


Abstract
A compact autonomous recorder was developed for short-duration measurements in confined moving systems where event-time cabling is unavailable. The cylindrical platform combines pressure, high-range acceleration, and angular-velocity interfaces with channel-specific conditioning, FPGA/microcontroller control, SDRAM buffering, eMMC storage, internal power, and mechanical support. Its operating sequence covers baseline checks, circular buffering, threshold-initiated event capture, nonvolatile storage, and post-test retrieval. An eight-field map and count-to-unit equations describe the readout convention. Three-channel electrical checks captured 1 kHz inputs and gave voltage spans of 6–8 mV at a nominal 5 V input. The loading evaluation comprised one acceleration–angular-velocity event and one pressure–acceleration event. Both tests stored eight-field event records over 8 ms at a nominal sampling rate of 1 MS/s per recorded field. Using the count-to-unit conversions, axial acceleration exceeded 24,000 g in the first event and reached approximately 27,000 g in the second, which also recorded approximately 354 MPa pressure. Both records were retrieved after recovery, with post-event communication available. These results demonstrate autonomous recording and recovery for two paired sensing configurations within the same compact architecture. Full simultaneous pressure–acceleration–angular-velocity operation remains to be evaluated.
1. Introduction
Short-duration transient loading occurs in aerospace qualification, structural-dynamic evaluation, impact-safety assessment, and controlled laboratory testing. Pressure, translational acceleration, and rotational motion can evolve over the same millisecond-scale interval. Recording these responses involves acquiring the signals, preserving the event data, and recovering them for interpretation. Reviews of vibration-based assessment and signal processing emphasize reliable acquisition and appropriate treatment of the recorded response [1,2].
In situ recording becomes difficult when the test object moves within a restricted installation envelope. Separate instruments, external acquisition hardware, optical observation, and wired transmission are suited to accessible laboratory arrangements but can conflict with package motion or unavailable event-time communication. Wireless smart-sensor networks move sensing and acquisition closer to the monitored structure [3], while independently operated recorders may still require post-test timing alignment [4].
Autonomous recorders organize sensing and data handling around the event. A high-voltage transient recorder combined multi-channel acquisition with storage, independent power, and timing functions [5]. Shipment-impact detectors link threshold-based logging to local retention [6], and vehicle-mounted acquisition systems address embedded monitoring of electronic-control-unit variables [7]. These examples show how acquisition, storage, and retrieval are organized for different sensing tasks.
At the converter level, field-programmable gate array (FPGA) architectures support parallel handling of analog-to-digital converter (ADC) outputs [8]. Lu et al. used buffered FPGA-controlled storage and host readout in a SATA recording system [9]. Programmable multi-event triggering and timing coordination have been studied for rocket-sled tests [10], while overload-storage instrumentation has combined strain and acceleration sensing [11]. Angular-rate acquisition adds a dependence on gyro range, filtering, and scale calibration, as illustrated by the instrument developed by Radi et al. [12]. Converter throughput, trigger coordination, and calibrated sensor response are therefore distinct aspects of an integrated recorder.
Application-specific sensor platforms in other domains likewise emphasize the co-design of sensing elements, packaging, and system integration [13]. Zhou et al. examined high-overload test-device design through functional decomposition and AD-TRIZ evaluation [14]. The present work focuses on the recorder implementation: channel-specific sensing interfaces feed one acquisition, buffering, storage, and retrieval procedure inside a mechanically integrated cylindrical package. The work includes:
- (1)
- A functionally decoupled architecture that defines sensing, conditioning, acquisition, storage, power, and support interfaces within one compact envelope;
- (2)
- An autonomous event sequence linking circular buffering, threshold initiation, nonvolatile storage, and post-recovery readout;
- (3)
- A component-level implementation description, test-specific acquisition settings, a fixed eight-field record format, and explicit decoding and engineering-unit conversion rules;
- (4)
- Electrical acquisition checks and two paired loading records demonstrating event capture, local retention, retrieval, and post-recovery operation.
Here, paired denotes the two parameter types in a loading configuration: acceleration–angular velocity or pressure–acceleration. Each configuration was tested once, producing four and three displayed histories, respectively. Together, the two configurations exercise all three parameter-interface types supported by the architecture, but they do not constitute simultaneous three-parameter validation.
2. System Requirements and Instrumentation Architecture
2.1. Measurement Scenario and Design Objectives
The instrumentation travels with the test object and records local transient responses within a restricted installation envelope. Triggering, acquisition, buffering, and storage are performed internally, followed by data retrieval after recovery. The cylindrical design has a nominal envelope of approximately 110 mm in length and 65 mm in diameter.
The package must fit the host structure, operate from independent power, and retain the selected event locally. Dedicated mounts and compartments support the sensors, electronics, and battery, while shared acquisition control organizes the selected signals into a common event record.
2.2. Instrumentation Requirements
Pressure characterizes local loading, acceleration captures translational inertial response, and angular-velocity channels provide rotational-sensor outputs. Their electrical interfaces need appropriate excitation, amplification, impedance matching, scaling, and filtering before conversion. A pressure or acceleration threshold selects the event interval within the operating acquisition sequence.
Data handling separates immediate sample capture from subsequent nonvolatile writing and host communication. The mechanical arrangement provides restrained internal assemblies and an accessible recovery interface. These requirements guide the electrical and mechanical implementation described below.
2.3. Technical Specifications
Table 1 summarizes the supported interfaces, nominal event settings, and recovery outcomes. Section 4 describes the hardware, recording sequence, and readout convention.
Table 1.
Implemented interfaces and nominal event settings.
2.4. Overall Instrumentation Architecture
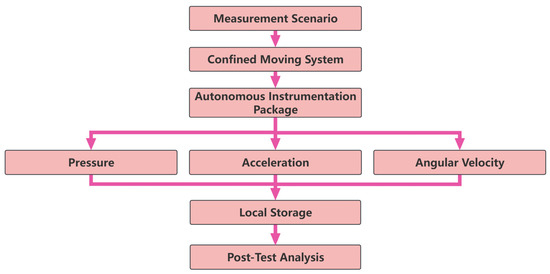
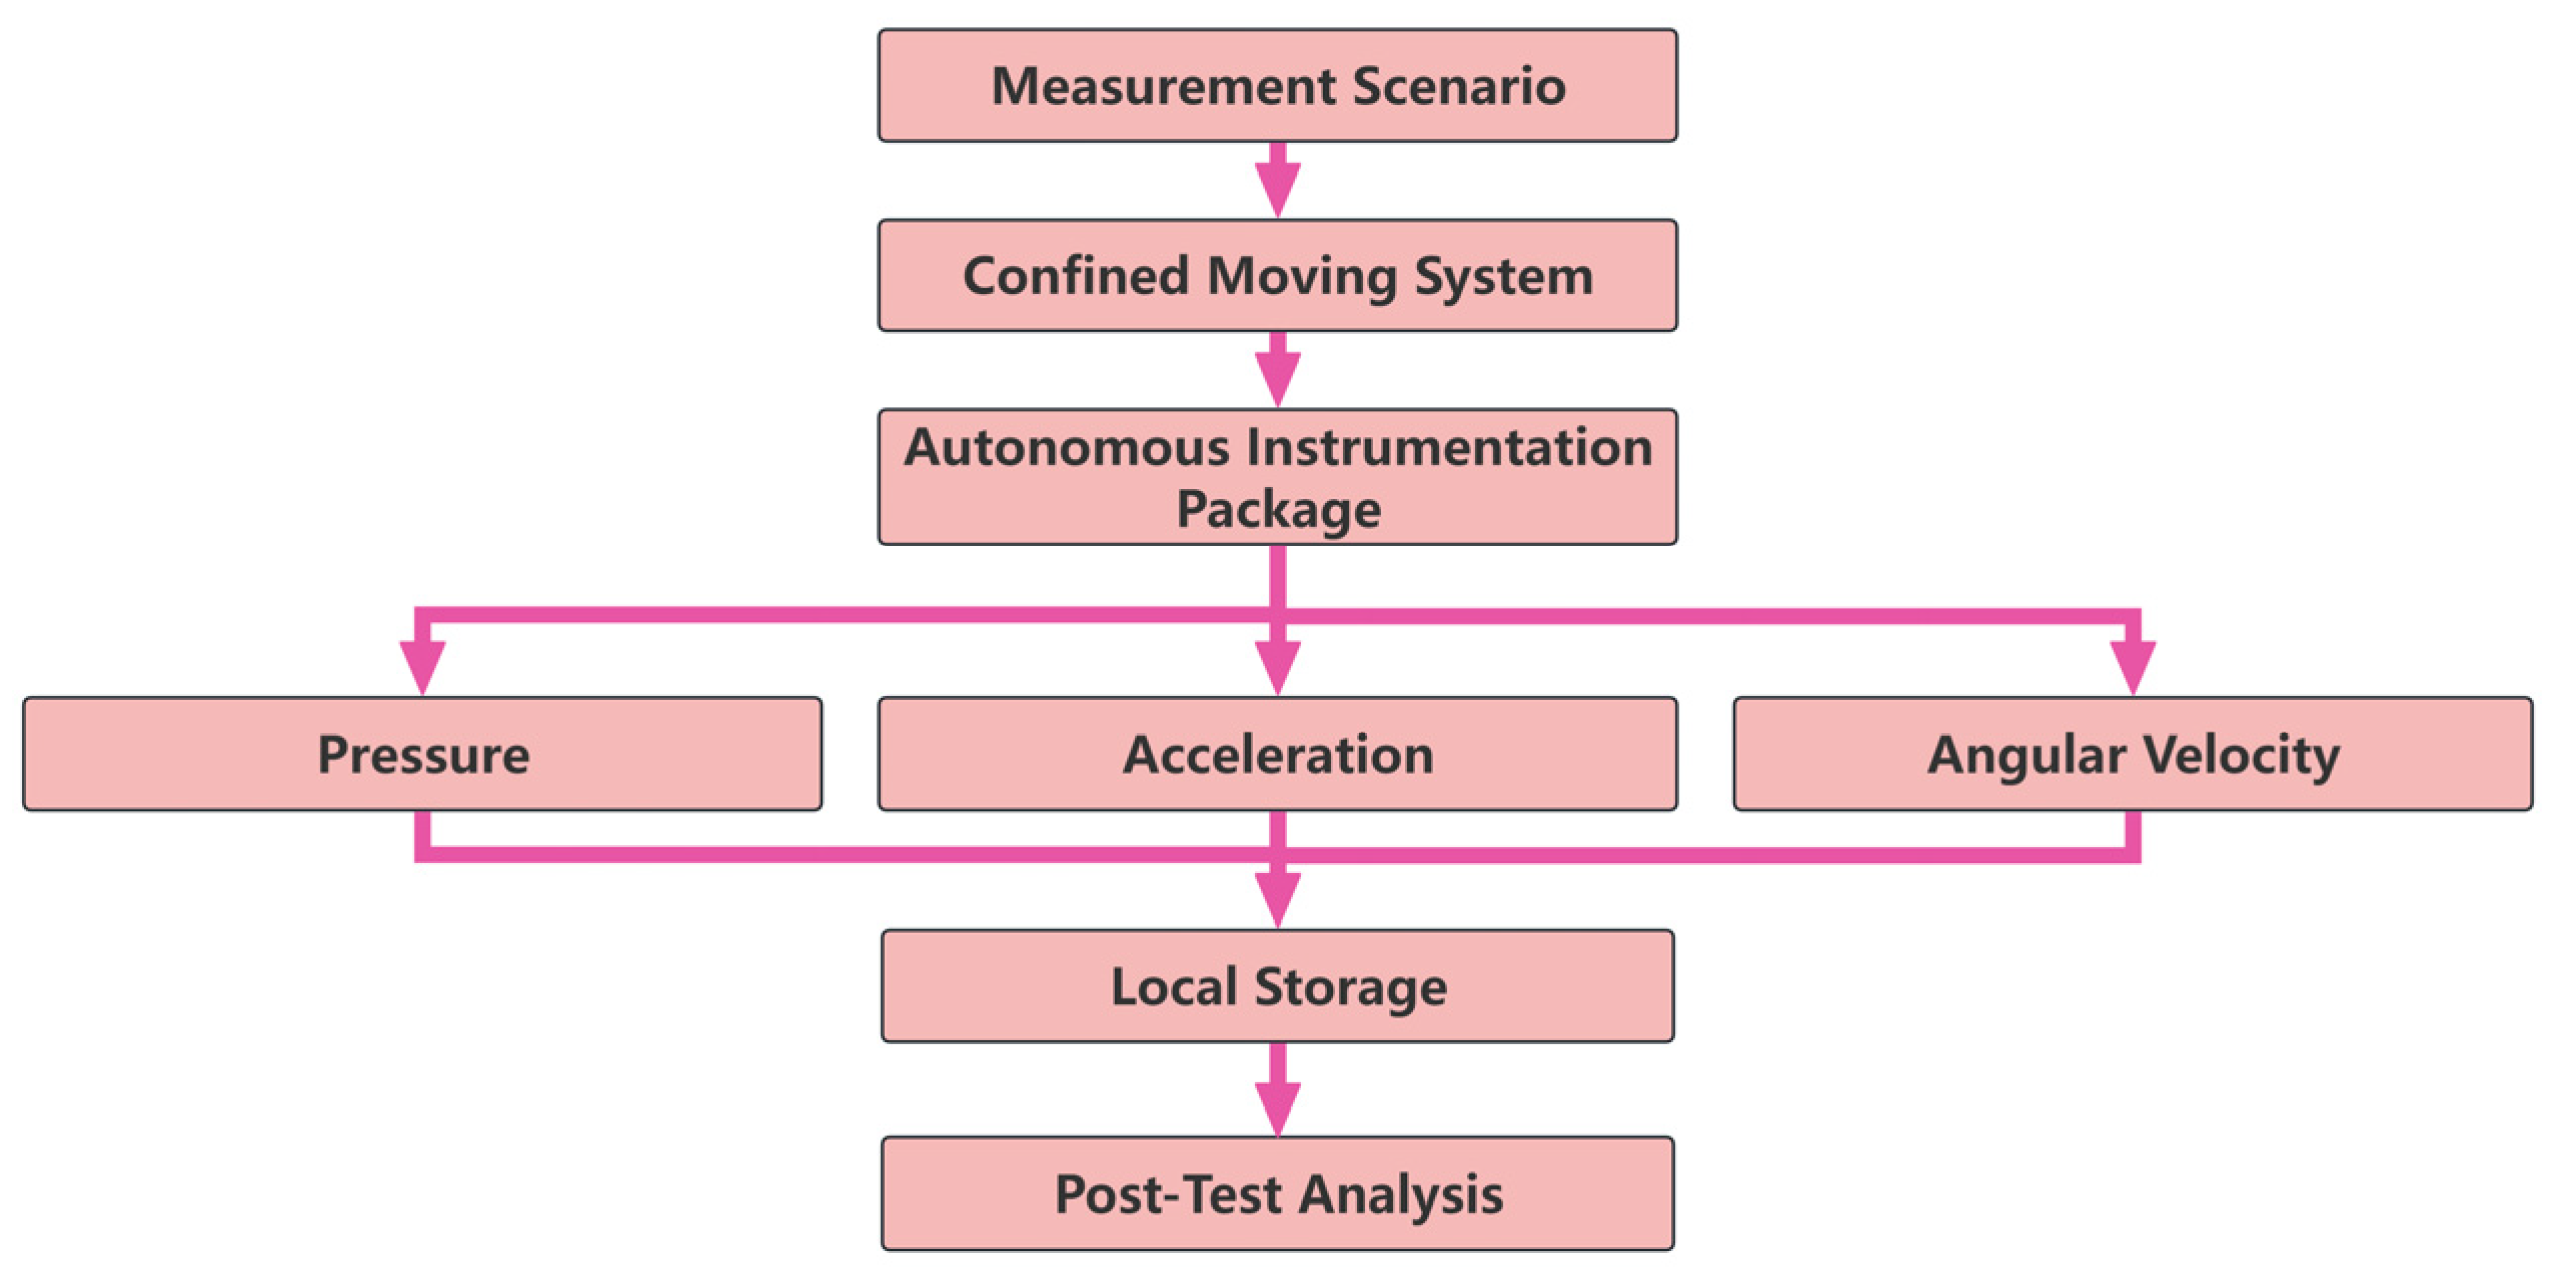
Figure 1 relates the measurement scenario to the supported parameter types, local recording, and post-test analysis. The selected sensor outputs remain within the autonomous package during loading and become available for analysis after recovery.
Figure 1.
Measurement scenario and recording workflow. Arrows show the progression from the measurement scenario through sensing and local storage to post-test analysis. The branches identify the supported parameter types; the two evaluated configurations are described in Section 6.1.
The architecture is functionally partitioned and physically integrated. Sensing, conditioning, acquisition, storage, power, and mechanical support have distinct interfaces within one cylindrical envelope.
3. Functional Decoupling and System Implementation
3.1. Functional Decoupling Strategy
The platform assigns excitation and conditioning to channel-specific paths, separates recording control from power conversion, and uses dedicated mechanical mounts. These interfaces accommodate the different electrical and support requirements of the sensors, converters, memory, and battery within one package.
Changes to a sensor path affect excitation, gain, filtering, and conversion coefficients; changes to storage affect writing and readout. Grounding, interconnections, and the support arrangement govern the interaction of these functions in the assembled instrument.
3.2. Module Implementation and System Integration
Conditioned analog signals feed an eight-channel ADC. The corresponding software fields are defined in Section 4.9. FPGA acquisition logic and microcontroller record control link capture to temporary and retained storage. Circular buffering preserves recent samples, the completed event is committed to eMMC, and the external interface supports configuration and post-recovery readout.
The two sensing-end arrangements retain the same preparation, capture, storage, and readout sequence (Section 4.5). Dedicated mounts and electronics compartments, together with a separately accessible battery, complete the implementation.
3.3. Evaluation of the Implementation Strategy
Distributed and partially integrated arrangements offer placement flexibility but retain external interconnections or separately controlled devices. The selected integrated arrangement combines local recording and independent power with dedicated internal supports. Table 2 relates these design choices to their intended functions.
Table 2.
Design constraints, implementation strategies, and intended measurement benefits.
4. Hardware Architecture and Data Acquisition System
4.1. Overall Hardware Architecture
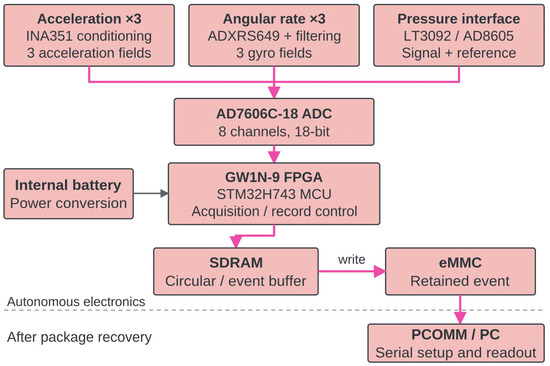
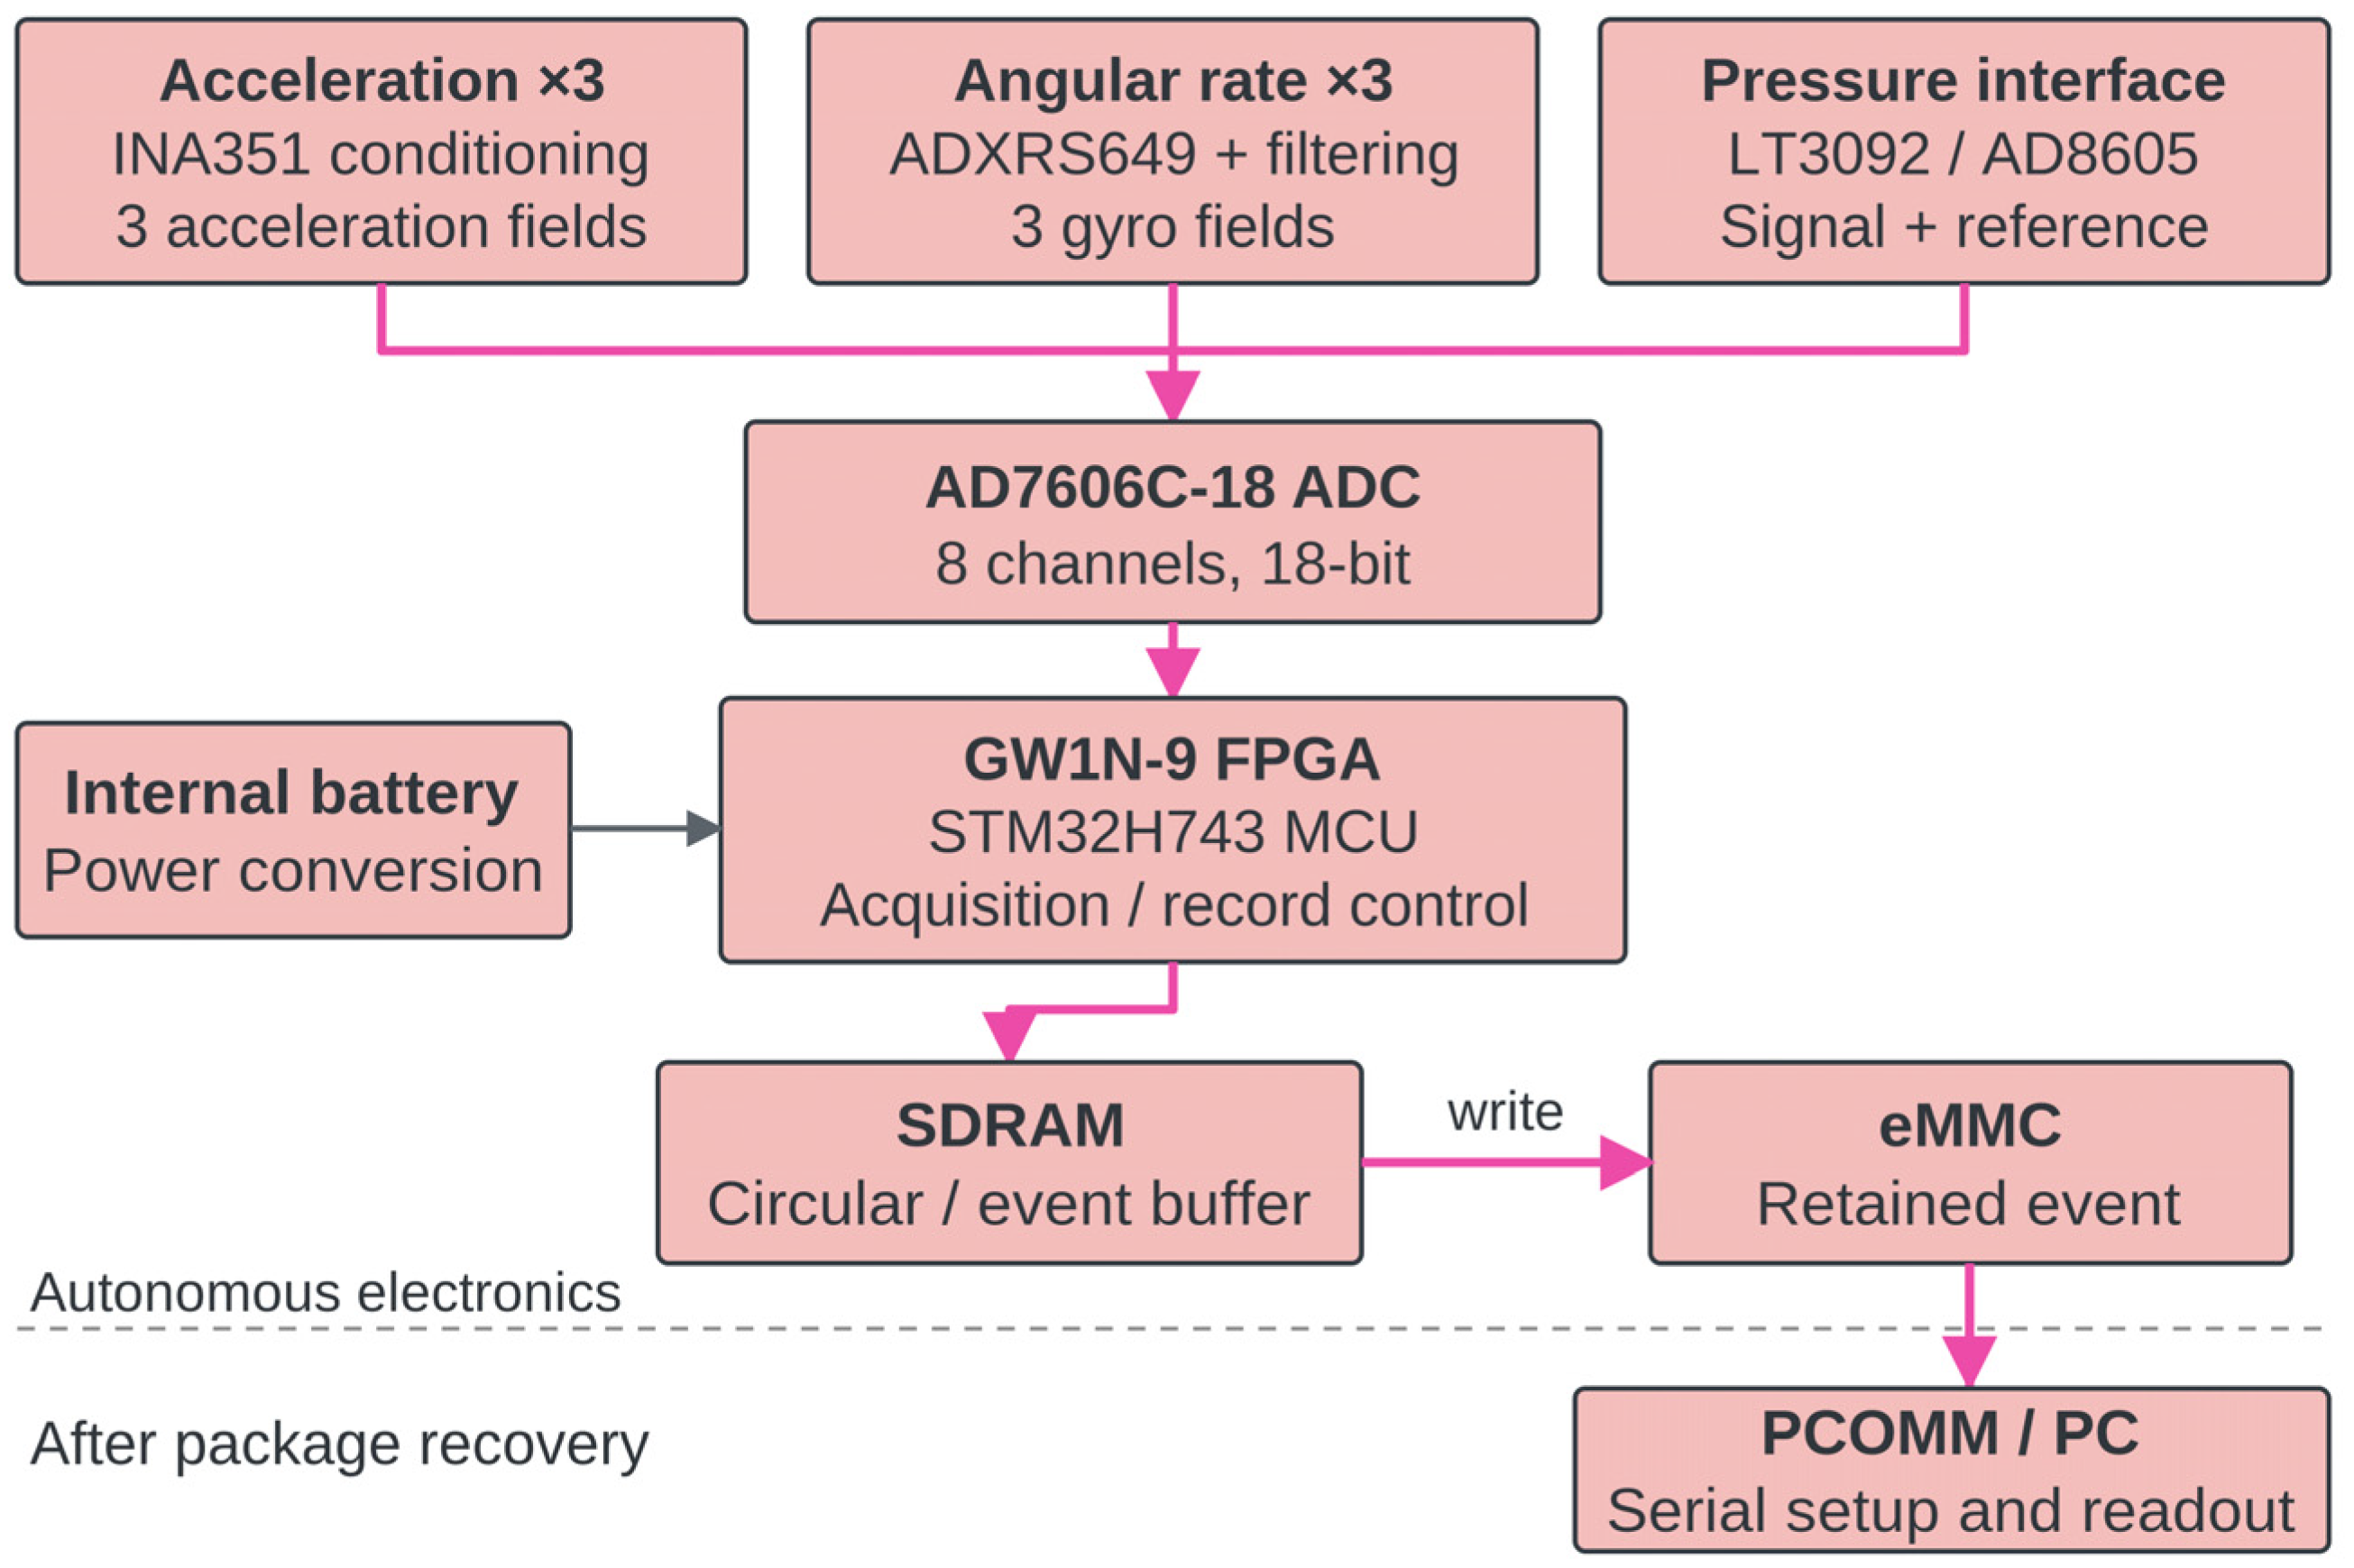
Both loading tests used the same acquisition hardware: an AD7606C-18BSTZ ADC (Analog Devices, Wilmington, MA, USA; AD7606C-18 hereafter), a GW1N-9 FPGA (GOWIN Semiconductor, Guangzhou, China), and an STM32H743AII6TR microcontroller (STMicroelectronics, Geneva, Switzerland). The FPGA controls sampling and readout; the microcontroller handles initialization, trigger settings, event recording, memory, and communication. Three acceleration-conditioning outputs, three single-axis gyro outputs, and the pressure signal/reference pair feed the ADC. SDRAM buffers the samples, and eMMC retains the completed record. Figure 2 shows the signal path, and Table 3 lists the components.
Figure 2.
Component-level recording architecture. Three acceleration fields, three gyro fields, and the pressure signal/reference pair feed the conversion and record-control path. Pink arrows indicate signal and data flow; the black arrow indicates the power connection. The dashed horizontal line separates the onboard recording electronics from the post-recovery PC interface. The internal supply powers the recording electronics, and PC communication supports setup and post-test retrieval.
Table 3.
Component identifications available from the design records.
The acquisition board was DAQ Rev. B, running FPGA firmware v1.3.2 and MCU recording software v0.9.6 in both tests. The ADC input filter operated in low-bandwidth mode, with a typical −3 dB bandwidth of 25 kHz [15]. It is distinct from the 16-bit, 800 kS/s AD7606B [16], which was not used in these tests.
The ADC operated in hardware mode with all eight inputs configured for single-ended bipolar ±10 V operation. Conversion timing and data readout were controlled by the FPGA. All eight channels used a bipolar ±10 V input range, and the sensor-conditioning outputs were kept within this range. Digital oversampling was disabled. A stable on-board reference supplied the ADC conversion reference independently of the pressure-interface electrical reference in ch8.
After power-up, the MCU initialized the system and configured sensor selection, the trigger threshold, and the recording sequence. Both tests used the same ADC settings, sampling rate, and fixed ch1–ch8 record format; only the sensor-end arrangement and trigger source changed. Section 4.5 and Section 4.9 describe the sampling sequence and raw-code conversion, respectively, and Appendix A gives the storage budget.
4.2. Pressure Measurement Channel
The IEPE-labeled pressure-interface signal and its electrical reference correspond to fields ch7 and ch8, respectively. The interface includes the programmable LT3092 current source [17] and an AD8605 amplifier. Equation (6) subtracts ch8 from ch7 at the same sample index. The reference field corrects the pressure readout; it is separate from the ADC conversion reference.
The reported event span is 0–500 MPa. Sensor-selection specifications separately list a 690 MPa element rating and a resonance of at least 400 kHz. The installed dynamic response also includes the pressure port and conditioning chain; pressure-calibration studies evaluate the delivered input, transducer, mounting interface, and transfer path together [18,19]. These component- and selection-level specifications are not used as a calibrated bandwidth or uncertainty estimate for the complete installed pressure channel.
4.3. Acceleration Measurement Channel
The acceleration front end uses three INA351 instrumentation-amplifier paths, with scaling set by the fitted gain and sensor sensitivity [20]. Both loading events used the reported ±50,000× g configuration. Sensor-selection information describes a ±50,000 g element with a DC–10 kHz response within ±5% and a DC–25 kHz −3 dB band. These are selection specifications; the design identifiers are listed in Table 3.
Sensor mounting and the acquisition path influence acceleration measurement [21,22]. A multi-axis sensitivity matrix relates main-axis response, transverse sensitivity, and mounting misalignment [23]. Modified Hopkinson-bar studies provide common-excitation triaxial shock-calibration approaches for assessing these terms [24,25]. These studies identify the assembled-channel calibration quantities required for quantitative multi-axis interpretation.
4.4. Angular-Velocity Measurement Channel
The ADXRS649 gyro has a native ±20,000°/s range. An external resistor extends the range to ±50,000°/s and changes the sensitivity [26]. The angular-velocity event used the reported extended configuration. Matching the output network to the readout scale is part of instrument-level angular-rate calibration, as illustrated by Radi et al. [12]. The corresponding software readout interval is given in Section 4.9.
The available gyro design specifies a 120 kΩ resistor and a 0.1 µF capacitor between RATEOUT and SUMJ. Using the manufacturer’s nominal 180 kΩ internal output resistance [26], the equivalent resistance and first-order pole are
The documented network therefore has an estimated time constant of 7.2 ms and a 10–90% rise time of approximately 15.8 ms. Because event-specific network and calibration records are unavailable, the angular-velocity histories are treated as recorded channel outputs rather than as calibrated high-frequency rotational motion.
4.5. Triggering and Data Acquisition
Before loading, the procedure checks baseline behavior, channel response, threshold initiation, storage, retrieval, and the internal supply. The package is installed, and the external cable is disconnected for the event. Circular acquisition retains recent samples in SDRAM; pressure- or acceleration-threshold detection initiates the selected event interval. Acquisition completion is followed by commitment to eMMC. Table 4 relates the operating states to record handling.
Table 4.
Operating sequence and event-record handling.
The FPGA issues conversion-start commands at a nominal 1 MHz rate, giving one eight-channel sample group every 1 µs. Conversion results are read in channel order, converted to the unsigned fields described in Section 4.9, and placed in the SDRAM circular buffer. Threshold detection selects an 8 ms event window; the MCU then commits the buffered frames to eMMC.
The B1 and B2 modes provide separate diagnostic checks. PCOMM self_check_value_0 through self_check_value_7 are B2 diagnostic limits, and cnt is a diagnostic frame counter. Event-trigger thresholds are separate from these diagnostic limits. The trigger sample index for the two archived loading records is not available and is therefore not assigned to the plotted time origin.
Let fs denote the nominal sampling rate per recorded field, Ts the nominal sample interval, T the record duration, and n the sample index. The nominal time grid is
Each 8 ms event stores 8000 samples per field at a nominal rate of 1 MS/s, giving 1 µs nominal spacing between sample positions. Each position holds one eight-field frame. Indices n = 0, …, 7999 span 0–7.999 ms. The event plots express time in seconds, with zero denoting the start of the displayed record.
4.6. Embedded Storage and Power Management
SDRAM separates event-time capture from subsequent eMMC writing. After recovery, PCOMM v0.1.2 uses the serial port associated with the Type-C connection. The operator selects the port and destination and retrieves the completed record in state A4. The host interface serves preparation and readout; the buffer, memory, and internal supply serve event-time operation.
Both tests used the same fixed-length frame: eight unsigned 16-bit fields ordered ch1–ch8, including fields not used in the displayed results. Each frame contains 16 sample bytes. An 8000-frame event carries 128,000 sample bytes (125 KiB), at a nominal acquisition-side data rate of 16,000,000 bytes/s (16 MB/s). The complete event file is approximately 128–132 kB; the sample payload is 128,000 bytes.
The internal battery powers sensing, conditioning, conversion, and memory until the buffered record is committed. Capacity and endurance values vary among the design descriptions. Power conversion is separated from signal handling. Board grounding, protection, and layout affect electromagnetic compatibility [27].
4.7. Mechanical Integration of the Instrumentation Package
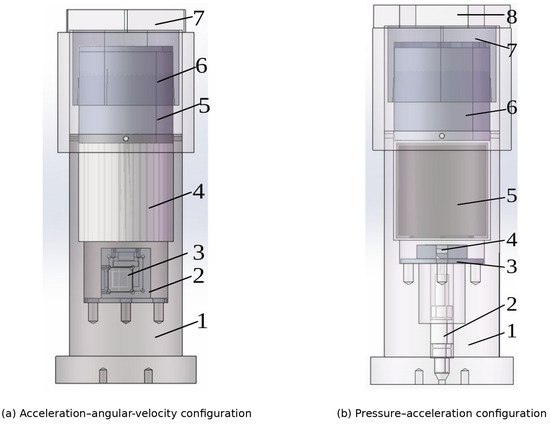
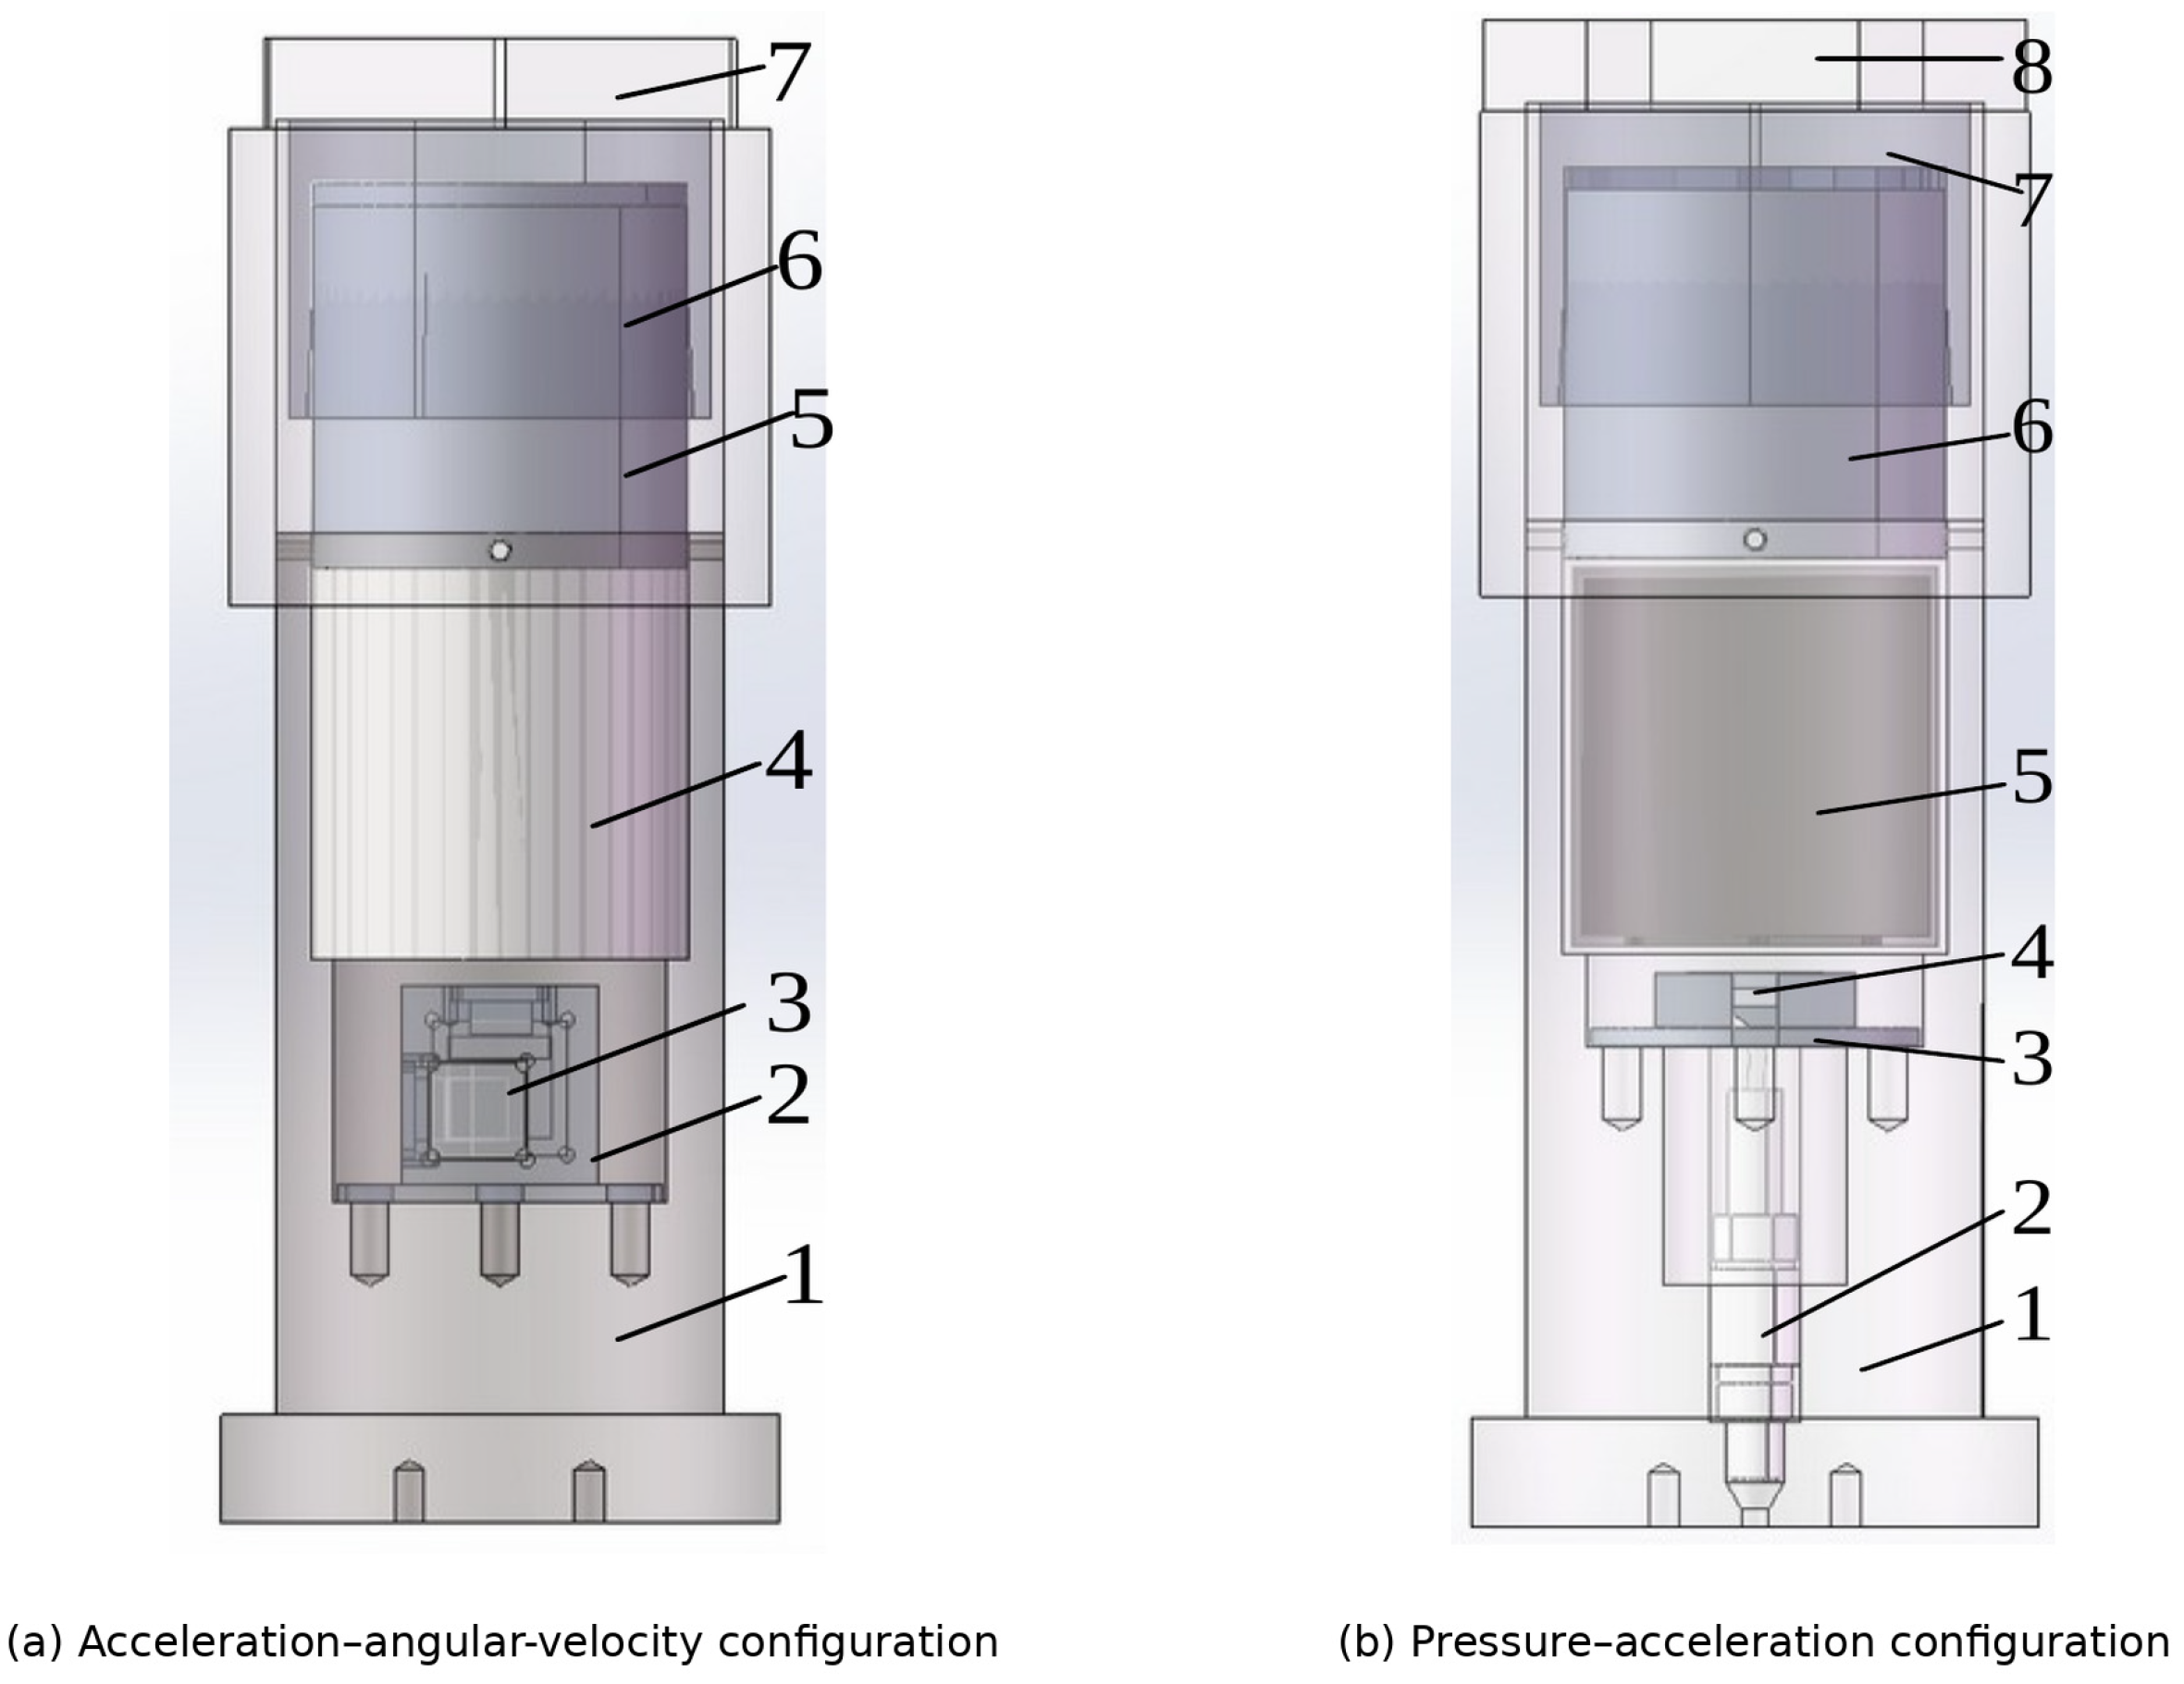
The hardware is integrated in a threaded cylindrical package. Dedicated interfaces support the sensors, acquisition electronics, storage, battery, rubber pad, sleeve, and end components. Two sensing-end arrangements accommodate acceleration–angular-velocity and pressure–acceleration recording while retaining the common storage and power architecture (Figure 3). Integrated high-g MEMS–ASIC work likewise treats packaging and calibration as coupled development issues [28].
Figure 3.
Mechanical integration models for the paired experimental configurations. (a) 1—Housing I; 2—sensor-mounting platform I; 3—sensor; 4—data-storage compartment; 5—battery compartment; 6—rubber pad; 7—sleeve. (b) 1—Housing II; 2—pressure sensor; 3—sensor-mounting platform II; 4—acceleration sensor; 5—data-storage compartment; 6—battery compartment; 7—rubber pad; 8—sleeve.
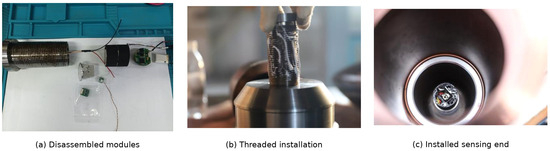
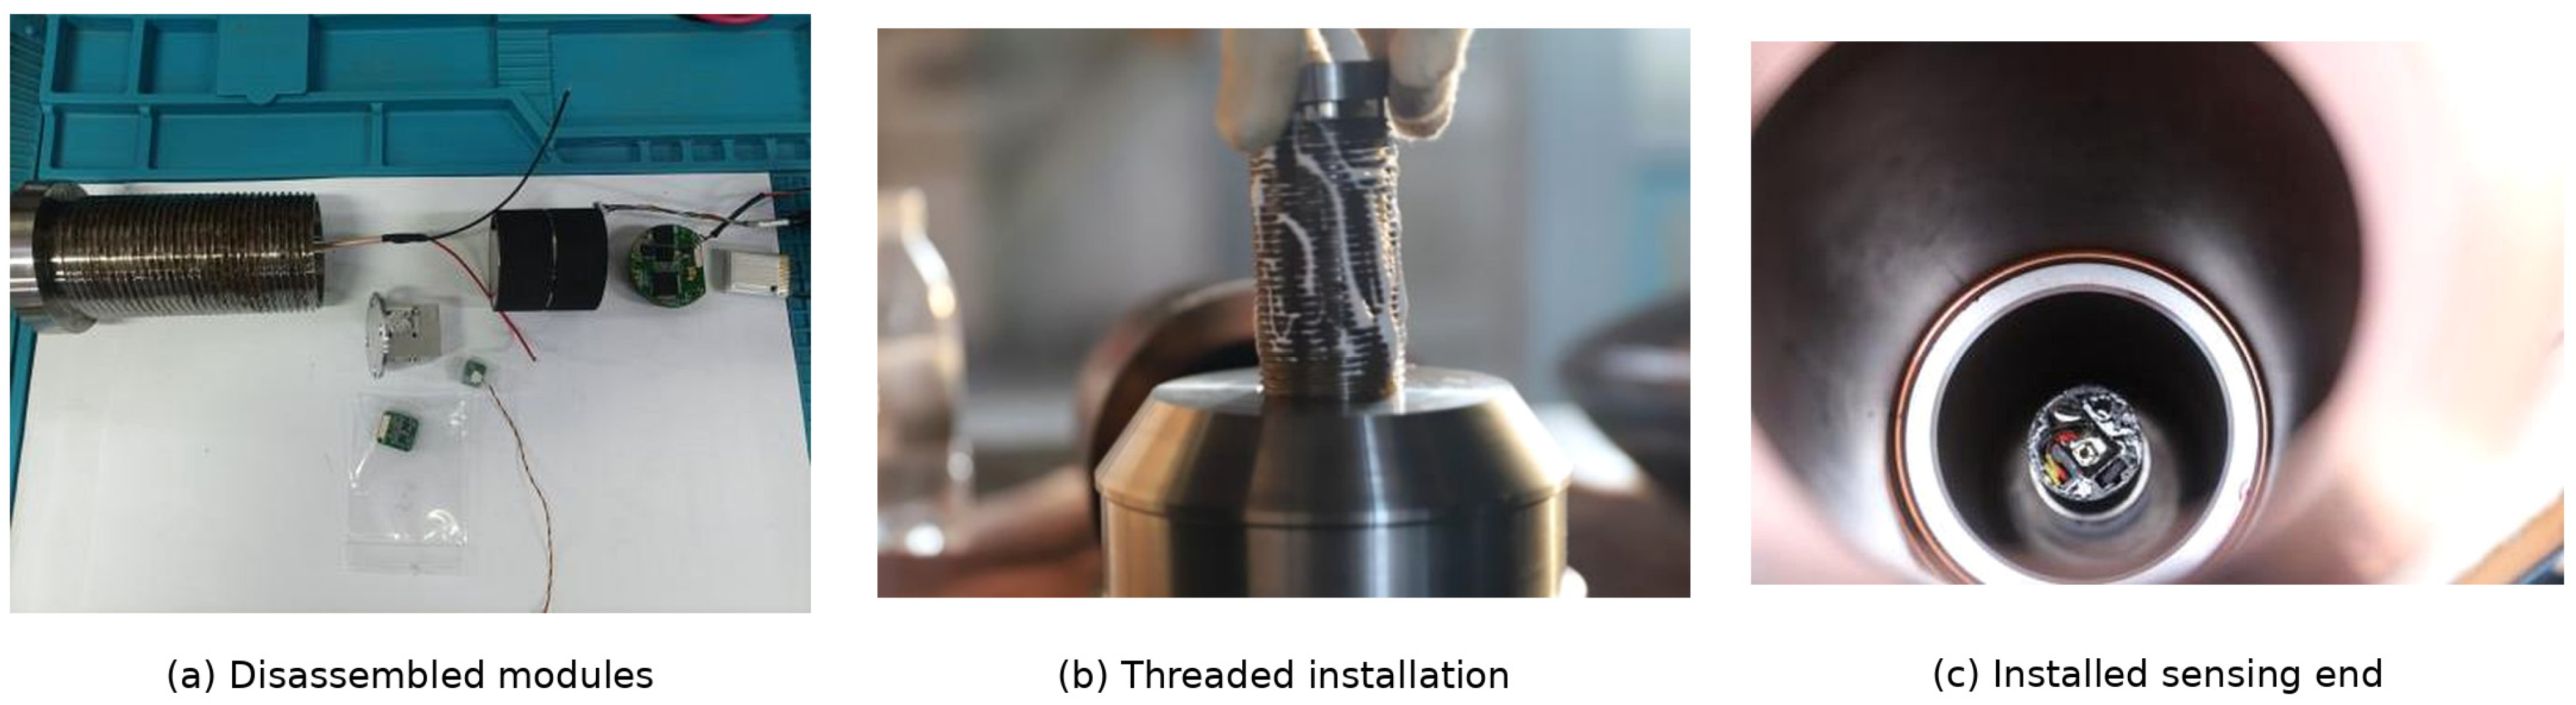
Figure 4 shows the fabricated modules, threaded installation interface, and sensing end. The sensor and circuit assemblies are potted, while the battery remains separately accessible. Together with the models in Figure 3, these photographs document the implemented support arrangement.
Figure 4.
Fabricated instrumentation platform: (a) disassembled modules; (b) threaded installation; and (c) installed sensing end.
4.8. Shared Acquisition Sequence and Synchronization Scope
The FPGA assigns the eight simultaneous ADC results to one sample index. This provides a shared acquisition sequence and time grid for the stored fields. The timing of the physical signals also depends on sensor and conditioning responses and converter aperture offsets. For pressure measurements, the sensor and transfer path can affect timing interpretation [29]. Channel delay affects comparisons within a record; clock-frequency error scales the time axis; and trigger latency and jitter locate the record relative to the event. These timing quantities were not measured in the two loading tests.
At 1 MS/s per recorded field, the nominal Nyquist frequency is 500 kHz. Oversampling was disabled; the measurement bandwidth is set by the sensor, analog-conditioning, and converter responses, including filter cutoff and out-of-band attenuation. Table 5 summarizes the recording functions and time convention.
Table 5.
Recording functions and their interpretation in the present evaluation.
4.9. Engineering-Unit Conversion and Calibration Scope
Table 6 defines the eight-field readout convention. Software X/Y/Z labels identify the inertial fields; the event figures retain the axial and radial labels used for the installed package.
Table 6.
Eight-field readout map and numerical use.
The FPGA converts each signed 18-bit ADC output C to a stored field D by an arithmetic right shift of three bits followed by addition of 16,384. Equivalently, D = floor(C/8) + 16,384, where floor denotes rounding toward negative infinity. The field spans 0–32,767 and is stored as a 16-bit unsigned integer; C = 0 maps to D = 16,384. This representation retains 15 code bits, not all 18 ADC output bits.
The inertial-channel conversions subtract the software offset of 16,384 from the stored fields. For inertial axis i and record index n, the engineering-unit conversions are
P[n] = 0.05087(DIEPE[n] − DVOS[n]) MPa.
D denotes the stored unsigned field, A acceleration in units of conventional standard gravity, G angular-velocity channel output, and P pressure. The pressure coefficient is 0.05087 MPa per count difference, equivalent to 50.87 kPa. Subtraction of ch8 from ch7 at the same sample index removes the common software offset and applies the electrical-reference correction.
For D = 0–32,767, Equation (5) gives a numerical angular-velocity readout interval from −25,000 to approximately 24,998°/s. The reported ±50,000°/s setting in Section 4.4 describes the sensor-side configuration, not the range preserved by this software scale. The angular-channel peaks reported in Section 6.3 fall within the stored-code interval.
A stored-count increment corresponds to approximately 5.0863 g for acceleration, 1.5259°/s for angular velocity, and 0.05087 MPa for the pressure-field difference. These are the numerical scales used in Equations (4)–(6). For a locally linear channel, y = K(d − d0), K combines sensor sensitivity, conditioning gain, and converter/readout scaling. A traceable uncertainty budget also requires trial-specific sensitivity, gain and offset, dynamic response, mounting and cross-axis effects, and timing [30]. No combined measurement uncertainty is assigned to the event histories.
5. Mechanical Integration and Post-Test Functional Evidence
5.1. Mechanical Integration
The assembly in Figure 3 connects the instrument to the host structure through the housing and threaded interface. Dedicated platforms locate the sensors, and the storage and battery compartments support recording and power. The sleeve, rubber pad, and end components complete the internal arrangement. The housing is specified as 35CrMnSi steel, the mounting platforms and end cap as 7075 aluminum alloy, and the storage compartment as galvanized steel.
5.2. Post-Test Functional Observations
Table 7 relates the mechanical supports to the two event outcomes. Recovered histories and post-test communication provide evidence that the assembled recording path operated through the reported loading events.
Table 7.
Mechanical interfaces and post-test functional observations.
5.3. Scope of Structural Qualification
The structural evidence concerns the assembled recorder in the two loading events. Stored records were retrieved after recovery, and communication remained available for both configurations (Section 5.2 and Table 7). These observations demonstrate recorder-level function after loading, but do not measure the internal structural response or establish component-level safety margins.
Component-level qualification requires documented finite-element assumptions and measurements of PCB strain, connector displacement, relative motion of internal assemblies, and pre- and post-test condition. Related studies address electronic assemblies, potting materials, and MEMS shock behavior [31,32,33,34]. These indicators were not measured in the present tests; they define the structural qualification work outlined in Section 7.4.
6. Proof-of-Concept Tests of Paired-Parameter Autonomous Acquisition
6.1. Scope and Experimental Setup
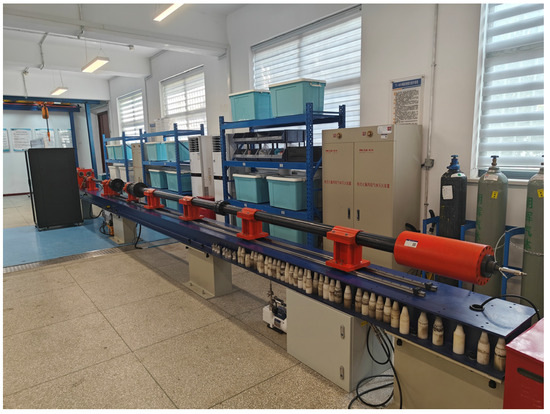
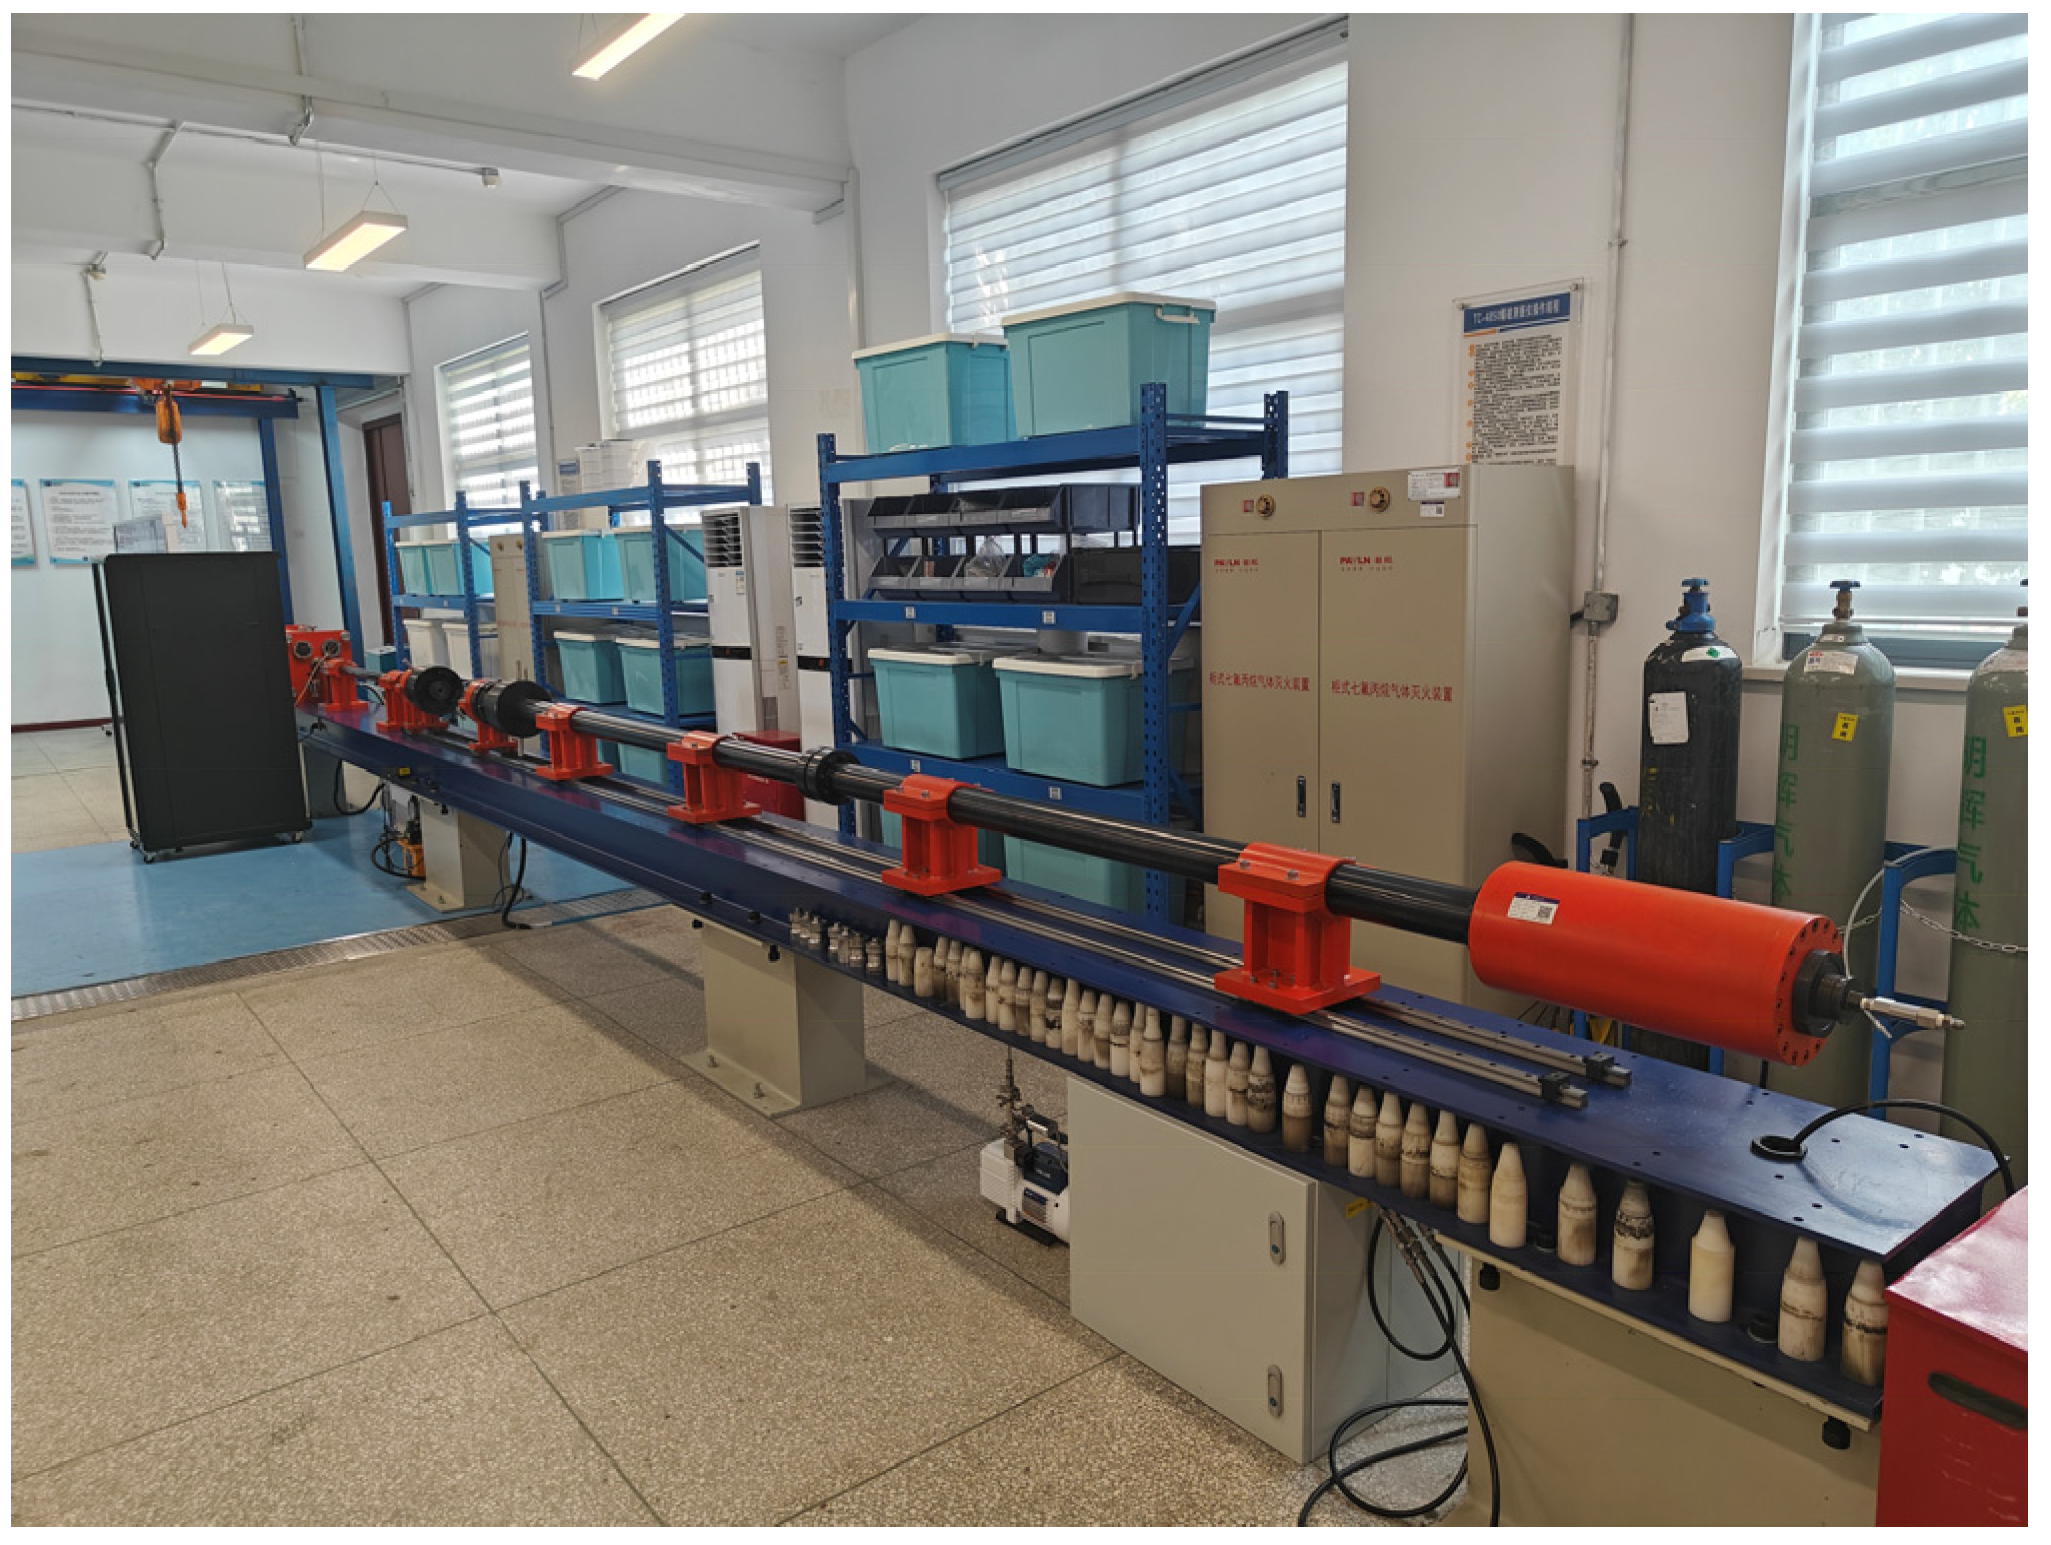
Two paired-parameter configurations were evaluated once each under room-condition laboratory loading. The first presents axial and radial acceleration together with axial and radial angular-velocity channel outputs. The second presents pressure together with axial and radial acceleration. Both followed pre-event checks, internally powered event recording, package recovery, and external readout. Figure 5 shows the controlled transient-loading apparatus.
Figure 5.
Laboratory transient-loading apparatus used for the two paired proof-of-concept tests.
Both loading tests used the DAQ Rev. B hardware and firmware configuration described in Section 4.1. Table 8 lists the presented histories, acquisition settings, and sensor-side ranges. Both events used the reported ±50,000 g acceleration setting. The gyro sensor range and software readout interval are described in Section 4.9.
Table 8.
Paired loading configurations and nominal acquisition settings.
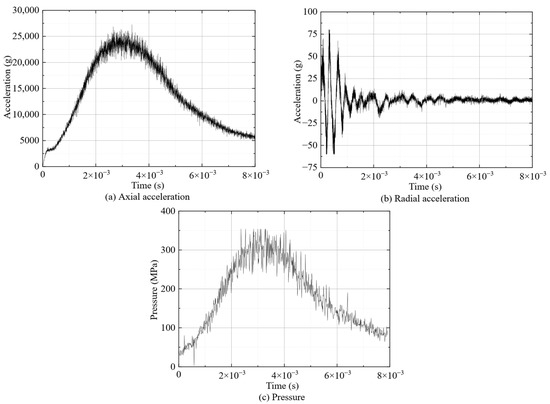
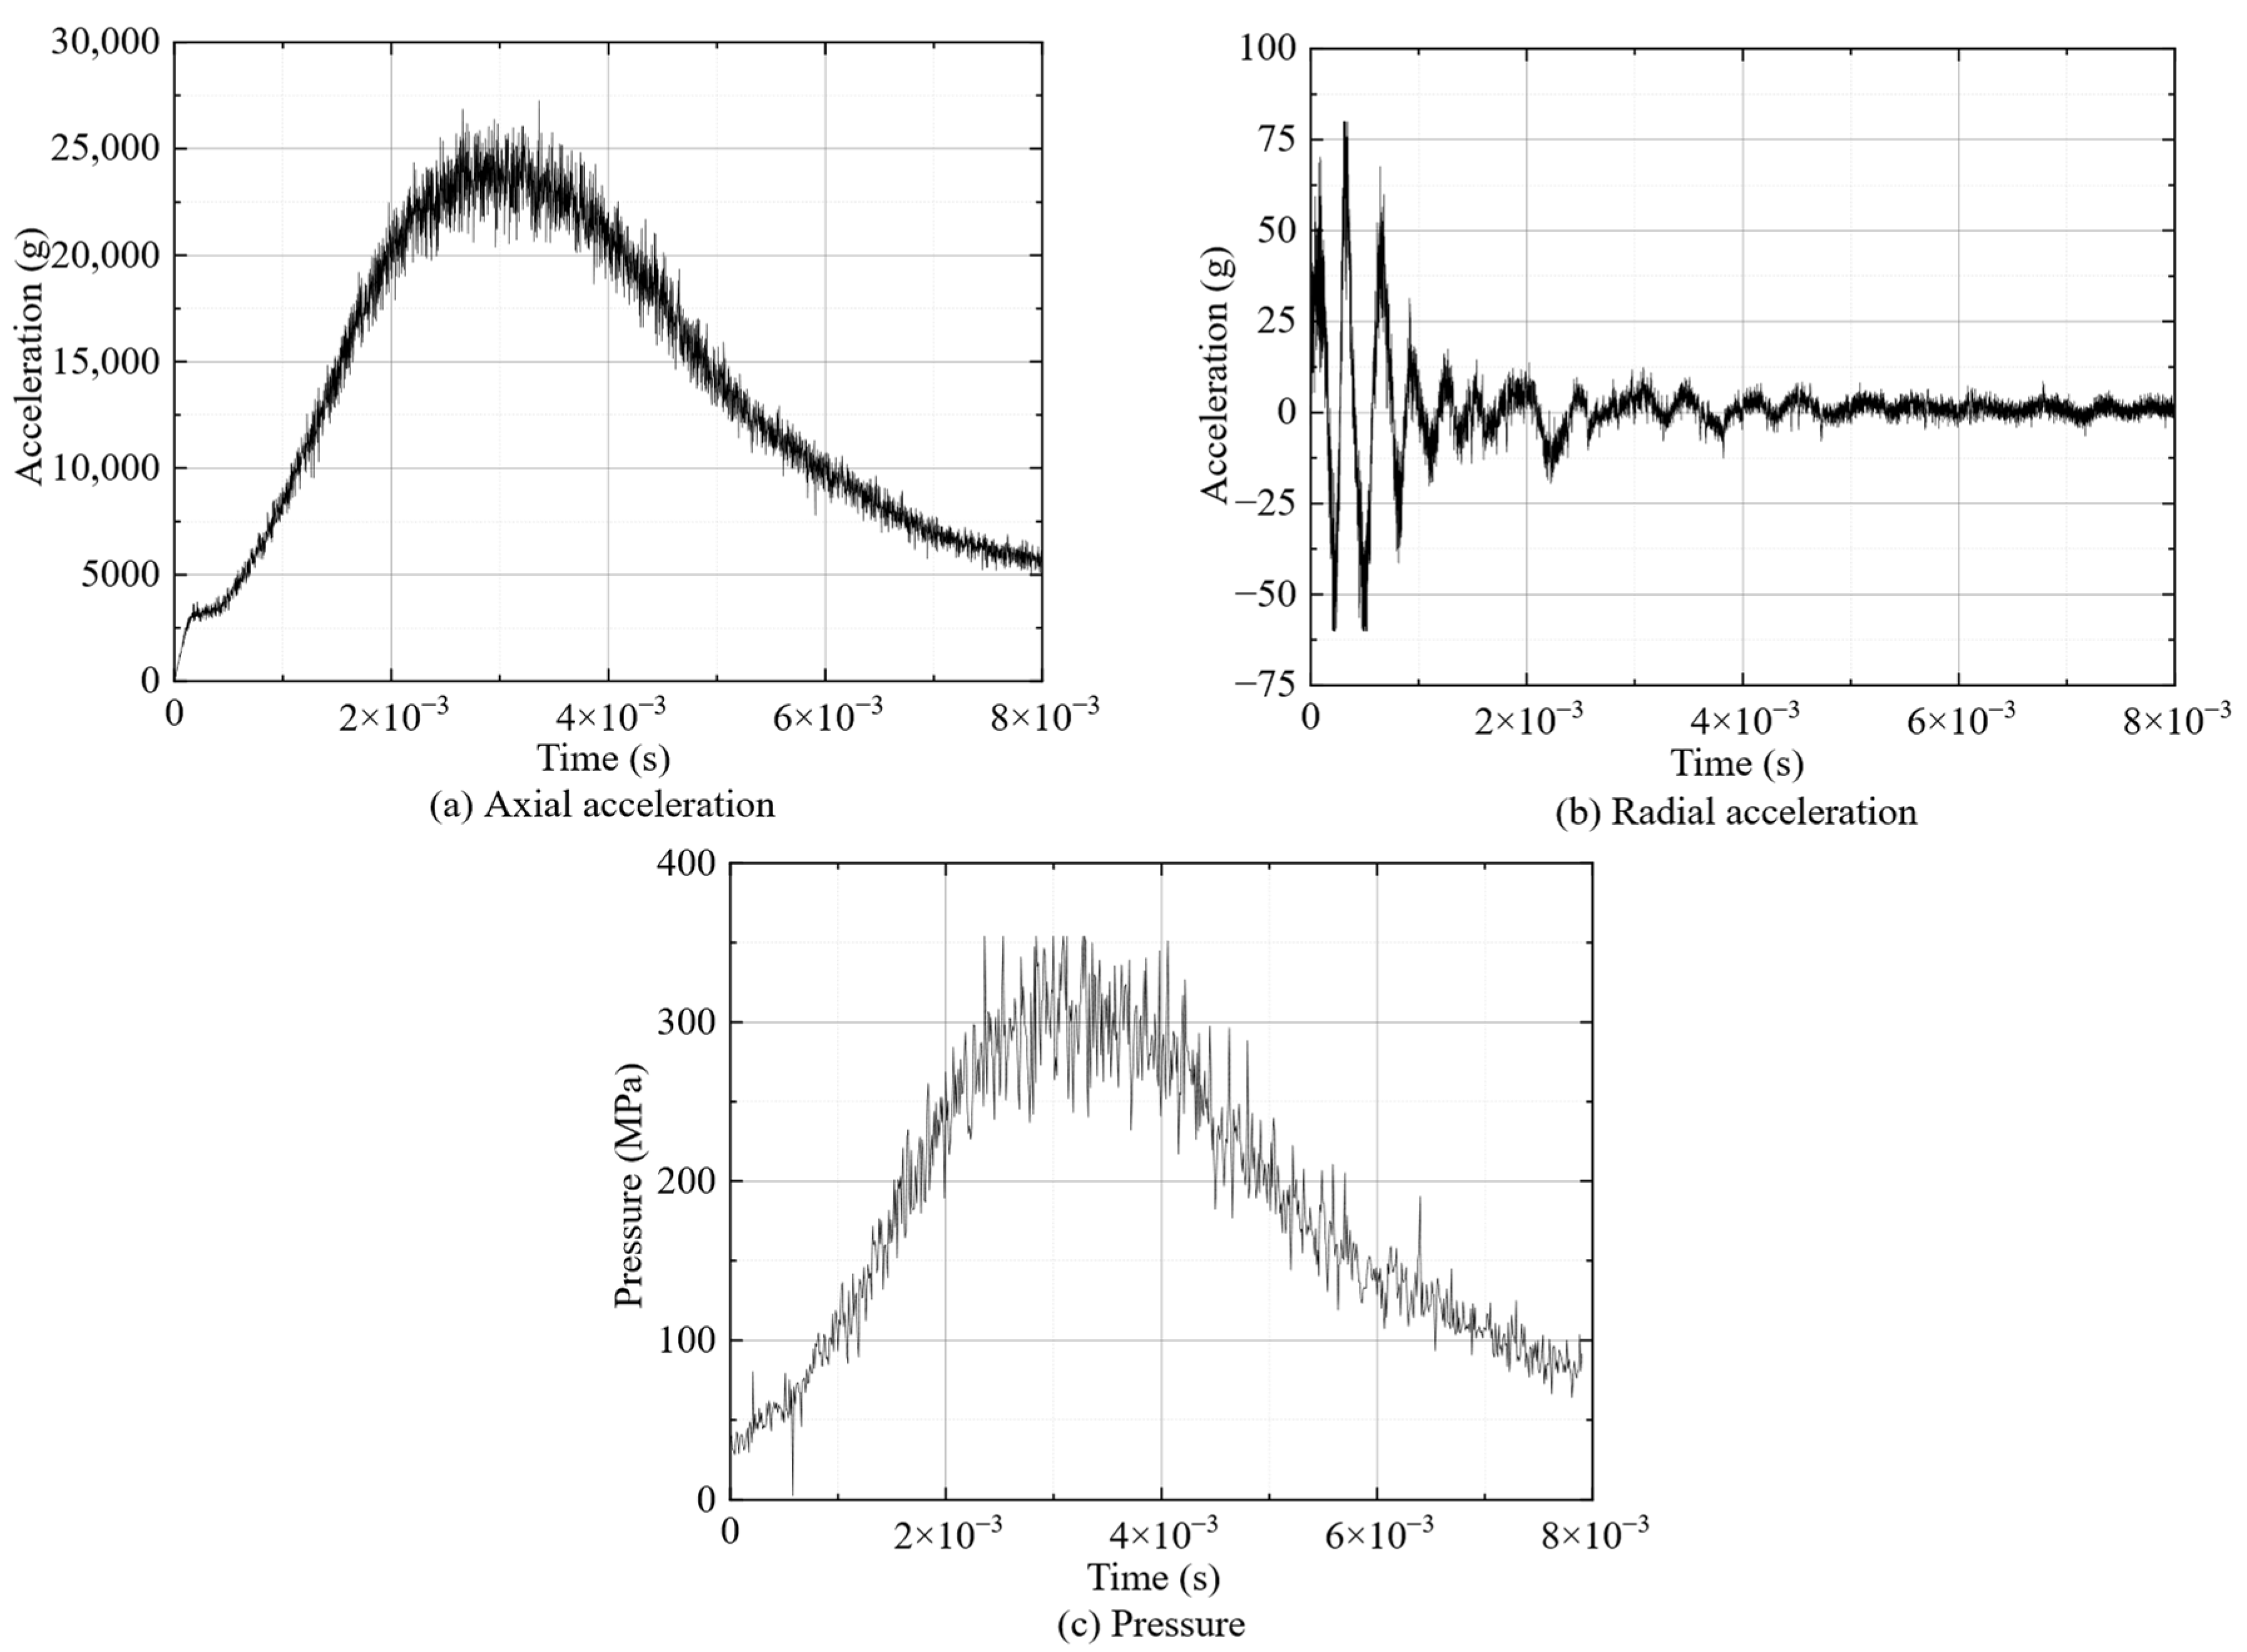
Both event formats store all eight fields in fixed frame positions. In the acceleration–angular-velocity configuration, ch1–ch6 carry the inertial outputs, while ch7 and ch8 remain in the file layout without contributing to the displayed results. In the pressure–acceleration configuration, ch1–ch3 provide acceleration, and pressure is calculated from ch7 and ch8. Fields not used in the reported results keep their frame positions. Four and three engineering-unit histories are presented, respectively.
Axial denotes the package longitudinal/loading direction; radial denotes the measured transverse direction identified in the plots. The quoted peaks refer to the full displayed interval on the existing engineering-unit scales.
The event histories are presented on the retained engineering-unit scales. No additional filtering, coordinate transformation, or amplitude rescaling was applied.
6.2. Pre-Test Verification
Pre-test checks covered baseline response, channel response, triggering, local storage, retrieval, and the internal supply. Electrical checks also exercised the three acceleration-input paths with 1 kHz sinusoidal signals over a stated 0.1–5 V peak-to-peak range. Individual-channel acquisitions and a three-channel acquisition with deliberately different input phases produced the corresponding stored waveforms, confirming channel identification and signal capture.
A separate check applied a nominal input V0 = 5 V. Table 9 lists the recorded extrema and two descriptive metrics: the peak-to-peak span and the largest extremum deviation from the nominal input, calculated as
ΔVpp = Vmax − Vmin,
Table 9.
Recorded electrical extrema and calculated descriptive metrics at a nominal 5 V input.
The three paths gave voltage spans of 6–8 mV and maximum extremum deviations of 0.08–0.12% at the nominal 5 V input. These electrical checks confirm basic acquisition-stage signal capture and complement the subsequent integrated loading tests.
6.3. Acceleration–Angular-Velocity Results
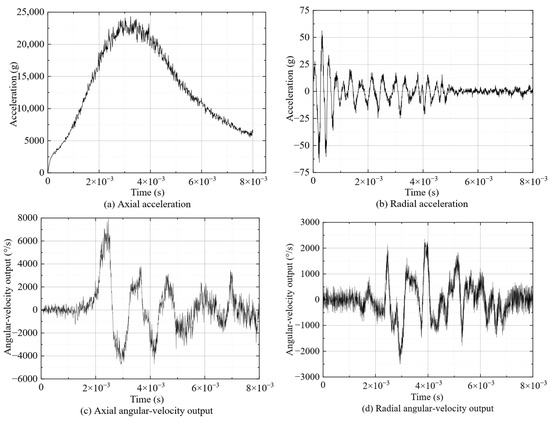
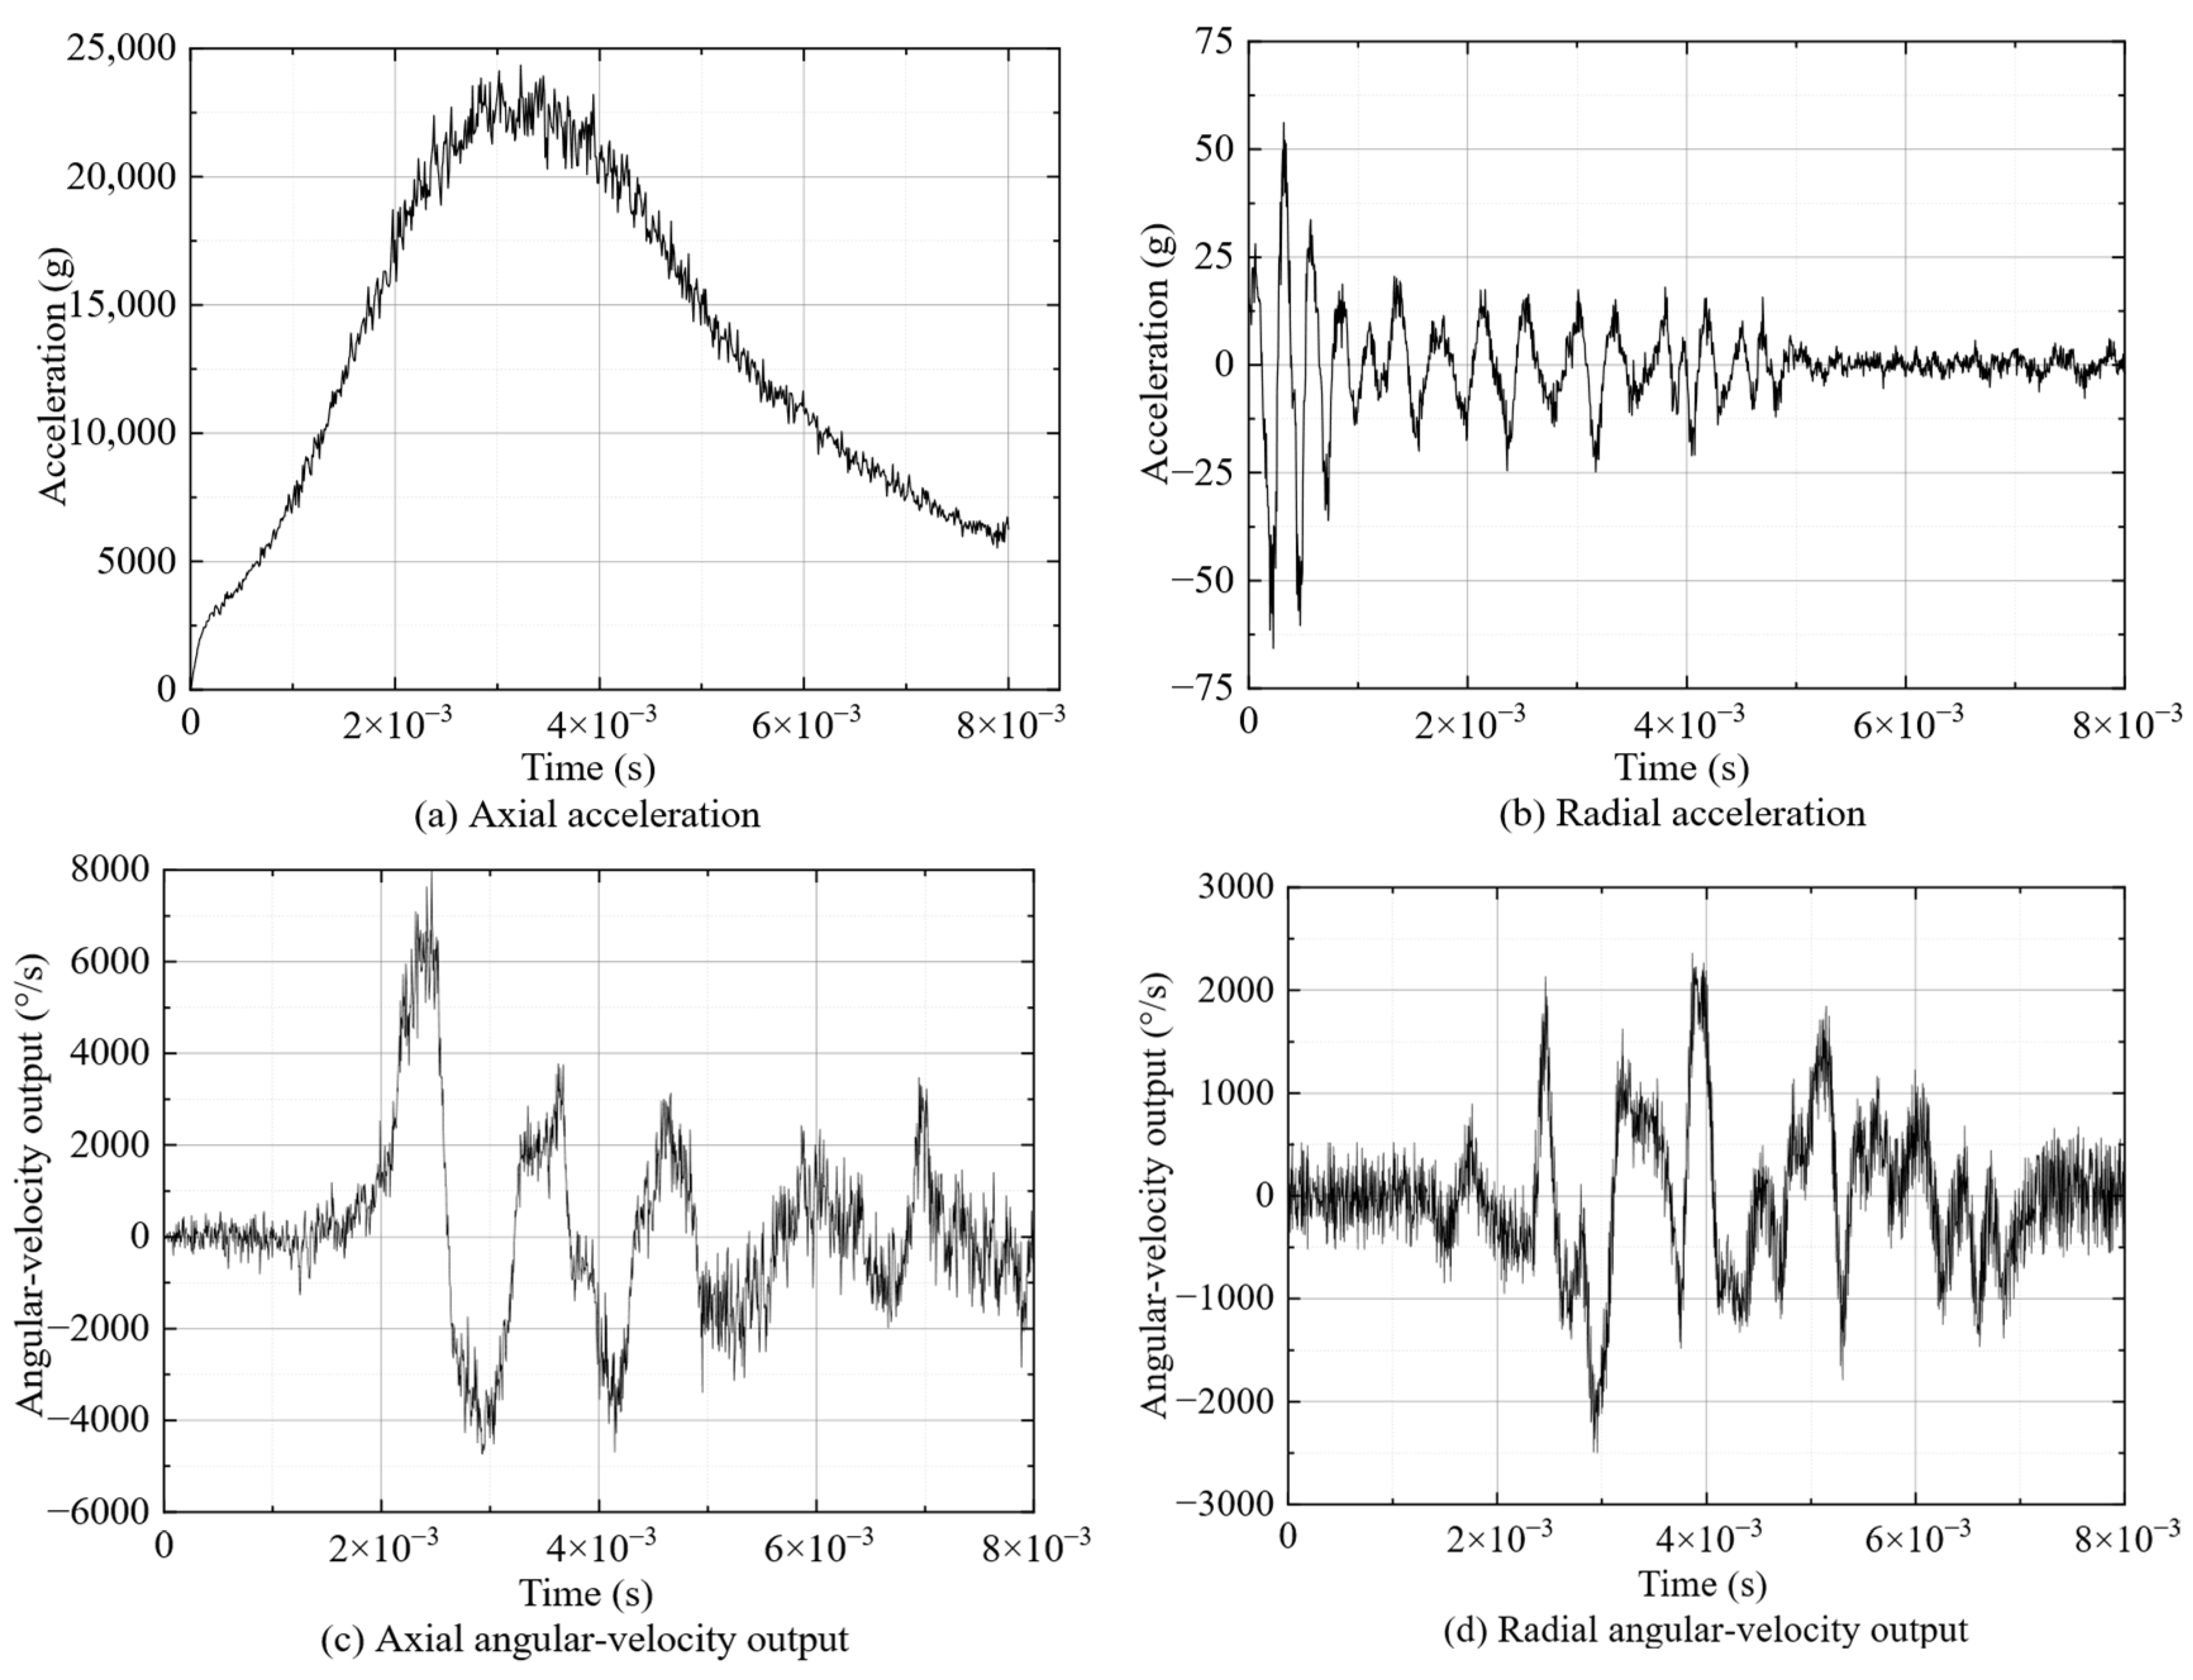
The first event produced the four histories in Figure 6. Axial acceleration rises above 24,000 g and then decays, while radial acceleration is smaller and oscillatory. The displayed angular-channel peaks are approximately 7000°/s axially and 2500°/s in radial magnitude. Both acceleration histories and both angular-velocity outputs were recovered in the same event record.
Figure 6.
Acceleration–angular-velocity event: (a) axial acceleration; (b) radial acceleration; (c) axial angular-velocity channel output; and (d) radial angular-velocity channel output. Nominal sampling rate: 1 MS/s per recorded field; displayed interval: 8 ms. Time is expressed in seconds, with zero denoting the start of the displayed record rather than the trigger instant. Angular-channel scaling and interpretation are described in Section 4.4 and Section 4.9.
The four retrieved histories show that the acceleration and angular-velocity interfaces were captured and retained together through the shared acquisition sequence.
6.4. Pressure–Acceleration Results
The second event produced the three histories in Figure 7. Pressure rises to approximately 354 MPa and then decays. Axial acceleration reaches approximately 27,000 g, while radial acceleration remains below 100 g in displayed peak magnitude. The pressure and axial-acceleration envelopes rise and decay within the same nominal event interval.
Figure 7.
Pressure–acceleration event: (a) axial acceleration; (b) radial acceleration; and (c) pressure. Nominal sampling rate: 1 MS/s per recorded field; displayed interval: 8 ms. Time is expressed in seconds, with zero denoting the start of the displayed record rather than the trigger instant. The displayed peaks are approximately 27,000 g axially, below 100 g in radial magnitude, and approximately 354 MPa in pressure.
The recovered record contains the pressure and acceleration histories from the second sensing-end arrangement. This configuration used the same threshold-initiated recording, local storage, and post-recovery readout procedure as the first event.
6.5. Record Retrieval and Post-Test Operation
Each configuration yielded one retrieved record from one loading event. The package remained operational after recovery, with post-test communication available in both cases. These observations demonstrate event capture, local retention, and post-test readout for the two proof-of-concept tests. File-level completeness, sample ordering, checksum integrity, and sensor-calibration retention were not independently audited. Table 10 summarizes the results and recovery outcomes of the two events.
Table 10.
Reported results and recovery outcomes for the paired events.
7. Discussion
7.1. What the Experiments Demonstrate
The main result is an acquisition-to-retrieval procedure that operates with two different sensor combinations in a confined cylindrical installation. Channel-specific analog interfaces feed common record control, temporary buffering separates capture from nonvolatile writing, and the recovered files preserve the association between outputs from each event. Changing the sensing-end arrangement leaves the autonomous record-handling sequence unchanged.
The electrical checks and loading tests address successive parts of this process. The 1 kHz and nominal 5 V checks exercise signal capture through the acquisition stage. The two loading records then show that the sensing, power, storage, and communication functions can support event recording and later retrieval in the assembled package.
The practical benefit is access to related sensor outputs after a short event in which an external acquisition link is unavailable. The demonstrated contribution therefore lies in autonomous recording and recovery across two sensor combinations within the same installation architecture. The present evidence supports recorder-level feasibility across two paired configurations rather than repeated-condition reliability or simultaneous three-parameter validation.
7.2. Comparison with Related Instrumentation
Table 11 compares the measurement tasks, relevant capabilities, and study scope of related instrumentation. It places the present package alongside autonomous recorders, converter and storage systems, triggering systems, and sensor-calibration studies. The comparison distinguishes the evidence supplied by each implementation from the recorder-level evaluation reported here.
Table 11.
Measurement purpose, relevant capability, and comparison with the present study.
The present platform combines heterogeneous sensing interfaces with a shared record controller, temporary buffering, nonvolatile retention, and a recoverable cylindrical assembly. Its electrical checks and paired loading records provide complementary evidence at acquisition-stage and integrated-recorder levels.
7.3. Scope of Measurement and Data Interpretation
The acquisition hardware, ADC settings, and fixed-frame format are described in Section 4.1, Section 4.2, Section 4.3, Section 4.4, Section 4.5 and Section 4.6. Section 4.9 specifies the conversion from ADC codes to stored fields and engineering units. Figure 6 and Figure 7 use these conversions without additional filtering or amplitude rescaling. Signal-processing choices can affect transient features used in high-g calibration [35,36].
The electrical checks establish acquisition-stage signal capture. Quantitative interpretation of the loading records also depends on installed-channel sensitivity, bandwidth, relative delay, clock accuracy, and trigger latency/jitter. For pressure, pressure-port dynamics, mounting vibration, and cross-sensitivity act in addition to the electrical-reference correction [37,38]. The smaller radial-acceleration response is more sensitive to baseline behavior, transverse sensitivity, and mounting alignment; common-excitation multi-axis calibration can quantify these effects [23,24,25]. End-to-end calibration against defined references is needed to assign measurement and timing uncertainties.
One record was recovered from each paired configuration. These two events demonstrate capture, local storage, and post-test retrieval, but do not establish repeatability or statistical reliability. The fixed-frame format defines the expected sample count and payload; sample ordering and checksum integrity were not independently audited. Simultaneous three-parameter operation and repeated loading require further tests.
7.4. Future Experimental and Metrological Qualification
Future records should embed the board and firmware versions, input configuration, channel assignment, trigger settings, word format, and sample sequence in the event metadata.
End-to-end calibration should characterize the installed sensitivity, bandwidth, cross-axis response, filtering, and dynamic transfer characteristics of the pressure and inertial channels, with pre- and post-loading checks used to assess calibration retention. Quantitative timing qualification should use a common reference input to measure inter-channel delay and an external timing reference to characterize clock error and trigger latency/jitter.
A simultaneous pressure–acceleration–angular-velocity experiment is required to validate full three-parameter operation, with the complete channel-enable mask and event metadata retained. Repeated matched-condition tests at representative load levels should quantify peak-value variability, trigger/recording success, retrieval success, and any data loss, providing a statistical basis for repeatability and reliability assessment.
Structural qualification should combine documented finite-element assumptions with component-level indicators such as PCB strain, connector displacement, internal relative motion, and pre/post-test inspection. Environmental testing would further determine whether the demonstrated recorder operation extends beyond the present laboratory conditions.
8. Conclusions
A compact autonomous platform was developed for transient measurements in confined moving systems. Pressure and inertial interfaces, FPGA/microcontroller control, SDRAM buffering, eMMC storage, internal power, and mechanical support form one integrated recorder. Its operating sequence links circular buffering to threshold-initiated capture, nonvolatile writing, and post-test retrieval. The component description, fixed eight-field format, decoding rule, and conversion equations document the implementation and readout convention.
Three-channel electrical checks captured 1 kHz inputs and gave voltage spans of 6–8 mV at a nominal 5 V input. The loading evaluation included one event per paired configuration. Each test stored an 8 ms record at a nominal sampling rate of 1 MS/s per recorded field. The count-to-unit conversions give axial acceleration above 24,000 g in the first event and approximately 27,000 g in the second, with approximately 354 MPa pressure in the latter. Both records were retrieved, and post-event communication remained available.
The two proof-of-concept tests demonstrate autonomous paired-parameter recording and post-test recovery in the compact package. Further evaluation should address simultaneous three-parameter operation, end-to-end calibration, quantitative synchronization, and repeated-condition reliability.
Author Contributions
Conceptualization, C.L., Y.Z. and P.Z.; methodology, C.L., W.L. and P.Z.; software, C.L., Y.Z. and P.Z.; validation, W.L.; formal analysis, W.L.; investigation, W.L., Y.Z. and S.S.; resources, W.L.; data curation, C.L., P.Z. and W.L.; writing—original draft preparation, C.L.; writing—review and editing, C.L., W.L., P.Z. and Y.Z.; visualization, C.L., P.Z. and W.L.; supervision, W.L.; project administration, C.L., W.L. and S.S.; funding acquisition, W.L. and S.S. All authors have read and agreed to the published version of the manuscript.
Funding
This research was funded by the Hubei Provincial Natural Science Foundation, grant number 2023AFB900.
Data Availability Statement
The numerical results and waveform histories evaluated in this study are presented in this article. Enquiries about the underlying experimental records should be directed to the corresponding authors.
Conflicts of Interest
The authors declare no conflicts of interest.
Appendix A. Record-Budget Arithmetic
Table A1 gives sample and payload counts for the fixed eight-field format. Both configurations use MA = MP = 8 fields per sample position and b = 2 bytes per field. The 16-bit unsigned words store the offset fields defined in Section 4.9, not the full 18-bit ADC output. At 1 MS/s per recorded field, each 8 ms event stores 8000 samples per field. Record-level headers and other metadata are excluded from the payload calculation.
Table A1.
Sample counts and payload budgets for the fixed eight-field event format.
Each frame contains 8 × 2 = 16 sample bytes, and each field contributes 8000 × 2 = 16,000 bytes per event. The pressure signal and its electrical reference occupy separate stored fields but form one pressure history. The 128,000-byte sample payload is part of a complete event file of approximately 128–132 kB. The payload calculation excludes record-level overhead. SDRAM buffering separates event-time acquisition from the subsequent eMMC write.
References
- Avci, O.; Abdeljaber, O.; Kiranyaz, S.; Hussein, M.; Gabbouj, M.; Inman, D.J. A review of vibration-based damage detection in civil structures: From traditional methods to machine learning and deep learning applications. Mech. Syst. Signal Process. 2021, 147, 107077. [Google Scholar] [CrossRef] [Scilit]
- Zhang, C.; Mousavi, A.A.; Masri, S.F.; Gholipour, G.; Yan, K.; Li, X. Vibration feature extraction using signal processing techniques for structural health monitoring: A review. Mech. Syst. Signal Process. 2022, 177, 109175. [Google Scholar] [CrossRef] [Scilit]
- Sofi, A.; Jane Regita, J.; Rane, B.; Lau, H.H. Structural health monitoring using wireless smart sensor network—An overview. Mech. Syst. Signal Process. 2022, 163, 108113. [Google Scholar] [CrossRef] [Scilit]
- Chen, Y.; Zheng, X.; Luo, Y.; Shen, Y.; Xue, Y.; Fu, W. An approach for time synchronization of wireless accelerometer sensors using frequency-squeezing-based operational modal analysis. Sensors 2022, 22, 4784. [Google Scholar] [CrossRef] [Scilit] [PubMed]
- Grebović, S.; Oprašić, N.; Fejzić, A.; Kartal, H.; Akšamović, A.; Konjicija, S. A low cost real-time transient recorder for high voltage systems. Sensors 2023, 23, 9769. [Google Scholar] [CrossRef] [Scilit] [PubMed]
- Kavaliauskas, Ž.; Šajev, I.; Blažiūnas, G.; Gecevičius, G.; Kazlauskas, S. Development and investigation of a smart impact detector for monitoring the shipment transport process. Appl. Sci. 2024, 14, 7102. [Google Scholar] [CrossRef] [Scilit]
- Bedretchuk, J.P.; Arribas García, S.; Nogiri Igarashi, T.; Canal, R.; Wedderhoff Spengler, A.; Gracioli, G. Low-cost data acquisition system for automotive electronic control units. Sensors 2023, 23, 2319. [Google Scholar] [CrossRef] [Scilit] [PubMed]
- Choi, S.; Yang, H.; Noh, Y.; Kim, G.; Kwon, E.; Yoo, H. FPGA-based multi-channel real-time data acquisition system. Electronics 2024, 13, 2950. [Google Scholar] [CrossRef] [Scilit]
- Lu, J.; Bai, J.; Shen, S. Design and implementation of a high-speed storage system based on SATA interface. Electronics 2026, 15, 452. [Google Scholar] [CrossRef] [Scilit]
- Yin, D.; Jiang, D.; Yu, J.; Liu, X.; Liu, Z.; Zhang, H. PMT-TC: A programmable multi-event triggering and timing coordination system for rocket-sled ejection tests. Aerospace 2026, 13, 759. [Google Scholar] [CrossRef] [Scilit]
- Gong, Y.; Li, C.; Shang, F.; Kong, D.; Fan, H. Design of an overload storage test system based on multiple sensors. Sens. Rev. 2026, 1–14. [Google Scholar] [CrossRef] [Scilit]
- Radi, A.; Mohamed, M.; Zahran, S. Design, implementation and calibration of analog gyro-based angular rate data acquisition system for high-spinning rotation rate applications. Sensors 2026, 26, 5083. [Google Scholar] [CrossRef] [Scilit] [PubMed]
- Wang, X.; Dong, W.; Dong, H.; Gao, Y.; Lin, J.; Jia, H.; Tao, Y.; Sun, H. Bioprinting of wearable sensors, brain-machine interfaces, and exoskeleton robots. Int. J. Bioprint. 2024, 10, 16–37. [Google Scholar] [CrossRef] [Scilit]
- Zhou, P.; Zhao, L.; Liang, W.; Zhao, Y.; Li, C.; Tan, F. Design and evaluation method of a high-overload test device based on AD-TRIZ. Sensors 2025, 25, 6177. [Google Scholar] [CrossRef] [Scilit] [PubMed]
- Analog Devices. AD7606C-18: 8-Channel DAS with 18-Bit, 1 MSPS Bipolar Input, Simultaneous Sampling ADC. Available online: https://www.analog.com/en/products/ad7606c-18.html (accessed on 16 September 2026).
- Analog Devices. AD7606B: 8-Channel DAS with 16-Bit, 800 kSPS Bipolar Input, Simultaneous Sampling ADC. Available online: https://www.analog.com/en/products/ad7606b.html (accessed on 16 September 2026).
- Analog Devices. LT3092: 200 mA Two-Terminal Programmable Current Source. Available online: https://www.analog.com/en/products/lt3092.html (accessed on 16 September 2026).
- Amer, E.; Wozniak, M.; Jönsson, G.; Arrhén, F. Evaluation of shock tube retrofitted with fast-opening valve for dynamic pressure calibration. Sensors 2021, 21, 4470. [Google Scholar] [CrossRef] [Scilit] [PubMed]
- Svete, A.; Hernández Castro, F.J.; Kutin, J. Effect of the dynamic response of a side-wall pressure measurement system on determining the pressure step signal in a shock tube using a time-of-flight method. Sensors 2022, 22, 2103. [Google Scholar] [CrossRef] [Scilit] [PubMed]
- Texas Instruments. INA351: Cost and Size Optimized, Low Power, 1.8 V to 5.5 V Selectable Gain Instrumentation Amplifier with Integrated Reference Buffer; Data Sheet, Rev. D. 2024. Available online: https://www.ti.com/lit/ds/symlink/ina351.pdf (accessed on 16 September 2026).
- Crognale, M.; Rinaldi, C.; Potenza, F.; Gattulli, V.; Colarieti, A.; Franchi, F. Developing and testing high-performance SHM sensors mounting low-noise MEMS accelerometers. Sensors 2024, 24, 2435. [Google Scholar] [CrossRef] [Scilit] [PubMed]
- Li, C.; Zhang, R.; Hao, L.; Zhao, Y. Development of a MEMS piezoresistive high-g accelerometer with a cross-center block structure and reliable electrode. Sensors 2024, 24, 5540. [Google Scholar] [CrossRef] [Scilit] [PubMed]
- Zhang, W.; Teng, F.; Zhang, Z. Sensitivity matrix calibration of triaxial high-G accelerometer based on triaxial shock calibration device. IEEE Sens. J. 2024, 24, 10975–10982. [Google Scholar] [CrossRef] [Scilit]
- Wang, Q.; Yuan, K.; Gao, M.; Xu, F.; Guo, W. A method for synchronous shock calibration of triaxial high-g accelerometers based on modified Hopkinson bar technique. IEEE Sens. J. 2023, 23, 11682–11694. [Google Scholar] [CrossRef] [Scilit]
- Gao, M.; Yuan, K.; Zhang, Y.; Chen, L.; Guo, W. Synchronous dynamic calibration of triaxial high-g accelerometers using a modified Hopkinson bar method: Theory, principle and experiment. Measurement 2023, 218, 113109. [Google Scholar] [CrossRef] [Scilit]
- Analog Devices. ADXRS649: Fast Starting, ±20,000°/sec Vibration Rejecting Rate Gyro; Data Sheet, Rev. B. 2012. Available online: https://www.analog.com/media/en/technical-documentation/data-sheets/ADXRS649.pdf (accessed on 16 September 2026).
- Analog Devices. AN-2020: An EMC Robust PCB Design Based on the AD7606B ADC for Power Automated Applications. Available online: https://www.analog.com/en/resources/app-notes/an-2020.html (accessed on 16 September 2026).
- Shi, Y.; Qu, Y.; Zhao, R.; Wang, Y.; Guo, C.; Cao, H.; Tang, J. Integrated package and calibration of high-g MEMS ASIC acceleration sensor. Measurement 2025, 240, 115510. [Google Scholar] [CrossRef] [Scilit]
- Pereira, J.D. Pressure sensors: Working principles of static and dynamic calibration. Sensors 2024, 24, 629. [Google Scholar] [CrossRef] [Scilit] [PubMed]
- JCGM 100:2008; Evaluation of Measurement Data—Guide to the Expression of Uncertainty in Measurement. BIPM: Sèvres, France, 2008. [CrossRef] [Scilit]
- Gharaibeh, M.A.; Pitarresi, J.M. A methodology to calculate the equivalent static loading for simulating electronic assemblies under impact. Microelectron. Reliab. 2022, 139, 114842. [Google Scholar] [CrossRef] [Scilit]
- Song, B.; Sanborn, B.; Loeffler, C.; Haynes, A.; Macrae, C. Characterization of dynamic confinement response of potting materials at different strain rates and temperatures. Mech. Mater. 2023, 186, 104808. [Google Scholar] [CrossRef] [Scilit]
- Peng, T.; You, Z. Reliability of MEMS in shock environments: 2000–2020. Micromachines 2021, 12, 1275. [Google Scholar] [CrossRef] [Scilit] [PubMed]
- Xu, Y.; Lin, J.; He, C.; Wu, H.; Huang, Q.; Yan, G. Design of a shock-protected structure for MEMS gyroscopes over a full temperature range. Micromachines 2024, 15, 206. [Google Scholar] [CrossRef] [Scilit] [PubMed]
- Shi, Y.; Zhang, J.; Jiao, J.; Zhao, R.; Cao, H. Calibration analysis of high-G MEMS accelerometer sensor based on wavelet and wavelet packet denoising. Sensors 2021, 21, 1231. [Google Scholar] [CrossRef] [Scilit] [PubMed]
- Wang, C.; Cui, Y.; Liu, Y.; Li, K.; Shen, C. High-G MEMS accelerometer calibration denoising method based on EMD and time-frequency peak filtering. Micromachines 2023, 14, 970. [Google Scholar] [CrossRef] [Scilit] [PubMed]
- Svete, A.; Amer, E.; Jönsson, G.; Kutin, J.; Arrhén, F. A method for correcting the high-frequency mechanical vibration effects in the dynamic calibration of pressure measurement systems using a shock tube. Mech. Syst. Signal Process. 2023, 193, 110246. [Google Scholar] [CrossRef] [Scilit]
- Pallas, N.-P.; Kellaris, K.; Bouris, D. Dynamic calibration of complex tubing systems using a single pressure measurement device. J. Wind Eng. Ind. Aerodyn. 2024, 249, 105715. [Google Scholar] [CrossRef] [Scilit]

Disclaimer/Publisher’s Note: The statements, opinions and data contained in all publications are solely those of the individual author(s) and contributor(s) and not of MDPI and/or the editor(s). MDPI and/or the editor(s) disclaim responsibility for any injury to people or property resulting from any ideas, methods, instructions or products referred to in the content. |
© 2026 by the authors. Licensee MDPI, Basel, Switzerland. This article is an open access article distributed under the terms and conditions of the Creative Commons Attribution (CC BY) license.