Abstract
In-vehicle Augmented Reality Head-Up Displays (AR-HUDs) enhance driving performance and experience by presenting critical information such as navigation cues and collision warnings. Although many studies have investigated the efficacy of AR-HUD navigation and collision warning interface designs, existing research has overlooked the critical interplay between graphic spatial positioning and safety risks arising from inattentional blindness. This study employed a single-factor within-subjects design, with Experiment 1 and Experiment 2 separately examining the impact of the spatial planar position (horizontal planar position, vertical planar position, mixed planar position) of AR-HUD navigation graphics and collision warning graphics on drivers’ inattentional blindness. The results revealed that the spatial planar position of AR-HUD navigation graphics has no significant effect on inattentional blindness behavior or reaction time. However, the horizontal planar position yielded the best user experience with low workload, followed by the mixed planar position. For AR-HUD collision warning graphics, their spatial planar position does not significantly influence the frequency of inattentional blindness; From the perspectives of workload and user experience, the vertical planar position of collision warning graphics provides the best experience with the lowest workload, while the mixed planar position demonstrates superior hedonic qualities. Overall, this study offers design guidelines for in-vehicle AR-HUD interfaces.
1. Introduction
AR-HUD creates a space where real and virtual information can appear synchronously [1], integrating data with the road environment in a more natural manner to enhance driver user experience [2] and mitigate safety risks associated with frequent gaze shifts to check information [3]. However, driving is a multitasking activity in a spatial environment, requiring drivers to switch visual attention between AR-HUD content and road environment cues. The perceptual characteristics of AR-HUD graphics can influence information acquisition and attention allocation [4]; frequent gaze switching, in turn, may induce inattentional blindness, thereby increasing the risk of accidental collisions that threaten driving safety [5]. Notably, presenting graphic information in appropriate positions can improve readability and viewing comfort, which helps reduce the frequency of drivers’ focus adjustments [6]. Thus, it is imperative to explore how the spatial plane position of AR-HUD information affects drivers’ perception and to develop scientifically sound AR-HUD designs that minimize inattentional blindness.
Vehicle navigation systems provide drivers with directional and road-related information. The advancement of AR-HUD technology enables the display of navigation and essential vehicle data on the windshield, superimposing such information onto real-world road conditions and thereby significantly reducing navigation errors and distractions [7]. Traditional HUDs typically present 2D information on vertical planes, whereas AR-HUDs introduce a novel mode of human–vehicle interaction for information delivery. Extant research has predominantly explored more effective and user-friendly HUD navigation information designs by comparing different display formats and types of navigation content. For instance, Bauerfeind) demonstrated that in ambiguous navigation tasks, displaying route information via an AR display near the horizontal ground while simultaneously presenting turning arrows on the vertical plane outperforms traditional HUD displays, reducing drivers’ mental workload [8]. Chauvin further found that in complex scenarios, AR-displayed navigation information on the horizontal ground offers advantages over traditional HUDs, with drivers making fewer errors and participants reporting easier comprehension [9]. Additionally, to maximize information functionality and intuitiveness while minimizing interference from HUD information on real-world perception, studies have investigated the impact of information display effects. Pfannmüller, examined how four variants (cutoff, non-cutoff, inclined, 2D) of two navigation graphics (boomerang, arrow) displayed on horizontal planes in conventional HUDs (C-HUDs) influence driver perception [10]. Pärschexplored the effects of the coverage of navigation information relative to the external environment on driving performance and subjective perception [11]. There have also been studies comparing differences in dynamic navigation effects involving virtual vehicles [12]. However, given that AR-HUD-displayed information is spatial in nature, existing research has overlooked the effectiveness and user experience of AR-HUD navigation information across different spatial planes. According to geographical contexts, a vertical plane aligns with the direction of local gravity, while a horizontal plane is orthogonal to this direction. Building on existing research and automotive AR-HUD design practices, this study categorizes the display positions of AR-HUD navigation graphics into three types: horizontal (near-ground) planar position, vertical (ground-orthogonal) planar position, and mixed-plane planar position (combining both planes). This classification aims to further investigate which spatial plane position for displaying navigation information better enables drivers to balance driving tasks and reduce the occurrence of inattentional blindness.
In addition, warning information displayed via in-vehicle HUDs aids drivers in better comprehending vehicle status and the surrounding environment, enhancing trust and perceived safety to facilitate safer and more accurate driving decisions [13]. For instance, Kim demonstrated that presenting virtual shadows near the horizontal ground can improve drivers’ performance across all stages of cognitive processing, assisting in identifying hazardous pedestrians, predicting their movements, and enabling appropriate decision-making and responses [14]. Jingfurther compared arrow-pointing and virtual shadow AR-HUD interfaces, finding both effectively reduce visual interference, improve visual information acquisition efficiency, and minimize the frequency of drivers’ gaze departure from the road surface [15]. Similarly, Roh and Lee showed that displaying radial circles on the horizontal plane to indicate the positions and movement directions of pedestrians and personal mobility users enhances drivers’ responsiveness to potential hazards, providing practical support [16]. Chen even highlighted that AR warnings significantly improve task performance in terms of reaction time under both high and low traffic density conditions [17]. However, existing research has overlooked the effectiveness and user experience of AR-HUD collision warning information across different spatial planes. Thus, this study will further investigate the impact of collision warning information displayed at varying spatial plane positions on drivers’ inattentional blindness behavior.
In-vehicle AR-HUDs typically display basic information vertically within a fixed screen area, while presenting navigation details and warnings of impending hazards in the AR display region—offering a natural means of conveying spatiotemporal information aligned with moving objects [18]. Existing research has validated the effectiveness of AR-HUD displays but overlooked the spatial attributes inherent in AR presentation. The task demands of driving impose unique constraints on drivers’ cognitive processes, as they cannot allocate all attentional resources to interface interaction. A critical question thus emerges: on which spatial plane should AR-HUD navigation and collision warning graphics be designed to enable drivers to perceive information quickly and effectively during navigational driving, reduce inattentional blindness, and ensure safe driving? To address this, the present study will investigate the influence of the spatial plane position of AR-HUD augmented display graphics on drivers’ inattentional blindness and subjective experience under navigation and collision warning conditions, through the analysis of inattentional blindness instances, reaction times, and subjective evaluations.
2. Experiment 1
Experiment 1 aims to investigate whether the spatial plane position of AR-HUD navigation graphics will affect blindness behavior during driving. By collecting the reaction time of drivers in response to unpredictable events and subjective scale data, the potential impact of AR-HUD navigation graphic design on driving will be explored.
2.1. Method
2.1.1. Experimental Participants and Equipment
In this study, we used G*power 3.1 (Düsseldorf, Germany) to estimate the experimental sample size. Generally, statistical test power (power) is set at 0.8 [19], and medium and large effect sizes are considered acceptable [20]. To enhance the reliability and persuasiveness of the study, with a significance level α = 0.05, an effect size f = 0.25, and statistical test power = 0.95, the predicted total sample size was at least 43. Hence, 45 participants were recruited, with a gender ratio of 1:1 and ages ranging from 21 to 25 years old. They had normal or corrected-to-normal vision, held a valid driver’s license, and were right-handed. All participants signed a written informed consent form before the experiment, and each received appropriate compensation upon completion.
The experiment program was written using E-Prime 3.0 software to collect participants’ driving response data. Experimental content was presented on a display screen similar in size to a car’s front windshield (approximately 143.9 cm wide and 81.0 cm high) to achieve a more realistic visual experience. Additionally, a Logitech steering wheel, accelerator pedal, brake pedal, and seat were equipped to simulate a real vehicle driving environment, with buttons on the steering wheel used to record participants’ driving reaction times.
2.1.2. Experimental Material
- (1)
- AR-HUD navigation interface design
This study used Adobe After Effects to create the navigation interface. In AR usage environments, setting the color of AR-HUD navigation graphics to blue is relatively robust [21]. The color transparency of the graphics was set to 0.75, which offers advantages in visibility and search response [22,23]. To reduce neglect of unexpected information, the dynamic effect of the navigation graphics was set to blinking [23]. Additionally, irrelevant variables such as the amount of information and information layout on the AR-HUD interface were controlled: the number of items displayed on a single interface was limited to 6–7 to reduce distractions caused by excessive information [24,25]. The display positions of the AR-HUD navigation graphics were categorized into three types: horizontal (close to the ground) display, vertical (perpendicular to the ground) display, and mixed-plane display (combining both planes), corresponding to horizontal planar position, vertical planar position, and mixed planar position in terms of spatial plane position, respectively (Table 1).

Table 1.
Display effects of AR-HUD navigation graphics.
- (2)
- AR-HUD navigation-assisted driving simulation scenarios
Considering the limitations of experimental equipment, technology, and experimental safety, many studies used video materials to replicate the driving scenarios instead of real time interaction [26,27]. This study also adopted video materials to conduct the experiment to obtain participants’ objective data and subjective experiences. First, Unity3D ((Version 2023.2.20f1, Unity Technologies, San Francisco, CA, USA) was used to create a first-person driving scene that simulated reality as closely as possible and record the video. Then, Adobe After Effects (2024) software (Adobe, San Jose, CA, USA) was employed to superimpose navigation graphics and other information onto the video scenes. Finally, three experimental materials were produced and exported.
In the videos, the first-person-view car travels at a constant speed on a city road during a clear day. The scenes include traffic lights, buildings, trees, vehicles, and pedestrians, with all road elements randomly appearing alongside the road to create a natural and realistic driving experience for drivers. Each scene video features the car making four turns (two left turns and two right turns). Meanwhile, three inattentional blindness test points are set, each occurring once: the traffic light turns red and the car runs the red light; the leading car brakes (with its brake light illuminated) while the distance to the leading car is too close; a pedestrian suddenly rushes onto the road. Across all videos, the car does not avoid any critical events, and no collisions occur according to system settings.
2.1.3. Experimental Variables and Design
This study employed a single-factor within-subjects design, with the spatial plane position of AR-HUD navigation graphics serving as the independent variable. This variable included three levels: horizontal planar position, vertical planar position, and mixed planar position.
To explore how the spatial plane position of AR-HUD navigation graphics influences drivers’ driving reactions and experiences, this study collected objective data—including the number of inattentional blindness occurrences and reaction times (when no blindness occurred)—as well as subjective data from user experience assessments and the NASA-TLX scale. Button operations were used to capture participants’ reaction times and determine the presence of inattentional blindness [27]. Drawing on existing research and real-world driving scenarios, inattentional blindness was defined as follows: no reaction when a pedestrian stepped into view in front of the vehicle’s windshield [28]; no reaction to a red light 3 s before turning; and no reaction between the activation and deactivation of the leading vehicle’s brake lights. Correspondingly, reaction time (in the absence of inattentional blindness) was the interval from the onset of each event to the participant’s response.
To assess differences in drivers’ workload under varying spatial plane positions of AR-HUD navigation graphics, this study employed the NASA-TLX scale [29]. This scale comprises six dimensions, measuring distinct aspects of workload via subjective ratings: Mental Demand, Physical Demand, Temporal Demand, Performance, Effort, and Frustration Level. A 0–100 rating scale is typically used, with higher scores indicating greater workload in the corresponding dimension.
The user experience scale was employed to assess participants’ subjective feelings and satisfaction, focusing on two dimensions: pragmatic quality and hedonic quality. This scale aims to enable quick evaluation of UX using multiple task-related (pragmatic) and non-task-related (hedonic) aspects of user experience [30,31]. Both dimensions comprise four items, each representing a pair of terms with opposite meanings (i.e., semantic differences), and the average of the eight items is taken as the overall UX value [32]. A 7-point Likert scale was used for scoring, where 1 indicates complete disagreement and 7 indicates complete agreement.
2.1.4. Experimental Process
Before the experiment, participants read and completed the informed consent form and provided demographic information. For the formal experiment, they completed three trials, with three inattentional blindness measurements conducted in each trial. Prior to the experiment, participants were instructed to imagine themselves in a real driving scenario, steer according to the navigation and turning information displayed on the interface, and immediately press a button upon encountering a red traffic light, a suddenly rushing pedestrian, or a dangerously close distance to the preceding vehicle. To enhance the complexity and realism of the driving scenario, this study adopted a dual-task paradigm [27,33] the primary task was the driving task, where participants responded to unexpected events by pressing corresponding buttons on the steering wheel; the secondary task was a question-and-answer task [25], in which participants were asked interface-related questions (e.g., “What is the current speed?”) during each trial. Participants first completed one practice trial, with road settings identical to those in the formal experiment but with fewer scenarios included. Once participants demonstrated understanding of the experimental procedure, the formal experiment commenced: they read the instructions, pressed the space bar to start, and completed the three randomly ordered trials. After each trial, participants immediately filled out the user experience scale and NASA-TLX scale (Figure 1). They could take breaks between trials, and the entire experiment took each participant 10–15 min to complete.
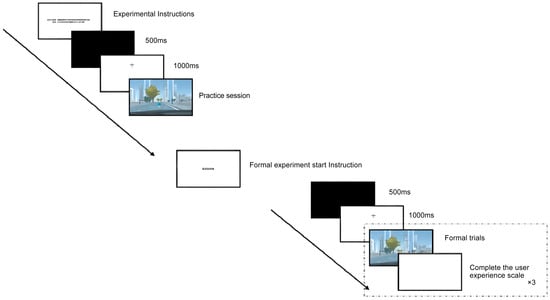
Figure 1.
Experimental flowchart.
2.2. Result
The spatial plane position of AR-HUD navigation indication graphics influences drivers’ subjective experience. This study examined differences in the three spatial plane displays through data on inattentional blindness, reaction time (when no blindness occurred), NASA-TLX scores, and user experience questionnaire responses. Notably, the UEQ score encompasses pragmatic quality, hedonic quality, and overall UX scores. The collected questionnaire data were processed and converted, with −3 indicating the most negative response, 0 a neutral response, and +3 the most positive response.
2.2.1. Inattentional Blindness
Descriptive statistics were conducted on the research results, which showed that participants experienced a total of 61 inattentional blindness occurrences. To explore the influence of the spatial plane position of AR-HUD navigation graphics on inattentional blindness, a non-parametric rank-sum test was employed, analyzed using the Kruskal–Wallis test method. The Kruskal–Wallis test’s null hypothesis posited that the spatial plane position of AR-HUD navigation graphics had no significant effect on the number of participants’ blindness occurrences. With a p-value of 0.778, the null hypothesis was supported, indicating that the number of blindness occurrences was nearly identical across different spatial plane positions. Thus, designers can use these positions flexibly.
2.2.2. Reaction Time
A generalized estimating equation analysis was performed, with reaction time (in the absence of blindness) as the dependent variable and the spatial plane position of navigation graphics as the factor. The results revealed that the spatial plane position had no significant effect on reaction time (χ2(2) = 0.356, p = 0.837) (Table 2, Figure 2). This indicates that drivers’ ability to process navigation information is comparable across different spatial plane positions, and the position of navigation graphics may not significantly impact their reaction speed. This could suggest that drivers exhibit strong adaptability to the spatial plane position of navigation graphics, or that the navigation graphic design is intuitive enough to avoid interfering with reaction speed.
Table 2.
Reaction times of different spatial plane positions of AR-HUD navigation graphics.
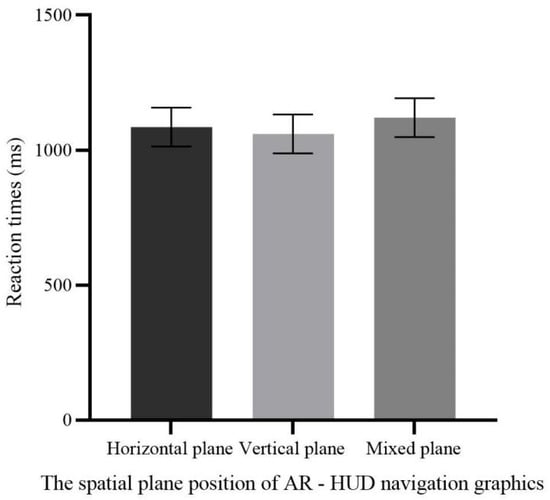
Figure 2.
The effect of the spatial plane position of AR-HUD navigation graphics on reaction time.
2.2.3. Workload
To explore how the spatial plane position of AR-HUD navigation graphics influences drivers’ workload, a generalized estimating equation analysis was performed, with NASA-TLX scores as the dependent variable and the spatial plane position of navigation graphics as the factor. The results revealed a significant difference in the effect of spatial plane position on subjective workload (χ2(2) = 8.199, p = 0.017). Post hoc pairwise comparisons indicated that vertical planar position (39.8214 ± 3.46025) was significantly higher than both horizontal planar position (26.1706 ± 3.46025) and mixed planar position (30.2579 ± 3.46025), with no significant difference between horizontal and mixed planar positions (Table 3, Figure 3). These findings suggest that horizontal planar position offers a distinct advantage in reducing subjective workload, while vertical planar position increases drivers’ subjective workload, and mixed planar position does not significantly elevate overall workload. Thus, designers should prioritize horizontal positioning for navigation graphics and use vertical planar position cautiously to minimize drivers’ cognitive burden. Although mixed planar position shows no significant advantage in workload, it remains worth exploring whether adjustments could achieve a better balance.
Table 3.
The effect of the spatial plane position of AR-HUD navigation graphics on workload.
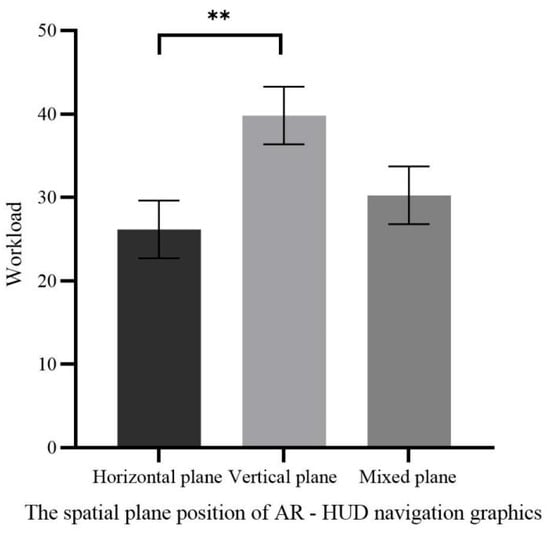
Figure 3.
Workload of different spatial plane positions of AR-HUD navigation graphics (** p < 0.01).
2.2.4. Subjective Evaluation of User Experience
To explore how the spatial plane position of AR-HUD navigation graphics influences drivers’ subjective experience, a generalized estimating equation analysis was performed, with pragmatic quality, pleasurable quality, and overall UX scores as the dependent variables and spatial plane position as the factor. Table 4 and Figure 4 present the user experience results across different spatial positions. The results indicated a significant difference in the effect of spatial plane position on pragmatic quality scores (χ2(2) = 37.491, p < 0.001). Post hoc pairwise comparisons revealed that horizontal planar position (1.5333 ± 0.23765) scored significantly higher than both vertical planar position (−0.4778 ± 0.23765) and mixed-plane display (0.1500 ± 0.23765), with a marginal difference between vertical and mixed-plane displays (mixed-plane > vertical).
Table 4.
The effect of the spatial plane position of AR-HUD navigation graphics on user experience.
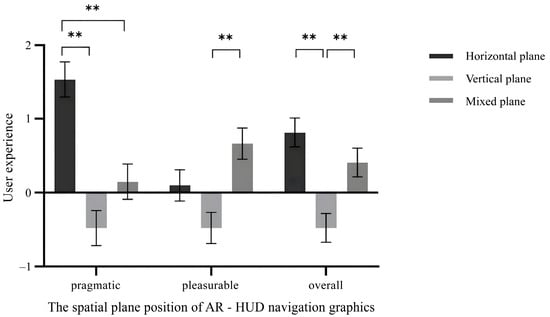
Figure 4.
User experience with different spatial plane positions of AR-HUD navigation graphics (** p < 0.01).
There was also a significant difference in the effect of spatial plane position on pleasurable quality scores (χ2(2) = 14.706, p = 0.001). Post hoc pairwise comparisons showed that vertical planar position (−0.4778 ± 0.21103) scored significantly lower than both horizontal planar position (0.1000 ± 0.21103) and mixed-plane display (0.6667 ± 0.21103), with a marginal difference between horizontal and mixed-plane displays (mixed-plane > horizontal). Additionally, spatial plane position had a significant effect on overall UX scores (χ2(2) = 23.150, p < 0.001). Post hoc pairwise comparisons demonstrated that vertical planar position (−0.47778 ± 0.194507) scored significantly lower than both horizontal planar position (0.81667 ± 0.194507) and mixed-plane display (0.40833 ± 0.194507), with no significant difference between horizontal and mixed-plane displays.
These findings indicate that vertical planar position yielded the lowest user experience scores, performing poorly in both pragmatic and pleasurable quality dimensions. Horizontal and mixed-plane displays showed no significant difference in overall UX, suggesting that despite differences in pragmatic and pleasurable qualities, both can provide a relatively good user experience. Thus, displaying navigation graphics on the horizontal plane may offer a better driving experience, or balancing horizontal and mixed-plane displays could be considered to accommodate both practicality and enjoyment.
2.2.5. Driving Behavior Is Related to Subjective Workload and User Experience
To further analyze relationships among drivers’ inattentional blindness behavior, workload, and user experience, Spearman’s correlation coefficient analysis was performed on the number of inattentional blindness occurrences, workload scores, pragmatic quality scores, and pleasurable quality scores. A positive correlation emerged between the number of inattentional blindness occurrences and workload scores (r = 0.217, p = 0.012), indicating that higher workload was associated with more frequent inattentional blindness. Workload scores also showed a strong negative correlation with pragmatic quality scores (r = −0.608, p < 0.001) and a negative correlation with pleasurable quality scores (r = −0.277, p = 0.001), meaning higher workload corresponded to lower scores in both quality dimensions. Additionally, pragmatic quality scores were positively correlated with pleasurable quality scores (r = 0.456, p < 0.001), suggesting that enhancing pragmatic quality in AR-HUD navigation graphic design may concurrently improve the pleasurable experience.
Thus, increased workload may lead to more inattentional blindness and reduced user experience. AR-HUD navigation graphic design should therefore aim to reduce drivers’ burden, enhance both pragmatic and pleasurable qualities, and thereby improve driving safety and enjoyment.
3. Experiment 2
Experiment 2 aims to explore whether the spatial plane position of AR-HUD collision warning graphic displays influences inattentional blindness behavior during driving. By capturing drivers’ reaction times to unpredictable events and collecting subjective scale data, it investigates the potential impact of AR-HUD collision warning graphic design on driving.
3.1. Method
3.1.1. Experimental Participants and Equipment
Similarly to Experiment 1, G*Power 3.1 was used to estimate the sample size, indicating a requirement for at least 43 participants. A total of 45 participants were thus recruited, with a 1:1 gender ratio and ages ranging from 21 to 25 years. They had normal or corrected-to-normal vision, held valid driver’s licenses, and were right-handed. All participants signed a written informed consent form prior to the experiment and received appropriate compensation upon completion.
The experimental equipment and environment were the same as those in Experiment 1.
3.1.2. Experimental Materials
- (1)
- AR-HUD collision warning interface design
Similarly to the AR-HUD interface design in Experiment 1, the color transparency of AR-HUD collision warning graphics was set to 0.75, with red used to enhance their warning effect [14,34,35]. Likewise, collision warning graphics were categorized into horizontal planar position, vertical planar position, and mixed planar position based on their spatial position (Table 5).
Table 5.
The display effect of AR-HUD collision warning graphics.
- (2)
- AR-HUD collision warning-assisted driving simulation scenarios
Three simulated driving videos were produced using Unity3D and Adobe After Effects software. Road scenes included randomly appearing buildings, trees, vehicles, and pedestrians to enhance environmental authenticity. In each scene video, the car travels straight at a constant speed on a city road during a clear day, encountering front-vehicle collision warnings and pedestrian collision warnings—each occurring 3 times, totaling 6 inattentional blindness test points. Specifically, these scenarios involve the preceding vehicle braking (with its brake light illuminated) at a dangerously close distance (rear-end collision risk); and a pedestrian suddenly rushing onto the road (pedestrian collision risk). The collision warning graphic’s position aligns with the warning object to clarify the prompt. Additionally, the warning graphic persists for 3 s, a duration proven appropriate [36]. Across all videos, unpredictable events follow different orders, and the car does not avoid any critical events.
3.1.3. Experimental Variables and Design
This study adopted a single-factor within-participants design. The spatial plane position of the AR-HUD collision warning graphics was taken as the independent variable, which included horizontal planar position, vertical planar position, and mixed planar position. To explore the influence of the spatial plane position on driving reactions and experiences, the number of inattentional blindness occurrences and reaction time (when no blindness occurred) were used as objective indicators, and the scores of the user experience and NASA-TLX scale were used as subjective measurement indicators, which was the same as in Experiment 1.
3.1.4. Experimental Procedure
The experimental procedure was the same as that in Experiment 1.
3.2. Result
This study employed a single-factor within-participants design, with the spatial plane position of AR-HUD collision warning graphics serving as the independent variable. This variable included three levels: horizontal planar position, vertical planar position, and mixed planar position. To explore how spatial plane position influences driving reactions and experiences, objective indicators included the number of inattentional blindness occurrences and reaction time (when no blindness occurred), while subjective measures comprised user experience scores and NASA-TLX scores—consistent with Experiment 1.
3.2.1. Inattentional Blindness
Descriptive statistics were conducted on the research results, which showed that driver participants experienced a total of three inattentional blindness occurrences. The study was divided into two scenarios: pedestrian collision warning and front-vehicle collision warning. To explore the influence of the spatial plane position of AR-HUD collision warning information on inattentional blindness, a non-parametric rank-sum test was employed, analyzed using the Kruskal–Wallis method. The results indicated that the spatial plane position of pedestrian collision warning graphics had no significant effect on inattentional blindness (p = 0.133), nor did that of front-vehicle collision warning graphics (p = 1.000). This may be because unexpected collision events ultimately appear very close to the front of the visual field, allowing drivers to react within a certain period, resulting in no significant differences across the three spatial plane position warnings.
However, the study found that although the data did not reach significance, in pedestrian collision scenarios, inattentional blindness occurred when warning information was displayed on the horizontal plane—specifically, the number of occurrences were generally higher than with mixed-plane and vertical-plane displays. This suggests that horizontal-plane display may be unsuitable for pedestrian collision warning design, whereas vertical-plane and mixed-plane displays offer a slight advantage for such warnings. These suggestions were made by limited experimental trials for each participant; more trials are needed to explore the validity.
3.2.2. Reaction Time
A generalized estimating equation analysis was performed, with reaction time (in the absence of inattentional blindness) as the dependent variable and the spatial plane position of AR-HUD collision warning graphics as the factor. Table 6 and Figure 5 present reaction time results for the pedestrian collision and front-vehicle collision scenarios. The results indicated that the spatial plane position of front-vehicle collision warning graphics had a significant impact on reaction time (χ2(2) = 13.006, p = 0.001), whereas that of pedestrian collision warning graphics did not (χ2(2) = 1.722, p = 0.423). Post hoc pairwise comparisons revealed that mixed-plane display of front-vehicle collision warning graphics (604.2667 ± 24.74569) yielded significantly shorter reaction times than vertical-plane display (728.4963 ± 47.82416) and horizontal-plane display (678.9630 ± 36.78284), with no significant difference between horizontal-plane and vertical-plane displays.
Table 6.
The effect of the spatial plane position of AR-HUD collision warning graphics on reaction time.
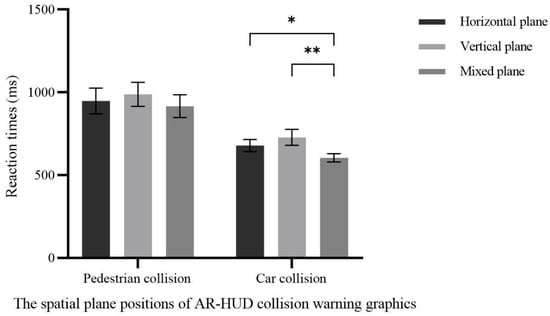
Figure 5.
Reaction time with different spatial plane positions of AR-HUD collision warning graphics (* p < 0.05; ** p < 0.01).
Thus, in front-vehicle collision warning scenarios, drivers responded more quickly to graphics presented on mixed-plane displays. In pedestrian collision warning scenarios, drivers could respond in a timely manner, allowing designers to flexibly design such graphics. For front-vehicle collision warning graphics—particularly in scenarios requiring rapid responses—mixed-plane display should be prioritized.
3.2.3. Workload
To explore the influence of the spatial plane position of AR-HUD collision warning graphics on drivers’ workload, a generalized estimating equation analysis was performed, with NASA-TLX scores as the dependent variable and the spatial plane position of AR-HUD collision warning graphics as the factor. The results revealed a significant difference in the effect of spatial plane position on subjective workload (χ2(2) = 10.037, p = 0.007). Post hoc pairwise comparisons indicated that horizontal-plane display (35.6481 ± 3.09495) and mixed-plane display (31.4815 ± 3.09495) scored significantly higher than vertical-plane display (22.1111 ± 3.09495), with no significant difference between horizontal-plane and mixed-plane displays (Table 7, Figure 6). In design, reducing drivers’ workload is critical to enhancing effective understanding of warning information. Thus, priority should be given to displaying collision warning graphics on the vertical plane in AR-HUD systems.
Table 7.
The effect of the spatial plane position of AR-HUD collision warning graphics on workload.
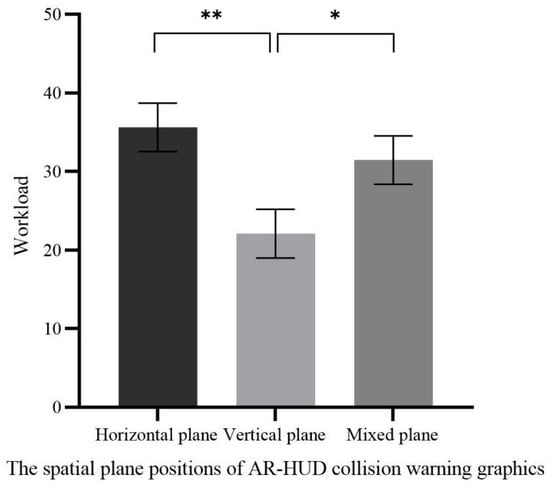
Figure 6.
Workload with different spatial plane positions of AR-HUD collision warning graphics (* p < 0.05; ** p < 0.01).
3.2.4. Subjective Evaluation of User Experience
The results indicated a significant difference in the effect of spatial plane position on pragmatic quality scores (χ2(2) = 25.928, p < 0.001). Post hoc pairwise comparisons revealed that vertical-plane display (1.6611 ± 0.20002) scored significantly higher than both horizontal-plane display (0.3667 ± 0.19158) and mixed-plane display (0.0444 ± 0.26693), with no significant difference between horizontal-plane and mixed-plane displays. There was also a significant difference in the effect of spatial plane position on pleasurable quality scores (χ2(2) = 11.587, p = 0.003). Post hoc pairwise comparisons showed that mixed-plane display (0.5667 ± 0.20985) and vertical-plane display (0.2167 ± 0.17526) scored significantly higher than horizontal-plane display (−0.3722 ± 0.22411), with no significant difference between vertical-plane and mixed-plane displays, as shown in Table 8.
Table 8.
The effect of the spatial plane position of AR-HUD collision warning graphics on user experience.
Additionally, spatial plane position had a significant effect on overall UX scores (χ2(2) = 16.581, p < 0.001). Post hoc pairwise comparisons demonstrated that vertical-plane display (0.9389 ± 0.15583) scored significantly higher than both horizontal-plane display (−0.0028 ± 0.18528) and mixed-plane display (0.3056 ± 0.20800), with no significant difference between horizontal-plane and mixed-plane displays, as shown in Figure 7. Given that vertical-plane display performed best in pragmatic quality and overall UX, it is recommended to prioritize vertical-plane display when designing AR-HUD collision warning graphics to optimize pragmatic quality and overall user experience. However, mixed-plane display also showed strong performance in pleasurable quality, highlighting the need to explore how to balance these dimensions to refine designs and meet more users’ needs.
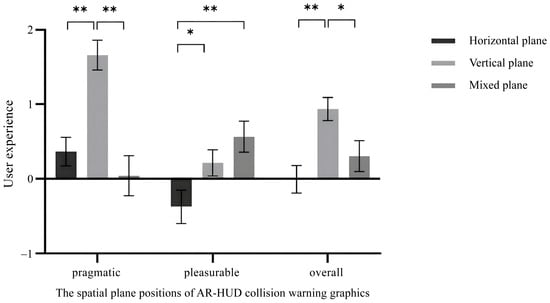
Figure 7.
User experience with different spatial plane positions of AR-HUD collision warning graphics (* p < 0.05; ** p < 0.01).
3.2.5. Relationship Between Workload and User Experience
To further analyze relationships among drivers’ inattentional blindness behavior, workload, and user experience, Spearman’s correlation coefficient analysis was performed on the number of inattentional blindness occurrences, workload scores, pragmatic quality scores, and pleasurable quality scores. No correlation was found between workload and the number of inattentional blindness occurrences, indicating that increased workload does not affect drivers’ processing of warning information. Workload scores showed a negative correlation with pragmatic quality scores (r = −0.499, p < 0.001) and with pleasurable quality scores (r = −0.316, p < 0.001), implying that high workload may reduce both pragmatic and pleasurable quality. Additionally, a moderate positive correlation was observed between pragmatic quality scores and pleasurable quality scores (r = 0.411, p < 0.001), suggesting that a collision warning design with strong practicality may simultaneously enhance driving pleasure. Thus, when designing AR-HUD collision warning graphics, avoiding increased driver workload is critical to maintaining a high-quality driving experience.
4. Discussion
4.1. Impact of Spatial Plane Position of Navigation Graphics on Inattentional Blindness Behavior and Reaction Time
Experimental results indicated no significant differences in drivers’ inattentional blindness occurrences and reaction times across different spatial plane positions of AR-HUD navigation graphics. When displaying navigation information in horizontal, vertical, or hybrid planes, drivers showed comparable response times to unexpected events and similar frequencies of inattentional blindness. This suggests that navigation information presented in different spatial planes imposes similar cognitive demands on drivers’ attentional resources for information processing, failing to induce significant differences in driving responses. Previous studies have established a significant correlation between inattentional blindness and cognitive load, where excessive cognitive load substantially increases the probability of blindness occurrence [23]. Notably, this study revealed significant variations in cognitive load across the three spatial plane configurations, with horizontal planar position consuming significantly more cognitive resources than vertical displays. However, the lack of significant differences in blindness frequency might be attributed to the relatively low complexity of road traffic information in our experimental design. Participants’ cognitive load thresholds were not exceeded during routine road information processing, resulting in generally low and statistically indistinguishable blindness occurrences. This implies that vertical plane might demonstrate advantages in reducing inattentional blindness and enhancing driving safety under complex traffic conditions.
Existing studies about AR-HUD and C-HUD information characteristics have demonstrated that augmented reality overlays facilitate better navigation comprehension [8,9]. Consistent with findings from Yunuo’s study [37], our research confirms that AR displays can significantly reduce driver reaction times, thereby mitigating accident risks. The non-significant differences in reaction times across the three planes in this study suggest that all configurations effectively conveyed information, enabling rapid user comprehension and response. However, Experiment II revealed that hybrid plane outperformed both horizontal and vertical configurations in forward collision warnings, which may be attributed to optimized attentional resource allocation. During routine driving scenarios where preceding vehicles are common, automated information processing tends to reduce cognitive vigilance, potentially leading to delayed detection of critical proximity situations. Our findings indicate that hybrid plane designs possess superior capability to activate user awareness in normative driving contexts.
4.2. The Spatial Plane Position of Navigation Graphics Affects Driving Workload and User Experience
Horizontal and mixed planar position outperform vertical planar position, with horizontal plane displays offering the best experiential quality and lowest cognitive load. Increased workload can lead to more frequent inattentional blindness and reduced user experience, consistent with previous research suggesting that higher workload may result in more inattentional blindness or prolonged reaction times to unpredictable stimuli—detrimental to safe driving [38]. Additionally, prior studies comparing augmented reality head-up displays (AR-HUD) with traditional head-up displays (C-HUD) have shown that AR information, when correctly superimposed on the environment, enhances understanding of navigation information [8,9]. Yunuo also found through comparison that AR displays can significantly reduce drivers’ reaction times, helping to mitigate unexpected events [37], while AR visualization improves user experience [2]. This study further elaborates on differences in AR-HUD navigation graphic displays across planes, concluding that navigation information presented on different planes can all fulfill guiding functions. However, varying display methods may affect information manipulability, naturalness, and comfort, thereby influencing drivers’ comfort and experience when perceiving environmental information.
On the basis of ensuring safe driving, horizontal-plane display of navigation graphics best provides drivers with a superior driving experience. Perceptual Load Theory posits that the level of task perceptual load determines resource allocation during selective attention [39,40]. Human cognitive and attentional resources are limited [41]: when perceptual processing load is high, limited resources become occupied, restricting attention to objects or information relevant to the current task, with no residual resources for processing task-irrelevant information. Conversely, low perceptual processing load allows extra resources to automatically spread to other irrelevant objects or information, enabling individuals to process all sensory input effectively. The lack of significant differences in reaction time and inattentional blindness occurrences across the three display methods may thus stem from similar resource occupancy, with most participants’ perceptual load not reaching a level that impacts task completion. Furthermore, when performing navigation-driving tasks, individuals construct cognitive maps to memorize environmental and spatial relationships—mental representations that enable efficient navigation and flexible decision-making in novel situations [42]. In daily life, people habitually build cognitive maps using landmarks and paths, facilitating the acquisition, encoding, storage, recall, and decoding of information. Horizontal-plane display of navigation graphics, positioned close to the ground, may align more closely with the spatial layout that drivers are accustomed to in driving tasks, simplifying the integration of new information and spatial navigation. This results in lower cognitive load, more natural information processing, and better subjective experience. In contrast, vertical-plane display of navigation graphics may require additional cognitive transformations by drivers, potentially increasing their cognitive burden.
Information presentation should enhance drivers’ intuition and reduce cognitive load, thereby improving driving safety and experience. In AR-HUD interface design, horizontal-plane display is the preferred option for navigation graphics, followed by mixed-plane display. Navigation graphics at different spatial plane positions influence how drivers receive, process, and integrate spatial information. When properly designed, mixed-plane display can provide more abundant spatial information, helping to enhance cognitive map accuracy. However, it may also increase load due to information overload, requiring designers to consider this comprehensively.
4.3. The Spatial Plane Position of Collision Warning Graphics Affects Driving Behavior and Perception
The spatial plane position of AR-HUD collision warning graphic displays can influence driving reactions, workload, and user experience. While different spatial plane positions show no significant impact on the number of inattentional blindness occurrences, varying event types and associated evasive maneuvers result in different response times. Specifically, the spatial plane position of pedestrian collision warning graphics has no significant effect on reaction time, whereas that of front-vehicle collision warning graphics does—with mixed-plane display outperforming both vertical-plane and horizontal-plane displays. From the perspectives of workload and user experience, vertical-plane display offers the best experience and lowest workload, followed by mixed-plane display, which exhibits relatively strong pleasurable qualities. High workload may reduce pragmatic and pleasurable quality but has no bearing on the number of inattentional blindness occurrences. Previous studies have shown that, compared with HDDs, displaying warning graphics on HUDs significantly improves drivers’ driving performance and eye-movement patterns [43]. Kim found that using ground-projected virtual shadows for pedestrian collision warnings can enhance drivers’ cognitive processing performance at each stage [14], while Roh and Leenoted that concentric circles projected on horizontal ground to indicate pedestrians’ and mobile users’ positions help improve drivers’ ability to respond to potential hazards [16]. Chen further demonstrated that for vertical-plane collision warnings, contact-type simulated warnings perform better in rear-end collisions, whereas bounding-box warnings yield shorter reaction times in pedestrian collisions [17]. This study confirms the advantages of AR-HUD in displaying warning graphics but further analyzes differences in how display spatial plane positions affect drivers’ objective behavior and subjective perception. Additionally, reaction times for pedestrian collision events are longer than those for front-vehicle collision events—consistent with previous research showing that lateral accidents (e.g., pedestrian collisions) elicit longer response times than longitudinal accidents (e.g., front-vehicle collisions) [44]. Drivers process central visual information efficiently but struggle with peripheral visual information [26]. Thus, in front-vehicle collision scenarios, warning information displayed across different spatial plane positions sufficiently captures drivers’ attention and enhances reactions, reducing collision risk. Conversely, pedestrian events—being lateral—may be more prone to inattentional blindness due to drivers’ lower efficiency in handling peripheral events, which aligns with the finding that horizontal-plane display performs relatively poorly in pedestrian collision warning design.
To balance driving safety and experiential quality, AR-HUD collision warning graphics can be displayed on either the vertical plane or mixed plane. Human cognitive and attentional resources are limited [41]; when a task demands substantial cognitive resources, insufficient capacity may remain for other tasks [45]. Macdonald and Lavieexplored inattentional blindness using a letter-search paradigm, proposing that load-induced blindness arises from the allocation of limited-capacity attention [46]. The present study shows that while workload does not affect drivers’ inattentional blindness, it does influence their experience: high workload, which typically involves processing more information and tasks, may disperse cognitive resources. Even so, drivers may maintain sufficient alertness under high workload to recognize warning information. Additionally, Feature Integration Theory divides visual attention into two key stages: pre-attentional and focused-attention [47]. Feature integration occurs in the second stage of visual processing, and when attention is overloaded or unfocused, stimulus features may combine inappropriately [48]. This suggests that users may need to allocate varying levels of attention to process warning graphics at different spatial plane positions. Despite the lack of significant differences in inattentional blindness occurrences, spatial plane position may still affect feature integration efficiency, thereby influencing reaction time and user experience.
To enhance drivers’ responses and experiences, AR-HUD design should account for collision event types. For pedestrian collision warning graphics, while horizontal-plane, vertical-plane, and mixed-plane displays all achieve a reminder effect, horizontal-plane display is not recommended when considering inattentional blindness occurrences and workload. The mixed-plane display may be chosen if a better hedonic experience is desired. For front-vehicle collision warning graphics, all spatial plane positions fulfill warning functions for drivers. The mixed-plane display can be selected to accelerate drivers’ responses as much as possible. To reduce cognitive load, vertical-plane display is preferred, followed by mixed-plane display.
4.4. Limitation
This study has some limitations. Due to equipment constraints, many previous studies about AR-HUD used pre-recorded videos as stimuli [23,27]. Video materials were used to standardize experimental conditions in this study. The use of pre-recorded videos instead of an interactive driving simulator reduces ecological validity. Participants watching video clips and engaging in simulated driving cannot fully replicate real-world driving, and the driving experience is less immersive compared to actual AR-HUD scenarios. The lack of real-time interaction may lower attentional demand and visual workload. However, the findings still shed light on guiding the spatial planar position of AR-HUD graphics design, which facilitate designers to reduce potential safety hazards for drivers.
Additionally, participants responded to unpredictable road events by pressing steering wheel buttons rather than using the brake pedal, limiting the ecological validity of the experimental task. To reduce this influence on behavioral data, participants were trained to press a button instead of a brake pedal. In future research, we will explore ways to refine experimental methods to better approximate perceptual experiences in real-world driving environments or strive to verify the validity of findings under real driving conditions. Finally, the study recruited college students, and demographic variables such as participants’ driving experience and gender may have influenced results. Future research should account for group and individual differences to more comprehensively analyze inattentional blindness in driving and optimize AR-HUD interface design.
5. Conclusions
The findings yielded design guidelines for the spatial plane position of AR-HUD navigation graphics. Horizontal-plane display is preferred for navigation graphics. Mixed-plane display can provide more spatial information, but increased information volume may elevate workload, thereby diminishing driving experience. Collision warning graphics design guidelines fall into two scenarios: pedestrian collisions and rear-end collisions. Overall, both vertical-plane and mixed-plane displays yield favorable effects. For pedestrian collision warning graphics design, mixed-plane display is a superior choice, as it can effectively warn drivers while enhancing their hedonic experience. For front-vehicle collision warning graphics design, mixed-plane display significantly accelerates drivers’ reaction speed, making it suitable for scenarios requiring rapid responses, while vertical-plane display, with its lower cognitive load, is more conducive to enhancing driving comfort and safety. In summary, when designing AR-HUD interfaces, designers must comprehensively consider task objectives, driving scenarios, and information complexity to optimize information display methods, striking a balance between driving safety and user experience.
Author Contributions
Conceptualization, M.Y. and J.Y.; Methodology, M.Y.; Validation, J.Y.; Writing—original draft, M.Y.; Supervision, J.Y. All authors have read and agreed to the published version of the manuscript.
Funding
This research was funded by National Social Science Foundation of China Key Project of Art Science (Grant No. 20AC003).
Data Availability Statement
The data presented in this study are available on request from the corresponding author.
Conflicts of Interest
The authors declare no conflict of interest.
References
- Moussa, G.; Radwan, E.; Hussain, K. Augmented Reality Vehicle system: Left-turn maneuver study. Transp. Res. Part C Emerg. Technol. 2012, 21, 1–16. [Google Scholar] [CrossRef]
- Detjen, H.; Salini, M.; Kronenberger, J.; Geisler, S.; Schneegass, S. Towards Transparent Behavior of Automated Vehicles: Design and Evaluation of HUD Concepts to Support System Predictability Through Motion Intent Communication. In Proceedings of the 23rd International Conference on Mobile Human-Computer Interaction, Toulouse, France, 27 September–1 October 2021; ACM Press: New York, NY, USA, 2021; pp. 1–12. [Google Scholar]
- Lee, J.; Koo, J.; Park, J.; Lee, M.C. Vehicle Augmented Reality Head-up Display information visualization enhancement algorithm and system. In Proceedings of the 2021 International Conference on Information and Communication Technology Convergence (ICTC), Jeju Island, Republic of Korea, 21–22 October 2021; IEEE: Piscataway, NJ, USA, 2021; pp. 701–706. [Google Scholar]
- Kim, H.; Gabbard, J.L. Assessing Distraction Potential of Augmented Reality Head-Up Displays for Vehicle Drivers. Hum. Factors J. Hum. Factors Ergon. Soc. 2022, 64, 852–865. [Google Scholar] [CrossRef]
- Pammer, K.; Sabadas, S.; Lentern, S. Allocating Attention to Detect Motorcycles: The Role of Inattentional Blindness. Hum. Factors J. Hum. Factors Ergon. Soc. 2018, 60, 5–19. [Google Scholar] [CrossRef]
- Li, R.; Chen, Y.V.; Zhang, L.; Shen, Z.; Qian, Z.C. Effects of perception of head-up display on the driving safety of experienced and inexperienced drivers. Displays 2020, 64, 101962. [Google Scholar] [CrossRef]
- Kim, S.; Dey, A.K. Simulated augmented reality windshield display as a cognitive mapping aid for elder driver navigation. In Proceedings of the SIGCHI Conference on Human Factors in Computing Systems, Boston, MA, USA, 4–9 April 2009; ACM Press: New York, NY, USA, 2009; pp. 133–142. [Google Scholar]
- Bauerfeind, K.; Drüke, J.; Bendewald, L.; Baumann, M. How does navigating with Augmented Reality information affect drivers’ glance behaviour in terms of attention allocation? Front. Virtual Real. 2022, 3, 930117. [Google Scholar] [CrossRef]
- Chauvin, C.; Said, F.; Langlois, S. Augmented reality HUD vs. conventional HUD to perform a navigation task in a complex driving situation. Cogn. Technol. Work 2023, 25, 217–232. [Google Scholar] [CrossRef]
- Pfannmüller, L.; Kramer, M.; Senner, B.; Bengler, K. A Comparison of Display Concepts for a Navigation System in an Automotive Contact Analog Head-up Display. Procedia Manuf. 2015, 3, 2722–2729. [Google Scholar] [CrossRef]
- Pärsch, N.; Harnischmacher, C.; Baumann, M.; Engeln, A.; Krauß, L. Designing Augmented Reality Navigation Visualizations for the Vehicle: A Question of Real World Object Coverage? In HCI in Mobility, Transport, and Automotive Systems; Krömker, H., Ed.; Springer International Publishing: Berlin/Heidelberg, Germany, 2019; Volume 11596, pp. 161–175. [Google Scholar]
- Smith, M.; Gabbard, J.L.; Burnett, G.; Hare, C.; Singh, H.; Skrypchuk, L. Determining the impact of augmented reality graphic spatial location and motion on driver behaviors. Appl. Ergon. 2021, 96, 103510. [Google Scholar] [CrossRef] [PubMed]
- Colley, M.; Krauss, S.; Lanzer, M.; Rukzio, E. How Should Automated Vehicles Communicate Critical Situations?: A Comparative Analysis of Visualization Concepts. Proc. ACM Interact. Mob. Wearable Ubiquitous Technol. 2021, 5, 1–23. [Google Scholar] [CrossRef]
- Kim, H.; Isleib, J.D.; Gabbard, J.L. Virtual Shadow: Making Cross Traffic Dynamics Visible through Augmented Reality Head Up Display. In Proceedings of the Human Factors and Ergonomics Society Annual Meeting, Washington, DC, USA, 19–23 September 2016; SAGE Publications: Los Angeles, CA, USA, 2016; Volume 60, pp. 2093–2097. [Google Scholar]
- Jing, C.; Shang, C.; Yu, D.; Chen, Y.; Zhi, J. The impact of different AR-HUD virtual warning interfaces on the takeover performance and visual characteristics of autonomous vehicles. Traffic Inj. Prev. 2022, 23, 277–282. [Google Scholar] [CrossRef]
- Roh, D.H.; Lee, J.Y. Augmented Reality-Based Navigation Using Deep Learning-Based Pedestrian and Personal Mobility User Recognition—A Comparative Evaluation for Driving Assistance. IEEE Access 2023, 11, 62200–62211. [Google Scholar] [CrossRef]
- Chen, W.; Niu, L.; Liu, S.; Ma, S.; Li, H.; Yang, Z. Evaluating the Effectiveness of Contact-Analog and Bounding Box Prototypes in Augmented Reality Head-Up Display Warning for Chinese Novice Drivers Under Various Collision Types and Traffic Density. Int. J. Hum.–Comput. Interact. 2024, 41, 2677–2691. [Google Scholar] [CrossRef]
- Fujimura, K.; Xu, L.; Tran, C.; Bhandari, R.; Ng-Thow-Hing, V. Driver queries using wheel-constrained finger pointing and 3-D head-up display visual feedback. In Proceedings of the 5th International Conference on Automotive User Interfaces and Interactive Vehicular Applications, Eindhoven, The Netherlands, 27–30 October 2013; ACM Press: New York, NY, USA, 2013; pp. 56–62. [Google Scholar]
- Cohen, J. Statistical Power Analysis for the Behavioral Sciences, 2nd ed.; Erlbaum Associates: Mahwah, NJ, USA, 1988. [Google Scholar]
- Cohen, J. A power primer. Psychol. Bull. 1992, 112, 155–159. [Google Scholar] [CrossRef] [PubMed]
- Gabbard, J.L.; Smith, M.; Merenda, C.; Burnett, G.; Large, D.R. A Perceptual Color-Matching Method for Examining Color Blending in Augmented Reality Head-Up Display Graphics. IEEE Trans. Vis. Comput. Graph. 2020, 28, 2834–2851. [Google Scholar] [CrossRef]
- Hussain, M.; Park, J. Effect of Transparency Levels and Real-World Backgrounds on the User Interface in Augmented Reality Environments. Int. J. Hum.–Comput. Interact. 2023, 40, 4265–4274. [Google Scholar] [CrossRef]
- Hou, G.; Dong, Q.; Wang, H. The Effect of Dynamic Effects and Color Transparency of AR-HUD Navigation Graphics on Driving Behavior Regarding Inattentional Blindness. Int. J. Hum.–Comput. Interact. 2024, 41, 7581–7592. [Google Scholar] [CrossRef]
- Park, K.; Im, Y. Ergonomic Guidelines of Head-Up Display User Interface during Semi-Automated Driving. Electronics 2020, 9, 611. [Google Scholar] [CrossRef]
- Burnett, G.E.; Donkor, R.A. Evaluating the impact of Head-Up Display complexity on peripheral detection performance: A driving simulator study. Adv. Transp. Stud. 2012, 28, 5–16. [Google Scholar]
- Chen, W.; Song, J.; Wang, Y.; Wu, C.; Ma, S.; Wang, D.; Yang, Z.; Li, H. Inattentional blindness to unexpected hazard in augmented reality head-up display assisted driving: The impact of the relative position between stimulus and augmented graph. Traffic Inj. Prev. 2023, 24, 344–351. [Google Scholar] [CrossRef]
- Briggs, G.F.; Hole, G.J.; Turner, J.A.J. The impact of attentional set and situation awareness on dual tasking driving performance. Transp. Res. Part F Traffic Psychol. Behav. 2018, 57, 36–47. [Google Scholar] [CrossRef]
- Wang, Y.; Wu, Y.; Chen, C.; Wu, B.; Ma, S.; Wang, D.; Li, H.; Yang, Z. Inattentional Blindness in Augmented Reality Head-Up Display-Assisted Driving. Int. J. Hum.–Comput. Interact. 2022, 38, 837–850. [Google Scholar] [CrossRef]
- Hart, S.G.; Staveland, L.E. Development of NASA-TLX (Task Load Index): Results of Empirical and Theoretical Research. Adv. Psychol. 1988, 52, 139–183. [Google Scholar] [CrossRef]
- Laugwitz, B.; Held, T.; Schrepp, M. Construction and evaluation of a user experience questionnaire. In HCI and Usability for Education and Work; Holzinger, A., Ed.; Springer: Berlin/Heidelberg, Germany, 2008; Volume 5298, pp. 63–76. [Google Scholar]
- Hassenzahl, M.; Tractinsky, N. User experience—A research agenda. Behav. Inf. Technol. 2006, 25, 91–97. [Google Scholar] [CrossRef]
- Schrepp, M.; Hinderks, A.; Thomaschewski, J. Design and Evaluation of a Short Version of the User Experience Questionnaire (UEQ-S). Int. J. Interact. Multimedia Artif. Intell. 2017, 4, 103–108. [Google Scholar] [CrossRef]
- Lee, J.; Lee, N.; Ju, J.; Chae, J.; Park, J.; Ryu, H.S.; Cho, Y.S. Visual Complexity of Head-Up Display in Automobiles Modulates Attentional Tunneling. Hum. Factors J. Hum. Factors Ergon. Soc. 2024, 66, 1879–1892. [Google Scholar] [CrossRef]
- Friedrich, M.; Vollrath, M. Urgency-Based color coding to support visual search in displays for supervisory control of multiple unmanned aircraft systems. Displays 2022, 74, 102185. [Google Scholar] [CrossRef]
- Chapanis, A. Hazards associated with three signal words and four colours on warning signs. Ergonomics 1994, 37, 265–275. [Google Scholar] [CrossRef]
- Ma, X.; Jia, M.; Hong, Z.; Kwok, A.P.K.; Yan, M. Does Augmented-Reality Head-Up Display Help? A Preliminary Study on Driving Performance Through a VR-Simulated Eye Movement Analysis. IEEE Access 2021, 9, 129951–129964. [Google Scholar] [CrossRef]
- Yunuo, C.; Xia, Z.; Liwei, T. How does AR-HUD system affect driving behaviour Evidence from an eye-tracking experiment study. Int. J. Veh. Des. 2023, 92, 1–21. [Google Scholar] [CrossRef]
- Murphy, G.; Greene, C.M. High perceptual load causes inattentional blindness and deafness in drivers. Vis. Cogn. 2015, 23, 810–814. [Google Scholar] [CrossRef]
- Lavie, N.; Fox, E. The role of perceptual load in negative priming. J. Exp. Psychol. Hum. Percept. Perform. 2000, 26, 1038–1052. [Google Scholar] [CrossRef]
- Lavie, N.; Tsal, Y. Perceptual load as a major determinant of the locus of selection in visual attention. Psychophys. 1994, 56, 183–197. [Google Scholar] [CrossRef]
- Sweller, J. Cognitive load during problem solving: Effects on learning. Cogn. Sci. 1988, 12, 257–285. [Google Scholar] [CrossRef]
- Tolman, E.C. Cognitive maps in rats and men. Psychol. Rev. 1948, 55, 189–208. [Google Scholar] [CrossRef] [PubMed]
- Yang, Z.; Shi, J.; Wu, B.; Ma, S.; Kang, C.; Zhang, W.; Li, H.; Wu, C. Effect of Warning Graphics Location on Driving Performance: An Eye Movement Study. Int. J. Hum.–Comput. Interact. 2020, 36, 1150–1160. [Google Scholar] [CrossRef]
- Dozza, M. What factors influence drivers’ response time for evasive maneuvers in real traffic? Accid. Anal. Prev. 2013, 58, 299–308. [Google Scholar] [CrossRef]
- Lavie, N. Distracted and confused?: Selective attention under load. Trends Cogn. Sci. 2005, 9, 75–82. [Google Scholar] [CrossRef] [PubMed]
- Macdonald, J.S.P.; Lavie, N. Load induced blindness. J. Exp. Psychol. Hum. Percept. Perform. 2008, 34, 1078–1091. [Google Scholar] [CrossRef] [PubMed]
- Treisman, A.; Gelade, G. A feature-integration theory of attention. Cogn. Psychol. 1980, 12, 97–136. [Google Scholar] [CrossRef]
- Treisman, A. Features and objects: The fourteenth bartlett memorial lecture. Q. J. Exp. Psychol. Sect. A 1988, 40, 201–237. [Google Scholar] [CrossRef]


Disclaimer/Publisher’s Note: The statements, opinions and data contained in all publications are solely those of the individual author(s) and contributor(s) and not of MDPI and/or the editor(s). MDPI and/or the editor(s) disclaim responsibility for any injury to people or property resulting from any ideas, methods, instructions or products referred to in the content. |
© 2025 by the authors. Licensee MDPI, Basel, Switzerland. This article is an open access article distributed under the terms and conditions of the Creative Commons Attribution (CC BY) license (https://creativecommons.org/licenses/by/4.0/).