


Abstract
Residual magnetism in the core of a power transformer can lead to an increased inrush current during closing, which may trigger relay protection malfunctions and cause equipment aging. Accurate detection of residual magnetism is crucial for grid safety. Traditional offline detection requires interrupting operation, while online methods are susceptible to interference and have limited accuracy. This paper proposes a method for detecting residual magnetism in power transformers based on the hysteresis area of magnetization. First, the magnetic flux distribution of the transformer is analyzed through finite element simulation, revealing that low-frequency excitation can make the core’s magnetic flux density distribution more uniform, and that the leakage flux and the flux inside the core have similar characteristics, which helps to determine the optimal position for flux detection. Next, the relationship between the small hysteresis loop area and residual magnetism is studied, revealing a monotonic mapping relationship between the normalized area of the negative hysteresis loop under current pulse excitation and the residual magnetism. Finally, experimental verification shows that this method effectively detects residual magnetism under different levels and operational conditions. The method is non-invasive, real-time, and highly resistant to interference, offering a new approach for residual magnetism detection in power transformers.
1. Introduction
As a core device for energy conversion and transmission in power systems, the operational reliability of power transformers directly impacts the stability and safety of the grid [1]. In modern power systems, transformers are key in converting high voltages from the generation side to medium and low voltages for distribution, or in converting medium and low voltages from the distribution side to low voltages for end-users. The operational status of transformers directly affects the continuity and quality of the electricity supply. With the rapid development of smart grids and the large-scale integration of renewable energy, the structure of power systems has become increasingly complex, and the operating environment of transformers has become more demanding. These factors require higher operational stability and safety for transformers [2].
During installation, maintenance, and operation, a certain amount of residual magnetism inevitably remains in the transformer core. This phenomenon stems from the hysteresis properties of ferromagnetic materials [3,4]. When subjected to an external magnetic field, ferromagnetic materials become magnetized, and even after the external magnetic field is removed, a residual magnetism remains inside the material. Transformer cores are typically made from laminated silicon steel or other ferromagnetic materials. During manufacturing, transportation, installation, and daily operations, factors such as DC excitation, lightning strikes, and short circuit faults can lead to the accumulation of residual magnetism in the transformer core [5,6].
Residual magnetism can significantly alter the magnetic flux transition during transformer energization, producing a surge current 10–20 times the rated current [7]. During no-load energization, if the core retains residual magnetism, the initial magnetic flux does not start from zero. This results in a high inrush current at closing. This instantaneous current can cause relay protection malfunctions, leading to unplanned outages, and accelerate the aging of winding insulation, thereby shortening the transformer’s lifespan [8]. In critical industrial and residential areas, such outages can cause severe economic losses and social impacts. Additionally, the surge current generates mechanical forces that shock the windings, which over time may cause deformation and compromise the transformer’s insulation and mechanical stability.
According to the International Conference on Large Electric Grids (CIGRE), transformer faults due to residual magnetism account for 8–12% of grid incidents, with this percentage rising to 15% in renewable energy integrated systems [9]. Renewable energy generation has the characteristics of intermittency and volatility, which result in more frequent energizing operations for transformers connected to such systems, increasing the probability of faults caused by residual magnetism. Therefore, accurately detecting and quantifying residual magnetism in transformer cores is crucial for optimizing closing strategies, suppressing inrush currents, and ensuring the safety of the grid.
Traditional residual magnetism detection methods can be categorized into offline and online detection. Offline detection methods, such as the DC magnetization method, involve applying a DC voltage to the windings to establish a stable magnetic flux, and then calculating the residual magnetism based on the demagnetization curve [10]. This method, although accurate, requires interrupting the transformer’s operation and is time-consuming (usually 2–4 h), which cannot meet the operational availability requirements of modern grids [11,12]. In today’s context of growing power demand, a long downtime for transformers severely affects the reliability of the power supply.
Online detection methods, such as the impact voltage method, deduce residual magnetism by monitoring the transient response of the windings. However, it is prone to interference from grid harmonics, with detection errors reaching 15–20% [13]. This method applies a brief impulse voltage to the transformer windings, then measures the transient voltage and current responses to calculate residual magnetism. However, harmonic components in the grid can interfere with the transient response signal, leading to inaccurate results [14]. The vibration analysis method uses the change in the vibration characteristics of the core due to residual magnetism for indirect measurement, but its sensitivity is significantly affected by environmental noise.
In recent years, detection techniques based on the characteristics of magnetization curves have attracted increasing attention. For example, residual magnetism can be extracted by analyzing the voltage–current waveforms during no-load closing [15]. However, this method relies on an accurate hysteresis model of the iron core, which limits its applicability under complex operating conditions. The magnetization curve describes the relationship between magnetic flux and magnetic field intensity in ferromagnetic materials, and the presence of residual magnetism causes a shift in the curve. By analyzing the voltage–current waveforms during no-load closing, relevant features of the magnetization curve can be obtained, thereby enabling the calculation of residual magnetism. Nevertheless, the hysteresis characteristics of the iron core are highly complex and are influenced by multiple factors such as material properties, temperature, and magnetic flux density. Establishing an accurate hysteresis model is therefore very challenging, which restricts the application of this method under complicated conditions.
The hysteresis loop, inherent to ferromagnetic materials, directly reflects the material’s magnetic state through its shape and area [16]. It refers to the closed curve formed between magnetic flux density and magnetic field intensity under cyclic excitation. Different magnetic states correspond to hysteresis loops with distinct shapes and areas, and analyzing the loop provides insights into the material’s magnetic properties. When residual magnetism exists in a transformer core, the hysteresis loop shifts during magnetization, exhibiting asymmetry between the forward and reverse magnetization paths [17]. This asymmetry arises because residual magnetism causes the initial points of forward and reverse magnetization to differ, thereby altering the loop’s shape.
Studies have shown that the area variation in minor hysteresis loops experiences a monotonic mapping relationship with the residual magnetism intensity, providing a novel approach for the quantitative detection of residual magnetism [18]. A minor hysteresis loop refers to a smaller closed curve formed in the local region of the main hysteresis loop. When residual magnetism exists in the core, the area of the minor hysteresis loop changes monotonically with the intensity of residual magnetism. By measuring the area of the minor hysteresis loop, the strength of residual magnetism can be quantitatively determined. Compared with traditional methods, the detection technique based on the excitation hysteresis loop area offers several advantages: (1) non-invasiveness, requiring no modification of the original transformer structure; (2) real-time capability, enabling detection during no-load or light-load operation; and (3) strong anti-interference ability, as the area integration operation effectively suppresses high-frequency noise [19,20]. These advantages highlight the promising potential of this method for practical engineering applications.
This paper proposes a residual magnetism detection method for power transformers based on the area of excitation hysteresis loops. First, a finite element simulation analyzes the internal magnetic flux distribution to determine the optimal detection location. As a powerful numerical tool, it accurately models the flux distribution inside the transformer. By comparing flux signals at different positions, the location with minimal interference and high signal strength is identified as optimal. Second, the influence of residual magnetism under different current pulse excitations is studied, and a mapping relationship between minor hysteresis loop area and residual magnetism is established. Finally, an experimental platform validates the method’s effectiveness under different residual magnetism and operating conditions.
2. Selection of Reasonable Positions for Magnetic Flux Detection
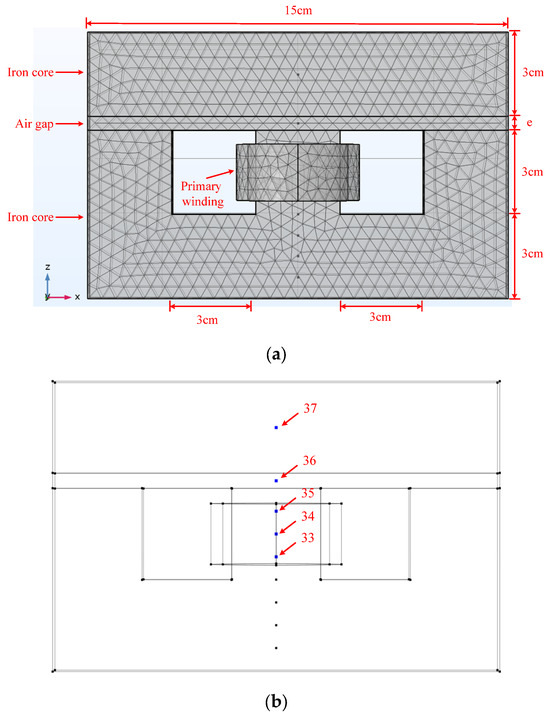
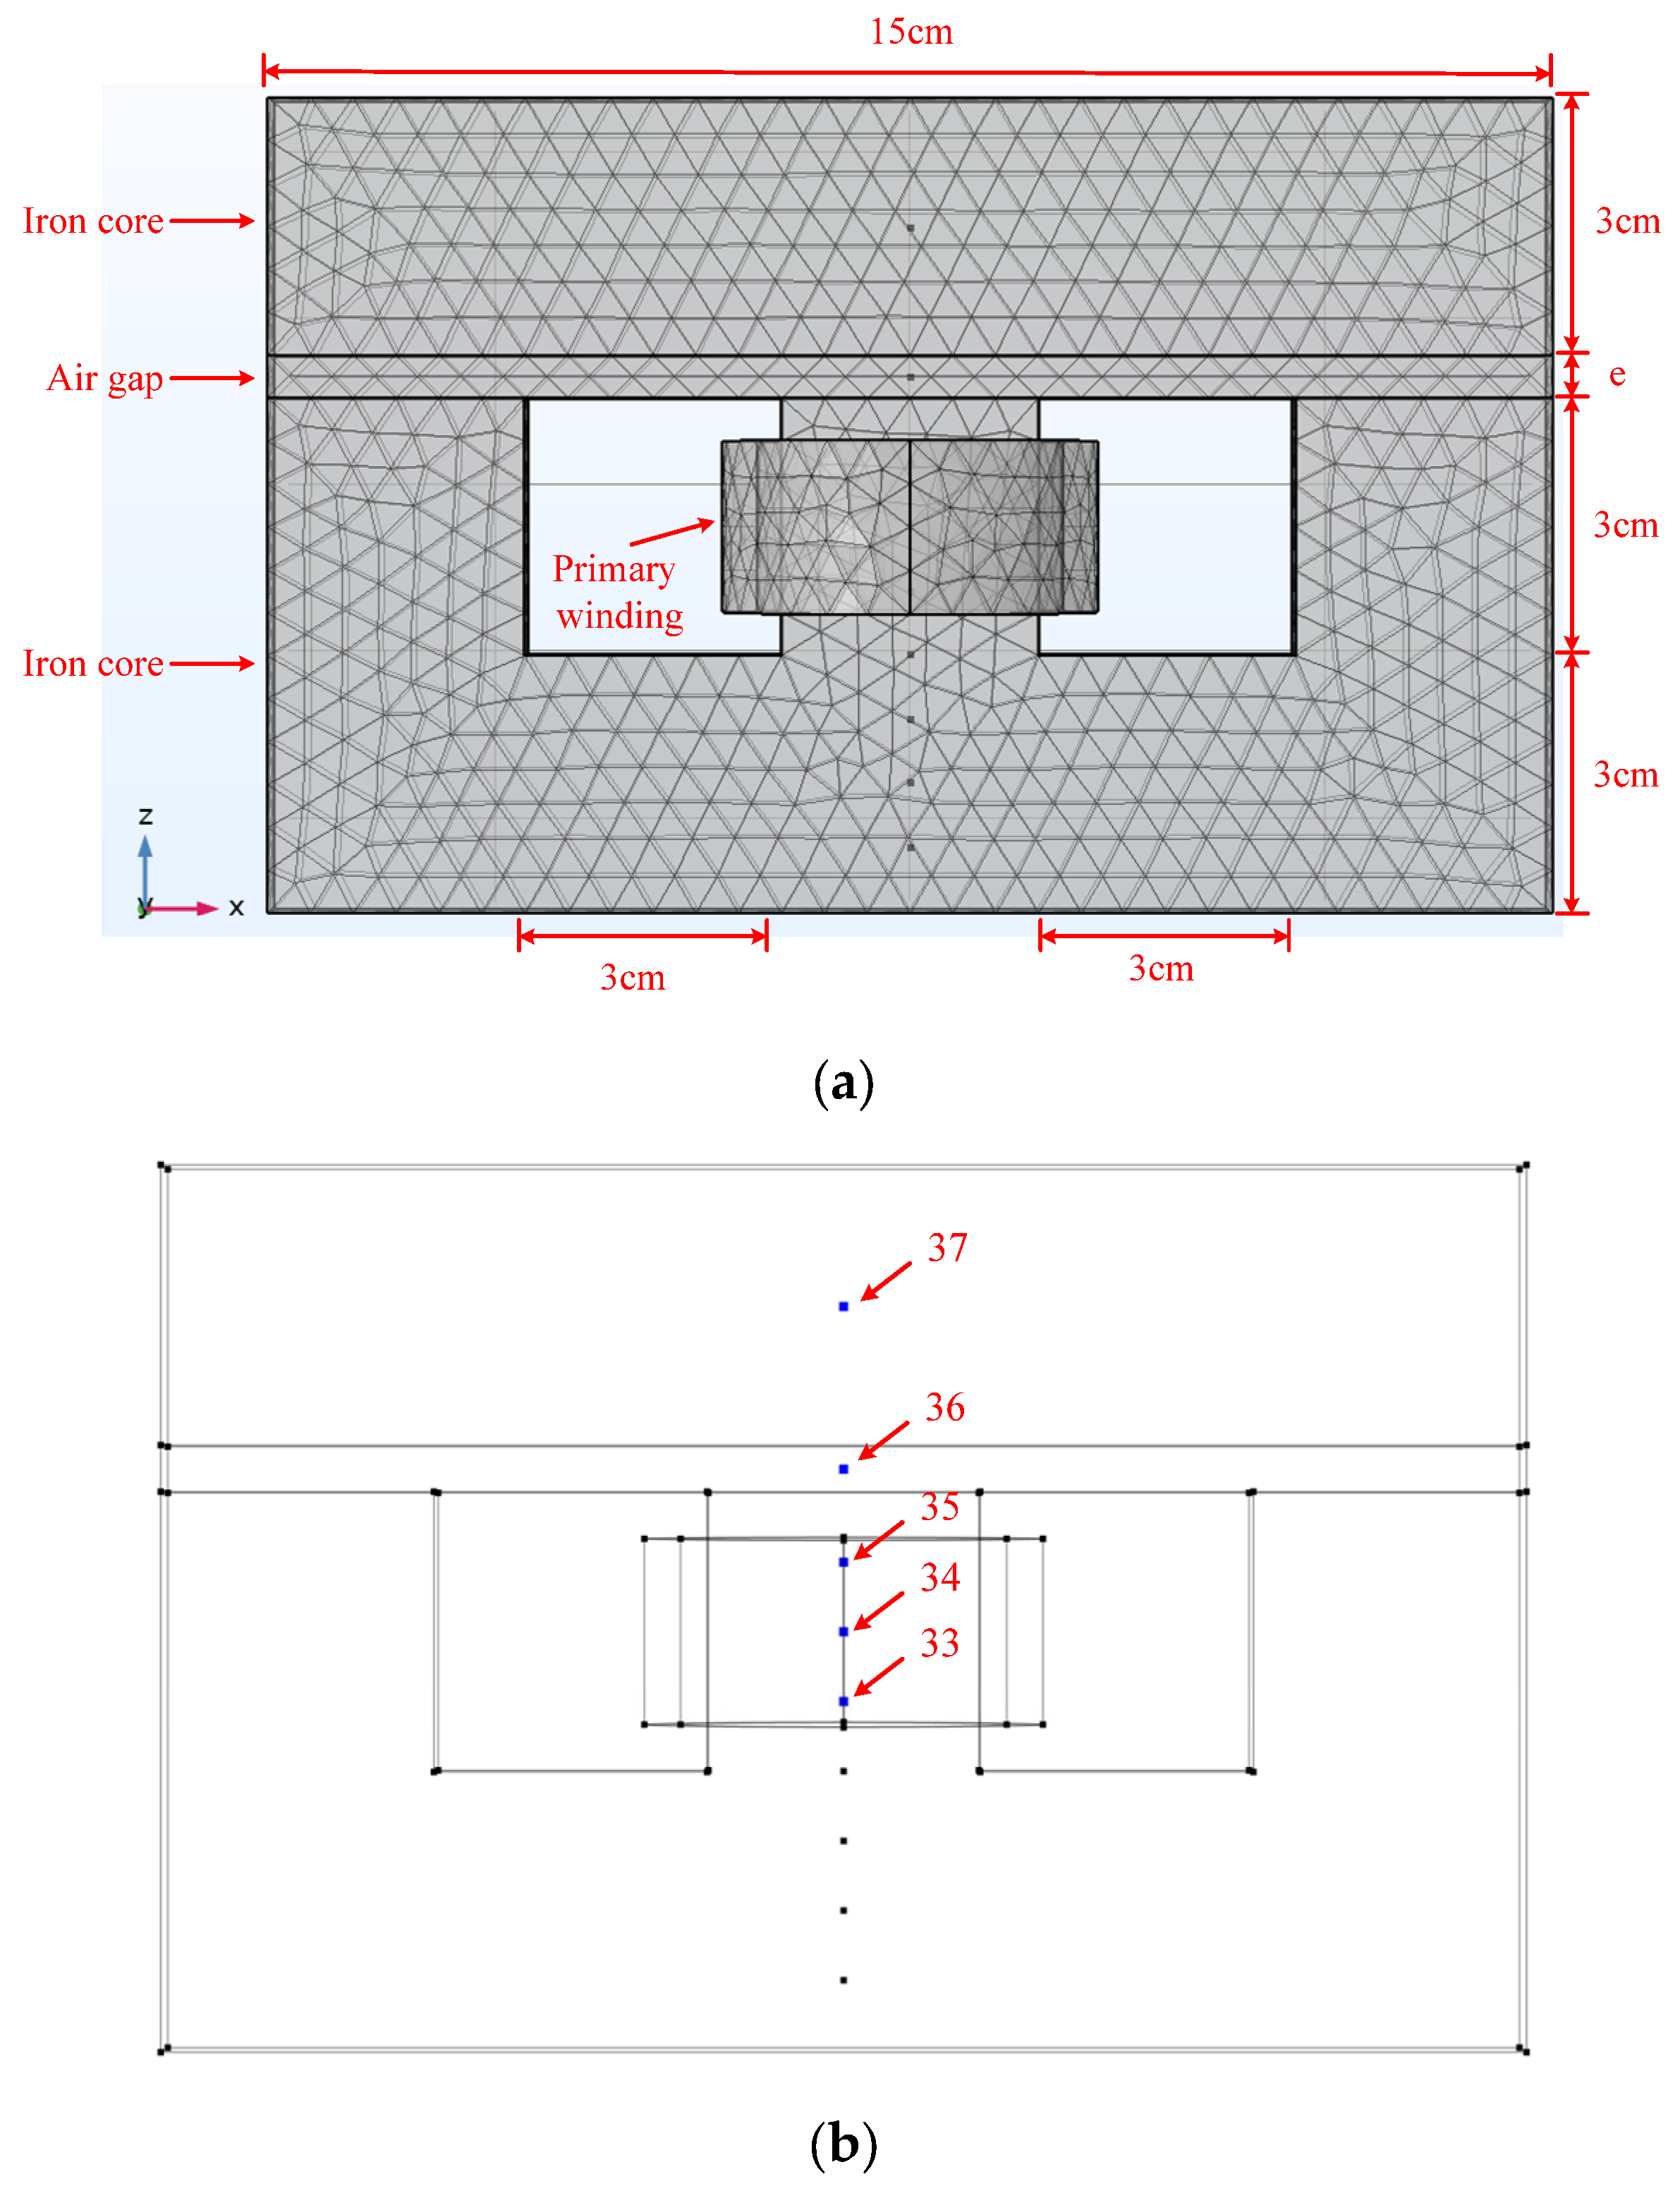
To validate the rationality of flux detection locations, the meshed transformer model in the XZ plane is shown in Figure 1a. The thickness in the Y-direction is 10 mm, and the transformer core material is silicon steel sheets. The point numbers in the model are automatically generated by the COMSOL Multiphysics 5.6 software. As illustrated in Figure 1b, flux detection points labeled 33 to 37 are distributed along the central axis. Among them, points 33–35 are located on the central axis of the primary coil, point 36 is positioned at the midpoint of the air gap along the axis, and point 37 is located at the midpoint of the core above the air gap.
Figure 1.
Transformer model and magnetic flux density detection point locations. (a) Transformer model mesh partition diagram; (b) magnetic flux density detection points on the central axis.
In the transformer simulation model, no secondary winding is defined—only the primary winding is included. The drive source, together with the primary winding, forms the excitation circuit, which is modeled with zero impedance, and the core is magnetized by the current in the primary winding.
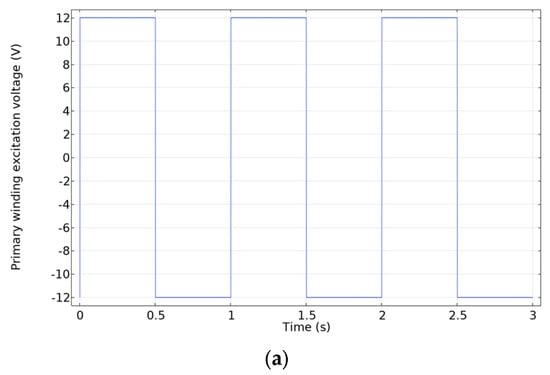
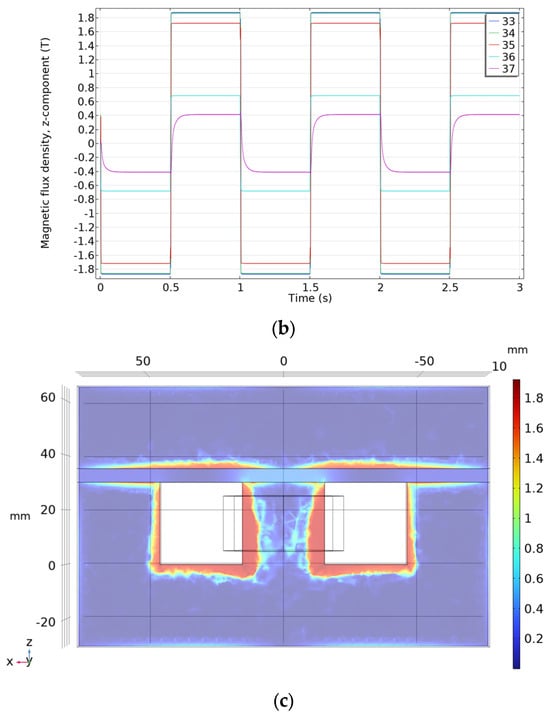
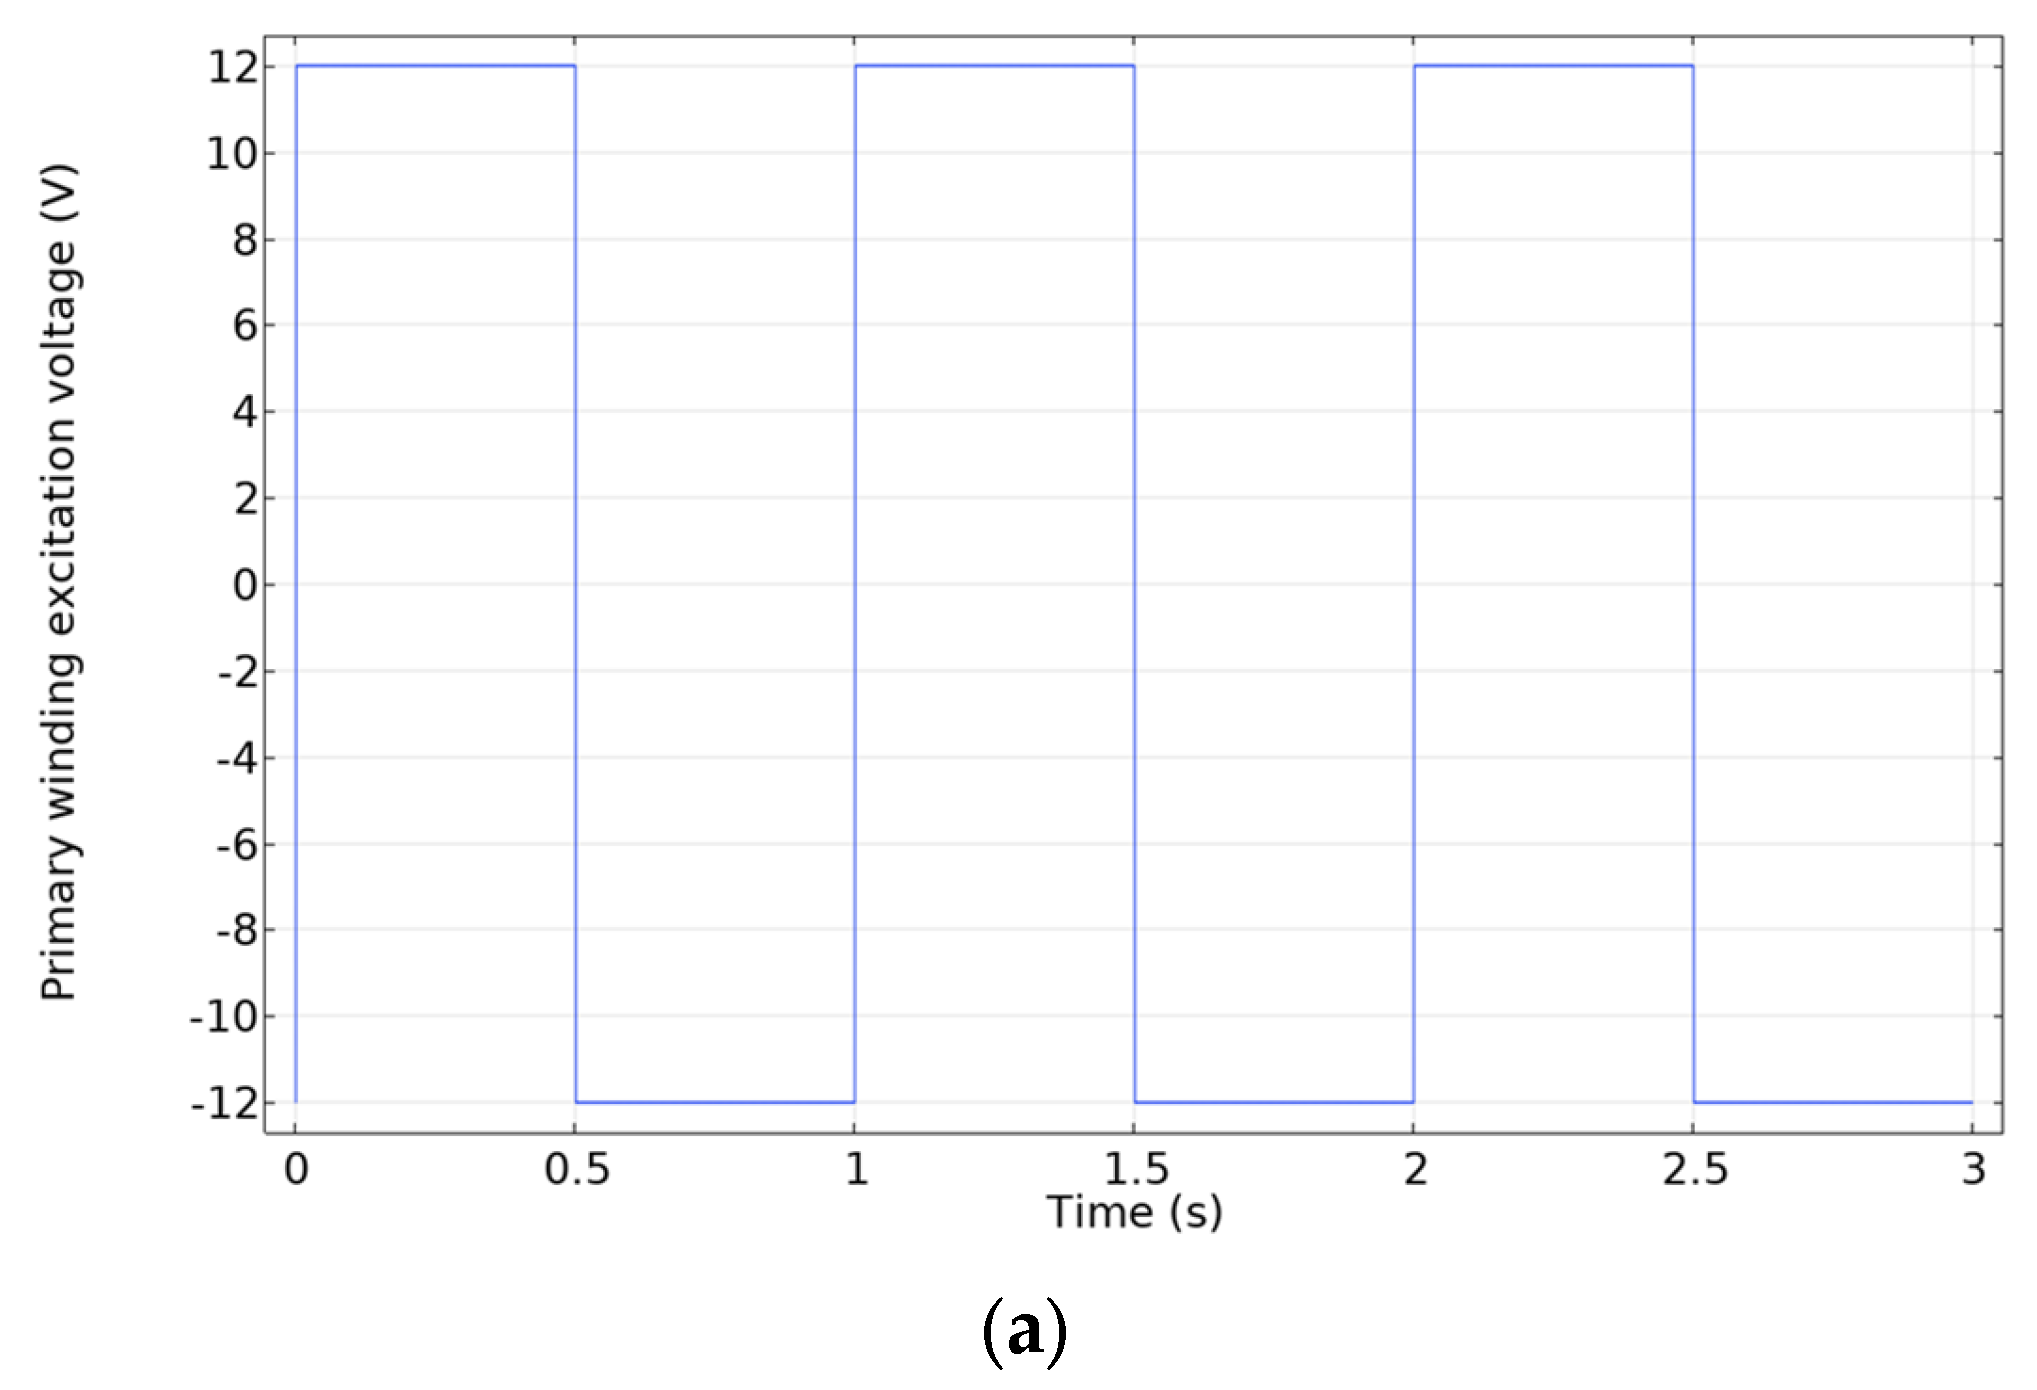
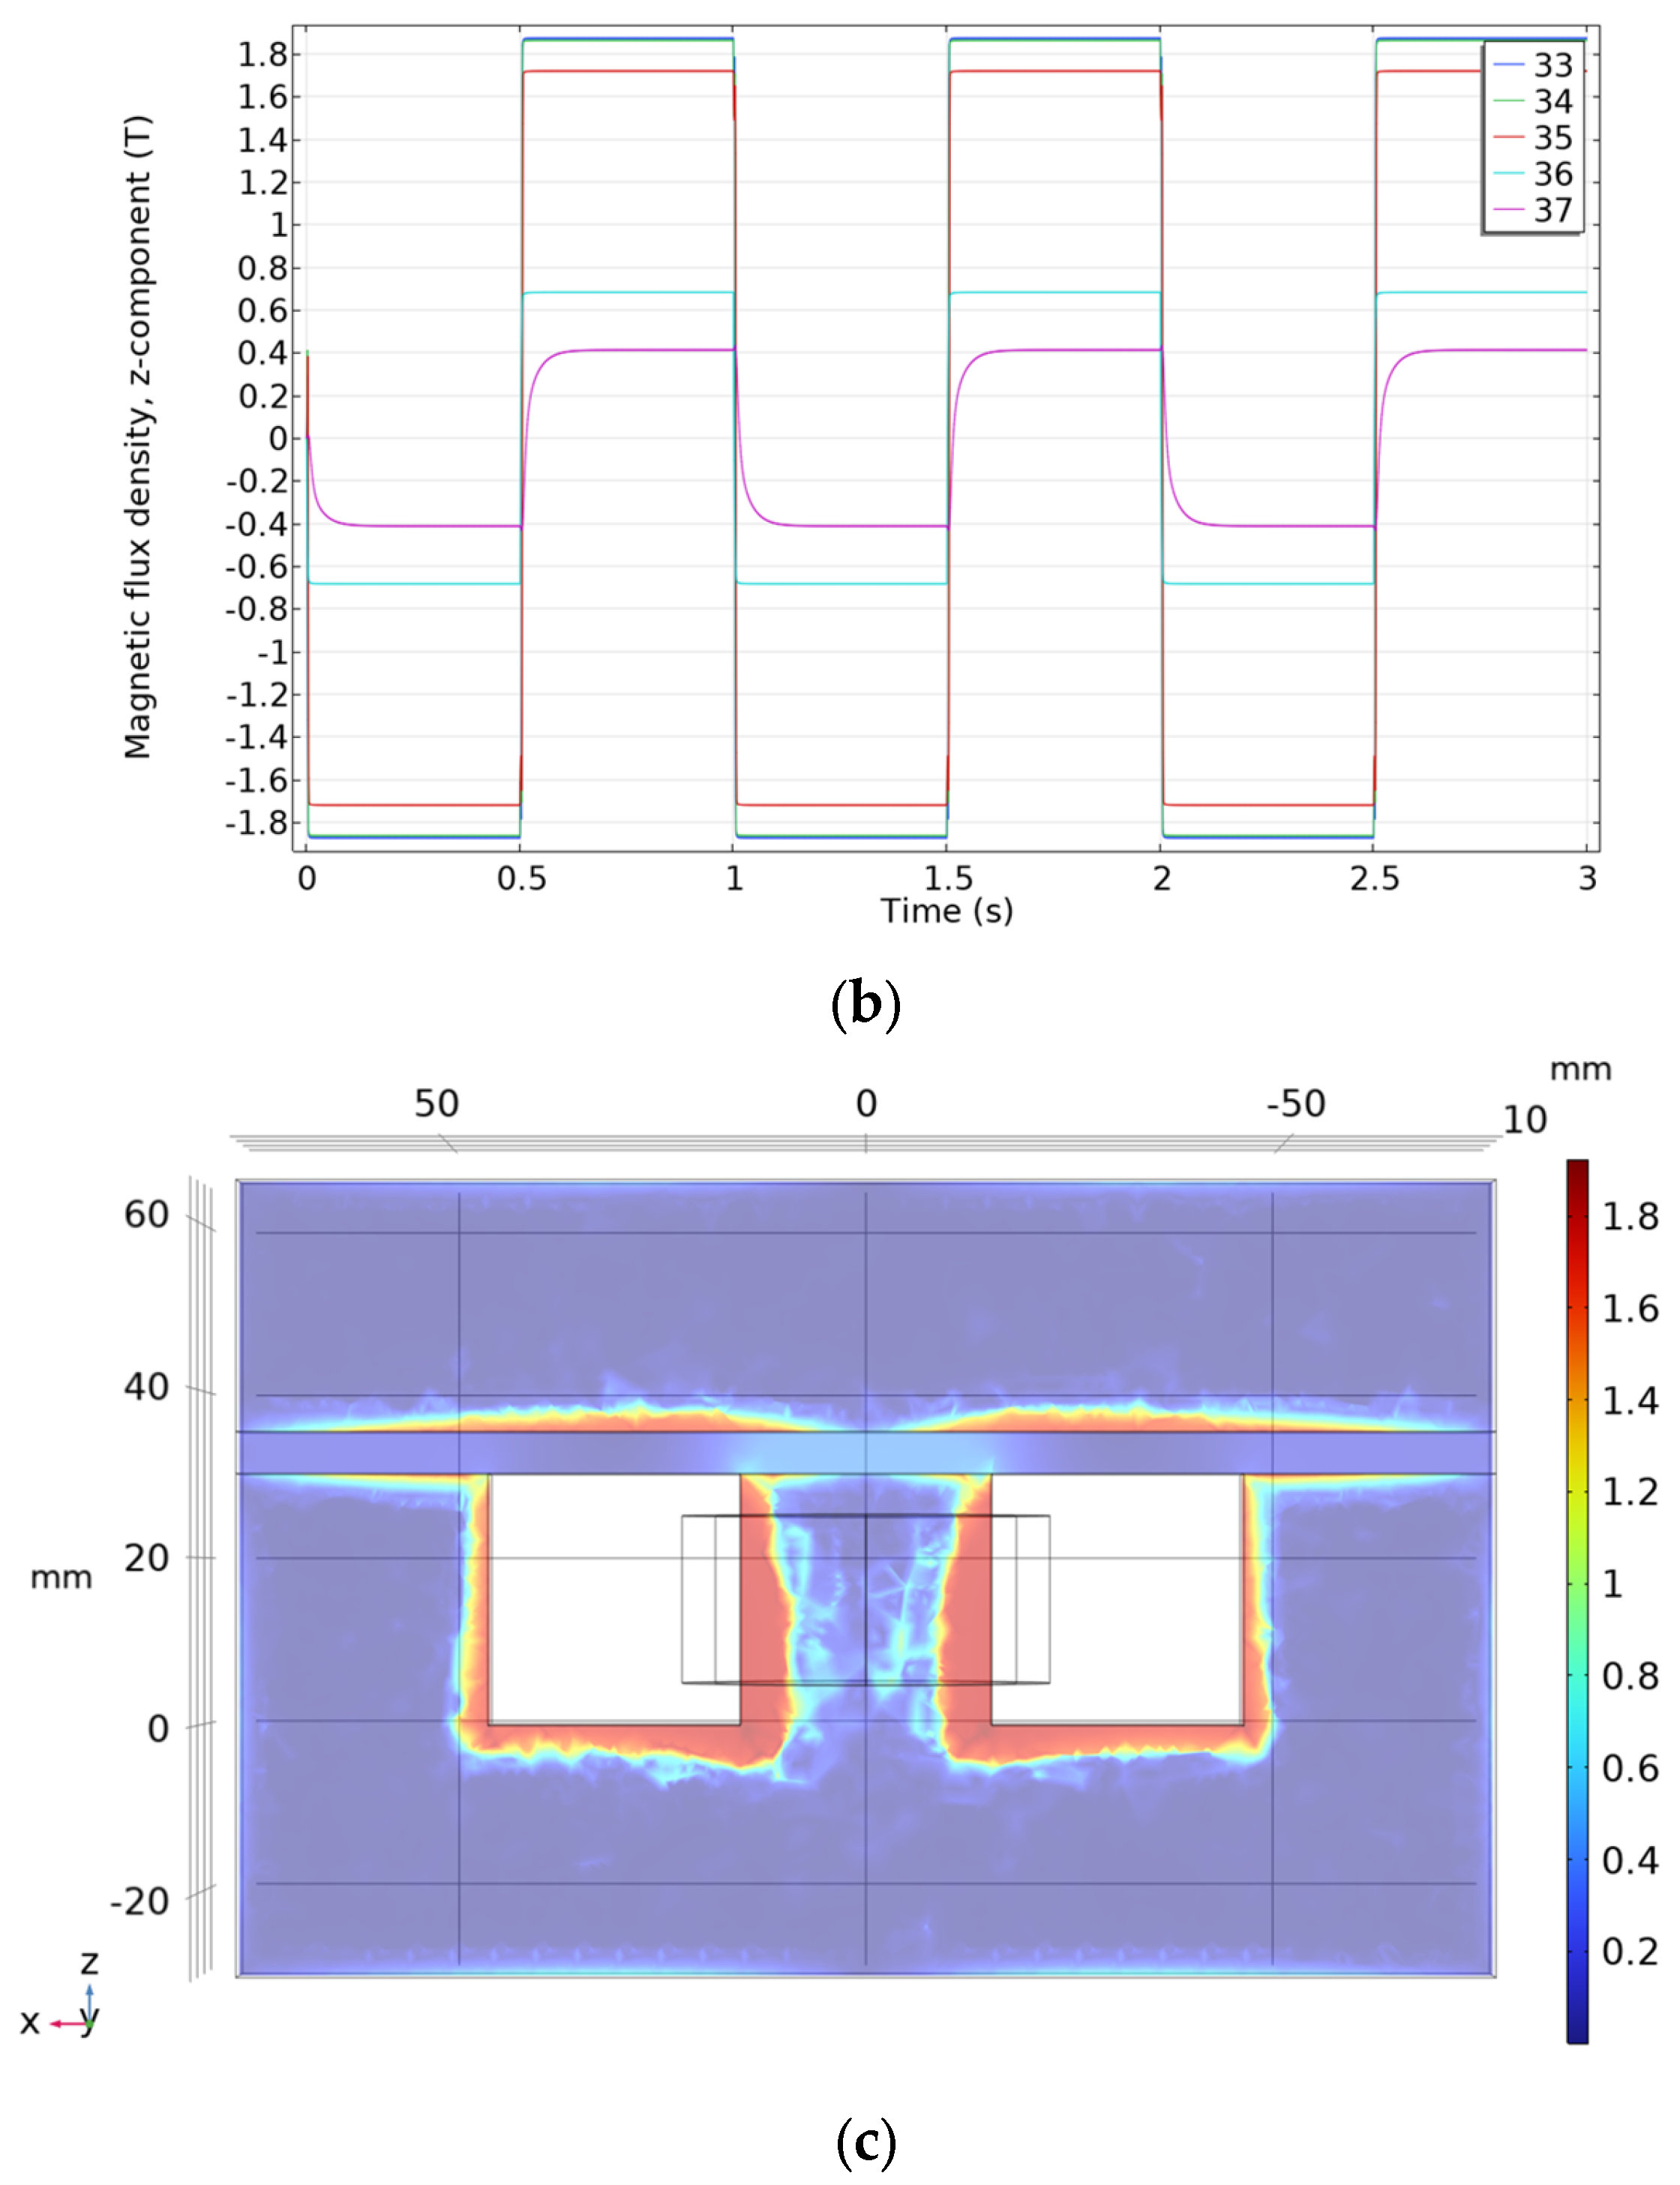
As shown in Figure 2a, the primary winding is driven by a 1 Hz, 12 V AC pulse; the duration of each voltage pulse is 0.5 s. When the air gap is 5 mm, the Z-component flux waveforms at each detection point are shown in Figure 2b. The flux density inside the core follows a similar waveform to that in the air gap. However, the flux density in the air gap and upper core is much lower than near the coil, showing that the reserved air gap for the residual magnetism sensor greatly affects the core flux. In addition, at the rising edge of excitation, the flux density in the upper core becomes distorted. Figure 2c presents the flux distribution on the XZ-plane. During abrupt signal changes, the flux density becomes non-uniform and concentrates near the core edges.
Figure 2.
The magnetic flux density distribution when the air gap width is 5 mm and the primary winding is excited by a pulse voltage. (a) Waveform of primary winding excitation voltage; (b) waveform of changes in the Z-direction component of magnetic flux density at each point along the central axis; (c) magnetic flux density distribution at the rising edge of the excitation signal.
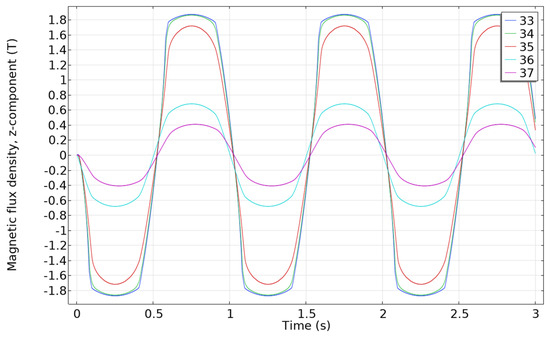
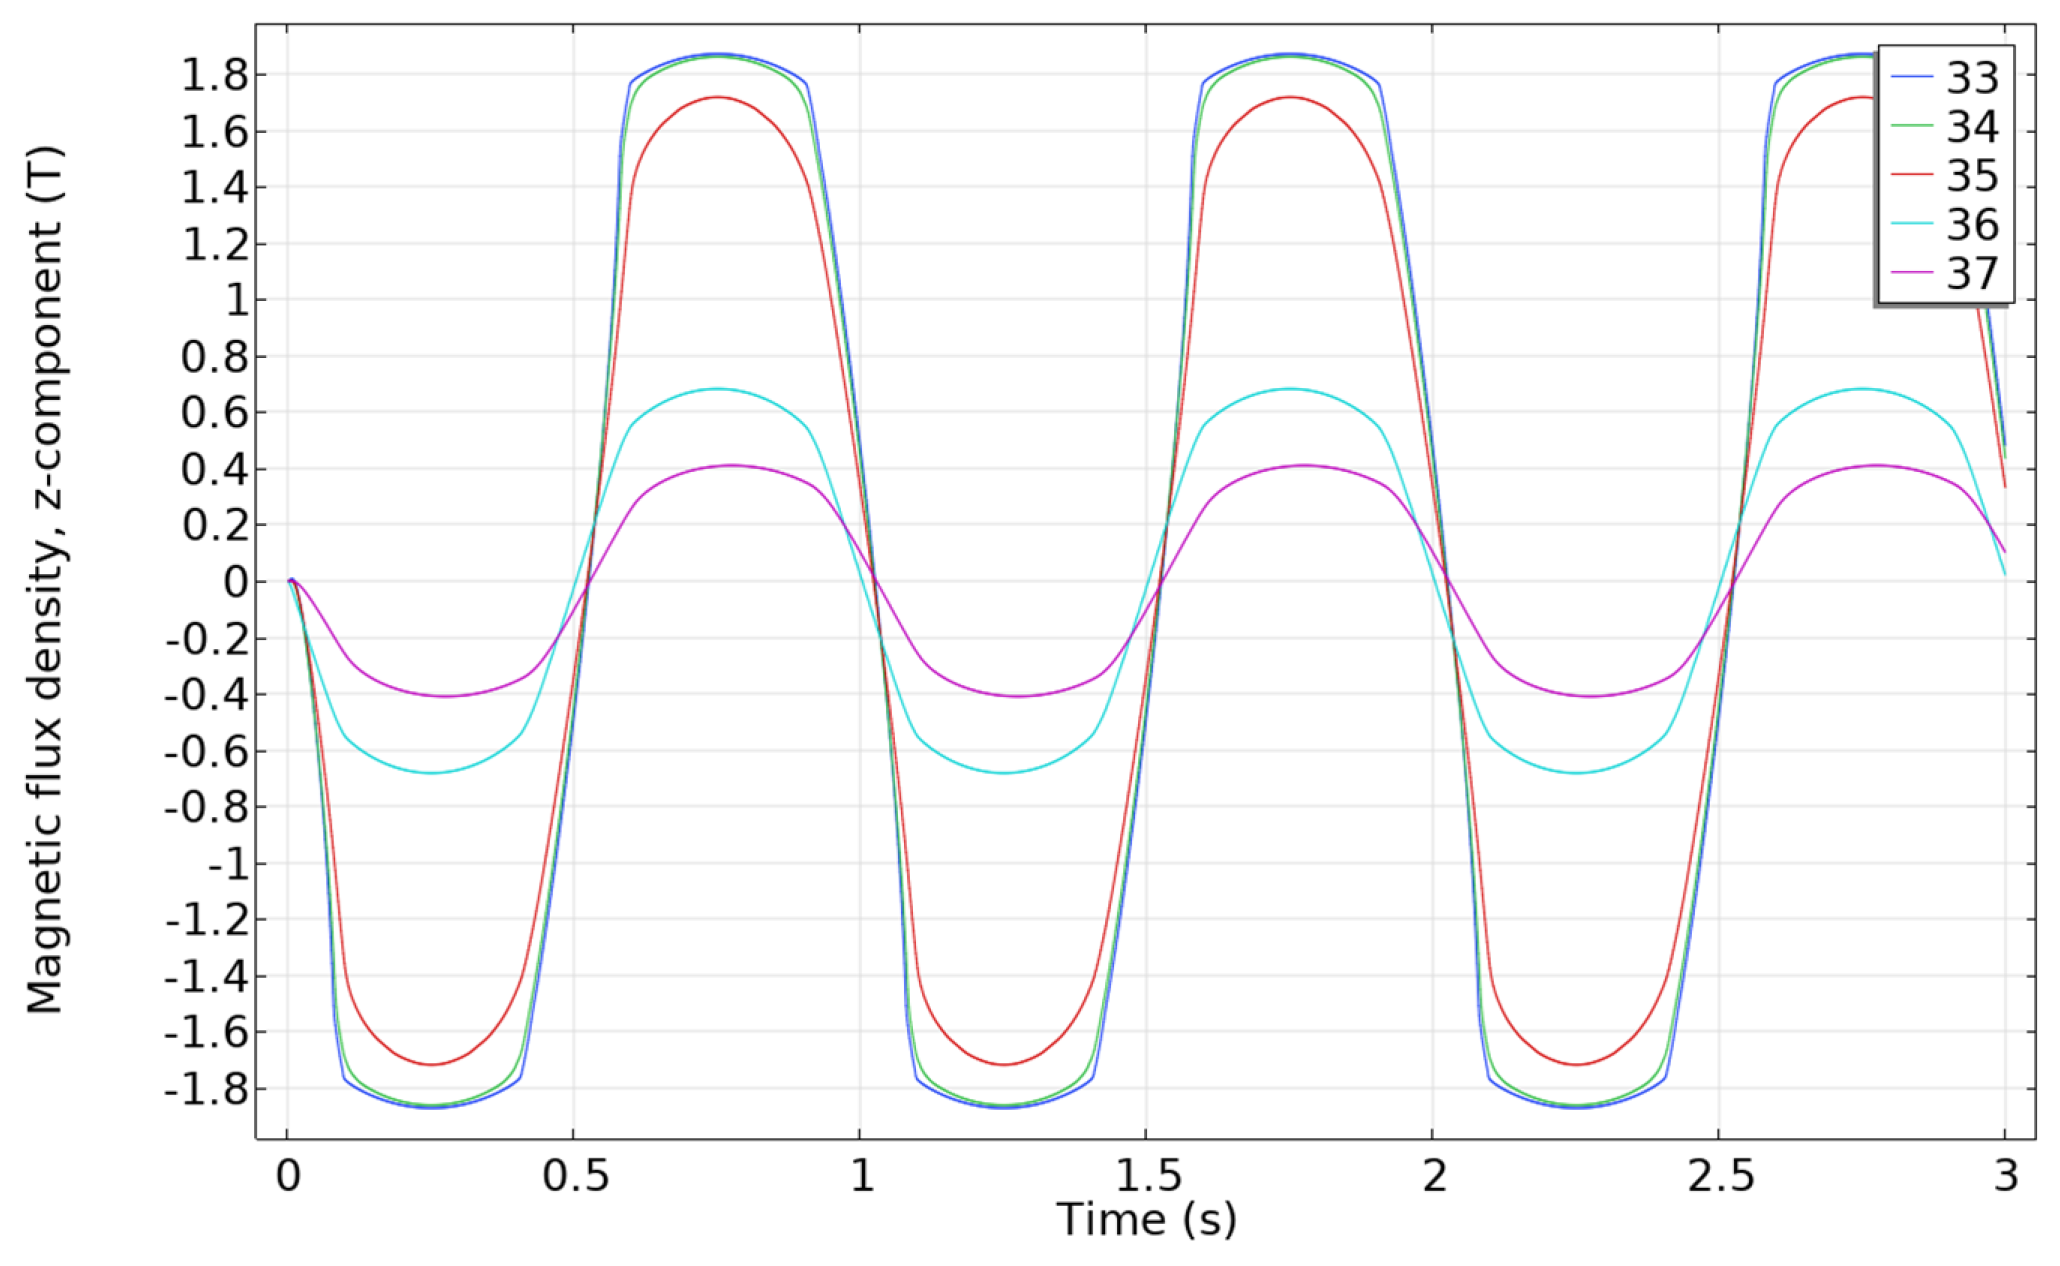
To make the core’s magnetic flux density distribution more uniform, a sinusoidal voltage is adopted for excitation, and the magnetic flux density at each point along the central axis is shown in Figure 3. As observed from Figure 3, under sinusoidal excitation, the silicon steel sheet tends to saturate at 1.8 T, and the waveform characteristics of core saturation are clearly evident, with the sinusoidal waveform exhibiting a clipping effect. At point 36 in the air gap, the flux density waveform also rises more slowly during core saturation due to the increased impedance of the overall magnetic circuit. In addition, the magnetic flux density in the air gap leads in phase relative to the magnetic flux density inside the core. Although such phase differences exert a negligible influence on residual magnetism measurements employing the TMAG5170 flux sensor manufactured by Texas Instruments, Dallas, TX, USA, they do interfere with measurements based on the area of the excitation hysteresis loop. Furthermore, when the conductivity or thickness of the silicon steel sheet varies, the measured hysteresis loop area and phase are inconsistent. Similarly, metallic components near the core, such as fastening bolts and support frames, also affect the hysteresis loop. These observations indicate that when detailed structural parameters of a transformer are unknown, the frequency of the excitation signal should be kept as low as possible in order to reduce the impact of related manufacturing parameters on residual magnetism measurement.
Figure 3.
When the air gap width is 5 mm and the primary winding excitation is a sinusoidal voltage, the waveform of the Z-direction component of the magnetic flux density at each point on the central axis changes.
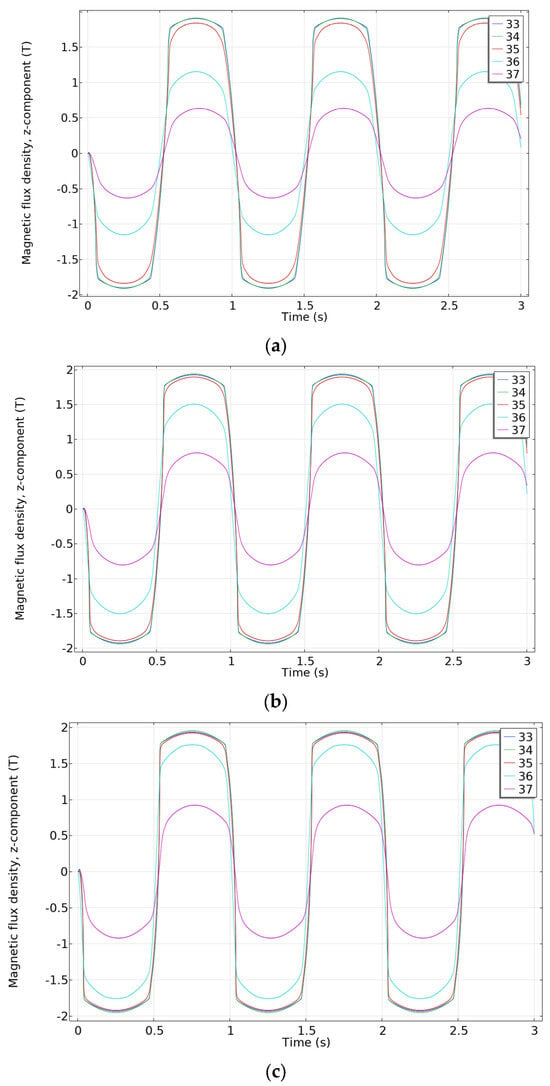
Installing magnetic sensors in the air gap allows for accurate measurement of the core’s residual magnetism. However, to minimize the disturbance on the core magnetic reluctance, it is important to reduce the air gap width in the test transformer model. Figure 4 illustrates the magnetic flux density waveforms at various points along the central axis of the transformer under sinusoidal voltage excitation, with air gap widths of 2 mm, 1 mm, and 0.5 mm. As the air gap width decreases to 0.5 mm, the flux density waveform inside the air gap closely aligns with that of the core near the primary winding, indicating that a smaller air gap reduces the discrepancy between the flux density in the air gap and the core. This helps in achieving a more accurate representation of the core’s magnetic behavior.
Figure 4.
Waveform of changes in the Z-direction component of magnetic flux density at various points along the central axis for different air gap widths. (a) When the air gap width is 2 mm; (b) when the air gap width is 1 mm; (c) when the air gap width is 0.5 mm.
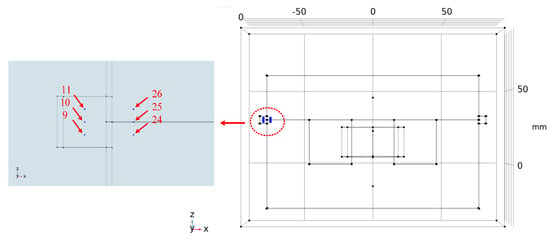
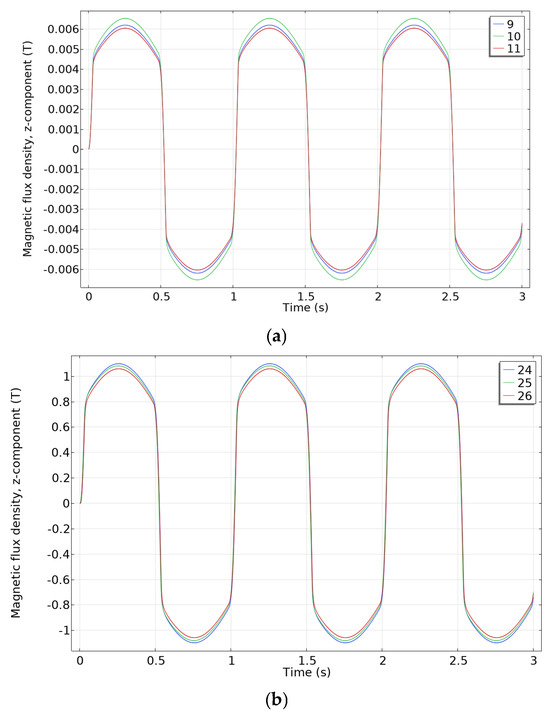
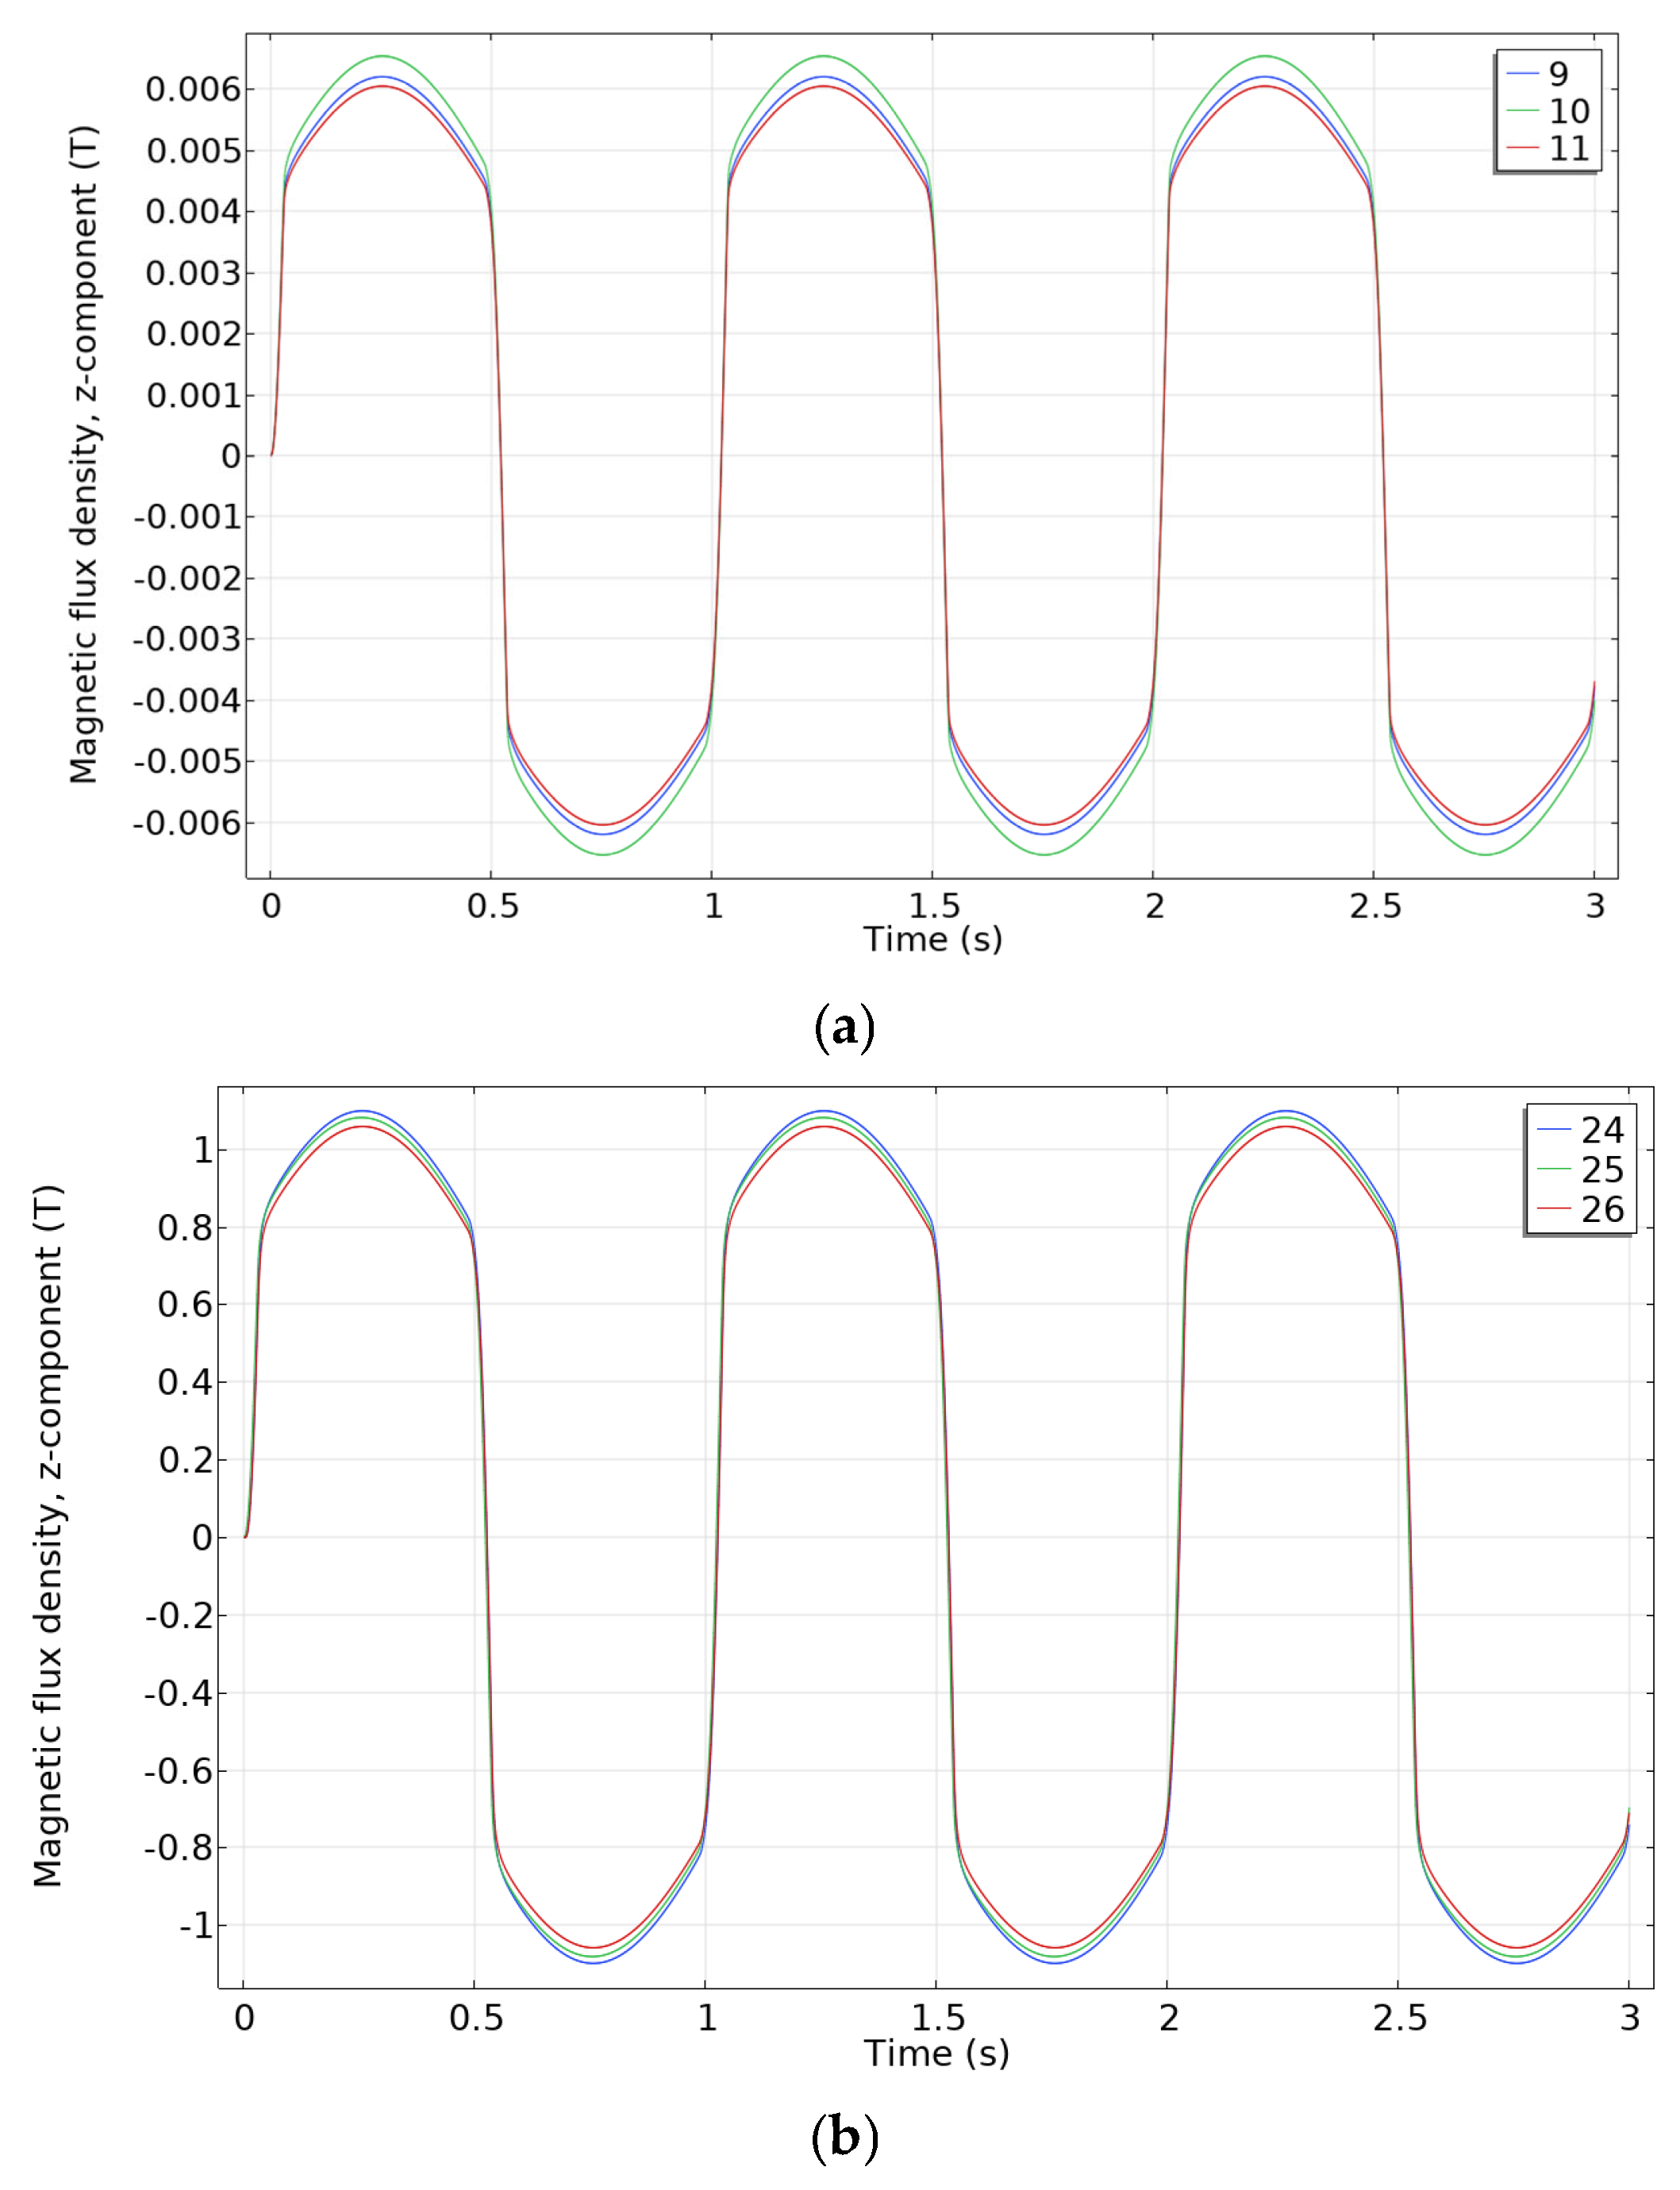
When the air gap between the silicon steel sheets of the transformer core is very small, magnetic field sensors cannot be installed inside the gap, and sensors must instead be placed at other locations to detect leakage flux. Therefore, it is necessary to analyze the relationship between core leakage flux and internal flux density. Assuming a normal lamination gap of 50 μm between silicon steel sheets, the detection points for core leakage flux (points 9–11) are located on the side of the transformer model, while point 25 is inside the air gap, and points 26 and 24 are inside the core above and below the air gap, respectively, as shown in Figure 5. Under sinusoidal excitation at 1 Hz, the flux density waveforms at these points are shown in Figure 6. The results indicate that although the leakage flux density in the air on the side of the transformer is much smaller than that inside the core, the leakage flux waveform is identical to that of the core flux density. This demonstrates that the leakage flux density at lamination joints of silicon steel sheets is positively correlated with the residual magnetism inside the core. Since the air gap is very small, the flux density in the core and in the gap are nearly equal, whereas the leakage flux density is more sensitive to position and is mainly concentrated at locations of discontinuous magnetic reluctance. Due to the unknown functional relationship between leakage flux and core residual magnetism, direct measurement of residual magnetism using leakage flux sensors is difficult. However, by controlling the excitation current, the core’s residual magnetism can be calibrated with fixed-position leakage flux sensors. Once calibrated, the residual magnetism can be measured provided the sensor position remains unchanged. For existing transformers, sensors can be installed and calibrated during maintenance, enabling direct residual magnetism measurement via leakage flux. It is critical to note that in practical applications, both calibration and measurement require the elimination of external and internal current interferences.
Figure 5.
Transformer model Side Nearby detection point location.
Figure 6.
Waveform of changes in the Z-direction component of magnetic flux density at various points near the side of the transformer model. (a) Magnetic flux density at points 9, 10, and 11; (b) magnetic flux density at points 24, 25, and 26.
Based on the above analysis, the following conclusions can be drawn: (1) The excitation voltage signal frequency for residual magnetism detection should be kept as low as possible to improve the uniformity of magnetic flux density within the silicon steel sheets. This improves detection accuracy and eliminates the influence of parameters such as sheet thickness and resistivity on residual magnetism measurement. (2) The residual magnetism of the transformer core can be estimated by measuring the flux density in the core air gap. However, the reserved air gap for sensor installation affects the magnetization coefficient and field distribution within the core. (3) Further investigation shows that transformer leakage flux also reflects the internal flux of the core. Therefore, residual magnetism can be estimated by detecting leakage flux at lamination joints or other locations of the transformer. For transformers with unknown mapping relationships, calibration through excitation can be performed prior to measurement. This method is independent of transformer parameters and offers convenient applicability.
3. Relationship Between the Area of the Small Hysteresis Loop and Remanence
Using unidirectional low-current pulse excitation to obtain hysteresis loop area for residual magnetism detection, the hysteresis area under current excitation is minimally affected when the excitation direction aligns with the magnetization direction of the silicon steel sheets. Thus, the residual magnetism measurement precision is poor. Only when the excitation current is reversed relative to the last magnetization current does the hysteresis loop area become influenced by residual magnetism. However, the residual magnetism direction in the transformer core is unknown, making it difficult to measure residual magnetism using unidirectional current pulses. Therefore, it is necessary to analyze the hysteresis loop area characteristics formed by positive and negative current pulse excitations under different residual magnetism conditions and explore whether using bidirectional current pulses can overcome the limitations associated with unidirectional excitation.
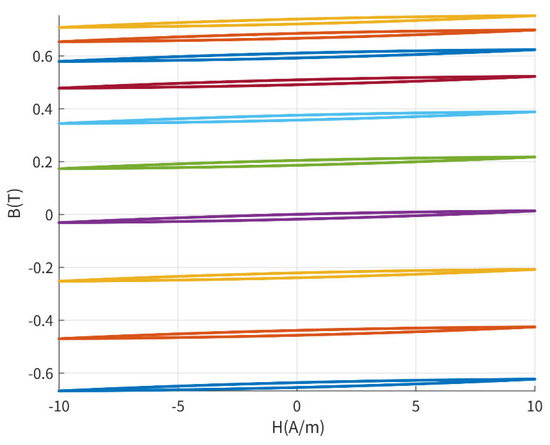
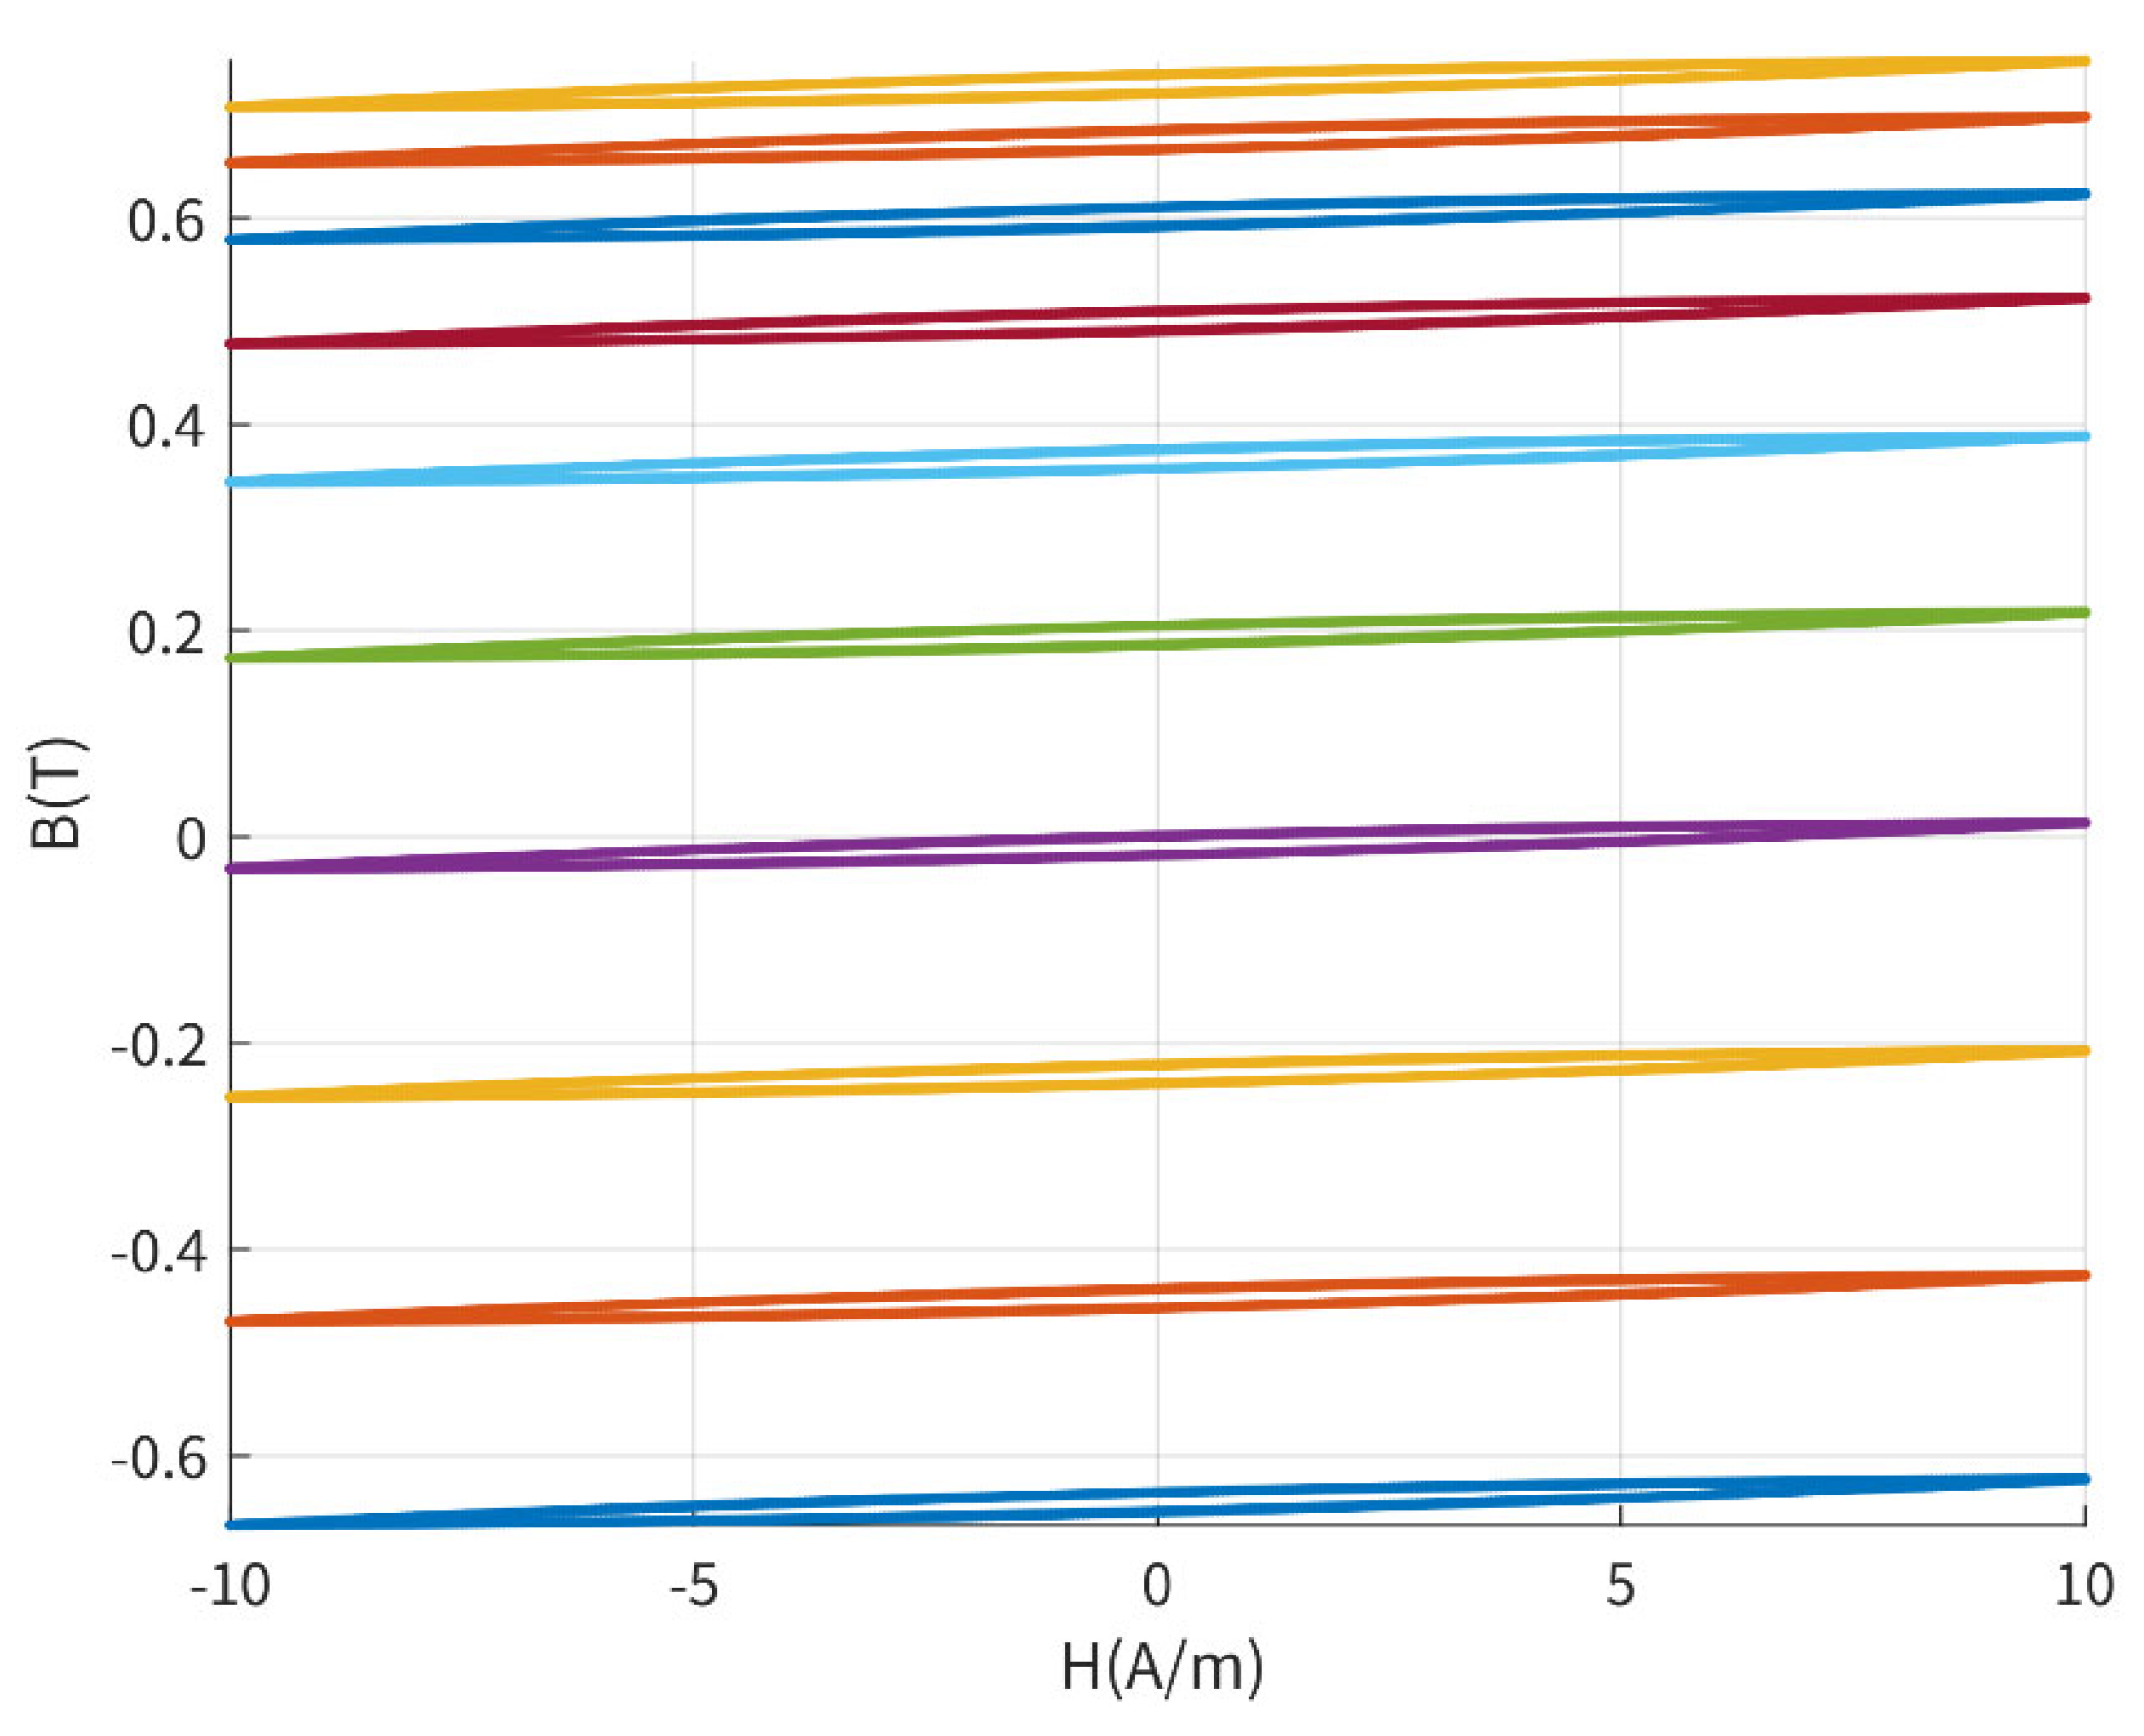
Figure 7 shows the hysteresis loops of silicon steel sheets under positive and negative current pulse excitations for different levels of residual magnetism. Observed, the shapes of these hysteresis loops are nearly identical and unaffected by residual magnetism, with the areas enclosed by the loops almost equal. This indicates that, within a larger range of residual magnetism, the hysteresis loop area is only related to the relative positions of the two turning points of the curve. Therefore, residual magnetism cannot be detected solely using the hysteresis loop characteristics of the transformer’s silicon steel sheets.
Figure 7.
Hysteresis loops of silicon steel sheets under bidirectional current pulse excitation at different residual magnetism levels.
The essence of various methods using hysteresis loop area to estimate residual magnetism in transformers is to exploit the impact of core residual magnetism on the transformer’s inductance value, with the residual magnetism being estimated by detecting the inductance.
The dynamic inductance (L) can be calculated by the following:
where (N) is the number of turns, (S) is the core cross-sectional area, (l) is the magnetic path length, (B) is the magnetic flux density, and (H) is the magnetic field strength.
The normalized inductance L_nor can be calculated by the following:
where L_max is the maximum inductance.
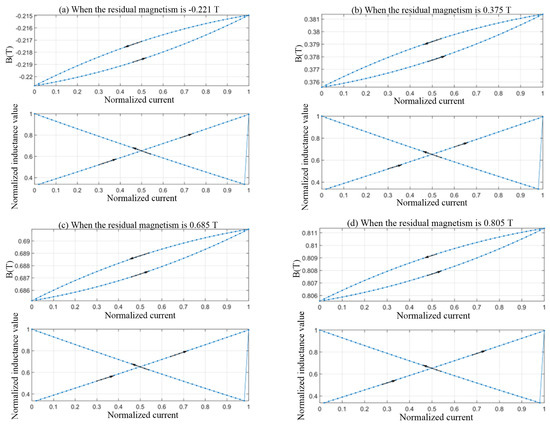
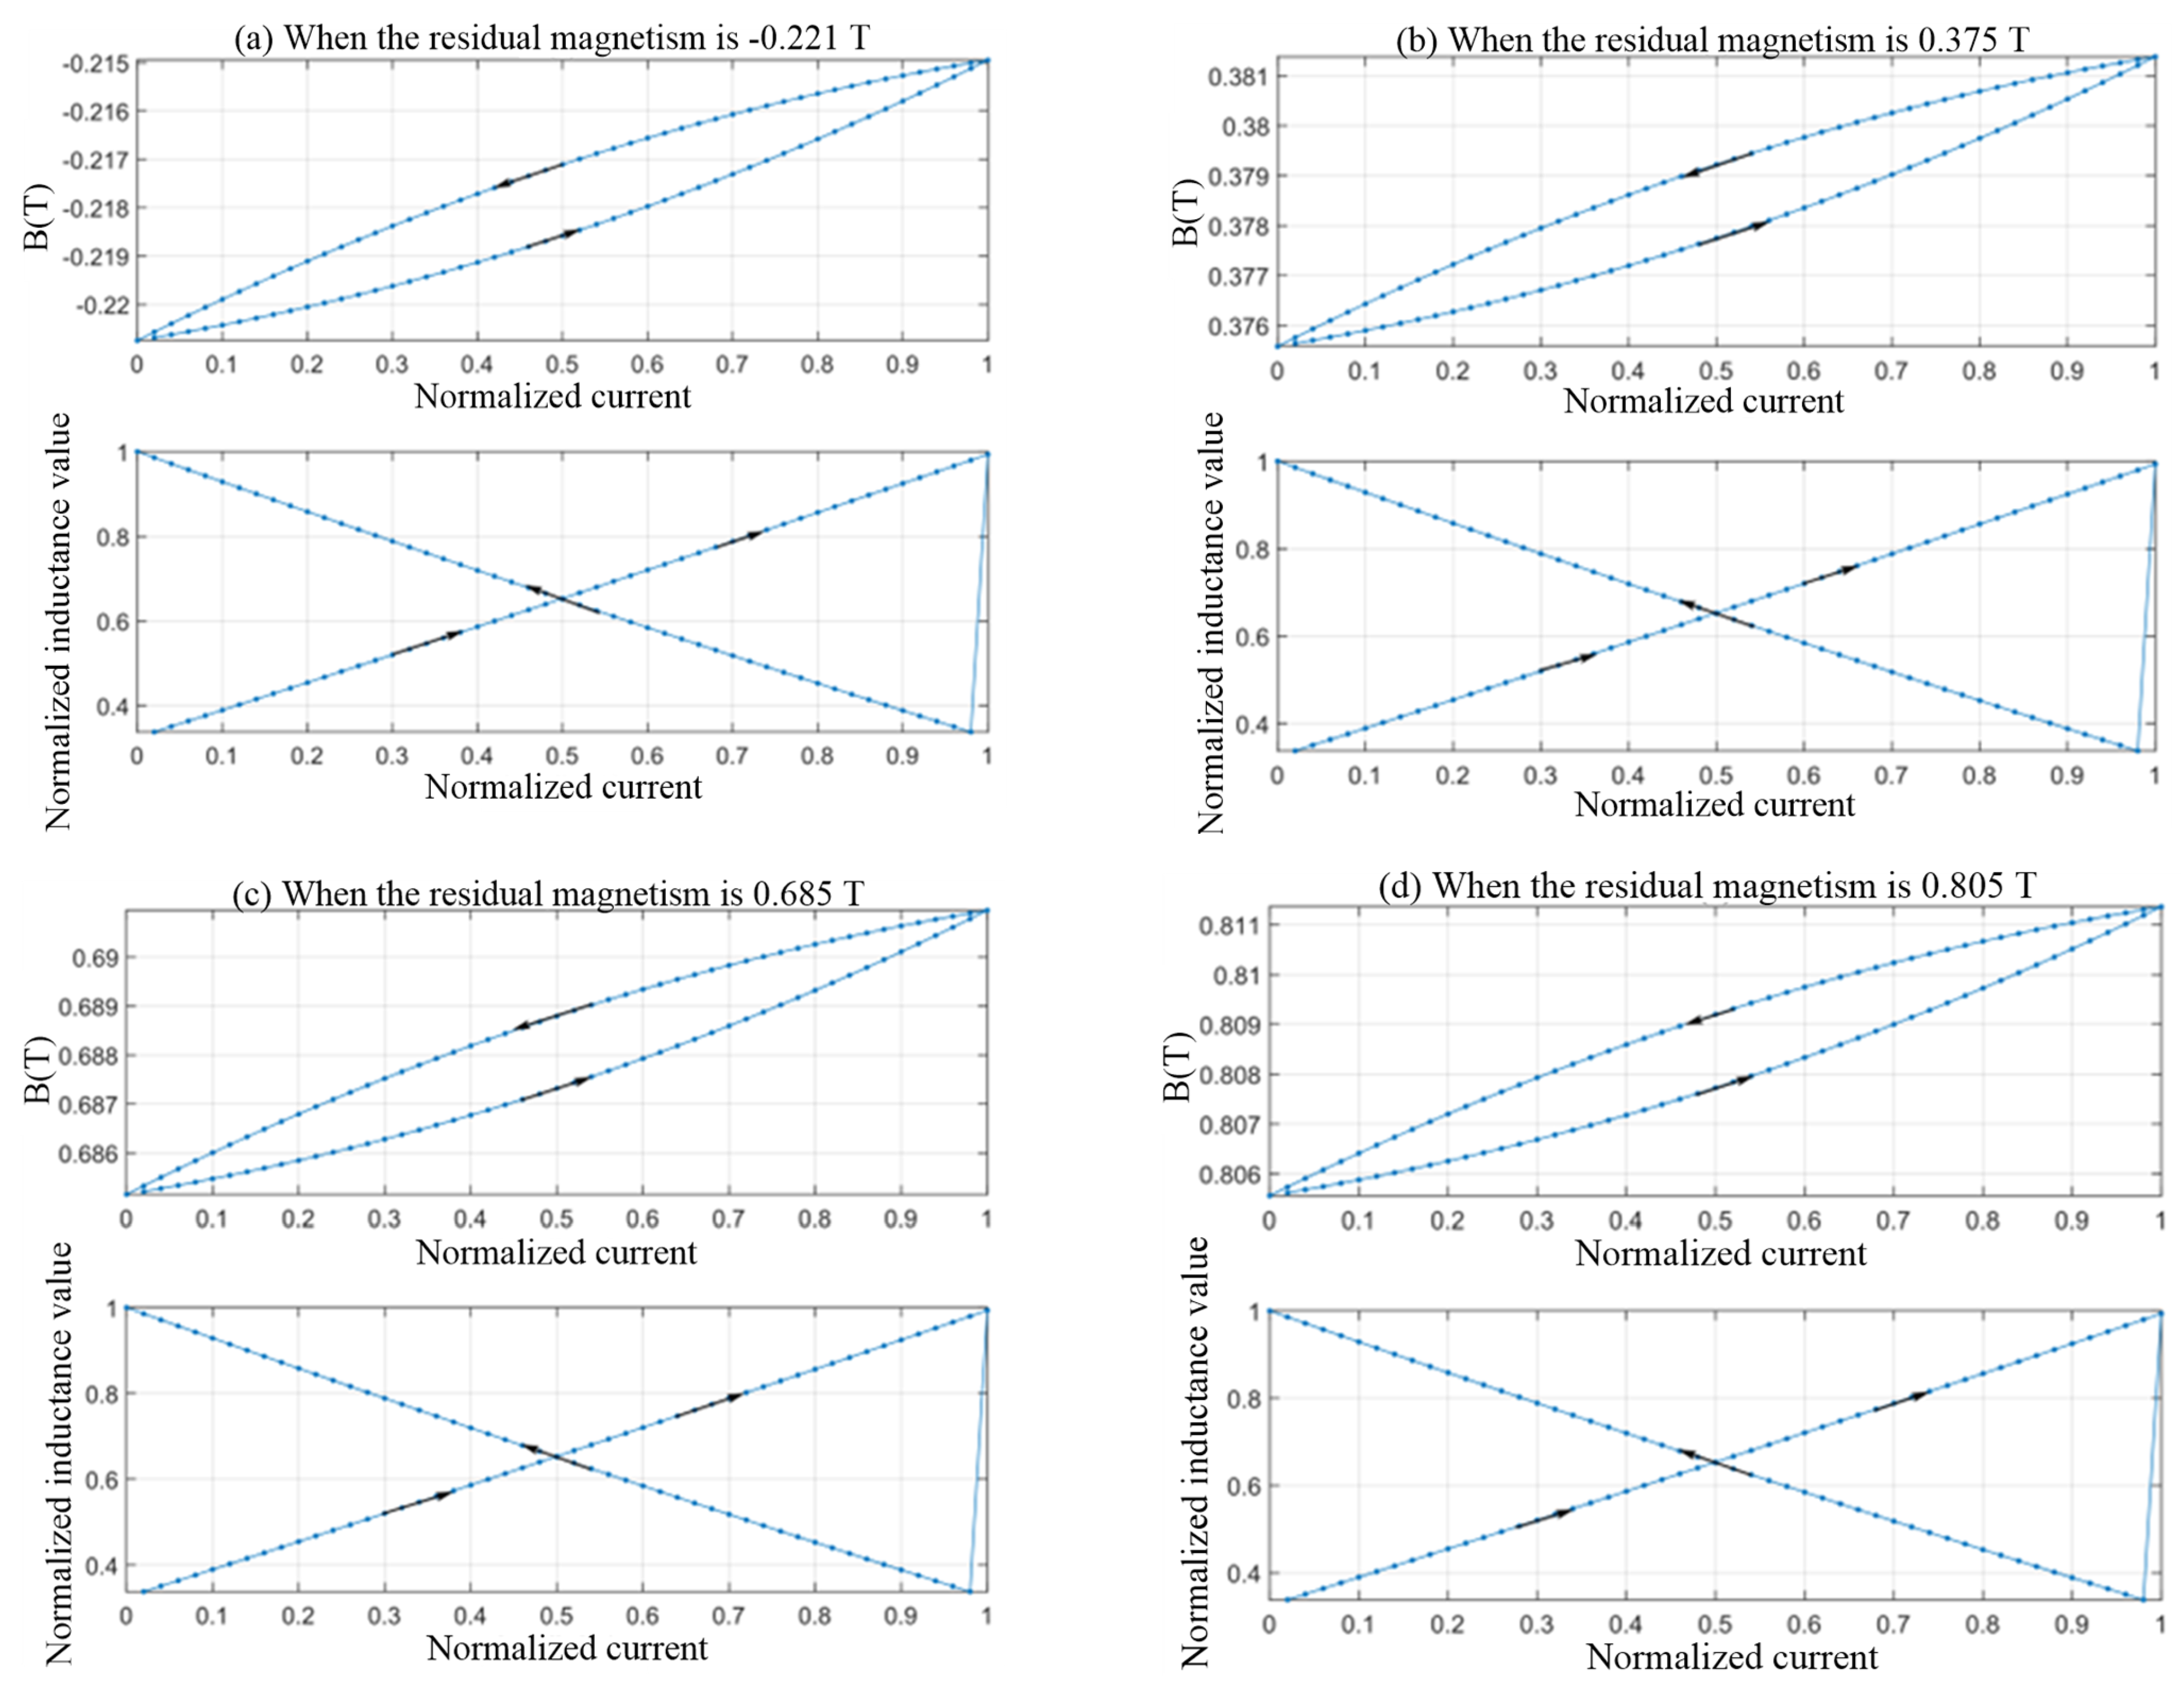
Figure 8 illustrates the hysteresis loop and dynamic inductance under identical excitation currents across different residual magnetism states. The arrow indicates the direction of magnetisation. Despite variations in core magnetic properties, the inductance values and their trends remain largely consistent. Consequently, when the initial magnetic flux density direction aligns with the previous magnetisation direction, the inductance value is primarily influenced by the characteristics of the detection current rather than residual magnetism. This renders residual magnetism undetectable.
Figure 8.
Hysteresis loops caused by the same excitation current under different residual magnetism conditions and corresponding dynamic inductance.
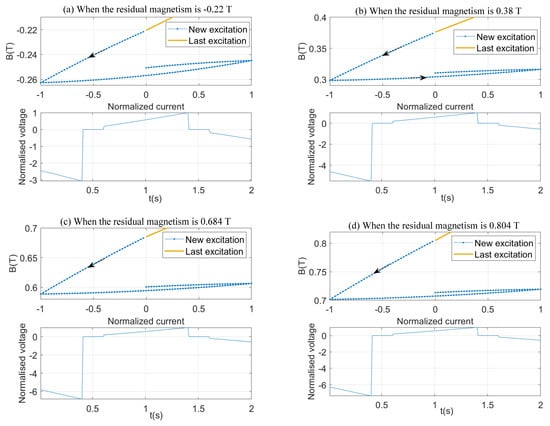
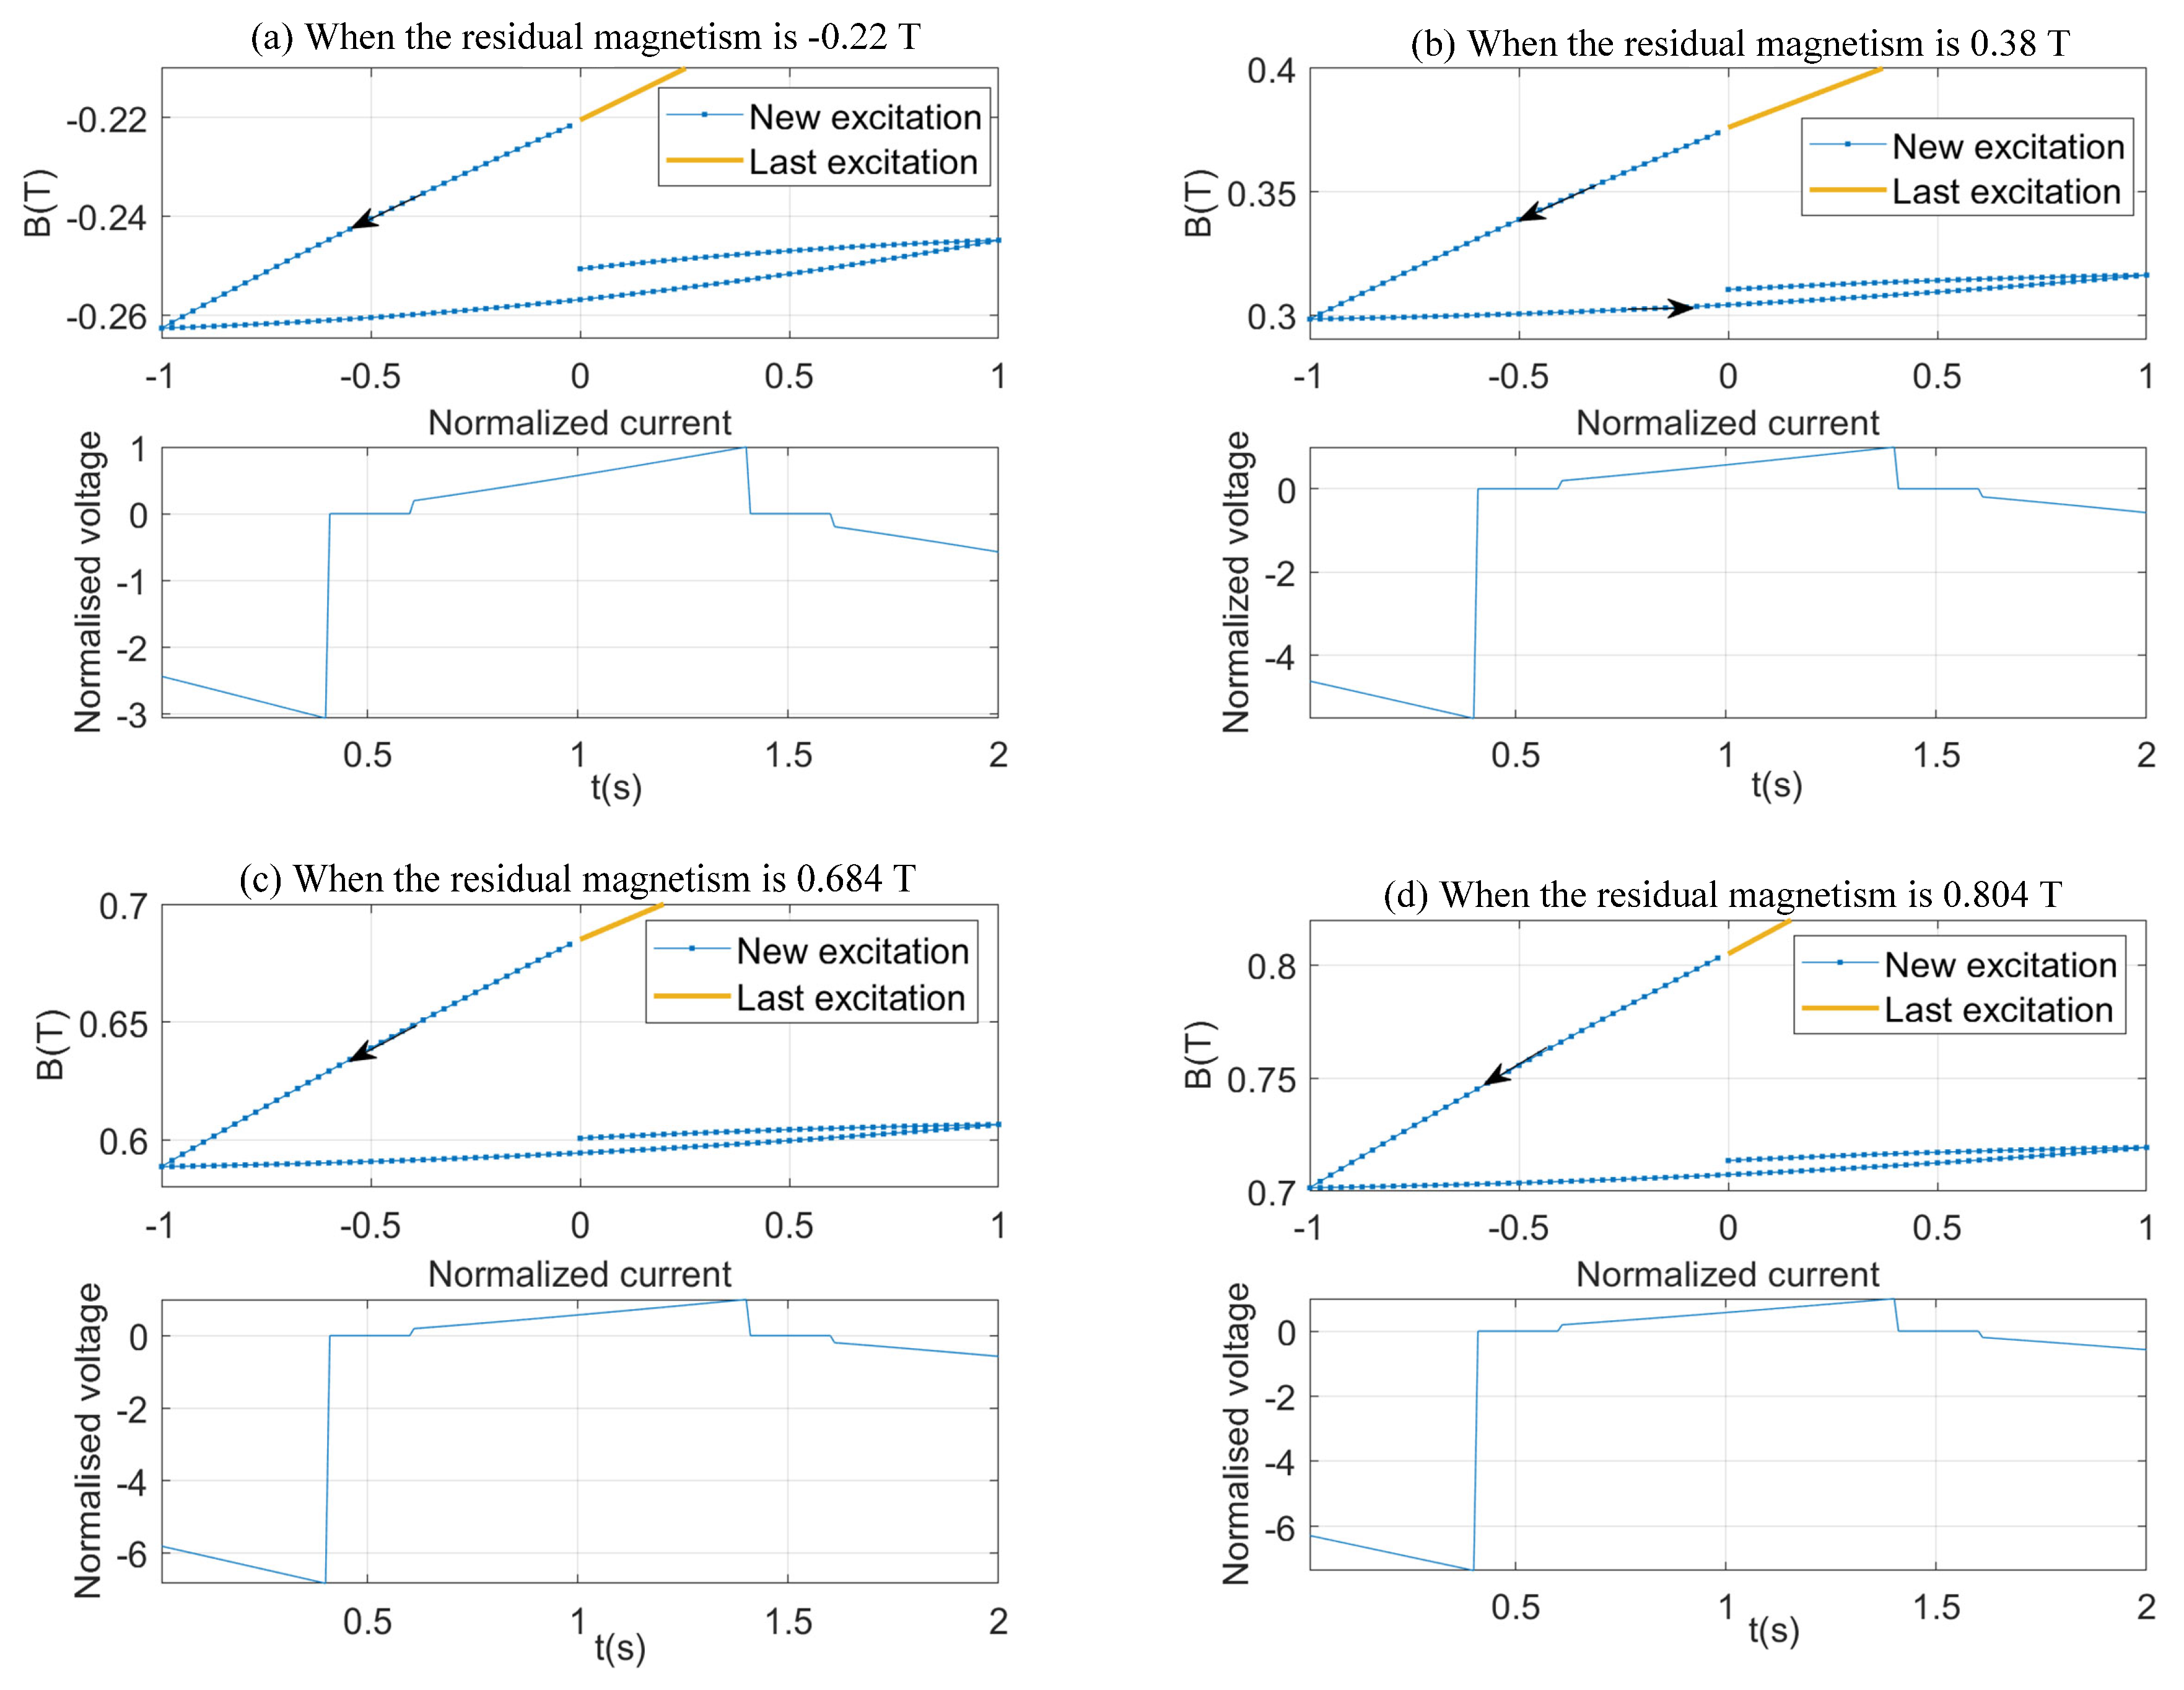
By maintaining a fixed slope of the excitation current signal, the output back electromotive force (EMF) reflects changes in inductance. Figure 9 illustrates the hysteresis loop and output electromotive force when the initial flux density direction opposes the prior magnetising current, highlighting the characteristic of electrosensitive cores being influenced by residual magnetism, The arrow indicates the direction of excitation. Using the excitation current in the opposite direction allows for measuring residual magnetism. The hysteresis area caused by the opposite excitation current is defined as the negative hysteresis loop area. The normalized value of this area is used to establish a mapping between residual magnetism and the negative hysteresis loop area. Using a quadratic polynomial fitting method, the relationship between the normalized residual magnetism Bn and the normalized inductance Sn is as follows:
Figure 9.
When the initial direction of the excitation current is opposite to the direction of the last excitation current, the hysteresis loop and its output counter-electromotive force.
4. Experimental Results
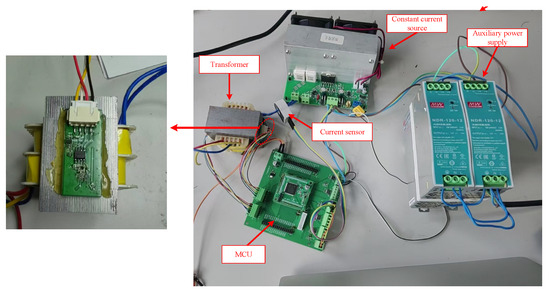
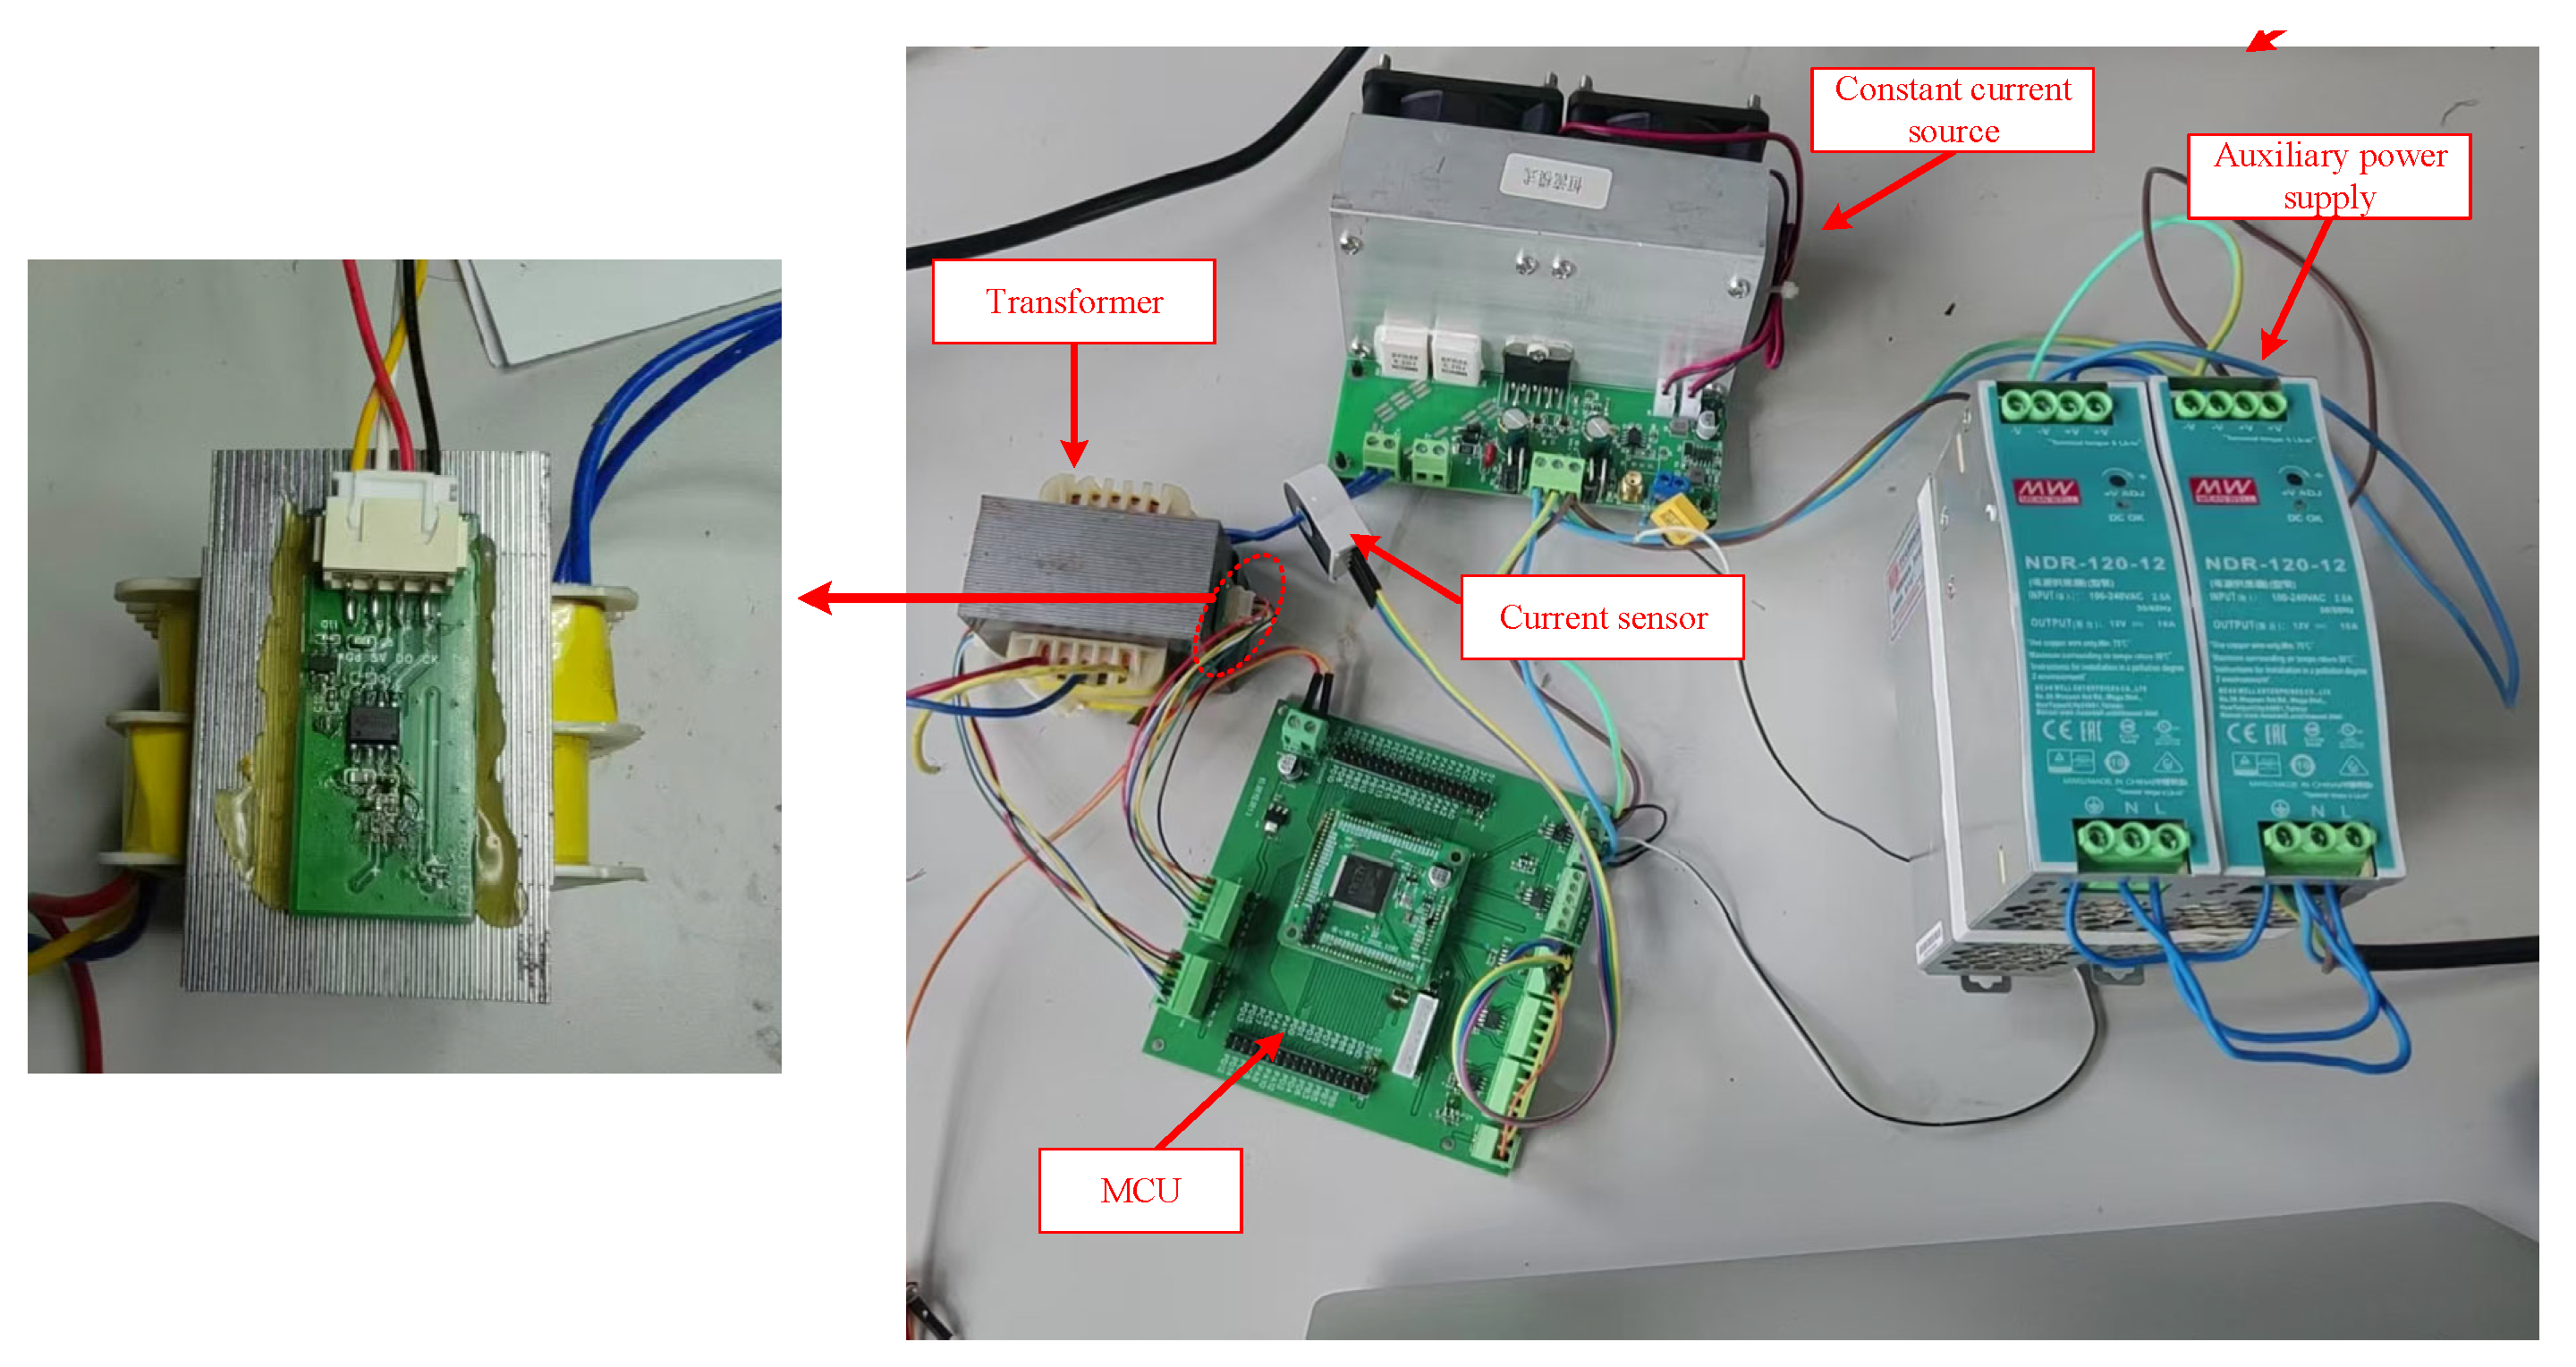
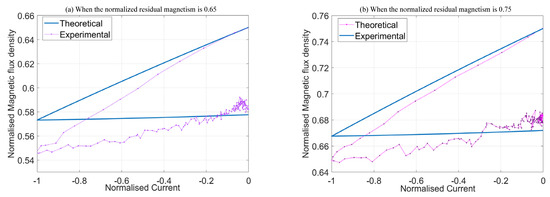
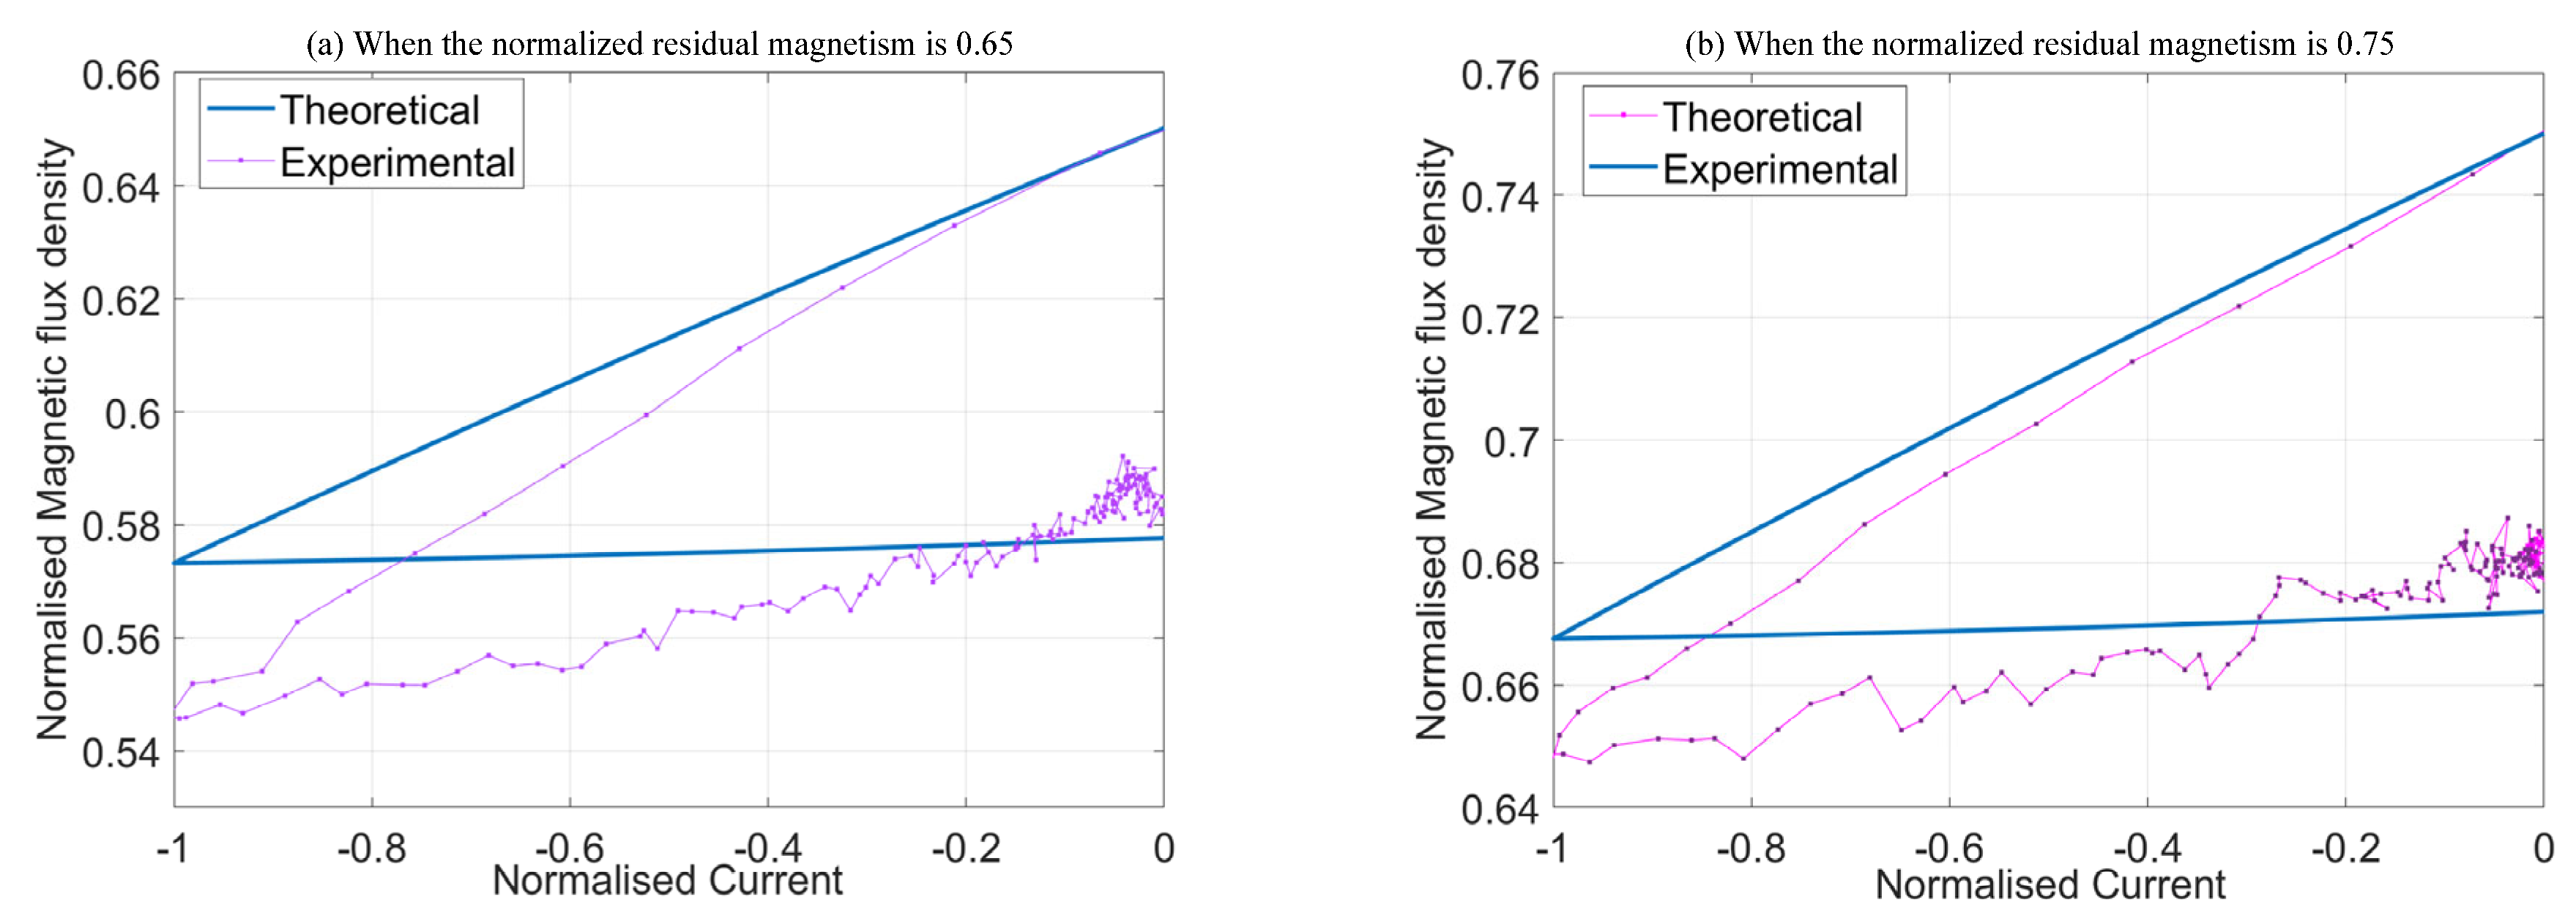
To validate the proposed residual magnetism measurement method, an experimental prototype was built, as shown in Figure 10, with components listed in Table 1. Silicon steel sheets served as the transformer core, and precise magnetization equipment set its residual magnetism to a fixed value. A power operational amplifier provided a constant current excitation source. A flux sensor was mounted on the transformer side, while a Hall sensor measured the excitation current in the primary winding. After measuring the flux density and field strength, the microcontroller unit plots the BH curve and calculates the normalized negative hysteresis loop area. Measurement errors were then compared with theoretical values calculated using the Preisach hysteresis model. For a non-oriented silicon steel core, Table 2 shows that residual magnetism was effectively detected, with relative errors from 2.46% to 9.81%. Figure 11 compares the theoretical and measured B–H curves for normalized residual magnetism values of 0.65 and 0.75. For an oriented silicon steel core, the test results in Table 3 likewise show effective detection of residual magnetism.
Figure 10.
Residual magnetism detection experimental prototype.
Table 1.
Main component model number.
Table 2.
Test results for a non-oriented silicon steel core.
Figure 11.
Comparison between theoretical and measured B–H curves.
Table 3.
Test results for an oriented silicon steel core.
5. Conclusions
This paper proposes a residual-magnetism detection method for power transformers based on the area of the excitation hysteresis loop. Low-frequency excitation effectively reduces the eddy-current interference from silicon steel sheets in flux detection and minimizes the influence of manufacturing tolerances. The leakage flux at the core’s lamination joints matches the internal flux waveform and, after excitation calibration, can serve as a universal detection target, thereby avoiding changes to the magnetic circuit that arise from intentional air gaps. Moreover, under bidirectional current-pulse excitation, the normalized area of the negative hysteresis loop exhibits stable monotonic mapping to residual magnetism, enabling detection across different residual-magnetism levels. In addition, the proposed method does not require damaging the transformer core, supports real-time detection under no-load or light-load conditions, and shows strong anti-interference capability. It is suitable for both maintenance and online monitoring of existing equipment, providing a practical technical approach for accurate residual-magnetism detection in power transformers and offering significant engineering value for grid stability. However, due to limitations of the current experimental conditions, this study was unable to verify the method’s applicability to large power transformers.
Author Contributions
Conceptualization, W.D. and X.W.; methodology, D.A.; software, Y.W.; validation, W.D. and X.W.; formal analysis, Y.W.; investigation, R.W.; resources, C.S.; data curation, H.W.; writing—original draft preparation, X.W.; writing—review and editing, C.J.; visualization, W.D.; supervision, G.L.; project administration, J.H. All authors have read and agreed to the published version of the manuscript.
Funding
This research was funded by [Science and Technology Project of Electric Power Research Institute of State Grid Xinjiang Electric Power Company] grant number [SGXJDK00LCJS2400369].
Data Availability Statement
The original contributions presented in this study are included in the article. Further inquiries can be directed to the corresponding author.
Conflicts of Interest
Authors Yuwei Wang, Wenjuan Dong, Delinuer Azan, Xingang Wang, Renaguli Wufuer and Hao Wang were employed by the Electric Power Research Institute of State Grid Xinjiang Electric Power Company. The remaining authors declare that the research was conducted in the absence of any commercial or financial relationships that could be construed as a potential conflict of interest.
References
- IEEE Std C57.12.00-2015; Standard for General Requirements for Liquid-Immersed Distribution, Power, and Regulating Transformers. IEEE: New York, NY, USA, 2016.
- Liserre, M.; Blaabjerg, F.; Hansen, S. Design and control of an LCL-filter-based three-phase active rectifier. IEEE Trans. Ind. Appl. 2005, 41, 1281–1291. [Google Scholar] [CrossRef] [Scilit]
- Chen, L.; Zhang, Z.; Ben, T.; Zhao, H. Dynamic magnetic hysteresis modeling based on improved parametric magneto-dynamic model. IEEE Trans. Appl. Supercond. 2022, 32, 0600605. [Google Scholar] [CrossRef] [Scilit]
- Petrun, M.; Steentjes, S. Iron-loss and magnetization dynamics in non-oriented electrical steel: 1-D excitations up to high frequencies. IEEE Access 2020, 8, 4568–4593. [Google Scholar] [CrossRef] [Scilit]
- Huo, C.; Yang, Y. A novel residual magnetism detection method of power transformer cores based on magnetization time. IEEE Sens. J. 2024, 24, 2647–2656. [Google Scholar] [CrossRef] [Scilit]
- Han, P.; Tong, Q.; Wang, Y.; Chen, Z.; Yang, W.; Hu, D.; Wu, H.; Zhang, J. An inrush current suppression strategy for UHV converter transformer based on simulation of magnetic bias. IEEE Trans. Power Deliv. 2022, 37, 5179–5189. [Google Scholar] [CrossRef] [Scilit]
- Jazebi, S.; de Leon, F.; Wu, N. Enhanced analytical method for the calculation of the maximum inrush currents of single-phase power transformers. IEEE Trans. Power Deliv. 2015, 30, 2590–2599. [Google Scholar] [CrossRef] [Scilit]
- Aghazadeh, A.; Hajipour, E.; Terzija, V.; Azizi, S. A Flux Matching Method for Mitigating the Inrush Current of Single-Phase Transformers. IEEE Trans. Power Deliv. 2024, 39, 3255–3267. [Google Scholar] [CrossRef] [Scilit]
- Wu, S.; Ren, Y.; Wang, Y.; Huo, C.; Liu, C. Residual flux measurement of power transformer based on transient current difference. IEEE Trans. Magn. 2022, 58, 8400405. [Google Scholar] [CrossRef] [Scilit]
- Fan, P.; Yao, H.; Wang, J.; Tao, S.; Chen, W. Measurement and research of DC magnetization curves based on DC excitation method. In Proceedings of the IEEE 2nd International Power Electronics and Application Symposium, Guangzhou, China, 10–13 November 2023. [Google Scholar]
- Sun, C.; Ohodnicki, P.R.; Stewart, E.M. Chemical sensing strategies for real-time monitoring of transformer oil: A review. IEEE Sens. J. 2017, 17, 5786–5806. [Google Scholar] [CrossRef] [Scilit]
- Huo, C.; Yang, Y. A review of research progress on residual magnetism detection methods for power transformer cores. IEEE Sens. J. 2024, 24, 7636–7645. [Google Scholar] [CrossRef] [Scilit]
- Peng, T.; Wan, D.; Zhao, M.; Zhou, H.; Mao, L.; Duan, X. An indirect method for measuring transformer residual magnetism. In Proceedings of the IEEE 3rd Conference on Energy Internet and Energy System Integration, Changsha, China, 8–10 November 2019. [Google Scholar]
- Granados-Lieberman, D.; Huerta-Rosales, J.R.; Gonzalez-Cordoba, J.L.; Amezquita-Sanchez, J.P.; Valtierra-Rodriguez, M.; Camarena-Martinez, D. Time-frequency analysis and neural networks for detecting short-circuited turns in transformers in both transient and steady-state regimes using vibration signals. Appl. Sci. 2023, 13, 12218. [Google Scholar] [CrossRef] [Scilit]
- Deng, R.; Li, L.; Zhuang, X.; Lu, C.; Xu, A.; Wang, C. Influence of inrush current of converter transformer on high-voltage DC system based on unbalanced residual magnetism. In Proceedings of the 3rd International Conference on Smart Grids and Energy Systems, Zhengzhou, China, 25–27 October 2024. [Google Scholar]
- Yang, Y.; Zhang, Z.; Pan, Z.; Lv, J.; Dong, Z.; Zhu, L. Research on the residual magnetic flux density measurement of single-phase transformer based on magnetomotive force. IEEE Trans. Instrum. Meas. 2025, 75, 6002516. [Google Scholar] [CrossRef] [Scilit]
- Zhang, S.; Yao, C.; Zhao, X.; Li, J.; Liu, X.; Yu, L.; Ma, J.; Dong, S. Improved flux-controlled vfcv strategy for eliminating and measuring the residual flux of three-phase transformers. IEEE Trans. Power Deliv. 2020, 35, 1237–1248. [Google Scholar] [CrossRef] [Scilit]
- Yamazaki, K.; Takaki, Y. Iron loss analysis of permanent magnet motors by considering minor hysteresis loops caused by inverters. IEEE Trans. Magn. 2019, 55, 1300304. [Google Scholar] [CrossRef] [Scilit]
- Savoie, M.; Shan, J. Monte carlo study of jiles-atherton parameters on hysteresis area and remnant displacement. In Proceedings of the IEEE 31st International Symposium on Industrial Electronics, Anchorage, AL, USA, 1–3 June 2022. [Google Scholar]
- Zhang, H.; Long, J.; Li, X.; Xu, Y.; Shi, J.; Ren, L.; Yang, W.; Wang, Z.; Chen, M. A new method to measure the residual flux by magnetic sensors and a finite-element model. IEEE Trans. Instrum. Meas. 2023, 72, 6006010. [Google Scholar] [CrossRef] [Scilit]

Disclaimer/Publisher’s Note: The statements, opinions and data contained in all publications are solely those of the individual author(s) and contributor(s) and not of MDPI and/or the editor(s). MDPI and/or the editor(s) disclaim responsibility for any injury to people or property resulting from any ideas, methods, instructions or products referred to in the content. |
© 2025 by the authors. Licensee MDPI, Basel, Switzerland. This article is an open access article distributed under the terms and conditions of the Creative Commons Attribution (CC BY) license (https://creativecommons.org/licenses/by/4.0/).