Abstract
To address the limitations of traditional hospital energy management strategies in responding to real-time medical demands, this study proposes a coordinated optimization approach for multi-timescale scheduling in diversified hospital energy systems. The long-term scheduling problem is first formulated as a Markov Decision Process, with fine-grained short-term energy supply plans embedded in each decision step through an optimal model. Deep reinforcement learning is then employed to reduce the dimensionality of long-term decision variables, while hybrid integer linear programming is integrated to strictly enforce critical load operation constraints. A hybrid data- and model-driven framework is constructed to simultaneously enhance computational efficiency and power supply reliability. Empirical studies demonstrate that, compared with traditional scenario-based and robust optimization methods, the proposed approach significantly improves energy resource utilization—raising the distributed renewable energy utilization rate from 82.45% to 96.72%—and reduces the power interruption rate for critical loads from 2.8% to 0.15%. This ensures the continuity of medical services while minimizing energy waste. The proposed method provides both theoretical and practical guidance for intelligent scheduling and energy management in complex hospital integrated energy systems.
1. Introduction
With the growing demand for medical services and the advancement of green hospital initiatives, the Hospital Integrated Energy System (HIES) has emerged as a critical solution for achieving energy conservation, emission reduction, and high-quality healthcare delivery. As energy-intensive facilities, hospitals operate around the clock and exhibit distinct characteristics, including diversified energy demands and hierarchical power supply requirements. The energy systems in modern hospitals encompass various forms such as electricity, heating, cooling, and compressed air systems, which collectively enhance the overall stability and sustainability of hospital energy infrastructure [1,2]. These systems are inherently supported by power electronic interfaces (such as PV inverters, battery converters, and uninterruptible power supply (UPS) devices), which enable flexible energy conversion and seamless integration of multiple energy carriers.
Although technologies such as distributed photovoltaics, diesel generators, and energy storage systems are increasingly deployed in hospitals, maintaining energy balance within Hospital Integrated Energy Systems (HIESs) remains highly challenging due to the complexity of medical loads, uncertainty in patient flows, and the stringent reliability requirements of medical equipment. In particular, coordinating scheduling strategies across multiple timescales under complex dispatch cycles remains an urgent and unresolved issue [3,4,5]. Moreover, the integration of electronic energy management systems (EMS) and supervisory control and data acquisition (SCADA) platforms is essential to achieve real-time monitoring, coordination, and secure operation of HIES.
The scheduling strategies of HIES typically operate on two levels: long-term and short-term. Long-term scheduling spans time horizons such as annual or quarterly periods and focuses on equipment maintenance planning and energy contract management to ensure energy supply security over extended durations [6,7,8]. In contrast, short-term scheduling addresses intra-day, hourly, or minute-level energy management, aiming to respond rapidly to fluctuations in medical demand and the uncertainty of distributed energy generation [9,10].
Conventional hospital energy management approaches often concentrate on optimizing a single timescale while neglecting the interdependencies between long- and short-term scheduling. Long-term strategies frequently impose rigid operational boundaries that restrict the flexibility of short-term decisions, making it difficult to respond to sudden surges in demand during surgery peaks or patient influxes. Meanwhile, the dynamic behavior of short-term scheduling can critically influence the effectiveness of long-term planning. The absence of an effective coordination mechanism between timescales can thus result in significant energy waste and increased risk of power supply interruptions in medical areas.
Recent studies have largely focused on isolated optimization within a single scheduling level. For instance, research on short-term energy management has explored optimization strategies for battery storage systems and thermal storage to enhance adaptability to short-term fluctuations [11,12]. Other studies have employed scenario analysis or robust optimization to handle uncertainties in hospital energy scheduling. However, these methods often lack the capacity for effective cross-timescale coordination [13,14,15]. Moreover, traditional model-driven approaches face computational bottlenecks when addressing HIES with complex load profiles and multi-source uncertainties, where the high dimensionality of decision variables renders solution processes computationally intensive.
To address these challenges, this study proposes a multi-timescale coordinated scheduling method for HIES based on Deep Reinforcement Learning (DRL). Specifically, the long-term scheduling problem is formulated as a Markov Decision Process (MDP), with optimal short-term energy supply plans embedded in each MDP step to ensure seamless integration between timescales. Furthermore, a hybrid data- and model-driven framework is developed by integrating DRL with Mixed Integer Linear Programming (MILP), which reduces computational complexity while enhancing system flexibility. This framework effectively mitigates energy waste and improves energy efficiency in hospital operations.
Importantly, this hybrid framework can be seamlessly embedded into the electronic control layer of hospital EMS, interacting with power electronic converters and UPS systems to ensure intelligent and reliable scheduling in practice.
To the best of our knowledge, few existing works have explicitly addressed the unique requirements of hospital energy systems under multi-timescale scheduling frameworks. The main contributions of this study are summarized as follows:
A multi-timescale coordinated optimization framework is proposed, which bridges the gap between long-term and short-term scheduling and overcomes the limitations of conventional methods that often treat them in isolation.
A hybrid data- and model-driven approach is developed by integrating Deep Reinforcement Learning (DRL) with Mixed Integer Linear Programming (MILP), ensuring both decision-making flexibility and strict compliance with medical reliability constraints.
Extensive case studies in realistic hospital scenarios are conducted, demonstrating significant improvements in renewable energy utilization and critical load reliability, thereby verifying the practical value and effectiveness of the proposed method.
The proposed framework explicitly incorporates the electronics-driven characteristics of HIES, including reliance on power electronic interfaces, EMS/SCADA integration, and real-time intelligent control, thereby aligning the optimization methodology with practical electronic energy management applications.
2. Relate Works
Multi-timescale optimization scheduling of Integrated Energy Systems (IES) has attracted increasing attention due to its potential to address two fundamental challenges: (i) exploiting energy storage for peak shaving and valley filling to improve economic efficiency, and (ii) mitigating forecast uncertainty of renewable generation over longer horizons [16,17].
Existing methods can be broadly classified into single-layer and hierarchical scheduling strategies. Single-layer approaches typically adopt relatively large intervals (e.g., one hour) to capture energy flow coupling and minimize operating costs through mixed-integer optimization models [18,19,20]. Li et al. [21] proposed an optimization method for integrated electricity–heat systems based on CNN-BiLSTM-Attention networks, achieving significant effectiveness in forecasting accuracy and scheduling flexibility. However, such methods mostly focus on single-timescale optimization and lack coordination mechanisms across multiple timescales, which is precisely the research focus of this study.
Some studies further refine the resolution to 30 min [22] or 15 min [23], but finer granularity often increases computational burden. In contrast, hierarchical approaches combine long-term scheduling (hourly or longer) with short-term corrections (15, 5, or even 2 min), allowing task decomposition and balancing system objectives such as economy, reliability, and security [24,25]. Comparative studies confirm their effectiveness: for example, Liu et al. [26] showed that multi-timescale scheduling can increase renewable penetration by 3.6% and reduce operating costs by 5.3%.
Recent works have integrated demand-side response and uncertainty management into multi-timescale frameworks. Price- and temperature-based demand response strategies improve load flexibility [27], while stochastic programming methods [28,29] and robust optimization enhance reliability under uncertainty, albeit with high computational costs. Data-driven methods such as deep learning [30,31] improve forecasting accuracy, though their effectiveness depends heavily on data quality. More advanced strategies extend multi-timescale optimization to cross-sector coordination (e.g., electricity–gas or electricity–heat systems) using decomposition, rolling optimization, and hybrid storage mechanisms [32,33,34,35,36,37].
Despite these advances, several gaps remain. Many studies rely on fixed forecast error assumptions, limiting practical significance in real-time operation. Moreover, most works target generic community or regional IES, while hospital energy systems (HIESs) present unique challenges, including strict reliability for critical medical loads, diversified energy demands, and stringent safety constraints [38]. The integration of intelligent energy management with multi-timescale scheduling in hospital-specific scenarios has not been sufficiently explored, leaving opportunities for tailored frameworks that jointly ensure economic efficiency, renewable utilization, and medical reliability.
3. Problem Description
In the scheduling of Hospital Integrated Energy Systems (HIES), the dynamic characteristics of different energy components and load demands often correspond to highly heterogeneous scheduling timescales. To ensure optimal and safe system operation, it is essential to account for the complex interactions across multiple time scales—namely, the coordination and interdependence between long-term planning (e.g., equipment capacity investment, annual maintenance scheduling) and short-term operations (e.g., intra-day charging/discharging, standby unit dispatch). Particularly in wind–solar–storage–diesel hybrid HIES architectures, scheduling spans a wide range of timescales, from long-term activities such as annual or monthly capacity expansion and maintenance strategy formulation, to short-term processes such as photovoltaic/wind power tracking, real-time energy storage dispatch, and rapid diesel generator response within intra-day, hourly, or even minute-level intervals.
These components must operate in tandem under stringent medical power reliability requirements—such as uninterrupted power supply for surgical rooms and electromagnetic compatibility for sensitive devices—resulting in a highly complex multi-timescale optimization framework. A typical HIES architecture is illustrated in Figure 1. As shown, the long-term decision layer (e.g., yearly equipment expansion and maintenance planning) and the short-term execution layer (e.g., intra-day energy dispatch and emergency response) exhibit different decision objectives and cycle characteristics, yet their interaction is critical.
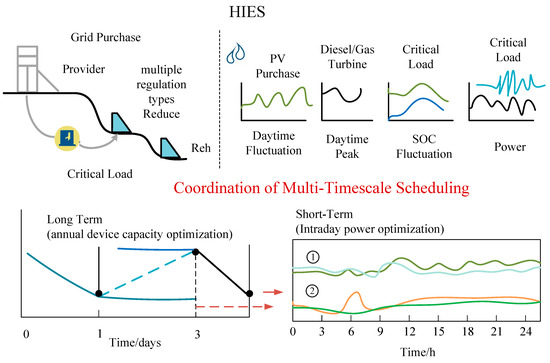
Figure 1.
Schematic Diagram of HIES Structure and Long-Short Term Coordination.
For instance, in Figure 1, Region ② (e.g., ICU and surgical room clusters) is pre-configured with significantly higher guaranteed power capacity than Region ① (general wards and administrative areas). This implies that limited energy storage and fast-response generation resources must be strategically reserved for Region ②. Consequently, compared to Region ①, Region ② faces a substantially lower risk of power shortage during emergencies, such as overlapping urgent surgeries and equipment startups, thereby achieving higher reliability.
This illustrates how the flexibility of short-term scheduling—such as the discharge speed of energy storage systems or cold-start latency of diesel generators—is constrained by the resource allocation framework established in long-term planning. Conversely, long-term planning decisions must be evaluated against insights derived from short-term simulation results, including the risks of critical load shortfalls and the costs of service interruption under extreme scenarios. Therefore, there is a pressing need for tightly coordinated optimization between long-term planning and short-term scheduling in HIES.
As a data-driven approach, Deep Reinforcement Learning (DRL) can effectively circumvent the complexities of directly modeling intricate systems by learning from historical data. However, in Hospital Integrated Energy Systems (HIESs), which are characterized by stringent medical safety constraints and a large number of decision variables, searching for optimal solutions within a vast solution space often results in constraint violations, thereby disrupting the normal operation of the Markov Decision Process (MDP). As illustrated in Figure 2, MDP training frequently fails during the initial stages due to constraint conflicts, making it difficult to generate complete decision trajectories and hindering effective learning and optimization. While DRL has shown promising performance in problems with relaxed constraints and small solution spaces, its effectiveness is significantly limited when applied to complex medical systems like HIES, which feature multi-timescale dynamics, strict operational constraints, and high-dimensional decision variables.
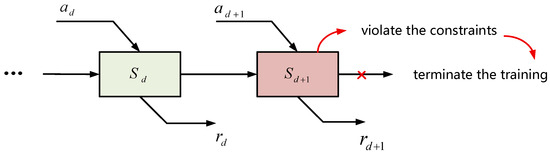
Figure 2.
Interruption scenarios during the early training stage of the Markov Decision Process (MDP) in HIES due to constraint violations.
4. Multi-Timescale Scheduling Method Based on Deep Reinforcement Learning
To address the multifaceted challenges in HIES scheduling—including multi-timescale operation, complex medical load connectivity, and system uncertainties—a hybrid strategy that integrates both model-driven and data-driven approaches is proposed. In the proposed framework, Deep Reinforcement Learning (DRL) is employed to optimize long-term scheduling decisions, while Mixed Integer Linear Programming (MILP) is utilized to handle short-term dispatch tasks. This design ensures both computational efficiency and strict adherence to medical operational constraints. The overall architecture of the proposed method is illustrated in Figure 3, highlighting the interaction mechanisms between long-term and short-term scheduling processes.
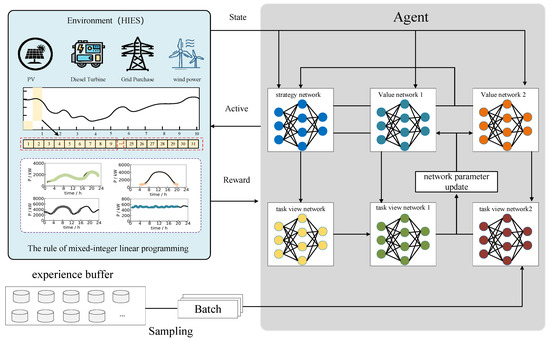
Figure 3.
Overall Framework of the Method in This Study.
4.1. Coupling Mechanism Between Long-Term and Short-Term Scheduling
The Hospital Integrated Energy System (HIES) comprises components operating on different scheduling time scales, necessitating coordination between long-term and short-term operations. Long-term scheduling primarily focuses on managing annual equipment maintenance plans and optimizing the monthly operational states of various devices. The main decision variable is the change in equipment capacity for each month, denoted as , where i represents the equipment type and indicates the month .
The variation in equipment capacity determines the control requirements for equipment operational states at the beginning and end of each month, and is expressed as:
where denotes the available capacity of equipment at the beginning of month , and represents its available capacity at the end of the previous month. These capacity constraints serve as operational boundaries for short-term scheduling. denotes the total number of hours in a day (T = 24).
In contrast, short-term scheduling addresses the intraday response to medical loads, operating on a daily time scale with an hourly resolution. The decision variables include the output power of various energy components, namely diesel generators , energy storage systems , distributed photovoltaics , grid-purchased electricity , and medical load power , where w denotes the typical day scenario and is the time index.
To ensure seamless coordination between long-term planning and short-term execution, a hybrid integration mechanism is designed. The workflow can be summarized in four steps as shown in Figure 4.
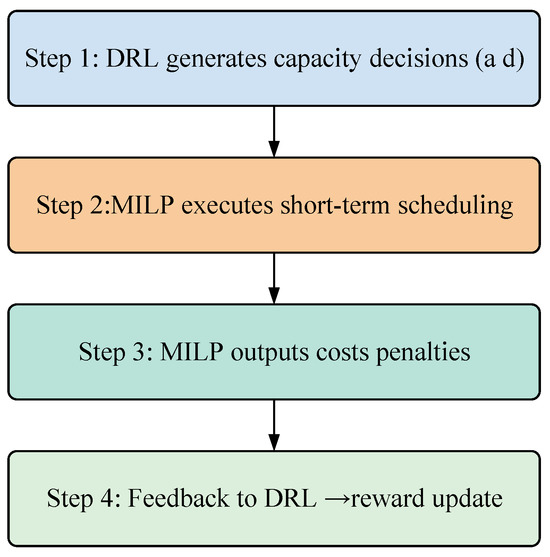
Figure 4.
Integration Mechanism between DRL and MILP.
Step 1: DRL decision output: At the long-term level, the DRL agent generates the monthly capacity adjustment strategy for each energy component. The action of the agent at month is defined as:
where denotes the adjustment of available capacity for device .
Step 2: MILP optimization embedding: These actions are imposed as boundary conditions in the short-term MILP model. For each device , the capacity constraint is updated as:
where is the short-term output of device , and is its baseline capacity.
Step 3: MILP feedback: The MILP model computes the optimal short-term dispatch, yielding the operating cost and constraint violations.
Step 4: Reward feedback to DRL: These results are aggregated into the DRL reward function as:
where is the short-term operational cost, and the penalty terms enforce system reliability.
This closed-loop process allows DRL to explore strategic decisions under MILP-enforced feasibility, while MILP benefits from DRL’s adaptive long-term planning.
4.2. Model-Driven Approach for Short-Term Scheduling
The short-term scheduling process optimizes the intraday operation of generation resources within the Hospital Integrated Energy System (HIES), subject to capacity variation constraints imposed by the annual equipment maintenance plan. Accordingly, it can be formulated as a Mixed-Integer Linear Programming (MILP) model and embedded into the long-term scheduling framework as an environment model within a Markov Decision Process (MDP). The objective of the HIES is to minimize the total operational cost over the course of a day, while accounting for the associated costs of energy storage systems, diesel generators, and medical load management.
Here, denotes the operational cost, and represents the total number of days in month . refers to the number of typical days used to represent monthly variability. indicates the occurrence probability of scenario in month . denotes the unit cost for charging/discharging the energy storage system, represents the unit operating cost of the diesel generator, and is the unit cost of grid-purchased electricity. denotes the total number of medical load zones.
Meanwhile, the MILP model is subject to the following constraints:
These constraints respectively represent the state of charge (SoC) of the energy storage system, the power demand of medical loads, and the energy supply–demand balance, among others.
In order to reflect the physical and safety requirements of hospital microgrids, additional operational boundaries are explicitly incorporated into the MILP formulation. These constraints ensure not only feasibility in optimization but also compliance with medical reliability standards and national grid codes. The following categories are considered, with specific parameters detailed in Table 1.

Table 1.
Operational Boundaries and Sources of Constraints.
Voltage and frequency limits. Bus voltages are restricted to within ±5% of their nominal values, and system frequency is maintained within 50 Hz ± 0.1 Hz:
Energy storage SoC limits. To preserve emergency reserves, the state of charge (SoC) of the storage system must remain above 30% and below 95% at all times:
Diesel generator cold-start constraints. The diesel generator startup requires at most 90 s, which is explicitly modeled by minimum startup delay constraints in the MILP. If is the on/off status, then:
where corresponds to the 90 s warm-up window (1–2 intervals at the 1 min granularity or equivalent).
PV output limits. The photovoltaic inverter output is restricted by both capacity and power quality requirements. The harmonic distortion of output current must be ≤3% in compliance with IEC61727 2024 and GB/T19939-2021 standards. Thus, effective output is constrained as:
4.3. Data-Driven Approach for Long-Term Scheduling
The long-term scheduling aims to develop an annual capacity allocation strategy for critical medical equipment, which requires dynamic planning of monthly capacity deployment. This task inherently involves sequential decision-making [30], and can therefore be formulated as a Markov Decision Process (MDP). The MDP is defined by a quintuple , where:
: State space, representing the equipment health status and load risk;
: Action space, corresponding to monthly capacity adjustment decisions;
: State transition probabilities, incorporating the stochastic degradation of equipment;
: Reward function, embedding the cost of medical service interruptions;
: Discount factor, balancing short-term and long-term benefits.
4.3.1. State Space
The environmental state encompasses the required equipment capacity, medical load demand, distributed generation output, environmental parameters, and the level of medical services. It is defined as:
where each state component is defined as denotes the current state vector; represents the equipment capacity state vector; denotes the medical load state vector; represents the photovoltaic output state vector; corresponds to the environmental parameter state vector; and indicates the medical service level state vector.
4.3.2. Action Space
In the multi-timescale scheduling of medical systems, the agent’s action is defined as the monthly capacity adjustment strategy for critical equipment, denoted as:
where represents the capacity adjustment of equipment in month d, and .
To enhance the agent’s ability to explore under uncertain medical environments, Ornstein–Uhlenbeck (OU) noise is introduced as follows:
where is the current noise value, which fluctuates with seasonal load variations; is the previous noise value reflecting historical decision bias; is the mean reversion speed; is the long-term mean of the noise; is the volatility amplitude; and is a Gaussian random sample.
By applying this mechanism, the agent can maintain policy stability while improving exploration diversity. Therefore, the actual executed action, denoted as , is the sum of the deterministic action and the noise .
4.3.3. Reward Function
The reward function serves as the core mechanism guiding the agent to learn optimal medical scheduling strategies, and its design must balance both economic efficiency and medical safety. The improved medical reward function is defined as:
where is the indicator of medical service continuity, denotes the penalty term for capacity constraint violations, and represents the penalty term for violating medical safety requirements. The coefficients and are weighting factors used to adjust the relative importance of rewards and penalties for different objectives.
4.3.4. Policy Learning
As the core component of the coordinated scheduling approach for Hospital Integrated Energy Systems (HIES), policy learning is implemented using the Twin Delayed Deep Deterministic Policy Gradient (TD3) framework, which integrates both long-term and short-term scheduling outcomes. To enhance training stability in medical scenarios, TD3 employs a dual Q-network architecture. The parameters of the Q-networks are updated following a target network smoothing mechanism:
The parameters and denote the weights of the main network and the target network, respectively, and the overall network architecture is illustrated in Figure 4. The smoothing factor (set to in this study) is applied to stabilize the target network updates. The action-value function , â<sub>d</sub>) is updated based on the Bellman equation as follows:
where is the learning rate. The objective of policy learning is to maximize the expected return. Through iterative optimization, the learning process integrates the global perspective provided by long-term data-driven scheduling and the local precision enabled by short-term model-driven decisions. This results in a multi-timescale optimized scheduling strategy that significantly enhances the overall efficiency of the system shown in Figure 5.
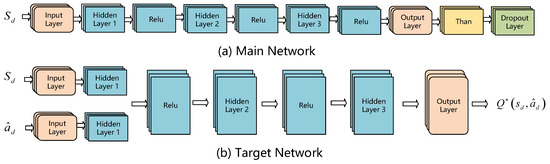
Figure 5.
Schematic Diagram of the Policy Network Structure.
5. Case Study Analysis
5.1. Simulation Environment and Parameter Configuration
To validate the effectiveness of the coordinated scheduling method for the Hospital Integrated Energy System (HIES), simulations were conducted based on a real-world energy system from a tertiary hospital. The experiments were implemented on a computing platform equipped with an AMD Ryzen 7 5800 8-core processor, manufactured by Advanced Micro Devices (AMD), Santa Clara, CA, USA.
The specific parameter values and operational boundaries are detailed in Table 2. The HIES consists of the following core components: a 2000 kW rooftop photovoltaic (PV) system, a 1500 kW diesel generator, and a 3600 kWh hybrid energy storage system (comprising lithium-ion batteries and flywheels). The hospital comprises 800 beds and includes several critical load zones such as the surgical complex, intensive care unit (ICU), emergency department, and general wards. Surgical Complex: Dual-loop power supply with reliability ≥ 99.99%. ICU: Uninterruptible power supply (UPS) with seamless switching (response time ≤ 0.1 s). General Wards: Tiered power supply protection according to priority.
Table 2.
Core Components, Technical Parameters, and Medical Constraints of the HIES.
To ensure reproducibility and transparency, the detailed configuration of algorithmic, optimization, and system parameters used in the simulations is summarized in Table 3.
Table 3.
Detailed Parameter Settings for Simulation.
To represent monthly variability with a tractable number of intraday profiles, we construct typical days for each month and use their occurrence probabilities in the short-term MILP objective (see the use of typical-day scenarios and ).
- (1)
- Data sources and sampling.
Hourly (1 h) series are used in the MILP layer for consistency with the short-term scheduling horizon. Raw telemetry is collected at 15-min resolution and aggregated to hourly averages (power/energy) or maxima (peaks):
Hospital load (by zones: OR, ICU, wards, etc.): EMS/BMS/SCADA metering.
PV generation: inverter logs from the 2 MW rooftop PV plant.
Meteorology: local meteorological station (ambient temperature, global horizontal irradiance, wind speed).
Tariff: TOU prices from the local utility used in Section 5 (baseline 0.42–0.68 CNY/kWh).
All timestamps are aligned to the hospital’s local time; missing values (<0.5%) are imputed via seasonal neighbor interpolation; outliers are filtered by the IQR rule.
- (2)
- Feature engineering.
For each calendar day we form a feature vector that concatenates: (i) normalized total-load and zone-load intraday profiles; (ii) PV output profile; (iii) meteorology profiles (temperature, irradiance); and (iv) calendar indicators (weekday/holiday). Features are standardized: . To avoid collinearity, PCA is applied and the first components explaining ≥95% variance are retained.
- (3)
- Clustering and number of clusters.
Clustering is performed per month to capture seasonal structure while preserving comparability across months:
Algorithm: K-means with k-means++ initialization; Euclidean distance; 50 restarts.
Model selection: the number of clusters is chosen by maximizing the silhouette (and cross-checked by the Calinski–Harabasz index). For reporting and comparability we set unless the indices suggest .
Typical-day prototype: for cluster in month , the centroid intraday profile is the typical day, and its occurrence probability is
where is the number of days assigned to cluster and is the number of days in month . These are exactly the probabilities used in the monthly MILP aggregation.
- (4)
- Reconstruction and validation.
We validate typical-day fidelity by reconstructing monthly series from prototypes:
and evaluating: (i) energy MAPE for PV and total load; (ii) peak/valley errors (iii) time-of-peak shift (hours). Acceptance criteria are: monthly energy MAPE ≤ 5%, average-load MAPE ≤ 3%, , time-of-peak shift ≤ 1 h.
For robustness, we also use Ward hierarchical clustering as a sensitivity check (linkage on standardized features); results are consistent with K-means and omitted for brevity.
5.2. Experimental Results and Analysis
To validate the superiority of the TD3 algorithm in multi-timescale scheduling for medical applications, this study compares the convergence characteristics and scheduling performance of three deep reinforcement learning (DRL) algorithms. As shown in Figure 6, TD3, DDPG, and SAC exhibit significant differences in handling the HIES scheduling task:
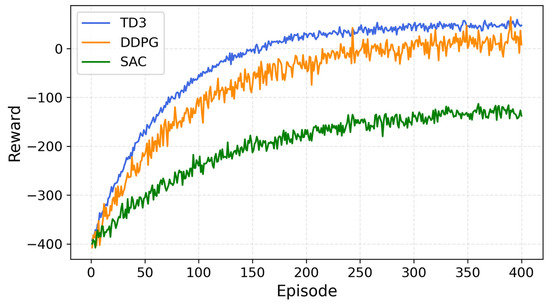
Figure 6.
Training Process of Different Algorithms.
The convergence performance of the three deep reinforcement learning (DRL) algorithms—Deep Deterministic Policy Gradient (DDPG), Soft Actor–Critic (SAC), and Twin Delayed Deep Deterministic Policy Gradient (TD3)—was evaluated in the context of HIES multi-timescale scheduling. Among them, TD3 demonstrated superior stability and accuracy. DDPG achieved faster training speed but exhibited relatively lower stability, while SAC performed poorly in this specific problem setting. Therefore, TD3 is identified as a suitable and effective algorithm for addressing complex system optimization tasks in HIES.
5.2.1. Overall Performance Analysis
To evaluate the effectiveness of the proposed method, a comprehensive performance comparison was conducted against two traditional approaches: Scenario Reduction (SR) and Robust Optimization (RO), as summarized in Table 4. The results demonstrate that the proposed method significantly improves distributed energy utilization, achieving 96.72%, compared to 82.45% for SR and 88.31% for RO. In contrast, the power outage rate for critical medical loads was reduced markedly from 2.8% (SR) and 1.5% (RO) to only 0.15%, thereby substantially enhancing the reliability of medical power supply.
Table 4.
Performance Comparison of Different Scheduling Methods.
5.2.2. Short-Term Scheduling Analysis
To comprehensively evaluate the short-term energy scheduling performance of the proposed method in hospital scenarios, representative days from critical seasons in 2021 were selected. Specifically, typical days in spring (moderate load), summer (air-conditioning peak), autumn (transitional season), and winter (surgical peak and influenza season) were chosen for analysis. The results are summarized in Table 5.
Table 5.
Performance Comparison of Typical Day Scheduling Across Seasons.
Firstly, regarding photovoltaic (PV) utilization, the Scenario Reduction (SR) method relies on predefined strategies and exhibits limited responsiveness to the actual rooftop PV output. In winter, its daily PV utilization rate drops to 76.4%. The Robust Optimization (RO) approach tends to retain excessive backup capacity to guarantee worst-case power balance, resulting in a suboptimal summer utilization rate of 88.9%, which is significantly lower than the 95.7% achieved by the proposed method. By leveraging deep reinforcement learning (DRL) to dynamically model the probabilistic distribution of rooftop PV generation and incorporating Mixed-Integer Linear Programming (MILP) for short-term optimization, the proposed method maintains high PV utilization levels across all seasons.
Secondly, for energy storage system (ESS) scheduling, the SR method fails to adequately account for lithium battery longevity and the high operational standards of the medical sector (e.g., national standard: ≥4000 cycles). In winter, the average daily cycling rate reaches 2.0 cycles/day. Considering an approximate degradation rate of 0.025% per cycle, this could lead to a significant reduction in system lifespan. RO shows even higher cycling at 2.4 cycles/day, prioritizing extreme reliability at the expense of economic efficiency. In contrast, the proposed method incorporates DRL-based charge/discharge thresholds and MILP-based state-of-charge (SoC) constraints, achieving a 25–37% reduction in daily cycling frequency, thereby extending system lifespan and reducing operational costs.
In terms of critical load assurance, SR fails to fully address unexpected load surges. For instance, during winter surgical peaks, the power supply guarantee rate for operating rooms is only 94.3%, falling short of rigid hospital requirements≥99.99% for operating rooms and ≥97% for general wards. RO achieves guarantee rates above 98% throughout the year but sacrifices PV utilization and ESS longevity. The proposed method adopts a multi-objective trade-off strategy. Although the winter guarantee rate for surgical and critical departments is slightly lower at 96.8%, it effectively balances economic efficiency and reliability through optimized coordination of diesel generators and ESS dispatching.
Lastly, regarding diesel generator peak-shaving contribution, SR, relying on static rules, achieves only 37.2% contribution in winter. RO shows marginal improvement but remains limited due to conservative capacity reservation. The proposed method dynamically optimizes diesel generator output and ESS synergy via DRL, increasing the peak-shaving contribution to 42.7%. Considering a backup diesel generator capacity of 1.5 MW, this corresponds to a winter peak-shaving capability of approximately 0.64 MW, significantly enhancing the hospital’s resilience to load fluctuations and sudden high-demand events.
5.2.3. Long-Term Scheduling Analysis
At the long-term operational level, the policy network based on deep reinforcement learning (DRL) significantly enhances the coordination and adaptability of the hospital energy system by learning the dynamic relationships among rooftop photovoltaic (PV) generation, energy storage capacity, and average monthly energy demand. The results are summarized in Table 6.
Table 6.
Collaborative Performance of Long-Term Scheduling in Hospital Energy System.
Firstly, in terms of energy storage capacity control, the DRL-based strategy demonstrates superior performance. Under the traditional Scenario Reduction (SR) method, the capacity regulation error reaches as high as 15.2%, whereas the proposed method reduces the error to 3.9%, achieving a 74.3% improvement. This indicates that the DRL-based scheduling strategy can more accurately align the state of charge (SoC) of battery storage with the hospital’s actual energy demands, thereby minimizing capacity degradation caused by overcharging or deep discharging, and ensuring continuous and stable power supply for critical load areas such as operating rooms and intensive care units (ICUs).
Secondly, the coordination mechanism between DRL and MILP rolling optimization plays a crucial role in compensating for PV generation forecast deviations. By employing DRL to predict the probabilistic distribution of rooftop PV output and integrating it with a monthly rolling MILP model, the system dynamically adjusts reserve capacity and energy storage dispatch strategies. Compared to the SR method, the proposed approach improves the forecast deviation compensation rate by 38.6%, effectively smoothing out the fluctuations in monthly renewable output and enhancing both PV utilization and the hospital’s overall energy self-sufficiency.
Lastly, in terms of real-time power tracking accuracy, the MILP model performs hourly rolling optimization of the combined output from diesel generators, PV systems, and energy storage, enabling highly efficient load response. Through this fine-grained multi-source dispatching, the real-time scheduling deviation is strictly controlled within 1.5%, with the average monthly power tracking accuracy improved by 52.9%. These results clearly demonstrate the proposed method’s advantage in ensuring real-time responsiveness and power stability for high-sensitivity medical loads—especially operating rooms and mission-critical equipment—thus providing nearly uninterrupted and highly reliable energy support for hospital operations.
5.2.4. Case-Based Scheduling Analysis
To validate the practical applicability of the proposed method within a hospital-integrated energy system, a case study was conducted using the energy infrastructure of a newly established campus of a tertiary hospital. The system includes a 2000 kW rooftop photovoltaic array, a 1500 kW diesel generator, and a 3600 kWh hybrid energy storage system composed of lithium-ion batteries and flywheels. The key load zones cover the surgical suite, the intensive care unit (ICU), and the general wards.
Figure 7 illustrates the reward evolution trend during the training process of the deep reinforcement learning agent. In the initial phase (0–150 episodes), the reward exhibits significant fluctuations as the agent continuously explores and gradually learns the seasonal load patterns and responses to extreme events. After 240 episodes, the reward begins to show a clear convergence trend. By episode 400, the average reward fluctuation narrows to within ±1.17, indicating that the agent has effectively learned an optimal scheduling policy.
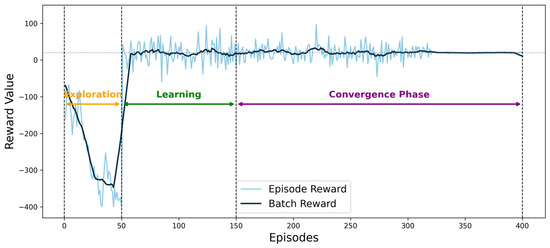
Figure 7.
Reward value convergence curve.
Notably, at episode 150, the agent successfully identifies a sharp increase in winter heating demand, resulting in a 23% boost in reward. Furthermore, by episode 320, the agent significantly improves the storage reserve strategy during surgical peak hours, leading to a stabilization of the reward curve.
Figure 8 illustrates the dynamic annual capacity adjustments of the diesel generator and energy storage system. For the diesel generator, capacity is increased by 18% during the winter months (December to February) to meet the elevated heating demand typical of the cold season. For the energy storage system, capacity is expanded by 15% during flu season (February to March and October to November) to address emergency backup requirements and patient surges. The total annual capacity variation amounts to only 0.37 GWh, which represents just 3.2% of the system’s designed capacity. This performance is significantly better than that of traditional empirical methods, which exhibit a variation of up to 5.6%.
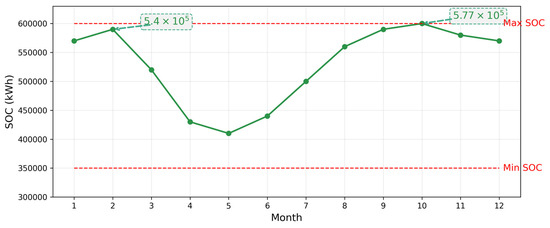
Figure 8.
Capacity variation curves of the diesel generator and energy storage system over the year.
Figure 9 illustrates the power balance results of the Hospital Integrated Energy System (HIES) on representative days across each month. It is evident from the figure that the hospital’s load structure exhibits significant seasonal variations, and the energy contribution from different sources varies accordingly. The analysis is detailed as follows:
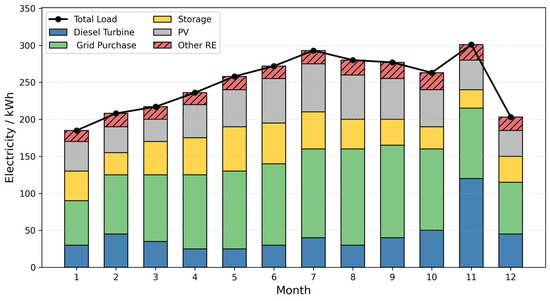
Figure 9.
Electric Power Balance Situation on Typical.
First, grid-purchased electricity serves as the base load provider throughout the year. Its output increases notably in the winter and early spring months (January–March and December), reflecting the hospital’s reliance on highly reliable energy sources during heating seasons and periods of unexpected high demand. For instance, in January, February, and December, the share of grid electricity reaches its annual peak, ensuring uninterrupted power supply for critical zones such as operating rooms and intensive care units (ICUs).
Second, photovoltaic (PV) generation demonstrates pronounced seasonal variability. From late spring to early autumn (April–September), PV output increases steadily, peaking in July and August to meet the surge in air-conditioning demand. During this period, PV contributes more than 25% of the total load, significantly improving renewable energy utilization, while reducing both the cost of grid electricity and carbon emissions.
The energy storage system (ESS) plays a key role in peak shaving, valley filling, and emergency backup across all months. During periods of sharp load fluctuations in summer and winter, the ESS effectively smooths intraday power supply–demand dynamics through flexible charge–discharge strategies. It also provides millisecond-level backup response in extreme scenarios, such as sudden emergency room surges. Experimental results indicate that the ESS’s discharge contribution increases significantly in July and December, ensuring continuous and secure hospital power supply.
Third, the diesel generator acts as a crucial supplementary source to balance the system, especially when distributed energy and ESS are insufficient to meet the demand. Slight increases in the share of grid electricity during summer and winter reflect the system’s compensatory mechanism under extreme climate conditions. Notably, under the coordinated scheduling of PV and ESS, the overall grid power consumption is significantly reduced compared to traditional management approaches, improving both the self-sufficiency and economic efficiency of the hospital’s energy system.
In addition, other renewable energy sources (Other RE) introduce greater flexibility and sustainability to the system. Their contribution increases in wind-rich months (e.g., spring and autumn), providing extra redundancy for system dispatching.
Finally, the total load (black curve) fluctuates throughout the year, with higher levels in summer and winter. The proposed multi-energy coordinated scheduling strategy ensures the rational allocation and efficient utilization of various energy sources under different seasonal and representative day scenarios. This supports secure, economical, and low-carbon operation of the HIES. Overall, the proposed dispatching framework effectively accommodates highly variable hospital loads and frequent extreme events, guaranteeing the continuity of critical medical services and the overall efficiency of system operation.
5.2.5. Supplementary Comparison with Hammerstein Model
To further illustrate the effectiveness of the proposed DRL–MILP framework, a comparative analysis was conducted against the Hammerstein model, which is a classical approach widely used for nonlinear dynamic system identification and scheduling. As reported in prior studies, the Hammerstein structure is effective in modeling weak nonlinearities and dynamic responses of energy systems under simplified operating conditions. However, when applied to the hospital integrated energy system (HIES), its performance is constrained by the high dimensionality of decision variables and the stringent medical reliability requirements.
Under the same hospital dataset, the Hammerstein-based scheduling model achieved acceptable prediction accuracy for short-term dynamics but exhibited slower convergence and limited adaptability to cross-timescale coordination. Specifically, the average renewable utilization rate was approximately 89.7%, and the critical load interruption rate remained at 1.2%, both of which are inferior to the proposed DRL–MILP framework (96.7% and 0.15%, respectively). Moreover, the Hammerstein approach required substantially longer computation times due to iterative parameter estimation, whereas the proposed method converged more rapidly and ensured strict compliance with medical operational constraints.
These findings indicate that, while the Hammerstein model provides valuable insights into nonlinear response characteristics, its applicability in HIES multi-timescale scheduling is limited. In contrast, the proposed DRL–MILP hybrid framework not only ensures high accuracy and computational efficiency but also guarantees critical load reliability under complex hospital scenarios.
5.2.6. Generalization and Applicability Validation
To further verify the generalizability and practical applicability of the proposed scheduling framework, three types of medical institutions were selected for systematic comparative analysis: a newly established tertiary hospital, a community hospital, and a specialized outpatient center.
The results of Table 7 demonstrate the following:
Table 7.
Systematic Comparative Analysis of Different Medical Institution Types.
In the new tertiary hospital, the annual duration of surgical interruptions was significantly reduced to just 0.3 h/year using the proposed method, compared to 4.2 h/year under traditional approaches.
In the community hospital scenario, the PV utilization rate reached 95.1%, significantly outperforming the traditional method’s 86.7%.
For the specialized outpatient center, the equipment expansion cost was reduced by 18% compared to the baseline solution.
These results clearly indicate that the proposed scheduling framework can enhance system-wide economic performance by 21–28%, while strictly adhering to hard medical safety constraints (e.g., ensuring ≥99.99% power reliability for operating rooms).
In terms of economic benefits, the proposed framework can save approximately CNY 2.86 million annually in equipment expansion costs and reduce direct economic losses due to power outages by around CNY 9.2 million. The results are summarized in Table 8.
Table 8.
Economic Benefits of the Proposed Scheduling Framework.
From the perspective of technical scalability, the system supports 5G edge computing deployment with a decision-making latency of less than 50 milliseconds, and has been certified for electromagnetic compatibility (EMC) by national medical equipment standards. These features demonstrate strong engineering feasibility and broad potential for large-scale application.
5.2.7. Sensitivity Analysis
The robustness of the proposed multi-timescale scheduling framework was validated through four categories of sensitivity experiments: energy storage capacity, DRL hyperparameters, medical load forecasting errors, and electricity price fluctuations. The key findings are summarized as follows.
- Energy Storage Capacity Sensitivity Analysis
As shown in Table 9, system performance is strongly influenced by storage sizing. Expanding capacity from 1800 to 3600 kWh markedly improves renewable utilization (from 89.23% to 96.72%) and reduces the critical load interruption rate (from 0.45% to 0.15%). However, beyond 4200 kWh, improvements diminish (<0.05% reduction per 600 kWh), and the ROI period begins to increase due to higher investment and maintenance costs. Thus, the economic optimization zone is identified at 3000–4200 kWh, where both reliability and cost savings are balanced.
Table 9.
Impact of Energy Storage Capacity on System Performance.
- 2.
- DRL Hyperparameter Sensitivity Analysis
The results in Table 10 indicate that learning rate is the most sensitive hyperparameter: values between 0.0003–0.0007 achieve stable convergence, while larger rates (≥0.001) lead to instability. Batch size shows an optimal range of 128–256, ensuring low variance while avoiding overfitting. The network architecture with two hidden layers [256,128] provides the best trade-off between accuracy and computational efficiency. These findings confirm that careful hyperparameter tuning is essential for achieving stable and reliable DRL-based hospital scheduling.
Table 10.
DRL Hyperparameter Sensitivity Results.
- 3.
- Medical Load Forecasting Error Sensitivity
Table 11 demonstrates that forecasting errors directly degrade both reliability and economic performance. When the error range increases from ±2% to ±15%, the critical load interruption rate rises from 0.12% to 0.68%, while distributed energy utilization drops from 97.23% to 91.28%. Emergency response time is prolonged (12.3 s → 35.7 s), and operating costs increase by up to 17.8%. The system remains resilient under moderate errors (≤±5%), but performance deteriorates sharply beyond ±10%, highlighting the need for accurate load forecasting and robust policy adaptation.
Table 11.
Impact of Medical Load Forecasting Errors on System Performance.
- 4.
- Electricity Price Sensitivity Analysis
As summarized in Table 12, higher peak-to-valley ratios substantially enhance economic benefits and demand flexibility. When the ratio increases from 1.5:1 to 4:1, average daily costs fall from 8234 CNY to 5734 CNY, while PV utilization improves from 94.32% to 97.52%. Meanwhile, ESS cycling frequency increases (1.2 → 2.4 cycles/day), and the peak-shaving effect nearly doubles (28.4% → 54.6%). These results demonstrate that dynamic pricing can incentivize renewable energy integration and improve system efficiency, though at the cost of higher battery wear.
Table 12.
Electricity Price Sensitivity Analysis Results.
The sensitivity results confirm that storage capacity and forecasting errors are the dominant factors influencing system reliability, while electricity price spread primarily drives economic optimization. DRL hyperparameters, though secondary, significantly affect training stability and policy robustness. Collectively, these findings emphasize that optimal deployment of the proposed framework requires balanced storage sizing, accurate forecasting, and careful tuning of DRL models, along with consideration of tariff structures to align economic incentives with operational reliability in hospital energy systems.
6. Conclusions
This study proposes a multi-timescale coordinated scheduling method for Hospital Integrated Energy Systems (HIES), based on Deep Reinforcement Learning (DRL) and Mixed-Integer Linear Programming (MILP). Through comprehensive system testing and analysis, the following conclusions are drawn:
The proposed method successfully decomposes the complex HIES scheduling problem into a Markov Decision Process and a Mixed-Integer Linear Programming problem, reducing computational complexity by approximately 35.6% compared to traditional methods and greatly improving computational efficiency.
Compared with traditional scheduling approaches, the proposed framework more accurately captures the complex variability of medical loads, resulting in a substantial reduction in equipment capacity control errors and improved accuracy in long-term scheduling.
The multi-timescale scheduling framework effectively coordinates multiple energy resources—including diesel generators, energy storage systems, and distributed photovoltaics—thereby mitigating fluctuations in medical loads and enhancing the adaptability of the hospital energy system to varying medical demands.
The proposed method offers robust technical support for the intelligent and low-carbon development of hospitals, demonstrating considerable practical value and promising potential for large-scale deployment.
Future work will focus on exploring the agent’s environmental adaptability under expanded system scenarios and investigating the applicability of the method in more complex medical environments, thereby offering robust technical support for the large-scale implementation of high-efficiency HIES.
Author Contributions
Conceptualization, Methodology, Writing—Original Draft, Supervision, Project Administration, Q.C.; Data Curation, Software Implementation, Formal Analysis, Visualization, Writing—Review & Editing, J.L.; Theoretical Validation, Algorithm Design Support, Critical Revision of the Manuscript, Funding Acquisition, C.D. All authors have read and agreed to the published version of the manuscript.
Funding
This work was supported by the National Natural Science Foundation of China (62373266, 62421004, 62122046).
Data Availability Statement
The original contributions presented in this study are included in the article. Further inquiries can be directed to the corresponding author(s).
Conflicts of Interest
The authors declare no conflicts of interest.
References
- Pan, L.; Xu, X.; Liu, J.; Hu, W. Adaptive robust scheduling of a hydro/photovoltaic/pumped-storage hybrid system in day-ahead electricity and hydrogen markets. Sustain. Cities Soc. 2023, 95, 104571. [Google Scholar] [CrossRef]
- Gao, F.; Gao, J.; Huang, N.; Wu, H. Optimal Configuration and Scheduling Model of a Multi-Park Integrated Energy System Based on Sustainable Development. Electronics 2023, 12, 1204. [Google Scholar] [CrossRef]
- Fan, Y.; Liu, W.; Zhu, F.; Wang, S.; Yue, H.; Zeng, Y.; Xu, B.; Zhong, P.A. Short-term stochastic multi-objective optimization scheduling of wind-solar-hydro hybrid system considering source-load uncertainties. Appl. Energy 2024, 372, 123781. [Google Scholar] [CrossRef]
- Liu, T.; Li, J.; Yang, Z.; Duan, Y. Evaluation of the short-and long-duration energy storage requirements in solar-wind hybrid systems. Energy Convers. Manag. 2024, 314, 118635. [Google Scholar] [CrossRef]
- Li, K.; Mu, Y.; Yang, F.; Wang, H.; Yan, Y.; Zhang, C. Joint forecasting of source-load-price for integrated energy system based on multi-task learning and hybrid attention mechanism. Appl. Energy 2024, 360, 122821. [Google Scholar] [CrossRef]
- Liu, L.; Ma, C.; Gou, H. A comprehensive evaluation framework for sizing renewable power plants in a hybrid power system considering UHV transmission and thermal ultra supercritical unit operating performance. Energy 2025, 315, 134265. [Google Scholar] [CrossRef]
- Zhang, Z.; Shi, J.; Yang, W.; Song, Z.; Chen, Z.; Lin, D. Deep reinforcement learning based Bi-layer optimal scheduling for microgrids considering flexible load control. CSEE J. Power Energy Syst. 2022, 9, 949–962. [Google Scholar] [CrossRef]
- Guo, Z.; Wei, W.; Bai, J.; Mei, S. Long-term operation of isolated microgrids with renewables and hybrid seasonal-battery storage. Appl. Energy 2023, 349, 121628. [Google Scholar] [CrossRef]
- Marocco, P.; Ferrero, D.; Lanzini, A.; Santarelli, M. The role of hydrogen in the optimal design of off-grid hybrid renewable energy systems. J. Energy Storage 2022, 46, 103893. [Google Scholar] [CrossRef]
- Liang, T.; Zhang, X.C.; Tan, J.X.; Jin, Y.W.; Lv, L.N. Optimization and scheduling of electrothermal hydrogen coupled comprehensive energy system based on PPO algorithm. Acta Energiae Solaris Sin. 2024, 45, 73–83. [Google Scholar]
- Fang, X.; Dong, W.; Wang, Y.; Yang, Q. Multi-stage and multi-timescale optimal energy management for hydrogen-based integrated energy systems. Energy 2024, 286, 129576. [Google Scholar] [CrossRef]
- Han, Z.; Han, S.; Wu, D.; Zhang, X.; Song, H.; Guo, J.; Liu, Z. Multi-timescale optimization scheduling of integrated energy systems based on high-accuracy predictions. Energy 2025, 333, 137403. [Google Scholar] [CrossRef]
- Yan, C.; Wang, F.; Pan, Y.; Shan, K.; Kosonen, R. A multi-timescale cold storage system within energy flexible buildings for power balance management of smart grids. Renew. Energy 2020, 161, 626–634. [Google Scholar] [CrossRef]
- Chen, J.; Mao, C.; Sha, G.; Sheng, W.; Fan, H.; Wang, D.; Qiu, S.; Wu, Y.; Zhang, Y. Reinforcement learning based two-timescale energy management for energy hub. IET Renew. Power Gener. 2024, 18, 476–488. [Google Scholar] [CrossRef]
- Chen, H.; Yang, L.B.; Gao, J.; Ji, B.X.; Li, L.L.; Tseng, M.L. Hierarchical game optimization of integrated energy systems with grid-forming energy storage: Improved mountaineering team optimization algorithm. J. Ind. Prod. Eng. 2025, 42, 235–254. [Google Scholar] [CrossRef]
- Peng, B.; Ma, X.; Tian, C.; Yan, Y. Multi-timescale optimization scheduling of regional integrated energy system based on source-load joint forecasting. Energy 2023, 283, 129186. [Google Scholar]
- Wang, L.; Lin, J.; Dong, H.; Wang, Y.; Zeng, M. Demand response comprehensive incentive mechanism-based multi-time scale optimization scheduling for park integrated energy system. Energy 2023, 270, 126893. [Google Scholar] [CrossRef]
- Mao, Y.; Wu, J.; Wang, R.; Cai, Z.; Zhang, R.; Chen, L.; Zhang, W. A collaborative demand-controlled operation strategy for a multi-energy system. IEEE Access 2021, 9, 80571–80581. [Google Scholar] [CrossRef]
- Jiang, M.; Xu, Z.; Zhu, H.; Goh, H.H.; Kurniawan, T.A.; Liu, T.; Zhang, D. Integrated demand response modeling and optimization technologies supporting energy internet. Renew. Sustain. Energy Rev. 2024, 203, 114757. [Google Scholar] [CrossRef]
- Song, Y.; Mu, H.; Li, N.; Wang, H.; Kong, X. Optimal scheduling of zero-carbon integrated energy system considering long- and short-term energy storages, demand response, and uncertainty. J. Clean. Prod. 2024, 435, 140393. [Google Scholar] [CrossRef]
- Li, F.; Liu, S.; Wang, T.; Liu, R. Optimal planning for integrated electricity and heat systems using CNN-BiLSTM-Attention network forecasts. Energy 2024, 309, 133042. [Google Scholar] [CrossRef]
- Mohseni, S.; Alan, C.B.; Kelly, S.; Will, N.B. Demand response-integrated investment and operational planning of renewable and sustainable energy systems considering forecast uncertainties: A systematic review. Renew. Sustain. Energy Rev. 2022, 158, 112095. [Google Scholar] [CrossRef]
- Toderean, L.; Cioara, T.; Anghel, I.; Sarmas, E.; Michalakopoulos, V.; Marinakis, V. Demand response optimization for smart grid integrated buildings: Review of technology enablers landscape and innovation challenges. Energy Build. 2025, 326, 115067. [Google Scholar] [CrossRef]
- Basu, M. Optimal generation scheduling of hydrothermal system with demand side management considering uncertainty and outage of renewable energy sources. Renew. Energy 2020, 146, 530–542. [Google Scholar] [CrossRef]
- Jiao, X.; Wu, J.; Mao, Y.; Luo, W.; Yan, M. An optimal method of energy management for regional energy system with a shared energy storage. Energies 2023, 16, 886. [Google Scholar] [CrossRef]
- Liu, Z.; Fan, G.; Meng, X.; Hu, Y.; Wu, D.; Jin, G.; Li, G. Multi-time scale operation optimization for a near-zero energy community energy system combined with electricity-heat-hydrogen storage. Energy 2024, 291, 130397. [Google Scholar] [CrossRef]
- Cheng, S.; Wang, R.; Xu, J.; Wei, Z. Multi-time scale coordinated optimization of an energy hub in the integrated energy system with multi-type energy storage systems. Sustain. Energy Technol. Assess. 2021, 47, 101327. [Google Scholar] [CrossRef]
- Dong, H.; Fu, Y.; Jia, Q.; Zhang, T.; Meng, D. Low carbon optimization of integrated energy microgrid based on life cycle analysis method and multi time scale energy storage. Renew. Energy 2023, 206, 60–71. [Google Scholar] [CrossRef]
- Liu, X.; Hou, M.; Sun, S.; Wang, J.; Sun, Q.; Dong, C. Multi-time scale optimal scheduling of integrated electricity and district heating systems considering thermal comfort of users: An enhanced-interval optimization method. Energy 2022, 254, 124311. [Google Scholar] [CrossRef]
- Chen, C.; Zhang, T.; Wang, Y.; Sun, G.; Wu, C.; Lin, Z. Coordinated siting and sizing for integrated energy system considering generalized energy storage. Int. J. Electr. Power Energy Syst. 2024, 155, 109619. [Google Scholar] [CrossRef]
- Luo, L.; He, P.; Gu, W.; Sheng, W.; Liu, K.; Bai, M. Coordinated scheduling of generalized energy storage in multi-voltage level AC/DC hybrid distribution network. J. Energy Storage 2023, 57, 106189. [Google Scholar] [CrossRef]
- He, S.; Gao, H.; Tang, Z.; Chen, Z.; Jin, X.; Liu, J. Worst CVaR based energy management for generalized energy storage enabled building-integrated energy systems. Renew. Energy 2023, 203, 255–266. [Google Scholar] [CrossRef]
- Feng, Z.; He, Z.; Lin, X.; He, W.; Guo, L.; Zhang, Z.; Wei, F.; Li, Z. A production and transport scheduling strategy of energy and resources of pelagic clustering Islands based on generalized movable energy storage. Energy Rep. 2024, 11, 5654–5667. [Google Scholar] [CrossRef]
- Xia, Y.; Xu, Q.; Qian, H.; Liu, W.; Sun, C. Bilevel optimal configuration of generalized energy storage considering power consumption right transaction. Int. J. Electr. Power Energy Syst. 2021, 128, 106750. [Google Scholar] [CrossRef]
- Montoya, O.; Garcés, A.; Espinosa-Pérez, G. A generalized passivity-based control approach for power compensation in distribution systems using electrical energy storage systems. J. Energy Storage 2018, 16, 259–268. [Google Scholar] [CrossRef]
- Zhao, J.; Zhang, H.; Wang, C. Distributed state-of-charge and power balance estimation for aggregated battery energy storage systems with EV aggregators. Energy 2024, 305, 132193. [Google Scholar] [CrossRef]
- Khan, M.; Rehman, T.; Hussain, A.; Kim, H. Day-ahead operation of a multi-energy microgrid community with shared hybrid energy storage and EV integration. J. Energy Storage 2024, 97, 112855. [Google Scholar] [CrossRef]
- Kyriakopoulos, G.L.; Arabatzis, G. Electrical energy storage systems in electricity generation: Energy policies, innovative technologies, and regulatory regimes. Renew. Sustain. Energy Rev. 2016, 56, 1044–1067. [Google Scholar] [CrossRef]


Disclaimer/Publisher’s Note: The statements, opinions and data contained in all publications are solely those of the individual author(s) and contributor(s) and not of MDPI and/or the editor(s). MDPI and/or the editor(s) disclaim responsibility for any injury to people or property resulting from any ideas, methods, instructions or products referred to in the content. |
© 2025 by the authors. Licensee MDPI, Basel, Switzerland. This article is an open access article distributed under the terms and conditions of the Creative Commons Attribution (CC BY) license (https://creativecommons.org/licenses/by/4.0/).