


Abstract
Ascorbic acid and its hydrophilic derivatives, ascorbyl phosphate, ascorbyl glucoside, and 3-O-ethyl ascorbic acid, are wide used active ingredients in cosmetics, with concentrations increasingly declared on product labels. Since such products are not subject to routine quality control, this study aimed to evaluate the content-related quality and stability of a comprehensive sample of commercial cosmetics. For this purpose, a selective HPLC-UV analytical method for their simultaneous determination was developed, validated, and applied to 41 products. The analysis revealed 0–31.7% (m/m) contents and inappropriate labeling in 22% of the products, including the absence and replacement of the labeled vitamin C form. Over half (57%) of the determined contents corresponded to the labels, which was claimed for 31 products, while the remaining contents were considerably lower (<80%). The stability study, performed on selected cosmetics and standard solutions under ambient and elevated temperatures, demonstrated instability, which could account for their inadequate content. Thus, the instability was found to be temperature-dependent and most pronounced for ascorbic acid, whereas the product price did not show a clear correlation with greater content or stability. Overall, these results highlight the need for proper quality control and stricter cosmetics regulation as well as formulation design to achieve sufficient stabilization, as observed in certain products.
1. Introduction
Ascorbic acid (AA), more broadly known as vitamin C (vit. C), is a highly valued cosmetic ingredient. Over the last two decades, its use in cosmetics has shifted from an auxiliary substance (antioxidant, pH adjuster, and stabilizer of the formulations) [1] to an active substance with several beneficial effects on the skin. Due to its antioxidative properties, it is primarily effective in the prevention of oxidative stress as well as in the treatment of skin conditions resulting from oxidative cellular damage, such as photoaging and hyperpigmentation [2,3]. Its effectiveness in the treatment of hyperpigmentation is also due to its inhibition of tyrosinase, the key enzyme involved in the conversion of tyrosine into melanin, which is responsible for skin pigment [4,5]. AA also plays a critical role in collagen production by stimulating procollagen gene expression and acting as a cofactor of 2-oxoglutarate-dependent dioxygenases, which catalyze post-translational modifications of procollagen (hydroxylation of proline and lysine residues) [6,7]. Additionally, by promoting the synthesis of tissue inhibitors of matrix metalloproteinases, which are involved in collagen degradation, AA increases collagen levels in the skin, improving skin firmness and signs of aging [4,7]. Vit. C has also been shown to be beneficial in some inflammatory dermatologic conditions such as erythema, acne, atopic dermatitis, and rosacea, which can partly be attributed to its ability to promote keratinocyte differentiation and modulate epidermal lipid metabolism [8,9,10,11].
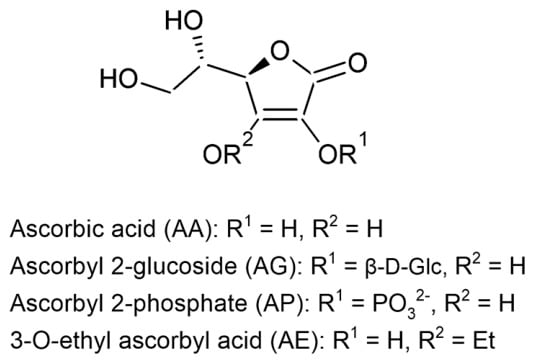
The formulation of high-quality and effective cosmetic products with AA is challenging primarily because of its hydrophilic nature, which limits its penetration through the hydrophobic stratum corneum barrier, as well as its instability and degradation, which can occur during cosmetics production and storage [12,13]. To overcome these limitations, several approaches are being investigated and applied in formulations, including reducing water content, oxygen levels, and light exposure; the addition of stabilizers; the use of high AA concentrations or advanced delivery systems; and the development and use of more stable AA derivatives [12]. Based on their structure, the currently available AA derivatives can be classified as hydrophilic (magnesium or sodium ascorbyl 2-phosphate (AP), ascorbyl 2-glucoside (AG) and 3-O-ethyl ascorbic acid (AE)), amphiphilic (disodium isostearyl 2-O-ascorbyl phosphate, ascorbyl 2-phosphate 6-palmitate), and lipophilic (ascorbyl 6-palmitate, tetrahexyldecyl ascorbate, and ascorbyl tetraisopalmitate) [14]. The addition of a lipophilic group enhances the lipophilicity of vit. C and its epidermal penetration, while substitution at the C2 or C3 position on the AA molecule primarily improves its stability by protecting the reactive enediol system [15]. Among the different vit. C forms, AA and its hydrophilic derivatives (Figure 1) are the most commonly used forms in commercial cosmetics [16]. Although the higher stability of its hydrophilic derivatives has been described in the literature, practical data on their intrinsic stability, as well as their stability in cosmetic products, have not yet been reported. The aim of this study was therefore to examine the quality of a representative sample of commercial cosmetic products containing AA, AP, AG, and AE, focusing on their labeling and actual content in relation to the labels’ claims. The quality assessment also includes a comparative evaluation of their intrinsic stability through forced degradation studies, stability testing of various commercially available cosmetic products, and a comparison of different factors affecting their stability. Since, to our knowledge, no suitable stability-indicating analytical methods have been reported for their simultaneous analysis, an initial objective of the study was the development and validation of a simple and selective method based on high-performance liquid chromatography (HPLC) applicable to their evaluation in various samples.
Figure 1.
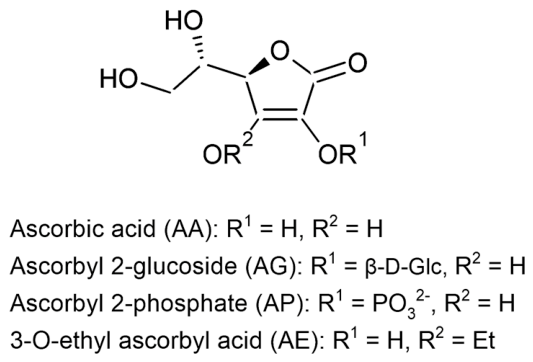
Structures of ascorbic acid (AA) and its hydrophilic derivatives: ascorbyl 2-glucoside (AG), ascorbyl 2-phosphate (AP), and 3-O-ethyl ascorbic acid (AE).
2. Materials and Methods
2.1. Chemicals and Reagents
AA (≥99.7%) and AG (≥99.6%) were obtained from Biosynth (Berkshire, UK). AE (≥98.0%) was purchased from Tokyo Chemical Industry (Tokyo, Japan). Magnesium (≥98.0%) and sodium AP (≥98.0%) were obtained from Sigma-Aldrich (Steinheim, Germany). HPLC-grade acetonitrile (ACN) and n-hexane were obtained from Honeywell, Riedel-de Haën™ (Seelze, Germany). Formic acid, sodium hydroxide, hydrochloric acid, hydrogen peroxide solution, and ethylenediaminetetraacetic acid disodium dihydrate (EDTA) were obtained from Merck (Darmstadt, Germany). Ultra-pure water (UPW) was obtained using an Adrona Connect LT purification system (Adrona, Riga, Latvia).
2.2. Instrumentation and Chromatographic Conditions
An Agilent 1100/1200 series HPLC system (Agilent Technologies, Santa Clara, CA, USA), equipped with a UV–VIS detector and a ChemStation data acquisition system, was used. The analysis was performed on a reversed-phase Gemini® C18 column (100 × 4.6 mm, 3 μm particle size; Phenomenex, Torrance, CA, USA) at 30 °C, with 0.05% formic acid in UPW (mobile phase A) and ACN (mobile phase B) in gradient elution mode at a flow rate of 1 mL/min. The gradient program was as follows: (time (min); % A; % B): (0–1.5; 100; 0), (1.5–5.0; 80; 20), (5.0–6.5; 80; 20), (6.6; 100; 0). The total run time was 10 min, and the detection wavelength was 254 nm, selected as a compromise to enable simultaneous determination of all four examined vit. C forms. The injection volume was adjusted to the analyte content in the samples and ranged from 3 μL to 10 μL (5 μL during method validation).
2.3. Preparation of Samples for Forced Degradation Study
A forced degradation study was performed on standard solutions containing one of the examined vit. C forms (250 mg/L of AA, AG, and AE or 500 mg/L of AP) in accordance with ICH guideline Q1A(R2) [17]. The individual solutions were further treated by adding 1 M HCl, 1 M NaOH, and 30% H2O2 to obtain samples containing 0.1 M HCl for acidic degradation, 0.1 M NaOH for alkaline degradation, and 3% H2O2 for oxidation. Untreated samples were exposed to elevated temperature (60 °C for thermal degradation), daylight for photodegradation, and stored at 25 °C, protected from light (control sample). After 24 and 48 h of exposure to the forced degradation conditions, the samples were processed (samples for hydrolytic degradation were neutralized with 1 M NaOH or HCl, and samples for thermal degradation were cooled to ambient temperature) and analyzed to assess the selectivity of the method in the presence of the formed degradation products. The determined contents were expressed as the ratio (%) between the response after 24 and 48 h and the initial response of the same concentration in the control sample.
2.4. Preparation of Standard Solutions
AA, AG, AP, and AE mixed stock standard solutions were prepared daily on three consecutive validation days by dissolving appropriate quantities of each individual standard in a 0.1 mM EDTA solution in UPW. The mixed stock solutions were further diluted with the same solvent to obtain calibration standards and quality control (QC) solutions (in triplicate), as presented in Table 1, which were analyzed immediately.
Table 1.
Concentrations (mg/L) of calibration standards and QC solutions.
2.5. Method Validation
The developed HPLC–UV method was validated according to ICH guideline Q2(R2) [18] in terms of selectivity, linearity, precision, accuracy, detection limit (DL), quantitation limit (QL), sample stability, sample preparation repeatability, and recovery. Selectivity was evaluated by visual examination of the chromatograms of each individual vit. C form standard solution, their mixtures, all solvents used, and all analyzed cosmetic products. Selectivity was also evaluated in the presence of degradation products of each individual vit. C form formed during the forced degradation study.
Linearity was assessed using a linear regression model between the concentrations of the individual vit. C forms in the calibration standard solutions (Table 1) and their peak responses. Based on this model, the slope of the regression line, y-intercept, and coefficient of determination (R2) were determined. The acceptance criterion for linearity was R2 > 0.999.
Accuracy and precision were evaluated at three QC levels, prepared in triplicate and covering low, medium, and high concentration levels within the linear ranges (Table 1), over three consecutive days of validation. Accuracy was reported as the mean percent ratio of the concentration calculated from the regression line, obtained on the same validation day (intra-day) and on different validation days (inter-day) and the known, actual concentration, and was set at 100 ± 5%. Precision was assessed as repeatability and intermediate precision, evaluated using three QC solutions at each concentration level. Repeatability was assessed as the relative standard deviation (RSD) of three QC solutions prepared and analyzed on the same validation day, while intermediate precision was determined as the RSD of QC solutions prepared and analyzed on three different validation days. Both repeatability and intermediate precision were set at ≤5%. Injection repeatability was determined using six consecutive injections of QC solutions at each of the three concentration levels and was considered acceptable at ≤2% RSD.
DL and QL were determined from the three calibration curves, using the equations DL = (3.3 × σ)/S and QL = (10 × σ)/S, where σ is the standard deviation of the intercepts, and S is the mean slope of the three regression lines.
The stability of the evaluated vit. C forms was assessed in QC solutions at each of the three concentration levels. Sample stability was evaluated by comparing the response after 24 h and 48 h of storage at 8 °C with the initial value, with an acceptance range of 100 ± 5%.
Repeatability of the sample preparation procedure was evaluated by preparing all tested cosmetic products in triplicate and calculating the RSD between them, with an acceptance criterion of ≤10%.
Method recovery was assessed for 14 different cosmetic products (No. 1, 6, 7, 8, 10, 13, 14, 16, 18, 25, 31, 34, 36, and 40) by adding the evaluated vit. C forms to the cosmetic products at their respective nominal amounts and performing separate analyses of the cosmetic product without addition and of the standard solution containing the added analyte amount in the extraction solvent. All samples were prepared in triplicate. Average recoveries were calculated using the following equation: recovery (%) = 100 × (concentration found in spiked sample − concentration found in non-spiked sample)/added concentration. The acceptance criterion was set at 100 ± 10%.
2.6. Overview of the Analyzed Commercial Cosmetic Products
A total of 41 leave-on commercial facial cosmetic products containing AA, AG, AP, and/or AE were analyzed. The products were purchased from different providers on the Slovenian market (grocery stores, drug stores, and pharmacies) through physical and online retailers between 2020 and 2025, and included serums, creams, primers, a spray, and a toner. Most of these products provided quantitative information on the content of some of the evaluated vit. C forms and were marketed with anti-aging or brightening effects. The relevant information regarding the type of products, formulations, and packaging, as well as the vit. C form and its labeled content, is summarized in Table A1, which also includes the price of each product, calculated by converting the retail price to a uniform volume of 30 mL.
2.7. Preparation of Samples for Cosmetic Product Analysis
The purchased products were opened within a few days of purchase and analyzed immediately after their opening. Thus, one batch of each product was purchased and analyzed. Before opening and analysis, the products were stored in their original primary and secondary packaging under the manufacturers’ recommended storage conditions (ambient temperature, except for products No. 24 and 32, which were stored in a refrigerator). All samples of the individual products were prepared in triplicate according to the procedures described below for hydrophilic and lipophilic formulations.
2.7.1. Sample Preparation for the Analysis of Hydrophilic Formulations
Samples of cosmetic products, containing mostly hydrophilic components, were prepared by weighing 30–150 mg of the product and adding 10 mL of 0.1 mM EDTA. The samples were vortexed for 5 min and sonicated for 10 min. The samples were then centrifuged at 20 °C and 4130× g for 10 min and filtered through a 0.45 μm Minisart® RC filter (Sartorius, Göttingen, Germany) before analysis. In the case of phase separation, only the lower, aqueous phase was sampled.
2.7.2. Sample Preparation for the Analysis of Lipophilic Formulations
Samples of the products, containing mostly lipophilic components (No. 8, 10, 11, 34, 35, 37, and 40), were weighed into centrifuge tubes (30–50 mg), followed by the addition of 2 mL of n-hexane and vortexing for 5 min and sonication for 10 min. Then, 10 mL of 0.1 mM EDTA was added, followed by additional vortexing for 5 min and sonication for 10 min. The samples were centrifuged at 20 °C and 4130× g for 10 min, resulting in at least two phases. The lower aqueous phase was filtered through a 0.45 μm Minisart® RC filter and transferred into vials for analysis.
2.8. Stability Testing of Selected Cosmetic Products and Standard Solutions Under Long-Term and Accelerated Storage Conditions
A total of 22 cosmetic products, selected based on the availability of sufficient quantities and adequate levels of the evaluated vit. C forms, were subjected to stability testing under long-term and accelerated storage conditions following the ICH Q1A(R2) [17] and Cosmetics Europe guidelines [19]. Testing under long-term storage conditions was performed on the cosmetic products in their original primary and secondary packaging under the expected storage conditions. Since typical expected storage conditions were ambient temperature and darkness, testing was performed under these conditions. Stability testing was additionally performed by storage in a refrigerator (2–8 °C) for two cosmetic products (No. 24 and 32) for which refrigerated storage is recommended by the manufacturer. The cosmetic products were opened periodically to simulate actual conditions of use (at least twice a week, resulting in exposure to air and light for a few minutes). Stability testing under accelerated storage conditions was performed by storing previously weighed amounts of the cosmetic products in closed plastic tubes, in a climatic chamber at elevated temperature (40 °C and 75% RH). In addition to these cosmetic products, individual 1% (m/V) AA, AG, AP, and AE standard solutions in UPW were also subjected to stability testing under long-term and accelerated storage conditions.
All samples for stability testing were prepared in triplicate, following the procedure described in Section 2.7, whereas the standard solutions were diluted 25-fold with UPW before analysis. All samples were analyzed at time 0, and after one, two (three in the case of the 1% AA standard solution), and four weeks. The organoleptic properties of the cosmetic products were also assessed at these time points, focusing on potential changes in color, consistency, clarity, and odor.
2.9. Quantification and Data Analysis
The quantification of the individual vit. C forms in the analyzed cosmetic products was based on their corresponding linear regression lines and the sample preparation procedure. The determined contents are expressed as mass percentages and are presented as the average (AV) ± standard deviation (SD) of the triplicate measurements. The numerical labels assigned to the tested cosmetic products are consistent throughout the manuscript.
3. Results
3.1. Forced Degradation Studies
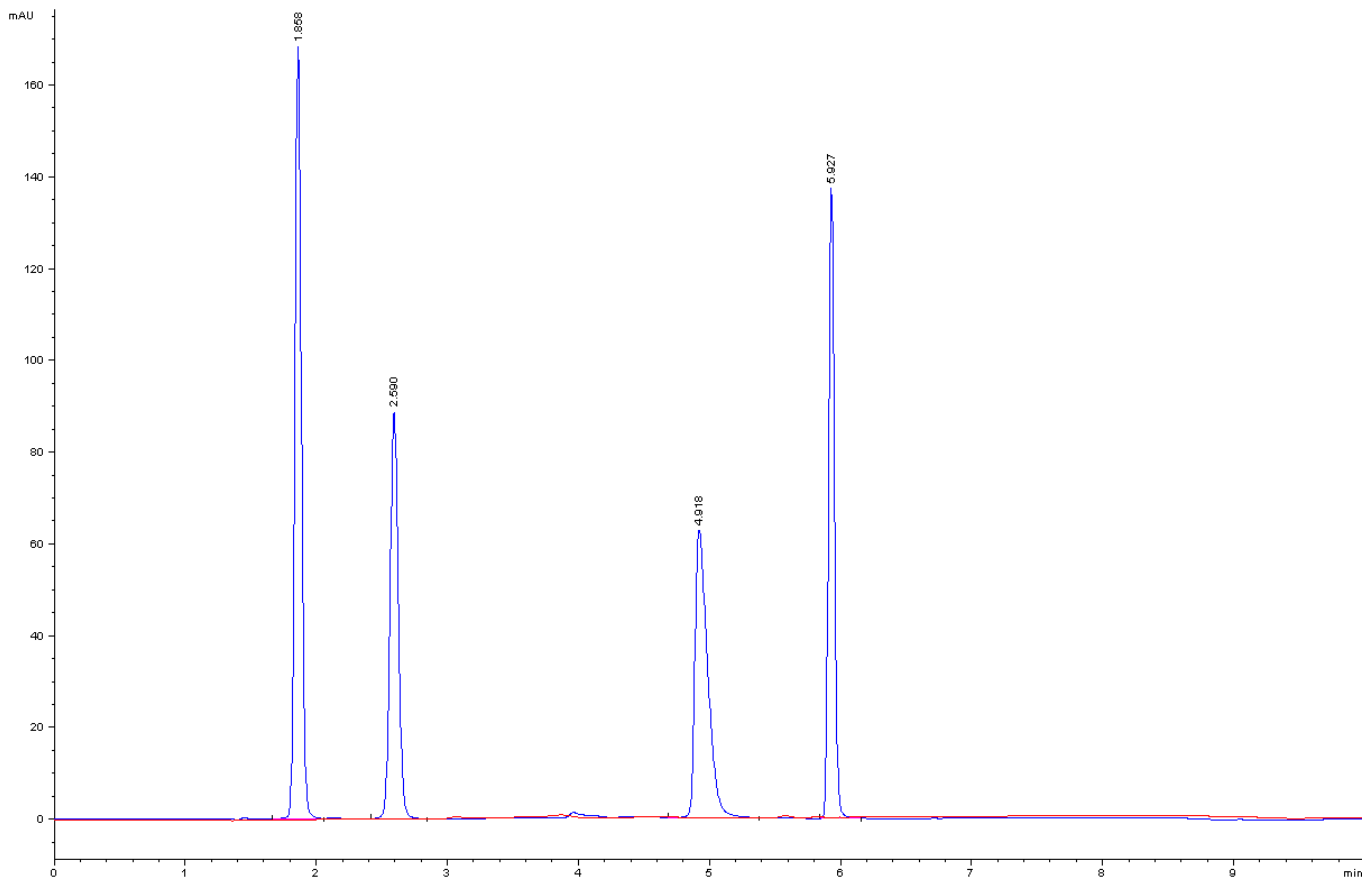
For the purpose of this study, a novel HPLC-UV method for the simultaneous determination of the evaluated vit. C forms (AA, AG, AP, and AE) was developed, and a representative chromatogram is shown in Figure A1. The stability-indicating nature of the method was assessed by forced degradation studies, in which individual solutions of the evaluated vit. C forms were exposed to typical forced degradation conditions (hydrolytic, oxidative, thermal, and photodegradation) for up to 48 h. The forced degradation studies also allowed a comparative assessment of the intrinsic stability of the four vit. C forms. The results, presented in Table 2, showed that AA exhibits the lowest stability, as it is highly unstable in aqueous solutions, with substantial degradation in the control samples, which was further pronounced under the evaluated forced degradation conditions. In contrast, AG, AP, and AE were considerably more stable than AA, as their contents remained unchanged under most of the tested conditions. However, significant degradation was observed under oxidative conditions, which was almost complete for AG and AP. The oxidatively most stable derivative, AE, was found to be susceptible to alkaline degradation. All chromatograms obtained in the forced degradation studies were visually examined. No distinct peaks corresponding to degradation products were observed in the chromatograms, and therefore no interferences with the chromatographic peaks of the individual vit. C forms were observed, demonstrating the selectivity of the developed method.
Table 2.
Remaining percentage of the evaluated vitamin C forms after 24 and 48 h of exposure to forced degradation conditions.
3.2. Method Validation
Validation of the developed HPLC–UV method was performed in accordance with ICH guideline Q2(R2) [18] and encompassed an evaluation of selectivity, linearity, precision, accuracy, DL, QL, sample stability, sample preparation repeatability, and recovery. Method selectivity was confirmed for all four evaluated vit. C forms, with no interferences detected at their retention times and at the selected detection wavelength in the standard solution samples, in samples from the forced degradation study, or in samples prepared from the cosmetic products. The method also demonstrated strong linearity over the evaluated concentration ranges, as indicated by the R2 values of the three combined regression lines over the three-day validation period (Table 3). The determined DL (0.66–2.13 mg/L) and QL (2.01–6.45 mg/L) (Table 3) demonstrate the sensitivity of the method, enabling the detection of the evaluated vit. C forms in cosmetic products at contents as low as 0.002–0.007% (m/m) and their quantification at 0.007–0.024% (m/m), considering the applied sample preparation conditions (150 mg of cosmetic product and 10 mL solvent) and analytical conditions (10 µL injection volume). The sensitivity can be further improved several-fold by adjusting the samples (mass of cosmetic product and volume of solvent) or their analysis (injection volume). The method also showed excellent accuracy and repeatability, and ensured sufficient stability of the evaluated vit. C forms in the QC samples over 48 h (Table 3). In addition to the method, the sample preparation procedure was validated by determining the average recoveries, which were within the following ranges: 90.5–106.3% (AA), 91.4–102.9% (AG), 91.8–103.8% (AP), and 95.1–97.3 (AE). All complied with the acceptance criterion of 100 ± 10% for all four vit. C forms. The repeatability of the sample preparation procedure was typically <5%.
Table 3.
Results from the method validation.
3.3. Qualitative Assessment of the Evaluated Vitamin C Forms in the Tested Cosmetics
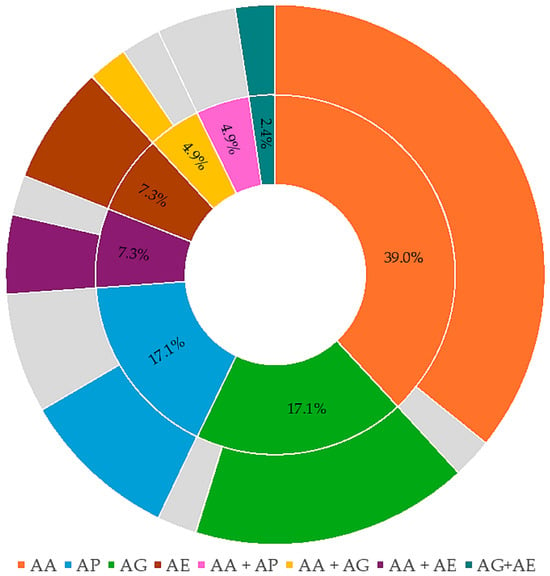
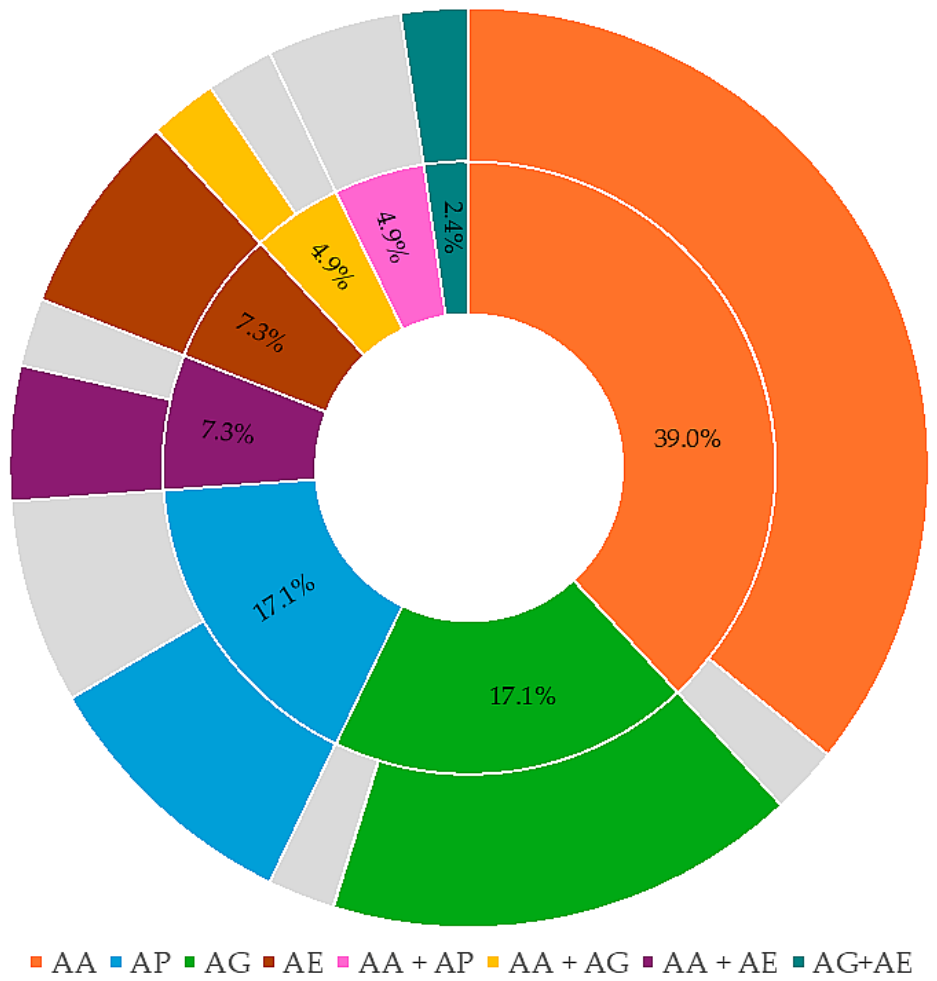
All 41 tested cosmetic products were labeled with at least one of the evaluated vit. C forms. Of these, four-fifths declared one form and one-fifth declared two of the evaluated vit. C forms (Table A1). The proportion of analyzed products with each specific form, as labeled on the products, is shown in the inner ring of Figure 2. The actual presence of the labeled forms was verified by analyses of samples prepared according to the procedure described in Section 2.7. The results are shown in the outer ring of Figure 2, indicating that the labeled forms were found in 78.0% of cases and that at least one of the labeled forms was below the DL in 22.0% of cases. In two of these, a different vit. C form was detected and quantified instead of the labeled one (AP instead of the labeled AA and AE instead of the labeled AA + AG). The identities of these two forms were additionally confirmed by recovery experiments using sample spiking with their reference standards, resulting in a 99.3% recovery for AP and a 97.3% recovery for AE. Among the nine cosmetic products that either lacked the labeled form or contained a different form than the labeled one, five were lower-priced products (<10 EUR/30 mL), whereas the remaining four were the highest-priced products labeled with each of the four vit. C forms. No labeling inconsistencies were observed among products in the medium price range (10–30 EUR/30 mL).
Figure 2.
Proportion of cosmetic products with specific labeled vitamin C forms (n = 41, inner ring) and the results of their qualitative assessment (outer ring), with confirmed presence shown in the same color and the share of forms not detected (<detection limit) shown in gray. Abbreviations: AA, ascorbic acid; AG, ascorbyl 2-glucoside; AP, ascorbyl 2-phosphate; AE, 3-O-ethyl ascorbic acid.
3.4. Quantitative Assessment of the Evaluated Vitamin C Forms in the Tested Cosmetics
3.4.1. Determination of the Content of the Individual Vitamin C Forms
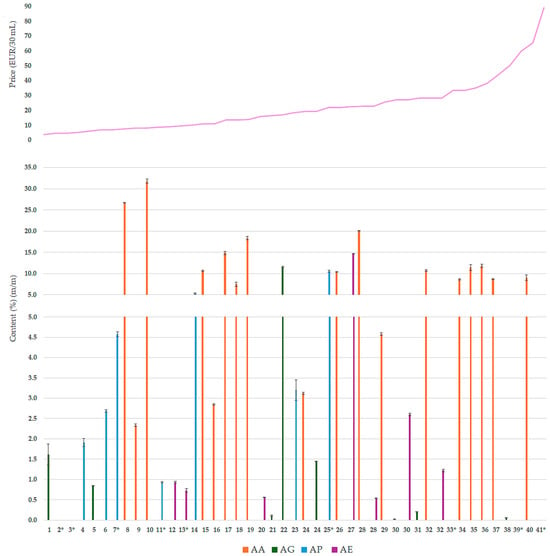
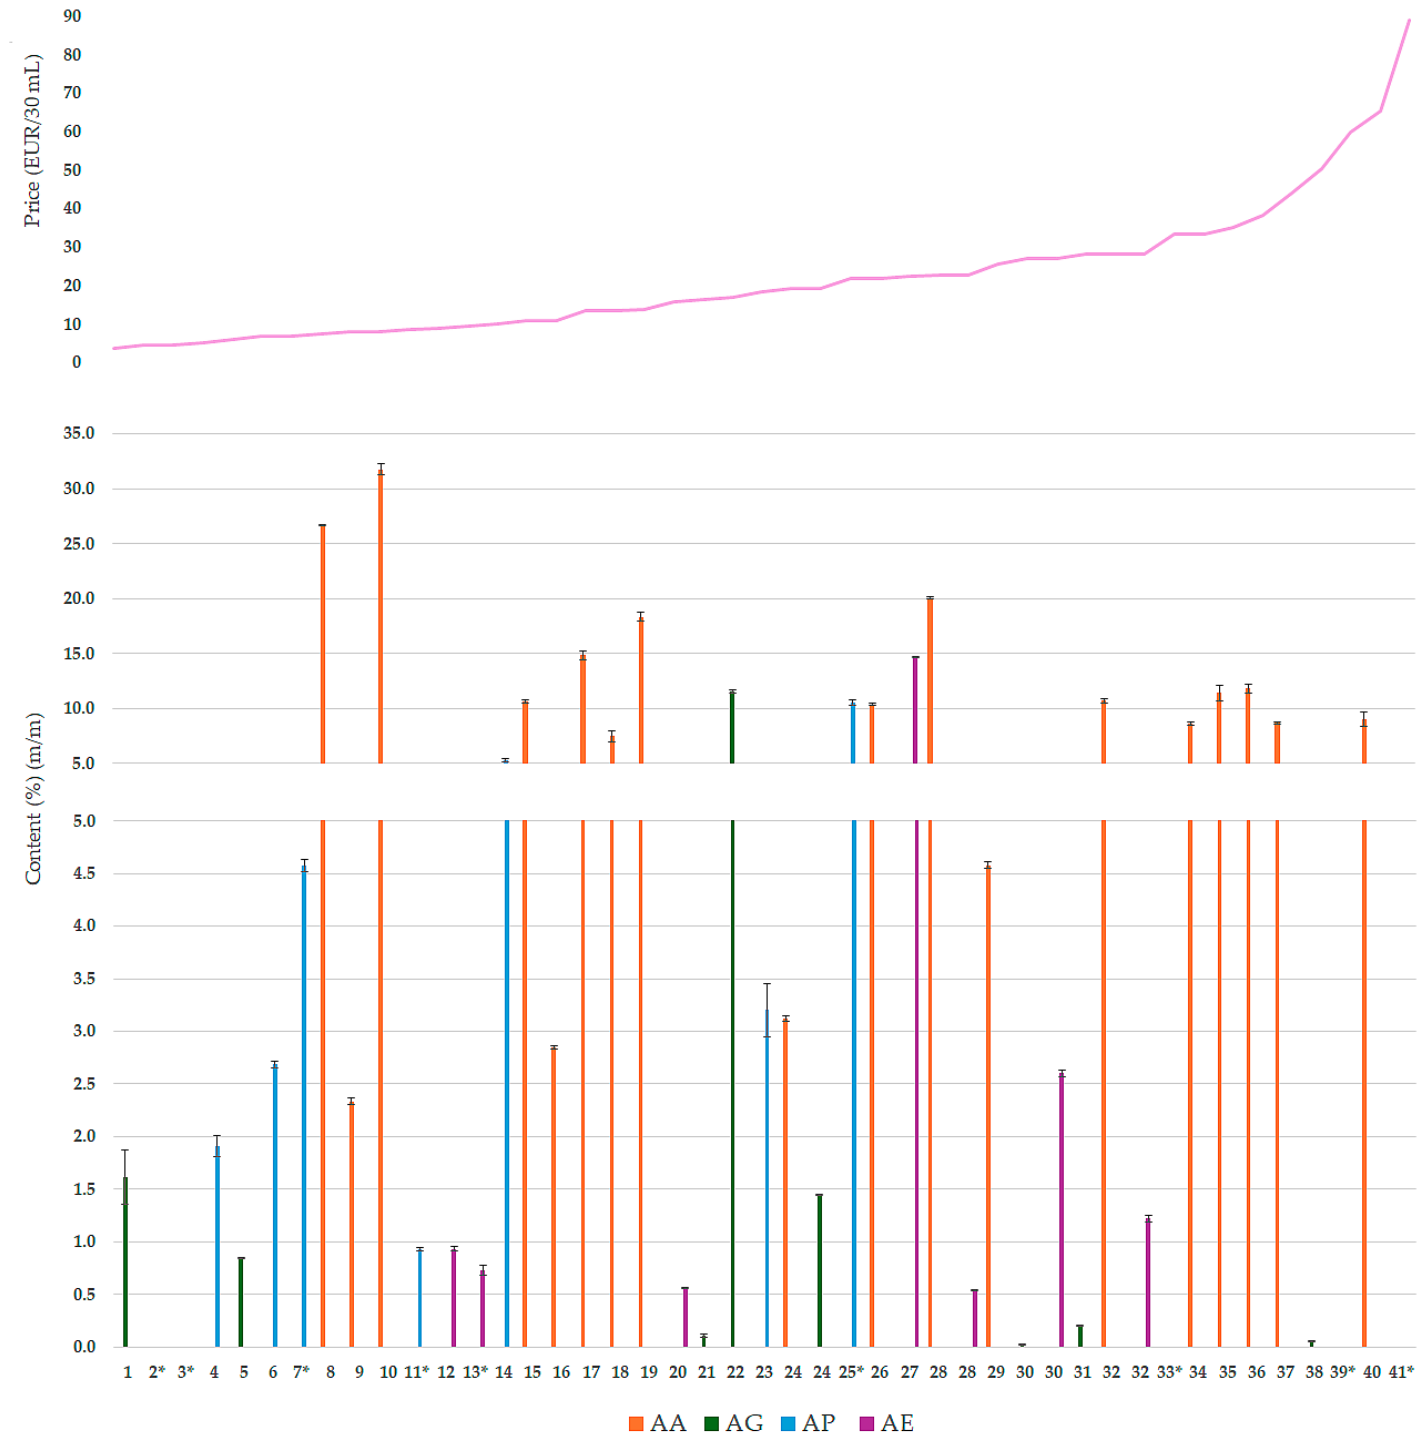
The detected vit. C forms in the tested cosmetics, prepared as described in Section 2.7, were further quantified (Section 2.9). The results, expressed as mass percentages and presented as the AV ± SD of the three replicates, are summarized in Figure 3. As shown in Figure 3, the contents ranged between < DL and up to 31.7% (AA), 11.5% (AG), 10.6% (AP), and 14.7% (AE). As also noticed in Section 3.3, the determined contents showed no clear correlation with the prices of the cosmetic products, as all products with very high contents (>15%) belonged to the lower and middle price ranges (up to 25 EUR/30 mL), whereas low contents (<1%) were determined in the higher-priced products (Figure 3). Among the four highest-priced products (>45 EUR/30 mL), low contents (product No. 38) as well as labeling errors and the absence of the specified vit. C form (products No. 39 and 41) were also observed (Figure 3).
Figure 3.
Determined contents of ascorbic acid (AA), ascorbyl 2-glucoside (AG), ascorbyl 2-phosphate (AP), and 3-O-ethyl ascorbic acid (AE) in the 41 tested cosmetic products are expressed as % (m/m) (mean ± standard deviation, n = 3) in relation to their prices (EUR per 30 mL), as shown by the pink line in the upper graph. In products No. 2, 3, 7, 11, 13, 25, 33, 39, and 41, marked with an asterisk (*), at least one of the labeled vitamin C forms was not detected.
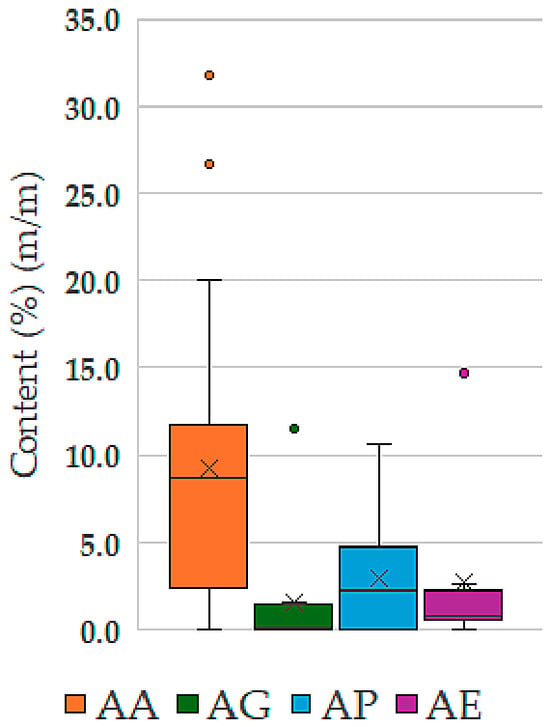
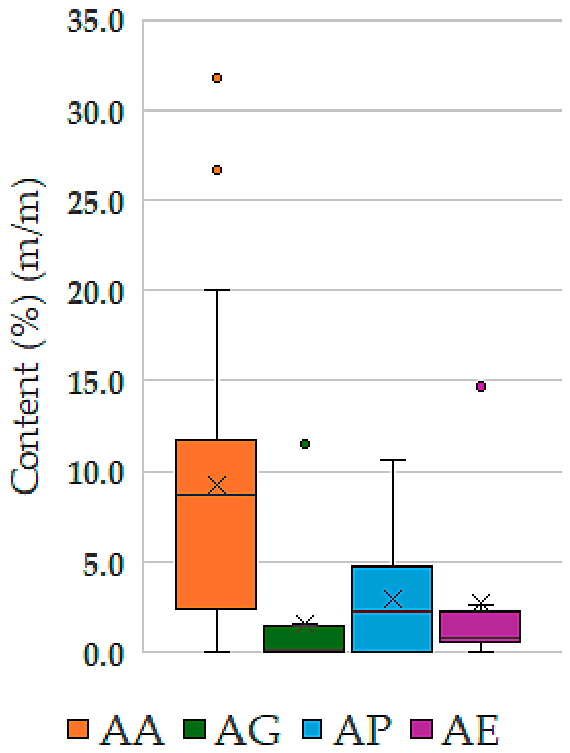
Further details on the distribution of the determined AA, AP, AG, and AE contents in the tested cosmetic products are shown in Figure 4 as a box plot. The determined AA contents showed both the highest values, with a median of 8.7%, and the greatest variability (interquartile range (IQR): 2.6–11.6%), followed by the determined AP contents (median 2.3%, IQR: 0.2–4.2%). Except for one outlier for each form, the determined AG and AE contents showed low variability and were generally clustered between 1% and 2%.
Figure 4.
Box-and-whisker plot showing the distribution of the determined contents of ascorbic acid (AA, n = 23), ascorbyl 2-glucoside (AG, n = 10), ascorbyl 2-phosphate (AP, n = 10), and 3-O-ethyl ascorbic acid (AE, n = 8). The box represents the interquartile range (IQR), the line inside the box indicates the median, the “×” marks the mean, the whiskers represent the minimum and maximum values, and the points indicate outliers.
3.4.2. Content-Related Quality Control of the Vitamin C Forms
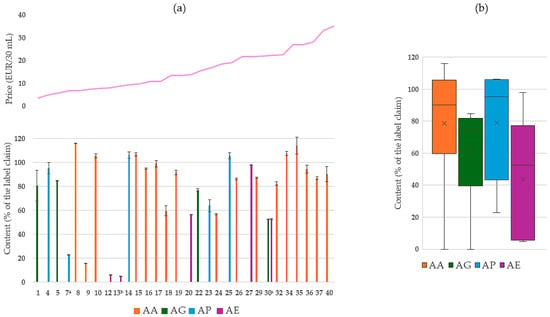
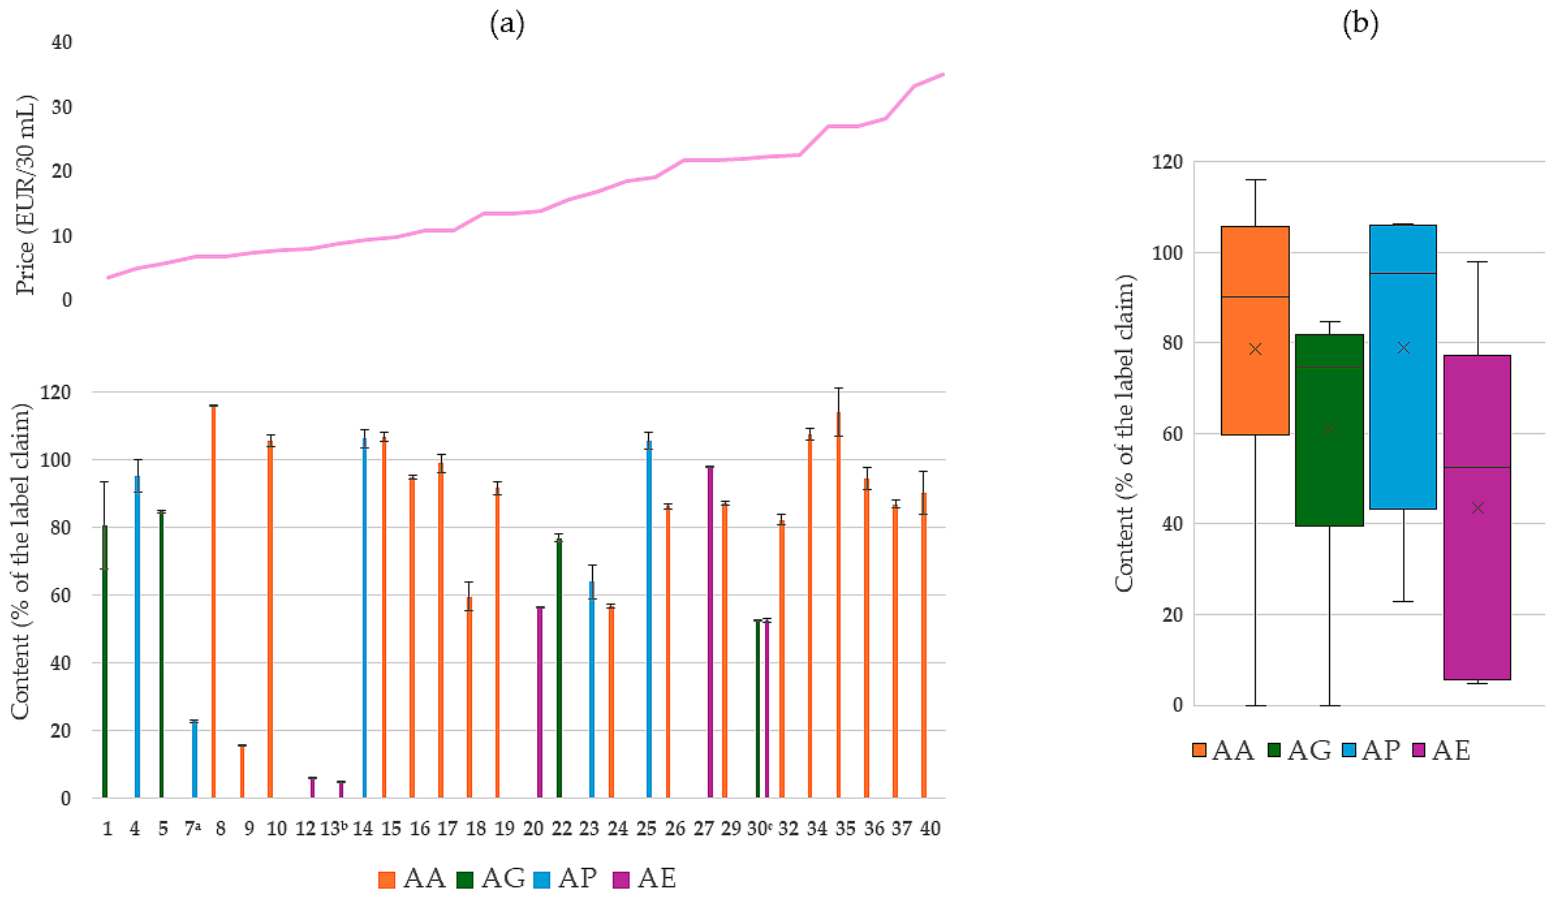
Among the tested cosmetic products, 31 quantitatively specified the content of vit. C. Of these, 29 products specified the content of an individual vit. C form, one product provided content representing the sum of two vit. C forms (AG and AE) and one product did not specify which of the two listed forms (AA and AG) the labeled content referred to. Overall, the content of AA was most frequently labeled, in 20 products, followed by AG, in 5 products, and AP and AE, each in 4 products. The determined contents in these 31 cosmetic products were compared with the amounts stated on the labels, thereby assessing the content-related quality of the tested products. The results, expressed as a percentage of the labels’ claims, were further evaluated in relation to the product price (Figure 5a). The determined contents ranged between 0 and 116% of the label claims for AA, 0–85% for AG, 23–106% for AP, and 5–98% for AE, and showed great variability for all four evaluated vit. C forms (Figure 5b).
Figure 5.
(a) Determined contents of ascorbic acid (AA), ascorbyl 2-glucoside (AG), ascorbyl 2-phosphate (AP), and 3-O-ethyl ascorbic acid (AE) in the 31 tested cosmetic products, with their specified contents in relation to the label claim (%) (average ± standard deviation, n = 3) and their price (EUR/30 mL), shown by the pink line in the upper graph. Products denoted by subscript letters: 7a—AP is contained instead of the labeled AA; 13b—AE is contained instead of the labeled AA and AG; in product 30c, it is not specified which of the two listed forms (AG, AE) the labeled content refers to. (b) Box-and-whisker plot showing the distribution of the determined contents in relation to the label claims. The box represents the interquartile range (IQR), the line inside the box indicates the median, the “×” marks the mean, the whiskers represent the minimum and maximum values, and the points indicate outliers.
3.5. Stability Testing of Standard Solutions and Selected Cosmetic Products Under Long-Term and Accelerated Storage Conditions
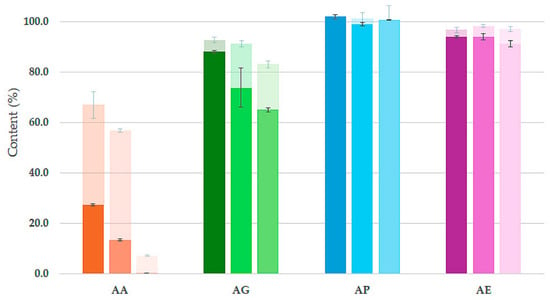
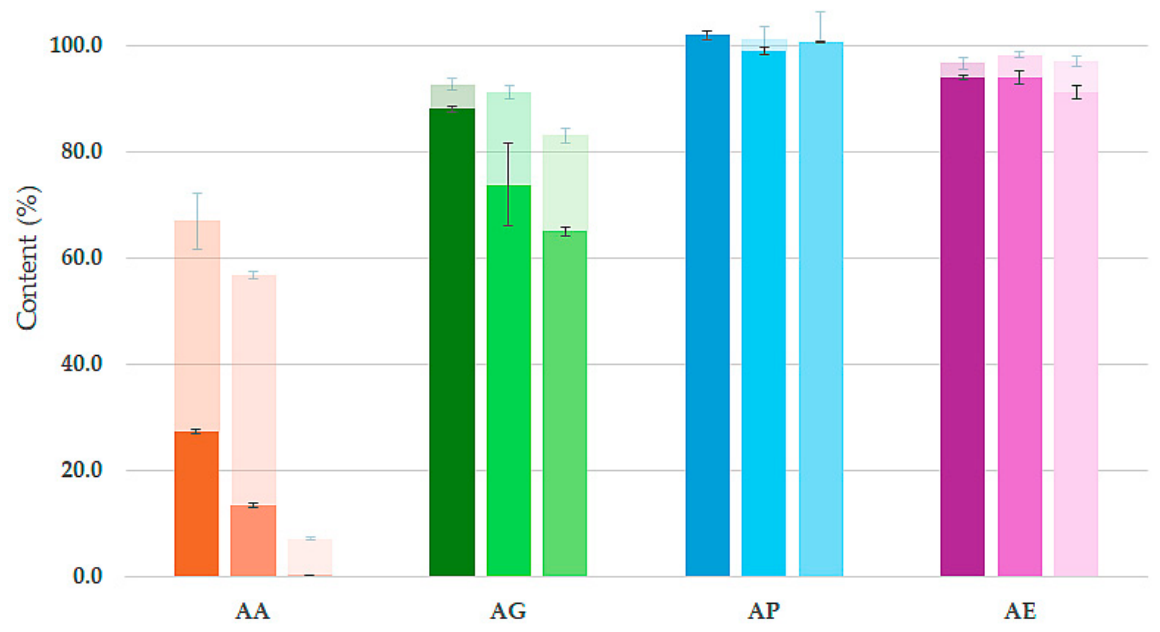
Assessment of the stability of the evaluated vit. C forms was initiated through stability studies of their individual 1% standard solutions in UPW over a four-week period under long-term and accelerated storage conditions. The results, summarized in Figure 6, indicate that among the four evaluated vit. C forms, AA is the least stable, as evidenced by its almost complete degradation after four weeks of storage at both ambient and elevated temperatures. In comparison, the evaluated AA derivatives exhibited considerably better stability. Among them, AG showed the highest degradation, with approximately 17% degradation under long-term conditions (35% under accelerated storage conditions). AP and AE remained stable during the study period under both long-term and accelerated storage conditions, with up to 10% degradation observed for AE under accelerated conditions. In all cases where instability occurred, the influence of temperature was evident (Figure 6).
Figure 6.
Relative change in the remaining content from the initial value (%) (average ± standard deviation, n = 3) of ascorbic acid (AA), ascorbyl 2-glucoside (AG), ascorbyl 2-phosphate (AP), and 3-O-ethyl ascorbic acid (AE) in individual standard solutions (1%, m/V) after 1, 2 (3 in the case of AA), and 4 weeks of storage under accelerated storage conditions (front) and long-term storage conditions (back).
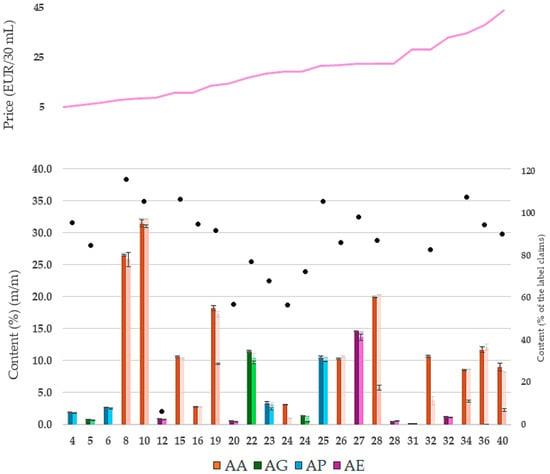
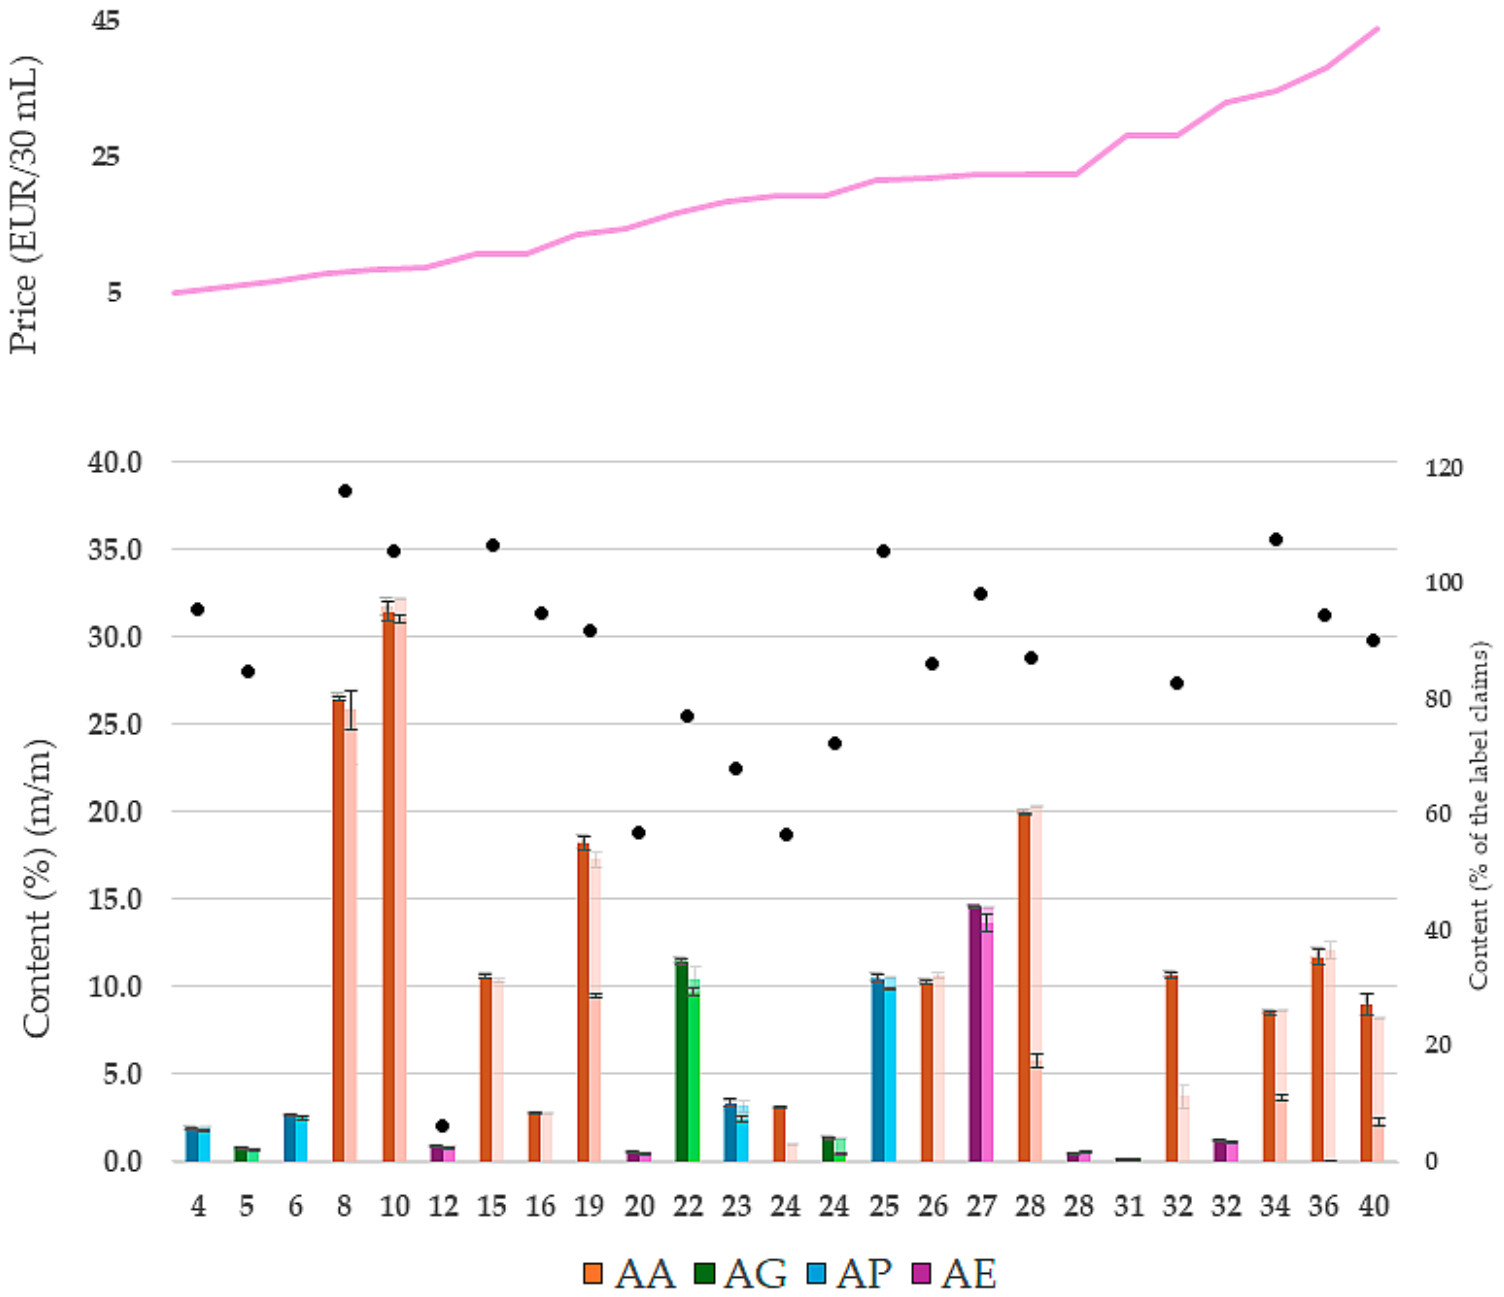
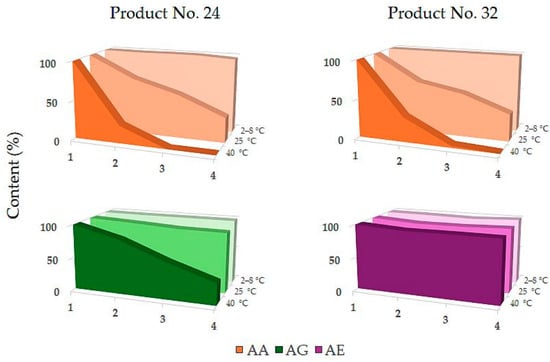
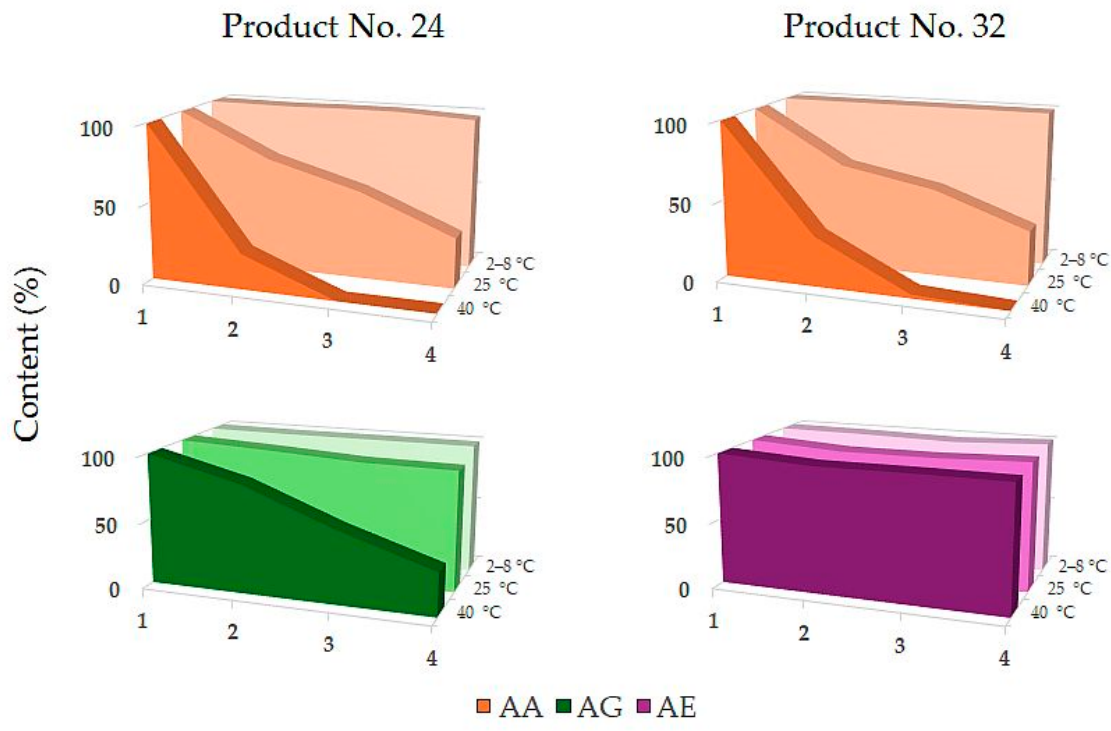
Stability assessment was also extended to a selected range of the analyzed commercial cosmetics, including nine products containing AA, four containing AP, three containing AG, three containing AE, two containing AA and AE, and one containing AA and AG. These products were exposed to long-term and accelerated storage conditions, and the results are summarized in Figure 7. No significant degradation was observed during the four-week period under either long-term or accelerated storage conditions for AP in product No. 4, AA in products No. 8 and 10, AE in products No. 28 and 32, and AG in product No. 31 (Figure 7). The determined contents in these products also correlated well with their label claims (95.5–116.1%). Since storage in a refrigerator is recommended by the manufacturer for cosmetic products No. 24 (containing AA and AG) and 32 (containing AA and AE), stability testing for these two products was also performed at a lower temperature (2–8 °C). The results, presented in Figure 8, together with those obtained at higher temperatures (25 °C and 40 °C), support this recommendation, demonstrating a stabilizing effect of the lower temperature on AA, whereas AG and AE showed no noticeable difference in their stability between 2–8 °C and 25 °C.
Figure 7.
Initial (first bar) and remaining content (%, m/m) (average ± standard deviation, n = 3) of ascorbic acid (AA), ascorbyl 2-glucoside (AG), ascorbyl 2-phosphate (AP), and 3-O-ethyl ascorbic acid (AE) after 4 weeks of storage of selected cosmetic products at 40 °C (front) and ambient temperature (back), shown in relation to their price (EUR/30 mL) (pink line on the upper graph). The black dots indicate the initial determined content in relation to the labeled claim (%) of the analyzed products, except for AP in product No. 6, AE in products No. 28 and No. 32, and AG in product No. 31, which have no declared contents.
Figure 8.
Relative change in the remaining content of ascorbic acid (AA), ascorbyl 2-glucoside (AG), and 3-O-ethyl ascorbic acid (AE) from their initial values (%) after 4 weeks of storage at 40 °C (front), ambient temperature (middle) and 2–8 °C (back).
Along with content determination, the organoleptic properties of the 22 cosmetic products were also assessed as part of the stability study. In products No. 15, 16, 19, 26, 28, 34, 36, and 40 in Figure 7, which contain AA, a gradual change in color from white to yellow was observed, whereas the odor of these products remained unchanged. In products No. 16, 36, and 40, a change in consistency (phase separation or stratification) was also observed.
4. Discussion
The primary purpose of this study was to determine the quality and stability of a diverse sample of commercial cosmetic products containing vit. C available on our market. A review of the commercially available products on our market showed that AA is the most predominant vit. C form used as an active ingredient, followed by its hydrophilic derivatives AP, AG, and AE. This trend has also been reported globally in a market review [16] and by the cosmetic industry [1,20]. Therefore, the focus of this study was on these four vit. C forms, with an emphasis on evaluating their intrinsic stability, as well as their content and stability in commercially available cosmetic products. The foundation for this work is an appropriate analytical method. Because no suitable methods for the simultaneous analysis of AA, AP, AG, and AE in cosmetic products, allowing their assay and stability evaluation, were found in the scientific literature, the first stage of this study was the development and validation of a simple and selective HPLC-UV method. To our knowledge, the developed method is the first reported to provide proper separation of all four hydrophilic vit. C forms used in commercial cosmetics, and it is also suitable for stability evaluation, as demonstrated by its confirmed selectivity in the presence of degradation products. Moreover, the method showed excellent linearity, precision, and accuracy within the expected working ranges as well as sufficient sensitivity, allowing the detection of at least 0.002–0.007% (m/m) of the evaluated analytes in cosmetic products, as shown in method validation (Section 3.2). The selection of an appropriate solvent (0.1 mM EDTA) ensured sufficient stability of the evaluated vit. C forms in the prepared samples, while high sample preparation repeatability and recovery were achieved through the selection and optimization of the sample preparation procedure. Overall, the complete analytical procedure was confirmed as suitable for the evaluation of AA, AG, AP, and AE in commercial cosmetic products and was thus applied for their assay, content-related quality control, and stability evaluation.
Based on a market review, a sample of 41 leave-on facial commercial cosmetic products containing AA, AG, AP, and/or AE in different formulations, price ranges, and points of purchase was selected for analysis (Section 2.6). The selected sample of cosmetic products reflects the distribution of the vit. C forms in products on the market, with AA being the most commonly labeled form, followed by its derivatives: AG, AP, and AE. A key selection criterion was the labeled quantitative content of AA, AG, AP, and/or AE in 31 products, which is a rising trend in the cosmetics market, contributing to increased consumer trust in product quality, yet may be potentially misleading in cases of inappropriate quality, which is generally not routinely monitored. Overall, the sampling strategy, based on a market review and predefined inclusion criteria rather than random sampling, as well as the analysis of a single batch of the tested cosmetic products, which restricted the assessment of batch-to-batch variability and manufacturing-related variations, represent a limitation of this study, which may reduce the representativeness of the sample and the generalizability of the results.
The initial step in the quality control process was to evaluate the actual presence of the labeled vit. C forms in the tested cosmetics, which was confirmed in 32 (78.0%) of the 41 tested products. Labeling inconsistencies in the remaining nine cosmetics were not limited to the lower-priced products (≤10 EUR/30 mL) but were also observed in the highest-priced products (30–90 EUR/30 mL), indicating that price alone is not a reliable indicator of product quality. Overall, the finding that 22.0% of the tested cosmetic products did not contain the labeled vit. C form, and that it had been replaced by another vit. C form (AP or AE) in two of them (Section 3.3), is noteworthy, as prior investigations of specific vit. C forms in smaller samples of cosmetic products have consistently confirmed the presence of the labeled form (AA in eight serums [21], three [22,23] and two cosmetic products [24]; AP in three [23], two [25], and one product [24]; AG in two [26] and one product [23]; and AE in one cosmetic product [27]), except for the study by Wang et al., which revealed the absence of AA in 8 of the 11 analyzed cosmetic products [28]. More generally, comparable or even higher levels of labeling errors and inconsistencies, in up to almost half of the tested cosmetic products, have been reported for other groups of active ingredients in commercial cosmetics, such as other skin-whitening agents [28], retinoids [29,30], and vitamin E and coenzyme Q10 [31], which is concerning and warrants stricter regulation in the cosmetics field.
The detected vit. C forms were also quantified (Figure 3 and Figure 4), generally revealing higher contents than those reported by the industry within the FDA’s Voluntary Cosmetic Registration Program (VCRP), as well as by other researchers. When present, AA was quantified at 2.3–31.7%, with an AV of 11.9% and a median of 10.5% (n = 18). Reported AA contents, provided by the industry, in almost 400 AA-containing formulations, traditionally ranged from 0.00001% to 10% [1], with more recent data indicating contents of up to 17% [20], whereas a majority of the labeled AA contents in the tested product range are well above 10%, with some even above 20%. In research articles, contents of up to 20% have been determined [24], which is often regarded as the upper concentration limit in cosmetics [2,4,21], supported by an in vitro study showing that percutaneous AA absorption increases up to 20%, whereas higher contents result in decreased tissue levels [32]. Therefore, the rationale and effectiveness of using the two cosmetic products with determined AA contents of >20% are questionable and, according to some reports, may be associated with an increased likelihood of irritation [21,33]. Nevertheless, the remaining 89% of the determined AA contents (Figure 3 and Figure 4) fall within concentration ranges with demonstrated efficacy (2–20%) [3,7,34,35], with typical concentrations between 2 and 12% (Figure 4). A similar trend of increasing content was also observed for AP, which was quantified at 0.9–10.6% (AV = 4.2%, median = 3.2%, n = 7), whereas contents up to 3% have been reported by the industry [1,20] and also in research studies [23]. Its clinical efficacy has been shown at concentrations of 1–5% [36,37,38,39], which corresponds well with the contents typically determined in this study (Figure 3 and Figure 4). At higher AP contents up to 10%, no signs of irritation or other adverse effects have been reported [20]. The determined AG contents between 0.03% and 11.5% (AV = 2.0, median = 0.5%, n = 8) also exceed both the previously highest determined AG content (≈2%) [26] and the highest reported content (5%) by the industry [40]. However, most of the tested products contained AG in concentrations below the documented range for clinical efficacy (1.8–5%) [41,42]. One product contained a considerably higher AG concentration (11.5%), which can still be considered safe, owing to its favorable safety profile, with no skin irritation or sensitization observed at concentrations up to 10% [40]. The use of AE (quantified at 0.5–14.7%, with an AV of 3.0 and a median of 0.9%, n = 7) has recently been increasingly embraced in commercial cosmetics. Consequently, it has not been included in the VCRP reports, whereas research articles report its content at around 2% [27]. Due to limited data demonstrating its efficacy only at 10% [43] and 30% [44], the efficacy of the tested products remains uncertain. Also, the safety of these products, especially the one with high AE content (14.8%), is questionable, since several case reports have documented allergic contact dermatitis caused by AE in cosmetic products, with patch testing confirming its potential as a contact allergen at concentrations of 0.05–10% in susceptible individuals [45,46,47,48,49,50,51]. However, all contents reported within the VCRP program, as well as the contents used for efficacy and safety assessment, are based on theoretical concentrations, which may differ significantly from the actual contents, as demonstrated in this study.
The labeled and determined contents were further evaluated with regard to the financial aspect. As shown in Figure 3, products in the lower price range (<10 EUR/30 mL) declared the highest contents (up to 30%), yet the determined contents were typically much lower, by up to 5%, with two exceptions (products No. 8 and 10 in Figure 3). In the medium price range (10–30 EUR/30 mL), contents up to 23% were labeled and the determined contents ranged from 0 to 20%. In the highest price range (>30 EUR/30 mL), more moderate contents (up to 12.5%) were both labeled and contained (0–12%). However, given the occurrence of the two highest determined contents in lower-priced products and the very low determined contents (≤0.05%) in six of the highest-priced products, it can be concluded that price is not a reliable indicator of higher content. This finding contrasts with the observations of a study from Brazil, which reported a positive correlation between AA content and price in a smaller sample of commercially available cosmetic products (n = 8) [21]. Nevertheless, it is consistent with our previous findings on other groups of active ingredients in commercial cosmetics (retinoids [30,31], vitamin E [31], coenzyme Q10 [31], and B-complex vitamins [52]).
The majority of the tested products (75.6%) not only listed and advertised the evaluated vit. C forms as ingredients but also provided quantitative information on their content. For these products, by comparison of the determined contents with their quantitatively stated ones on the products, we evaluated their content-related quality control. For the purposes of the present study, good agreement between the labeled and determined contents was considered as a difference within ±20% of the labeled claim, which was observed in 57.1% of the determined contents. The remaining 42.9% of the analyzed products exhibited substantially lower contents, ranging from 0% to 80% of the labeled claim (Figure 5). One-fifth (20.0%) of the determined contents were below 50% of the labeled claims. Notably, all these products belonged to the lower price range, indicating differences in content-related quality across price ranges, in contrast to other quality attributes, as previously observed in the evaluation of labeling and content. Although reported for other groups of active ingredients (e.g., retinoids [31] and nicotinamide [52]), such discrepancies between the labeled and actual content of vit. C and its forms in commercial cosmetics have not been described. The available studies on smaller sets of products report very good agreement and differences up to 13% between the determined and labeled vit. C content. These include AP in two products [25] and one product [24]; AG in two products [26]; and AA in three serums [22], two products [24], and an additional two products, while in the third product tested in this study, only AA, of the three labeled vitamin C forms, was detected and accounted for ≈50% of the total labeled content [21]. Considering the intrinsic instability of these compounds, a possible reason for the commonly determined lower content than that labeled is their degradation during manufacturing and storage, in addition to inaccuracies in the manufacturing process. Nevertheless, the determined contents of AA, which is the most unstable form, were generally more consistent with the labeled claims than the contents of the other three vit. C forms (Figure 5b). To explore this further, stability studies in standard solutions as well as in cosmetic products containing all four evaluated vit. C forms were further performed.
Stability testing initially encompassed forced degradation testing of individual solutions of the evaluated vit. C forms, which were exposed to typical hydrolytic, oxidative, thermal, and photolytic forced degradation conditions in accordance with ICH guideline Q1A(R2) [17]. The results confirmed the widely recognized instability of AA, evidenced by its almost complete degradation in all tested samples, including the control (Table 2). These results are consistent with previously published data and the known susceptibility of AA to oxidation to dehydroascorbic acid and further degradation products [13]. The findings of the forced degradation study also supported the previously described enhanced stability of the derivatives AG, AP, and AE compared with AA [2,14,15], while additionally providing a quantitative assessment, which has not yet been reported. Their enhanced stability arises from chemical modification of the enediol moiety, which is the primary oxidation site of AA. Substitution at either the C2 position (AP and AG) or the C3 position (AE) decreases the electron-donating capacity of the enediol system, thereby improving oxidative stability compared with AA. As supported by the results, substitution at the C3 position (AE) may provide enhanced oxidative stability compared with AA and C2-substituted derivatives because of the critical role of the C3 hydroxyl group in the formation of monodehydroascorbate and its resonance stabilization [53,54]. Moreover, the findings provide a basis for identifying key factors affecting the stability of the evaluated vit. C derivatives, namely, oxidizing agents in the case of AP, AG, and AE and alkaline conditions in the case of AE and AG (Table 2).
The stability studies were further extended with testing of 22 selected commercial cosmetic products, as well as individual 1% (m/V) AA, AG, AP, and AE standard solutions in UPW, simulating their typical contents in commercial products under long-term and accelerated storage conditions. The stability testing was performed in accordance with ICH Q1A(R2) [17] and Cosmetics Europe guidelines [19]. Consistent with the results from the forced degradation study (Table 2), stability testing of the standard solutions under both long-term and accelerated storage conditions confirmed the intrinsic instability of AA, with complete degradation occurring even under milder conditions (40 and 25 °C) within one month (Figure 6). Compared with AA, the greater stability of the three derivatives, observed in the forced degradation study (Table 2), was also confirmed, as AP and AE remained stable under long-term and accelerated storage conditions, and AG showed a lesser extent of degradation (up to 17% under long-term and 35% under accelerated conditions) (Figure 6). The observed instability also demonstrates the importance and need for appropriate stabilization within the formulation, which was further explored. Moreover, the temperature dependence of the instability (Figure 6) also suggests a potential stabilization approach through storage at lower temperatures, which has recently been implemented by certain manufacturers.
To investigate possible reasons for the lower-than-labeled contents and to assess the efficacy of stabilization within the formulations, additional stability testing was conducted on 22 selected commercial cosmetics. The results are consistent with the findings from the stability study in standard solutions (Figure 6), demonstrating the high susceptibility of AA to degradation in 10 of the 12 tested products, with losses of up to 68% under long-term storage and complete degradation under accelerated storage conditions. Among the three derivatives, AG showed the most pronounced degradation (up to 10% under long-term and up to 67% under accelerated conditions) in three of the four tested products, followed by AP (up to 27% degradation under accelerated conditions), whereas AE remained mostly stable in the tested products, with up to 10% degradation under accelerated conditions. It should be noted that the stability study under accelerated storage conditions was performed in closed plastic tubes instead of the original cosmetic packaging. Applying the same storage conditions to all tested products minimized the influence of different packaging materials and designs and ensured comparability of the results. However, in addition to temperature, other storage conditions (e.g., headspace, oxygen exposure, and packaging material) also differed from those applied in the study under long-term conditions and may have influenced the results. Overall, considering the results from the forced degradation study (Table 2) and the stability testing of the standard solutions under long-term and accelerated storage conditions (Figure 6), the storage temperature was found to particularly affect AA stability in the tested formulations as well. This is evident in Figure 7 and even more clearly demonstrated in Figure 8, which shows the stability of AA, AG, and AE at three temperatures in two cosmetic products for which storage in a refrigerator is recommended by the manufacturer and justified in terms of ensuring AA stability. In addition to temperature, other factors may also affect the stability of the evaluated vit. C forms, such as the time of storage before opening and analysis, repeated exposure to air and light during the study, as well as the packaging material and its properties. Most of the tested products, including all products in the stability study except products No. 12 and 31, were packed in amber containers. Also, most containers were glass bottles. Interestingly, the two most stable products with AA (No. 8 and 10) were packed in plastic containers, indicating that formulation-related factors are likely to play a more important role. Thus, the identification of these two stable products with AA represents a novel insight into the stability of AA in commercial cosmetic products, as a prior study from 2022 reported significant AA degradation (33–87%) within one month of storage at ambient temperature in all eight tested products [21]. Considering that both products are water-free, the improved AA stability is most likely associated with the anhydrous nature of the formulations, which enhances AA stability and indicates that effective AA stabilization can be achieved through appropriate formulation. Since these two products contained the highest determined AA amounts (26.7% and 31.8%) and considering the established concentration dependence of AA stability [55], the initial content of the individual vit. C form was evaluated as a potential factor affecting their stability. Among the remaining ten products with AA (Figure 7), a trend toward improved stability at higher labeled and also actual AA content was observed, although this was not consistent across all products, indicating different levels of stabilization among the formulations. Based on a review of the composition of these products, AA stability was highest in water-free formulations (products No. 8, 10, and 34, Figure 7), followed by oil-in-water emulsions and aqueous solutions, containing co-solvents, such as propanediol and/or other antioxidants and stabilizers (e. g., EDTA, ferulic acid, glutathione, tocopherol, sodium sulfite, and metabisulfite) (products No. 19, 28, and 40 in Figure 7). On the other hand, products No. 15, 16, and 26 (Figure 7), which exhibited the greatest AA degradation, were aqueous solutions without specific stabilizers. In the evaluation of the remaining tested products containing each of the three derivatives AG, AE, and AP, the potential stabilizing effect of their higher initial content could not be confirmed, as the products with the lowest contents were identified as stable. Moreover, in two products with AP (No. 23 in Figure 7) and AG (No. 24 in Figure 7), a greater extent of degradation was observed than in their 1% standard solutions (Figure 6), despite their higher content (3.4% AP and 1.5% AG). Based on the composition of these two water-based formulations, pH adjustment with sodium hydroxide or tromethamine as well as the presence of plant-derived extracts were identified as potential factors contributing to the reduced stability of AG and AP compared with their standard aqueous solutions. However, the potential contribution of these factors remains to be elucidated.
The instability demonstrated in most of the tested products highlights the need for appropriate stabilization, particularly of AA, to ensure sufficient content for product efficacy. It is also the most probable reason for the lower-than-labeled contents observed in products No. 24, 26, 28, 32, 36, and 40 (AA); 24 (AG); and 23 (AP) (Figure 7). However, this does not apply to AE, for which the detected instability in products No. 12 and 20 was not as pronounced as the difference between the labeled and determined contents (Figure 7). Other possible reasons for the lower initial content include manufacturing inaccuracies, incorrect labeling, and batch-to-batch variability, which was not assessed in this study. Considering the financial aspect, as observed in Figure 7, higher prices of cosmetic products do not ensure better stabilization of the contained vit. C forms. This is most clearly illustrated by the extensive (>50%) or even complete AA degradation within 4 weeks of storage under accelerated storage conditions in the highest-priced products (No. 26, 28, 32, 36, and 40; Figure 7). In contrast, no significant degradation was observed in the two most affordable products with AA (No. 8 and 10; Figure 7), indicating that certain manufacturers have addressed the instability issues, despite the low prices of their products.
5. Conclusions
AA is one of the most widely used ingredients in cosmetic products, with various beneficial effects on the skin. Nevertheless, from a formulation perspective, a key limitation is its instability, which has led to increased use of its derivatives, such as AP, AG, and AE. Over the past few years, there has also been a notable increase in cosmetic products that specify the quantitative contents of these vit. C forms. In the absence of regular quality control by the authorities, this study focused on the evaluation of the quality and stability of a comprehensive sample of 41 vit. C commercial cosmetics, available on the Slovenian market, using an original analytical approach based on HPLC-UV, confirmed as appropriate for their assay and stability evaluation. Quality control revealed inappropriate labeling in 22% of the tested products, mostly involving the absence of the labeled vit. C form and contents below 80% of the labeled claim in nearly half (43%), as well as less than 50% of the labeled claim in one-fifth of the 31 tested products with specified content. To assess potential reasons for the determined inappropriate contents, stability testing was performed, initially encompassing forced degradation testing, which confirmed the intrinsic instability of AA and identified key factors affecting the stability of its derivatives, among which AE was found to be most stable. This pattern was also confirmed within stability studies of both standard solutions and selected cosmetic products under long-term and accelerated storage conditions. In general, among the tested cosmetics, AA showed the most frequent and pronounced degradation, which is a likely reason for its inappropriate contents in relation to the label claims. However, as appropriate formulation was shown to ensure sufficient stabilization of the evaluated vit. C forms, especially AA, manufacturers should strive to improve the quality of their cosmetic products through proper formulation design. Furthermore, based on the presented results, stricter control and regulatory measures in the field of cosmetics are warranted to prevent misleading consumers.
Author Contributions
Conceptualization, R.R.; methodology, R.R.; validation, R.R. and Ž.T.R.; formal analysis, Ž.T.R.; resources, R.R.; data curation, Ž.T.R.; writing—original draft preparation, Ž.T.R.; writing—review and editing, R.R. and Ž.T.R.; visualization, Ž.T.R.; supervision, R.R.; project administration, R.R.; funding acquisition, R.R. All authors have read and agreed to the published version of the manuscript.
Funding
This research was funded by the Slovenian Research Agency (ARIS), grant number P1-0189.
Institutional Review Board Statement
Not applicable.
Informed Consent Statement
Not applicable.
Data Availability Statement
Data is contained within the article.
Acknowledgments
The authors thank Laura Kozar, Ajda Šarman, Olivia Samsa, and Alja Podvinšek for their help with the experimental work.
Conflicts of Interest
The authors declare no conflicts of interest.
Abbreviations
The following abbreviations are used in this manuscript:
| AA | Ascorbic acid |
| ACN | Acetonitrile |
| AE | 3-O-ethyl ascorbic acid |
| AG | Ascorbyl 2-glucoside |
| AP | Ascorbyl 2-phosphate |
| AV | Average |
| DL | Detection limit |
| EDTA | Ethylenediaminetetraacetic acid |
| HPLC | High-performance liquid chromatography |
| IQR | Interquartile range |
| No. | Number |
| QC | Quality control |
| QL | Quantitation limit |
| R2 | Coefficient of determination |
| RSD | Relative standard deviation |
| SD | Standard deviation |
| UPW | Ultra-pure water |
| VCRP | Voluntary cosmetic registration program |
| Vit. C | Vitamin C |
Appendix A
Table A1.
Summary of the analyzed cosmetic products with their labeled information (product type and price, labeled vit. C forms, and their declared contents).
Figure A1.
Representative chromatogram of a quality control sample containing ascorbic acid (retention time 1.9 min), ascorbyl 2-glucoside (2.6 min), ascorbyl 2-phosphate (4.9 min), and 3-O-ethyl ascorbic acid (5.9 min) at 254 nm, overlaid with the blank solvent (0.1 mM EDTA in ultra-pure water).
References
- Elimore, A.R. Final Report of the Safety Assessment of L-Ascorbic Acid, Calcium Ascorbate, Magnesium Ascorbate, Magnesium Ascorbyl Phosphate, Sodium Ascorbate, and Sodium Ascorbyl Phosphate as Used in Cosmetics. Int. J. Toxicol. 2005, 24, 51–111. [Google Scholar] [CrossRef] [Scilit] [PubMed]
- Correia, G.; Magina, S. Efficacy of Topical Vitamin C in Melasma and Photoaging: A Systematic Review. J. Cosmet. Dermatol. 2023, 22, 1938–1945. [Google Scholar] [CrossRef] [Scilit] [PubMed]
- Maia Campos, P.M.B.G.; Gonçalves, G.M.S.; Gaspar, L.R. In Vitro Antioxidant Activity and in Vivo Efficacy of Topical Formulations Containing Vitamin C and Its Derivatives Studied by Non-Invasive Methods. Skin Res. Technol. 2008, 14, 376–380. [Google Scholar] [CrossRef] [Scilit] [PubMed]
- Singh, N.; Brown, A.N.; Oscherwitz, M.; Gold, M.H. Vitamin C: Its Role in Cosmeceuticals. Dermatol. Rev. 2025, 6, e70012. [Google Scholar] [CrossRef] [Scilit]
- Kerscher, M.; Meunier, S.; Nachtweide, D.; Geissler, M.; Sundaram, H. Pilot Evaluation of Safety, Efficacy, and Tolerability of a New Topical Formulation for Facial Hyperpigmentation, Combining Ascorbyl Tetraisopalmitate and Crosslinked Resilient Hyaluronic Acid. J. Am. Acad. Dermatol. 2018, 79, AB222. [Google Scholar] [CrossRef] [Scilit]
- Boo, Y.C. Ascorbic Acid (Vitamin C) as a Cosmeceutical to Increase Dermal Collagen for Skin Antiaging Purposes: Emerging Combination Therapies. Antioxidants 2022, 11, 1663. [Google Scholar] [CrossRef] [Scilit] [PubMed]
- Nusgens, B.V.; Colige, A.C.; Lambert, C.A.; Lapière, C.M.; Humbert, P.; Rougier, A.; Haftek, M.; Richard, A.; Creidi, P. Topically Applied Vitamin C Enhances the mRNA Level of Collagens I and III, Their Processing Enzymes and Tissue Inhibitor of Matrix Metalloproteinase 1 in the Human Dermis. J. Investig. Dermatol. 2001, 116, 853–859. [Google Scholar] [CrossRef] [Scilit] [PubMed]
- Alster, T.S.; West, T.B. Effect of Topical Vitamin C on Postoperative Carbon Dioxide Laser Resurfacing Erythema. Dermatol. Surg. 1998, 24, 331–334. [Google Scholar] [CrossRef] [Scilit] [PubMed]
- Kim, K.P.; Shin, K.O.; Park, K.; Yun, H.J.; Mann, S.; Lee, Y.M.; Cho, Y. Vitamin C Stimulates Epidermal Ceramide Production by Regulating Its Metabolic Enzymes. Biomol. Ther. 2015, 23, 525–530. [Google Scholar] [CrossRef] [Scilit] [PubMed]
- Vasanth, S.; Dubey, A.; G.S., R.; Lewis, S.A.; Ghate, V.M.; El-Zahaby, S.A.; Hebbar, S. Development and Investigation of Vitamin C-Enriched Adapalene-Loaded Transfersome Gel: A Collegial Approach for the Treatment of Acne Vulgaris. AAPS PharmSciTech 2020, 21, 61. [Google Scholar] [CrossRef] [Scilit] [PubMed]
- Abbas, M.A.M.; Elgamal, E.E.A.E.; Zaky, M.S.; Elsaie, M.L. Microneedling with Topical Vitamin C versus Microneedling with Topical Insulin in the Treatment of Atrophic Post-Acne Scars: A Split-Face Study. Dermatol. Ther. 2022, 35, e15376. [Google Scholar] [CrossRef] [Scilit] [PubMed]
- Caritá, A.C.; Fonseca-Santos, B.; Shultz, J.D.; Michniak-Kohn, B.; Chorilli, M.; Leonardi, G.R. Vitamin C: One Compound, Several Uses. Advances for Delivery, Efficiency and Stability. Nanomed. Nanotechnol. Biol. Med. 2020, 24, 102117. [Google Scholar] [CrossRef] [Scilit] [PubMed]
- Temova Rakuša, Ž.; Grobin, A.; Roškar, R. A Comprehensive Approach for the Simultaneous Analysis of All Main Water-Soluble Vitamins in Multivitamin Preparations by a Stability-Indicating HPLC-DAD Method. Food Chem. 2021, 337, 127768. [Google Scholar] [CrossRef] [Scilit] [PubMed]
- Enescu, C.D.; Bedford, L.M.; Potts, G.; Fahs, F. A Review of Topical Vitamin C Derivatives and Their Efficacy. J. Cosmet. Dermatol. 2022, 21, 2349–2359. [Google Scholar] [PubMed]
- Austria, R.; Semenzato, A.; Bettero, A. Stability of Vitamin C Derivatives in Solution and Topical Formulations. J. Pharm. Biomed. Anal. 1997, 15, 795–801. [Google Scholar] [CrossRef] [Scilit] [PubMed]
- Lazar, M.; Rajanala, S.; De La Garza, H.; Vashi, N. Consumer Preferences of Topical Vitamin C Products: A Comparative Study. Cureus 2023, 15, e45414. [Google Scholar] [PubMed]
- ICH (International Conference on Harmonisation of Technical Requirements for Registration of Pharmaceuticals for Human Use). Harmonised Tripartite Guideline Stability Testing of New Drug Substances and Products Q1A(R2). 2003. Available online: https://database.ich.org/sites/default/files/Q1A%28R2%29%20Guideline.pdf (accessed on 12 June 2024).
- ICH (International Conference on Harmonisation of Technical Requirements for Registration of Pharmaceuticals for Human Use). Harmonised Tripartite Guideline Q2(R2) Validation of Analytical Procedures. 2023. Available online: https://database.ich.org/sites/default/files/ICH_Q2%28R2%29_Guideline_2023_1130_ErrorCorrection_2025.pdf (accessed on 12 June 2024).
- Publishing Bureau Cosmetics Europe. Guidelines on Stability Testing of Cosmetics CE/CTFA; Publishing Bureau Cosmetics Europe: Brussels, Belgium, 2004; Available online: https://cosmeticseurope.eu/resources/guidelines-on-stability-testing-of-cosmetics-ce-ctfa-2004/ (accessed on 16 May 2022).
- Cosmetic Ingredient Review Expert Panel. Safety Assessment of Ascorbic Acid and Ascorbates as Used in Cosmetics. 2024. Available online: https://www.cir-safety.org/sites/default/files/Ascorbic%20Acid.pdf (accessed on 7 September 2025).
- Pizzo, J.S.; Cruz, V.H.M.; Rodrigues, C.A.; Manin, L.P.; Visentainer, L.; Santos, O.O.; Maldaner, L.; Visentainer, J.V. Rapid Determination of L-Ascorbic Acid Content in Vitamin C Serums by Ultra-High-Performance Liquid Chromatography–Tandem Mass Spectrometry. Int. J. Cosmet. Sci. 2022, 44, 131–141. [Google Scholar] [CrossRef] [Scilit] [PubMed]
- Lavilla, I.; Romero, V.; Costas, P.; Bendicho, C. Kinetic Spectrophotometric Assay for the Determination of Vitamin C in Cosmetics Following Ultrasound-Assisted Emulsification. Anal. Methods 2023, 15, 951–958. [Google Scholar] [CrossRef] [Scilit] [PubMed]
- Balaguer, A.; Chisvert, A.; Salvador, A. Environmentally Friendly LC for the Simultaneous Determination of Ascorbic Acid and Its Derivatives in Skin-Whitening Cosmetics. J. Sep. Sci. 2008, 31, 229–236. [Google Scholar] [CrossRef] [Scilit] [PubMed]
- Chang, M.-L.; Chang, C.-M. Simultaneous HPLC Determination of Hydrophilic Whitening Agents in Cosmetic Products. J. Pharm. Biomed. Anal. 2003, 33, 617–626. [Google Scholar] [CrossRef] [Scilit] [PubMed]
- Shih, Y. Simultaneous Determination of Magnesium L-Ascorbyl-2-Phosphate and Kojic Acid in Cosmetic Bleaching Products by Using a Microbore Column and Ion-Pair Liquid Chromatography. J. AOAC Int. 2001, 84, 1045–1049. [Google Scholar] [CrossRef] [Scilit]
- Lin, C.-H.; Wu, H.-L.; Huang, Y.-L. Combining High-Performance Liquid Chromatography with on-Line Microdialysis Sampling for the Simultaneous Determination of Ascorbyl Glucoside, Kojic Acid, and Niacinamide in Bleaching Cosmetics. Anal. Chim. Acta 2007, 581, 102–107. [Google Scholar] [CrossRef] [Scilit] [PubMed]
- Permana, B.; Hasanah, M.; Tursino. Simultaneous HPLC Determination of Arbutin, Niacinamide and 3-O-Ethyl Ascorbic Acid in Whitening Cream Products in the Presence of Parabens. J. Chromatogr. Sci. 2023, 61, 241–248. [Google Scholar] [PubMed]
- Wang, Y.-H.; Avonto, C.; Avula, B.; Wang, M.; Rua, D.; Khan, I.A. Quantitative Determination of α-Arbutin, β-Arbutin, Kojic Acid, Nicotinamide, Hydroquinone, Resorcinol, 4-Methoxyphenol, 4-Ethoxyphenol, and Ascorbic Acid from Skin Whitening Products by HPLC-UV. J. AOAC Int. 2015, 98, 5–12. [Google Scholar] [CrossRef] [Scilit] [PubMed]
- Vállez-Gomis, V.; Carchano-Olcina, S.; Azorín, C.; Benedé, J.L.; Chisvert, A.; Salvador, A. Simultaneous Quantification of Vitamin A and Derivatives in Cosmetic Products by Liquid Chromatography with Ultraviolet Detection. Separations 2022, 9, 40. [Google Scholar] [CrossRef] [Scilit]
- Temova Rakuša, Ž.; Škufca, P.; Kristl, A.; Roškar, R. Quality Control of Retinoids in Commercial Cosmetic Products. J. Cosmet. Dermatol. 2021, 20, 1166–1175. [Google Scholar] [PubMed]
- Temova Rakuša, Ž.; Roškar, R. Quality Control of Vitamins A and E and Coenzyme Q10 in Commercial Anti-Ageing Cosmetic Products. Cosmetics 2021, 8, 61. [Google Scholar] [CrossRef] [Scilit]
- Pinnell, S.R.; Yang, H.; Omar, M.; Riviere, N.M.; DeBuys, H.V.; Walker, L.C.; Wang, Y.; Levine, M. Topical L-Ascorbic Acid: Percutaneous Absorption Studies. Dermatol. Surg. 2001, 27, 137–142. [Google Scholar] [CrossRef] [Scilit] [PubMed]
- Al-Niaimi, F.; Chiang, N.Y.Z. Topical Vitamin C and the Skin: Mechanisms of Action and Clinical Applications. J. Clin. Aesthetic Dermatol. 2017, 10, 14–17. [Google Scholar]
- Rattanawiwatpong, P.; Wanitphakdeedecha, R.; Bumrungpert, A.; Maiprasert, M. Anti-Aging and Brightening Effects of a Topical Treatment Containing Vitamin C, Vitamin E, and Raspberry Leaf Cell Culture Extract: A Split-Face, Randomized Controlled Trial. J. Cosmet. Dermatol. 2020, 19, 671–676. [Google Scholar] [CrossRef] [Scilit] [PubMed]
- Escobar, S.; Valois, A.; Nielsen, M.; Closs, B.; Kerob, D. Effectiveness of a Formulation Containing Peptides and Vitamin C in Treating Signs of Facial Ageing: Three Clinical Studies. Int. J. Cosmet. Sci. 2021, 43, 131–135. [Google Scholar] [CrossRef] [Scilit] [PubMed]
- Mohammadi, S.; Shokri, J.; Ranjkesh, M.; Akbari Hamed, S.; Monajjemzadeh, F. Comparative Physicochemical Stability and Clinical Anti-Wrinkle Efficacy of Transdermal Emulgel Preparations of 5% Sodium Ascorbyl Phosphate and or Ascorbic Acid on Human Volunteers. J. Cosmet. Dermatol. 2021, 20, 174–180. [Google Scholar] [CrossRef] [Scilit] [PubMed]
- Klock, J.; Ikeno, H.; Ohmori, K.; Nishikawa, T.; Vollhardt, J.; Schehlmann, V. Sodium Ascorbyl Phosphate Shows in Vitro and in Vivo Efficacy in the Prevention and Treatment of Acne Vulgaris. Int. J. Cosmet. Sci. 2005, 27, 171–176. [Google Scholar] [CrossRef] [Scilit] [PubMed]
- Shaikh, Z.I.; Mashood, A.A. Treatment of Refractory Melasma with Combination of Topical 5% Magnesium Ascorbyl Phosphate and Fluorescent Pulsed Light in Asian Patients. Int. J. Dermatol. 2014, 53, 93–99. [Google Scholar] [CrossRef] [Scilit] [PubMed]
- Ruamrak, C.; Lourith, N.; Natakankitkul, S. Comparison of Clinical Efficacies of Sodium Ascorbyl Phosphate, Retinol and Their Combination in Acne Treatment. Int. J. Cosmet. Sci. 2009, 31, 41–46. [Google Scholar] [CrossRef] [Scilit] [PubMed]
- Johnson, W., Jr.; Bergfeld, W.F.; Belsito, D.V.; Klaassen, C.D.; Liebler, D.C.; Marks, J.G., Jr.; Peterson, L.A.; Shank, R.C.; Slaga, T.J.; Snyder, P.W.; et al. Safety Assessment of Ascorbyl Glucoside and Sodium Ascorbyl Glucoside as Used in Cosmetics. Int. J. Toxicol. 2025, 44, 5S–16S. [Google Scholar] [CrossRef] [Scilit] [PubMed]
- Jacques, C.; Genies, C.; Bacqueville, D.; Tourette, A.; Borotra, N.; Chaves, F.; Sanches, F.; Gaudry, A.L.; Bessou-Touya, S.; Duplan, H. Ascorbic Acid 2-Glucoside: An Ascorbic Acid pro-Drug with Longer-Term Antioxidant Efficacy in Skin. Int. J. Cosmet. Sci. 2021, 43, 691–702. [Google Scholar] [CrossRef] [Scilit] [PubMed]
- Huang, W.-Y.; Lee, P.-C.; Huang, L.-K.; Lu, L.-P.; Liao, W.C. Stability Studies of Ascorbic Acid 2-Glucoside in Cosmetic Lotion Using Surface Response Methodology. Bioorg. Med. Chem. Lett. 2013, 23, 1583–1587. [Google Scholar] [CrossRef] [Scilit] [PubMed]
- Loza-Rodríguez, N.; Millán-Sánchez, A.; Mallandrich, M.; Calpena, A.C.; López, O. Lipid-Based Gels for Delivery of 3-O-Ethyl L-Ascorbic Acid in Topical Applications. Pharmaceutics 2024, 16, 1187. [Google Scholar] [CrossRef] [Scilit] [PubMed]
- Zerbinati, N.; Sommatis, S.; Maccario, C.; Francesco, S.D.; Capillo, M.C.; Rauso, R.; Herrera, M.; Bencini, P.L.; Guida, S.; Mocchi, R. The Anti-Ageing and Whitening Potential of a Cosmetic Serum Containing 3-O-Ethyl-l-Ascorbic Acid. Life 2021, 11, 406. [Google Scholar] [CrossRef] [Scilit] [PubMed]
- Yagami, A.; Suzuki, K.; Morita, Y.; Iwata, Y.; Sano, A.; Matsunaga, K. Allergic Contact Dermatitis Caused by 3-o-Ethyl-L-Ascorbic Acid (Vitamin C Ethyl). Contact Dermat. 2014, 70, 376–377. [Google Scholar] [CrossRef] [Scilit] [PubMed]
- Numata, T.; Kobayashi, Y.; Ito, T.; Harada, K.; Tsuboi, R.; Okubo, Y. Two Cases of Allergic Contact Dermatitis Due to Skin-Whitening Cosmetics. Allergol. Int. Off. J. Jpn. Soc. Allergol. 2015, 64, 194–195. [Google Scholar] [CrossRef] [Scilit] [PubMed]
- Victoria-Martínez, A.M.; Mercader-García, P. Allergic Contact Dermatitis to 3-O-Ethyl-L-Ascorbic Acid in Skin-Lightening Cosmetics. Dermat. Contact Atopic Occup. Drug 2017, 28, 89. [Google Scholar] [CrossRef] [Scilit] [PubMed]
- Mamodaly, M.; Dereure, O.; Raison-Peyron, N. A New Case of Allergic Contact Dermatitis Caused by 3-O-Ethyl Ascorbic Acid in Facial Antiageing Cosmetics. Contact Dermat. 2019, 81, 315–316. [Google Scholar] [CrossRef] [Scilit] [PubMed]
- Romita, P.; Foti, C.; Barlusconi, C.; Mercurio, S.; Hansel, K.; Stingeni, L. Allergic Contact Dermatitis to 3-O-Ethyl-L-Ascorbic Acid: An Underrated Allergen in Cosmetics? Contact Dermat. 2020, 83, 63–64. [Google Scholar] [CrossRef] [Scilit] [PubMed]
- Suzuki, K.; Futamura, K.; Nishimura, A.; Matsunaga, K.; Yagami, A. Seven Cases of Allergic Contact Dermatitis Caused by Cosmetics Containing 3-O-Ethyl-L-Ascorbic Acid. Contact Dermat. 2022, 86, 421–423. [Google Scholar] [CrossRef] [Scilit] [PubMed]
- Hamanaka, M.; Kanto, H.; Mikai, H.; Tanaka, H.; Ito, T.; Washizaki, K.; Ishiko, A. A Rare Case of Allergic Contact Dermatitis Caused by 3-O-Ethyl-L-Ascorbic Acid in Skin-Whitening Cosmetics Identified under Immunosuppressive Therapy. Contact Dermat. 2020, 83, 520–521. [Google Scholar] [CrossRef] [Scilit] [PubMed]
- Temova Rakuša, Ž.; Šenk, A.; Roškar, R. Content and stability of B complex vitamins in commercial cosmetic products. J. Cosmet. Dermatol. 2023, 22, 628–636. [Google Scholar] [CrossRef] [Scilit] [PubMed]
- Laroff, G.P.; Fessenden, R.W.; Schuler, R.H. The Electron Spin Resonance Spectra of Radical Intermediates in the Oxidation of Ascorbic Acid and Related Substances. J. Am. Chem. Soc. 1972, 94, 9062–9073. [Google Scholar] [CrossRef] [Scilit] [PubMed]
- Njus, D.; Kelley, P.M.; Tu, Y.-J.; Schlegel, H.B. Ascorbic Acid: The Chemistry Underlying Its Antioxidant Properties. Free Radic. Biol. Med. 2020, 159, 37–43. [Google Scholar] [CrossRef] [Scilit] [PubMed]
- Yin, X.; Chen, K.; Cheng, H.; Chen, X.; Feng, S.; Song, Y.; Liang, L. Chemical Stability of Ascorbic Acid Integrated into Commercial Products: A Review on Bioactivity and Delivery Technology. Antioxidants 2022, 11, 153. [Google Scholar] [CrossRef] [Scilit] [PubMed]

Disclaimer/Publisher’s Note: The statements, opinions and data contained in all publications are solely those of the individual author(s) and contributor(s) and not of MDPI and/or the editor(s). MDPI and/or the editor(s) disclaim responsibility for any injury to people or property resulting from any ideas, methods, instructions or products referred to in the content. |
© 2026 by the authors. Licensee MDPI, Basel, Switzerland. This article is an open access article distributed under the terms and conditions of the Creative Commons Attribution (CC BY) license.