


Highlights
What are the contributions to systems practice, theory, and or methodology?
- This study advances systems methodology by coupling an Undesirable Super-SBM efficiency model with a spatial autocorrelation framework (Global Moran’s I, LISA, Getis-Ord Gi*). This provides a replicable, multi-scale analytical procedure for diagnosing the co-evolution and spatial dependency of two interacting subsystems—green transport and regional economic quality—rather than treating them as isolated units. It introduces an Entropy–CRITIC combined weighting scheme within a dual-system coupling coordination model, reducing subjective bias in measuring multidimensional regional development. This offers a transparent, data-driven protocol for system scientists studying trade-offs between economic output, resource inputs, and environmental constraints in large-scale spatial systems.
What are the main findings and the implications of the main findings?
- Green transport efficiency and high-quality development coordination follow a nonlinear “convergence–divergence” path, with a clear “east-high, west-low” basin pattern. Downstream areas (Yangtze River Delta) form stable high-value spatial clusters, while upstream regions persist as low-value clusters; the mean Global Moran’s I (0.485) confirms strong spatial clustering, indicating that coordination levels are shaped by geographic proximity and infrastructure density. The findings highlight that multidimensional low-carbon policies produce threshold effects (post-2015 rebound in efficiency) and that cross-regional spillovers are incomplete—advanced practices in the east do not smoothly diffuse westward. This underscores the need for multi-level basin governance (e.g., ecological compensation, digital transport corridors) to dismantle administrative barriers and prevent regional “low–low” lock-in, directly informing coordinated river-basin management practice.
Abstract
This study employs panel data from 11 provinces and municipalities along the Yangtze River Economic Belt spanning 2010–2021. It measures green transport efficiency (GTE) using principal component analysis (PCA) and the undesirable Super-SBM model while constructing an economic high-quality development index (HQEDI) through an entropy-weighted CRITIC approach. The study combines coupling coordination degree modeling with spatial autocorrelation analysis (Global Moran’s I, LISA, hotspot/coldspot detection) to empirically investigate their synergistic evolution mechanism. The findings indicate the following: (1) Multidimensional policy combinations exhibit a nonlinear threshold effect on enhancing green transport efficiency, with efficiency significantly rebounding post-2015 as low-carbon policies deepened. (2) High-quality economic development displays a dual-stage ‘convergence-divergence’ pattern, where downstream regions lead in HQEDI but mid- and upstream regions show faster growth in coordination and green dimensions. (3) The coupling coordination degree exhibits pronounced spatial spillover effects, with the global Moran’s I mean reaching 0.485. High-value clusters form in downstream regions, while upstream areas predominantly exhibit low-value clusters, revealing an ‘east-high, west-low’ regional differentiation pattern. (4) The gradient divergence mechanism stems from heterogeneity in infrastructure density, industrial structure, and policy responsiveness elasticity. Accordingly, it is recommended to establish a multi-level governance mechanism to dismantle administrative barriers and to construct a tripartite policy package integrating ‘digital transport, ecological compensation, and industrial radiation’ to advance coordinated basin development.
1. Introduction
Since 1978, the infrastructure-driven development model has promoted China’s economic growth and regional connectivity, and the Yangtze River Economic Belt has gradually become an important economic region linking the eastern, central, and western parts of the country [1]. Transportation infrastructure can provide fundamental conditions for high-quality economic development by improving regional accessibility, reducing transportation and transaction costs, and facilitating the flow of production factors such as capital, labor, and technology. However, the construction of transportation infrastructure and transportation activities also require substantial capital and energy inputs and generate undesired environmental outputs such as carbon emissions [2,3,4]. Therefore, regional transportation development involves not only the improvement of transport capacity and economic output but also the enhancement of resource utilization efficiency and the control of environmental costs.
Against this background, the coupling relationship between regional green transportation efficiency and high-quality economic development reflects the degree of coordination among transportation infrastructure inputs, economic output, resource consumption, and environmental performance. Studying their coupling relationship helps determine whether the growth of regional transportation and economic output is accompanied by simultaneous improvements in resource allocation efficiency and environmental performance [4,5], and provides an analytical basis for evaluating regional sustainable development.
There are significant differences among the upper, middle, and lower reaches of the Yangtze River Economic Belt in terms of transportation infrastructure density, industrial structure, energy utilization, technological capability, and economic development level [1,4]. These differences not only affect regional green transportation efficiency and high-quality economic development but may also influence the degree of coordination between the two. At the same time, cross-regional transportation networks have altered the relationship between transport networks and the spatial layout of industries by promoting the movement of goods, industrial linkages, and technology diffusion [1].
With the application of new transportation infrastructure and low-carbon technologies, smart transportation, multimodal transport, and cross-regional logistics collaboration have gradually improved the efficiency of factor mobility and the utilization efficiency of transportation networks. However, due to differences in industrial foundation, energy structure, and technological conditions across regions, the economic and environmental effects generated by these changes may exhibit significant regional heterogeneity. Therefore, studying the coupling relationship between regional green transportation efficiency and high-quality economic development in the Yangtze River Economic Belt helps reveal the co-evolution and spatial differences among transportation development, resource utilization, environmental performance, and high-quality economic development.
1.1. Establishing a Green Efficiency Measurement System
Existing studies on green efficiency measurement have mainly focused on expanding evaluation dimensions and integrating advanced methods. In terms of theoretical modeling, research has gradually moved beyond traditional efficiency assessment frameworks. Existing studies have applied the Undesirable Super-SBM model to measure provincial green economic efficiency in China, providing a solid methodological foundation for evaluating resource-environmental performance in regional development [3]. A three-dimensional evaluation system for the Yangtze River Economic Belt has been developed by incorporating new infrastructure indicators, including 5G base station density and new energy charging pile coverage [4]. Regarding methodological integration, an improved three-stage DEA model has been applied to evaluate transportation efficiency across 28 Chinese provinces after removing environmental factors and random interference [6]. Energy rebound effects in China’s transportation sector have also been quantified using a CGE model, with comparisons across rail, road, waterway, and air transport subsectors [7]. Regarding emerging factor quantification, intelligent connected vehicle cooperative driving and vehicle–road cooperative systems have been reviewed as important mechanisms affecting traffic efficiency and safety [8], while digital-twin maturity has been proposed as an evaluation framework for port digital-twin solutions [9]. In addition, roadside-unit deployment density and connectivity have been incorporated into intelligent transportation infrastructure planning [10]. However, existing research exhibits limitations in addressing infrastructure indicator redundancy. For instance, although novel metrics were introduced, the multicollinearity issue between road mileage and vehicle ownership was not resolved, thereby creating scope for innovation in optimising indicator systems [11].
1.2. Multiscale Correlation Analysis of Spatial Measurement Methods
Academic discussion has mainly focused on methodological innovation and the analysis of transmission mechanisms. In terms of methodological innovation, existing studies have moved beyond the limitations of traditional single administrative scales. A three-level spatial weight matrix covering the provincial, urban agglomeration, and basin economic belt scales was constructed, and the gradient attenuation pattern of transport efficiency was revealed through Moran’s I decomposition [12]. Using an improved gravity model and network analysis, previous research has shown that the economic attraction radii of Chengdu and Chongqing expanded from more than 50 km in 2005 to over 200 km in 2015, with direct overlap emerging in the intermediate Chengdu–Chongqing area, indicating the gradual formation of an integrated spatial economic pattern [13]. Domestic research has also made progress in multi-scale nested analysis. For example, the geographically and temporally weighted regression model (GTWR) has been applied to examine the “spatio-temporal transition” phenomenon in the Middle Yangtze River urban agglomeration [14]. Panel vector autoregression (PVAR) has been applied to examine the dynamic interaction and impulse-response relationship between tourism development and green development efficiency in 41 cities of the Yangtze River Delta, providing a methodological reference for analysing time-lagged interactions among regional economic, environmental, and transport-related systems [15]. Regarding transmission mechanisms, a spatial simultaneous-equation model was constructed to confirm a bidirectional reinforcing mechanism between green transport efficiency and economic quality [16]. In addition, dynamic spatial panel Durbin models have been applied to evaluate the direct and spillover effects of transport-network advantages on tourism economic efficiency, while smart-waterway studies have further developed evaluation-index systems for assessing the construction effects of digital and intelligent waterway infrastructure [17]. However, existing literature remains limited in examining the interactive transmission mechanisms between basin-scale and administrative-scale systems, particularly lacking dynamic tracking of cross-level spatial spillover effects. This provides an innovative entry point for revealing the complex transport–economy linkages within the Yangtze River Economic Belt. International transport economics provides a mechanism-based explanation of the relationship between transport infrastructure and regional development. Improvements in transport infrastructure can reduce generalised transport costs, expand market access, and facilitate interregional trade, thereby affecting regional income, productivity, and resource allocation [18]. However, the economic benefits of improved connectivity may be distributed unevenly across space. Greater market integration may strengthen industrial agglomeration in core regions while weakening economic activity in some peripheral regions [19]. In addition, transport activities generate external costs, including congestion, carbon emissions, local air pollution, and traffic accidents [20]. Therefore, transport performance should not be evaluated solely in terms of infrastructure expansion or transport output; its spatial distribution effects and resource and environmental costs should also be considered. This perspective provides an international transport economics foundation for examining the coupling relationship between regional green transport efficiency and high-quality economic development.
1.3. Policy Exploration of Regional Coordination Mechanisms
Academic research has mainly focused on the innovation of policy tools and the exploration of spatial adaptation mechanisms. In terms of integrated policy innovation, existing studies have moved beyond the limitations of single policy instruments. The “digital transport empowerment” policy package combines 5G subsidies with carbon trading, thereby achieving synergy between technology diffusion and emission reduction in the Yangtze River Delta [21]. The “tax incentives + decentralised authority + digital declaration” policy mix adopted by the Hainan Free Trade Port reduced enterprise costs by 23%, while Wuxi’s flexible “cooperation first, assessment later” institutional arrangement helped resolve corporate trust crises. In terms of spatial adaptation mechanisms, a “basin governance + enclave economy” framework has been constructed to address interest imbalances in the Yangtze River Economic Belt through inter-provincial ecological compensation [22]. The “institution–space–governance” analytical paradigm has been proposed to explain county-level urban–rural integration by linking institutional adaptation, spatial restructuring, and governance innovation, thereby providing a theoretical framework for improving factor allocation efficiency and reducing institutional frictions [23]. Regarding the optimisation of market mechanisms, empirical evidence based on Chinese provincial panel data shows that logistics density has a significant positive effect on the proportion of e-commerce transactions, with the effect being more pronounced in provinces with more advanced e-commerce development [24]. However, existing research has not yet fully incorporated transportation infrastructure, technological change, market linkages, and regional heterogeneity into a unified analytical framework to systematically examine the coupling relationship between regional green transportation efficiency and high-quality economic development. In particular, the regional differences, spatial correlations, and local agglomeration characteristics of the coordination relationship between the two systems still require further investigation.
Overall, existing research has yielded relatively rich results in optimizing the indicator system for regional green transportation efficiency, identifying spatial correlation characteristics, and analyzing regional coordination mechanisms, laying a theoretical and methodological foundation for studying the coordination relationship between regional green transportation efficiency and high-quality economic development in the Yangtze River Economic Belt. However, the following three limitations remain:
- (1)
- The quantitative representation of new transportation infrastructure in measuring regional green transportation efficiency is still insufficient;
- (2)
- The analysis of multi-scale spatial correlations and their transmission characteristics remains relatively weak;
- (3)
- Under conditions of regional heterogeneity, the comprehensive evaluation of the coupling relationship between regional green transportation efficiency and high-quality economic development is still inadequate.
To address these limitations, this paper conducts research in three main aspects:
First, by combining principal component analysis with the undesirable output Super-SBM model, the information overlap among transportation infrastructure indicators is reduced, and a measurement framework for regional green transportation efficiency suitable for the Yangtze River Economic Belt is constructed.
Second, using the Getis–Ord Gi* and LISA analysis methods, the spatial distribution and local agglomeration characteristics of the coupling relationship between regional green transportation efficiency and high-quality economic development in the Yangtze River Economic Belt are identified.
Third, a dual-system coupling framework for regional green transportation efficiency and high-quality economic development is constructed, and the entropy weight–CRITIC combined weighting method is adopted to reduce the subjectivity of indicator weighting, thereby providing a methodological basis for analyzing the coordinated evolution and regional differences in the two systems.
2. Theoretical Analysis and Hypothesis Formulation
2.1. The Evolutionary Mechanism of Green Transport Efficiency in Transportation Along the Yangtze River Economic Belt: A Policy Mix-Driven Approach with Regional Heterogeneity
As the core implementation zone for China’s dual carbon strategy, optimising the green transport efficiency within the Yangtze River Economic Belt represents a pivotal challenge in balancing economic growth with ecological conservation [25]. Drawing upon green transportation theory and a regional heterogeneity perspective, this study systematically analyses the evolution of green transportation efficiency in the Yangtze River Economic Belt from 2010 to 2021. This helps reveal the revelation of the dynamic interplay between multi-dimensional policy combinations and institutional-technological coordination mechanisms, providing theoretical underpinnings for differentiated policy design.
In the context of the Yangtze River Economic Belt, green transport theory provides a systematic framework for evaluating the green efficiency of transportation. It explains the dynamic balance among infrastructure investment, energy consumption, and environmental load. Green transport theory emphasises the synergy between economic activities and environmental protection, advocating the ecological transformation of the transportation system through technological innovation, resource optimisation, and institutional constraints [26]. Its core dimensions include transport efficiency indicators, environmental performance, economic viability, and sustainable development capacity. In terms of transport efficiency indicators, including transport efficiency, warehousing efficiency, and information efficiency, regional differences in logistics efficiency in the Yangtze River Economic Belt have been verified using the DEA-Malmquist index model [27]. Regarding environmental performance, including carbon emission control and pollution governance, studies on the transportation sector of the Yangtze River Economic Belt have shown that energy structure optimisation, clean energy substitution, transportation structure adjustment, and organisational efficiency improvement are key pathways for reducing transport-related carbon emissions [28]. In terms of economic viability and sustainable development capacity, producer services agglomeration has been shown to improve urban green development performance in the Yangtze River Economic Belt, indicating that transport-related service agglomeration and resource allocation can contribute to regional green efficiency improvement [29].
The policy lifecycle theory posits that policies exhibit phased effects from formulation through implementation, evaluation, and adjustment. The inherent lag in policy execution creates a temporal discrepancy between infrastructure integration targets outlined in documents such as the Yangtze River Economic Belt Development Plan and the long-term nature of transport infrastructure projects (e.g., railway network construction cycles), rendering short-term investments difficult to translate into efficiency gains. As policies evolve from ‘input-driven’ to ‘outcome-oriented’ approaches, macro-level interventions—including mandatory emission reduction standards, new energy promotion, and market-based incentives (e.g., carbon trading)—accelerate technological substitution and industrial restructuring, thereby driving a rebound in green efficiency.
The interplay between institutional change (such as strengthened environmental regulations) and technological diffusion (such as the proliferation of new energy vehicles) is pivotal to enhancing green efficiency. Institutions compel enterprises to adopt green technologies through mandatory standards (e.g., pollutant emission limits) and incentive measures (e.g., subsidies), while technological maturity influences policy implementation outcomes. For instance, downstream regions with stronger economic foundations and greater capacity to attract technological resources are more responsive to formal environmental regulation, thereby forming a virtuous cycle of “institutional guidance–green technological innovation–efficiency enhancement” [30].
The disparate endowments across the upper, middle, and lower reaches of the Yangtze Economic Belt (such as resource distribution, economic structure, and technological reserves) inevitably lead to spatially differentiated evolution of green efficiency. Upper-reach regions (Chongqing, Sichuan, etc.), dominated by heavy industry and highly reliant on traditional energy sources, require cross-regional coordination (e.g., hydropower development) for green transition. Middle-reach regions (Hubei, Hunan, etc.), leveraging the Yangtze’s golden waterway, possess significant potential for integrating port logistics and multimodal transport, while the economically advanced downstream regions (Shanghai, Jiangsu, etc.) hold advantages in clean technology adoption and digitalised management. Regional heterogeneity theory underscores the necessity for tailored policy instruments, avoiding one-size-fits-all governance approaches.
Hypothesis H1.
A non-linear threshold effect exists for the enhancement of green transport efficiency within the Yangtze River Economic Belt through multi-dimensional policy combinations, with significant regional heterogeneity.
2.2. Spatial and Temporal Differentiation in High-Quality Economic Development of the Yangtze River Economic Belt Driven by Regional Heterogeneity and Policy Synergy
As a strategic engine for Chinese-style modernisation, the Yangtze River Economic Belt shoulders the historic mission of prioritising ecology, pursuing green development, and fostering regional coordination. Guided by General Secretary Xi Jinping’s directive to ‘step up conservation of the Yangtze River and stop its over development’, the 11 provinces and municipalities along the river have forged a high-quality development framework characterised by ‘interregional linkage between eastern, central and western zones, and upstream-downstream coordination’ through institutional innovation, industrial upgrading and ecological restoration [31]. Nevertheless, deep-seated contradictions such as regional industrial homogeneity and barriers to factor mobility remain to be resolved. Multidimensional policy coordination is required to accelerate the cultivation of new productive forces, thereby offering a Chinese solution for global river basin governance [32].
The theory of uneven development emphasizes the asynchronous nature of regional economic growth, positing that disparities in resource endowments, policy orientations, and historical accumulation inevitably lead to spatial differentiation [33]. According to Myrdal’s circular causation theory [34], downstream regions leverage first-mover advantages (such as the Yangtze River Delta’s industrial base and open policies) to generate a ‘backflow effect’, attracting capital, talent, and other factors from mid- and upstream regions, thereby widening regional disparities. Meanwhile, mid- and upstream regions accelerate their catch-up through the ‘diffusion effect’ under policy inclinations (e.g., the Western Development Strategy) and technological diffusion [35].
The gradient transfer theory posits that the sequential transfer of industries and technologies along a ‘downstream → midstream → upstream’ gradient constitutes a pivotal pathway for coordinated regional development [36]. In the governance of the Yangtze River Economic Belt, networked governance mechanisms have been proposed to integrate multiple actors and promote collaborative governance, including multi-level governance, inter-regional partnership governance, and ecological compensation mechanisms [37]. However, regionally fragmented development patterns (e.g., Chengdu-Chongqing and Yangtze River Delta operating independently) lead to industrial homogeneity and resource misallocation, suppressing overall efficiency [38]. Empirical evidence from spatial economic models (e.g., SBM-undesirable) indicates that the Yangtze River Economic Belt must transition towards regional economic integration. This requires overcoming agglomeration barriers through transport connectivity and factor pooling (e.g., multimodal transport integration in the middle reaches) [39].
The theory of regional synergistic integration emphasises dismantling administrative barriers and market segmentation to establish mechanisms for ‘inter-provincial consultation, ecological co-governance, and shared benefits’. Downstream regions employ institutional-technological coordination (such as carbon trading markets and digital governance) to form policy combinations of ‘mandatory emissions reductions coupled with innovation incentives’, while mid- and upstream regions rely on cross-regional compensation mechanisms (such as hydroelectric development revenue sharing and ecological transfer payments) to offset resource disadvantages [40].
Hypothesis H2.
Regional disparities in high-quality economic development along the Yangtze River Economic Belt exhibit a dual-stage pattern of ‘convergence-divergence’, with spatial adaptation thresholds for multi-dimensional policy coordination.
2.3. Regional Heterogeneity and the Coupling Between Regional Green Transport Efficiency and High-Quality Economic Development in the Yangtze River Economic Belt
High-quality economic development refers to the comprehensive advancement of the economy across multiple dimensions, including sustainability, innovation and equity, with a focus on social and environmental benefits [41]. However, due to geographical, resource, cultural, and policy disparities within the region, economic development exhibits marked imbalances across different areas.
According to regional economics theory, the formation of economic disparities is typically closely linked to factors such as natural resource endowments, industrial development foundations, historical legacies, and regional policies [42]. For instance, eastern regions like Shanghai, Jiangsu, and Zhejiang are relatively economically developed with higher levels of economic advancement, whereas central and western regions such as Chongqing, Yunnan, and Guizhou face more severe resource constraints and economic underdevelopment.
The theory positing that regional economic disparities exhibit a dual-stage pattern of ‘convergence-divergence’ is grounded in two distinct developmental pathways: the ‘convergence hypothesis’ and the ‘divergence hypothesis’. The convergence hypothesis contends that as economies develop, lower-income regions can narrow the economic gap with more developed areas to some extent through resource flows, technology diffusion, and institutional innovation. Conversely, the divergence hypothesis emphasises that as economic structures become increasingly complex and industrial tiers advance, regional disparities may widen due to factors such as technological innovation, industrial concentration, and market mechanisms [43].
In the practical case of the Yangtze River Economic Belt, early-stage economic development relied heavily on efficient resource utilisation and growth in labour-intensive industries, creating a significant gap between the eastern and central-western regions. However, with the state’s emphasis on high-quality economic development in this region and policy initiatives in infrastructure construction, industrial transformation, and ecological governance, convergence in economic growth was achieved to a certain extent across different areas [44]. In later phases, however, regional disparities within the Yangtze River Economic Belt have tended to diverge. This is attributable to the diversification of industrial structures across regions and variations in innovation-driven development strategies. Particularly in certain cities within the central and western regions, weak industrial foundations and a scarcity of innovation resources have hindered their ability to keep pace effectively with the eastern regions, thereby exacerbating inter-regional disparities [45].
Multidimensional policy coordination refers to the synergistic implementation of economic, social, environmental and other policies to advance coordinated regional development. Based on the State Council’s 2024–2025 Energy Conservation and Carbon Reduction Action Plan, within the context of the Yangtze River Economic Belt, policy coordination encompasses not only central government macro-regulation but also the harmonisation of local government industrial policies, innovation support measures and ecological conservation initiatives. Policy coordination can foster regional economic development across various levels, particularly in technological innovation, infrastructure construction, and green development, thereby providing robust support for high-quality economic growth. However, the effectiveness of policies within the Yangtze River Economic Belt varies across different regions. The theory of spatial adaptation thresholds indicates significant disparities in economic potential, industrial structure, and innovation capacity between regions, rendering single policies often incapable of achieving universal adaptation. For instance, under the innovation-driven development strategy, eastern coastal regions can achieve substantial economic value-added through emerging sectors like high-tech industries and green energy. Conversely, central and western regions, with weaker industrial foundations, struggle to fully benefit from such policies. Consequently, policy synergies exhibit spatial adaptation thresholds: only when policies attain a certain degree of adaptation within specific regions can they effectively stimulate local economic growth [42].
Hypothesis H3.
The coordinated coupling between green transport efficiency and the economic high-quality development index can enhance regional resource allocation efficiency in the Yangtze River Economic Belt through spatial spillover effects, thereby optimising overall sustainable development levels.
3. Research Design
3.1. Evaluation System Development and Data Sources
3.1.1. Establishing a Green Efficiency Assessment Framework for Transport in the Yangtze River Economic Belt and Identifying Data Sources
This study will establish a multidimensional input-output indicator system based on factor theory and existing research findings [4]. Data sources include the China Statistical Yearbook, provincial (municipal) statistical yearbooks, the China Fixed Asset Investment Statistical Yearbook, the China Energy Statistical Yearbook, and the China Transport Statistical Yearbook. Input indicators will comprehensively encompass the three core factors: capital, labour, and energy consumption. To further refine the indicator system, this study transcends the traditional three-factor framework by incorporating infrastructure (railways/highways/waterways)—the ‘skeletal system’ underpinning industry operations—and transport equipment (vehicles/vessels)—the ‘operational tools’—into the input framework. Expected output indicators adopt a dual material-economic perspective: cargo turnover represents the physical output intensity of transport services, while industry value added measures economic value creation, forming complementary observations. Unexpected output focuses on the environmental dimension, with carbon emissions as the core indicator. This approach quantifies the atmospheric environmental impact of transport activities while aligning with policy evaluation requirements for international emission reduction commitments. The Green Transport Efficiency (GTE) evaluation framework for the Yangtze River Economic Belt is illustrated in Figure 1.
Figure 1.
Green Transport Efficiency Evaluation Indicator System for Transport in the Yangtze River Economic Belt.
As shown in Figure 1, the system contains numerous secondary indicators for input metrics, with some information overlap between transport infrastructure and transport equipment. For instance, there is often a reciprocal relationship between road mileage and the number of transport vehicles in operation. Generally, the number of decision units should exceed the number of indicators to ensure the validity of the evaluation. Therefore, it is necessary to limit the number of input-output indicators. This approach helps reduce the data processing burden and minimise multicollinearity, thereby avoiding excessive computational complexity and evaluation results that are difficult to interpret. Principal Component Analysis (PCA) is employed to optimise the two categories of input indicators: transport infrastructure and equipment investment. The specific approach involves performing dimension reduction optimisation via PCA on the five secondary indicators X5, X6, X7, X8, and X9 listed in Figure 1. Drawing upon prior literature experience [46,47], the cumulative variance explained threshold is set at 85% to determine the number of principal component factors. Ultimately, these five secondary indicators were condensed into two new secondary indicators (PCNT1 and PCNT2), which were incorporated into the Undesirable Super-SBM model to calculate the green transport efficiency values for each province (municipality) within the Yangtze River Economic Belt.
3.1.2. Construction of the Indicator System and Data Sources for the High-Quality Development Index of the Yangtze River Economic Belt
In this study, high-quality economic development is defined as a multidimensional state of regional development in which technological progress, efficient factor allocation, and structural transformation sustain improvements in economic output and productivity [48], while promoting structural coordination, resource and environmental efficiency, market connectivity, and broadly shared social welfare [49]. It therefore differs from the mere expansion of GDP or economic scale by emphasising the efficiency, structure, sustainability, openness, and inclusiveness of economic development. The construction of the indicator system for high-quality regional economic development in the Yangtze River Economic Belt mainly draws on existing studies on high-quality economic development evaluation [50,51,52]. Data sources include the China Statistical Yearbook, National Annual Report on Science and Technology Statistics, Annual Report on Fixed Asset Investment Statistics, National Annual Report on Technology Market Statistics, Transport Statistics Yearbook, China Fiscal Statistics Yearbook, China Energy Statistics Yearbook, China Environmental Statistics Yearbook, China Customs Statistics Yearbook, China Foreign Economic and Trade Statistics Yearbook, China Marketisation Index Report, and China Labour Statistical Yearbook. Against the backdrop of green transport enablement, the measurement indicators for the HQEDI of the Yangtze River Economic Belt were optimised. A multi-dimensional evaluation system for high-quality economic development in the Yangtze River Economic Belt under green transport enablement was constructed, focusing on five key dimensions: innovation, coordination, green, openness, and sharing. The HQEDI indicator system was not constructed by directly transferring a general regional development index into the present study. Instead, each indicator was reviewed according to its specific role in the transport–economy relationship. An indicator was retained only when it represented at least one of three functions: an enabling condition for transport-related economic development, a transmission channel through which transport accessibility and mobility affect regional development, or an economic, environmental, or distributive outcome associated with transport development. The retained indicators were also required to perform a conceptually distinct role from the input–output variables used to calculate regional green transport efficiency.
On this basis, the five HQEDI dimensions correspond to five transport–economy mechanisms. The innovation dimension captures the capacity to generate, absorb, and commercialise technologies that improve transport, logistics, energy efficiency, and productivity. The coordination dimension reflects the spatial, industrial, fiscal, and energy adjustments associated with transport-network development and improved accessibility. The green dimension evaluates whether transport-supported economic activity is accompanied by lower environmental pressure. The openness dimension captures the effects of transport connectivity on trade, external investment, market allocation, and factor mobility. The sharing dimension assesses whether improvements in accessibility are translated into labour income, household welfare, reduced urban–rural disparities, and broader access to public transport and essential services.
The HQEDI is conceptually distinct from regional green transport efficiency. Regional green transport efficiency measures the technical efficiency with which the transport sector converts capital, labour, energy, infrastructure, and equipment into desirable transport and economic outputs while controlling carbon emissions. The HQEDI instead evaluates the broader regional conditions and socioeconomic outcomes associated with transport development. Accordingly, transport-related indicators in the HQEDI are interpreted as measures of accessibility, structural adjustment, environmental burden, or welfare distribution rather than as repeated measures of transport-sector production efficiency. This system comprises five primary indicators and 23 secondary indicators. The final indicator system results are presented in Figure 2.
Figure 2.
High-Quality Development Indicator System for the Yangtze River Economic Belt.
3.2. Empirical Model
3.2.1. Green Transport Efficiency Measurement Model and Analytical Method for Transportation in the Yangtze River Economic Belt
Data Envelopment Analysis (DEA) is applicable for measuring the efficiency of production systems involving multiple inputs and outputs. Consequently, it has been widely adopted by researchers [53] and rapidly developed and optimised into the non-radial Slack-Based Measure (SBM) model. Building upon the non-radial SBM model, this study introduces the Super-SBM model. This model’s advantage lies in its capacity to account for more complex production processes and market demand uncertainties. The efficiency values it yields are no longer constrained by an upper limit of 1, thereby facilitating inter-regional comparative analysis. Considering unexpected outputs, this study ultimately selected the Undesirable Super-SBM model as the framework for measuring regional transport green efficiency [54].
To address partial data gaps in the original dataset, linear interpolation was employed for supplementation. Transport energy consumption and carbon emissions data were derived from the China Energy Statistical Yearbook 2022. Transport carbon emissions were calculated by standardising various energy sources using the standard coal conversion factors published in the China Energy Statistical Yearbook, establishing this as the baseline for transport sector energy consumption. This was further adjusted to reflect China’s specific energy structure characteristics. Employing carbon emissions as the environmental constraint, this study adopts the top-down carbon emission estimation methodology based on final energy consumption; the calculation formula is as follows [4]:
In Formula (1), ρ denotes the green transport efficiency of regional transport; the subscript i represents the i-th input indicator, where m is the number of input indicators; q1 is the number of output indicators, q2 is the number of unexpected output indicators, r denotes the r-th output indicator, t denotes the t-th unexpected output indicator, j denotes the j-th region, and n denotes the number of regions. λj represents the weighting of the j-th regional evaluation indicator; k denotes the designated region; yg denotes the output indicator value for the transport sector; yq denotes the transport sector’s green expected output matrix; yb denotes the transport sector’s green unexpected output matrix; s− denotes the slack variable for the input indicator of the regional transport sector; sg+ represents the slack variable for the expected output; sb− denotes the slack variable for the unexpected output indicator; xik indicates the i-th input indicator under the k-th region; yrk denotes the r-th output indicator under the k-th region; ytk represents the unexpected output indicator for the k-th region at time t; xij denotes the i-th input indicator for the j-th region; srg+ denotes the slack variable corresponding to the rth desired output indicator, yrkg denotes the r-th expected output matrix for region k, ytjb denotes the matrix of slack variables corresponding to the t-th unexpected output indicator in the j-th region, sib− denotes the slack variable matrix for the i-th unexpected output indicator, ytkb denotes the slack variable matrix for the k-th region’s t-th unexpected output indicator.
Carbon emission data can be obtained through the standardized conversion of energy types using the standard coal conversion coefficient issued by the China Energy Statistical Yearbook. These data serve as the basis for energy consumption in the transportation industry and are combined with China’s energy structure. The carbon emission index is used as an environmental constraint, referencing Zhang Shining’s “top-down” carbone mission measurement method based on terminal energy consumption [55].
In Formula (2), T denotes the cumulative CO2 emissions from the transportation sector; denotes the energy type; represents the consumption of energy type ; is the corresponding carbon emission factor; denotes the average lower heating value of energy type ; represents the carbon content per unit of calorific value; and is the carbon oxidation rate.
3.2.2. Calculation Model and Analytical Methodology for the High-Quality Economic Development Index (HQEDI) of the Yangtze River Economic Belt
The CRITIC method, formally known as the Criteria Importance Through Intercriteria Correlation method, is an objective weighting approach for multi-criteria decision-making [56]. It determines indicator weights by jointly considering the contrast intensity of each criterion and the conflict among criteria, thereby reducing the influence of subjective judgement and improving the objectivity of weight allocation. Its core principle involves establishing weights by evaluating the conflicts and complementarities among various indicators, aiming to reduce the influence of subjective judgements on weight assignment and enhance the objectivity and accuracy of evaluation outcomes. To achieve a more comprehensive measurement of regional economic high-quality development indices, this study integrates the Entropy Weighting Method and the CRITIC Weighting Method through the Information Content Weighting Method, forming a hybrid approach: the Information Content Weighting-based Entropy-CRITIC Weighting Method. This approach combines the Entropy Weighting Method’s reflection of data information content with the CRITIC Weighting Method’s consideration of data interrelationships. This approach reduces subjectivity, more comprehensively reflects decision-makers’ preferences, and balances data volatility and correlation, thereby enhancing the accuracy of weight allocation.
Based on the indicators and corresponding data sources listed in Figure 2, this study collected indicator data for 11 regions across the upper, middle, and lower reaches of the Yangtze River Economic Belt from 2010 to 2021. Subsequently, the entropy weighting method was employed to calculate the indicator weights wentropy, followed by the CRITIC weighting method to compute the indicator weights wcritic. Based on these two sets of weights, the comprehensive evaluation score S for each indicator was determined, and the mean μ of the composite scores was calculated. The coefficient of variation was then calculated, as shown in Formula (3).
The weight λ entropy is calculated as the percentage of each indicator’s coefficient of variation relative to the total coefficient of variation. Finally, the comprehensive weight is obtained using the entropy-weighted CRITIC weighting method (see Equation (4)).
The economic high-quality development index is the weighted average of all indicators weighted by their respective weights.
3.2.3. Coupling Coordination Degree Calculation Model and Spatial Correlation Analysis Method
The coupling coordination degree model is used in this study as a descriptive composite-index method for assessing the relative balance and joint development level of regional green transport efficiency and high-quality economic development. The coupling degree C measures the numerical balance between the two normalised subsystem scores, whereas the comprehensive development index T reflects their weighted overall development level. The coupling coordination degree D combines these two components to distinguish balanced but low-level development from coordination at a relatively high development level. The evaluation basis is shown in Table 1. These measures describe the relative coordination status of the two subsystems within the study sample; they do not directly identify substantive interaction, direction of influence, or causal relationships between them.
Table 1.
Coupling Coordination Evaluation Criteria Table.
Combining the assessment results of green transport efficiency within the Yangtze River Economic Belt with those of the economic high-quality development index, this study employs a coupling coordination model to quantitatively analyse the relationship between green transport efficiency and economic high-quality development within the Yangtze River Economic Belt. Utilising spatial correlation models and hotspot/coldspot models, it reveals the spatio-temporal characteristics of their coupling coordination, thereby providing theoretical foundations for promoting the coordinated development of transportation and economic high-quality growth in the region. The specific approach and methodology are as follows:
Firstly, the coupling degree model is established as follows [57]:
In Formula (5): represents the green efficiency value of transportation, denotes the high-quality economic development index, n is the number of subsystems (units), and i is the value for each subsystem. As their distribution range is [0, 1], the coupling degree (C value) also falls within the interval [0, 1].
Secondly, to address scenarios where high coupling may occur despite all subsystems operating at low levels within the coupling model, and to overcome the limitation that coupling degree fails to reflect the directionality of influence, a coordination degree model is introduced. This model analyses the degree of coordination between regional green transport efficiency and high-quality economic development. The coordination degree model is as follows:
In Formula (6), the coordination degree T measures the consistency and coordination of operations among subsystems or components within the system. A higher coordination degree indicates greater harmony in the system’s internal functioning. represents the system weighting; denotes the green efficiency value for transport; signifies the high-quality economic development index.
In the coupling coordination degree model, the weighting parameters α (green transport efficiency value of transportation) and β (economic high-quality development index) are each set at 0.5. This equal weighting allocation is based on two grounds: firstly, from a systemic equilibrium perspective, green transport efficiency and high-quality economic development constitute the two core pillars of regional sustainable development. The former embodies the sector’s transformative efficacy under resource and environmental constraints, while the latter reflects the quality of economic growth and enhancement of social welfare, both holding equal strategic importance; secondly, theoretically, following the classical paradigm of coupling coordination modelling, when no significant dominant-subordinate relationship exists between subsystems, symmetrical weighting minimises the interference of researchers’ subjective judgements on the model’s objectivity. This approach has become a consensus application principle in studies of the co-evolution of transport and economic systems. Hence, the final weights are set as .
Finally, a coupling coordination degree model is introduced to describe the mutual equilibrium and coordination between different systems or elements. This coupling coordination degree model is expressed as in Equation (7):
Previous studies have noted that the coupling coordination degree model is sensitive to formula specification, weighting, indicator construction, and classification thresholds, and may produce high coupling values when both subsystems remain underdeveloped [57]. To mitigate these concerns, this study uses the complete formulation, reports all coefficients and weights, interprets D rather than C alone, and applies consistent indicators and procedures across all provinces and years. Equal weighting is treated as a transparent assumption, and the resulting categories as descriptive intervals. The results are therefore used for within-sample comparison rather than causal inference or direct cross-study comparison.
Spatial autocorrelation analysis constitutes one of the fundamental methodologies within theoretical geography, effectively revealing the spatial distribution characteristics of green efficiency in regional transport systems alongside inter-regional interdependencies. This method typically employs Moran’s I, which is widely used to measure spatial autocorrelation [11]. The Moran’s I index reflects the statistical correlation of specific attribute values across space, primarily categorised into Global Moran’s I and Local Moran’s I. Global Moran’s I is employed to analyse whether spatial correlation exists across the entire dataset. Should Global Moran’s I indicate statistical significance, Local Moran’s I may be further examined to investigate spatial autocorrelation within specific areas.
Global Moran’s I provides an overall assessment of spatial autocorrelation but does not reveal specific spatial autocorrelation between individual regions. Local Moran’s I measures spatial correlation between different areas, serving as a distance-weighted matrix-based indicator of local spatial autocorrelation. As a decomposition of Global Moran’s I, it detects clusters of high and low values while describing the similarity between a spatial unit and its neighbourhood. To further analyse the spatial associations and variation in regional transport green efficiency, this study employs local spatial autocorrelation analysis. Typically, Local Moran’s I is combined with ArcGIS (ArcGIS Pro 3.0)’s LISA (Local Indicators of Spatial Autocorrelation) distribution maps to examine local spatial correlations [58]. To measure the spatial clustering of specific attribute values, this study employs four-stage hotspot/coldspot grey-scale clustering (2010–2012, 2013–2015, 2016–2018, 2019–2021) to reveal the spatial distribution characteristics of coordination coupling. Given that the spatial analysis covers only 11 provincial-level units, the resulting Moran’s I, LISA, and hotspot/coldspot patterns are interpreted as exploratory evidence of spatial association. Their statistical significance and local cluster classifications may be sensitive to individual observations and the specification of the spatial weights matrix.
4. Empirical Analysis
4.1. Calculation of Green Transport Efficiency in the Yangtze River Economic Belt
According to the delineation of the Yangtze River Economic Belt by the Leading Group Office for Promoting the Development of the Yangtze River Economic Belt, the upstream region encompasses Chongqing, Sichuan, Guizhou, and Yunnan; the middle region includes Jiangxi, Hubei, and Hunan; while the downstream region comprises Shanghai, Jiangsu, Zhejiang, and Anhui. This study calculated the green transport efficiency for the upper, middle, and lower reaches between 2010 and 2021, along with the average green transport efficiency for each region, as shown in Table 2. Regional green transport efficiency in the upper, middle, and lower reaches, as well as the overall average for the Yangtze River Economic Belt, generally declined from 2010 to 2015 and recovered during 2016–2019. One possible explanation is that the effects of transport infrastructure investment emerged gradually because of the relatively long input–output cycle, while increasing attention to energy conservation, emission reduction, and green transport may also have contributed to the subsequent improvement. However, the observations for 2020 and 2021 coincided with the COVID-19 pandemic and related disruptions to mobility and logistics, which may have affected both the inputs and outputs of the efficiency model. These two years are therefore interpreted cautiously and are not regarded as a simple continuation of the pre-pandemic recovery trend. Overall, the results are broadly consistent with the non-linear temporal pattern and regional heterogeneity proposed in Hypothesis H1.
Table 2.
Green Efficiency of Regional Transport in the Yangtze River Economic Belt, 2010–2021.
4.2. Calculation of the Yangtze River Economic Belt High-Quality Development Index
Using the entropy weighting-CRITIC weighting method, individual weight analyses were conducted for each indicator of high-quality development in the Yangtze River Economic Belt (see Table 3 for the weight allocation table and Table 4 for the comprehensive weighting results).
Table 3.
Entropy-Based Weighting Table for the CRITIC Empowerment Method.
Table 4.
Entropy-Weighted CRITIC Empowerment Method Comprehensive Weighting Table.
As shown in Table 4, the CRITIC weights for GDP growth rate and R&D investment ratio are relatively low, whereas those for investment return rate and transport investment efficiency are comparatively high. This demonstrates that the two weighting methods yield differing results due to their distinct emphases. The weight obtained through the entropy-weighted CRITIC weighting method based on the information-weighting approach combines the Entropy Weighting method’s reflection of data information content with the CRITIC weighting method’s consideration of data interdependencies. This approach reduces subjectivity, more comprehensively reflects decision-maker preferences, balances data volatility and correlation, and enhances the accuracy of weight allocation.
The economic high-quality development index for the Yangtze River Economic Belt was calculated using the entropy-weighted CRITIC method, with results presented in Figure 3 [48]. Significant disparities exist in the level of economic high-quality development across the upper, middle, and lower reaches of the Yangtze River Economic Belt. A pronounced east-strong, west-weak pattern emerges, where the economic high-quality development index follows the sequence ‘lower reaches > middle reaches > upper reaches’. Notably, the development trajectory of the middle reaches aligns closely with the overall development trend of the Yangtze River Economic Belt. The drivers of these regional disparities can be summarised as follows. From an industrial structure perspective, the tertiary sector accounts for a significantly higher proportion in the downstream regions (average 67.2% in 2021) compared to the upstream regions (48.5%). The digital economy and high-end services are progressively becoming the engines of economic growth in the downstream areas. In terms of technological innovation capacity, the R&D expenditure intensity in downstream provinces (3.1%) is 2.6 times that of upstream regions (1.2%), with higher investment supporting downstream areas in driving total factor productivity growth. Additionally, in transportation infrastructure density, downstream regions boast 19,800 kilometres of road per 100 square kilometres, far exceeding the 7600 kilometres in upstream areas, thereby reducing factor mobility costs. Concurrently, the overall economic high-quality development index across regions within the Yangtze River Economic Belt exhibits a steady upward trajectory from 2010 to 2021, demonstrating minimal volatility and stable growth.
Figure 3.
Trends in the High-Quality Economic Development Index Across Different Regions of the Yangtze River Economic Belt.
This study divides the period from 2010 to 2021 into four phases, each spanning three years. The phased HQEDI for the Yangtze River Economic Belt is presented in Table 5. The HQEDI of provinces (municipalities) within the Yangtze River Economic Belt exhibited certain variations between 2010 and 2021. Using the mean HQEDI value of 0.51 for the Yangtze River Economic Belt during 2010–2021 as the benchmark, Shanghai’s HQEDI exceeded this mean in all time periods and exhibited a sustained growth trend. This indicates Shanghai’s outstanding performance in high-quality economic development, securing the top position. Jiangsu and Zhejiang also demonstrated stable growth trends, maintaining HQEDI values above the benchmark in all four phases and ranking second and third respectively. Hubei, Chongqing, Anhui, Sichuan, and Hunan, though below the benchmark in the first phase, exhibited positive overall growth trajectories, surpassing the benchmark by the fourth phase. Conversely, regions such as Jiangxi, Yunnan, and Guizhou, despite relatively rapid HQEDI growth, failed to catch up and exceed the benchmark by the fourth phase due to factors including weaker economic foundations. Overall, while HQEDI generally trended upwards across provinces and municipalities over time, the magnitude and pace of growth varied significantly between regions.
Table 5.
Comparison of HQEDI and Benchmark Differences Across Regions of the Yangtze River Economic Belt.
Analysed across five dimensions including innovation and coordination (see Figure 4), a basin-wide perspective reveals marked growth in coordination, sharing and green dimensions, yet sluggish progress in openness—notably exhibiting a declining trend since 2019. Phased analysis indicates that the green and sharing dimensions developed relatively weakly, while innovation coordination and openness achieved higher levels of development. However, when innovation coordination and sharing dimensions experienced varying degrees of growth, the openness dimension tended towards stagnation or even regression. Hypothesis H2 is thus validated.
Figure 4.
Comparative Chart of Development Levels Across Four Stages and Five Dimensions.
4.3. Coupling Analysis of Green Transport Efficiency and High-Quality Development in Transport
Based on the coupling coordination model, the coupling coordination degree between the green efficiency of transportation and the high-quality economic development index in the Yangtze River Economic Belt was calculated. According to the calculated coupling coordination degree, the coupling coordination relationship can be categorised into two broad categories: coordination and misalignment. These are further subdivided into four detailed categories: highly coordinated, fundamentally coordinated, fundamentally misaligned, and misaligned with decline. This yields a total of ten coordination states, with classification criteria detailed in Table 1. The coupling coordination results for the Yangtze River Economic Belt’s green transport efficiency and high-quality economic development index are presented in Table 6. The coupling coordination levels of the downstream regions—Shanghai, Jiangsu, and Zhejiang—have consistently remained high, reaching even greater heights in 2021. This indicates strong coupling coordination between green transport efficiency and high-quality economic development in these areas. Shanghai, in particular, saw its score rise from 0.924 in 2010 to 0.995 in 2021, approaching a state of complete coordination. The coupling coordination levels of central regions Hubei, Hunan, and Jiangxi fall between those of eastern and western regions. Although fluctuations occurred in certain years, the overall trend is positive. For instance, Hubei saw significant growth, rising from 0.502 in 2010 to 0.813 in 2021. Western regions Guizhou, Sichuan, and Yunnan, despite starting from lower bases, also demonstrated steady increases in coupling coordination. Guizhou’s index rose from 0.167 in 2010 to 0.439 in 2021, Sichuan’s from 0.236 to 0.441, and Yunnan’s from 0.225 to 0.616. These increases indicate that the coupling coordination between green transport efficiency and the high-quality economic development index is progressively improving in the upper reaches of the Yangtze River Economic Belt. From the overall mean perspective, between 2010 and 2016, approximately half of the Yangtze River Economic Belt regions were in a state of fundamental imbalance or declining imbalance, with three provinces (municipalities) classified as declining imbalance. However, from 2014 onwards, the number of provinces (municipalities) in declining imbalance gradually decreased, disappearing entirely by 2017. From 2016 onwards, the number of provinces (municipalities) in fundamental imbalance also showed a downward trend. By 2021, the majority of provinces (municipalities) had achieved a state of coordination, with only two provinces (municipalities) remaining in a state of fundamental imbalance.
Table 6.
Calculated Results for the Coupling Coordination Degree between GTE and HQEDI in the Yangtze River Economic Belt.
From the perspective of the evolution trend in the coupling coordination degree between green transport efficiency and the high-quality economic development index within the Yangtze River Economic Belt, Shanghai Municipality, Jiangsu Province, and Zhejiang Province maintained a high level of coupling coordination from 2010 to 2021. Meanwhile, the coupling coordination degree of Anhui Province, Hubei Province, Hunan Province, Jiangxi Province, Sichuan Province, and Chongqing Municipality also gradually increased. Specifically, Guizhou and Yunnan exhibited low coupling coordination levels during the initial research period (2010–2012), yet demonstrated rapid growth thereafter. Nevertheless, their coupling coordination levels remain comparatively low when measured against eastern coastal regions. Secondly, examining temporal trends reveals that most provinces (municipalities) exhibit an upward trajectory in coupling coordination. For instance, Guizhou’s coupling coordination rose from 0.167 in 2010 to 0.439 in 2021, representing an increase of approximately 163%—a notably rapid growth rate. Yunnan Province’s coupling coordination index rose from 0.225 in 2010 to 0.616 in 2021, representing an increase of approximately 174%, also demonstrating rapid growth. In contrast, Shanghai Municipality, Jiangsu Province, and Zhejiang Province in the lower reaches of the Yangtze River Economic Belt experienced fluctuations in growth due to their higher initial values, with significant increases only occurring between 2016 and 2020. In contrast, Anhui, Hubei, Hunan, Jiangxi, Sichuan, and Chongqing exhibited smaller but stable upward trends. Spatially, the coupling coordination degree between green transport efficiency and high-quality economic development in the Yangtze River Economic Belt demonstrated a pattern of ‘higher in the east, lower in the southwest’.
Spatially, the coupling coordination degree of the Yangtze River Economic Belt’s green transport efficiency and high-quality economic development index is generally higher in the downstream regions than in the middle and upstream areas, exhibiting an overall pattern of ‘downstream regions > middle regions > upstream regions’. This may be related to factors such as the economic development level and industrial structure of the downstream Yangtze River Delta region. Regions such as Shanghai and Jiangsu exhibit higher levels of economic development and openness, more comprehensive transport networks, and greater adoption of maritime shipping, new energy vehicles, and public transport, conferring significant locational advantages over upstream areas.
From a temporal perspective, the coupling coordination degree shows an overall upward trend, indicating that over time, the Yangtze River Economic Belt has progressively enhanced the coordination between green transport efficiency and high-quality economic development indices. Although fluctuations occurred in certain years, growth remains the dominant developmental trajectory. Concurrently, the dynamic evolution of coupling coordination reveals that mid- and upstream regions exhibit relatively similar coordination levels, though they lag considerably behind downstream areas. Nevertheless, their growth momentum surpasses that of downstream regions, indicating substantial future potential and scope for expansion.
5. Further Analysis—Spatial Correlation and Distribution Characteristics Analysis
5.1. Global Spatial Autocorrelation of Coupling Coordination Degree
Moran’s I index is a statistical measure of spatial autocorrelation, used to assess the degree of spatial clustering or dispersion of a given characteristic value. This study calculated the Global Moran’s I index for the coupling coordination degree between the green transport efficiency and the high-quality economic development index in the Yangtze River Economic Belt, followed by statistical analysis and testing of the results (see Table 7). From 2010 to 2021, the Moran’s I index for the coupling coordination degree between green transport efficiency and high-quality economic development in the Yangtze River Economic Belt predominantly exceeded 0.4, indicating that data across all years exhibited strong positive spatial autocorrelation.
Table 7.
Global Moran’s I Test for Coupling Coordination Degree between GTE and HQEDI in the Yangtze River Economic Belt.
Analysis of the trend in Global Moran’s I index reveals that the highest score recorded in 2017 was 0.615, while the lowest score in 2021 was 0.336. The Moran’s I index remained above zero for every year between 2010 and 2021, with its p-value passing the significance level test at 5%. Consequently, it can be concluded that the spatial distribution of the coupling coordination degree between green transport efficiency and the high-quality economic development index within the Yangtze River Economic Belt during this period is not random. Instead, it exhibits significant spatial clustering characteristics. This implies that the coupling coordination degree between green transport efficiency and high-quality economic development indices across different regions within the Yangtze River Economic Belt exhibits spatial dependency. It suggests that the development of this coupling coordination degree may correlate with the coordinated development of these indices in neighbouring regions. Specifically, provinces (municipalities) with higher coupling coordination degrees tend to be adjacent to one another, while those with lower values also exhibit a tendency to be neighbouring.
5.2. Local Spatial Autocorrelation of Coupling Coordination Degree
The Global Moran’s I statistic indicates that the overall spatial autocorrelation exists between the green transport efficiency and the high-quality economic development index within the Yangtze River Economic Belt. However, to analyse the inter-regional correlation characteristics more specifically, a local analysis of the clustering features across provinces (municipalities) remains necessary. By calculating the changes in local spatial autocorrelation across four phases from 2010 to 2021 for each province in the Yangtze River Economic Belt (see Figure 5).
Figure 5.
Spatial Autocorrelation Evolution of Coupling Coordination Degree in the Yangtze River Economic Belt.
Based on the local spatial autocorrelation analysis of the coupling coordination index for the Yangtze River Economic Belt from 2010 to 2021, as illustrated in Figure 5, the following observations emerge: Firstly, the spatial pattern exhibits relative stability, with eastern coastal provinces (particularly Jiangsu and Shanghai) consistently displaying high-value clustering characteristics (dark-coloured blocks). This indicates their long-term leadership in the coordination between green transport efficiency and high-quality economic development indices, underpinned by robust spatial autocorrelation. Zhejiang experienced a marked surge after 2013 and has since maintained a high-value position, reflecting how coastal regions have continuously strengthened green development momentum through policy coordination and technological upgrading. Secondly, regional divergence has markedly intensified, with western provinces (Sichuan, Chongqing, Guizhou, Yunnan) persistently occupying low-value zones (light to medium grey), forming a pronounced spatial contrast with the east. Notably, Sichuan’s coordination further declined (shading lightens) between 2019 and 2021, highlighting inland regions’ lag in industrial transformation and green transport infrastructure development, with the coordination gap between east and west widening. Thirdly, the central transitional belt exhibits volatility. Hubei, Hunan, and Jiangxi provinces predominantly occupy the mid-range (grey to dark grey), yet lack stable clustering characteristics. Hubei experienced a brief uptick between 2013 and 2015 before declining, while Hunan has remained at a mid-level. This reflects the uneven influence of both eastern and western regions on central provinces, preventing the formation of stable regional coordination mechanisms. Finally, spatial spillover effects demonstrate significant inadequacy. High-value regions (Jiangsu, Zhejiang) and low-value regions (Yunnan, Guizhou, Sichuan, Chongqing) are contiguous yet exhibit no gradual transition, indicating that advanced practices from the east have not effectively diffused westward. Notably, Chongqing—a western hub—remains at a medium-to-low level despite its proximity to Hubei’s high-value zone, underscoring the fragility of regional coordination mechanisms.
Moreover, Zhejiang’s marked improvement between 2013 and 2015 coincided with the implementation period of national strategies such as the ‘Pilot Demonstration Zone for Ecological Civilisation’, indicating that policy interventions can effectively stimulate regional coordination. However, the absence of fundamental improvement in the overall landscape after 2016 reveals that deep-seated structural contradictions—such as the sluggish transfer of industrial gradients and the lack of cross-provincial ecological compensation mechanisms—remain unresolved. Overall, Figure 5 illustrates a three-stage evolutionary trajectory from 2010 to 2021: progressing from ‘point breakthroughs’ to ‘axial extension’ and ultimately towards ‘networked synergy’: Upstream regions (Sichuan, Chongqing, Hubei) sustained their engine role; midstream areas (Hunan, Jiangxi) ascended from periphery to hub status; while downstream zones (Shanghai, Jiangsu, Zhejiang) intensified polarised radiation. This trajectory profoundly embodies the spatial response to the Yangtze River Economic Belt’s strategy of ‘ecological priority, basin-wide interaction, and intensive development’. Notably, the persistent ‘low-low’ clustering (blue) in the Yunnan-Guizhou region starkly contrasts with the stable ‘high-high’ clustering (pink) in the Yangtze River Delta. This highlights the urgent need for policymakers to address the ‘Hu Huanyong Line’ challenge in coordinated basin development through cross-provincial ecological compensation and infrastructure connectivity, thereby achieving truly synergistic, green, high-quality development across the entire basin.
5.3. Analysis of Coupling Coordination Hotspots and Coldspots
Subsequently, based on clustering and outlier analysis, a hotspot analysis of the Yangtze River Economic Belt was conducted and visualised (see Figure 6).
Figure 6.
Evolution of Spatial Distribution of Coupling Coordination Degree Cold Spots/Hot Spots.
This diagram illustrates the spatiotemporal evolution of the coupling coordination degree between green transport efficiency and economic high-quality development across the 11 provinces and municipalities of the Yangtze River Economic Belt from 2010 to 2021.
Spatial-temporal evolution characteristics of coupling coordination between green transport efficiency and high-quality economic development. From an overall perspective, regional development exhibits pronounced spatial differentiation and dynamic convergence trends: the core Yangtze River Delta region (Shanghai, Jiangsu, Zhejiang) consistently maintains the deepest black tones (greyscale value ≥ 0.8), forming a stable high-heat zone that highlights its leading role in green transportation development and high-quality growth. Midstream provinces such as Hubei, Hunan, and Jiangxi demonstrate a dynamic improvement trajectory, with their tones deepening from early light grey to later medium-dark grey, reflecting sustained optimisation of coordination driven by policy initiatives. Conversely, western provinces like Guizhou and Yunnan initially featured predominantly light shades, showing some improvement later but remaining relatively lagging, revealing gradient disparities in regional coordinated development. Notably, a pivotal turning point emerged between 2016 and 2018: the grey values of western provinces like Sichuan and Chongqing markedly deepened, aligning precisely with the intensified implementation of the Yangtze River Economic Belt strategy, particularly the construction timeline of the upstream green shipping corridor. Concurrently, the grey values of high-heat regions such as Shanghai slightly declined in the latter period, suggesting an increasing radiating effect from the core zone to surrounding provinces. This spatio-temporal evolution—characterised by ‘eastern stability, central advancement, and western catch-up’—not only demonstrates the efficacy of regional development strategies but also reflects the differentiated balancing paths between ecological constraints and economic development demands across distinct segments of the Yangtze River Economic Belt. It is recommended that three key strategies be reinforced in the future: consolidating the Yangtze River Delta’s role as the core engine, enhancing midstream green supply chain coordination, and establishing differentiated green infrastructure investment and ecological compensation mechanisms for upstream provinces. This will foster a more balanced, coordinated development pattern across the entire river basin.
6. Discussion
The results show a non-linear evolution of regional green transport efficiency and persistent differences among the upstream, middle, and downstream regions. The relatively higher coordination levels in the downstream region may be associated with denser transport networks, stronger innovation capacity, greater market openness, and more developed service industries. This interpretation is broadly consistent with previous studies linking transport connectivity and logistics capacity to market accessibility, factor mobility, and regional development [1,24,29,47]. However, the observations for 2020 and 2021 coincided with the COVID-19 pandemic and may reflect exceptional changes in mobility, logistics demand, energy consumption, and transport output. These values should therefore not be interpreted simply as a continuation of the pre-pandemic trend.
The spatial results indicate geographical clustering rather than verified spillover effects. High-value clustering in the downstream region and relatively low values in several upstream provinces suggest that neighbouring regions may share similar economic, technological, and resource conditions. Nevertheless, Moran’s I and LISA statistics cannot identify the direction or causal mechanism of interregional influence [59]. Moreover, because the spatial analysis includes only 11 provincial-level units, local clustering results may be sensitive to the spatial weight matrix and should be regarded as exploratory.
The coupling coordination degree should also be interpreted as a descriptive measure of the relative joint development of regional green transport efficiency and high-quality economic development, rather than evidence of causality. Its results may be affected by indicator selection, weighting assumptions, formula specification, and classification thresholds [57]. Accordingly, the findings are mainly applicable to comparisons within the present sample and study period. The provincial scale, the absence of causal identification, and the dataset ending in 2021 limit the current relevance and generalisability of the conclusions.
Although the empirical findings are specific to the Yangtze River Economic Belt, the analytical framework can be adapted to other river basins, economic corridors, metropolitan regions, and cross-border transport systems. Its application elsewhere would require local adjustment of indicator definitions, weights, classification thresholds, spatial units, and spatial weight matrices according to regional transport modes, development priorities, environmental pressures, institutional conditions, and data availability. Therefore, the transferable contribution of this study lies mainly in its integrated analytical procedure, while the specific numerical results, regional rankings, spatial patterns, and policy recommendations remain context-dependent.
The findings of this study are also broadly comparable with evidence from other regional contexts. A slack-based DEA assessment of the U.S. transport sector identified substantial differences in environmental efficiency among states, indicating that the capacity to convert transport inputs into mobility outputs while limiting carbon emissions varies considerably across regions [58]. Evidence from 186 regions in 19 European countries further shows that the relationship between transport accessibility and regional performance is significant only in part of the sample and is affected by regional centrality and neighbouring accessibility conditions [60]. Research on the U.S. Great Lakes region similarly found that the relationship between transport accessibility and regional economic resilience varies significantly across space [61]. Spatial econometric evidence from Spanish provinces also suggests that the direct and neighbouring-region productivity effects of transport infrastructure differ across transport modes [62]. These international findings support the interpretation that the coordination between transport development, environmental performance, and regional economic development is affected by regional economic conditions, network position, and infrastructure composition. Nevertheless, because the present study employs Moran’s I and LISA rather than a causal spatial econometric model, the identified spatial clusters should continue to be interpreted as evidence of geographical association rather than verified causal spillover effects.
7. Conclusions and Policy Recommendations
7.1. Conclusions
This study quantitatively examines the coupling relationship between green transport efficiency and the high-quality economic development index within the Yangtze River Economic Belt. Employing a coupling coordination degree model, it calculates the coupling coordination degree between these two indicators. Analyses from both inter-provincial and regional perspectives reveal temporal and spatial variations in this coupling. Utilising spatial autocorrelation and hotspot/coldspot models, the study explores the changing characteristics of the coupling coordination degree. Key findings are as follows:
- (1)
- Research on the coupling coordination degree between green transport efficiency and high-quality economic development in the Yangtze River Economic Belt reveals distinct spatio-temporal evolution patterns. Between 2010 and 2021, green transport efficiency exhibited a U-shaped trajectory, declining initially before rising sharply. Following a policy inflection point in 2015, efficiency values surged from 0.296 to 0.807 by 2021, validating the synergistic effects of green transport policies and technological diffusion (Hypothesis H1). The economic high-quality development index exhibited an east-strong, west-weak gradient pattern, with downstream regions’ mean (0.684) substantially exceeding upstream regions (0.404). However, mid-to-upstream regions demonstrated notable growth rates—Hubei and Chongqing achieved annual increases of 4.2%—confirming the two-stage ‘convergence-divergence’ characteristic of regional disparities (Hypothesis H2). The spatial distribution of coupling coordination degree highlights an evolutionary trajectory of ‘high-value clustering in downstream regions, dynamic leapfrogging in midstream areas, and accelerated catch-up in upstream zones’: Shanghai, Jiangsu, and Zhejiang form a stable high-coordination zone (mean ≥ 0.883), while Yunnan and Guizhou, despite low starting points (2010 < 0.25), achieved growth exceeding 170%, reflecting the effectiveness of policy dividends permeating the west.
- (2)
- Spatial correlation analysis reveals the underlying mechanisms of coordinated basin development. ① Eastern high-value cores (Jiangsu-Zhejiang) achieve self-reinforcement through technological iteration and policy dividends (e.g., Zhejiang’s 2013 ecological civilisation policy). ② Western low-value depressions (Yunnan-Guizhou-Sichuan-Chongqing) face path lock-in; despite Chongqing’s proximity to Hubei’s medium-value zone, it fails to absorb spillover effects. ③ The transitional belt in the central region lacks spatial linkage functions, exhibiting a dual fracture pattern of ‘high-value polarisation and low-value fixation’ across the entire area. This spatial structure confirms that while policy drivers prove effective locally (e.g., Zhejiang’s leapfrog development), the absence of cross-regional coordination mechanisms hinders overall basin-wide harmonisation. The polarised contrast between the expansion of high-value clusters (Yangtze Delta → middle reaches) along the river and the spatial inertia of low-value regions (Yunnan-Guizhou) validates the transmission chain: ‘policy-driven catalysis of technological diffusion reshapes spatial spillover and relational structures’ (Hypothesis H3 holds).
- (3)
- Multi-dimensional policy coordination exhibits significant spatial adaptation thresholds. Analysis across five dimensions reveals: innovation and coordination dimensions consistently lead (mean > 0.6), while green and shared dimensions show the fastest growth (58% increase from 2010 to 2021). However, the openness dimension stagnates or even regresses due to international trade fluctuations. This structural imbalance stems from regional endowment disparities: ① Downstream regions dominate technological innovation through the digital economy (tertiary sector accounting for 67.2% of GDP) and high R&D investment intensity (3.1%). ② Midstream regions enhance transport investment efficiency via multimodal logistics integration (weighting 0.069). ③ Upstream regions, constrained by weak industrial foundations, rely on ecological compensation mechanisms to breach development thresholds. Furthermore, entropy-weighted CRITIC results corroborate these disparities: trade openness (weight 0.088) and foreign investment contribution (0.084) significantly drive the downstream region, whereas the upstream region relies more heavily on public welfare expenditure (0.031) and public transport coverage (0.045).
- (4)
- The study offers three implications for coordinated governance of the Yangtze River Economic Belt: ① Spatial restructuring strategy: consolidate the Yangtze Delta’s ‘high-high’ agglomeration engine function, enhancing its spillover effects to Anhui and Jiangxi (e.g., declining grey values suggest diffusion); establish a coordinated corridor linking Hunan, Hubei, and Jiangxi in the middle reaches to address the ‘central collapse’; For the residual ‘low-low’ zone in Yunnan-Guizhou, implement combined ‘infrastructure connectivity + ecological compensation’ policies, such as cross-provincial sharing mechanisms for hydropower revenues. ② Innovation in policy toolkits: Focus downstream on ‘digital transport + carbon trading’ market mechanisms (e.g., Zhejiang’s ‘enterprise contribution points system’); explore ‘basin governance + enclave economy’ models in the middle reaches (e.g., Ganjiang New Area practices); increase green infrastructure investment and institutional flexibility upstream (e.g., flexible assessment to resolve trust crises). ③ Technology-Empowered Pathways: Promote digital twin technologies to optimise transport networks, and break down factor mobility barriers through ‘new infrastructure + industry’ integration—such as enhancing logistics density in mid- and upstream regions (each 1% increase drives a 0.78% rise in e-commerce transactions). Ultimately, establish a basin-wide sustainable development paradigm where ‘green efficiency drives upgrading, spatial spillovers enhance resource allocation, and policy alignment narrows disparities’.
7.2. Policy Recommendations
Based on the observed regional disparities and spatial clustering patterns of regional green transport efficiency and high-quality economic development in the Yangtze River Economic Belt, the following policy recommendations are proposed. Their implementation should be matched to regional fiscal capacity, technical conditions, and the life-cycle costs of transport projects.
- (1)
- Establish a Differentiated and Cost-Conscious Monitoring System
A unified annual monitoring framework should be established for regional green transport efficiency, the high-quality economic development index, and their coupling coordination degree. Supporting indicators should include transport energy consumption, carbon emissions per unit of transport output, infrastructure utilisation, public transport coverage, project operating costs, and fiscal affordability. To limit administrative and financial burdens, the system should primarily integrate existing statistical and transport-management databases rather than require provinces to construct new independent platforms. Provinces may be classified as high-level stable regions, improving transitional regions, or persistently constrained regions, with policy priorities adjusted according to their main efficiency, environmental, and fiscal constraints rather than investment scale alone.
- (2)
- Prioritise Low-Cost Efficiency Improvements in Upstream Provinces
Upstream provinces that remain at relatively low coordination levels or in low–low clusters should prioritise the maintenance and efficient use of existing transport infrastructure rather than large-scale capacity expansion or high-cost digital systems. Initial measures may include improving connections among road, rail, and inland waterway transport, upgrading selected energy-intensive equipment, integrating existing transport data, and introducing basic monitoring systems on major freight corridors. Projects should be implemented in phases, beginning with measures that have relatively low costs and clear effects on network utilisation, freight efficiency, and emission reduction.
Funding should rely primarily on existing transport budgets, targeted higher-level fiscal support, and cross-provincial cost-sharing arrangements. New borrowing should be considered only where stable repayment sources and measurable operating benefits can be demonstrated. Progress should be assessed using regional green transport efficiency, infrastructure utilisation, carbon-emission intensity, operating and maintenance costs, and the coupling coordination degree.
- (3)
- Strengthen Joint Investment and Multimodal Coordination in the Middle Reaches
The middle reaches should strengthen their connecting role between the upper and lower reaches by prioritising transport bottlenecks with clear interprovincial benefits. Hubei, Hunan, and Jiangxi may jointly develop cross-provincial freight corridors, multimodal transport nodes, and common standards for transport data and modal transfers. To avoid duplicated investment, participating provinces should use shared planning, joint procurement, and transparent cost-sharing arrangements.
Priority should be given to projects that reduce modal transfer time and improve the utilisation of existing facilities before new infrastructure is constructed. Project performance should be evaluated using modal transfer time, the share of multimodal transport, transport investment efficiency, carbon emissions per unit of transport output, operating costs, and changes in the coupling coordination degree.
- (4)
- Focus Downstream Investment on Demonstration, Efficient Operation, and Knowledge Sharing
Shanghai, Jiangsu, and Zhejiang should gradually shift from further infrastructure expansion towards efficient network operation, energy-saving technology application, transport-data integration, and improved freight organisation. Given their stronger fiscal and technical capacity, these provinces may undertake limited pilot applications of advanced digital technologies at major logistics hubs or high-traffic corridors. However, such projects should be expanded only after cost–benefit assessment demonstrates clear operational, environmental, and financial advantages.
Cooperation with neighbouring provinces should focus on shared technical standards, staff training, interoperable data systems, and the transfer of proven low-cost management practices. Joint programme performance should be assessed using technology adoption, reductions in operating and transfer costs, infrastructure utilisation, transport carbon-emission intensity, and regional green transport efficiency, rather than project numbers or investment scale alone.
8. Limitations and Future Research
This study is subject to several statistical limitations associated with the small number of spatial units. Although the panel dataset contains 132 province-year observations covering 11 provinces and municipalities from 2010 to 2021, the Global Moran’s I and local spatial statistics for each year are calculated using only 11 cross-sectional spatial units. The repeated annual observations therefore do not increase the spatial sample size available for each yearly spatial analysis. A major limitation of this study is that the dataset ends in 2021. Consequently, the results describe the evolution of regional green transport efficiency and high-quality economic development during 2010–2021 and do not capture the subsequent post-pandemic economic recovery, recent changes in mobility and logistics, or newer transport and decarbonisation policies. The findings should therefore not be interpreted as an assessment of current provincial conditions. Their relevance lies primarily in identifying historical regional disparities, temporal patterns, and coordination characteristics within the study period. Future research should extend the dataset beyond 2021 when complete and consistently defined provincial statistics become available.
The limited number of spatial units may reduce statistical power and make the estimated spatial statistics more sensitive to individual provinces, the specification of the spatial weights matrix, and the significance thresholds used to classify local clusters. In particular, the LISA and hotspot/coldspot results should be interpreted as exploratory evidence of spatial association rather than as definitive evidence of stable spatial regimes or causal spillover effects. The positive Moran’s I values indicate that provinces with similar coupling coordination levels tend to be geographically adjacent, but they do not identify the direction or causal mechanism of interregional influence.
Future research should use prefecture-level or city-level data to increase the number of spatial observations and examine whether the identified clustering patterns remain stable at a finer geographical scale. Robustness analyses based on alternative spatial weights matrices and permutation-based inference should also be conducted. Where data permit, spatial panel econometric models may be employed to distinguish spatial association from causal interregional effects and to examine the mechanisms linking regional green transport efficiency with high-quality economic development.
Author Contributions
Conceptualization, C.L.; methodology, S.D. and Y.L. (Yangzhou Li); software, Y.L. (Yangzhou Li) and Y.L. (Yangzhou Li); validation, Q.D., S.D. and Y.L. (Yanfei Li); formal analysis, Q.D. and S.D.; data collection, Y.L. (Yangzhou Li); writing—original draft preparation, Y.L. (Yangzhou Li) and Q.D.; writing—review and editing, Q.D., S.D., Y.L. (Yanfei Li) and C.L.; visualization, Y.L. (Yangzhou Li) and S.D.; supervision, Q.D. and S.D.; project administration, S.D. and C.L.; funding acquisition, S.D. and C.L. All authors have read and agreed to the published version of the manuscript.
Funding
This research was funded by the Shanghai Municipal Foundation for Philosophy and Social Science (grant No.2024BJC002 and 2025BZH004).
Data Availability Statement
Data will be made available on request.
Conflicts of Interest
The authors declare no conflicts of interest.
References
- Ren, Y.; Tian, Y.; Xiao, X. Spatial Effects of Transportation Infrastructure on the Development of Urban Agglomeration Integration: Evidence from the Yangtze River Economic Belt. J. Transp. Geogr. 2022, 104, 103431. [Google Scholar] [CrossRef] [Scilit]
- Shao, H.; Wang, Z. Spatial Network Structure of Transportation Carbon Emission Efficiency in China and Its Influencing Factors. Chin. J. Popul. Resour. Environ. 2021, 19, 295–303. [Google Scholar] [CrossRef] [Scilit]
- Zhao, P.; Zeng, L.; Lu, H.; Zhou, Y.; Hu, H.; Wei, X. Green Economic Efficiency and Its Influencing Factors in China from 2008 to 2017: Based on the Super-SBM Model with Undesirable Outputs and Spatial Dubin Model. Sci. Total Environ. 2020, 741, 140026. [Google Scholar] [CrossRef] [Scilit] [PubMed]
- Li, Y.; Li, C.; Feng, D. Study on Transportation Green Efficiency and Spatial Correlation in the Yangtze River Economic Belt. Sustainability 2024, 16, 3686. [Google Scholar] [CrossRef] [Scilit]
- Wang, W.; Mo, Y.; Guan, L.; Gong, L. Prediction Analysis and Control Strategies on Coupling Coordination between Low-Carbon Transportation and High-Quality Economic Development in the Backward U-Shaped Bend Metropolitan Area of the Yellow River Basin. Ecol. Indic. 2025, 175, 113521. [Google Scholar] [CrossRef] [Scilit]
- Tang, Y.; Ding, H.; Shan, X.; Wang, X. Application of the Novel Three-Stage DEA Model to Evaluate Total-Factor Energy Efficiency: A Case Study Based on 30 Provinces and 8 Comprehensive Economic Zones of China. Results Eng. 2023, 20, 101417. [Google Scholar] [CrossRef] [Scilit]
- Du, H.; Chen, Z.; Zhang, Z.; Southworth, F. The Rebound Effect on Energy Efficiency Improvements in China’s Transportation Sector: A CGE Analysis. J. Manag. Sci. Eng. 2020, 5, 249–263. [Google Scholar] [CrossRef] [Scilit]
- Wang, B.; Han, Y.; Wang, S.; Tian, D.; Cai, M.; Liu, M.; Wang, L. A Review of Intelligent Connected Vehicle Cooperative Driving Development. Mathematics 2022, 10, 3635. [Google Scholar] [CrossRef] [Scilit]
- Klar, R.; Fredriksson, A.; Angelakis, V. Assessing the Maturity of Digital Twinning Solutions for Ports. In Proceedings of the 2023 IEEE International Conference on Pervasive Computing and Communications Workshops and Other Affiliated Events (PerCom Workshops), Atlanta, GA, USA, 13–17 March 2023; IEEE: New York, NY, USA, 2013; pp. 552–557. [Google Scholar] [CrossRef] [Scilit]
- Barrachina, J.; Garrido, P.; Fogue, M.; Martinez, F.J.; Cano, J.-C.; Calafate, C.T.; Manzoni, P. Road Side Unit Deployment: A Density-Based Approach. IEEE Intell. Transp. Syst. Mag. 2013, 5, 30–39. [Google Scholar] [CrossRef] [Scilit]
- Anselin, L. Spatial Econometrics: Methods and Models; Kluwer Academic Publishers: Dordrecht, The Netherlands, 1988. [Google Scholar] [CrossRef] [Scilit]
- Jia, P.; Hu, Y.; Yuan, S. Research on the Efficiency and Spatial Correlation of China’s Provincial Comprehensive Transportation. Sci. Res. Manag. 2020, 41, 219–229. [Google Scholar]
- Yin, H. Spatial Economic Pattern and Intercity Economic Linkages of the Chengdu–Chongqing Urban Agglomeration. J. Southwest Univ. Soc. Sci. Ed. 2019, 45, 44–53. [Google Scholar] [CrossRef]
- Fotheringham, A.S.; Crespo, R.; Yao, J. Geographical and Temporal Weighted Regression (GTWR). Geogr. Anal. 2015, 47, 431–452. [Google Scholar] [CrossRef] [Scilit]
- Hu, M.; Li, R.; You, W.; Liu, Y.; Lee, C.-C. The Influencing Effect of Tourism Economy on Green Development Efficiency in the Yangtze River Delta. Int. J. Environ. Res. Public Health 2023, 20, 1072. [Google Scholar] [CrossRef] [Scilit] [PubMed]
- Ding, T.; Zhang, N. Spatial Relationship Between Railway Transport Efficiency and Economic Development in the Yangtze River Economic Belt. Railw. Transp. Econ. 2023, 45, 63–67+122. [Google Scholar]
- Cai, H.; Ming, Q.; Han, J.; Gong, X. Research on the Impact Effect of Urban Air Transportation Linkage Networks on Tourism Economic Development in China. Hum. Geogr. 2024, 39, 142–152. [Google Scholar] [CrossRef]
- Donaldson, D. Railroads of the Raj: Estimating the Impact of Transportation Infrastructure. Am. Econ. Rev. 2018, 108, 899–934. [Google Scholar] [CrossRef] [Scilit]
- Faber, B. Trade Integration, Market Size, and Industrialization: Evidence from China’s National Trunk Highway System. Rev. Econ. Stud. 2014, 81, 1046–1070. [Google Scholar] [CrossRef] [Scilit]
- Parry, I.W.H.; Walls, M.; Harrington, W. Automobile Externalities and Policies. J. Econ. Lit. 2007, 45, 373–399. [Google Scholar] [CrossRef] [Scilit]
- Zhou, Z.; Dai, H.; Zha, Y. Dilemmas and Countermeasures of Digital Transport Empowering High-Quality Economic Development. China Soft Sci. 2023, 9, 86–94. [Google Scholar]
- Peng, M.; Xu, H.; Qu, C.; Xu, J.; Chen, L. Understanding China’s Largest Sustainability Experiment: Atmospheric and Climate Governance in the Yangtze River Economic Belt as a Lens. J. Clean. Prod. 2021, 283, 124619. [Google Scholar] [CrossRef] [Scilit]
- Luo, B. On County-Level Urban–Rural Integrated Development with Chinese Characteristics: An Analytical Paradigm Based on “Institution–Space–Governance”. J. Nanjing Agric. Univ. Soc. Sci. Ed. 2025, 25, 14–31. [Google Scholar]
- Zeng, S.; Fu, Q.; Haleem, F.; Han, Y.; Zhou, L. Logistics Density, E-Commerce and High-Quality Economic Development: An Empirical Analysis Based on Provincial Panel Data in China. J. Clean. Prod. 2023, 426, 138871. [Google Scholar] [CrossRef] [Scilit]
- Hu, D.; Wang, X.; Hu, C.; Hu, X. Highways and Green Economic Growth in China’s Yangtze River Economic Belt: Mediating Role of Green Technology Innovation. Pol. J. Environ. Stud. 2025, 34, 1565–1579. [Google Scholar] [CrossRef] [Scilit] [PubMed]
- Chen, M.; Liu, W.; Wang, S.; Liu, Y. Spatio-Temporal Differentiation of Urban Eco-Efficiency in the Yangtze River Economic Belt and Its Driving Factors. China Popul. Resour. Environ. 2020, 30, 121–127. [Google Scholar]
- Yu, L.; Shi, M.; Li, J. Logistics Efficiency and Factor Decomposition in the Yangtze River Economic Belt Based on the DEA-Malmquist Index Model. Bus. Econ. Manag. 2018, 4, 16–25. [Google Scholar]
- Zhang, N.; Zhou, P.; Kung, C.-C. Total-Factor Carbon Emission Performance of the Chinese Transportation Industry: A Bootstrapped Non-Radial Malmquist Index Analysis. Renew. Sustain. Energy Rev. 2015, 41, 584–593. [Google Scholar] [CrossRef] [Scilit]
- Li, W.; Zhang, Y.; Yang, C.; Gong, W.; Wang, C.; Zhang, R. Does Producer Services Agglomeration Improve Urban Green Development Performance of the Yangtze River Economic Belt in China? Ecol. Indic. 2022, 145, 109581. [Google Scholar] [CrossRef] [Scilit]
- Xiong, R.; Gao, D. Exploring the Impact of Heterogeneous Environmental Regulations on Green Innovation Efficiency: Evidence from China’s Yangtze River Economic Belt. Systems 2023, 11, 516. [Google Scholar] [CrossRef] [Scilit]
- Gong, G.; Zhao, Y. Ecology versus Economic Development: Effects of China’s Yangtze River Economic Belt Strategy. Int. Stud. Econ. 2024, 19, 330–352. [Google Scholar] [CrossRef] [Scilit]
- Gao, J.; Cheng, J.; Zhou, W.; Liu, Z.; Zhan, C. Spatial Heterogeneity Evolution and Convergence of Green Innovation in the Yangtze River Economic Belt. Econ. Geogr. 2025, 45, 22–31. [Google Scholar] [CrossRef]
- Zhao, T.; Zhang, Z.; Liang, S. Digital Economy, Entrepreneurship, and High-Quality Economic Development: Empirical Evidence from Urban China. Front. Econ. China-Sel. Publ. From Chin. Univ. 2022, 3, 393–426. [Google Scholar]
- Myrdal, G. Economic Theory and Under-Developed Regions; Duckworth: London, UK, 1957. [Google Scholar]
- Zhong, Y.; Wu, S. Dilemmas, Mechanisms, and Countermeasures of New Quality Productive Forces Promoting Regional Coordinated Development. J. Chongqing Univ. Soc. Sci. Ed. 2025, 30, 41–45. [Google Scholar]
- Zou, R. Interregional Gradient Transfer of China’s Cultural Industry. Jianghan Trib. 2019, 2, 136–140. [Google Scholar]
- Luo, Z.; Yang, J. Construction of a Networked Governance Framework for the Ecological Environment of the Yangtze River Economic Belt. Reform 2019, 1, 87–96. [Google Scholar]
- Bai, Y.; Guo, S. Spatio-Temporal Differences in Economic Strength in the Yangtze River Economic Belt: A Comparison of Cities along the Belt. Reform 2015, 1, 99–108. [Google Scholar]
- Guang, Y. Coordinated Development of the Regional Digital Economy and Circulation Industry: A Case Study of the Yangtze River Economic Belt. Commer. Econ. Res. 2023, 11, 171–175. [Google Scholar]
- Wang, J. Research on Ecological Environmental Governance and Coordination Mechanisms in the Yangtze River Economic Belt in the New Era. Tianjin Soc. Sci. 2023, 5, 53–59. [Google Scholar]
- Shi, T.; Yang, S.; Zhang, W.; Zhou, Q. Coupling Coordination Degree Measurement and Spatiotemporal Heterogeneity between Economic Development and Ecological Environment: Empirical Evidence from Tropical and Subtropical Regions of China. J. Clean. Prod. 2020, 244, 118739. [Google Scholar] [CrossRef] [Scilit]
- He, Y.; Zhang, X.; Zheng, H. Impact of the Yangtze River Economic Belt on High-Quality Economic Development in China: Evidence from a Spatial Difference-in-Differences Model. Econ. Model. 2025, 143, 106962. [Google Scholar] [CrossRef] [Scilit]
- Williamson, J.G. Regional Inequality and the Process of National Development: A Description of the Patterns. Econ. Dev. Cult. Change 1965, 13, 1–84. [Google Scholar] [CrossRef] [Scilit]
- Ling, Y.; Liu, Z. Logical Framework, Long-Term Mechanism, and Policy Path of Regional Coordinated and Integrated Development: A Case Study of the Yangtze River Economic Belt. J. Nantong Univ. Soc. Sci. Ed. 2025, 41, 56–67. [Google Scholar]
- Fan, S.; Kanbur, R.; Zhang, X. China’s Regional Disparities: Experience and Policy. Rev. Dev. Financ. 2011, 1, 47–56. [Google Scholar] [CrossRef] [Scilit]
- Adler, N.; Golany, B. Including Principal Component Weights to Improve Discrimination in Data Envelopment Analysis. J. Oper. Res. Soc. 2002, 53, 985–991. [Google Scholar] [CrossRef] [Scilit]
- Ma, F.; Wang, W.; Sun, Q.; Liu, F.; Li, X. Integrated Transport Efficiency and Its Spatial Convergence in China’s Provinces: A Super-SBM DEA Model Considering Undesirable Outputs. Appl. Sci. 2018, 8, 1698. [Google Scholar] [CrossRef] [Scilit]
- Quatraro, F. Innovation, Structural Change and Productivity Growth: Evidence from Italian Regions, 1980–2003. Camb. J. Econ. 2009, 33, 1001–1022. [Google Scholar] [CrossRef] [Scilit]
- Kubiszewski, I.; Costanza, R.; Franco, C.; Lawn, P.; Talberth, J.; Jackson, T.; Aylmer, C. Beyond GDP: Measuring and Achieving Global Genuine Progress. Ecol. Econ. 2013, 93, 57–68. [Google Scholar] [CrossRef] [Scilit]
- Greco, S.; Ishizaka, A.; Tasiou, M.; Torrisi, G. On the Methodological Framework of Composite Indices: A Review of the Issues of Weighting, Aggregation, and Robustness. Soc. Indic. Res. 2019, 141, 61–94. [Google Scholar] [CrossRef] [Scilit]
- Hickel, J. The Sustainable Development Index: Measuring the Ecological Efficiency of Human Development in the Anthropocene. Ecol. Econ. 2020, 167, 106331. [Google Scholar] [CrossRef] [Scilit]
- Li, C.; Deng, S.; Li, Y.; Zhu, L. Green Transportation-Enabled High-Quality Economic Development in the Yangtze River Economic Belt: Regional Disparities and Dynamic Characteristics. Sustainability 2025, 17, 6018. [Google Scholar] [CrossRef] [Scilit]
- Tone, K. A Slacks-Based Measure of Efficiency in Data Envelopment Analysis. Eur. J. Oper. Res. 2001, 130, 498–509. [Google Scholar] [CrossRef] [Scilit]
- Yang, X.; Mao, J. Land-Use Efficiency and Influencing Factors in the Urban Agglomeration in the Middle Reaches of the Yangtze River: Based on the Undesirable Super-Efficiency SBM Model. J. Henan Norm. Univ. Philos. Soc. Sci. Ed. 2024, 3, 62–69. [Google Scholar]
- Yang, Q.; Zheng, Y.; Fu, L. Spatio-temporal evolution characteristics and influencing factors of carbon emission reduction potential of the transportation industry in China. Manag. Syst. Eng. 2024, 3, 9. [Google Scholar] [CrossRef] [Scilit]
- Diakoulaki, D.; Mavrotas, G.; Papayannakis, L. Determining Objective Weights in Multiple Criteria Problems: The CRITIC Method. Comput. Oper. Res. 1995, 22, 763–770. [Google Scholar] [CrossRef] [Scilit]
- Ariken, M.; Zhang, F.; Liu, K.; Fang, C.; Kung, H.-T. Coupling Coordination Analysis of Urbanization and Eco-Environment in Yanqi Basin Based on Multi-Source Remote Sensing Data. Ecol. Indic. 2020, 114, 106331. [Google Scholar] [CrossRef] [Scilit]
- Park, Y.S.; Lim, S.H.; Egilmez, G.; Szmerekovsky, J. Environmental Efficiency Assessment of U.S. Transport Sector: A Slack-Based Data Envelopment Analysis Approach. Transp. Res. Part D Transp. Environ. 2018, 61, 152–164. [Google Scholar] [CrossRef] [Scilit]
- Anselin, L. Local Indicators of Spatial Association—LISA. Geogr. Anal. 1995, 27, 93–115. [Google Scholar] [CrossRef] [Scilit]
- Freiria, S.; Sousa, N.; Calvo-Poyo, F. Spatial Analysis of the Impact of Transport Accessibility on Regional Performance: A Study for Europe. J. Transp. Geogr. 2022, 102, 103371. [Google Scholar] [CrossRef] [Scilit]
- Chacon-Hurtado, D.; Kumar, I.; Gkritza, K.; Fricker, J.D.; Beaulieu, L.J. The Role of Transportation Accessibility in Regional Economic Resilience. J. Transp. Geogr. 2020, 84, 102695. [Google Scholar] [CrossRef] [Scilit]
- Arbués, P.; Baños, J.F.; Mayor, M. The Spatial Productivity of Transportation Infrastructure. Transp. Res. Part A Policy Pract. 2015, 75, 166–177. [Google Scholar] [CrossRef] [Scilit]
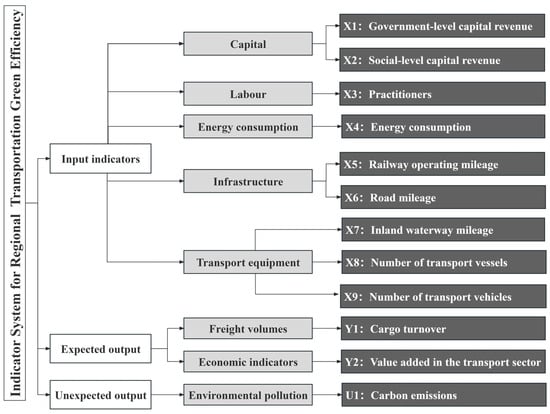
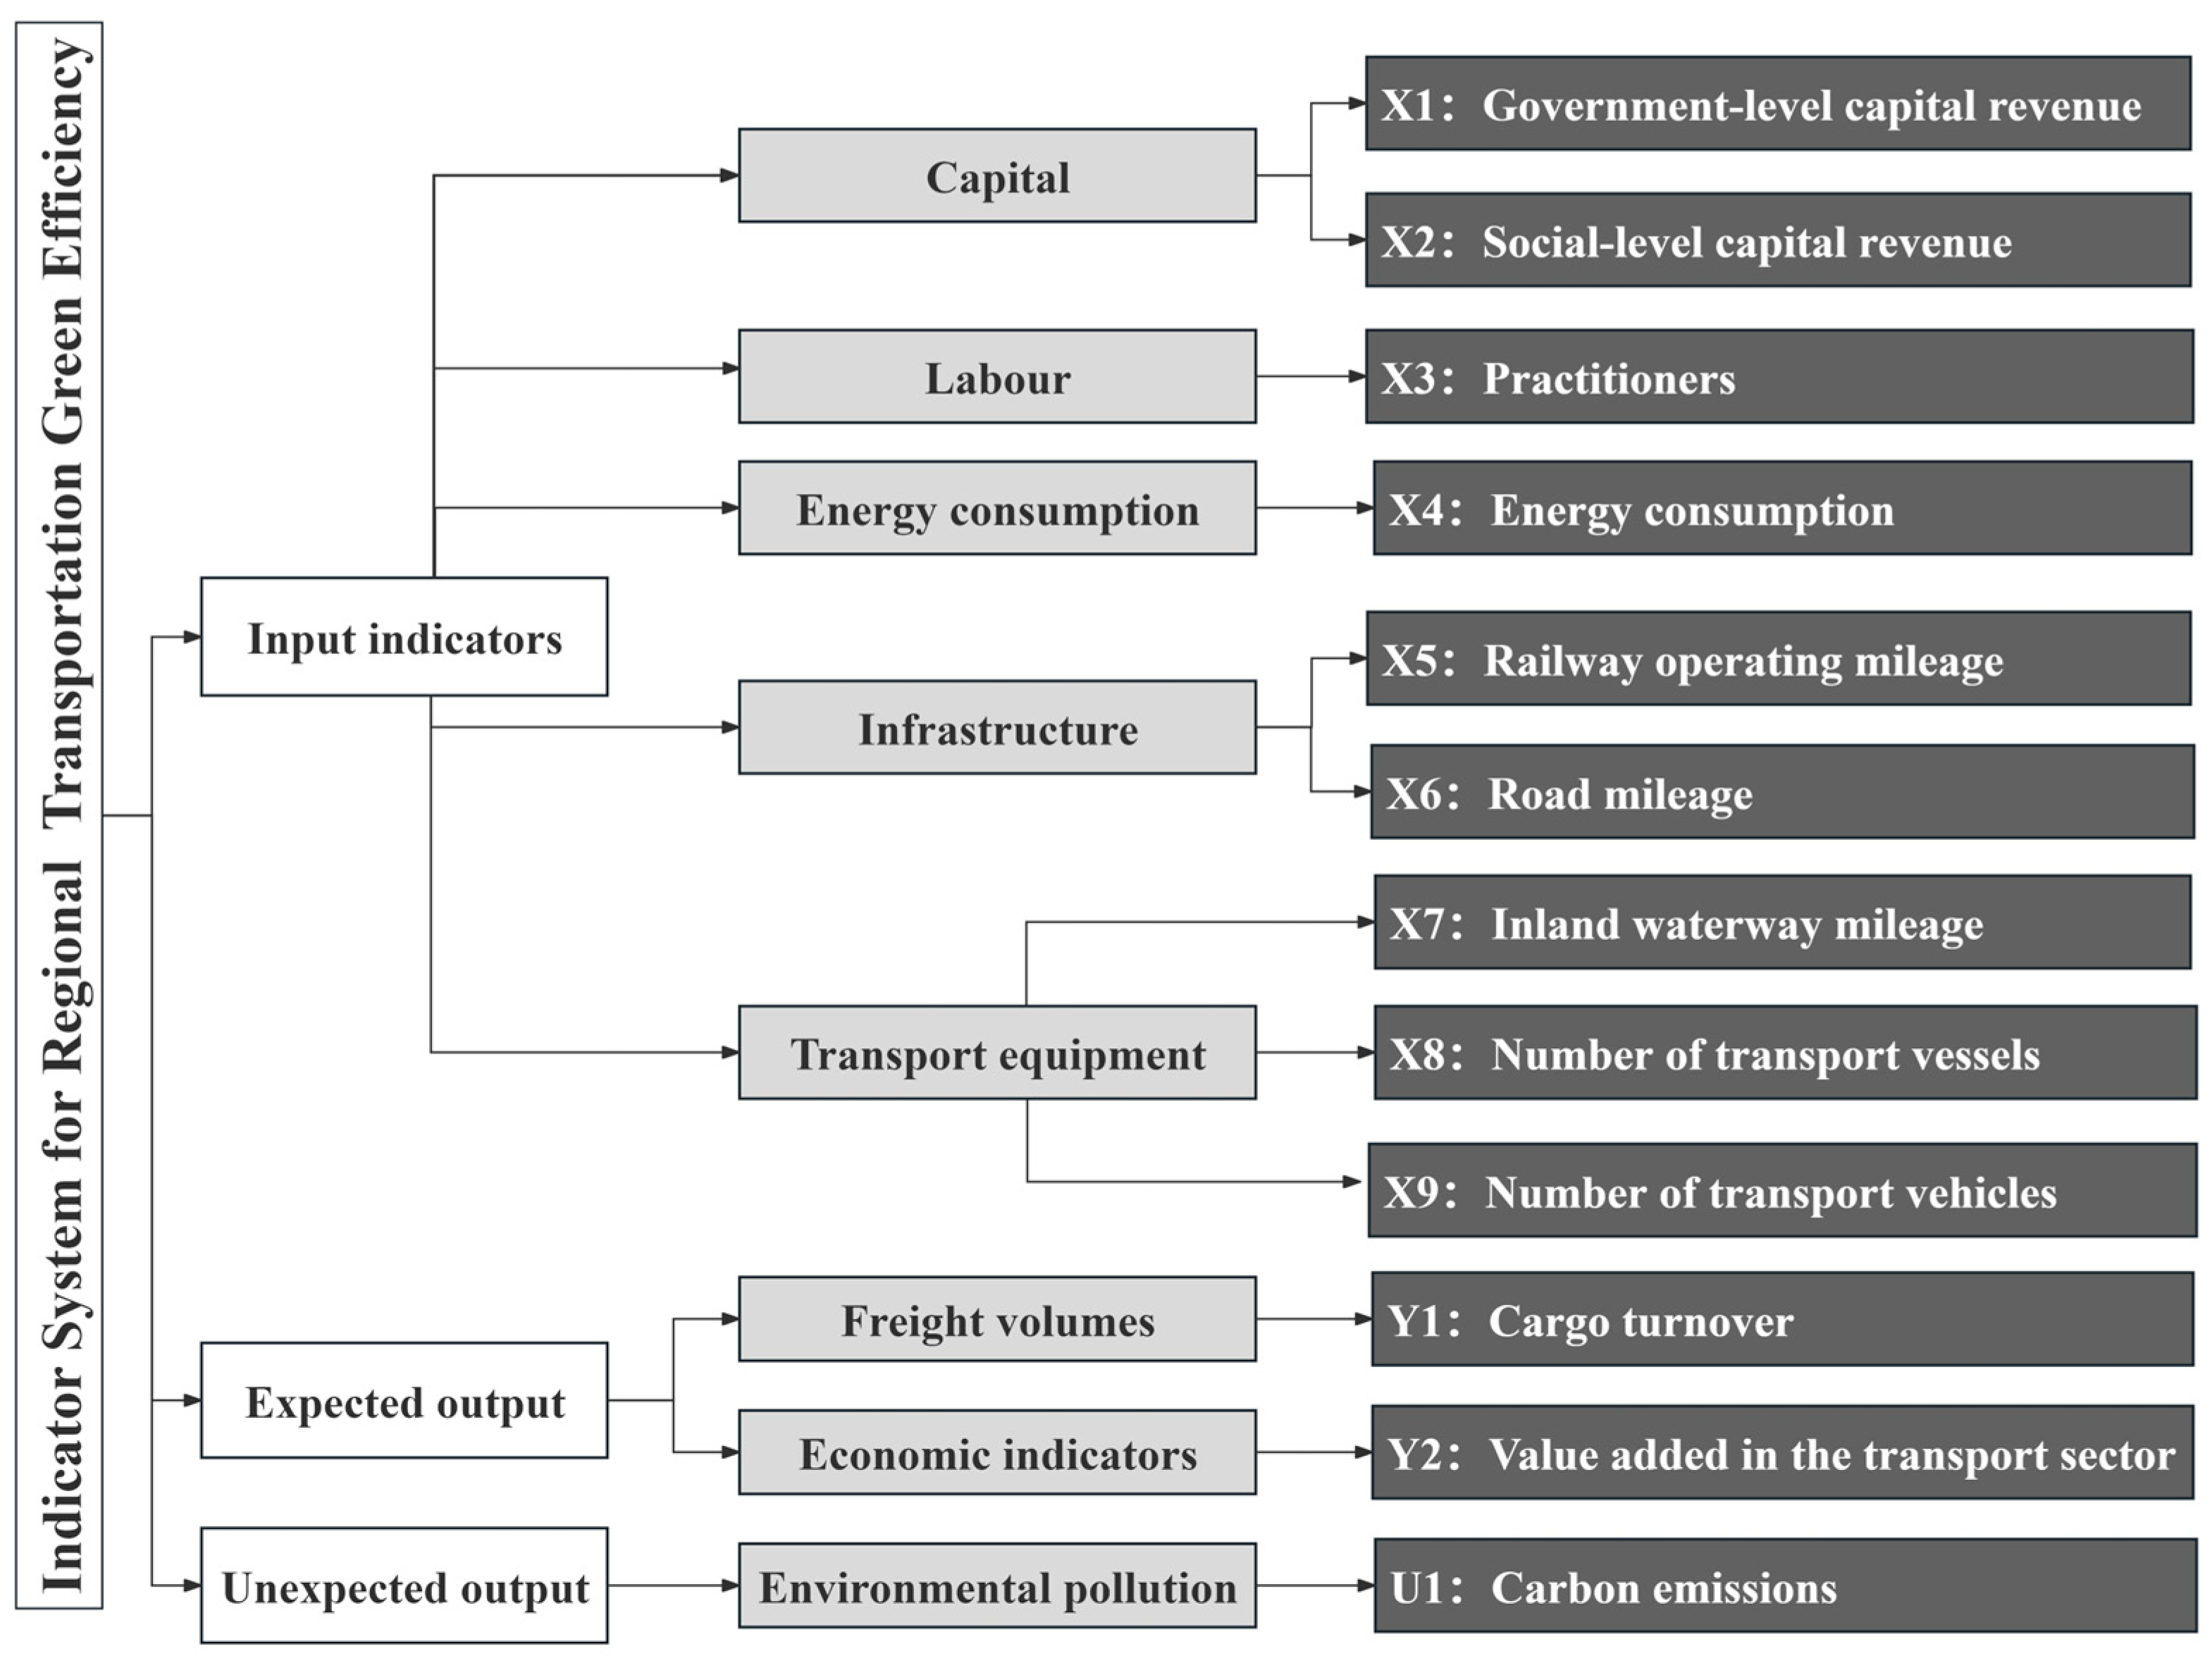
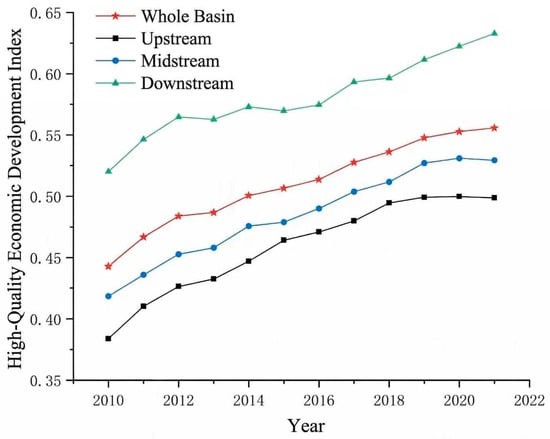
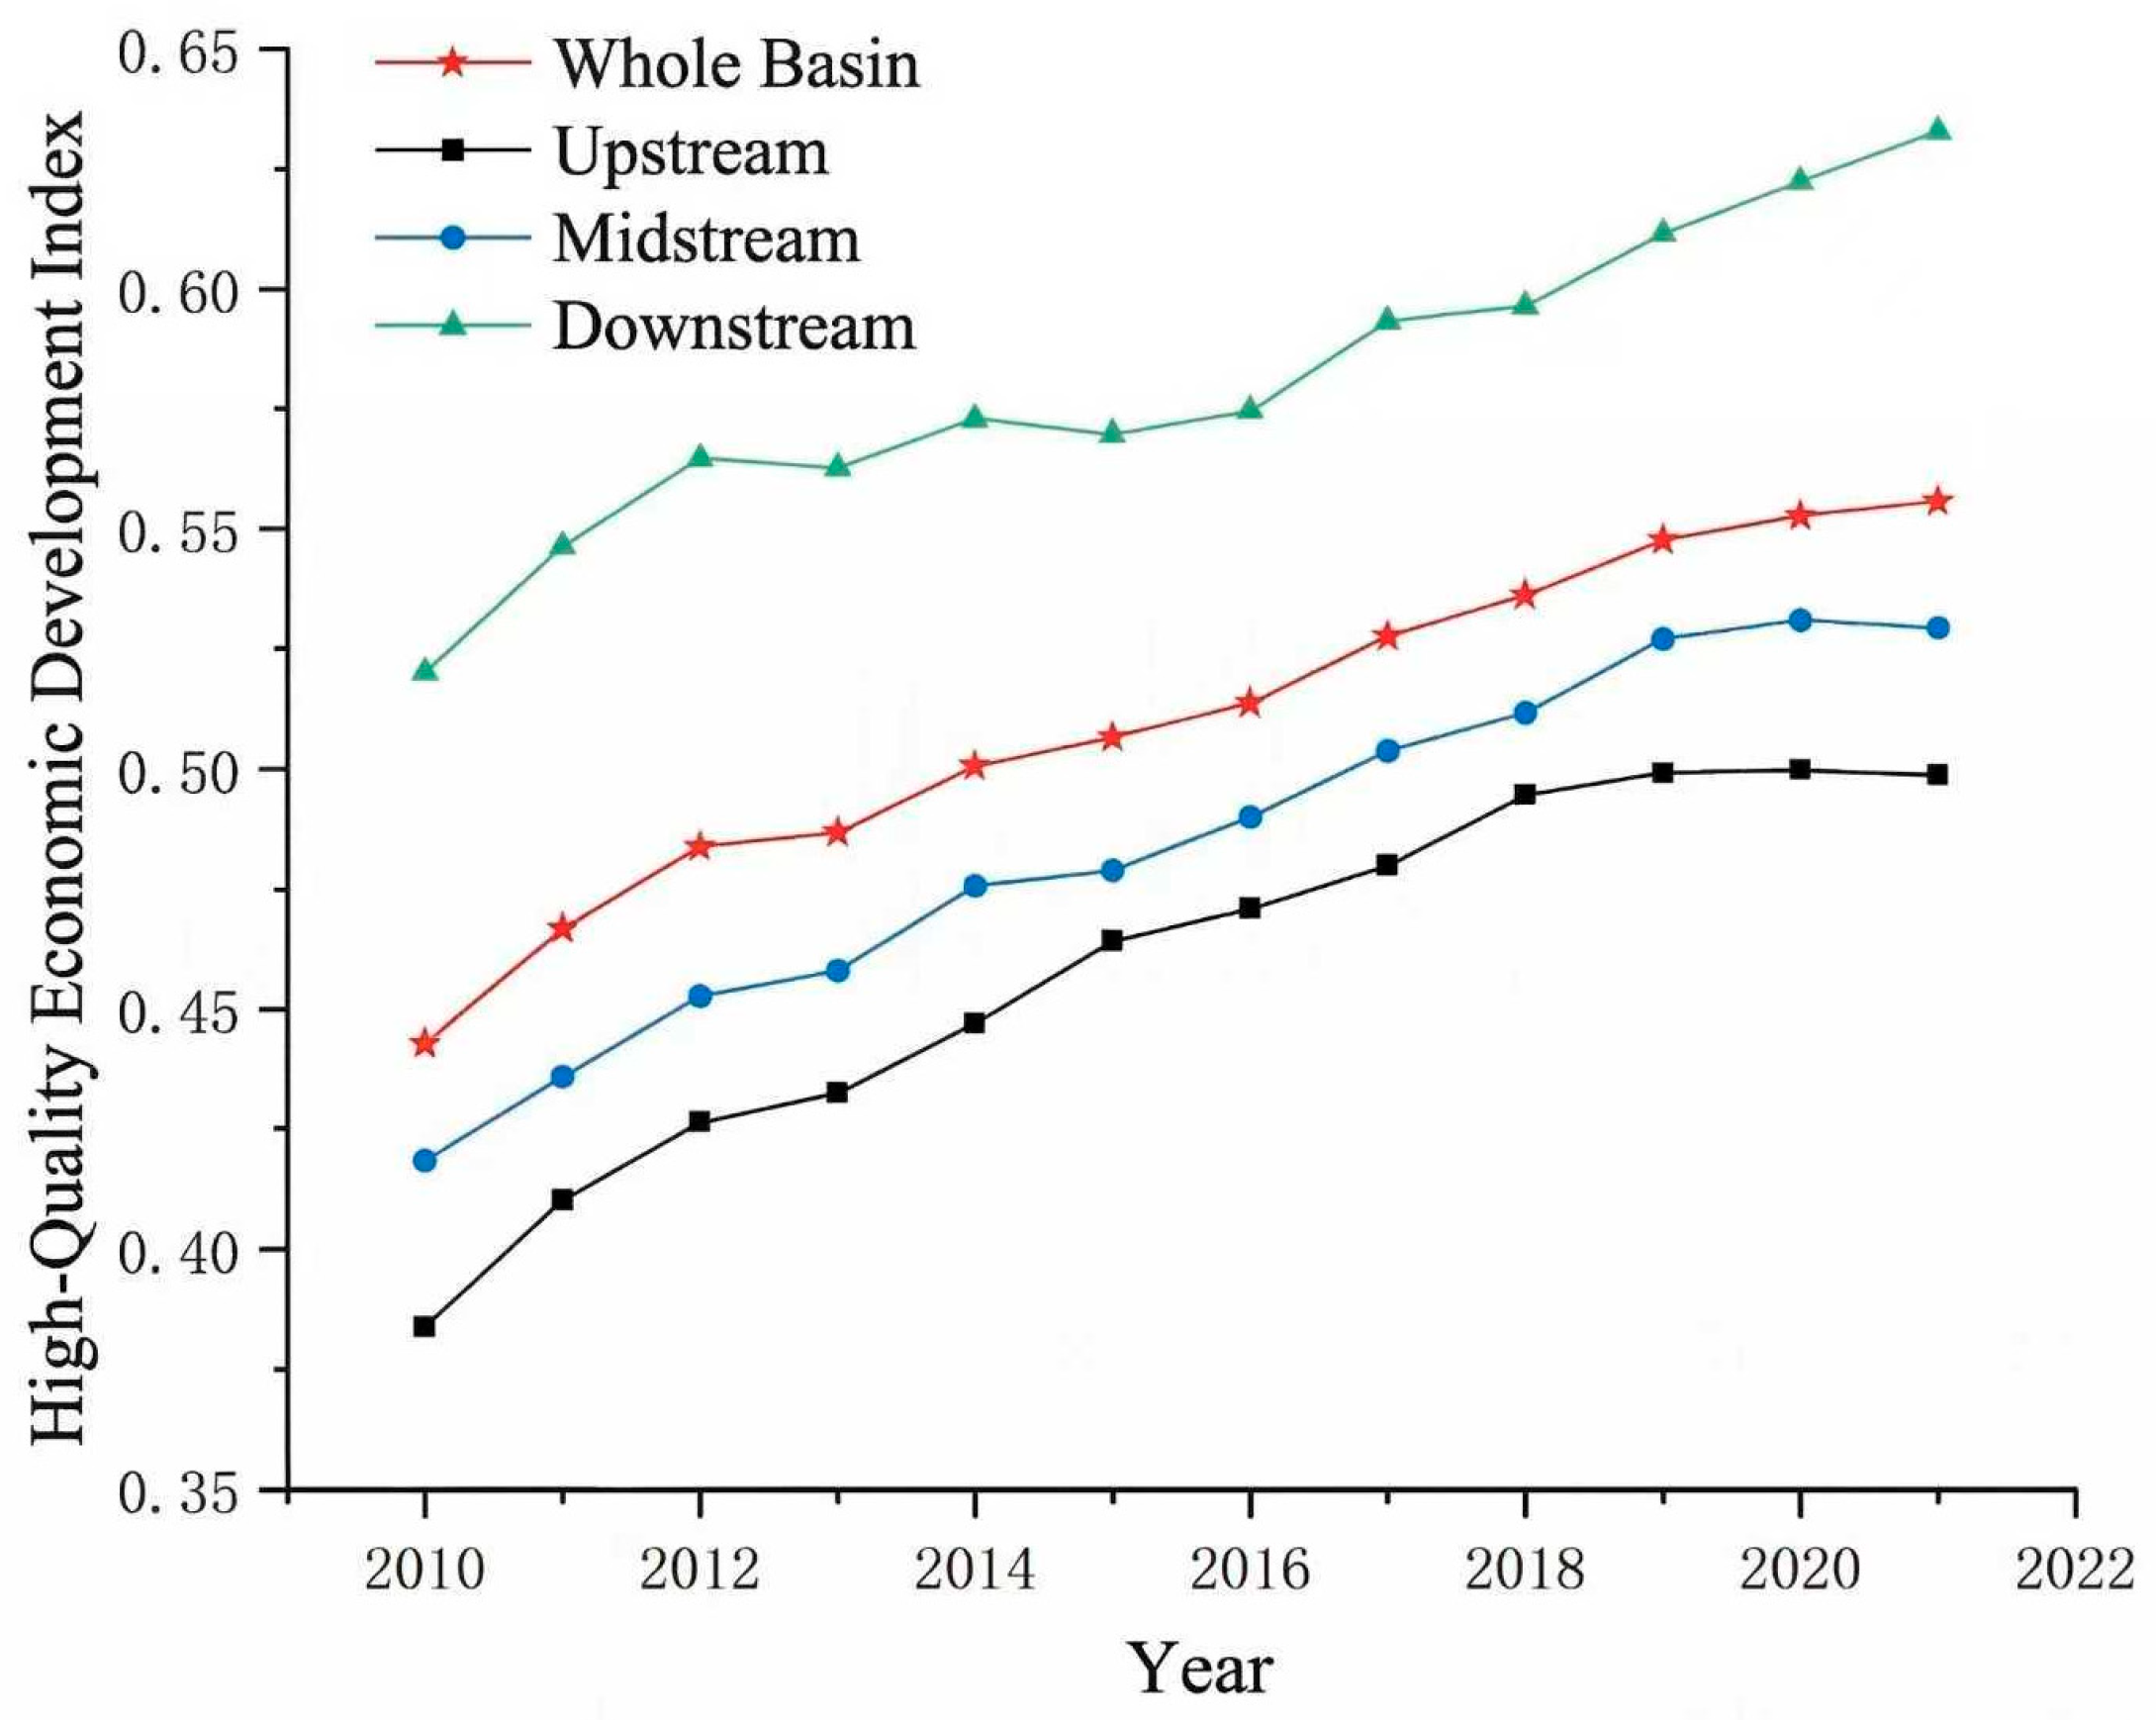
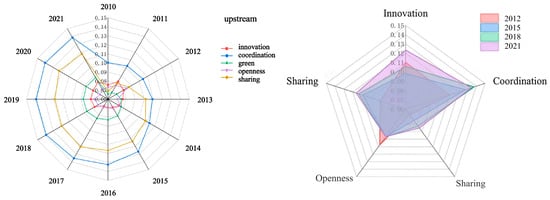
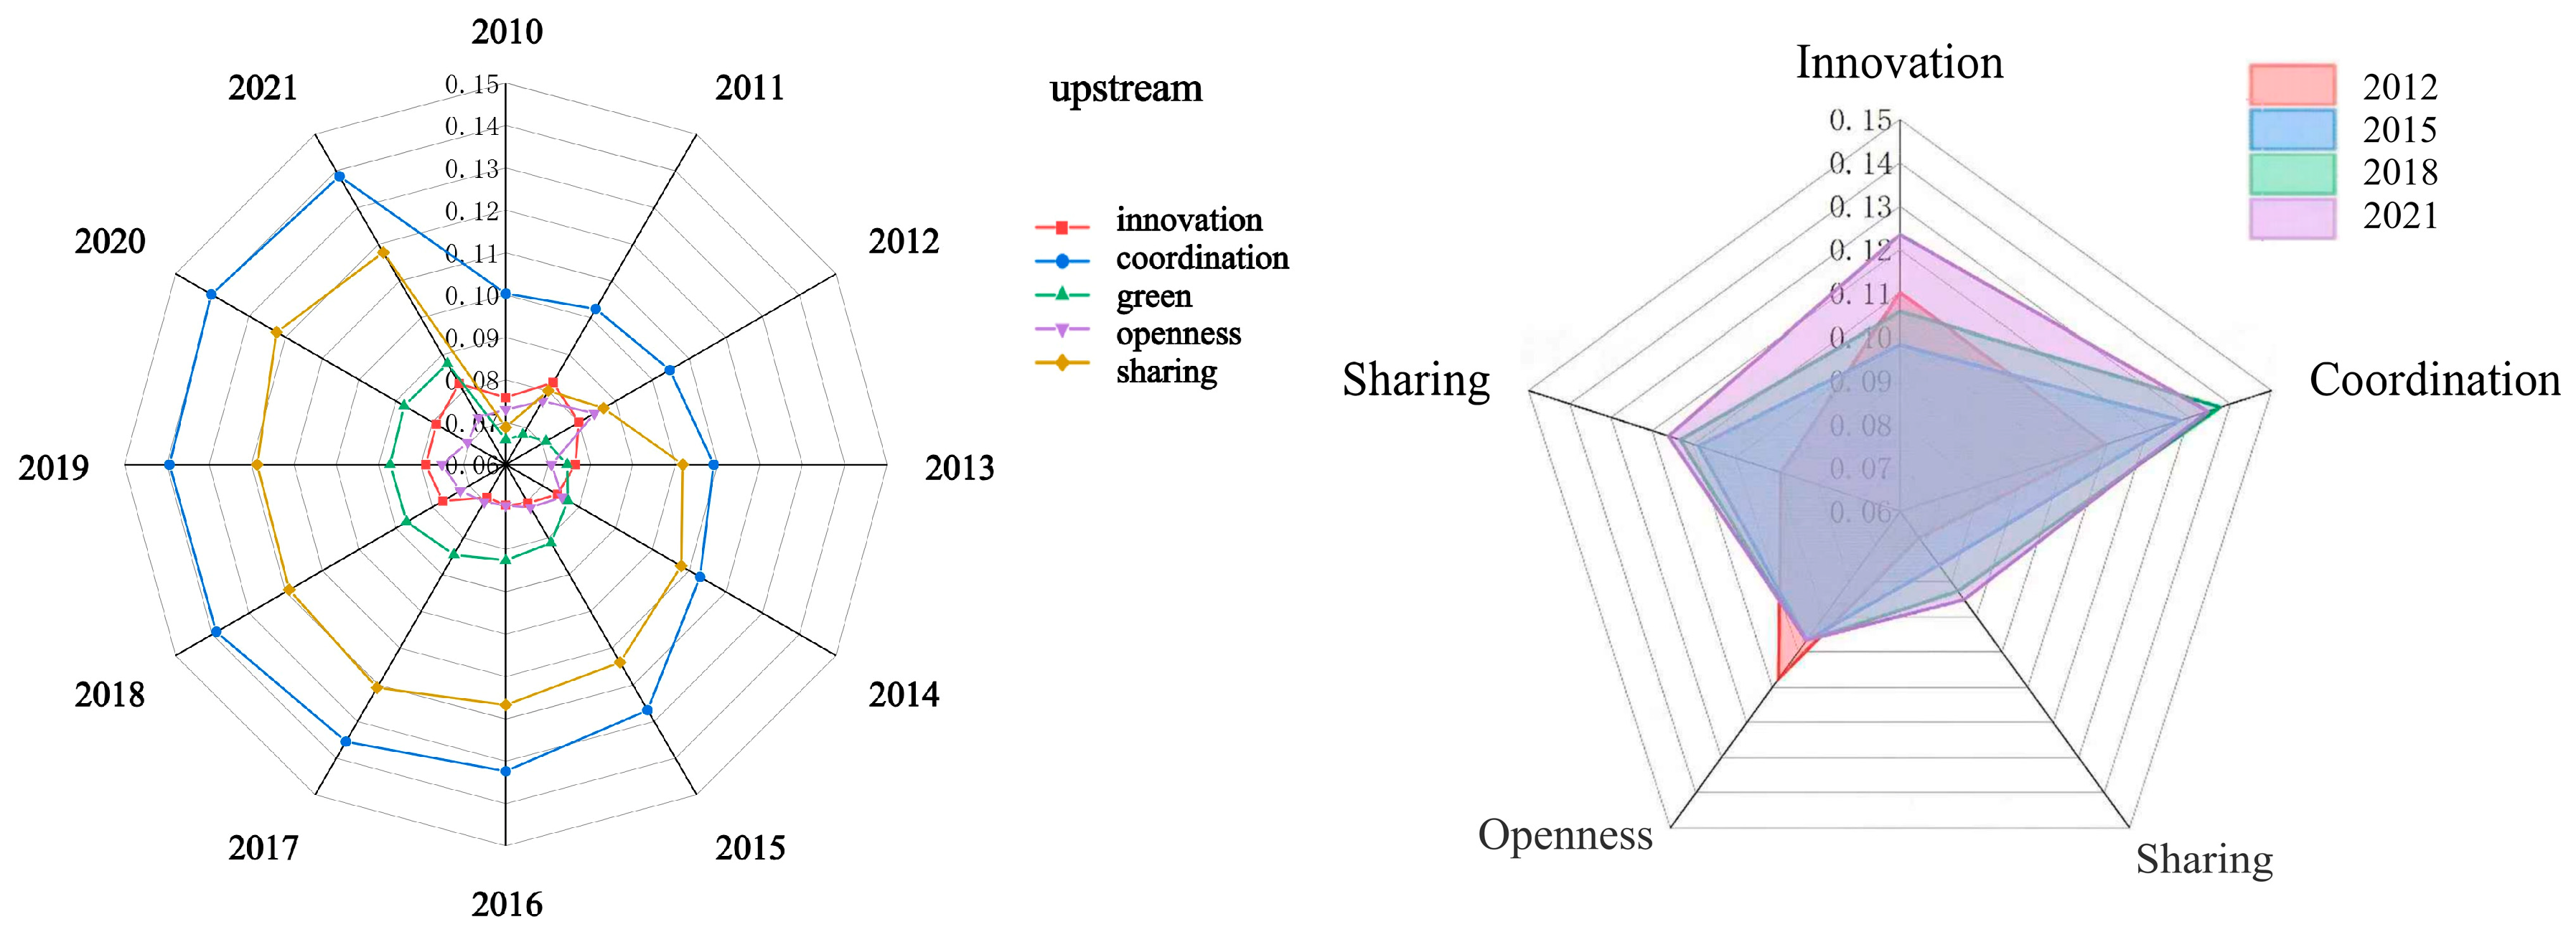
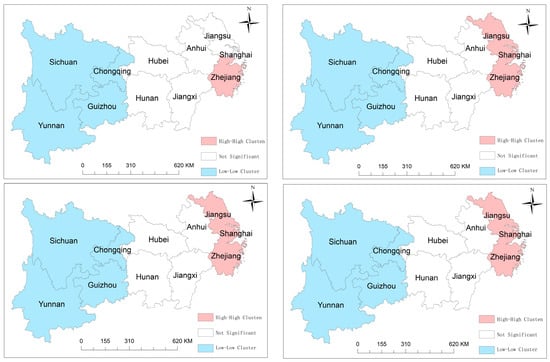
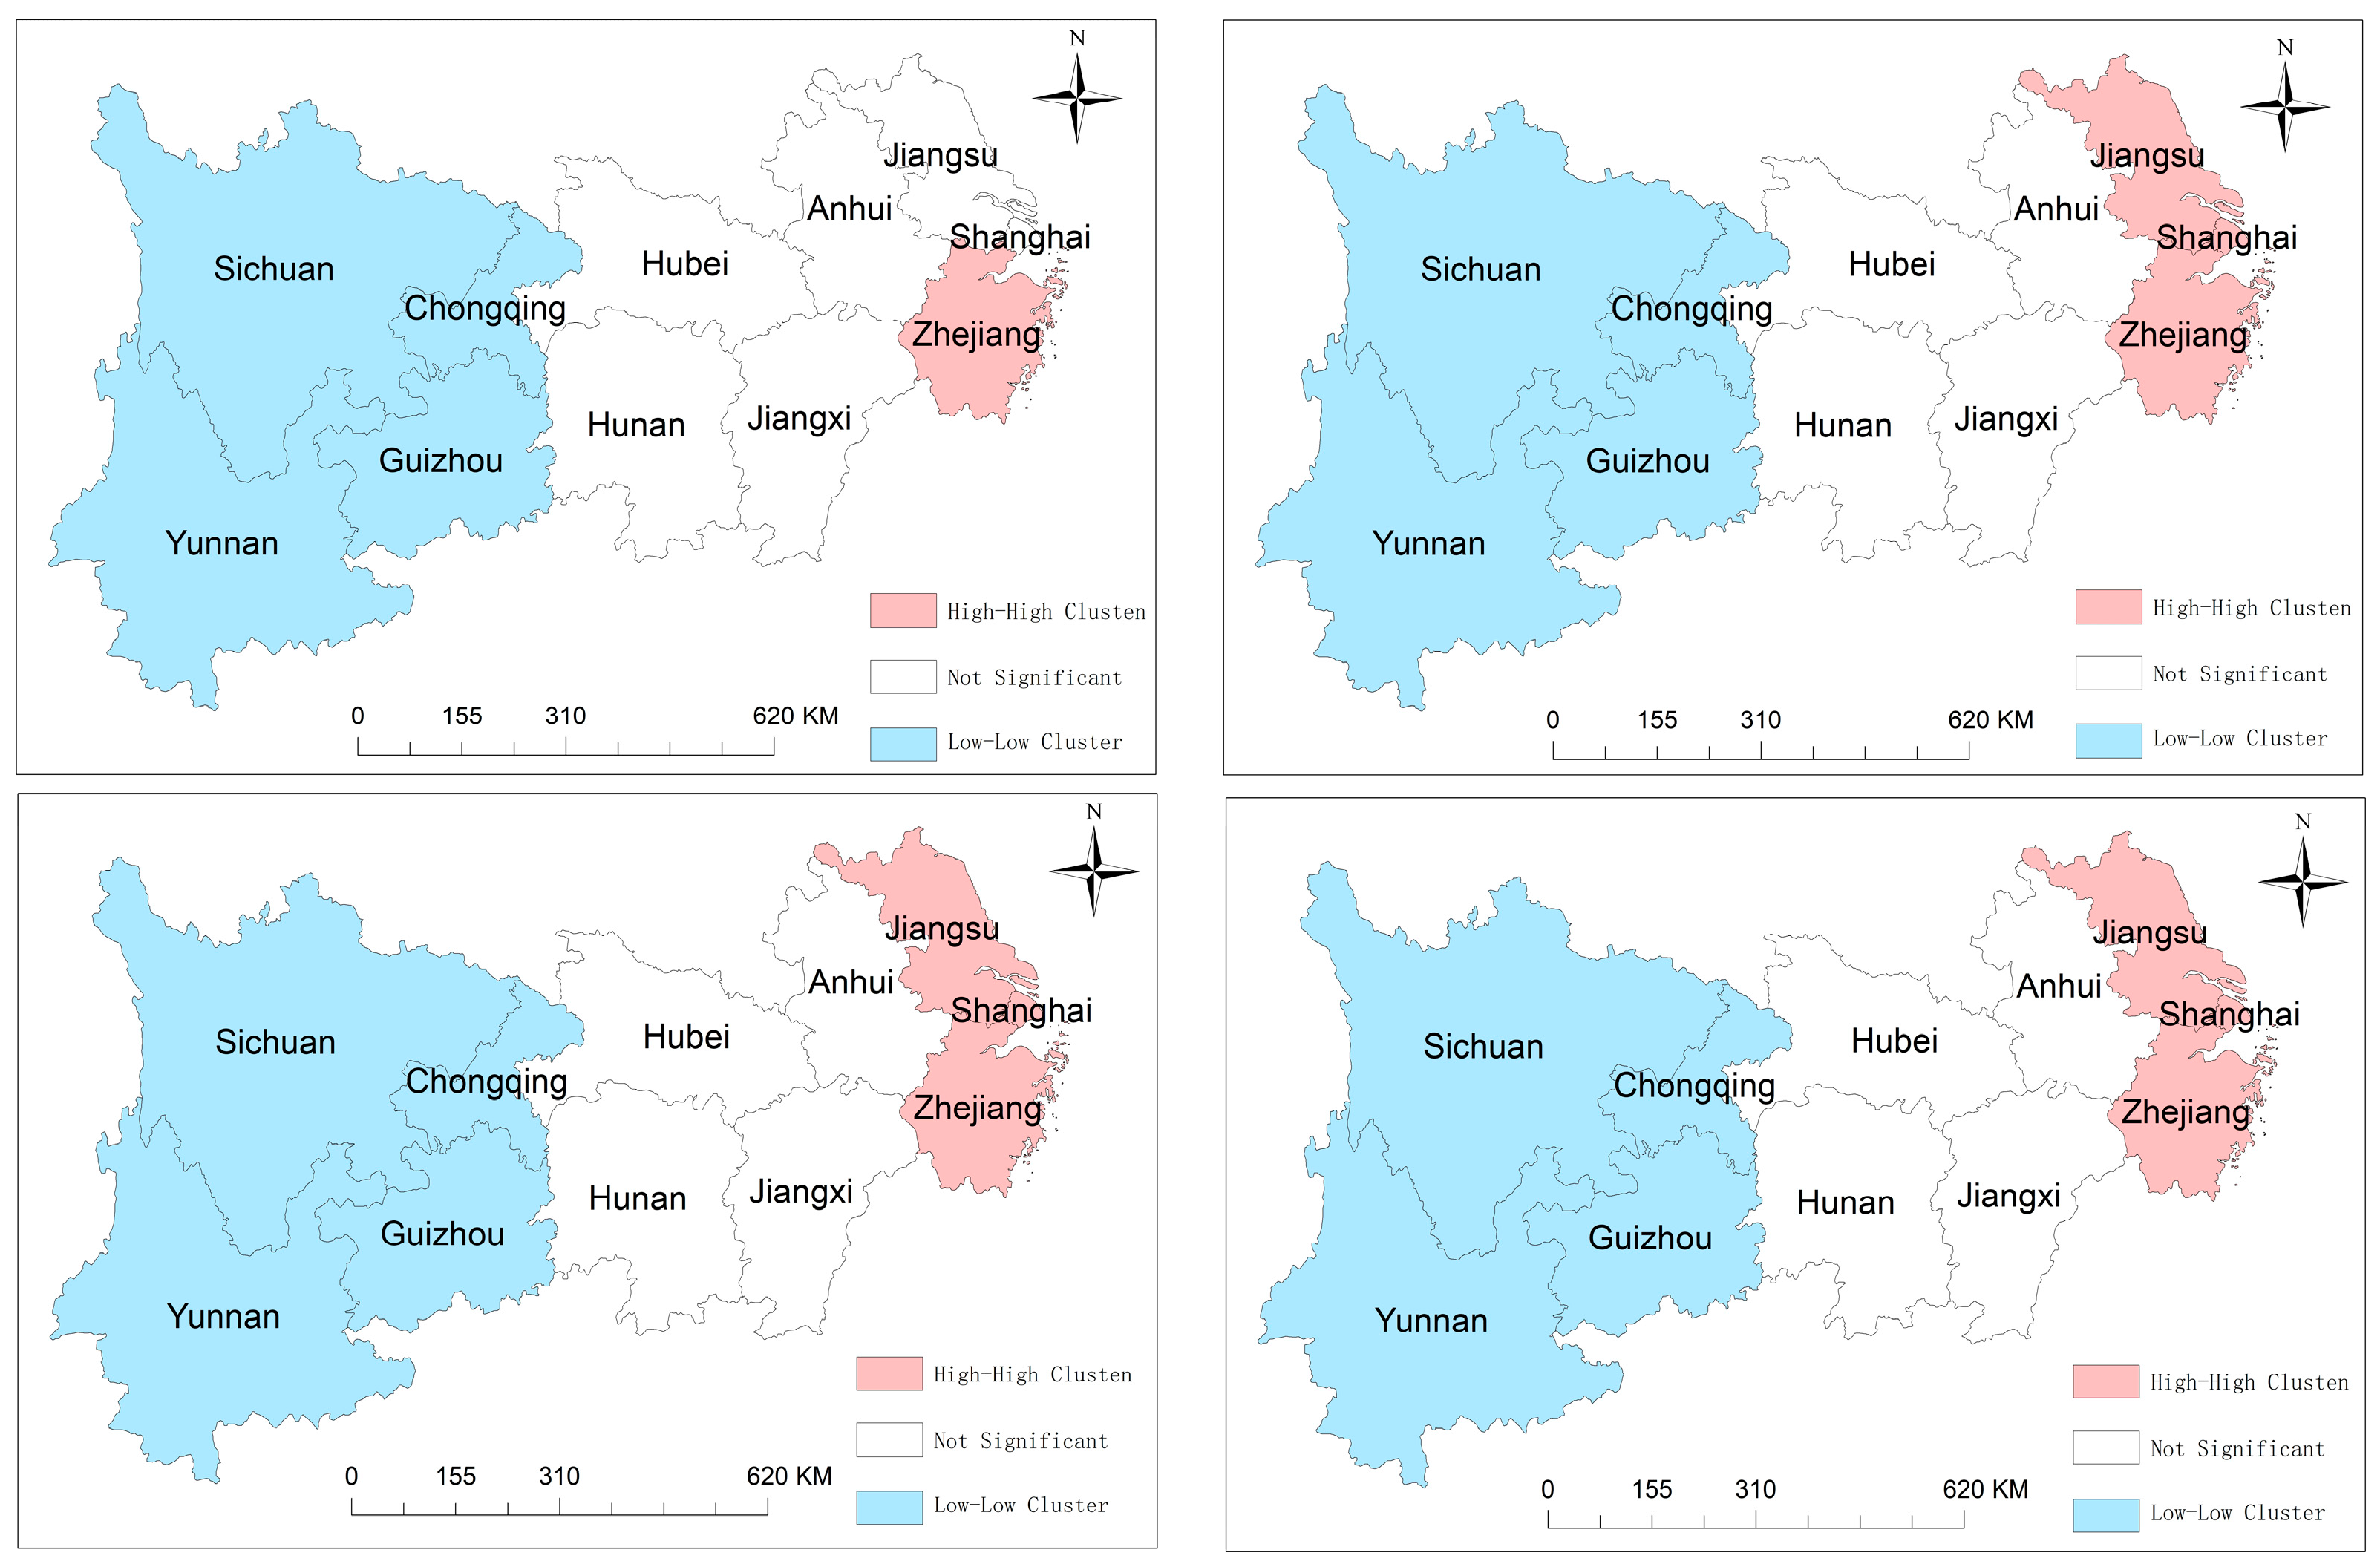
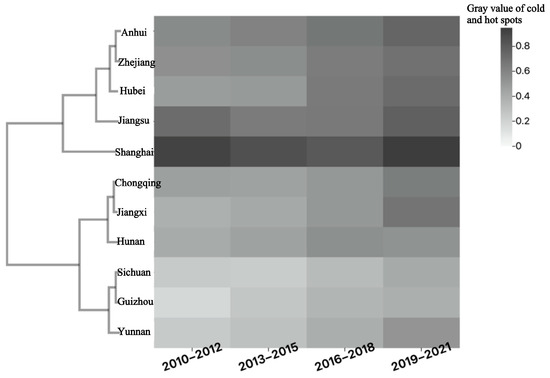
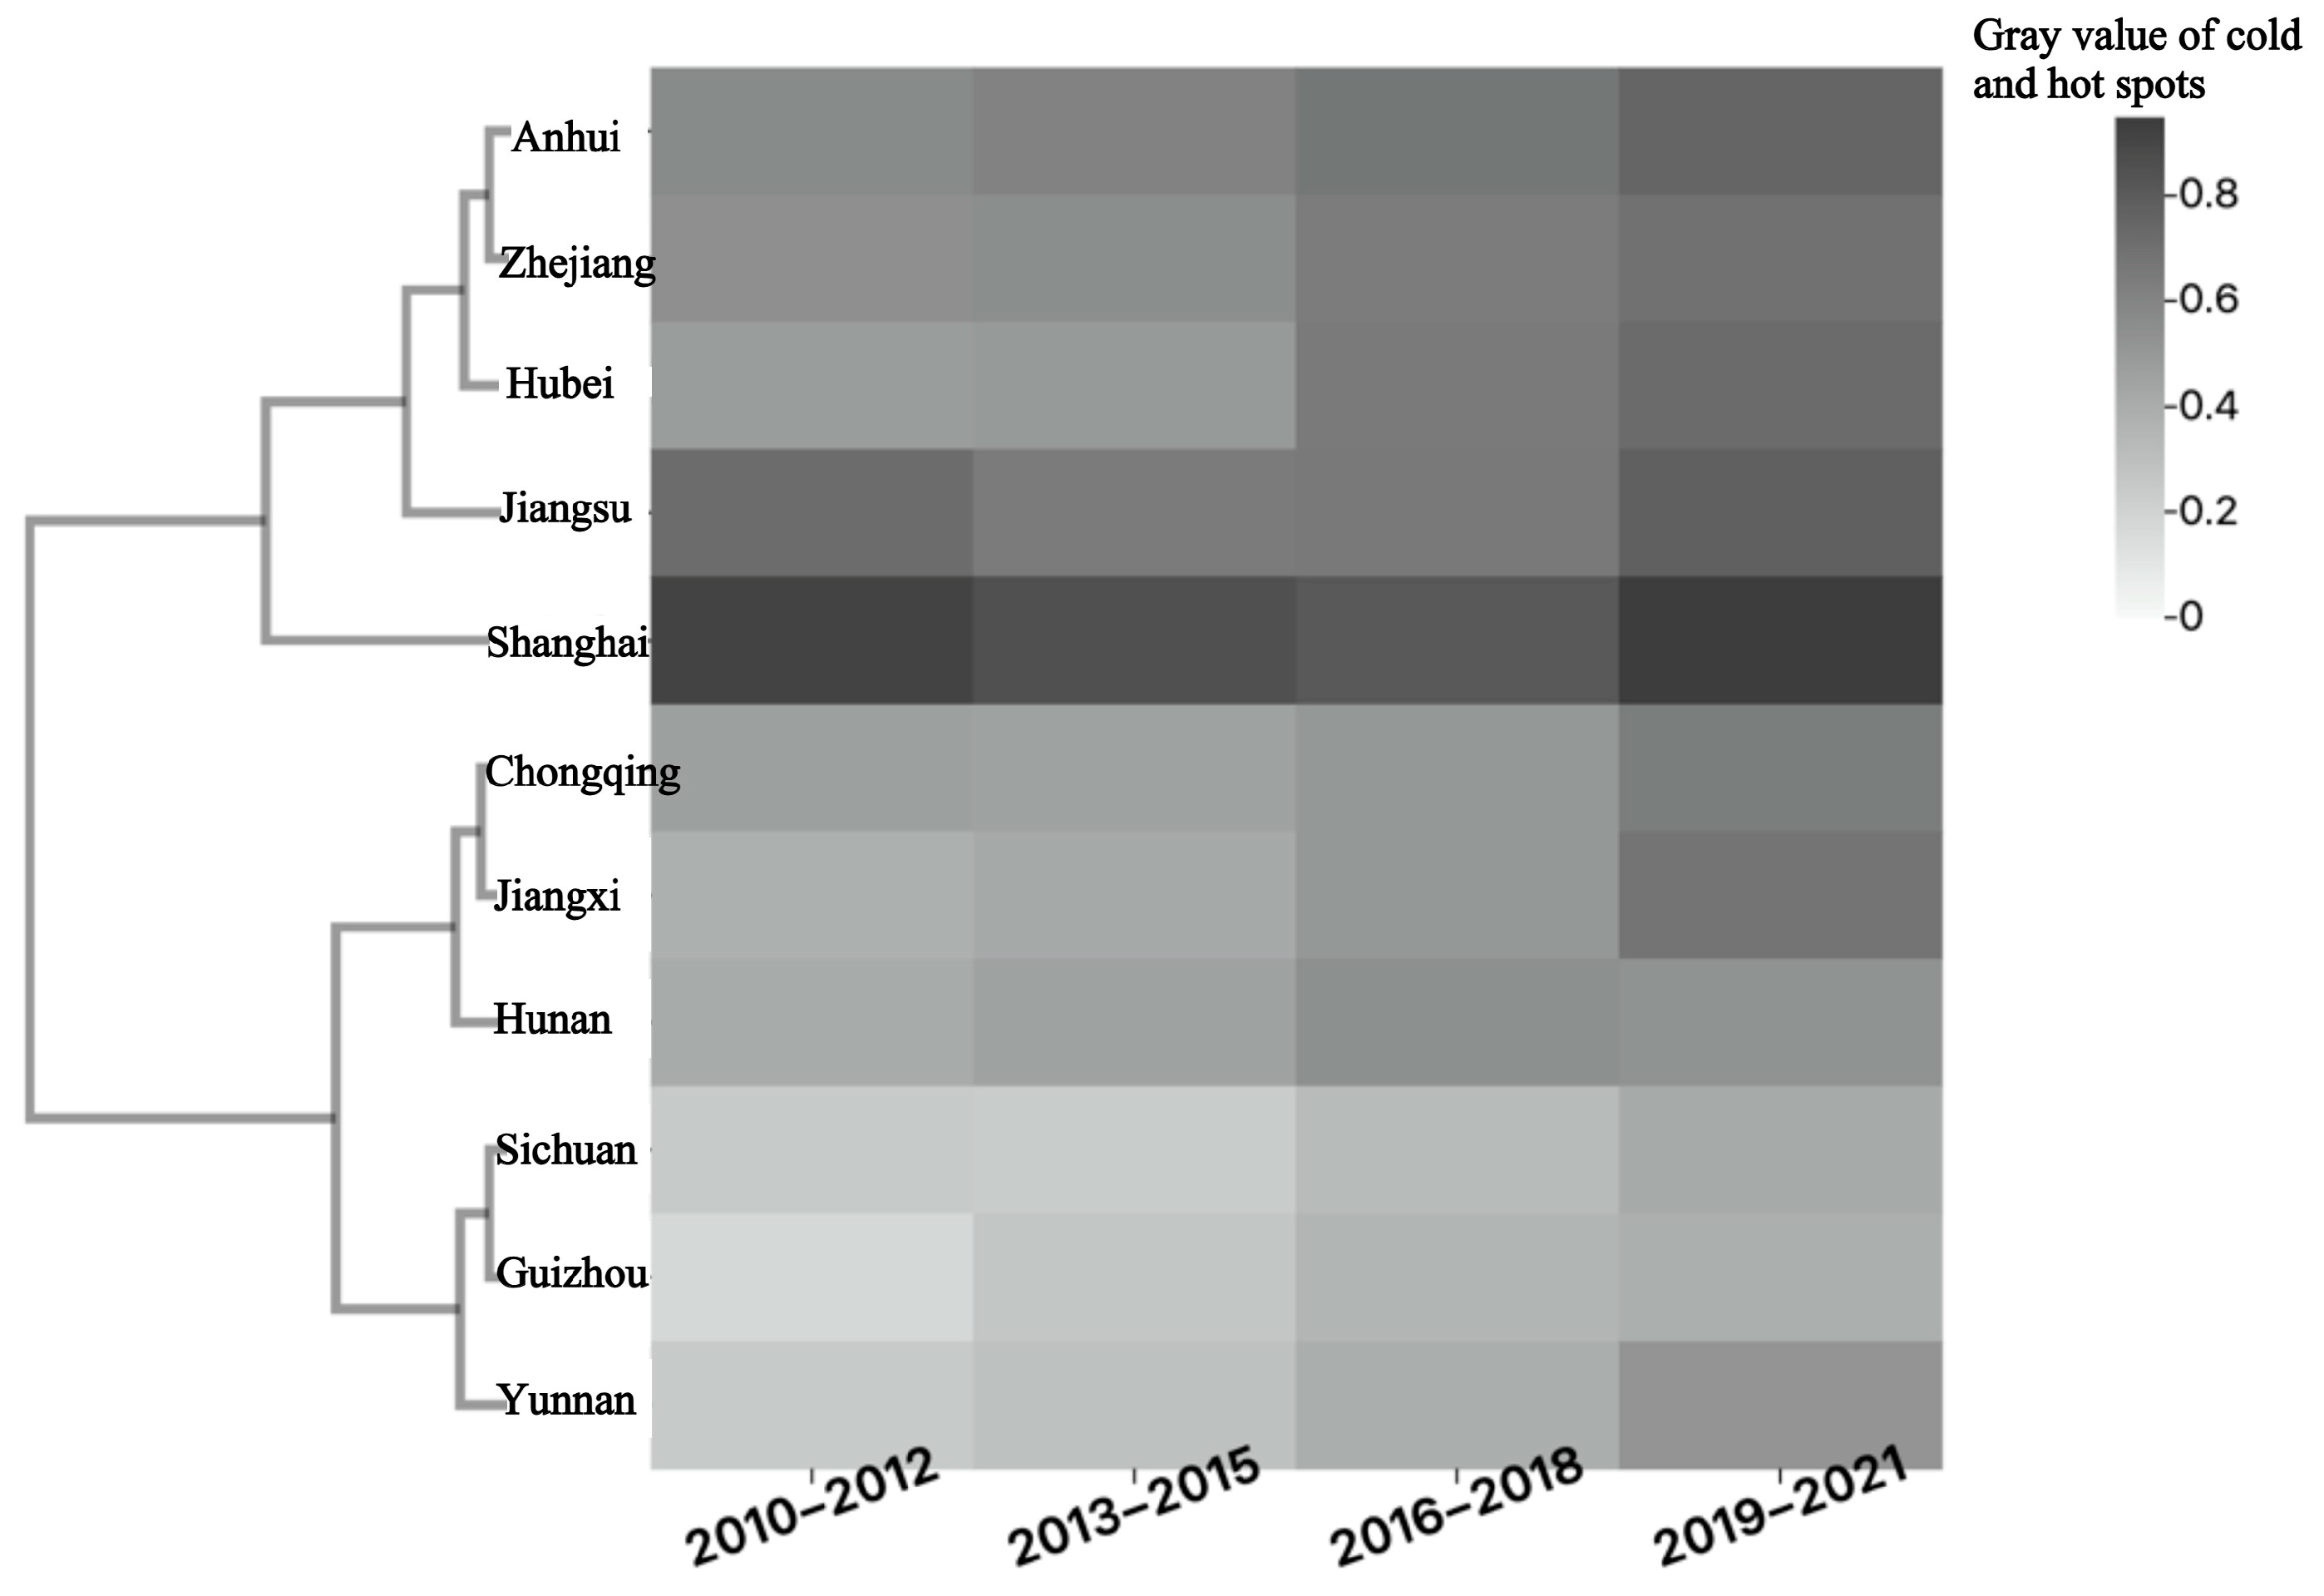

Disclaimer/Publisher’s Note: The statements, opinions and data contained in all publications are solely those of the individual author(s) and contributor(s) and not of MDPI and/or the editor(s). MDPI and/or the editor(s) disclaim responsibility for any injury to people or property resulting from any ideas, methods, instructions or products referred to in the content. |
© 2026 by the authors. Licensee MDPI, Basel, Switzerland. This article is an open access article distributed under the terms and conditions of the Creative Commons Attribution (CC BY) license.