


Highlights
Please indicate how your work links to systems science via your contributions to systems practice, theory, and/or methodology.
- •
- From a systems perspective, this study integrates interrelated information activities across the organizational information life cycle and conceptualizes information-flow waste within a unified process-and-value framework.
- •
- The validated 23-item scale enables an overall assessment and stage-specific diagnosis of information-flow waste within organizations and provides a measurement basis for comparisons among the job groups examined in this study.
What are the main findings and/or the implications of the main findings?
- •
- Results support a second-order structure comprising information acquisition, information transmission, information storage, and information processing, and the scale achieves strict measurement invariance across production and operations, professional and technical, and supervisory and managerial job groups.
- •
- Information-flow waste and each of its four dimensions are significantly and positively associated with information overload, indicating that analyses of employee information overload should consider not only information quantity but also the additional demands on employees’ time, attention, and cognitive resources associated with nonessential information processing.
Abstract
Information-flow waste refers to activities within organizational information flows that consume resources without creating value, yet standardized instruments for systematically measuring this construct remain lacking. This study aims to clarify the construct structure of information-flow waste and develop a corresponding scale. Candidate items were generated through literature analysis, expert interviews, and cognitive interviews. The scale was then purified and validated using two independent manufacturing samples (n = 266 and n = 287) through exploratory factor analysis, confirmatory factor analysis, measurement invariance testing, and nomological validity testing. The results support a second-order structure comprising information acquisition, information transmission, information storage, and information processing, yielding a final 23-item Information-Flow Waste Scale. The scale demonstrates good reliability, convergent validity, and discriminant validity and achieves strict measurement invariance across production and operations, professional and technical, and supervisory and managerial job groups. Information-flow waste is significantly and positively associated with information overload, providing initial support for the scale’s nomological validity. This study provides a standardized measurement instrument for subsequent empirical research on information-flow waste and, in manufacturing contexts, a measurement basis for identifying manifestations of waste across stages of information flow and conducting subsequent problem analysis.
1. Introduction
As organizations become increasingly dependent on information, information has become a critical resource supporting organizational operations, strategic planning, decision-making, and business coordination. Accordingly, information management capability is widely regarded as an important foundation of organizational efficiency, long-term performance, and competitive advantage [1,2]. Prior research indicates that information management concerns not only information as an object but also information flows, namely, the dynamic processes through which information moves and is transformed among different actors. The core of information management is to facilitate the efficient acquisition, processing, and use of information so that it can flow smoothly within organizations and realize its value [3]. In organizational practice, however, missing, distorted, redundant, delayed, and difficult-to-access or retrieve information is widespread. Such problems not only weaken information availability, accuracy, and timeliness but also trigger additional information-processing activities, such as waiting, verification, and rework, thereby reducing the efficiency of organizational information flows and causing unnecessary consumption of organizational resources [1].
Information value is not an inherent property of information itself; rather, it is the contribution that information makes by meeting users’ needs and supporting relevant activities in a particular context of use. Whether an information-flow activity creates value depends on whether it contributes to the realization of information value [4]. Based on the lean management view of waste, information-flow waste can be defined as activities within information flows that consume time, human effort, and other organizational resources without creating value [5]. Information-flow waste reduces process efficiency and increases information-processing costs. When employees continually devote their limited time and effort to non-value-adding activities, their efforts are less likely to be converted into effective outputs, potentially increasing cognitive load and work stress, generating frustration, and further affecting employee behavior [6,7,8]. The emergence of information-flow waste may be jointly influenced by organizational capabilities, governance mechanisms, and management practices [9,10], while its adverse effects may vary with task characteristics, organizational contexts, and employees’ coping capabilities [11,12].
Information-flow waste is an important object of inquiry in lean information management and provides a valuable perspective for explaining how organizational contextual factors influence organizational performance and employee behavior. Related research on information quality and information overload provides an important basis for understanding information problems in organizations. However, such research primarily examines whether information attributes meet use requirements or whether the quantity of information exceeds individuals’ processing capacity. It therefore cannot systematically reveal the resource consumption generated by non-value-adding activities within information flows and cannot substitute for the independent examination of information-flow waste [13,14,15]. In manufacturing operations, lean-management research has accumulated substantial empirical evidence and theoretical development regarding continuous improvement, employee involvement, and their performance implications [16,17]. By contrast, research on information-flow waste remains concentrated on conceptual definitions, typological classifications, case analyses, and the development of improvement tools for specific processes and contexts [9,10,18], while empirical research on its antecedents, consequences, and boundary conditions remains limited.
Systematically examining these antecedents, consequences, mechanisms, and boundary conditions first requires a clear definition and reliable measurement of information-flow waste. Existing studies have provided preliminary insights into its manifestations, sources, and improvement approaches, but this knowledge remains fragmented, and information-flow waste has not yet been developed into a construct that has clear boundaries and an explicit structure and can be measured in a standardized manner [10,18]. To address this gap, this study develops the construct of information-flow waste by integrating prior research and identifying its key dimensions from an information-life-cycle perspective. The study then uses survey data to purify and validate an Information-Flow Waste Scale. By providing a validated conceptual framework and corresponding measurement scale, this study contributes to a more systematic understanding of waste in organizational information flows and establishes a foundation for subsequent empirical research and theory development.
The remainder of this paper is organized as follows. Section 2 presents the theoretical background and construct development of information-flow waste. Section 3 describes the scale development procedure, item generation, cognitive interviews, samples, and data analysis strategy. Section 4 reports the results of scale purification, scale validation, and nomological validity testing. Section 5 discusses the findings, theoretical and practical implications, limitations, and directions for future research. Section 6 concludes the paper.
2. Theoretical Background and Construct Development
Lean thinking provides the theoretical starting point for understanding and improving waste in information management processes. Lean management defines value from the customer’s perspective, regards activities that consume time, human effort, and other resources without creating customer value as waste, and improves value flow and value-creation efficiency by identifying and eliminating such activities [16]. To establish fundamental principles and an improvement framework for information management, Hicks introduced lean thinking into this field and proposed lean information management [5]. Lean information management emphasizes identifying and eliminating waste in information management processes so that appropriate, accurate, and timely information flows effectively to users, thereby improving the efficiency and quality of information management processes and supporting organizational performance improvement [4].
However, the terminology used in prior research to describe waste in information management processes is not fully consistent. Hicks used the phrase “waste within the context of information management” and described it as the “additional actions and inactivity” arising when users cannot immediately obtain an appropriate quantity of suitable, accurate, and up-to-date information [5]. Subsequent studies have used terms such as “information waste,” “waste in/within information flows,” “information-logistics waste,” and “information flow waste.” Although these terms vary according to research context and analytical emphasis, they all refer to waste arising at different stages of information flow [18,19]. To avoid interpreting “information waste” as referring only to useless, low-quality, or redundant information, this study adopts “information-flow waste” as the construct name.
Following this line of inquiry, some studies have attempted to map the seven wastes of manufacturing onto information management [19]. This mapping provides a useful starting point for research on information-flow waste. Unlike physical entities, however, information is characterized by intangibility, compressibility, scalability, and high-speed transmission [20]. These characteristics make information-flow waste less directly observable than scrap, inventory, or material movement. In digital information systems, traditional waste categories such as transportation, inventory, and motion cannot fully retain their original meanings from physical production. Compared with visible physical waste, information-flow waste is often dispersed across different information activities, and its identification is more context-dependent. The seven manufacturing wastes and information-flow waste, therefore, do not correspond on a one-to-one basis but overlap only partially. Information-flow waste must still be identified from the characteristics of information and its flow.
The value of information is ultimately judged by its users because they are the actors who use information to support decisions and related activities [13]. From this perspective, information-quality research evaluates whether information meets users’ needs in specific use contexts and focuses on attributes such as accuracy, completeness, timeliness, relevance, understandability, and accessibility. It therefore provides an important basis for evaluating information content, presentation, and access conditions. However, even when information is of high quality in these respects, its flow may still involve repeated entry, repeated transmission, redundant storage, and unnecessary conversion or processing, thereby consuming additional time, human effort, and system resources and reducing the efficiency with which information value is realized [5,21]. Information-flow waste and information quality therefore overlap in certain manifestations but differ in their evaluative perspectives. Information-flow waste is judged by whether activities consume resources without creating value; it encompasses both waste induced by information-quality problems and other forms of waste across stages of information flow. Comprehensive identification of information-flow waste therefore requires a systematic analysis of information activities within organizations.
Information-behavior research and the information-management process perspective provide different approaches to analyzing organizational information activities. Information-behavior research centers on information users and examines behaviors such as searching, acquiring, exchanging, and using information in response to information needs, thereby providing an important basis for understanding how organizational members participate in information activities [22]. This perspective primarily explains why and how individuals interact with information; it is not intended to divide the principal activities within organizational information flows systematically. Because this study seeks to define comprehensively the range of activities in which information-flow waste can occur, it requires an analytical framework that systematically covers major information activities while maintaining consistency in the level of categorization. The information-management process perspective is therefore more suitable as the basis for dimensional classification.
The information-management process perspective understands information management as a series of interrelated activities spanning the information life cycle and emphasizes the integrated management of information formation, flow, and use within organizations. By organizing different information activities within a unified process framework, this perspective provides a basis for systematically defining the activity domain in which information-flow waste may occur. Existing information-management process models differ in how they name specific activities and in the granularity of their classifications. For example, Choo divides information management into identifying information needs, acquiring information, organizing and storing information, developing information products and services, distributing information, and using information, whereas Wilson distinguishes acquisition, organization, storage, retrieval, access, and dissemination [3]. Despite these differences, the activities included in these models perform four principal functions within information flows: bringing information within users’ scope of use; enabling information to flow among actors, departments, and systems; organizing, preserving, and retrieving information; and arranging, transforming, and integrating information to produce task-required outputs.
To maintain consistent criteria and levels of analysis across dimensions, this study consolidates related activities from different models according to these principal functions. The information acquisition dimension corresponds to activities through which information enters organizational members’ scope of use and is matched with task requirements. The information transmission dimension corresponds to activities through which information flows and is exchanged among different actors, departments, media, or systems. The information storage dimension corresponds to the organization, preservation, maintenance, and retrieval of information. The information processing dimension corresponds to the analysis and transformation of existing information into task outputs. On this basis, this study conceptualizes information-flow waste as comprising four dimensions: information acquisition, information transmission, information storage, and information processing.
3. Materials and Methods
3.1. Scale Development Procedure
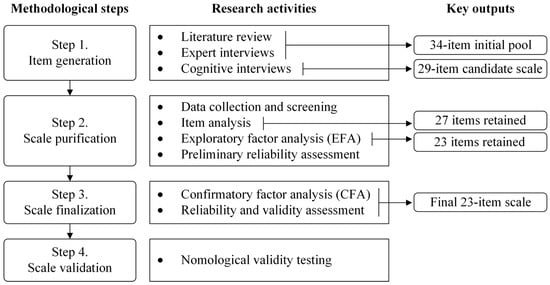
To develop an Information-Flow Waste Scale with high reliability and validity, this study followed widely recognized procedures for scale development and validation [23,24]. Initial measurement items were first generated through a literature review and expert interviews and then revised and screened through cognitive interviews. During scale purification, exploratory factor analysis (EFA) was conducted on the initial survey sample using SPSS version 26. During scale finalization, confirmatory factor analysis (CFA) was conducted on the validation sample using AMOS version 24. Finally, information overload was used as an external construct for an initial test of the scale’s nomological validity. Figure 1 presents the scale development and validation procedure, research activities at each stage, key outputs, and changes in the number of items.
Figure 1.
Methodological process for scale development and validation.
3.2. Item Generation
During item development, this study first identified specific manifestations of information-flow waste within each dimension through literature analysis. Drawing on the information-management process perspective, Tian et al. analyzed information flows in terms of structural elements such as information content, transmission media, storage media, and intelligent agents. Their analysis provided a basis for systematically identifying manifestations of information-flow waste across the four dimensions and generating preliminary items [3]. The study also reviewed established formulations from research on information quality, data quality, knowledge transfer, information sharing, task-technology fit, and media richness; selected content that could reflect information-flow waste within the four dimensions; and integrated and contextually adapted this content to organizational work settings.
To supplement the literature analysis and evaluate the content appropriateness of the preliminary items, semi-structured expert interviews were conducted with 12 experts: four scholars in relevant fields, four business managers, and four domain experts. The scholars primarily conducted research on information management, lean management, process optimization, or digital transformation. The managers and domain experts were mainly from manufacturing firms and had practical experience in production operations, process optimization, cross-departmental coordination, or digital-system development; their daily work involved substantial processing and flow of business information. All interviewees had more than five years of relevant research or practical experience. The interviews were conducted individually and lasted approximately 45–60 min. The interview guide used open-ended questions, with follow-up probes based on the interviewees’ responses. First, the interviewees were asked to draw on their actual work experience to describe the information activities involved in specific work tasks, particularly the problems they encountered. The researchers then probed further into the context in which these problems arose, the specific processing procedures involved, the additional resource inputs required as a result, and the effects of these problems on task progression. After these open-ended descriptions, the research team provided the interviewees with the construct definition of information-flow waste, descriptions of the four dimensions, and the preliminary items derived from the literature analysis. The interviewees then assessed the alignment between the preliminary items and the construct definition, the dimensional assignment of items, content overlap among items, the clarity of item wording, and applicability to work contexts, and offered suggestions for adding, merging, deleting, or revising items.
The research team organized the interview records into textual materials for analysis. Two researchers independently analyzed these materials. First, they extracted specific manifestations of information-flow waste added by the experts, assigned them to information acquisition, transmission, storage, or processing according to the information activities involved, and consolidated semantically similar content. Second, they summarized the experts’ evaluations and revision suggestions for each preliminary item. After completing their independent analyses, the two researchers compared their results and reached consensus through discussion, on the basis of which they supplemented and revised the preliminary items derived from the literature. Specifically, items were added for manifestations mentioned by multiple experts and consistent with the construct definition; items with highly overlapping meanings were merged; items inconsistent with the construct definition or with unclear dimensional assignment were removed or adjusted; and items that were ambiguous, overly technical, or inconsistent with actual work contexts were contextually reworded.
3.2.1. Information Acquisition Dimension
The information acquisition dimension captures the mismatch between the information obtained by organizational members and the requirements of their current tasks. Prior research on information quality and data quality indicates that the effective use of information depends not only on its accuracy but also on whether it is timely, relevant, appropriate in amount, and easy to understand and use [25]. When acquired information does not meet task requirements, organizational members often need to perform additional checking, completion, filtering, interpretation, or cross-validation. These activities increase information-processing costs and weaken the support that information provides for task execution, thereby constituting waste at the information acquisition stage [21]. Item development for this dimension focused primarily on key attributes of information content and drew on established formulations from research on information quality, data quality, and task-technology fit [26,27].
3.2.2. Information Transmission Dimension
The information transmission dimension captures inefficiency and distortion as information flows among different actors, departments, media, or systems. Prior research on communication behavior, knowledge flows, and supply-chain information sharing indicates that effective transmission depends not only on whether information is sent but also on whether transmission channels operate smoothly, communication quality is adequate, and information reaches the intended recipient promptly and in an appropriate form [28,29,30,31]. When blocked paths, inconvenient channels, transmission distortion, inappropriate frequency, or unclear sources generate additional waiting, follow-up inquiries, confirmation, forwarding, or repeated transmission, organizational members must devote additional time to tracking and correcting information. This increases information-processing costs and disrupts task progression, thereby constituting waste at the information transmission stage. Item development for this dimension focused primarily on key attributes of transmission media and drew on established formulations from research on knowledge transfer, task-technology fit, information sharing, communication quality, and channel richness [26,28,29,30].
3.2.3. Information Storage Dimension
The information storage dimension captures inefficiency and failure in preserving, entering, organizing, retrieving, and reusing information. Prior research on knowledge management and information quality indicates that storage is not merely the retention of information but an important foundation for maintaining organizational memory and supporting subsequent access, retrieval, and reuse. Whether information is entered promptly, preserved completely, organized appropriately, and accessed conveniently directly affects the subsequent realization of its value [32,33]. When information that should be retained is not stored promptly, completely, or accurately; stored information is disorganized or difficult to retrieve quickly; or stored information is difficult to review and reuse, organizational members must devote additional time to searching, checking, backfilling, reconstructing, or regenerating information. These activities constitute waste at the information storage stage. Item development for this dimension focused primarily on key attributes of storage media and drew on established formulations from research on knowledge storage and repositories, information quality, and accessibility [32,33,34].
3.2.4. Information Processing Dimension
The information processing dimension captures processing redundancy and failure in transforming raw informational inputs into task outputs. Prior knowledge-management research indicates that effective knowledge application depends on integrating information or knowledge from different sources and applying it to problem solving, judgment, and decision-making; only through effective processing can information be transformed into actionable information that supports task execution [35]. Research on cognitive load, technology overload, and technostress further indicates that individual efficiency, accuracy, and stability may decline when processing is excessively complex, information and functions are overloaded, technological requirements change frequently, or tasks continually require excessive cognitive resources [6,7,36]. When information processing involves unnecessary steps, repeated processing, delays, or outputs that cannot directly support subsequent decisions and actions, organizational members must devote additional time to organizing, analyzing, correcting, or reworking information. These activities increase the cost of producing usable information and delay task progression, thereby constituting waste at the information processing stage. Item development for this dimension focused primarily on key attributes of processing agents and drew on established formulations from research on knowledge application, cognitive load, and technostress [6,35].
In summary, by focusing on information acquisition, information transmission, information storage, and information processing and drawing on research on structural attributes of information flows, established scale formulations from related studies, and feedback from expert interviews, this study developed an initial pool of 34 items for the Information-Flow Waste Scale.
3.3. Cognitive Interviews
Before formal scale validation, cognitive interviews were conducted to examine whether the item wording was clear and easy to understand and whether the response format was appropriate. Prior research indicates that cognitive-interview samples are typically small, generally ranging from 5 to 15 participants [37]. Five respondents familiar with information management, lean management, process optimization, and digitalization practices participated in the cognitive interviews. They first completed an initial questionnaire containing 34 items and then provided feedback on their understanding of each item, its content relevance, and the feasibility of responding.
During the interviews, the researchers focused on whether respondents understood each item accurately, whether the item content reflected manifestations of information-flow waste in work settings, and whether the response options were convenient and appropriate. Feedback centered on insufficiently clear wording, content that combined multiple judgments, and inadequate fit between certain items and actual work contexts. In response, items with wording or comprehension problems were rephrased, items containing multiple judgments were split where necessary, and items that could not accurately reflect the intended construct or were unsuitable for retention were removed.
Following revision through the cognitive interviews, the initial 34 items were reduced to 29 candidate items for subsequent scale purification. Table 1 lists the 29 candidate items and the principal reference models used to develop the items within each dimension.
Table 1.
Initial dimensions, candidate items, and reference-model sources for the Information-Flow Waste Scale.
3.4. Samples and Data Collection
3.4.1. Sample I for Scale Purification
To purify the initial items of the Information-Flow Waste Scale and examine its underlying dimensional structure, a first independent survey was conducted in a manufacturing context using purposive sampling. Because information-flow waste primarily arises during the acquisition, transmission, storage, and processing of information in manufacturing operations, the study focused on job groups closely related to manufacturing operations and directly involved in information-flow processes in their daily work. This focus was intended to ensure that respondents could answer on the basis of actual experience with information use and processing. To ensure sufficient exposure to organizational information flows and information-system use, respondents were required to hold positions directly involved in, or closely related to, manufacturing operations and to have worked in their current positions for at least six months.
Through enterprise collaboration channels, questionnaires were administered through a combination of online distribution and on-site investigation in manufacturing settings. At the beginning of the questionnaire, respondents were informed of the study’s purpose and the principle of anonymity, were explicitly told that the data would be used solely for academic research, and were advised that they could withdraw voluntarily at any stage. These procedures were intended to reduce social desirability bias and improve response quality [38]. A total of 328 questionnaires were collected. During data cleaning, the raw responses were screened according to predefined criteria. Questionnaires were sequentially excluded if they contained missing responses to key items, were completed in less than 120 s, displayed obvious response regularities (e.g., long strings of identical responses or repeated patterns), or failed the attention check [39]. Respondents’ eligibility regarding job background and tenure in the current position was then rechecked. After these procedures, 266 valid responses were retained, yielding a valid response rate of 81.1%.
Among the valid respondents, approximately 72.6% were male (193 respondents) and 27.4% were female (73 respondents). Their mean age was 33.8 years, and their mean work experience was 8.1 years. Frontline employees accounted for approximately 41.4% (110 respondents), team or section leaders for 19.5% (52 respondents), functional engineers (e.g., quality, equipment, process, and planning) for 28.6% (76 respondents), and managers for 10.5% (28 respondents). All measurement items were assessed on a five-point Likert-type frequency scale anchored from 1 = never to 5 = always.
3.4.2. Sample II for Scale Validation
A second independent survey was conducted to perform confirmatory factor analysis (CFA) and finalize the scale. Consistent with the first survey, purposive sampling was used to recruit respondents in job groups closely related to manufacturing operations and directly involved in information-flow processes in their daily work. The inclusion criteria were identical to those used in the first survey: respondents were required to hold positions directly involved in, or closely related to, manufacturing operations and to have worked in their current positions for at least six months.
Through enterprise collaboration channels, the second survey also combined online questionnaire distribution with on-site investigation in manufacturing settings. A total of 350 questionnaires were distributed, and 287 valid responses were retained after data cleaning for subsequent CFA. Among the valid respondents, approximately 70.4% were male (202 respondents) and 29.6% were female (85 respondents). Their mean age was 34.6 years, and their mean work experience was 8.3 years. Frontline employees accounted for approximately 38.3% (110 respondents), team or section leaders for 22.6% (65 respondents), functional engineers (e.g., quality, equipment, process, and planning) for 28.6% (82 respondents), and managers for 10.5% (30 respondents). Unlike the first survey, the second questionnaire retained only the formal candidate items resulting from EFA purification and used them to further assess the scale’s structural stability, reliability, and validity.
3.5. Data Analysis Strategy
The first survey sample was used for item analysis and EFA. Corrected item-total correlations (CITC), descriptive statistics, the Kaiser–Meyer–Olkin (KMO) statistic, Bartlett’s test of sphericity, communalities, factor loadings, and reliability coefficients were examined to purify the scale. The second survey sample was used for CFA and scale validation. The analyses assessed model fit, standardized factor loadings, Cronbach’s alpha, composite reliability (CR), average variance extracted (AVE), Fornell–Larcker discriminant validity, and the heterotrait–monotrait ratio of correlations (HTMT). A second-order CFA model was further tested to evaluate whether information acquisition, information transmission, information storage, and information processing could be represented as first-order dimensions of the higher-order construct of information-flow waste.
To test nomological validity, information overload was measured as an external criterion variable using a widely recognized information-overload scale [36]. The three items were: (1) I am often distracted by the excessive amount of information available to me, which affects my work judgment or decision-making; (2) The amount of information I need to process every day makes me feel overwhelmed; and (3) My problem is usually that I need to integrate too much information. A structural model was then constructed to examine the relationship between information-flow waste and information overload, and the relationships of information acquisition, information transmission, information storage, and information processing with information overload were also tested separately.
4. Results
4.1. Scale Purification
A CITC value of at least 0.30 was used as the basic criterion for retaining items [40], together with item content and changes in internal consistency after item deletion. Item 18 and Item 25 had CITC values of 0.285 and 0.198, respectively, below the prespecified threshold, and were therefore removed. The remaining 27 items were entered into EFA. Before factor extraction, the KMO statistic and Bartlett’s test of sphericity were used to assess the suitability of the data for factor analysis. In general, a KMO value above 0.80 indicates good suitability for factor analysis [41]. The overall KMO value was 0.920, and Bartlett’s test of sphericity was significant (χ2(351) = 3893.503, p < 0.001), indicating that the data were suitable for subsequent factor analysis.
EFA was conducted using principal component analysis with Varimax orthogonal rotation. Items were evaluated according to factor loadings and potential cross-loadings, together with their theoretical meanings. Items with a highest factor loading below 0.50 or loadings above 0.40 on two or more factors were subjected to further review [41]. The communalities of the 27 items ranged from 0.512 to 0.708 and were all acceptable. Based on the eigenvalue-greater-than-one criterion, four factors were extracted, cumulatively explaining 61.274% of the total variance [41].
The rotated factor-loading matrix showed cross-loadings for Item 10 and Item 16. Item 10 loaded 0.545 on information transmission and 0.424 on information acquisition, whereas Item 16 loaded 0.523 on information transmission and 0.456 on information storage. The highest loadings of Item 11 and Item 29 did not occur on their theoretically expected factors. Item 11 loaded 0.408 on information transmission and 0.477 on information processing, with its highest loading below 0.50. Item 29 loaded 0.419 on information processing and 0.529 on information acquisition. Considering their factor loadings, cross-loadings, and theoretical assignments, Item 10, Item 11, Item 16, and Item 29 were removed from subsequent analyses.
After these four items were removed, an overall EFA was conducted on the 23 retained items to examine the purified factor structure. The KMO value was 0.923, and Bartlett’s test of sphericity was significant (χ2(253) = 3105.836, p < 0.001). Based on the eigenvalue-greater-than-one criterion, four factors were extracted, cumulatively explaining 63.596% of the total variance. All items had primary loadings ranging from 0.695 to 0.811 and communalities ranging from 0.522 to 0.729 and loaded primarily on their theoretically expected factors, indicating that no further item deletion was required. Table 2 presents the EFA results for the final 23 items. Internal consistency within each dimension was further assessed using CITC and Cronbach’s alpha. All item CITC values exceeded 0.50, with a minimum of 0.598. Cronbach’s alpha values for the four dimensions ranged from 0.801 to 0.917, exceeding the recommended threshold of 0.70 [40] and indicating good internal consistency. Thus, 23 of the original 29 candidate items were retained to form the purified Information-Flow Waste Scale for subsequent CFA.
Table 2.
Summary of exploratory factor analysis results.
4.2. Scale Validation
CFA was first conducted in AMOS to test a measurement model comprising four correlated first-order reflective factors—information acquisition, information transmission, information storage, and information processing—and to assess reliability, convergent validity, and discriminant validity. The results are presented in Table 3. The correlated first-order four-factor measurement model exhibited a good fit (χ2 = 399.181, df = 224, χ2/df = 1.782, CFI = 0.958, TLI = 0.952, RMSEA = 0.052, SRMR = 0.043) [42]. All standardized item loadings on their respective dimensions were significant (p < 0.001) and ranged from 0.674 to 0.849, indicating that the items adequately reflected their corresponding dimensions.
Table 3.
Confirmatory factor analysis results.
Internal consistency was assessed using Cronbach’s alpha and composite reliability (CR). Cronbach’s alpha values ranged from 0.867 to 0.923, and CR values ranged from 0.868 to 0.924, all exceeding the recommended threshold of 0.70 [40]. AVE values ranged from 0.576 to 0.690 and exceeded the recommended threshold of 0.50 [43]. The scale therefore demonstrated good internal consistency and convergent validity.
Discriminant validity was first assessed using the Fornell–Larcker criterion. The square root of the AVE for each dimension exceeded its correlations with the other dimensions [43]. Further analysis showed that HTMT values among the dimensions ranged from 0.584 to 0.669, below the acceptable threshold of 0.90 [44], supporting the scale’s discriminant validity.
To further examine the latent structure of information-flow waste and the relative adequacy of alternative measurement structures, four competing models were compared: a one-factor model in which all items loaded on a single factor (M1); a correlated first-order four-factor model comprising four related first-order dimensions (M2); a second-order model in which the four first-order dimensions jointly reflected overall information-flow waste (M3); and a bifactor model in which all items loaded simultaneously on a general factor and their respective specific dimensions (M4) [45]. Table 4 presents the model-fit results. The one-factor model fit the data poorly, whereas the correlated first-order, four-factor, second-order, and bifactor models all exhibited good fit. These findings support the four-dimensional structure of information-flow waste and indicate commonality among the four dimensions that can be explained by overall information-flow waste.
Table 4.
Comparison of competing measurement models.
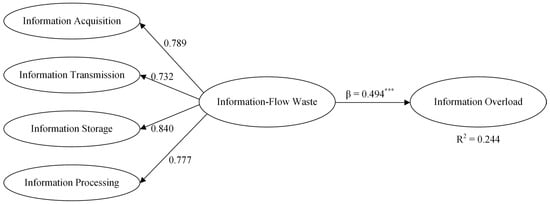
The standardized loadings of the second-order information-flow waste construct on information acquisition, information transmission, information storage, and information processing were 0.789, 0.732, 0.840, and 0.777, respectively, and all were significant (p < 0.001). The chi-square difference between the second-order model and the correlated first-order four-factor model was nonsignificant (Δχ2(2) = 0.288, p = 0.866), indicating that introducing the second-order structure did not produce a significant loss of fit. The second-order model also had lower AIC and BIC values than the correlated first-order four-factor model, indicating that it explained the shared variance among the four dimensions more parsimoniously [45].
The bifactor model performed slightly better than the second-order model on some fit indices, but it estimated more parameters and had a BIC of 747.597, higher than the second-order model’s BIC of 682.443. Further analysis using bifactor-specific indices [46] showed a total omega of 0.963, an omega hierarchical (ωH) of 0.828, and an ωH/ω ratio of 0.860, indicating that the general factor accounted for 86.0% of the reliable variance in total scores. The explained common variance (ECV) and percentage of uncontaminated correlations (PUC) were 0.627 and 0.739, respectively, whereas omega hierarchical subscale (ωHS) values for the four specific factors ranged from 0.249 to 0.410. These results indicate that the general factor had strong explanatory power and that the specific factors retained relatively limited independent reliable variance after controlling for the general factor. Together with the poor fit of the one-factor model and the theoretical basis for the four-dimensional structure, these findings indicate that information-flow waste should be regarded as a hierarchical multidimensional construct. Although the bifactor model was competitive, its specific factors represent the dimension-specific common variance retained after controlling for the general factor, which does not fully align with the theoretical specification of the four dimensions as first-order dimensions of overall information-flow waste. Considering model fit, parsimony, theoretical consistency, and the intended use of the scale, the second-order model was adopted as the primary structural representation of information-flow waste.
Because the CFA sample included different job groups, multigroup CFA was further conducted to test measurement invariance across jobs. The managerial sample was too small to provide stable model estimates as a separate group, and both team/section leaders and managers performed supervisory, coordination, and managerial responsibilities. These respondents were therefore combined into a supervisory and managerial group, yielding three groups: production and operations positions (n = 110), professional and technical positions (n = 82), and supervisory and managerial positions (n = 95). Using the 23-item second-order measurement model as the baseline, the analyses sequentially tested configural invariance, first-order loading invariance, second-order loading invariance, item-intercept invariance, first-order factor-intercept invariance, first-order strict invariance, and second-order strict invariance. Model comparisons were based primarily on changes in fit indices. Additional equality constraints were considered not to cause a substantial decline in fit when CFI decreased by no more than 0.010 and RMSEA increased by no more than 0.015. Changes in SRMR and chi-square difference tests were used as supplementary criteria; SRMR increases were required not to exceed 0.030 for loading invariance and 0.010 for intercept and residual invariance [47,48].
The results are presented in Table 5. The configural invariance model exhibited acceptable fit (χ2 = 1006.784, df = 678, CFI = 0.924, TLI = 0.915, RMSEA = 0.041, SRMR = 0.065), supporting configural invariance across job groups. As equality constraints were added sequentially, changes in fit relative to the preceding model remained within the corresponding thresholds. The largest decrease in CFI was 0.003, the largest increase in RMSEA was less than 0.001, the largest increase in SRMR was 0.014, and all chi-square difference tests were nonsignificant (p = 0.081–0.663). The second-order strict invariance model also retained acceptable fit (χ2 = 1179.445, df = 820, CFI = 0.917, TLI = 0.923, RMSEA = 0.039, SRMR = 0.084). The Information-Flow Waste Scale therefore achieved second-order strict measurement invariance across the three job groups. This indicates that the scale has a consistent measurement structure and meaning across the three job groups examined in this study, providing a measurement basis for subsequent comparisons of information-flow waste levels and relationships with other variables across these groups.
Table 5.
Measurement invariance test results across job groups for the Information-Flow Waste Scale.
Taken together, the scale purification and validation results yielded a final 23-item Information-Flow Waste Scale. The scale comprises information acquisition, information transmission, information storage, and information processing, with 9, 4, 7, and 3 items, respectively. The complete items are presented in Table 6. All items are scored on a five-point frequency scale ranging from 1 = never to 5 = always, with higher scores indicating greater information-flow waste. The second-order structure supports the use of the scale to measure overall information-flow waste, whereas the four dimensions can be used to identify its specific manifestations at different stages of information activity.
Table 6.
Final items of the Information-Flow Waste Scale.
4.3. Nomological Validity
Nomological validity reflects whether the relationships between a newly developed construct and theoretically related constructs are consistent with theoretical expectations [49]. Prior research suggests that information-flow waste may require individuals to undertake nonessential information-processing activities beyond those necessary for normal task completion during information acquisition, transmission, storage, and processing. These activities occupy limited time, attention, and cognitive resources, create additional information-processing demands, and increase the likelihood of information overload [5,14]. Information-flow waste was therefore expected to be positively associated with individual information overload.
Based on the validated second-order structure, a full structural model linking second-order information-flow waste to information overload was estimated. The model exhibited good fit (χ2 = 480.789, df = 294, χ2/df = 1.635, CFI = 0.959, TLI = 0.955, RMSEA = 0.047, SRMR = 0.043). Information-flow waste was significantly and positively associated with information overload (β = 0.494, C.R. = 6.487, p < 0.001) and explained 24.4% of its variance (R2 = 0.244). Figure 2 presents the nomological-validity model linking second-order information-flow waste to information overload and its standardized estimates. These results are consistent with theoretical expectations and provide initial support for the nomological validity of the Information-Flow Waste Scale at the overall construct level.
Figure 2.
Nomological validity model of information-flow waste with standardized estimates. *** p < 0.001.
As a supplementary analysis, the structural relationships between each of the four dimensions and information overload were tested separately. Information acquisition, information transmission, information storage, and information processing were all significantly and positively associated with information overload, with standardized path coefficients of 0.354, 0.370, 0.446, and 0.375, respectively (all p < 0.001; Table 7). The directions of these results are consistent with the test at the overall construct level and provide further preliminary evidence of nomological validity at the dimensional level.
Table 7.
Nomological validity test results for each dimension.
5. Discussion
5.1. Theoretical Contributions
This study advances the conceptual development of information-flow waste in organizational settings and provides a method for its measurement. Prior research has primarily conceptualized and identified information-flow waste by mapping the seven wastes of lean management onto information-management contexts [19]. Theoretically, information-flow waste represents the application of the general lean-management concept of waste to information management, with its distinctiveness arising from shifting the object of identification from manufacturing activities—the traditional focus of lean management—to information-flow activities. However, the seven wastes originated in manufacturing practice, and contextually mapping them to information management retains the classification logic of manufacturing waste, making it difficult to capture the manifestations of waste across stages of information flow comprehensively. By contrast, the information life cycle is organized around the principal stages of information activity and therefore provides a more appropriate analytical framework for defining and identifying information-flow waste at each stage.
Prior research on information quality, knowledge management, information sharing, and task-technology fit has identified and evaluated key elements for the effective operation of information flows from the perspectives of information objects, the organization of activities, media and technological conditions, and the fit between information and task requirements [26,27,29,32,33,34,35]. Information-flow waste does not seek to reevaluate these factors; instead, it locates them within different stages of information flow and examines whether resource inputs to the associated activities are converted into information value. Thus, although some items draw on established formulations from existing scales, they have a different theoretical context and measurement focus within the information-flow process framework. This distinction integrates specific information problems previously dispersed across different research perspectives into a unified process-and-value framework and further clarifies the theoretical boundary of information-flow waste as an independent construct.
More importantly, conceptualizing and operationalizing information-flow waste as an independent construct provides a basis for lean information management research with greater explanatory power. On this basis, research can build on waste identification and improvement to further examine the conditions under which information-flow waste arises and its theoretical relationships with relevant outcomes. By integrating interrelated information activities across the information life cycle, this study also extends the analysis of organizational information processing beyond information quantity and processing capacity to resource inputs and value realization within information activities, thereby providing a complementary perspective for understanding employees’ cognitive and work experiences.
This study also reveals the hierarchical multidimensional structure of information-flow waste. Information acquisition, information transmission, information storage, and information processing are distinguishable yet jointly reflect higher-order information-flow waste. This hierarchical structure allows researchers to examine information-flow waste at the overall level while also analyzing manifestations of waste at different stages of information activity. Measurement invariance across job groups further supports the measurement comparability of the scale across the job groups examined in this study.
The positive association between information-flow waste and information overload provides a process-efficiency perspective on information overload. Information overload is generally regarded as a cognitive state that arises when information-processing demands exceed individuals’ limited processing capacity, whereas information-flow waste occurs at the level of information activities [14]. The results show that overall information-flow waste and all four dimensions are significantly and positively associated with information overload, indicating that this association exists across different stages of information flow. This finding provides initial empirical support for the theoretical relationship between information-flow waste and information overload and represents an initial extension of the nomological network of information-flow waste.
5.2. Practical Implications
Improving quality, reducing costs, and increasing efficiency are central objectives of business operations management, and improvements to organizational information flows must likewise address quality, cost, and efficiency. Identifying and evaluating information-flow waste provides an entry point for organizations to examine information-flow problems in terms of information-flow quality, resource consumption, and operational efficiency.
In the manufacturing context examined in this study, the Information-Flow Waste Scale developed here can serve as a measurement instrument for organizations to identify and evaluate information-flow waste. In managerial practice, information-flow problems often appear in fragmented forms. Managers may perceive inefficiencies in information activities but find it difficult to evaluate them systematically. The scale helps transform these dispersed and ambiguous information problems into managerial issues that can be measured and evaluated and provides a basis for developing a shared understanding of information-flow waste within organizations.
Information-flow waste is not confined to a single dimension or stage but is a systemic phenomenon spanning different stages of the information life cycle. Managerial practice should therefore not reduce it to vague descriptions such as “poor information flow” or “difficult-to-use information systems.” Instead, organizations should use the measurement results for each dimension to identify stages in which manifestations of waste are particularly salient and, in conjunction with business processes, system operations, and employee feedback, further analyze possible directions for process optimization, institutional improvement, system upgrades, or employee training. Based on the measurement comparability across the job groups examined in this study, organizations can also compare information-flow waste across these groups, identify the job groups and stages of information flow that require particular attention, and thereby inform subsequent problem analysis and managerial improvement.
The findings that information-flow waste and each of its four dimensions are significantly and positively associated with information overload indicate that analyses of employee information overload should consider not only information quantity but also the additional demands on employees’ time, attention, and cognitive resources associated with nonessential information processing. The scale can therefore serve as a supplementary tool for organizations to identify information-activity problems associated with employee information overload.
5.3. Limitations and Future Research Directions
This study has several limitations that should be addressed in future research. First, this study used purposive sampling to develop and validate the Information-Flow Waste Scale in a manufacturing context in China, and the sample primarily comprised job groups directly involved in information-processing activities in manufacturing operations, which limits the representativeness of the sample. Although this study obtained support for measurement invariance across job groups, this evidence remains limited to the manufacturing samples and job groups examined in this study and is insufficient to determine the robustness and generalizability of the scale in broader contexts. Future research can further validate its factor structure using more diverse samples and test measurement invariance across industries, organizational types, countries, and regions. On this basis, future research can also compare overall information-flow waste levels and dimensional manifestations across job groups, organizational levels, and organizational types and analyze their managerial implications.
The study used cross-sectional data, which primarily reflect information-flow waste at a particular point in time, making it difficult to capture dynamic changes arising from process optimization, system upgrades, or organizational transformation. In addition, information-flow waste and information overload were both measured through self-reports at the same point in time, and their association may therefore still be affected by common method bias. Because of the cross-sectional research design, this study could not assess the scale’s test–retest reliability or predictive validity. Future research could reduce common method bias through temporal separation and multisource data and use longitudinal repeated-measures or intervention designs to further examine the scale’s temporal stability, predictive validity, and sensitivity to changes induced by managerial interventions. Because this study did not directly evaluate the scale’s effectiveness in specific managerial interventions, future research could combine scale scores with system logs and objective process-performance indicators to further examine the relationship between scale scores and actual information-flow operations and thereby evaluate the scale’s practical value more systematically.
Only information overload was used as an external variable to provide an initial test of the nomological validity of information-flow waste, and its nomological network remains to be expanded. Future research could use the scale to incorporate information-flow waste into studies of lean information management, organizational performance, and related topics. Such research could examine how organizational capabilities, governance mechanisms, and management practices—including information governance, cross-departmental coordination, organizational digital capability, and lean information management practices [4,50]—influence information-flow waste and analyze its relationships with outcomes such as cognitive load, work stress, task performance, and process performance. Subsequent studies could further identify relevant mechanisms and examine the moderating roles of task contexts, employee capabilities, and organizational support. Comparing the relationships of the four dimensions with different outcome variables could also reveal their differentiated effects.
6. Conclusions
This study developed and validated the Information-Flow Waste Scale. The results support its hierarchical multidimensional structure and measurement comparability across the job groups examined in this study, while the significant positive association between information-flow waste and information overload provides initial evidence of the scale’s nomological validity. Based on the validation results obtained from the manufacturing samples in this study, the scale can be used for the overall assessment and stage-specific identification of information-flow waste and provides a measurement basis for subsequent theoretical testing and comparisons among the job groups examined in this study. Its applicability across contexts and practical value in specific managerial interventions require further validation.
Author Contributions
Conceptualization, R.T., T.C. and F.K.; methodology, R.T., T.C. and F.K.; software, S.Z. and Z.Y.; validation, R.T., T.C., F.K. and S.Z.; formal analysis, R.T. and S.Z.; investigation, R.T., S.Z., K.D. and Z.Y.; resources, T.C. and F.K.; data curation, R.T., S.Z. and Z.Y.; writing—original draft preparation, R.T.; writing—review and editing, R.T., T.C., F.K. and S.Z.; visualization, R.T., S.Z. and Z.Y.; supervision, T.C. and F.K.; project administration, R.T. and S.Z. All authors have read and agreed to the published version of the manuscript.
Funding
This research received no external funding.
Institutional Review Board Statement
The study was conducted in accordance with the Declaration of Helsinki, and the protocol was approved by the Ethics Committee of the School of Nursing, Jilin University (Project identification code 202508019) on 27 August 2025.
Informed Consent Statement
Informed consent was obtained from all participants involved in the study.
Data Availability Statement
The data presented in this study are available from the corresponding author upon reasonable request. The data are not publicly available due to confidentiality considerations related to the participating organizations and respondents.
Acknowledgments
The authors thank the experts and respondents who participated in the interviews and surveys.
Conflicts of Interest
The authors declare no conflicts of interest.
References
- Hicks, B.J.; Culley, S.J.; McMahon, C.A. A study of issues relating to information management across engineering SMEs. Int. J. Inf. Manag. 2006, 26, 267–289. [Google Scholar] [CrossRef] [Scilit]
- Kusa, R.; Suder, M.; Duda, J. Role of entrepreneurial orientation, information management, and knowledge management in improving firm performance. Int. J. Inf. Manag. 2024, 78, 102802. [Google Scholar] [CrossRef] [Scilit]
- Tian, R.; Kong, F.; Zhang, S.; Chen, T.; Ding, K.; Yu, Z. SITI-value-added heat map: A structural analysis method for mapping and eliminating information waste of information flow. Int. J. Lean Six Sigma 2026, 17, 1–43. [Google Scholar] [CrossRef] [Scilit]
- Bevilacqua, M.; Ciarapica, F.E.; Paciarotti, C. Implementing lean information management: The case study of an automotive company. Prod. Plan. Control 2015, 26, 753–768. [Google Scholar] [CrossRef] [Scilit]
- Hicks, B.J. Lean information management: Understanding and eliminating waste. Int. J. Inf. Manag. 2007, 27, 233–249. [Google Scholar] [CrossRef] [Scilit]
- Ragu-Nathan, T.S.; Tarafdar, M.; Ragu-Nathan, B.S.; Tu, Q. The consequences of technostress for end users in organizations: Conceptual development and empirical validation. Inf. Syst. Res. 2008, 19, 417–433. [Google Scholar] [CrossRef] [Scilit]
- Hart, S.G.; Staveland, L.E. Development of NASA-TLX (Task Load Index): Results of empirical and theoretical research. In Human Mental Workload; Hancock, P.A., Meshkati, N., Eds.; Elsevier: Amsterdam, The Netherlands, 1988; pp. 139–183. [Google Scholar]
- Nastjuk, S.I.; Trang, J.-V.; Grummeck-Braamt, M.; Adam, T.P.; Tarafdar, M. Integrating and synthesising technostress research: A meta-analysis on technostress creators, outcomes, and IS usage contexts. Eur. J. Inf. Syst. 2024, 33, 361–382. [Google Scholar] [CrossRef] [Scilit]
- Wu, C.; Brookes, N.; Unterhitzenberger, C.; Olson, N. The role of lean information flows in disaster construction projects: Exploring the UK’s COVID surge hospital projects. Constr. Manag. Econ. 2023, 41, 840–858. [Google Scholar] [CrossRef] [Scilit]
- Michaud, M.; Meyer, J.; Forgues, D.; Ouellet-Plamondon, C. A taxonomy of sources of waste in BIM information flows. Buildings 2021, 11, 291. [Google Scholar] [CrossRef] [Scilit]
- Gimpel, H.; Lanzl, J.; Regal, C.; Urbach, N.; Becker, J.; Tegtmeier, P. Stress from digital work: Toward a unified view of digital hindrance stressors. Inf. Syst. Res. 2025, 36, 896–915. [Google Scholar] [CrossRef] [Scilit]
- Lei, C.F.; Ngai, E.W.T. Cognitive technostress appraisal: Conceptualization and measurement development. Int. J. Inf. Manag. 2026, 88, 103046. [Google Scholar] [CrossRef] [Scilit]
- Wang, R.Y.; Strong, D.M. Beyond accuracy: What data quality means to data consumers. J. Manag. Inf. Syst. 1996, 12, 5–33. [Google Scholar] [CrossRef] [Scilit]
- Farhoomand, A.F.; Drury, D.H. Managerial information overload. Commun. ACM 2002, 45, 127–131. [Google Scholar] [CrossRef] [Scilit]
- Graf, B.; Beinig, R.; Schwickert, S.; Schischke, D. Consolidation and integration of information overload and communication overload—A theory-based derivation of distinct measurement models and scale development. Int. J. Inf. Manag. 2026, 88, 103045. [Google Scholar] [CrossRef] [Scilit]
- Stone, K.B. Four decades of lean: A systematic literature review. Int. J. Lean Six Sigma 2012, 3, 112–132. [Google Scholar] [CrossRef] [Scilit]
- de Medeiros, N.C.; Filho, M.G.; Callefi, M.H.; Ganga, G.M.D.; da Silva, J.M.N.; Thürer, M.; Negrão, L.L.L.; Lizarelli, F.L. Measuring employee involvement in lean manufacturing efforts: Proposal of a robust scale. Int. J. Prod. Res. 2025, 63, 4590–4615. [Google Scholar] [CrossRef] [Scilit]
- Redeker, G.A.; Kessler, G.Z.; Kipper, L.M. Lean information for lean communication: Analysis of concepts, tools, references, and terms. Int. J. Inf. Manag. 2019, 47, 31–43. [Google Scholar] [CrossRef] [Scilit]
- Roh, P.; Kunz, A.; Wegener, K. Information stream mapping: Mapping, analysing and improving the efficiency of information streams in manufacturing value streams. CIRP J. Manuf. Sci. Technol. 2019, 25, 1–13. [Google Scholar] [CrossRef] [Scilit]
- Eaton, J.J.; Bawden, D. What kind of resource is information? Int. J. Inf. Manag. 1991, 11, 156–165. [Google Scholar] [CrossRef] [Scilit]
- Busert, T.; Fay, A. Information quality focused value stream mapping for the coordination and control of production processes. Int. J. Prod. Res. 2021, 59, 4559–4578. [Google Scholar] [CrossRef] [Scilit]
- Wilson, T.D. Human information behavior. Informing Sci. 2000, 3, 49–56. [Google Scholar] [CrossRef] [Scilit] [PubMed]
- Churchill, G.A., Jr. A paradigm for developing better measures of marketing constructs. J. Mark. Res. 1979, 16, 64–73. [Google Scholar] [CrossRef] [Scilit]
- Hinkin, T.R. A brief tutorial on the development of measures for use in survey questionnaires. Organ. Res. Methods 1998, 1, 104–121. [Google Scholar] [CrossRef] [Scilit]
- Lee, Y.W.; Strong, D.M.; Kahn, B.K.; Wang, R.Y. AIMQ: A methodology for information quality assessment. Inf. Manag. 2002, 40, 133–146. [Google Scholar] [CrossRef] [Scilit]
- Goodhue, D.L.; Thompson, R.L. Task-technology fit and individual performance. MIS Q. 1995, 19, 213–236. [Google Scholar] [CrossRef] [Scilit] [PubMed]
- Wixom, B.H.; Todd, P. A theoretical integration of user satisfaction and technology acceptance. Inf. Syst. Res. 2005, 16, 85–102. [Google Scholar] [CrossRef] [Scilit]
- Li, S.; Lin, B. Accessing information sharing and information quality in supply chain management. Decis. Support Syst. 2006, 42, 1641–1656. [Google Scholar] [CrossRef] [Scilit]
- Gupta, A.K.; Govindarajan, V. Knowledge flows within multinational corporations. Strateg. Manag. J. 2000, 21, 473–496. [Google Scholar] [CrossRef] [Scilit]
- Rashid, A.; Rasheed, R.; Ali, S.B. Information sharing, quality management, and firm performance: The mediating role of supply chain agility. Systems 2026, 14, 350. [Google Scholar] [CrossRef] [Scilit]
- Prajogo, D.I.; Olhager, J. Supply chain integration and performance: The effects of long-term relationships, information technology and sharing, and logistics integration. Int. J. Prod. Econ. 2012, 135, 514–522. [Google Scholar] [CrossRef] [Scilit]
- Kulkarni, U.R.; Ravindran, S.; Freeze, R. A knowledge management success model: Theoretical development and empirical validation. J. Manag. Inf. Syst. 2006, 23, 309–347. [Google Scholar] [CrossRef] [Scilit]
- Kankanhalli, A.; Tan, B.C.Y.; Wei, K.K. Contributing knowledge to electronic knowledge repositories: An empirical investigation. MIS Q. 2005, 29, 113–144. [Google Scholar] [CrossRef] [Scilit]
- Sangari, M.S.; Hosnavi, R.; Zahedi, M.R. The impact of knowledge management processes on supply chain performance: An empirical study. Int. J. Logist. Manag. 2015, 26, 603–626. [Google Scholar] [CrossRef] [Scilit]
- Donate, M.J.; de Pablo, J.D.S. The role of knowledge-oriented leadership in knowledge management practices and innovation. J. Bus. Res. 2015, 68, 360–370. [Google Scholar] [CrossRef] [Scilit]
- Karr-Wisniewski, P.; Lu, Y. When more is too much: Operationalizing technology overload and exploring its impact on knowledge worker productivity. Comput. Hum. Behav. 2010, 26, 1061–1072. [Google Scholar] [CrossRef] [Scilit]
- Peterson, C.H.; Peterson, N.A.; Powell, K.G. Cognitive interviewing for item development: Validity evidence based on content and response processes. Meas. Eval. Couns. Dev. 2017, 50, 217–223. [Google Scholar] [CrossRef] [Scilit]
- Podsakoff, P.M.; MacKenzie, S.B.; Lee, J.-Y.; Podsakoff, N.P. Common method biases in behavioral research: A critical review of the literature and recommended remedies. J. Appl. Psychol. 2003, 88, 879–903. [Google Scholar] [CrossRef] [Scilit] [PubMed]
- Meade, A.W.; Craig, S.B. Identifying careless responses in survey data. Psychol. Methods 2012, 17, 437–455. [Google Scholar] [CrossRef] [Scilit] [PubMed]
- Nunnally, J.C.; Bernstein, I.H. Psychometric Theory, 3rd ed.; McGraw-Hill: New York, NY, USA, 1994. [Google Scholar]
- Hair, J.F., Jr.; Black, W.C.; Babin, B.J.; Anderson, R.E. Multivariate Data Analysis, 8th ed.; Cengage Learning EMEA: Andover, UK, 2018. [Google Scholar]
- Hu, L.-T.; Bentler, P.M. Cutoff criteria for fit indexes in covariance structure analysis: Conventional criteria versus new alternatives. Struct. Equ. Model. 1999, 6, 1–55. [Google Scholar] [CrossRef] [Scilit]
- Fornell, C.; Larcker, D.F. Evaluating structural equation models with unobservable variables and measurement error. J. Mark. Res. 1981, 18, 39–50. [Google Scholar] [CrossRef] [Scilit]
- Henseler, J.; Ringle, C.M.; Sarstedt, M. A new criterion for assessing discriminant validity in variance-based structural equation modeling. J. Acad. Mark. Sci. 2015, 43, 115–135. [Google Scholar] [CrossRef] [Scilit]
- Kline, R.B. Principles and Practice of Structural Equation Modeling, 5th ed.; Guilford Press: New York, NY, USA, 2023. [Google Scholar]
- Rodriguez, A.; Reise, S.P.; Haviland, M.G. Evaluating bifactor models: Calculating and interpreting statistical indices. Psychol. Methods 2016, 21, 137–150. [Google Scholar] [CrossRef] [Scilit] [PubMed]
- Cheung, G.W.; Rensvold, R.B. Evaluating goodness-of-fit indexes for testing measurement invariance. Struct. Equ. Model. 2002, 9, 233–255. [Google Scholar] [CrossRef] [Scilit] [PubMed]
- Chen, F.F. Sensitivity of goodness of fit indexes to lack of measurement invariance. Struct. Equ. Model. 2007, 14, 464–504. [Google Scholar] [CrossRef] [Scilit]
- Cronbach, L.J.; Meehl, P.E. Construct validity in psychological tests. Psychol. Bull. 1955, 52, 281–302. [Google Scholar] [CrossRef] [Scilit] [PubMed]
- Zhang, S.; Bi, X.; Tian, R.; Chen, T.; Ding, K.; Yu, Z. Lean digitalization solutions for SMEs in China. IEEE Trans. Eng. Manag. 2025, 72, 1546–1558. [Google Scholar] [CrossRef] [Scilit]

Disclaimer/Publisher’s Note: The statements, opinions and data contained in all publications are solely those of the individual author(s) and contributor(s) and not of MDPI and/or the editor(s). MDPI and/or the editor(s) disclaim responsibility for any injury to people or property resulting from any ideas, methods, instructions or products referred to in the content. |
© 2026 by the authors. Licensee MDPI, Basel, Switzerland. This article is an open access article distributed under the terms and conditions of the Creative Commons Attribution (CC BY) license.