


Abstract
Against the backdrop of broadly similar safety regulation, firms in high-risk industries continue to differ in day-to-day safety governance. This study draws on distributed-cognition and socio-technical systems perspectives to examine how formal, material, and relational carriers help senior-management safety prioritization acquire a recorded organizational footprint under performance pressure. We conceptualize institutionalization, digital safety system support, and team safety climate as interdependent carriers and analyze three-wave, multi-source data from 183 firms and 667 teams in Chinese high-risk industries. Firm-level operational leading indicators (OLI) from safety-management records serve as the primary recorded-outcome layer. OLI analyses show that institutionalization and digital safety system support are robustly associated with the overall recorded-indicator composite; team safety climate, by contrast, aligns most clearly with proactive reporting. The three carriers leave carrier-specific signatures across recorded-indicator bundles: institutionalization in closed-loop rectification, digital safety system support in digital-system activity, and team safety climate in proactive reporting. Performance pressure operates mainly as an additive contextual force in the recorded layer. The findings contribute to Systems scholarship on entangled socio-technical resilience by identifying how managerial priorities acquire organizational reach through differentiated carrier coupling in the recorded organizational layer.
1. Introduction
Organizations in high-risk industries operate under competing demands—delivery speed, cost control, and safety—that constrain the attention and resources any priority can receive. Whether frontline employees report hazards, halt unsafe operations, or intervene in peers’ risky behavior depends less on whether senior managers value safety than on whether the organization has built channels that carry that priority into routine safety activity. The question is how senior-management priorities are enacted across organizational levels under goal conflict and operational strain—especially visible when firms operating under broadly similar external safety regulation nevertheless differ in day-to-day safety governance.
Research on distributed cognition and sociomaterial practice helps shift the analysis from individual intention to the arrangements through which cognition and action are organized. On this view, the capacity to act on what matters is lodged in the joint system of people, routines, artifacts, and interactions, rather than inside any one of them alone [1,2,3]. For safety governance, this implies a specific shift of analytical attention: a managerial safety priority does not travel across levels as a signal held by individuals but as something carried by the formal, material, and relational arrangements in which cognition and action are already organized. The question is therefore not what any single mechanism contributes in isolation but how institutional, digital, and relational elements become coupled in routine safety governance.
Recent socio-technical work on organizational resilience gives this reframing its sharpest form. Resilience is an emergent property of how people, practices, and data are coupled, not a property supplied by any single technological or managerial element [4]. Digital capacity makes this concrete: it does not deliver resilience on its own but becomes organizationally consequential when paired with innovation capability and agile response [5]. Activation itself is cross-level: advanced technologies gain organizational traction only when upper-level strategic and leadership conditions put them to work [6]. The coupling medium, in turn, is not an unspoken alignment but something material: coordination runs through the language, symbols, and interfaces by which organizations talk to themselves [7]. At the limit, even cognition and creative problem solving are best understood as living in person–object systems, which means a managerial priority was never located inside an individual manager to begin with—it has always been distributed across the arrangements that hold it in place [8].
This line of reasoning applies directly to safety governance. A managerial safety priority becomes durable where it is coupled with formal routines, digital infrastructures, and relational norms, and that durability can be examined through the traces those couplings leave in organizational records.
Safety governance research often assumes that managerial attention to safety, once credibly signaled, will be reflected in downstream safety activity in a relatively straightforward way [9,10]. Yet high-risk organizations tell a different story. Firms whose leaders demonstrably prioritize safety still vary markedly in how safety appears in routine organizational activity [11], and cross-level coupling often leaves uneven traces across formal, digital, and relational records. Recent reviews also show that safety leadership remains a broad and internally heterogeneous concept, often combining rather different forms of leader behavior under the same label [12]. Why does the same managerial priority produce different recorded footprints across firms? And how does that priority come to leave durable traces in routine work?
Two gaps limit current understanding. First, most studies treat safety leadership or safety commitment as the proximal driver of frontline outcomes, adopting a signaling logic in which leaders transmit cues and employees respond [9,10]. This framing identifies that managerial signals matter but not how priorities become embedded in organizational structures that persist beyond individual signaling episodes. The durability and reach of strategic priorities depend on how they are encoded into the formal, material, and social architecture of the organization [13,14]. Our use of organizational embedding is therefore deliberately narrow. Rather than treating embedding as mere structural existence, frequency of use, or broad perceived effectiveness, we use the term to denote the extent to which a managerial safety priority is built into arrangements that persist in routine work and carry that priority across levels. Granovetter’s distinction between structural and relational embeddedness helps locate this usage, although our operationalization is more specific to safety governance [15]. In the present study, these arrangements are conceptualized as formal–normative, material–informational, and relational carriers, which are operationalized as institutionalization, digital safety system support, and team safety climate.
Second, although safety governance produces different types of organizational records, few studies theorize why organizational carriers might leave differentiated signatures across those records [16,17]. If the mechanisms that sustain one form of recorded safety activity differ from those that sustain another, a uniform governance approach may overestimate the reach of certain organizational investments—particularly digital-system investments. Digital systems can improve visibility, reduce informational ambiguity, and support earlier recognition of abnormal conditions [18,19]. They do not, by themselves, supply the formal authority or relational backing that other forms of recorded organizational activity also require. Team-level research likewise reminds us that subgroup divisions, trust patterns, and interactional strain can alter communication and mutual monitoring in ways that bear directly on safety behavior [20]. This is the differentiation we bring to the foreground: the three carriers are expected to leave distinct signatures across recorded-indicator bundles, because each carrier’s conceptual function aligns with a different form of recorded safety activity.
Drawing on upper echelons theory [21,22] and the attention-based view [23,24], we examine whether managerial safety prioritization—the stable allocation of attention and resources to safety when it competes with operational goals—is associated with recorded safety activity through three organizational carriers: institutionalization, digital safety system support, and team safety climate. We also examine performance pressure as a layer-specific contextual condition in the recorded layer. The analysis proceeds in three steps. We first examine whether managerial safety prioritization is associated with the formation of the three carriers. We then test whether these carriers leave differentiated signatures across recorded-indicator bundles. Finally, we assess whether performance pressure operates in the recorded layer as a contextual force.
Throughout this article, we use managerial safety prioritization to refer to the attentional and resource-allocation dimension of managerial safety orientation, as captured by the scale developed by Fruhen et al. [25,26]. In descriptive terms, this orientation may be discussed as a managerial cognitive priority, but we do not claim that it constitutes a fully separate empirically established construct from related notions such as safety commitment or top-management safety climate. Our contribution is not the establishment of a new construct but the demonstration that an attentional-prioritization operationalization, when traced through differentiated organizational carriers, produces bundle-level differentiation in recorded organizational activity that is less visible when the analysis begins with behavioral signaling alone.
The analysis uses multi-source, time-lagged data from 183 firms and 667 nested teams in Chinese high-risk industries. The study makes three main contributions. First, it shifts the analytical focus from a single proximal driver to the differentiated carriers through which a senior-management priority reaches recorded organizational activity. Second, it decomposes firm-level operational leading indicators into four conceptually defined bundles: proactive reporting, closed-loop rectification, learning participation, and digital-system activity. Formal, material, and relational carriers leave carrier-specific signatures across these bundles: institutionalization aligns with closed-loop rectification, digital safety system support with digital-system activity, and team safety climate with proactive reporting. Third, it identifies the layer-specific role of performance pressure in the recorded layer, which appears mainly as an additive contextual force, with no carrier-specific moderation pattern observed.
2. Theoretical Background and Hypotheses
2.1. Managerial Safety Prioritization as an Upstream Attention-Allocation Orientation
We define managerial safety prioritization (MSP) as the stable allocation of managerial attention and resources to safety under goal conflict—when safety competes with operational priorities such as profitability, cost containment, and delivery schedules. The construct draws on two complementary theoretical traditions. Upper echelons theory holds that organizational outcomes reflect the cognitive orientations of top managers [21,22]; the attention-based view emphasizes that what managers attend to shapes how organizational resources are allocated [23,24].
We do not treat managerial safety prioritization as a wholly separate construct. The safety leadership literature itself remains conceptually broad. Definitional boundaries are often blurred, and much of the empirical tradition is anchored in the transformational–transactional leadership vocabulary [12]. Our use of managerial safety prioritization is narrower. It refers to the attentional and resource-allocation orientation through which senior managers keep safety in focus when it competes with cost, delivery, and production goals. In that sense, it sits upstream of two adjacent constructs with which it overlaps but from which it remains analytically distinct. Safety commitment places more weight on visible demonstrations and signaling of safety values [9,10]; top-management safety climate emphasizes how employees in the aggregate read the organization’s practical priorities [27]. Our operationalization, based on Fruhen et al. [25,26], targets neither the signaling moment nor the received downstream perception. It targets the orientation from which both tend to follow.
Because competing benchmark scales were not included, the present data cannot establish full empirical separation between managerial safety prioritization and commitment-related or climate-related measures. That boundary remains an open empirical question. The study’s contribution lies elsewhere. Tracing this attentional-prioritization measure through the three carriers reveals bundle-level differentiation in recorded activity—a pattern that remains hidden when analysis begins with behavioral signaling alone. The argument is therefore not that managerial priority directly determines downstream safety activity but that its organizational reach depends on the formal, material, and relational carriers through which that priority is made durable.
The argument implies that cross-level coupling is fragile. Senior managers formulate strategic intent, but it must be enacted amid local ambiguity, multiple accountabilities, and ongoing trade-offs. Recent evidence on construal and risk-mitigating behavior suggests that more abstract work-context framing can reduce the ethical salience of concrete risk mitigation, especially when risks are psychologically distant from the decision context [28]. Unless safety prioritization is embedded in arrangements that outlast occasional managerial reminders, its downstream influence weakens across levels [29,30].
Institutionalization (II) is one such arrangement. When managers prioritize safety, they may encode this priority into formal rules, accountability structures, and procedural safeguards [31]. Over time, these arrangements sediment safety expectations into stable routines [32,33]. Institutionalization therefore serves as the formal–normative carrier that renders managerial priority procedural and durable.
Hypothesis 1a (H1a).
Managerial safety prioritization is positively associated with institutionalization.
Digital safety system support (DS) is a second carrier. Managers who prioritize safety are more likely to invest in digital systems that support risk monitoring, hazard reporting, early warning, and safety decision making [34]. Such systems make risks more visible and convert dispersed operational information into actionable cues for managers and workers. DS therefore serves as the material–informational carrier that encodes managerial priority into artifacts, monitoring systems, and information flows.
Hypothesis 1b (H1b).
Managerial safety prioritization is positively associated with digital safety system support.
Team safety climate (SC) is a third carrier. Managers who prioritize safety reflect this orientation in resource allocation and supervisory practices that signal safety’s practical importance [35]. Through social information processing [36], local work groups collectively interpret these signals as shared expectations about what safety means in practice [27]. Because managerial prioritization is a firm-level orientation, its primary climate implication should appear in the firm-shared component of team climate rather than only in deviations among teams within the same firm. Accordingly, the climate hypotheses below refer to the between-firm shared component of team safety climate.
Hypothesis 1c (H1c).
Managerial safety prioritization is positively associated with the between-firm shared component of team safety climate.
2.2. Frontline Measures in the Multi-Source Design
Safety performance research distinguishes safety motivation from safety participation [16]. Safety motivation captures willingness to engage in safety activities without external monitoring. Safety participation refers to proactive behaviors such as hazard reporting, peer intervention, work stoppage, and safety-improvement suggestions. These measures are included to clarify the multi-source design and construct space. The main hypotheses and primary analyses reported below, however, are anchored in the recorded OLI layer.
2.3. Formal, Material, and Relational Carriers of Cross-Level Coupling
We treat institutionalization, digital safety system support, and team safety climate as three distinct but interdependent carriers of cross-level coupling. Each contributes something different to the coupling process. Institutionalization provides normative constraint, role clarity, and procedural legitimacy. Digital safety system support supplies material visibility and informational affordances. Team safety climate provides relational permission, local interpretation, and social backing.
The three are interdependent because no single carrier is usually sufficient to move a senior-management safety priority into durable recorded organizational activity. Formal rules may look complete yet remain thin in practice when hazards are not made visible. Digital visibility can raise awareness, but it rarely supplies the procedural protection or relational backing needed when work is interrupted. Relational support helps employees voice concern, yet without procedural cover, proactive intervention may still remain exposed. Empirically, we estimate their independent associations; theoretically, we treat them as coupled channels within the same socio-technical arrangement.
These three carriers were selected because they span the main formal, material, and relational modes through which organizations embed strategic priorities. Institutionalization reflects formal–normative embedding: safety is coded into rules, accountability arrangements, and review loops. Digital safety system support reflects material–informational embedding: safety priorities become encoded into devices, monitoring systems, and reporting architectures. Team safety climate reflects relational embedding: shared expectations, interactional support, and local sensemaking reproduce safety as a lived concern [3,37].
These three do not exhaust the channels through which managerial priorities reach organizational action. Middle managers, informal networks, training systems, and external regulatory pressures are also implicated. We focus on institutionalization, DS, and team climate because they are theoretically distinguishable, empirically tractable with our multi-source design, and together represent the main ways a safety priority is organized across levels. The theory developed here treats these carriers primarily as continuous coupling mechanisms rather than as prespecified organizational types.
2.4. Carrier-Specific Signatures in the Recorded Layer
The three carriers should leave distinguishable imprints across recorded OLI bundles because their conceptual functions correspond to different forms of recorded safety activity. Institutionalization provides normative constraint, role clarity, and procedural legitimacy, and should therefore align most closely with closed-loop rectification records, where accountability loops, deadlines, and verification routines are directly expressed. Digital safety system support supplies material visibility and informational affordances and should align most closely with digital-system activity records—platform activity, early-warning response, and intelligent-monitoring coverage. The between-firm shared component of team safety climate provides relational permission and local interpretation and should align most closely with proactive reporting records, where employee-initiated disclosure depends on local relational conditions [38].
Hypothesis 2a (H2a).
Institutionalization is most clearly associated with closed-loop rectification records.
Hypothesis 2b (H2b).
Digital safety system support is most clearly associated with digital-system activity records.
Hypothesis 2c (H2c).
The between-firm shared component of team safety climate is most clearly associated with proactive reporting records.
Accordingly, the carrier-specific hypotheses are stated for recorded-indicator bundles rather than for safety motivation, safety participation, or supervisor-rated participation as primary outcomes.
2.5. Indirect Pathways in the Recorded Layer
Managerial safety prioritization reaches recorded safety activity not because senior managers value safety in the abstract but because that priority is carried by organizational arrangements that become observable in records over time. From a distributed cognition perspective, a priority held only in managerial minds has limited durability; it becomes organizationally consequential when it is stabilized in rules, surfaced by digital infrastructures, and reinforced through local interaction [1,2,3]. We therefore consider indirect pathways through which managerial safety prioritization reaches the recorded OLI layer via the three carriers.
To complement the continuous-coupling analysis, we later conduct an exploratory check of whether the three carriers form empirically distinguishable profiles. This analysis is treated as supplementary evidence rather than as a test of prespecified configuration types.
2.6. Performance Pressure in the Recorded Layer
We treat performance pressure (PP) as a layer-specific contextual condition. In the recorded layer, performance pressure may accumulate as an additive contextual force on operational leading indicators rather than through carrier-specific curvilinear moderation, because recorded organizational activity—platform logins, rectification closures, reporting submissions, learning participation—continues to be generated under pressure as routines, monitoring systems, and reporting loops remain operational [39,40]. At the same time, the three carriers may differ in how they combine with performance pressure in the recorded layer, because formal, material, and relational mechanisms draw on different organizational resources [41,42,43].
Hypothesis 3a (H3a).
Performance pressure is associated with the recorded-outcome layer, primarily as an additive contextual force on operational leading indicators.
Hypothesis 3b (H3b).
The three carriers are expected to show carrier-specific recorded-layer patterns under performance pressure, rather than a uniform curvilinear moderation pattern.
The conceptual model and analytical layers are presented in Figure 1.
Figure 1.
Conceptual model and analytical layers. Managerial safety prioritization reaches the primary recorded-outcome layer of operational leading indicators through formal, material, and relational carriers. Performance pressure is modeled as a layer-specific contextual condition in the recorded layer.
3. Materials and Methods
3.1. Sample and Procedure
Data were collected from firms in China across high-risk industries, including manufacturing (25.7%), hazardous chemicals (16.4%), energy and power (10.9%), non-coal mining (10.4%), construction (9.3%), coal mining (9.3%), transportation (6.0%), and other sectors (12.0%). Firms were recruited through industry associations and safety regulatory agencies across multiple provinces. The study used a three-wave, multi-source nested matched survey with a three-month lag between adjacent waves.
At Time 1 (T1), senior managers (general managers or vice presidents responsible for safety) rated firm characteristics, performance pressure, and managerial safety prioritization. At Time 2 (T2), safety department heads rated institutionalization and digital safety system support, and frontline employees rated team safety climate. At Time 3 (T3), frontline employees rated safety motivation and safety participation, and their direct supervisors provided independent behavioral ratings.
After removing invalid questionnaires, cases with missing key information, and samples that could not be matched across time points and informants, 667 team-level observations nested within 183 firms remained for analysis. Across waves, the field process yielded 312 firms at T1, 237 matched firms and 892 teams through T2, and 183 matched firms with 667 teams in the final analytic sample. Firm-level retention from T1 to the final analytic sample was approximately 59%. The sample averaged 3.64 teams per firm, with an average effective team response size of 18.04 members (17.52 for safety climate items; 18.56 for behavior and motivation items). Firms ranged from small enterprises (fewer than 100 employees) to large organizations (over 1000 employees), with a mix of state-owned (38%), privately owned (47%), and foreign-invested enterprises (15%). The employee sample was predominantly male, at approximately 78%, consistent with workforce composition in high-risk industries; average organizational tenure was approximately seven years.
Firm-level attrition from 312 initial T1 firms to 183 analytic firms corresponds to a 41% loss across waves. Appendix B reports a descriptive comparison of retained and non-retained firms on the five T1 covariates available for both groups: firm size, baseline managerial safety prioritization, baseline performance pressure, state ownership, and manufacturing status. None differed significantly (all p > 0.37). This reduces concern about systematic attrition on observed baseline characteristics, but it does not rule out selection on unobserved ones. Firms with weaker safety governance may have been less willing to sustain multi-wave participation. The estimates should therefore be read as conditional on the matched sample, not as population parameters for all contacted firms.
The supervisor-rated participation subsample comprised 366 teams (55% of the total) from all 183 firms. Partial coverage reflects that not all team supervisors consented to the additional rating task. Appendix B also compares teams with and without supervisor ratings. The two groups did not differ significantly on employee-rated safety participation, safety motivation, or team safety climate; differences were concentrated in response volume and, more modestly, in managerial safety prioritization and institutionalization.
Although the three-wave design strengthens temporal ordering, the study remains observational. The results therefore support cross-level association patterns, not strong causal inferences. The three-month lag may also be too short to capture slower organizational processes such as institutional sedimentation and climate formation. If anything, a short lag would be more likely to attenuate than to inflate indirect effects through slower-moving mechanisms.
3.2. Measures
All core constructs were measured using established scales adapted for the Chinese organizational safety context. Items were translated from English to Chinese and back-translated by independent bilingual researchers following Brislin’s [44] guidelines. A pilot study with 45 safety managers and 120 frontline workers confirmed item clarity and cultural appropriateness. Complete item wordings appear in Appendix A. Unless otherwise noted, all items used 5-point Likert scales (1 = strongly disagree to 5 = strongly agree for attitude items; 1 = never to 5 = very frequently for behavior-frequency items).
The measurement strategy aligned construct level with informant competence. Managerial safety prioritization and performance pressure were rated by senior managers because these constructs concern strategic prioritization under competing goals. Institutionalization and digital safety system support were rated by safety-function leaders, who possess comprehensive knowledge of organizational procedures, digital systems, and compliance loops. Team safety climate, safety motivation, and safety participation were generated from frontline employee ratings. Firm-level operational leading indicators were drawn from T3 safety-management records maintained by firm safety officers, which provided a recorded organizational layer distinct from employee and supervisor ratings.
Managerial safety prioritization (MSP). MSP was measured using the scale developed by Fruhen et al. [25,26], completed by senior managers at T1. The scale contained 8 items ( = 0.890) assessing top management’s safety prioritization and resource-investment preferences under goal conflict.
Performance pressure (PP). PP was measured using a scale adapted from Bakker and Demerouti [45], completed by senior managers at T1. The scale contained 4 items ( = 0.849) measuring the composite constraints of profit realization, cost containment, and delivery deadlines.
Institutionalization (II). II was measured using items based on Naveh et al. [33], completed by safety department heads at T2. The scale contained 6 items ( = 0.904) assessing the degree to which safety regulations are embedded in business processes and the completeness of accountability loops.
Digital safety system support (DS). DS was measured using items based on Leonardi [34], completed by safety department heads at T2. The scale contained 6 items ( = 0.908) measuring the support that the firm’s digital safety systems provide for real-time risk monitoring, hazard early warning, and safety management decision making. This measure is designed to capture the availability and perceived supportiveness of digital systems; it does not index actual usage intensity or the depth of workflow integration. This distinction informs how we interpret the results and is revisited in the Limitations section.
Common-source considerations. Institutionalization and digital safety system support were both rated by safety department heads. Although this follows a standard key-informant design [46], it may inflate the observed association between these two constructs. To mitigate this concern, both variables entered the recorded-layer regression models simultaneously. Similarly, managerial safety prioritization and performance pressure were both rated by senior managers at T1. We address the implications of these shared sources for interpretation in the Limitations section.
Team safety climate (SC). SC was measured using a scale adapted from Zohar and Luria [27], completed by frontline employees at T2. The scale contained 8 items ( = 0.967). For the cross-level models, the team-level climate score was decomposed into a between-firm shared component and a within-firm team-deviation component, as described in Section 3.4.
Safety motivation (SM). SM was measured using a scale adapted from Griffin and Neal [16], completed by frontline employees at T3. The scale contained 4 items ( = 0.938).
Safety participation (SP). SP was measured using a scale adapted from Neal and Griffin [17], completed by frontline employees at T3. The scale contained 8 items ( = 0.969). Supervisor-rated safety participation was collected as an additional multi-source design measure and is not used as a primary outcome in the final reported analyses.
Operational leading indicators (OLI). At T3, firm safety officers provided 14 operational leading indicators drawn from safety-management records. These indicators capture recorded safety activity in four conceptually defined indicator bundles: proactive reporting, closed-loop rectification, learning participation, and digital-system activity. F_OBJ7, average rectification closure duration in days, was reverse-scored because lower raw values indicate safer performance. All 14 indicators were direction-adjusted and standardized before aggregation. The overall OLI composite was calculated as the mean of the 14 standardized indicators, and the four recorded-indicator bundles as the means of their respective standardized items. These indicators are treated as recorded organizational safety activity rather than as psychological scale items; reliability and principal-component diagnostics appear in Section 4.1.
Outcome variable distributions. The observed means for SM (2.481) and SP (2.651) on 5-point scales may appear low. Two features of the measurement design contribute to this. First, the behavior-frequency items for SP use anchors from 1 = never to 5 = very frequently, and proactive safety behaviors (hazard reporting, peer intervention, work stoppage) are by nature low-base-rate events in most work settings. Second, the motivation items are worded to capture willingness to bear costs (e.g., accepting efficiency losses for safety), which respondents may endorse more cautiously than general safety attitudes. We confirmed that neither variable exhibited problematic floor effects: the distributions were approximately normal with adequate variance (SD = 0.366 and 0.397, respectively). These values refer to team-level distributions; Table 6 reports firm-aggregated team means, which have slightly smaller standard deviations, as expected from within-firm averaging. At the team level, skewness and kurtosis were and for SM and 0.00 and for SP. The regression results likewise showed no evidence of range restriction.
Control variables. Candidate controls included firm size, firm age, ownership type, industry sector, safety management infrastructure, and team size. Because several sample-size-related controls were redundant, the final model specification retained T3 team size as the team-size control; the control-selection logic is described in Section 3.4. Operational leading indicators are not treated as background controls in the current specification; they are analyzed as a firm-level recorded-outcome layer.
Table 1 summarizes the core variables, including their level of analysis, informant source, measurement wave, and internal-consistency reliability.
Table 1.
Summary of core variables.
3.3. Data Aggregation and Multi-Level Structure
Team safety climate, safety motivation, and safety participation were generated from individual employee ratings and aggregated to the team level. Median within-group agreement indices (rwg) were 0.720, 0.738, and 0.718, respectively, all exceeding the conventional 0.70 threshold. Intraclass correlation coefficients were ICC(1) = 0.188, 0.192, and 0.201 and ICC(2) = 0.802, 0.816, and 0.823, respectively.
These aggregation diagnostics support the use of team-level scores for safety climate, safety motivation, and safety participation. The nested structure also supports clustered inference at the firm level and the between/within decomposition of team safety climate used in the cross-level models. The aggregation-level ICCs in Table 2 should be distinguished from the between/within decomposition of team safety climate described in Section 3.4, which separates team-level climate scores into between-firm and within-firm components.
Table 2.
Data aggregation validity for team-level variables.
3.4. Model Specification
The nested team-within-firm structure and the addition of firm-level recorded outcomes led us to adopt a segmented cross-level regression strategy. Firm-level antecedent paths and firm-level OLI models were estimated using OLS with heteroscedasticity-robust standard errors. Cross-level models for employee- and supervisor-rated outcomes were estimated using firm-clustered robust standard errors, which account for the non-independence of teams nested within the same firm without relying on an unstable random-effects specification.
Operational-record models. OLI analyses were conducted at the firm level (N = 183) using ordinary least squares with HC3 robust standard errors. We estimated models for the overall OLI composite and for the four recorded-indicator bundles. To make the modeling choices transparent, the results report a parsimonious carrier-only specification, a specification adding managerial safety prioritization and performance pressure, and a saturated specification adding firm-level controls. These OLI models provide the recorded organizational layer of the analysis and constitute the primary evidentiary base of the final article.
Rationale for recorded-layer estimation. The design includes firm-level recorded outcomes and team-level frontline measures. The final reported models focus on firm-level OLI because the recorded outcomes are defined at the firm level and provide the article’s primary evidentiary layer. Frontline measures are described to clarify the multi-source design context, but they are not advanced as primary outcome models. The estimates therefore represent cross-level predictive associations within the recorded organizational layer, not causal parameters.
Control variable specification. Preliminary diagnostics indicated that three sample-size-related covariates—the T2 response count, the T3 response count, and the number of overlapping employee IDs—were highly collinear. To avoid instability from redundant controls, the main models retained only T3 team size among the team-size covariates. This reduced the collinearity problem substantially. Because one finite VIF remained slightly above the conventional threshold, we also examined whether the focal coefficients were sensitive to the control specification. The substantive conclusions remained unchanged.
Between/within decomposition of team safety climate. To distinguish the shared firm-level component of team safety climate from team-specific deviations within the same firm, we decomposed team safety climate as follows:
where denotes the safety climate score of team i in firm j, denotes the between-firm shared climate component, and denotes the within-firm team-deviation component. Hereafter, the between-firm shared component of team safety climate is denoted as ; the team-level deviation from that firm mean is denoted as . The hypotheses concerning team safety climate focus on the between-firm shared component, while the within-firm deviation component is retained in the models to separate contextual climate from local team variation.
Performance-pressure specification in the recorded layer. For the recorded-layer analyses corresponding to H3a and H3b, performance pressure enters as linear and quadratic terms alongside carrier-by-pressure and carrier-by-pressure-squared interactions, estimated using firm-level OLS with HC3 robust standard errors. Whether performance pressure operates as an additive contextual force (H3a) or through carrier-specific patterns (H3b) is adjudicated by the joint significance of the linear term and the carrier-by-pressure-squared interactions in the OLI overall and bundle-level models, respectively (reported in Section 4.8).
4. Results
4.1. Measurement Model Validation
We evaluated the measurement models using a layered validation strategy suited to the nested and multi-source design. The firm-level four-factor CFA (MSP, PP, II, DS; = 270.984, df = 246, /df = 1.102, CFI = 0.989, TLI = 0.988, RMSEA = 0.024), the multi-level CFA for team safety climate ( = 38.936, df = 20, /df = 1.947, CFI = 0.996, TLI = 0.995, RMSEA = 0.038), the two-factor MCFA for safety motivation and safety participation ( = 263.694, df = 53, /df = 4.975, CFI = 0.972, TLI = 0.965, RMSEA = 0.077), and the seven-factor aggregated CFA ( = 2202.800, df = 874, /df = 2.520, CFI = 0.940, TLI = 0.935, RMSEA = 0.048) all showed acceptable fit.
All constructs exceeded conventional thresholds for composite reliability (CR > 0.70) and average variance extracted (AVE > 0.50). All heterotrait–monotrait ratio (HTMT) values fell below 0.85 [47], supporting discriminant validity. The HTMT values between safety motivation and safety participation (0.766) remained below threshold, supporting their empirical distinctiveness despite conceptual relatedness. Table 3 and Table 4 summarize the reliability, convergent-validity, and discriminant-validity diagnostics.
Table 3.
Reliability and convergent validity of latent variables.
Table 4.
Discriminant validity: HTMT matrix.
Table 5 reports the reliability and PCA diagnostics for the OLI composite and recorded-indicator bundles.
Table 5.
Reliability and PCA diagnostics for operational leading indicators.
We also examined the internal consistency and component structure of the 14 firm-level operational leading indicators (OLI). F_OBJ7, average rectification closure duration, was reverse-coded so that higher values consistently indicate stronger recorded safety activity. The 14-item OLI composite showed good internal consistency. The four recorded-indicator bundles—proactive reporting, closed-loop rectification, learning participation, and digital-system activity—are treated as conceptually defined bundles, not fully separate latent scales. PCA diagnostics served only as auxiliary evidence.
4.2. Descriptive Statistics and Correlations
Table 6 reports descriptive statistics and selected correlations for the OLI indicators, carriers, contextual variables, and employee- and supervisor-rated design measures. Managerial safety prioritization correlated positively with institutionalization (r = 0.546), digital safety system support (r = 0.562), and the firm-shared component of team safety climate (r = 0.510). The OLI overall composite correlated positively with safety motivation (r = 0.695), employee-rated safety participation (r = 0.691), and supervisor-rated participation (r = 0.639), showing expected alignment with adjacent safety-related measures. Digital safety system support correlated more strongly with the digital-system activity bundle (r = 0.756) than with employee-rated safety participation (r = 0.281 at the firm level), anticipating the layer-specific pattern reported below.
Table 6.
Descriptive statistics and selected correlations.
4.3. Upstream Antecedent Paths from Managerial Safety Prioritization to the Three Carriers
These analyses address RQ1 by testing whether managerial safety prioritization predicts the formation of the three carriers (H1a–H1c). Table 7 reports three cross-level OLS regressions in which managerial safety prioritization predicts, separately, institutionalization, digital safety system support, and the between-firm shared component of team safety climate. Each model uses firm-clustered robust standard errors to respect the nested team-within-firm structure and controls for performance pressure, ten firm-level covariates, and the retained T3 team-size control. All coefficients are standardized.
Table 7.
Upstream antecedent paths from managerial safety prioritization to the three carriers (RQ1).
Managerial safety prioritization was positively and significantly associated with all three carriers, supporting H1a–H1c. The upstream association was strongest for digital safety system support (), followed by the between-firm shared component of team safety climate () and institutionalization (). This ordering is consistent with the idea that material–informational infrastructure is most directly shaped by senior-management attention allocation, whereas formal–normative routines and the firm-shared relational component accumulate more gradually through complementary organizational processes. The decomposition diagnostic above—MSP predicts the between-firm shared climate component but not the within-firm team deviation—further supports locating the climate hypotheses at the between-firm level. These firm-level upstream results establish the first stage of the cross-level carrier pathway; the carrier-to-outcome pathways corresponding to RQ2 are examined in the following sections, beginning with recorded organizational outcomes.
4.4. Operational Leading Indicators as a Recorded Safety Activity Layer
The measurement design treated firm-level operational leading indicators, derived from T3 safety-management records, as the primary recorded-outcome layer. OLI captures what becomes visible in organizational records—reporting rates, rectification closure, learning participation, and digital-system logs. These recorded indicators are used as the primary evidentiary basis of the article.
The OLI overall composite correlated positively with employee-rated motivation and participation, but the decomposed OLI bundles show more specific record-based patterns. The following analyses therefore focus on carrier associations with OLI overall and its four recorded-indicator bundles.
4.5. Carrier Effects on Operational Leading Indicators
These analyses address RQ2 by examining whether the three carriers are associated with recorded organizational outcomes.
Table 8 reports firm-level regressions predicting the OLI overall composite. Model 1 includes the three carriers only. Model 2 adds managerial safety prioritization and performance pressure. Model 3 adds the full control set. All coefficients are standardized and estimated with HC3 robust standard errors.
Table 8.
Carrier effects on firm-level OLI overall.
Institutionalization and digital safety system support were robustly associated with the OLI overall composite across all three specifications. Team safety climate showed a smaller positive association: it was significant in the carriers-only and context-adjusted models and became marginal after the saturated control set was added. This pattern suggests that formal and material carriers leave the clearest recorded organizational trace, while the record-level association for the relational carrier is weaker at the aggregate OLI level.
4.6. Carrier-Specific Patterns Across Recorded Indicator Bundles
Decomposing OLI into four recorded-indicator bundles clarifies the aggregate pattern. Table 9 reports the context-adjusted Model 2 specification for OLI overall and each bundle. The decomposed results are consistent with a differentiated socio-technical coupling: each carrier is most visible in the recorded activity domain that corresponds to its conceptual function.
Table 9.
Carrier-specific patterns across OLI recorded-indicator bundles.
Institutionalization was the dominant predictor of closed-loop rectification. Its coefficient for the closed-loop bundle was the largest carrier coefficient in Table 9, while digital safety system support and team safety climate were not significant for this bundle. This is conceptually coherent because closed-loop rectification records—proposal adoption, on-time rectification, feedback closure, and rectification duration—are direct expressions of formal procedures and accountability loops.
Digital safety system support was the dominant predictor of digital-system activity. It strongly predicted digital platform activity, early-warning response, and intelligent-monitoring coverage, while institutionalization and climate did not independently predict this bundle. Team safety climate showed its clearest recorded association with proactive reporting, where the climate coefficient exceeded those for the formal and digital carriers. Learning participation drew the most cooperative multi-carrier support: institutionalization was strongest, digital safety system support was significant, and team safety climate showed marginal evidence.
Figure 2 visualizes the same bundle-level coefficients as a carrier-specific recorded-signature map.
Figure 2.
Carrier-specific recorded signatures across OLI bundles. Cells report standardized coefficients from firm-level HC3 models for the recorded-indicator bundles; darker positive cells indicate stronger carrier-specific recorded signatures. Significance markers indicate + p < 0.10, * p < 0.05, ** p < 0.01, and *** p < 0.001.
4.7. Exploratory Carrier-Profile Analysis
Table 10 summarizes the exploratory carrier-profile analysis.
Table 10.
Results of the exploratory carrier-profile analysis.
To examine whether the three carriers formed discrete firm-level configurations, we estimated exploratory Gaussian-mixture profile models using standardized institutionalization, digital safety system support, and firm-shared team safety climate. The BIC selected a two-profile solution. The solution separated firms into lower- and higher-carrier constellations, but classification separation was modest (entropy = 0.399), and bootstrap stability was limited (mean ARI = 0.432).
We therefore read the profiles as exploratory variation rather than stable organizational types. The profile analysis is better read as evidence that firms vary in the joint strength of formal, material, and relational carriers, while the carriers themselves operate primarily as continuous coupling mechanisms.
4.8. Recorded-Layer Performance-Pressure Results
These analyses address RQ3 by testing how performance pressure conditions the recorded OLI layer.
Table 11 reports the recorded-layer performance-pressure specification.
Table 11.
Performance pressure effects in the recorded OLI layer.
In the OLI layer, performance pressure operated primarily as an additive contextual force. The linear PP term was positive and significant in the OLI overall model, while the quadratic PP term was only marginal. The carrier-by-PP and carrier-by-PP-squared terms were not significant for OLI overall. In recorded organizational activity, the carriers and performance pressure therefore contributed mainly additively rather than through a carrier-specific curvilinear moderation pattern. H3a is supported in the recorded layer. Taken together, the recorded-layer estimates support H3a and are consistent with the core implication of H3b: performance pressure does not impose a uniform curvilinear moderation pattern across carriers. Because the carrier-by-pressure terms are not significant, H3b is interpreted as evidence against uniformity rather than as a confirmatory moderation effect.
Because the process mechanism underlying any curvilinear pattern was not directly measured in this design, we do not treat unmeasured behavioral processes beyond the recorded layer as a primary claim. Establishing such a process mechanism would require direct measurement of managerial attention reallocation or institutional implementation drift.
Figure 3 summarizes the recorded-layer performance-pressure pattern.
Figure 3.
Performance pressure in the recorded organizational layer. Performance pressure operates mainly as an additive contextual force for operational leading indicators; the linear PP term is positive, while carrier-by-PP and carrier-by-PP-squared interaction terms are not significant.
4.9. Industry-Context Carrier Salience
As a supplementary contextual check, we grouped firms into process industries, manufacturing, and other non-process sectors. Process industries include coal mining, non-coal mining, hazardous chemicals, and energy/power; manufacturing is retained as a separate mixed category; construction, transportation, and other sectors form the other non-process group. The three groups contained 86, 47, and 50 firms, respectively.
Table 12 reports the subgroup coefficient patterns for industry-context carrier salience. The industry-context analysis did not alter the carrier-specific recorded pattern. Institutionalization was consistently strongest for closed-loop rectification across all three groups, and digital safety system support was consistently strongest for digital-system activity. Team safety climate showed its clearest subgroup association with proactive reporting in process industries, with weaker or nonsignificant subgroup coefficients elsewhere.
Table 12.
Industry-context carrier salience across selected OLI recorded-indicator bundles.
Given the exploratory subgroup design and limited subgroup sizes, we treat the industry results as contextual evidence rather than as confirmatory multi-group effects.
Figure 4 summarizes the industry-context coefficient pattern using small-multiple dot plots.
Figure 4.
Exploratory industry-context carrier salience. Small-multiple coefficient plots summarize carrier associations with selected OLI bundles across process, manufacturing, and other non-process industry groups. Points show standardized coefficients, and horizontal bars show approximate 95% confidence intervals. Estimates are exploratory subgroup patterns rather than confirmatory multi-group moderation tests.
4.10. Integrated Evidence Map
Taken together, the recorded-layer results show three connected patterns. At the upstream stage, managerial safety prioritization is positively associated with all three carriers (H1a–H1c; Section 4.3, Table 7). Across the OLI recorded-indicator bundles, each carrier leaves its strongest trace in the activity domain that corresponds to its conceptual function: institutionalization in closed-loop rectification, digital safety system support in digital-system activity, and the between-firm shared component of team safety climate in proactive reporting (H2a–H2c; Section 4.6, Table 9). Performance pressure operates mainly as an additive contextual force on the overall OLI composite, with no uniform carrier-by-pressure curvilinear moderation in the recorded layer (H3a, H3b; Section 4.8, Table 11). Figure 5 summarizes these patterns as a descriptive evidence map across carriers, recorded-indicator bundles, and performance-pressure patterns.
Figure 5.
Integrated evidence map across carriers in the recorded OLI layer. Cells summarize the relative strength of recorded-layer evidence across OLI overall, recorded-indicator bundles, performance-pressure patterns, and exploratory industry-context checks. Categories are descriptive summaries based on coefficient size, statistical significance, and consistency across the corresponding primary and robustness checks; they do not replace the full coefficient tables.
The main manuscript tests eight hypotheses anchored in the recorded operational-leading-indicator layer (H1a–H1c, H2a–H2c, H3a–H3b). Table 13 summarizes the main-manuscript hypothesis tests and their evidentiary basis.
Table 13.
Summary of main-manuscript hypothesis tests.
5. Discussion
5.1. Carrier-Specific Recorded Signatures
The results indicate that managerial safety prioritization reaches the organizational records through differentiated carriers, not through a single uniform channel. Once the three carriers entered the OLI models, the direct association between managerial safety prioritization and recorded safety activity attenuated but remained significant (Table 8, Model 2); this is consistent with a carrier-mediated recorded-layer pattern, not a purely direct signaling account [9,10].
The central pattern visible in the recorded layer is one of carrier-specific signatures. Institutionalization leaves its strongest trace in closed-loop rectification records, digital safety system support in digital-system activity records, and the between-firm shared component of team safety climate in proactive reporting records (Section 4.6, Table 9, Figure 2). These signatures are not uniform in magnitude or coverage. Each carrier is most visible in the recorded activity domain that corresponds to its conceptual function, while being weak or absent in the domains where its conceptual function is not primary. This bundle-level alignment is the central socio-technical finding of the study.
These findings extend recent systems-oriented work on organizational resilience by showing that safety governance depends not simply on the presence of digital tools or managerial priorities but on how formal, material, and relational carriers are coupled in recorded organizational activity [4,5,6]. Within safety governance, the three carriers do not operate as interchangeable levers: each leaves a distinct signature in the recorded organizational layer, and their coupling across bundles is what sustains broad-based recorded safety activity.
5.2. Digital Safety System Support in the Recorded Layer
Digital safety system support shows its clearest recorded signature in the digital-system activity bundle, where it predicts digital platform activity, early-warning response, and intelligent-monitoring coverage (Section 4.6, Table 9; , ). This carrier-specific pattern is consistent across the three industry subgroups examined in Section 4.9 and aligns with the socio-technical systems perspective on digital resilience developed by Sánchez-Rodríguez et al., Zhang et al., and Xu et al. [4,5,6].
In distributed-cognition terms, this recorded-layer pattern suggests that DS primarily strengthens the informational side of the arrangement, whereas the formal and relational carriers carry procedural authority and relational backing more clearly. When those supports do not travel with the digital layer, the organization can produce a clear recorded footprint while leaving the conditions for broader behavioral enactment outside the primary evidentiary scope of the present article. This gives entangled socio-technical accounts of resilience [4] a more specific empirical grounding: digital systems may be tightly linked to recorded organizational activity while still requiring normative and relational conditions for broader enactment.
Interpreting the broader reach of digital safety system support beyond the recorded layer requires caution. The scale indexes system availability and perceived supportiveness; it does not capture usage intensity or integration with stop-work authority, escalation pathways, or accountability loops. As discussed in Section 3.2, technology that is available but weakly integrated into decision-making authority may yield different recorded and behavioral patterns than technology that is deeply integrated. Our measure cannot distinguish “technology that is available but unused” from “technology that is used but institutionally disconnected.” Interpreting digital safety system support beyond the recorded layer requires disaggregated measurement of system availability, routine usage, and integration with formal authority, a measurement direction returned to in Section 6.4. This point is consistent with recent work on situational awareness in complex emergency response, which shows that information becomes actionable only when it is role-relevant, timely, and connected to response authority and coordination structures [48].
Industry heterogeneity also shapes how DS operates within broader socio-technical arrangements. Our industry-context analysis (Section 4.9) shows that the DS-dominant signature on the digital-system activity bundle held across all three industry groups, but the coupling of DS with the other carriers varied. This caution is consistent with recent evidence from mining contexts showing that hazard-exposure profiles, risk appetite, and fatalistic beliefs can vary substantially even within sectors commonly grouped under the broad label of “high risk” [49]. Such evidence supports our decision to treat the industry analysis as exploratory contextual evidence, not as a confirmatory industry typology. Larger industry-specific samples are needed to test these patterns directly.
5.3. Between-Firm Versus Within-Firm Climate Effects
The between/within decomposition of team safety climate adds an important qualification to the recorded-layer findings. The between-firm shared component of team safety climate was associated with proactive reporting records, consistent with the interpretation that firm-level relational conditions reach recorded activity most clearly through local disclosure, with less evidence across broader recorded bundles.
The interpretation remains bounded: the between/within decomposition captures statistical variance partitioning, not a direct measure of how team climate is socio-technically anchored across organizational levels. Future research could measure norm crystallization and cross-level climate coupling more directly.
5.4. Performance Pressure as a Contextual Condition
Performance pressure operated in the recorded layer primarily as an additive contextual force rather than through carrier-specific curvilinear moderation. Under pressure, recorded organizational activity continued because platform routines, rectification procedures, reporting channels, and learning systems remained operational. This pattern is consistent with resilience engineering arguments that adaptive capacity depends on maintained functioning under strain rather than on perfect performance in low-stress settings [50,51] and with broader accounts of organizational resilience as an emergent property of entangled socio-technical systems rather than a feature of any single subsystem [4,52].
Because the underlying process mechanism was not directly measured, this performance-pressure interpretation should be read as a recorded-layer claim rather than as evidence of a directly observed behavioral process.
5.5. Systems Implications and Construct Boundaries
The bundle-level carrier alignments clarify how safety governance operates as a socio-technical system. If organizational resilience depends on the coupling of normative, material, and relational carriers, each carrier’s recorded signature identifies a distinct contribution: institutionalization to closed-loop rectification, digital safety system support to digital-system activity, and the between-firm shared component of team safety climate to proactive reporting. This interpretation extends systems accounts of resilience, but it remains an interpretation, not a directly tested causal mechanism.
Managerial safety prioritization also overlaps conceptually with management safety commitment and top-management safety climate. The Fruhen et al. [25,26] operationalization emphasizes attention allocation and resource orchestration, whereas safety commitment emphasizes behavioral signaling. Because we did not include a competing measure of safety commitment, we cannot claim full empirical separation here; that boundary requires competing-scale designs and remains an open empirical question.
A formal incremental-validity test against a dedicated safety-commitment benchmark scale or a dedicated top-management safety climate scale was not part of the original data collection, and we do not treat the present results as a substitute for that design. The current data nevertheless provide a limited post hoc indication that the attentional-prioritization operationalization is not fully absorbed by carrier-level or climate-style components already in the model. At the recorded-outcome layer, managerial safety prioritization retains an independent positive association with the OLI overall composite (, ; Table 8, Model 2) after institutionalization, digital safety system support, the between-firm shared component of team safety climate, and performance pressure are jointly controlled. This is a partial indication, not an incremental-validity test in the formal sense; a defensible incremental-validity claim would require a competing-construct design that estimates managerial safety prioritization, safety commitment, and top-management safety climate together within a nested-model comparison.
6. Conclusions
6.1. Summary of Findings
Across the three research questions, senior-management safety prioritization acquired a recorded organizational footprint through differentiated carriers, not through a single uniform channel. At the upstream stage, managerial safety prioritization predicted all three carriers (H1a–H1c), most strongly for digital safety system support (), followed by the between-firm shared component of team safety climate () and institutionalization ().
At the carrier-to-records stage, institutionalization and digital safety system support were robust predictors of the OLI composite, while the between-firm shared component of team safety climate contributed a smaller aggregate association. The bundle-level decomposition was more diagnostic than the composite. Institutionalization aligned with closed-loop rectification records, digital safety system support with digital-system activity records, and the between-firm shared component of team safety climate with proactive reporting records; learning participation drew on a more cooperative multi-carrier pattern. These bundle-level alignments are visible in organizational records and are not fully captured by leader-signaling or shared-perception accounts alone. Performance pressure operated in the recorded layer mainly as an additive contextual force, strengthening the overall OLI composite without inducing uniform carrier-by-pressure curvilinear moderation.
6.2. Limitations
Several limitations should inform interpretation.
First, the digital safety system support measure captures system availability and perceived supportiveness, not actual usage intensity, feature-adoption depth, or the degree to which digital outputs are linked to formal authority structures such as stop-work procedures, escalation pathways, or accountability loops. The present study therefore does not make a primary claim about behavioral outcomes beyond the recorded layer. The OLI bundles should likewise be read as recorded leading indicators, not as accident-reduction outcomes, and some bundle-specific associations may partly reflect proximity between carrier measures and corresponding records.
Second, we did not empirically distinguish managerial safety prioritization from safety commitment or top-management safety climate through dedicated incremental-validity tests. Competing-scale designs are required to settle this boundary.
Third, the study remains observational. Although the three-wave, multi-source design strengthens temporal ordering and reduces some common-method concerns, it does not permit strict causal inference. We use language such as “associated with” and “predicts” throughout, but these terms do not imply established causal mechanisms. This caution also applies to the performance-pressure interpretation, whose process mechanisms were inferred, not directly measured.
Fourth, common-source concerns remain for certain construct pairs. Institutionalization and digital safety system support were rated by the same safety department head; managerial safety prioritization and performance pressure were rated by the same senior manager. The multi-source measurement design mitigates but does not eliminate these concerns.
Fifth, the primary estimates rely on cross-level regressions with firm-clustered robust standard errors, not random-slope models. This strategy addresses non-independence among teams within firms, but it does not characterize between-firm heterogeneity in mechanism–outcome associations, which remains a relevant theoretical question.
Finally, the study focuses on high-risk industries in China. The cultural and regulatory context—including the role of state oversight, collectivist norms, and industry-specific safety regimes—may shape the relative importance of institutional, digital, and relational mechanisms in ways that do not generalize directly to other settings.
6.3. Practical Implications
Organizations should treat safety as a persistent strategic priority anchored in executive scorecards and routine reviews, not as an episodic compliance matter. The results suggest that safety governance should be evaluated across more than one register. Firms should track not only whether employees report stronger motivation or participation but also whether managerial priorities become visible in operational leading indicators—near-miss and hazard reporting, rectification closure, learning participation, and digital-system activity.
Governance tools should also be matched to the safety activity they are expected to support. Institutionalization matters especially for closed-loop rectification, because it supplies accountability, deadlines, and verification routines. Digital safety systems are especially visible in digital-system records because they generate logs, alerts, and monitoring coverage. Team safety climate matters especially for proactive reporting, because reporting hazards and near misses requires relational permission as well as formal channels. Digital investment should therefore be sequenced with institutional authority and relational support, not substituted for them.
Performance pressure should be managed dynamically. During deadline peaks or cost-cutting phases, temporary safety resources and explicit reinforcement of stop-work authority may be necessary to keep organizational carriers effective. Practitioners can complement recorded indicators with periodic frontline-experience surveys. Sustained divergence between strong recorded digital-system activity and weaker frontline perceptions can serve as a diagnostic signal that additional authority linkage, procedural protection, or relational support may be needed.
6.4. Future Directions
Future research should first sharpen measurement of the digital carrier. Studies that disaggregate digital safety system support into system availability, routine usage intensity, feature adoption, and integration with formal authority structures—stop-work procedures, escalation pathways, and accountability loops—would clarify whether the recorded-layer signature pattern reflects a fundamental property of digital safety systems or a contingent feature of how these systems are currently deployed. Competing-construct studies that directly compare managerial safety prioritization, safety commitment, and top-management safety climate as predictors would further clarify the construct space.
A second priority is to strengthen temporal and outcome validation. Cross-lagged panel designs, quasi-natural experiments, and longer follow-up windows would provide stronger leverage on causal ordering. Designs that link OLI trajectories to later accident, injury, or shutdown outcomes would help determine when recorded safety activity becomes durable safety performance. Future work should also measure the coupling conditions that link recorded activity to organizational outcomes more directly—the authority rules attached to digital warnings, the procedural protections attached to hazard escalation, and the relational conditions that make peer correction sustainable. Cross-cultural and cross-regulatory replication would clarify the boundary conditions of the carrier-specific recorded-signature pattern.
Author Contributions
Conceptualization, B.W.; data curation, B.W.; formal analysis, B.W.; investigation, B.W.; methodology, B.W., P.L. and C.S.; validation, B.W.; writing—original draft preparation, B.W.; writing—review and editing, P.L. and C.S.; supervision, P.L.; funding acquisition, C.S.; project administration, C.S. All authors have read and agreed to the published version of the manuscript.
Funding
This research was supported by the Fundamental Research Funds of the China Academy of Safety Science and Technology (Grant No. 2026JBKY09) and the Open Research Fund of the Key Laboratory of Production Safety Regulation Technology and Management, Ministry of Emergency Management (Grant No. CCSRKF26-LL03). The funding agencies had no role in the study design; collection, analysis, and interpretation of data; writing of the manuscript; or the final decision to submit the manuscript for publication.
Institutional Review Board Statement
Ethical review and approval were waived for this study. The research consisted solely of an anonymous, non-interventional organizational survey conducted for academic research purposes. It focused on managerial safety prioritization, organizational carriers, team safety climate, safety motivation, and safety participation in firms and teams. Because the study involved only an anonymous, non-interventional organizational survey with no personal health, biological, or medical data, it falls outside the scope of life-science and medical human-subject review requirements in the jurisdictions where data were collected.
Informed Consent Statement
Informed consent was obtained from all subjects involved in the study. Before participation, respondents were informed of the purpose of the research, that participation was entirely voluntary, that they could withdraw at any time without penalty, and that all responses would be collected and analyzed anonymously for academic research purposes only.
Data Availability Statement
The de-identified analytical dataset and analysis scripts are available from the corresponding author upon reasonable request. Raw firm-level source data are not publicly deposited due to confidentiality agreements.
Acknowledgments
The authors thank the participating firms and their employees for their cooperation. The authors also thank Shipeng Cui and Ru Guo for helpful discussions and comments during manuscript preparation, particularly regarding enterprise safety-governance practice and the interpretation of recorded safety indicators.
Conflicts of Interest
The authors declare no conflicts of interest.
Appendix A. Questionnaire Items
Appendix A.1. Measurement Items
All items used 5-point response scales unless otherwise noted. Response anchors were 1 = strongly disagree to 5 = strongly agree for attitude items and 1 = never to 5 = very frequently for behavior-frequency items.
Appendix A.1.1. Managerial Safety Prioritization (MSP; Adapted from Fruhen et al. [25,26])
- When safety, cost, and delivery goals conflict, safety should take priority.
- I view workplace safety as a core management issue rather than a routine compliance matter.
- Even when external inspections are infrequent, preventive safety investment should be maintained.
- Major business decisions should be evaluated for their safety consequences before they are made.
- Accident prevention depends more on forward-looking management than on blame after the fact.
- I am willing to accept short-term operating costs to reduce major safety risks.
- Safety performance reflects the quality of management, not merely whether employees obey instructions.
- When a safety problem is exposed, it is more important to identify systemic causes than to find someone to blame.
Appendix A.1.2. Performance Pressure (PP; Adapted from Bakker and Demerouti [45])
- During the past six months, this firm has faced strong profit or cash-flow pressure.
- Production and delivery targets frequently squeeze the time available for safety management.
- Cost-control pressure has affected the allocation of safety-related resources.
- Compared with our peers, this firm operates under strong business pressure.
Appendix A.1.3. Institutionalization (II; Adapted from Naveh et al. [33])
- Safety risk assessment is formally built into project initiation, change, procurement, or outsourcing decisions.
- When a hazard is identified, the firm follows a closed-loop process that specifies responsibility, deadline, and verification.
- Near-miss events are formally recorded, analyzed, and fed back into operations.
- Problems raised by external inspections are usually converted into long-term internal process improvements.
- Routine work processes for frontline teams and middle managers include clearly specified safety steps.
- Safety rules are applied consistently across departments rather than used only for temporary compliance.
Appendix A.1.4. Digital Safety System Support (DS; Adapted from Leonardi [34])
- Key operating activities use digital or intelligent tools for risk monitoring.
- High-risk equipment or areas have real-time warning or abnormality alerts.
- Hazard identification, rectification, and verification can be tracked in an information system.
- Safety data are regularly used in team reviews and management improvement.
- Frontline employees have received training in the use of digital safety tools.
- The technical system helps employees identify and report risks more quickly rather than merely leaving records after the fact.
Appendix A.1.5. Team Safety Climate (SC; Adapted from Zohar and Luria [27])
- My direct supervisor encourages employees to point out risks and problems proactively.
- Even when work is rushed, our team does not treat safety requirements as optional.
- When employees report hazards, they usually receive a response and follow-up action.
- In this team, raising a safety concern is unlikely to lead to blame or retaliation.
- Coworkers actively remind one another to correct unsafe practices.
- Employees can refuse clearly dangerous work arrangements.
- The team seriously discusses early warning signs and near misses rather than ignoring them.
- The organization emphasizes continuous safety improvement rather than merely passing inspections.
Appendix A.1.6. Safety Motivation (SM; Adapted from Griffin and Neal [16])
- Even without external monitoring, I am willing to invest extra effort to follow safety requirements.
- I am willing to accept a small loss of efficiency in order to reduce risk.
- In safety matters, I value prevention more than simply avoiding an accident.
- Even when stronger safety requirements increase my workload, I still support implementing them.
Appendix A.1.7. Safety Participation (SP; Adapted from Neal and Griffin [17])
- During the past three months, I proactively reported hazards, unsafe conditions, or abnormalities.
- During the past three months, I reported near misses or events that almost led to an accident.
- During the past three months, I reminded coworkers to correct unsafe behavior.
- During the past three months, I asked for work to be paused or adjusted when I noticed a clear danger.
- During the past three months, I proposed suggestions for safety improvement.
- During the past three months, I took part in safety improvement or learning activities that were not mandatory.
- During the past three months, I proactively shared observations or lessons during accident or near-miss reviews.
- During the past three months, I helped new employees or coworkers understand safer ways of working.
Appendix A.1.8. Supervisor-Rated Safety Participation (SRB)
- Members of this team proactively report hazards and near misses.
- Members of this team proactively remind others and correct unsafe behavior.
- Members of this team proactively propose safety improvement suggestions.
- When risk increases, members of this team proactively take preventive action.
Appendix A.2. Operational Leading Indicators and Scoring Direction
Table A1 lists the 14 operational leading indicators used to construct the OLI composite and the four recorded-indicator bundles. All indicators were standardized before aggregation. F_OBJ7 was reverse-scored because a shorter average rectification closure duration indicates safer performance.
Table A1.
Summary of operational leading indicators and scoring direction.
Appendix B. Additional Sample and Robustness Diagnostics
Table A2.
Matched versus unmatched firms on observed T1 covariates.
Table A3.
Teams with versus without supervisor-rated participation.
References
- Hutchins, E. Cognition in the Wild; MIT Press: Cambridge, MA, USA, 1995; ISBN 978-0-262-08231-0. [Google Scholar]
- Clark, A.; Chalmers, D. The extended mind. Analysis 1998, 58, 7–19. [Google Scholar] [CrossRef]
- Orlikowski, W.J. Sociomaterial practices: Exploring technology at work. Organ. Stud. 2007, 28, 1435–1448. [Google Scholar] [CrossRef] [Scilit]
- Sánchez-Rodríguez, A.; Pérez-Campdesuñer, R.; García-Vidal, G.; Fernández-Ochoa, Y.; Martínez-Vivar, R.; Alvarez-Subía, F.I. Digital organizational resilience in Latin American MSMEs: Entangled socio-technical systems of people, practices, and data. Systems 2025, 13, 889. [Google Scholar] [CrossRef] [Scilit]
- Zhang, J.; Li, H.; Zhao, H. The impact of digital transformation on organizational resilience: The role of innovation capability and agile response. Systems 2025, 13, 75. [Google Scholar] [CrossRef] [Scilit]
- Xu, Y.; Yu, H.; Qiu, R.; Yu, L. How does artificial intelligence shape supply chain resilience? The moderating role of the CEOs’ sports experience. Systems 2025, 13, 190. [Google Scholar] [CrossRef] [Scilit]
- Tomassi, A.; Falegnami, A.; Romano, E. Talking resilience: Embedded natural language cyber-organizations by design. Systems 2025, 13, 247. [Google Scholar] [CrossRef] [Scilit]
- Vallée-Tourangeau, F. Systemic creative problem-solving: On the poverty of ideas and the generative power of prototyping. Systems 2025, 13, 150. [Google Scholar] [CrossRef] [Scilit]
- Zohar, D. Modifying supervisory practices to improve subunit safety: A leadership-based intervention model. J. Appl. Psychol. 2002, 87, 156–163. [Google Scholar] [CrossRef] [Scilit] [PubMed]
- Clarke, S. Safety leadership: A meta-analytic review of transformational and transactional leadership styles as antecedents of safety behaviours. J. Occup. Organ. Psychol. 2013, 86, 22–49. [Google Scholar] [CrossRef] [Scilit]
- Christian, M.S.; Bradley, J.C.; Wallace, J.C.; Burke, M.J. Workplace safety: A meta-analysis of the roles of person and situation factors. J. Appl. Psychol. 2009, 94, 1103–1127. [Google Scholar] [CrossRef] [Scilit]
- Adra, I.; Giga, S.; Hardy, C.; Leka, S. What is safety leadership? A systematic review of definitions. J. Saf. Res. 2024, 90, 181–191. [Google Scholar] [CrossRef] [Scilit]
- Gioia, D.A.; Chittipeddi, K. Sensemaking and sensegiving in strategic change initiation. Strateg. Manag. J. 1991, 12, 433–448. [Google Scholar] [CrossRef] [Scilit]
- Maitlis, S.; Christianson, M. Sensemaking in organizations: Taking stock and moving forward. Acad. Manag. Ann. 2014, 8, 57–125. [Google Scholar] [CrossRef]
- Granovetter, M. Economic action and social structure: The problem of embeddedness. Am. J. Sociol. 1985, 91, 481–510. [Google Scholar] [CrossRef] [Scilit]
- Griffin, M.A.; Neal, A. Perceptions of safety at work: A framework for linking safety climate to safety performance, knowledge, and motivation. J. Occup. Health Psychol. 2000, 5, 347–358. [Google Scholar] [CrossRef]
- Neal, A.; Griffin, M.A. A study of the lagged relationships among safety climate, safety motivation, safety behavior, and accidents at the individual and group levels. J. Appl. Psychol. 2006, 91, 946–953. [Google Scholar] [CrossRef] [Scilit]
- Dodoo, J.E.; Al-Samarraie, H.; Alzahrani, A.I.; Lonsdale, M.; Alalwan, N. Digital innovations for occupational safety: Empowering workers in hazardous environments. Workplace Health Saf. 2024, 72, 84–95. [Google Scholar] [CrossRef] [Scilit]
- Cagno, E.; Accordini, D.; Neri, A.; Negri, E.; Macchi, M. Digital solutions for workplace safety: An empirical study on their adoption in Italian metalworking SMEs. Saf. Sci. 2024, 177, 106598. [Google Scholar] [CrossRef] [Scilit]
- Wang, X.; Zhang, Z.; Liang, S.; Yang, Z.; Su, C. Faultlines and miners’ safety behaviour: Role of emotional exhaustion and safety self-efficacy. Small Group Res. 2026. OnlineFirst. [Google Scholar] [CrossRef] [Scilit]
- Hambrick, D.C.; Mason, P.A. Upper echelons: The organization as a reflection of its top managers. Acad. Manag. Rev. 1984, 9, 193–206. [Google Scholar] [CrossRef] [Scilit] [PubMed]
- Hambrick, D.C. Upper echelons theory: An update. Acad. Manag. Rev. 2007, 32, 334–343. [Google Scholar] [CrossRef] [Scilit]
- Ocasio, W. Towards an attention-based view of the firm. Strateg. Manag. J. 1997, 18, 187–206. [Google Scholar] [CrossRef] [Scilit]
- Joseph, J.; Laureiro-Martinez, D.; Nigam, A.; Ocasio, W.; Rerup, C. Research frontiers on the attention-based view of the firm. Strateg. Organ. 2024, 22, 6–17. [Google Scholar] [CrossRef] [Scilit]
- Fruhen, L.S.; Mearns, K.J.; Flin, R.; Kirwan, B. Skills, knowledge and senior managers’ demonstrations of safety commitment. Saf. Sci. 2014, 69, 29–36. [Google Scholar] [CrossRef] [Scilit]
- Fruhen, L.S.; Griffin, M.A.; Andrei, D.M. What does safety commitment mean to leaders? A multi-method investigation. J. Saf. Res. 2019, 68, 203–214. [Google Scholar] [CrossRef] [Scilit]
- Zohar, D.; Luria, G. A multilevel model of safety climate: Cross-level relationships between organization and group-level climates. J. Appl. Psychol. 2005, 90, 616–628. [Google Scholar] [CrossRef] [Scilit] [PubMed]
- Affinito, S.J.; Hofmann, D.A.; Keeney, J.E. Out of sight, out of mind: How high-level construals can decrease the ethical framing of risk-mitigating behavior. J. Appl. Psychol. 2025, 110, 177–196. [Google Scholar] [CrossRef] [Scilit] [PubMed]
- Floyd, S.W.; Wooldridge, B. Managing strategic consensus: The foundation of effective implementation. Acad. Manag. Exec. 1992, 6, 27–39. [Google Scholar] [CrossRef] [Scilit]
- Feldman, M.S.; Pentland, B.T. Reconceptualizing organizational routines as a source of flexibility and change. Adm. Sci. Q. 2003, 48, 94–118. [Google Scholar] [CrossRef] [Scilit]
- Fernández-Muñiz, B.; Montes-Peón, J.M.; Vázquez-Ordás, C.J. Safety management system: Development and validation of a multidimensional scale. J. Loss Prev. Process Ind. 2007, 20, 52–68. [Google Scholar] [CrossRef] [Scilit]
- Naveh, E.; Katz-Navon, T.; Stern, Z. Treatment errors in healthcare: A safety climate approach. Manag. Sci. 2005, 51, 948–960. [Google Scholar] [CrossRef] [Scilit]
- Naveh, E.; Katz-Navon, T.; Stern, Z. Readiness to report medical treatment errors: The effects of safety procedures, safety information, and priority of safety. Med. Care 2006, 44, 117–123. [Google Scholar] [CrossRef] [Scilit]
- Leonardi, P.M. When flexible routines meet flexible technologies: Affordance, constraint, and the imbrication of human and material agencies. MIS Q. 2011, 35, 147–167. [Google Scholar] [CrossRef] [Scilit]
- Zohar, D. A group-level model of safety climate: Testing the effect of group climate on microaccidents in manufacturing jobs. J. Appl. Psychol. 2000, 85, 587–596. [Google Scholar] [CrossRef] [Scilit] [PubMed]
- Salancik, G.R.; Pfeffer, J. A social information processing approach to job attitudes and task design. Adm. Sci. Q. 1978, 23, 224–253. [Google Scholar] [CrossRef] [Scilit]
- Scott, W.R. Institutions and Organizations: Ideas, Interests, and Identities, 4th ed.; Sage: Thousand Oaks, CA, USA, 2014; ISBN 978-1-4522-4222-4. [Google Scholar]
- Edmondson, A. Psychological safety and learning behavior in work teams. Adm. Sci. Q. 1999, 44, 350–383. [Google Scholar] [CrossRef] [Scilit]
- Hashemian, S.M.; Triantis, K.P. Production pressure and its relationship to safety: A systematic review and future directions. Saf. Sci. 2023, 159, 106045. [Google Scholar] [CrossRef] [Scilit]
- Cavanaugh, M.A.; Boswell, W.R.; Roehling, M.V.; Boudreau, J.W. An empirical examination of self-reported work stress among U.S. managers. J. Appl. Psychol. 2000, 85, 65–74. [Google Scholar] [CrossRef] [Scilit] [PubMed]
- LePine, J.A.; Podsakoff, N.P.; LePine, M.A. A meta-analytic test of the challenge stressor–hindrance stressor framework: An explanation for inconsistent relationships among stressors and performance. Acad. Manag. J. 2005, 48, 764–775. [Google Scholar] [CrossRef] [Scilit]
- Zohar, D.; Huang, Y.-H.; Lee, J.; Robertson, M. A mediation model linking dispatcher leadership and work ownership with safety climate as predictors of truck driver safety performance. Accid. Anal. Prev. 2014, 62, 17–25. [Google Scholar] [CrossRef] [Scilit]
- Vaughan, D. The Challenger Launch Decision: Risky Technology, Culture, and Deviance at NASA; University of Chicago Press: Chicago, IL, USA, 1996; ISBN 978-0-226-85175-4. [Google Scholar]
- Brislin, R.W. The wording and translation of research instruments. In Field Methods in Cross-Cultural Research; Lonner, W.J., Berry, J.W., Eds.; Sage: Beverly Hills, CA, USA, 1986; pp. 137–164. [Google Scholar]
- Bakker, A.B.; Demerouti, E. The job demands-resources model: State of the art. J. Manag. Psychol. 2007, 22, 309–328. [Google Scholar] [CrossRef] [Scilit]
- Kumar, N.; Stern, L.W.; Anderson, J.C. Conducting interorganizational research using key informants. Acad. Manag. J. 1993, 36, 1633–1651. [Google Scholar] [CrossRef] [Scilit]
- Henseler, J.; Ringle, C.M.; Sarstedt, M. A new criterion for assessing discriminant validity in variance-based structural equation modeling. J. Acad. Mark. Sci. 2015, 43, 115–135. [Google Scholar] [CrossRef] [Scilit]
- Wang, S.; Zhu, Y. A theoretical framework for analyzing firefighters’ situational awareness and information requirements in large chemical tank firefighting. J. Saf. Sustain. 2025, 2, 307–322. [Google Scholar] [CrossRef] [Scilit]
- Stemn, E.; Fosu, S.; Addo, L.N.A. Assessment of occupational hazards exposures of artisanal and small-scale mining in Ghana. J. Saf. Sustain. 2025; in press. [CrossRef] [Scilit]
- Hollnagel, E. Safety-I and Safety-II: The Past and Future of Safety Management; Ashgate: Farnham, UK, 2014; ISBN 978-1-4724-2308-5. [Google Scholar]
- Woods, D.D. Four concepts for resilience and the implications for the future of resilience engineering. Reliab. Eng. Syst. Saf. 2015, 141, 5–9. [Google Scholar] [CrossRef] [Scilit]
- Sutcliffe, K.M.; Vogus, T.J. Organizing for resilience. In Positive Organizational Scholarship: Foundations of a New Discipline; Cameron, K.S., Dutton, J.E., Quinn, R.E., Eds.; Berrett-Koehler: San Francisco, CA, USA, 2003; pp. 94–110. [Google Scholar]
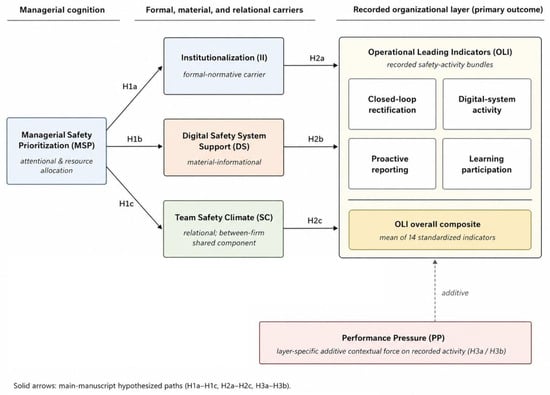
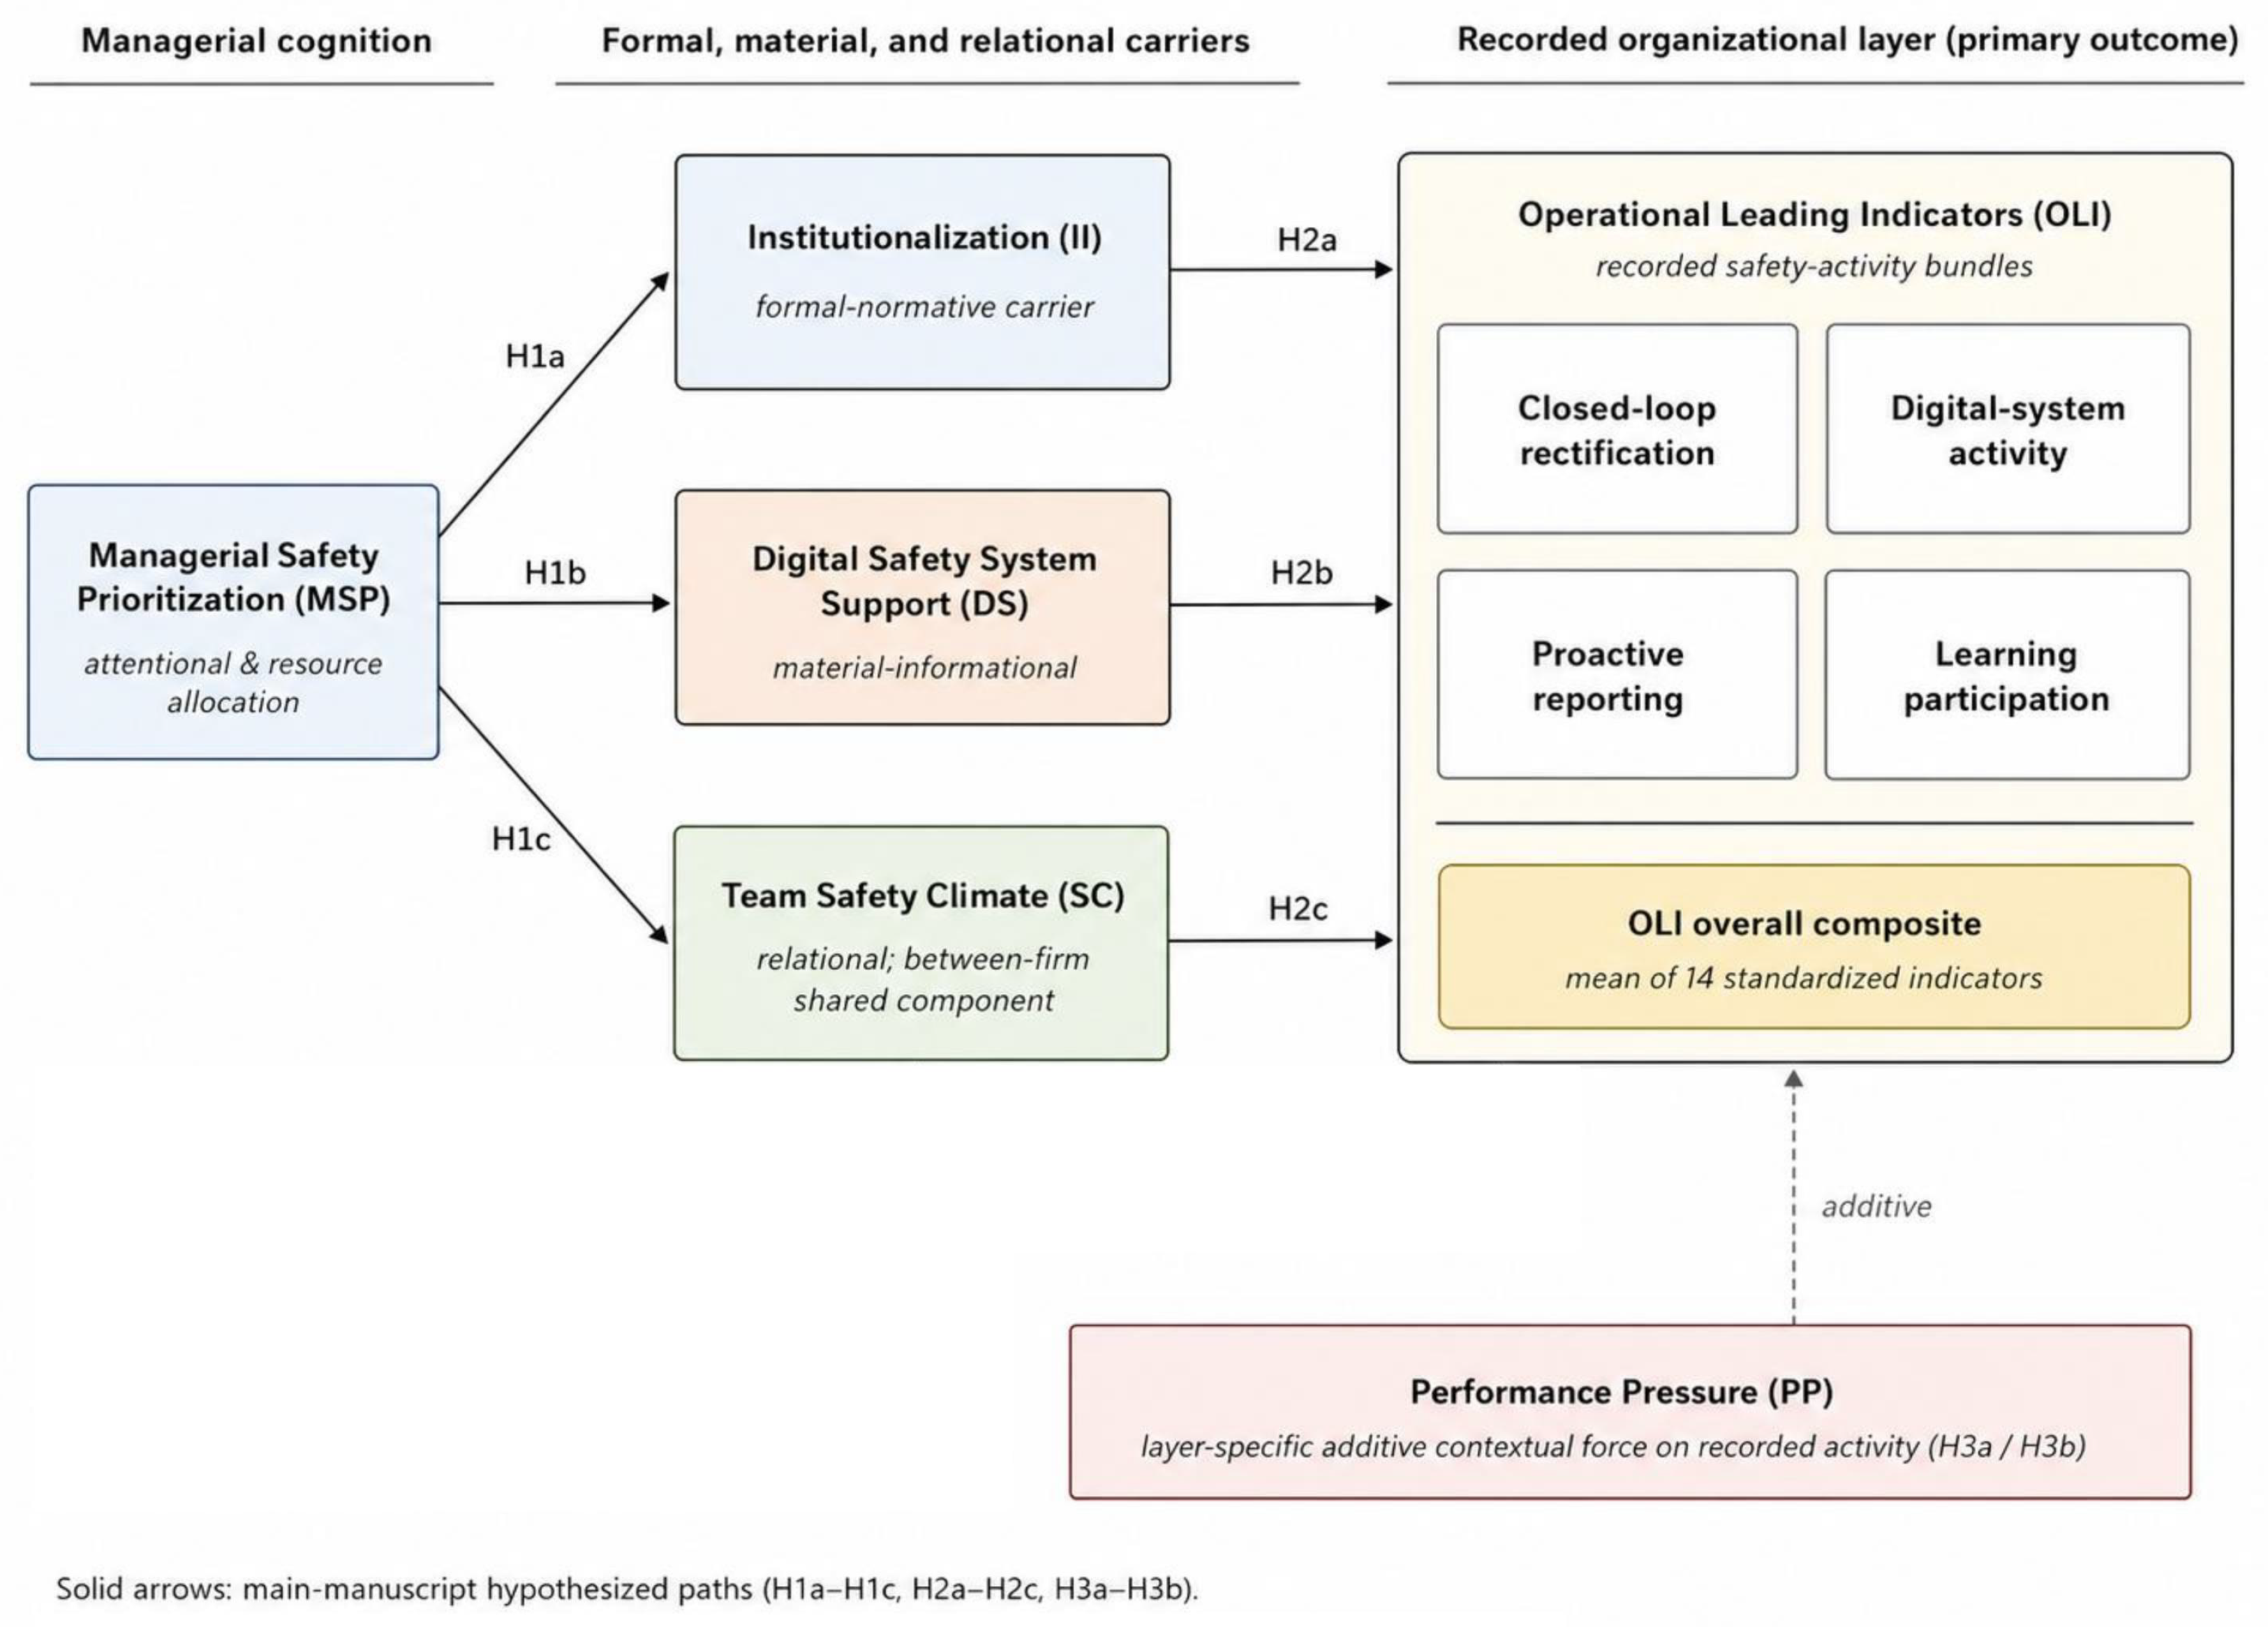
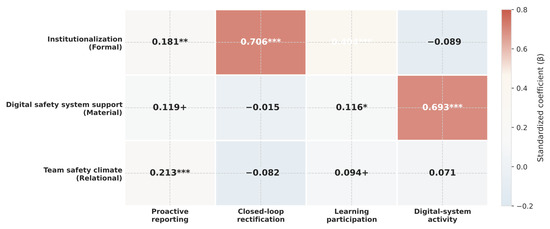
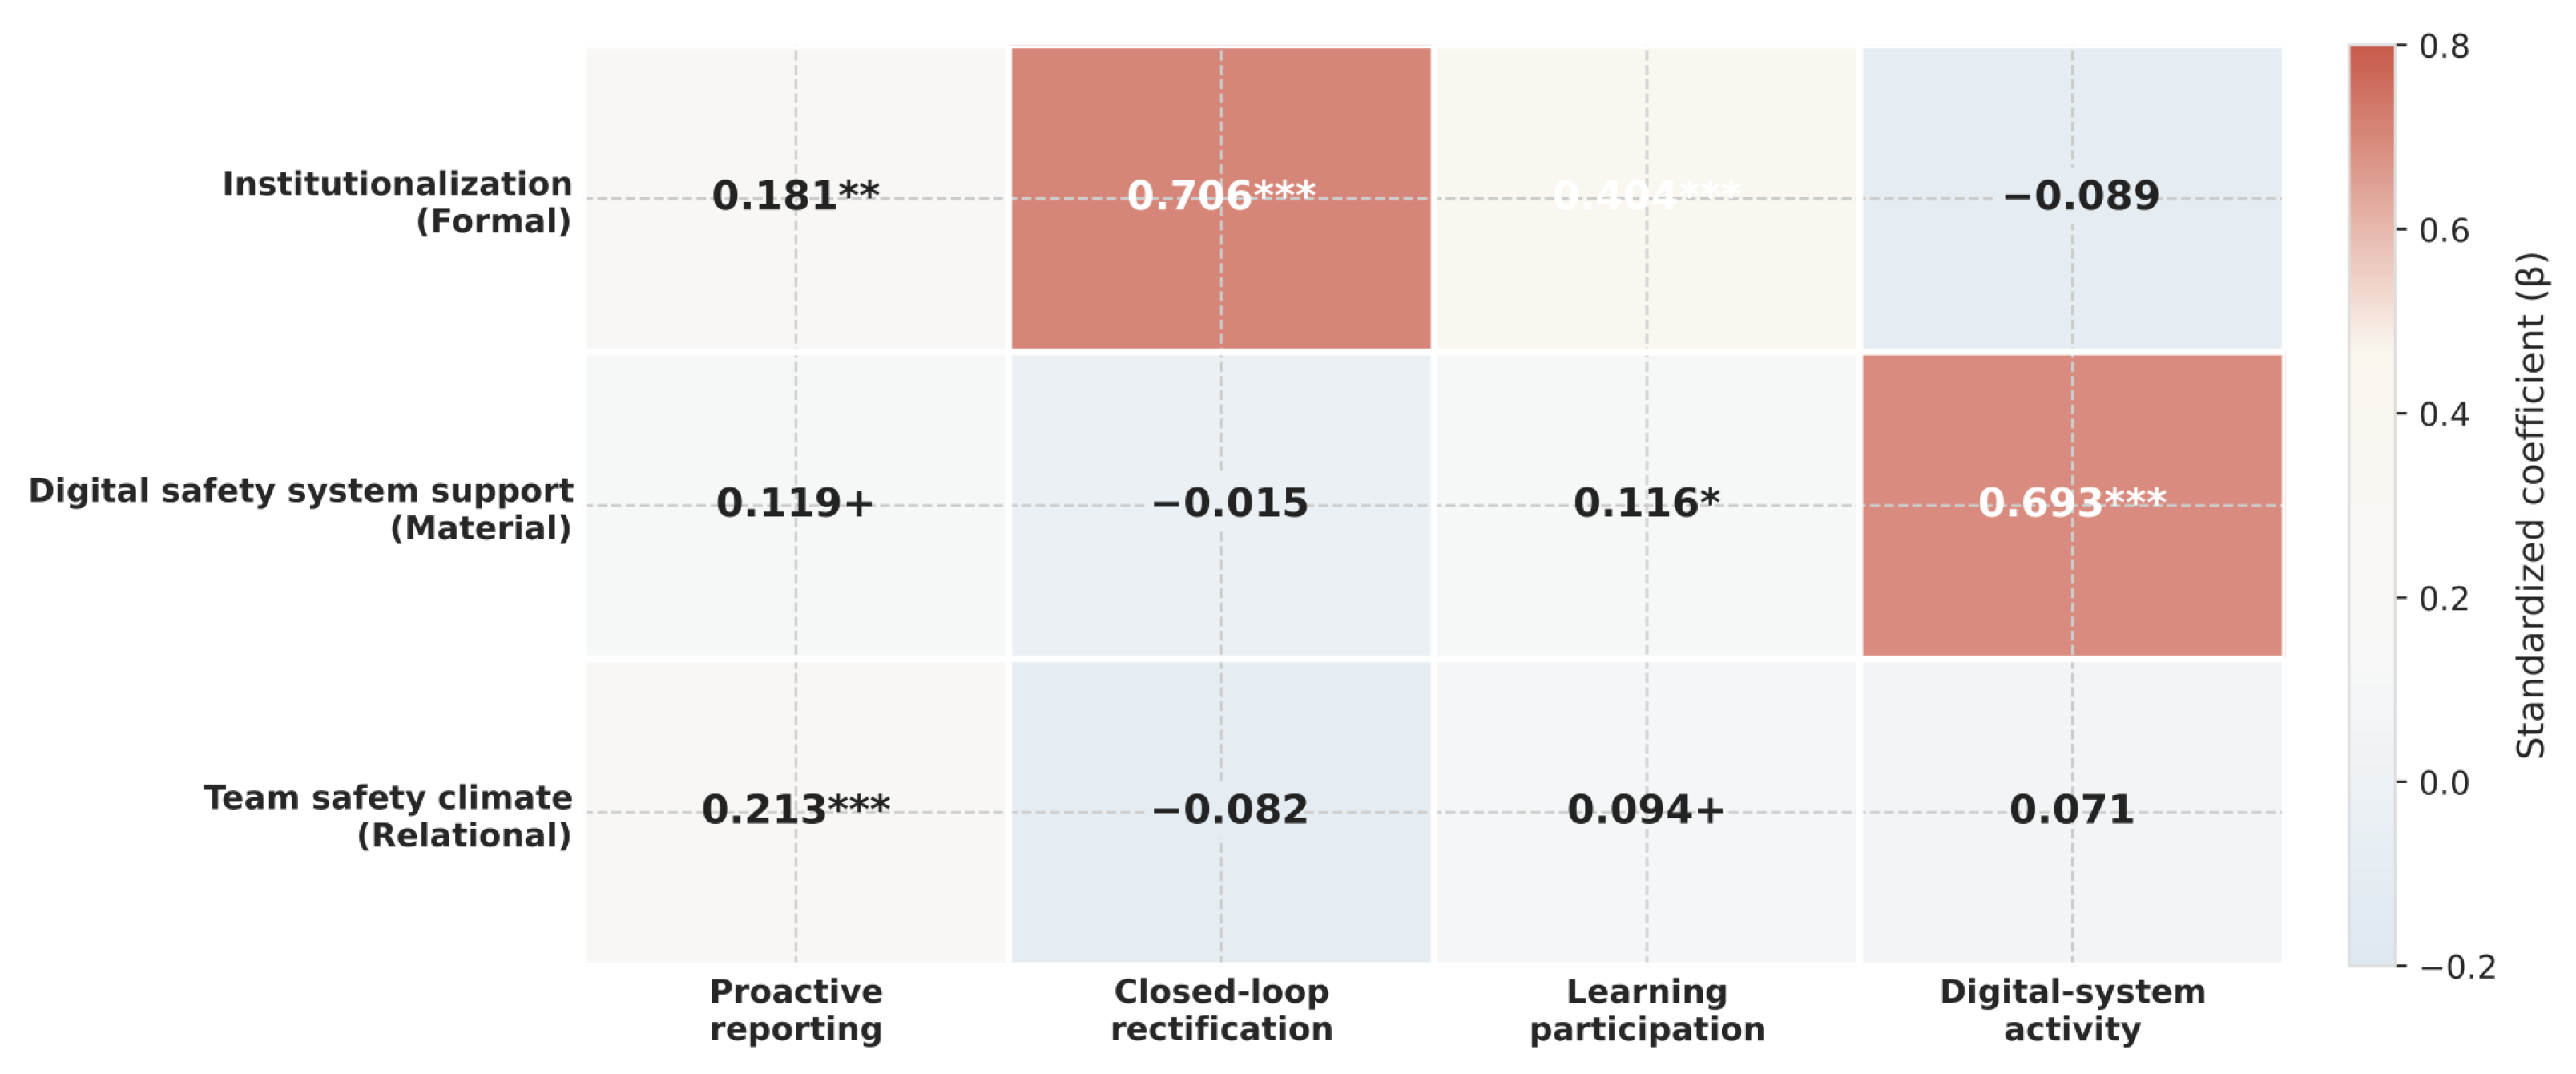
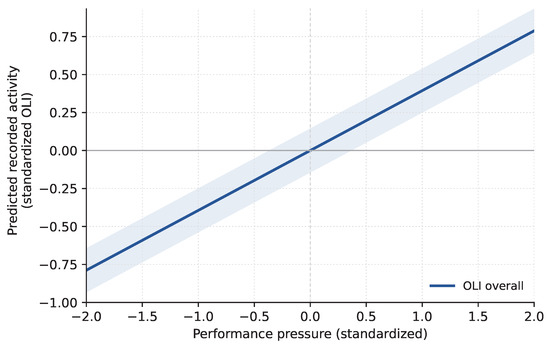
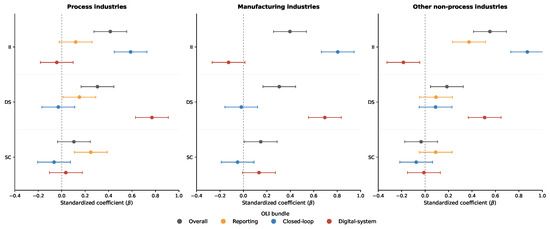
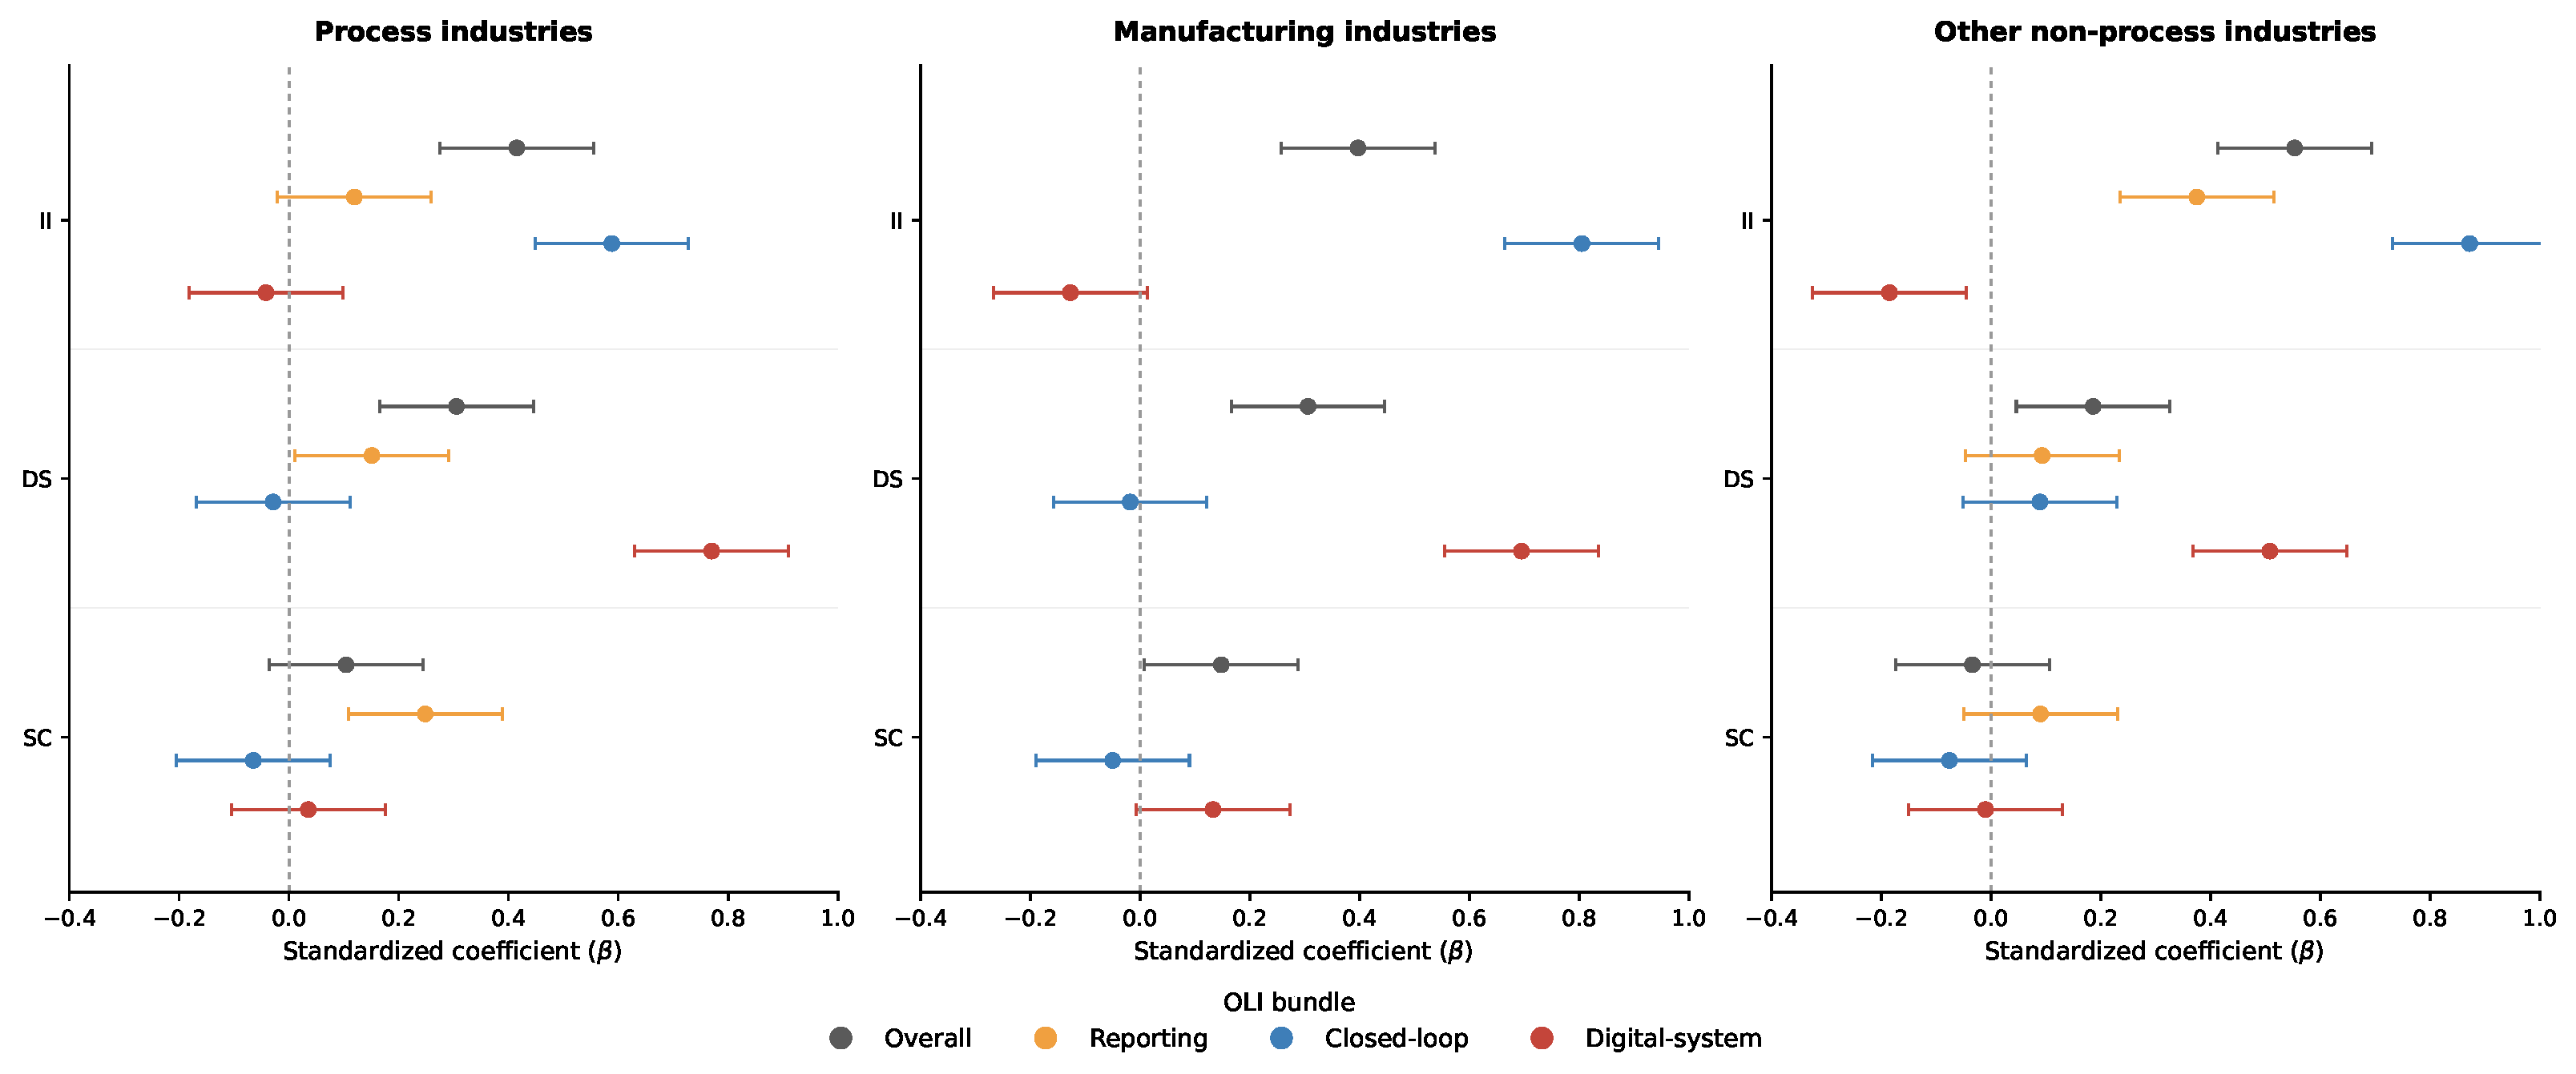
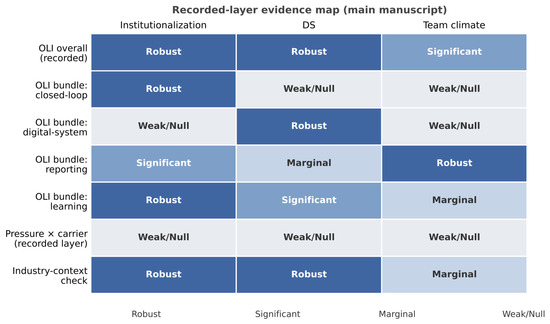
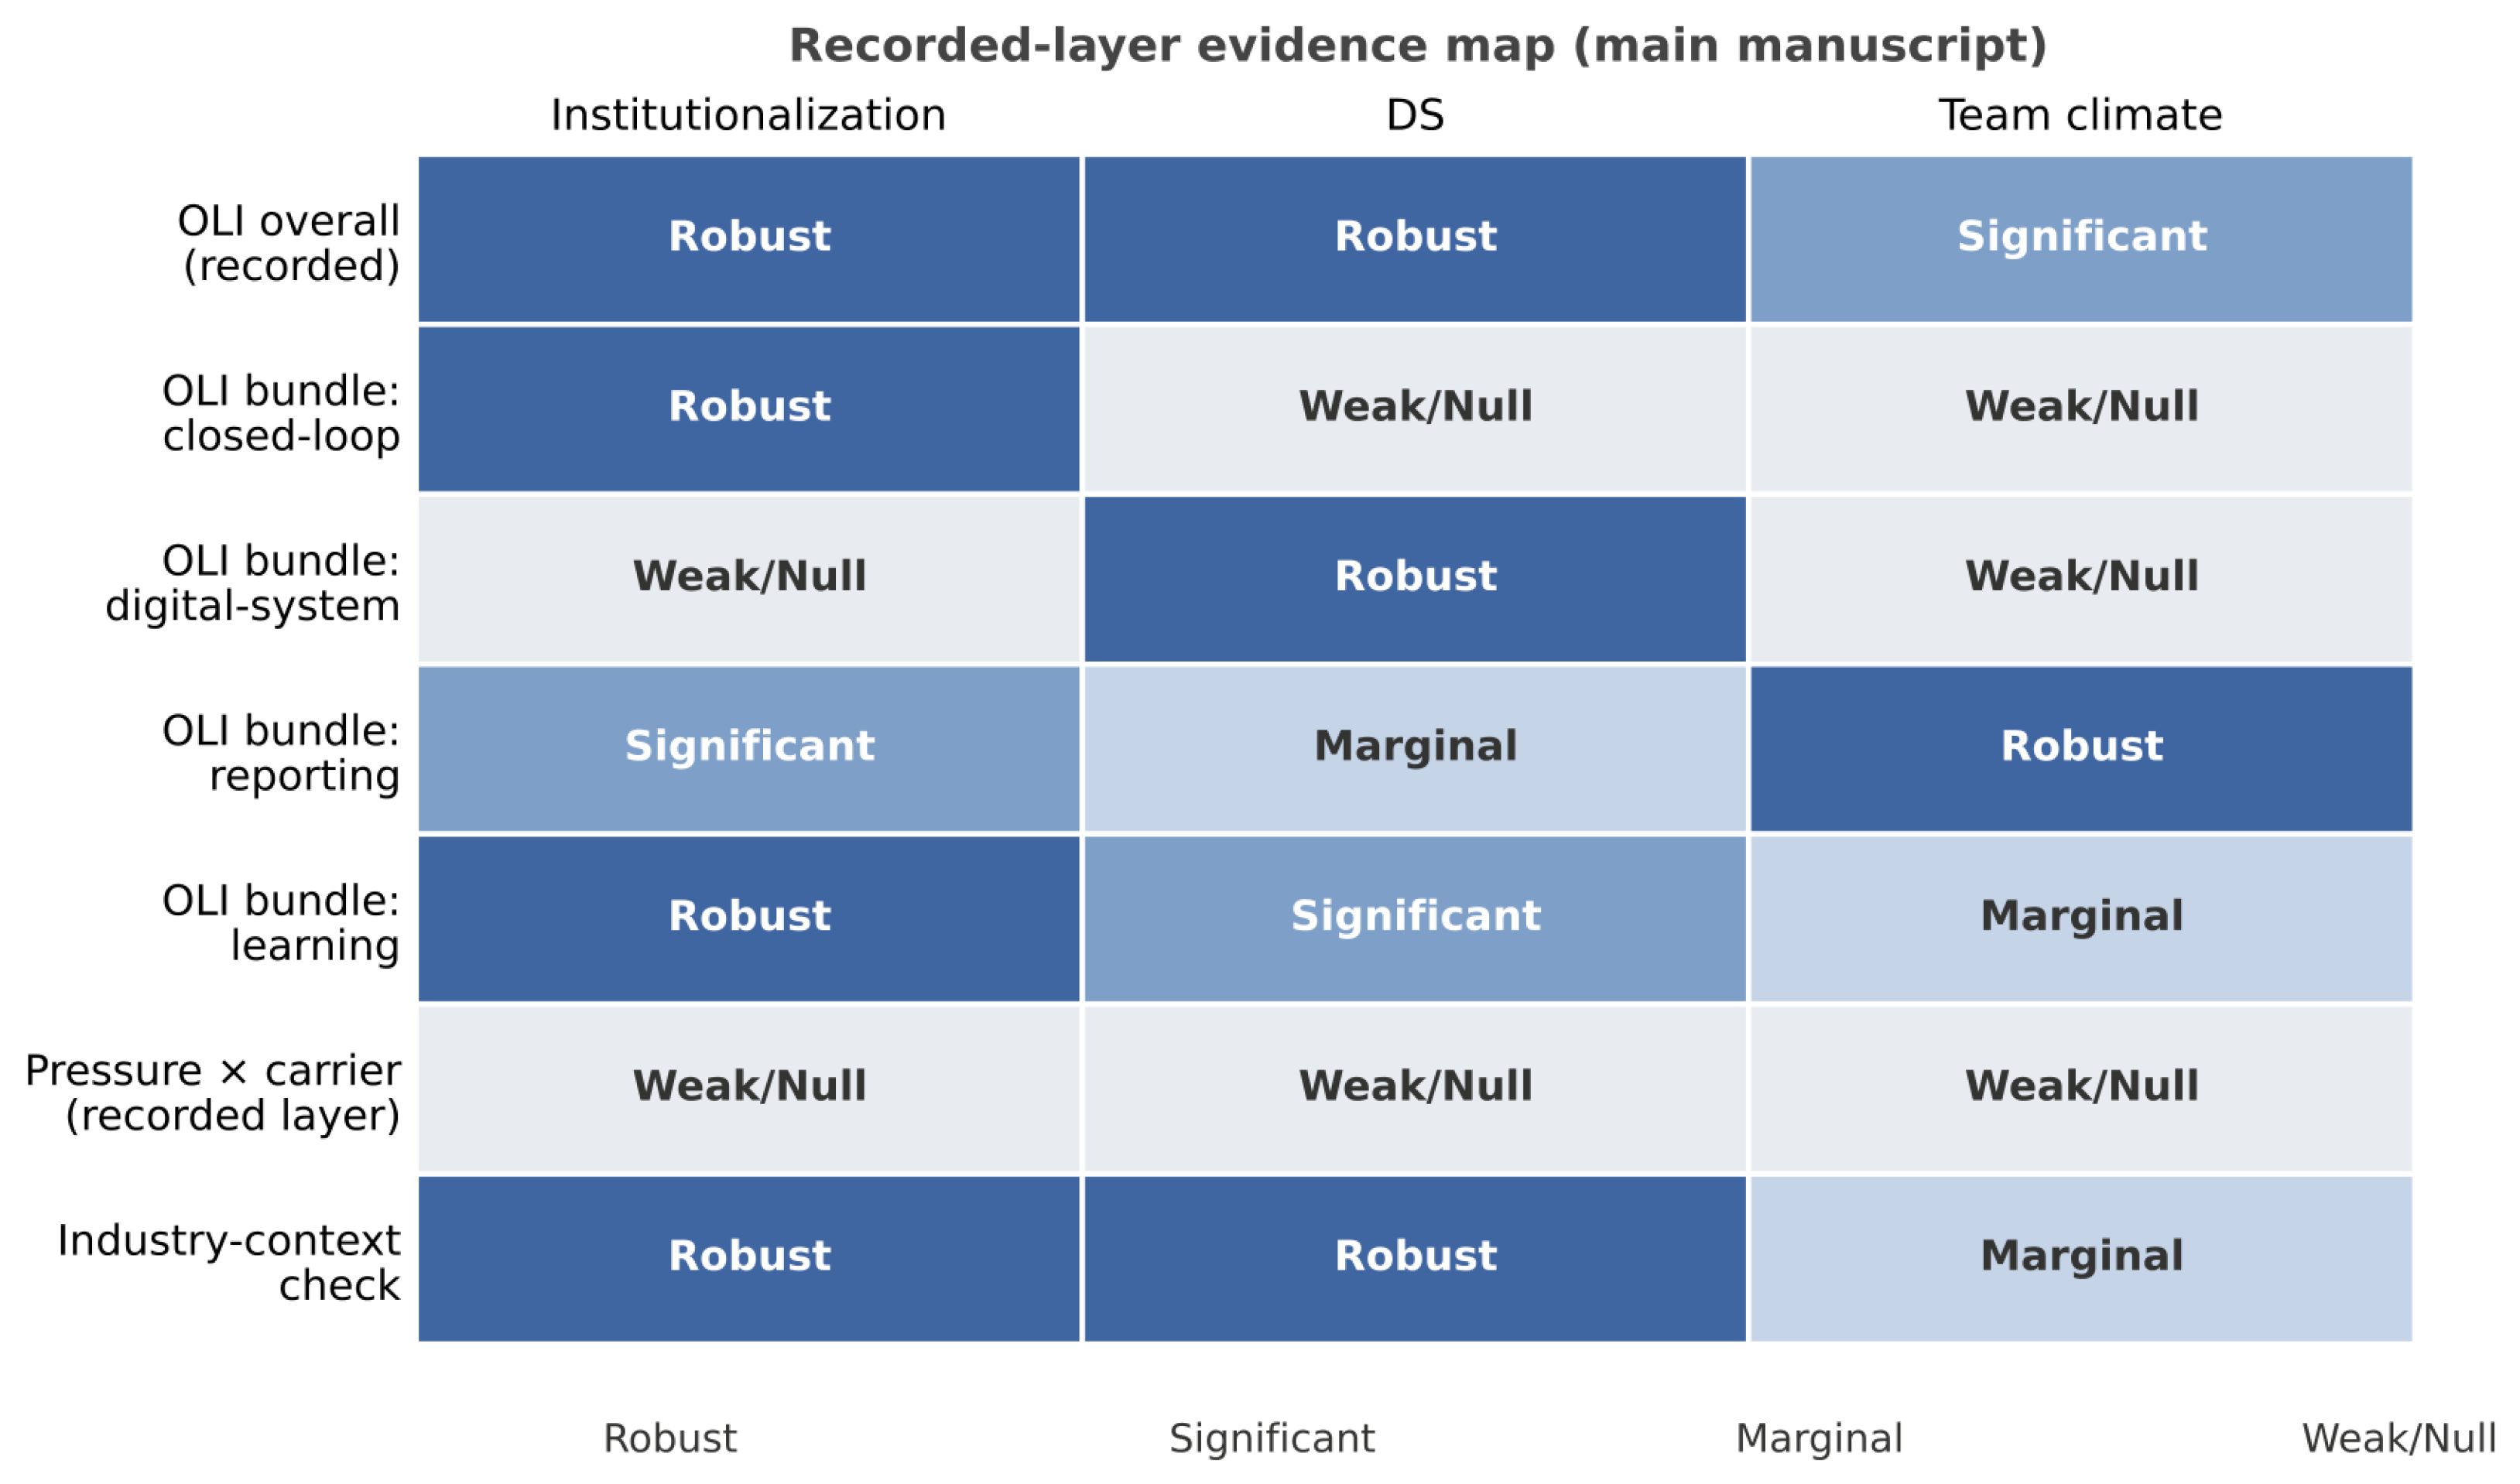

Disclaimer/Publisher’s Note: The statements, opinions and data contained in all publications are solely those of the individual author(s) and contributor(s) and not of MDPI and/or the editor(s). MDPI and/or the editor(s) disclaim responsibility for any injury to people or property resulting from any ideas, methods, instructions or products referred to in the content. |
© 2026 by the authors. Licensee MDPI, Basel, Switzerland. This article is an open access article distributed under the terms and conditions of the Creative Commons Attribution (CC BY) license.