


Abstract
Innovation system decision-making is a core component in promoting incentives and conditions necessary for the emergence of innovation. It also plays a critical role in guiding policy and modeling strategies that aim to promote science, technology, and entrepreneurship at national, regional, and local levels. Decision-makers often select innovation system models that do not align with contextual scope, data accessibility, or institutional conditions, undermining their implementation. The lack of alignment between innovation system model assumptions and contextual realities undermines analysis and policy design, particularly when trying to implement a regional model on a national scale without any sort of adaptation. This study presents a framework that aligns innovation system models to specific contexts by providing a decision-making system based on structural analysis. Using a comprehensive collection of relevant previous studies related to the theoretical evolution of innovation system models, this research provides insights regarding the most used types and techniques to compare innovation systems comprising national and regional ISs, helix models, and innovation and entrepreneurship ecosystems. For each model, explanatory potential via structural analysis is operationalized through five indicators derived from multilevel graphs: geopolitical scope, number of actors, vertical and horizontal density, and Shannon’s entropy. These indicators are then systematized into dimensions comprising two feasibility filters and three mechanism-related dimensions, forming the basis for a minimum viable innovation system model selection heuristic. This structural analysis shows that ecosystem lenses capture distributive and adaptive interaction structures; helix models emphasize coordination and governance; and national or regional innovation systems underscore policy reach and institutional boundaries. The results provide a numerical analysis of three different contexts—a national mission, a city entrepreneurship program, and a regional coordination upgrading effort—highlighting areas for improvement in planning, project implementation, and public policy design.
1. Introduction
In the 1980s, Freeman and Lundvall [1] showed that the innovation system perspective is a central framework for analyzing the interactions between actors, institutions, and resources that facilitate the creation, use, and diffusion of innovation. These models have become the standard reference for innovation researchers and practitioners, guiding policy and modeling strategies and projects that promote science, technology, entrepreneurship, and innovation development at the national, regional, and local levels [2,3,4].
The literature includes important studies comparing innovation system perspectives focused on analyzing the same model across different countries, regions within a single country, variations in governmental models within the same country, and synergetic capabilities within national contexts. However, few have compared multiple innovation system models, though several techniques have been proposed to compare them. These include the multilevel logit model; the sectoral multilevel perspective; language processing; level analysis; Fuzzy-Set Qualitative Comparative Analysis (FSQCA); configurational analysis; and comparisons of characteristics, mechanisms, and processes. Additional approaches involve system mapping and agent comparisons, information theory, econometric analysis, comparative data-driven analysis, and comparative case studies. However, as noted, these research efforts have not compared multiple innovation system models, nor have they developed selection-support tools to choose suitable innovation system models for specific contextual settings. Therefore, the evidence suggests that decision-makers often select innovation system models that do not align with contextual scope, data accessibility, or institutional conditions; for example, in cases such as Mexico [5,6], Chile [7,8], Peru [9], and South Africa [10,11], the decision-makers chose regional innovation system models for nationwide projects or tried to combine incompatible innovation system model premises (static systems with adaptive systems). In the best cases, this is semantically redundant, while in the worst cases, the lack of alignment between model assumptions and contextual realities (choosing a regional model for a national project) undermines analysis and policy design, particularly when trying to implement a regional model on a national scale without any sort of adaptation.
Using different perspectives and techniques to choose suitable innovation system models has raised several important research questions. One of these pertains to their misalignment between theory and practice, which undermines their implementation and results. For example, the use of regionally conceptualized innovation system models to build national systems, which produce a wide range of different outcomes depending on other contextual variables [5,6,7,8,9,10,11]; misalignment between objectives and governance strategies; or weak policy applicability. Another important area of inquiry is the link between structural analysis and the explanatory potential of innovation system models. Heuristic tools offer numerous advantages in innovation system model selection based on specific contextual settings. This includes integrating the user’s priority weights with the mechanism-related dimensions to assess a score for each feasible innovation system model and produce a recommendation. However, these tools also face challenges, such as partisan politics, resource constraints, or path dependence.
As researchers in the field of innovation systems, we recognize the importance of addressing these questions. The primary objectives of this study are as follows: (1) to carry out a systematic review of the innovation system literature and to characterize each system model, focusing on eight widely used models with an explicit geopolitical scope: national ISs (NISs), regional ISs (RISs), triple helix (TH), quintuple helix (QIH), innovation ecosystems (IEs), entrepreneurship ecosystems (EEs), national innovation ecosystems (NIEs), and regional innovation ecosystems (RIEs); (2) to develop a multilevel graph with agents and interactions, from which five explanatory potential indicators are derived: geopolitical scope, number of levels and actors, level–relationship density, actor-relationship density, and Shannon’s entropy; (3) to systematize the explanatory indicators into dimensions comprising two feasibility filters (geopolitical scope and agent coverage) and three mechanism-related dimensions (horizontal richness, vertical articulation, and relationship variety); and (4) to provide an exploratory selection framework based on heuristics to select innovation system model, matching the different models with specific contextual settings based on the idea that users first filter based on feasibility (geopolitical scope; actor/data coverage). The findings obtained using simulation scenarios are expected to support more effective decision-making for governments, planners, and strategists. This will help them to select the most appropriate innovation systems and design interventions that are better aligned with their objectives and constraints.
The main theoretical contributions of this study are as follows:
- A comprehensive collection of relevant studies related to the theoretical evolution of innovation system models.
- Identification of the most recent work, offering insights to support constructing multilevel graphs and assessing exploratory potential (EP) indicators that underpin the development of context-sensitive selection heuristic tools.
- An operationalized, indicator-based comparison of the innovation systems lens via multilevel graphs.
- An innovation system multilevel graph comprising four distinct levels: national, regional, local, and institutional.
- A selection heuristic that translates explanatory potential indicators through the contextual dimensions into innovation system model recommendations that best fit a user’s context.
- A minimal viable selection tool that provides a structured starting point for improving the alignment between innovation system theory and practice in the governance of innovation and entrepreneurship development.
- A presentation of exemplary case studies of the developed selection heuristic simulation using three contexts: a national mission, a city entrepreneurship program, and a regional coordination-upgrading effort.
2. Theoretical Background
2.1. The Evolution of Innovation Systems (ISs)
Ackoff and Checkland define a system as a collection of interconnected elements that interact to produce a specific outcome [12,13]. In this sense, our study considers the outcome as the emergence of innovation and entrepreneurship. The origins of innovation systems (ISs) date back to the early 1840s, with Friedrich List’s work [12]. Contemporary IS studies began with Christopher Freeman in 1982 [13] and were further developed in 1988 by Freeman and Lundvall [1] and Nelson [2] through the national innovation system (NIS) approach. Their research focused on describing how developed countries came to be developed through innovation, characterizing the process as an interaction between the central government (CG), universities, and industry. In this model, the CG implements public policies and provides funding to encourage university–industry collaborations, fostering innovation and advancing current technologies. More recently, developing countries have adopted this work as a guide or process to develop themselves [14,15].
In 1992, Cooke [16] introduced a regional perspective through regional innovation systems (RISs), studying how regional governments (RGs) increased involvement in day-to-day operations can create more favorable conditions for universities and industry when collaborating on regional innovation projects.
As scholarly interest in ISs grew, the triple helix (TH) model was introduced by H. Etzkowitz & Leydesdorff [17]. The authors built on the RIS approach but emphasize a more cooperative interaction between universities and government, two of the three primary agents. Baber [18] and later Carayannis & Campbell [19] updated the TH model by proposing the addition of civil society (i.e., local culture and market/beneficiaries) in what they called the quadruple helix (QH) model [20]. Subsequently, Carayannis et al. [21] introduced the quintuple helix, adding sustainability as the fifth helix.
The term “ecosystems” was later adopted to describe systems with memory and decision-making capabilities, thereby exhibiting adaptability and interaction-driven evolution [22,23,24]. Expanding on this, Adner’s [25] innovation ecosystem (IE) model analyzes the actors and resources of a specific geographical area and their interrelationships, as well as the ecosystem’s evolution in the context of its innovation output. In this model, the IE considers government, industry, universities, infrastructure, financing, research institutions, and entrepreneurship as fundamental actors.
Furthermore, the functional objectives of innovation systems/ecosystems and entrepreneurship ecosystems are distinct. While ISs primarily generate innovation—often using entrepreneurship merely as a way to promote innovation—Isenberg’s [26] entrepreneurship ecosystem (EE) model reverses this paradigm. In the EE model, the primary emergent property is entrepreneurial activity itself; innovation serves as a catalyst, and local culture acts as one of the structural drivers.
A pro-entrepreneurial culture motivates individuals and organizations to engage in entrepreneurial activities by offering informal societal approval, practical support, and access to networks [22,27,28,29]. Due to their reliance on culture, EEs frequently emerge as geographically concentrated spaces, often clustered around a particular city or anchored to a specific university. Frenkel and Maital [30] and Jackson [31] also applied the ecosystem concept to NISs and RISs, leading to the development of the national innovation ecosystem (NIE). Meanwhile, Ranga [32] and Russell and Smorodinskaya [33] applied it to RIS, converting this model into the regional innovation ecosystem (RIE). Figure 1 summarizes the theoretical evolution of innovation system models.
Figure 1.
Innovation system timeline (authors’ creation).
Following our protocol, we provide a deeper review of IS models, characterizing and operationalizing them to develop a selection heuristic (see Section 3.2 and Section 4.1).
2.2. Analyzing Innovation Systems
Howoldt [34], Pereira D. and Pereira O. [35], and Srholec [36] compared IS perspectives by analyzing the same model across different countries; Lu [37] and Porto-Gomez [15] compared regions within a single country; Liu and White [38] compared variations in governmental models within the same country; and Li et al. [39] compared synergetic capabilities within national contexts. Chang & Chen [40] analyzed different system models, but their focus was limited to specific parts of the system, while Liu et al. [41] focused on specific industries. Botta et al. [42] proposed an analytical framework that distinguishes between levels and acknowledges their specific characteristics; however, in practice, it tends to analyze each level in turn and neglects interlevel interactions. Few studies have compared multiple IS models; exceptions include Afzal et al. [43], who compared two models, and Markard & Truffer [44], who adopted a theory-based, sectoral, multilevel prospective analysis.
Several techniques have been proposed in the literature to compare IS models. These studies include Srholec [36], who developed a multilevel logit model; Markard and Truffer [43], whose work involved a sectoral multilevel perspective; Howoldt [34], whose work involved language processing; Botta et al. [42], whose work involved level analysis; Li et al. [39] and Pereira D. and Pereira O. [35], who used FSQCA; Liu et al. [41], whose used configurational analysis; Liu and White [38], who compared characteristics, mechanisms, and processes; Chang and Chen [40], whose work involved system mapping and agent comparisons; Porto-Gomez et al. [15], whose work involved information theory; Afzal et al. [43], who used econometric analysis; and Lu [37], whose work involved comparative case studies.
These research efforts have not compared multiple IS models or used specific analysis techniques to portray verticality or horizontality, nor have they developed selection-support tools to choose suitable IS models for specific contextual settings (see Table 1). Section 2.3 provides the conceptual framework underpinning our approach.
Table 1.
Summary of comparison types and techniques.
2.3. Conceptual Framework
This study uses structural analysis to determine the inherent logical architecture of different IS model conceptualizations. We build on the complexity work of Ponsiglione et al. [45], Katz [46], and Markard and Truffer [44] to develop multilevel graphs, which we use to transition from theory and the descriptive literature to a formalized graphic framework. Then, we use Pyka et al.’s research [47] to improve the context of the analysis. Our approach also measures how innovation system perspectives abstract reality into their models through network theory (density) and complexity (Shannon’s entropy) [48], building the “explanatory potential” of a given model. This was made possible by categorizing the literature-derived data into hierarchical levels, agents, and interactions to construct a topological representation as the basis for the variables. Finally, bridging the gap between theory and practice, these variables were operationalized into dimensions for the selection heuristic. Consequently, the heuristic’s dimensions are epistemologically grounded in the holistic structural properties defined by the literature, ensuring that the selection process is driven by the internal logic of the innovation systems.
We define “explanatory potential” as a construct built using the above metrics to scale how accurately a specific IS model conceptualization maps real underlying structural mechanisms. Grounded in Bertalanffy’s [49] systems theory, where a system serves as a formal representation of reality. In this sense, this term indicates the ability of a given IS model to offer a realistic representation of its agents and interactions through quantitative indicators, revealing how its systemic architecture facilitates or restricts coordination and resilience through its governance structure. Thus, explanatory potential measures the degree to which an IS model breaks down reality to explain the functional dynamics of the system.
Figure 2 summarizes the conceptual framework for this study, linking the structural analysis and its explanatory potential regarding IS models to a context-sensitive selection heuristic tool through four building blocks: (1) an IS model literature review and visual characterization, (2) explanatory potential measures and dimensions, (3) an IS model selection heuristic, and (4) the problem definition.
Figure 2.
Conceptual framework of this study. It links explanatory potential to a context-sensitive selection tool and consists of four building blocks: (1) an IS model literature review and visual characterization, (2) explanatory potential measures and dimensions, (3) an IS model selection heuristic, and (4) the problem definition.
Block (1) is the basis for the IS model selection framework. This block comprises a systematic review of the IS literature, from which the structural variables are identified—levels, agents, and relationships—and structurally analyzes each IS model via multilevel graphs, density, and Shannon’s entropy. These analyses feed into block (2), where the explanatory potential (EP) is built through measurements of agents (a), horizontal density (da), vertical density (dl), and Shannon’s entropy (E). These measures were operationalized and derived in context-sensitive dimensions comprising mechanism- and feasibility-related dimensions. The three mechanism-related dimensions are as follows:
Horizontal richness (H): Derived from the agent–relationship density, da, this reflects the number and intensity of ties between agents, including networked and open interaction patterns.
Vertical articulation (V): Derived from level–relationship density, dl, this reflects coordination and linkages across levels.
Relationship variety (S): Derived from Shannon’s entropy, E, this considers the richness and evenness of relationship types (e.g., cooperation, networking, development, and coopetition).
These EP measures are normalized to facilitate their use within the IS model selection framework. In addition, we define two feasibility-related dimensions that act as filters:
Geopolitical scope (G): The highest tier of governance engaged by a given IS model.
Agent/data coverage (A): The observable agent categories captured by a given IS model.
Block (2) feeds into block (3), which encompasses the selection heuristic tool. Once the different dimensions are defined (block 2) with the selection process, the values of the different measurements need to be in the same range to handle them together; thus, they are standardized. Once the process and the values are ready, the selection heuristic framework can be used; its outcome is a list of recommended IS models to be applied under specific conditions, which moves the process to block (4). Finally, block (4) specifies the user’s problems or needs, defining the scenario’s context. In our approach, these needs are expressed as priority weights assigned by the user to the three mechanism-related dimensions (H, V, and S), wH, wV, and wS, which feed the selection heuristic.
3. Research Data and Methods
This section presents the research data and methods of this study.
3.1. Research Data
A systematic literature review was performed in the Web of Science (Clarivate, Inc., Philadelphia, PA, USA) and Scopus (Elsevier) databases using predetermined keywords in the title, abstract, and keyword fields. The framework adopted comprises the stages described in Figure 3. The predetermined keywords included innovation systems, national innovation systems (NISs), regional innovation systems (RISs), triple helix (TH), quadruple helix (QH), quintuple helix (QIH), innovation ecosystems (IE), entrepreneurial ecosystems (EEs), national innovation ecosystems (NIEs), and regional innovation ecosystems (RIEs), as well as the following formula: (“complex adaptive systems CAS”) AND (“innovation systems IS, NIS, RIS, TH, QH, QIH, IE, EE, NIE, RIE, complexity”) AND (“IS, NIS, RIS, TH, QH, QIH, IE, EE, NIE, RIE”). Focusing on geopolitically bound innovation systems, their agents, and their relationships, accordingly, we excluded other IS models such as TIS and GIS. We collected 240 records published in the innovation system field between 2017 and 2022 and updated them to 2025.
Figure 3.
Summary of the literature review and visual characterization.
After full-text screening against the study’s objectives, we retained 56 relevant studies across various IS frameworks for in-depth analysis (Table 2). Although the number of documents was not quantitatively representative of all research on each IS model, it was qualitatively exhaustive, reaching a point where no new contributions emerged for the conceptualization of each model.
Table 2.
List of exemplary references for each IS model. These key references were used to build multilevel graphs.
To strengthen the review’s theoretical grounding, we also included seminal, highly cited references for each framework identified within the retrieved publications. As these references pre-dated the 2017–2022 window used in our study, their inclusion broadened the temporal scope of the review.
3.2. Research Methods
In this section, we describe the information required to perform the structural analysis and develop the IS model selection heuristic. This includes unweighted multilevel graphing and Shannon’s entropy from the complexity field and network graph matrices and density from the network field.
To compare the different IS models, a translation process was required to transition from the qualitative literature to quantitative variables. Drawing from Larkin et al. [90] and Ponsiglione’s [45] complexity science perspective, multilevel graphs were used to topologically map the hierarchy levels, agents, and relationships, as they reflect the richness of these factors in a system. Following Pyka et al. [47], to measure the saturation ratio of the relationship agents, network density was selected, as it reveals the connectivity intensity of each IS model, providing a quantitative representation of systemic coordination. Finally, aligned with Nelson [2], Leydersdorff and Ivanova [48], and Bhattacharya et al. [91], we identified each system’s parts and resources using Shannon’s entropy; this metric allows for a rigorous measurement of the existing systemic diversity of agents and relationships within a system, thus demonstrating the distributional diversity that facilitates its evolution.
3.2.1. Unweighted Multilevel Graphs and Derived Network Graph Matrices
As is shown in “Computer Science and Engineering—Theory and Applications” [92], unweighted multilevel graphs can represent agents, their interactions, and the operational levels of each IS mode. An IS multilevel graph based on our comprehensive literature review is presented in Figure 4.
Figure 4.
General characterization of the template of the multilevel graph used in this study (authors’ elaboration; keynote). A multilevel graph encompasses four levels of analysis (national, regional, local, and institutional) and the emergent level “Innovation and Technology or Entrepreneurship Development.” Green cones indicate active agents in each IS, and red cones denote inactive agents. We used three colors for the lines: yellow for connections between different levels and the system’s emergent level, green for connections across various levels, and purple for relationships at the same level.
To ensure reproducibility, the following standardized process was followed: information extraction, baseline definition, agent harmonization, and interaction coding. By surveying the literature, a universal baseline comprising three structural variables—levels, agents, and interactions—was identified. According to Lundvall et al. [93], things exist whether we consider them or not; thus, a reality vs. conceptualization benchmark was adopted. This approach demonstrates that while the IS model recognizes its scope level, the other structural levels are still there. Therefore, all levels were included in all graphs to measure where a model fails to acknowledge this context.
As agent information was extracted, inconsistencies were harmonized based on functional roles rather than nomenclature. For instance, the term “society” was found to be inconsistently used across the helix literature. This process allowed us to use this term to represent the market/beneficiaries of the innovation system instead of the regional culture—whose conceptualization was an outlier and thus excluded from consideration in the graphs—although the case is still mentioned.
Finally, for Shannon’s entropy calculations, the interactions and directionality coding were performed following an “explicit mention protocol”, where an interaction was only registered as present if the literature explicitly mentioned an exchange process. Furthermore, bidirectionality was registered only if reciprocal flows were explicitly mentioned (e.g., government → funding→ universities → government priority-oriented research) when an interaction was present; in cases of undocumented reciprocity, the direction remained unidirectional. This interpretation ensures that the graphs show the models’ actual depth rather than the researcher’s inference.
An IS multilevel graph comprises four distinct levels—national, regional, local, and institutional—and an emergent level labeled “Innovation and Technology or Entrepreneurship Development” [46]. The cones represent agents (green: active; red: inactive). The edges are color-coded as follows: yellow for connections between different levels and the system’s emergent level, green for connections across different levels, and purple for relationships occurring at the same level. The arrows of these edges denote directionality (A ⟶ B for unidirectional; A ↔ B for bidirectional). These edges also encode relationships, such as cooperation, coopetition, or a transactional nature.
From these graphs, we derived binary network matrices that record the presence (1) or absence (0) of ties between actors. According to Barrat et al. [94], if the graphs are directed, then the resulting matrices are asymmetric. As illustrated in Figure 5, two matrix types are constructed: (i) the “Level Relationship Matrix”, illustrating the relationships between levels and providing a “vertical” perspective on the IS models (see Figure 5, left), and (ii) the “Agent Relationship Matrix”, depicting the relationships between agents regardless of their levels and providing a “horizontal” view of interactions across different IS models (see Figure 5, right). This dual representation captures the various dimensions they possess, whereas traditional approaches typically depict a single-layer network.
Figure 5.
General characterization of the vertical vs. horizontal dimensions explored through the analyses (authors’ elaboration).
3.2.2. Indicators for Assessing the Explanatory Potential of IS Models
The structural analysis yielded five key indicators of the explanatory potential of IS models; namely, geographical scope, number of agents, density value, number of levels, and Shannon’s index, which are described below. The first two indicators refer to filtering measures, and the remaining three are used to assess the final score:
- (a)
- Number of agents: This dimension comprises the specific agents identified for each IS model, including primary, secondary, and sporadic agents. Each IS model proposes several agents that interact with one another to varying degrees, all of which constitute the IS model conceptualization.
- (b)
- Density value: The density of a system indicates how well its agents are connected. As mentioned above, we applied two density approaches to capture the various relationships between agents and levels. The first density value (da) in the result table illustrates the density of relationships between agents, regardless of their levels (horizontal density). By contrast, the second density value (dl) in the result table indicates the density of relationships across different levels (vertical density). The system’s density (D) was calculated using the network graph matrix with the following formulas:
- For horizontal density (agent–relationship density), da = Ed/(N × N);
- For vertical density (level–relationship density), dl = Ed/(N × (N − 1)).
- Here, Ed is the number of actual edges (relationships), and N is the number of matrix entries; when multiplied, the latter provides the number of possible edges. For horizontal density, we adapted the formula by removing the “−1”, as agents are not individual institutions; they are instead categories of institutions. Therefore, institutions within that category can interact with each other [92,93].
Regarding the operationalization of the horizontal density (da) the “−1” term was removed from the standard formula; this was a deliberate choice to reflect the meso-level nature of the agents in this analysis as, unlike traditional social network analyses, in which nodes represent unique individuals, in innovation system models nodes represent institutional categories. For instance, for “universities”, University A and University B exist within the category, and they can—and do—interact. Therefore, excluding self-loops (−1 term) would undercalculate the density of systems that explicitly consider intra-category interactions. By using only “N × N”, the formula accounts for relationships inherent to complex innovation systems.
- (c)
- Number of levels: The number of levels was determined based on information from the literature review. These levels are geopolitical: national scope refers to a country, regional scope to a zone within a country, local scope to a city, and institutional scope to specific institutions within a city. In total, four levels were identified, each existing within the next higher one: institutions within cities, cities within regions, and regions within countries.While the term “region” is sometimes ambiguously defined in the literature, referring at times to large geopolitical areas containing multiple cities and at other times to specific cities, in this paper, we distinguish between regional and local levels to avoid confusion; nonetheless, we considered both scenarios. However, as research advances, other levels may emerge, and this number could be updated accordingly.
- (d)
- Shannon’s entropy index (E): We operationalized the diversity of relationships represented by each innovation system (IS) model using Shannon’s entropy, E [94]. For a given model, let the relationships be allocated across K = 8 categories, and pi denotes the proportions of relationships in each category i (i = 1,…, K). Entropy is defined as
Based on the literature, we first constructed a relationship matrix across all IS models. Following the explicit mention protocol, each observed relationship is coded as follows: 0 = absent, 1 = unidirectional, and 2 = bidirectional. To operationalize Lundvall et al.’s [93] premise of things existing whether one considers them or not—applied to levels in this case—a weighted articulation penalty was applied to the levels’ articulation. When a model in the literature references regional and local levels but does not specify that they are articulated, we assign a half-weight (0.5 for unidirectional or 1 for bidirectional).
This acts as a structural recognition that, while the levels are present in reality, the models’ conceptualization does not recognize those links. By assigning half-weights, the entropy calculations accurately reflect this potential connectivity, penalizing the models’ scores for not articulating them while recognizing their existence.
Similarly, using the literature, the multilevel graphs and matrices of each model’s coded relationships were summed within eight categories: Government Cooperation; Central Government (CG) Environment–Development Public Policies; Regional Government (RG) Environment–Development Public Policies; Local Government (LG) Environment–Development Public Policies; Organizations’ Cooperation; Organizational Networking; Organizational Development; and Organizational Coopetition. Let denote the unadjusted sum for category i in model m, with m = 1,…, N and N = 8 models.
For model m, let be the sum of category proportions. If a category’s cross-model total exceeds the number of models (N = 8), we apply a within-category adjustment:
where is the adjusted value, is the category sum for the IS model, and is the highest value within that category.
This category adjustment is a normalization protocol. By scaling the category sums against the highest observed value (), we ensure that the resulting entropy value reflects the proportional diversity within each IS model, rather than being artificially inflated by the absolute number of citations or model size. This allows for a more accurate comparison of structural richness across the different models with their respective levels of conceptualized depth, making sure the metric actually measures the quality of interaction distribution across categories.
Proportions, pmi, are then calculated as follows:
The resulting pmi values form the basis of Shannon’s diversity index [95], where a higher value indicates a broader and more even distribution of relationships across categories. Thus, this index is useful as a diagnostic tool for adaptive variety, as it suggests that the IS models are not dependent on a single category, which could lead to a systemic bottleneck. Instead, they possess a decentralized distribution of interactions. In practice, this implies a higher systemic capacity for resilience, where the system can still function through alternative pathways if one is disrupted. Conversely, per Zhang et al. [96], a low index value signals a brittle systemic architecture with a high concentration of interactions, making the system vulnerable to stagnation or total shutdown. This is what a potential user of the selection heuristic (a researcher or policymaker) could be interested in when looking for an innovation system model, particularly one that is “diverse” or highly ranked on the index, especially if their context has a significant need for resilience or adaptability.
3.2.3. IS Model Selection Framework
As described in Figure 2, the EP measures serve as proxies to derive the context-sensitive dimensions that underpin the IS model selection framework. This is reflected in an exploratory heuristic whose processes require a series of approaches, as described in the next section.
4. Results
In this section, we assess the explanatory potential of indicators for each IS model, their normalization values, and the decision aid tool.
4.1. Assessment of Explanatory Potential Indicators
Five core indicators were used to provide a multidimensional picture of the explanatory potential of each IS model: geopolitical scope, g; number of agents, a; agent–relationship density, da; level–relationship density, dl; and Shannon’s diversity index, E. Table 3 summarizes the values of these indicators.
Table 3.
Values of exploratory potential indicators by IS model.
- (a)
- National Innovation Systems (NISs)
The NIS model is defined at the national level, bypassing regional and local levels, and characterized by a unidirectional link from the government to universities and industry, as well as bidirectional collaboration between universities and industry. This facilitates innovation and technology development.
Owing to its concentration on governmental and institutional levels, the NIS model depicts a sparse configuration, with low agent–relationship density (da = 0.24; i.e., less than a quarter of possible ties are present) and even thinner level–relationship connections (dl = 0.13), the lowest value among the models. Additionally, Shannon’s entropy index (E = 0.94) indicates a limited and uneven mix of relationships, consistent with a simple, top-down structure. Overall, an NIS is most suitable for mapping national policy and basic university–industry collaboration schemes.
- (b)
- Regional Innovation Systems (RISs)
The RIS model’s patterns of interaction mirror those of an NIS; however, its main difference is in scope: the actor is a regional (RG) or local government (LG), depending on how “region” is defined. In these approaches, the concept of “region” ranges from a large geographical area to a city. An RIS exhibits similar structural metrics to those of NIS, da = 0.24 and dl = 0.13, with a slightly higher Shannon’s diversity index for an RIS (E = 0.96), suggesting a more evenly distributed relationship.
Regarding explanatory potential, RISs reframe NISs, transitioning from a spatial to a structural perspective. RIS approaches prioritize regional proximity, local clusters, or regional policy instruments, but they do not add to network richness, openness, or interlevel coordination compared to NISs.
- (c)
- Triple Helix (TH)
The TH model is similar to NISs/RISs, with the key difference that it introduces a bidirectional relationship between universities (U) and the government (G), particularly at a local government (LG) level. From this perspective, the LG functions not only as a funder or regulator but also as a collaborative project partner with universities.
This additional connection provides TH models with higher density (da = 0.28 and dl = 0.20) and Shannon’s index (E = 1.01) values than those of NISs/RISs. Although these values provide a more accurate representation of real-world dynamics, the overall structure remains unchanged, the only difference being that the government level shifts from regional to local.1
- (d)
- Quintuple Helix (QIH)
The quintuple helix (QH) model extends the TH perspective by incorporating two additional helices: society and sustainability. The definition of “society” remains challenging; in some contexts, it is conceptualized as local culture (a binding context) while, in others, it is the market or beneficiaries (demand-side agents). The concept of “region” is also ambiguous, ranging from a single city to a larger area that encompasses several cities.
Although the broader number of helices included in the QIH model results in more agents and relationships, it exhibits lower density values, da = 0.25 and dl = 0.20, driven by a lower relationship-to-agent ratio. By contrast, Shannon’s diversity index increases (E = 1.06), indicating a slightly wider variety of relationship types, but remains below that of the ecosystemic models.
- (e)
- Innovation Ecosystems (IEs)
The IE model provides a higher level of structural detail by disaggregating previously bundled functions into local or regional dedicated agents (e.g., infrastructure, finance, research institutes, and entrepreneurship), resulting in nine agents. This ecosystem perspective also provides bidirectional feedback between these agents and the emergent innovation and technology development (ITDev) level, as it emphasizes the system’s memory, learning, and decision-making capabilities.
This richer composition results in a higher agent–relationship density (da = 0.33), while level–relationship density (dl = 0.20) remains unchanged, as the additional ties are concentrated at the institutional level. Shannon’s diversity index is the highest among all models (E = 1.3594), indicating a large variety of relationship types. These features give the IE model strong explanatory potential for complex, open, and adaptive innovation settings.
- (f)
- Entrepreneurship Ecosystems (EEs)
Unlike IEs, where the systemic output is innovation, the EE model shifts the outcome to entrepreneurship. This paradigm change emphasizes local culture as a structural driver operating at the local (city) or institutional level, particularly within universities. Therefore, innovation and technology development are reframed as a system variable that promotes the creation and scaling of new ventures.
The EE model includes 10 agents and specifies highly detailed horizontal ties between them, resulting in the highest agent–relationship density of all models (da = 0.42). Level–relationship density (da = 0.20) remains unchanged, with most interactions occurring at the institutional/local layers. Shannon’s diversity index (E = 1.2282) is second only to that of the IE model, indicating a rich and relatively even distribution of relationship categories. The high density and diversity of EEs make them suitable for explaining how ecosystems generate and support entrepreneurship; however, their explanatory potential is highly localized.
- (g)
- National Innovation Ecosystems (NIEs)
Unlike NISs, NIEs add relationships between agents, expanding beyond simple cooperation to include competition and coopetition, explicitly recognizing the system’s need for adaptive mechanisms. However, relative to IE and EE models, NIEs include fewer agents (six), resulting in an agent–relationship density (da = 0.3056) higher than that of NISs/RISs/TH/QIH but lower than that of IEs and EEs; nevertheless, the level–relationship density remains unchanged (dl = 0.20). Furthermore, Shannon’s diversity index is the lowest in the set (E = 0.9360), indicating a relatively narrow and uneven distribution of relationship types compared with other ecosystemic and helix models.
Consequently, the NIE model shows mid-range explanatory potential, suited for macro-level assessments of national innovation capabilities. This goes beyond the traditional NIS by integrating ecosystemic ideas and non-cooperative relationships, but its agent set and relational diversity remain comparatively coarse.
- (h)
- Regional Innovation Ecosystems (RIEs)
The RIE model mirrors the NIE logic on a regional/local scale, with the same six agents and similar relationships (cooperation, competition, coopetition, and feedback from ITDev to agents). The main difference lies in the type of governmental actor, which shifts to regional or local levels (RGs or LGs). For this reason, the density values are the same (da = 0.3056 and dl = 0.20); however, Shannon’s diversity index increases to E = 1.1140, suggesting a somewhat richer and more evenly distributed set of relationships at the subnational scale (e.g., regional clusters and localized interactions).
As described here, different frameworks are suitable for different contextual conditions. The selection heuristic developed in the following subsections builds directly on these patterns, translating them into practical criteria for choosing the most appropriate IS model.
4.2. IS Model Selection Heuristic
The selection heuristic translates explanatory potential indicators through the contextual dimensions into innovation system model recommendations that best fit a user’s context. The process consists of five straightforward steps, as shown in Figure 6, illustrated in Table 4, and described below.
Figure 6.
Structure of the selection heuristic approach.
Table 4.
Three examples with simulated scenarios used to select specific innovation system (IS) models employing the proposed heuristic.
- Stemming from the root problem of choosing mismatched IS models to fix a perceived problem, the researcher or decision-maker should first define their objective to set the context for their decisions. The objectives can be generally divided into three segments: articulation across different levels, usually from the government; interactions between specific institutions, usually at the same level; and system stability, concerning the number and quality of relationships.
- Building on point 1, the user defines the inputs for two filtering indicators: geopolitical scope, g, and agent data availability, a. The former refers to the highest level of governance involved in the study, including national, regional, and local levels. In a subsequent step, the user selects the number of agents’ information that best fits the available IS models (a ∈ {3, 5, 6, 9, 10}). Agent/data coverage reflects the granularity and breadth of available actors and data; the minimum viable set comprises government, industry, and universities, while higher coverage improves feasibility for ecosystemic lenses. Data availability refers to the user having access to information on government policies and funding; private industry projects and funding for innovation development; university projects on innovation and entrepreneurship development; and cooperation projects.
- In the next step, the user assigns relative importance to vertical articulation (V), horizontal interaction (H), and systemic diversity (S) via priority weights, w (wV, wH, and wS, respectively). These weights are allocated based on the following general logic:
- High V → stronger cross-level coordination potential. Aligning national–regional–local policies and programs.
- High H → richer cross-agent networking/open-innovation readiness. Denser inter-agent structure matters.
- High S → more varied, evenly distributed interaction mechanisms (robustness/complexity). Richer, more evenly distributed interaction types matter.
- Subsequently, models are filtered by scope and feasibility. Each scope is associated with a set of applicable models, and those requiring a finer agent granularity than what is available are excluded. For national problems, N = {NIS, NIE}; for regional problems, R = {RIS, TH, QIH, IE, RIE}; and for local problems, L = {EE, TH, QIH, IE, RIE}. If the user’s context is oriented toward a quick lean minimum viable system, then the horizontal priority dimension should be its next selection criterion. If the user’s context leans toward articulation between different government levels or sectors, then the vertical priority dimension should be the next selection criterion. If the user’s context is more focused on building a stable and robust system that better considers complexity, then the fifth dimension, “stability, robustness, and complexity”, should be next for their selection criteria. With any one of these dimensions (3, 4, or 5), the user would only need to select the best-ranked IS model for the selected dimension, with 1 being the best ranking.
- The remaining models are scored using a weighted combination of their normalized indicators (see Table 4) and the user-allocation weights across the three dimensions, yielding a fit score. If another model’s score lies within a small margin, both are proposed as complementary lenses. Specifically, if the second-best score is within Δ ≤ 0.05 of the top score, a top two is returned with guidance on integrative use (e.g., “RIE as the system lens + EE for local venturing”). To choose one of these two, one can use any other dimension to make the selection. Once the dimension is chosen, the user must select the best-positioned option within that dimension. Ties are broken, in order, by (i) expected policy reach at the focal tier, (ii) openness requirements, and (iii) implementability, given the available data. The process ensures clarity, comparability, and adaptability to different policies and analytical contexts.
The proposed dimensions discussed above are the minimum dimensions required to make an informed and grounded IS model selection; however, this heuristic can be enriched by the user through refining their selection criteria based on their specific needs and situation.
4.3. Exemplary Case Studies
To evaluate the selection heuristic, we used empirical archetypes rather than random scenario simulations. These archetypes were structurally built from the literature review (Table 2), as well as contemporary policy documents—ranging from Mexico’s Conacyt [5] to South Africa’s Department of Science and Innovation [10]—serving as historical and operational calibration. This ensures that the proposed framework was tested against governance paradigms currently in operation and provides the selection heuristic’s demonstration of utility. Table 4 illustrates the heuristic with an analysis of three contexts: a national mission, a city entrepreneurship program, and a regional coordination upgrading effort.
After filtering feasible lenses by scope and agent coverage, we weigh priorities over horizontal richness (H), vertical articulation (V), and interaction diversity (S). Using the normalized scores in Table 3, the national case selects the NIE model over the NIS model (0.672 vs. 0.002). The city case selects an RIE (0.448), with TH as a design complement (0.282). The regional case selects TH (0.602), with QIH as a near tie (Δ = 0.033), indicating value in combining coordination interfaces with societal engagement. These examples show how the tool yields transparent, context-sensitive recommendations.
5. Discussion, Limitations, and Future Research
This study provides a new perspective on the misalignment between IS model theory and implementation. We do so by addressing the following research question: “Under what contextual conditions does each IS model contribute distinctive explanatory value, and how can these differences be exploited for analysis and policy design?” The outcome of this query resulted in an exploratory decision framework that aligns IS models to specific contextual settings.
In this section, we discuss three aspects: the results of the structural analysis, the IS model selection heuristic tool, and limitations and avenues for future research.
5.1. Interpreting Explanatory Potential Across IS Models
The structural analysis yielded five key explanatory potential indicators: geopolitical scope, g; number of agents, a; agent–relationship density, da; level–relationship density, dl; and Shannon’s diversity index, E. As for interlevel relationships, of the four potential levels that could be articulated in an innovation system, interactions were primarily concentrated at one governmental level and the institutional level. This is where innovation and technology develop. This aligns with Korber et al. [97], who found that the institutional level is essential for analysis; even so, these models still do not consider the individual level.
The lack of articulation between government levels prevents the system from creating synergies, which relates to regional cultural factors as enabler mechanisms for more open forms of innovation, encouraging cooperation and creativity. Agreeing with Apenteng et al. [98], cultures that promote innovation tend to generate new ideas, support their implementation, tolerate failure, and emphasize the importance of regional differences within a country.
This contextual dependency is further evidenced by different studies showing that regional differences are often ignored, as Rosa et al. [99] suggest. Barreto et al. [100] and Mewes et al. [101] added to this, finding that different cities within a country using the same innovation system mechanisms end up providing different innovation outcomes, as well as different impacts of those outcomes. Along this line, Larkin et al. [90] argued that the regional context matters, as it determines nexus innovations and their upscaling. Reinforcing this logic, Martiarena and Temudo [102] state that the diversity of things and the resources of a region influence the population’s perceptions of opportunities and its disposition toward engaging in innovation development.
Similarly, Saeedikiya et al. [103] showed that the regional environment (MENA vs. Nordic) influences entrepreneurial growth aspirations, while institutional constraints hinder them. London and Sheikh [104] also reinforce these arguments by recognizing innovation as a process where many different factors, agents, and interactions come into play and, therefore, not a job for a single entity to do. This strongly resonates with Nelson’s [2] comparative analysis discussing how the existing conditions of a given place help or hinder a business’s ability to innovate and develop new technologies and products. Nelson also illustrates how successful developments are shaped by the conditions surrounding such businesses.
Following Bertalanffy [49], an IS model that incorporates more specific agents and relationships is not necessarily better but rather more accurate in reflecting the complexity of real-world interactions and mechanisms. Thus, the number of agents considered by a model, although a relevant variable, is not a determinant for a system’s robust conceptualization. The results for horizontal density and diversity also show that IS models are better suited for open innovation practices: IS models with higher horizontal density and diversity are more open and tend to have more specialized knowledge as their institutions exchange knowledge.
In addition, Shannon’s entropy was used to quantify systemic diversity, which evaluates the system’s adaptive resilience. A higher entropy value suggests higher resilience, meaning that the system has a higher capacity to reorganize itself and innovate when facing external shocks.
Over time, some agents are disaggregated into independent agents with their own interactions, increasing systemic complexity and intertwined dynamics. Agents frequently pursue multiple objectives simultaneously while still working toward shared goals. This pattern is consistent with recognizing IS models as complex adaptive systems [45,105], in which emergent properties arise from localized interactions and feedback loops rather than centralized design.
Consequently, a government’s role must shift from authority to that of coordinator and facilitator, as its function is to increase communication and cooperation between the different agents living within its geopolitical scope [104], rather than dictating roles and actions.
We also analyzed the explanatory potential of the IS models, which allowed us to define the minimum set of dimensions needed to design a selection framework for specific contextual conditions, a tool that operationalizes all the analyses and perspectives used.
As this framework is to be used under almost any scenario, the dimensions considered to make a first selection are the minimum required to make an informed choice; nonetheless, this tool can be improved by refining the selection criteria and adding more variables, such as specific industry or technology.
5.2. Using the Selection Tool as a Context-Sensitive Decision Aid
Navarro [14] argues that IS models were developed as explanatory tools used to understand how advanced economies achieve their innovation performance. Despite this original purpose, these models have often been used as planning and design templates, with mixed results across contexts and time. Our research reveals that decision-makers often select IS models that do not align with contextual scope, data accessibility, or institutional conditions, for example, in cases such as Mexico [5,6], Chile [7,8], Peru [9], and South Africa [10,11], where the decision-makers chose to use regional IS models for nationwide projects or tried to combine incompatible IS model premises (static systems with adaptive systems).
Our findings were obtained using simulated scenarios and have been accurate and consistent. This indicates that the selection process works well. For researchers and policymakers, our selection method will make this process more efficient and effective, and it will prevent them from selecting inadequate IS models for their specific needs and contexts.
Regarding implementation, our results align with Lin et al. [106], who show that a well-developed innovation system and culture promote incentives and conditions necessary for the emergence of innovation. Therefore, governments and researchers should carefully consider the strengths and limitations of different IS models before making a selection, and if they choose to use a certain model outside of its originally conceptualized scope, they should make the necessary adaptations for their specific context.
Building on the context discussion and taking Nelson’s [2] premise—deepened by Pyka et al. [47] in their discussion of the qualities of isomorphism within innovation systems—mimetic behavior in ISs can lead to the super-specialization of the system, where all major innovations and technology development must follow the theme of the region, and new ventures need to align with it for legitimization. This creates a primary industry as the core and a secondary industry around it, mainly dealing with complementary products and services for the former.
The interesting behavior of ISs can be used to develop highly specialized innovation systems, which can be created from scratch or reinforced if the region already has some resources deployed or active projects. Malagón and Huerta [107] explore how this dimension can be exploited in the fast-growing AI industry where, by considering the context, decision-makers can champion AI-related projects and leverage them to build an entire innovation system around it, whether focusing on software or hardware solutions.
This selection heuristic provides the bare minimum variables to be considered, and it can be built up to include other variables as the user sees fit. To design an AI-focused innovation system, the user can include a preselection step given their context if a local, regional, or national scope is optimal. In this preselection phase, the user filters the geopolitical scope against the needed and available resources, so if the resource requirements are not met locally, it goes regional; if gaps still exist regionally, it can go national; if it still does not meet the requirements at a national level, the user should then choose a national scope. As Lundvall [93] and Nelson [2] show, a national scope facilitates the acquisition of missing resources, as the national level represents the highest regulatory and resource-pooling entity within a country.
Brynjolfsson and McAfee [108] show that AI development accelerates through exponential growth patterns, but it requires the recombination of knowledge from other fields; thus, if we consider this, we would have to look for an IS model with high entropy (diversity) and density (openness) while maintaining the preselected geopolitical scope. The resulting model choice aligns the system’s structural capacity with AI’s specific requirements for cross-disciplinary collaboration and adaptive resilience within the user’s particular environment.
5.3. Limitations and Future Research
This study has some limitations. The multilevel graphs and corresponding indicators are limited to the extent and depth of the literature reviewed. We focused on the most widely used geopolitically bound innovation system perspectives, thus excluding perspectives such as the Technological Innovation System (TIS) and Global Innovation System (GIS). Our analysis is limited to the structural design of innovation system models and focuses on what the literature considers the most developed version of each. This version can last from a few days to several years, depending on the interactions, decisions, and environment. Consequently, our multilevel graphs can be thought of as a “snapshot” of the system at a specific moment, allowing researchers to treat this snapshot as a static system. As such, our model does not analyze system dynamics or the time-bounded evolution of the relevant systems. Finally, the proposed heuristic selection tool is limited by the minimum dimensions defined by the explanatory potential indicators and the structural analyses, and it is yet to be empirically validated.
These limitations point to several promising avenues for future research. One prominent direction is to deepen the analysis of the relationships between agents and levels by characterizing their nature, per Bhattacharya et al. [91]. Another is to design and test new IS models that explicitly address the identified opportunities. A third avenue of research involves analysis at the individual level, which may enrich the explanatory potential by helping us understand more specific dynamics that enable the emergence of innovation and entrepreneurship along the lines of scholars such as Apenteng et al. [98] and Jin and Yu [109]. For example, we might use FSQCA like Li et al. [39] or Pereira and Pereira [35]. Finally, similar to London and Sheikh [104], combining system dynamics with agent-based modeling could provide simulation approaches capable of validating and refining the effectiveness of these models under specific conditions.
Finally, future research should evaluate the selection heuristic in real-world scenarios and document its utility or lack thereof. This could prove useful in advancing the field of innovation systems.
6. Conclusions
In conclusion, this paper provides a new perspective on innovation systems by linking their explanatory potential to a context-sensitive selection framework. Through a structural analysis comprising multilevel graphs and derived indicators, we identified a minimum set of dimensions that can guide the selection of IS models under specific contextual settings, highlighting areas for improvement in planning, project implementation, and public policy design.
Furthermore, structural analysis showed that the best components for assessing explanatory potential are the system’s interactions and actors, including their number, direction, interconnectedness across levels, and diversity, as well as the nature of their interactions. The number of agents of each model is relevant; however, it does not appear to be the determining factor in a model’s explanatory potential. Instead, network density is a more meaningful measure of each model’s conceptual robustness. We also found that only two levels, government and institutional, are operational across models, overlooking the human component. This ultimately contextualizes the emergence of innovation, technology, and entrepreneurship in IS models.
Answering our research questions, under what contextual conditions do IS models contribute distinctive explanatory value? How can these models be selected and used for analysis and policy design? The key contextual dimensions are geopolitical scope; information availability; and the relative priority given to vertical coordination, horizontal networking, and systemic robustness and complexity. The proposed framework showed that there is no universally superior IS model; instead, models differ in their suitability for specific contexts and can be combined to address multilevel and multi-actor challenges.
For governments, planners, strategists, and decision-makers, our framework serves as a practical guide for selecting more appropriate IS lenses and designing interventions that are better aligned with their objectives and constraints. Despite the inherent limitations discussed above, the minimal viable selection tool proposed here provided a structured starting point for improving the alignment between IS theory and practice in the governance of innovation and entrepreneurship development.
Author Contributions
H.M. contributed to conceptualization, investigation, data curation, formal analysis, and writing—original draft. A.Á.R. contributed to conceptualization, methodology, supervision, validation, and writing—review and editing. A.H.B. contributed to conceptualization, formal analysis, investigation, validation, and writing—review and editing. All authors have read and agreed to the published version of the manuscript.
Funding
This research was partially funded by Mexico’s Secihti (former Conacyt) under the grant “Beca Nacional de Posgrados” CVU1240068.
Institutional Review Board Statement
Not applicable.
Informed Consent Statement
Not applicable.
Data Availability Statement
The main information source for the development of this research was bibliographical; this is reflected in Table 2 and the References Section.
Conflicts of Interest
The authors declare no conflicts of interest.
Abbreviations
The following abbreviations are used in this manuscript:
| IS | Innovation system |
| CG | Central government |
| RG | Regional government |
| LG | Local government |
| NIS | National innovation system |
| RIS | Regional innovation system |
| TH | Triple helix |
| QIH | Quintuple helix |
| IE | Innovation ecosystem |
| EE | Entrepreneurship ecosystem |
| NIE | National innovation ecosystem |
| RIE | Regional innovation ecosystem |
| TIS | Technological innovation system |
| GIS | Global innovation system |
| FSQCA | Fuzzy-Set Qualitative Comparative Analysis |
| EP | Explanatory potential |
Note
| 1 | For the scope and purposes of this comparative analysis, the QH is represented as an integrated variable of the quintuple helix model, as the latter includes the fourth helix (society), alongside the fifth (sustainability). |
References
- Freeman, C.; Lundvall, B.A. Small Countries Facing the Technological Revolution, 1st ed.; Pinter Pub Ltd.: London, UK, 1988. [Google Scholar]
- Nelson, R.R. National Innovation Systems: A Comparative Analysis; Oxford University Press: Oxford, UK; New York, NY, USA, 1993. [Google Scholar]
- Lundvall, B. Why study national systems and national styles of innovation? Technol. Anal. Strateg. Manag. 1998, 10, 403–422. [Google Scholar] [CrossRef] [Scilit]
- Schumpeter, J.A. Capitalism, Socialism & Democracy; Harper & Row: New York, NY, USA, 1942. [Google Scholar]
- CONAHCYT. Informe Nacional Sobre el Estado General que Guardan las Humanidades, las Ciencias, las Tecnologías y la Innovación en México. Gobierno de México. 2022. Available online: https://sisnai.secihti.mx/wp-content/uploads/Normatividad/Informes%20Conahcyt/01%20Informe%20general/Informe%20nacional%202022/INAHCTI%202022.pdf (accessed on 14 September 2025).
- Gobierno de México. Plan de Desarrollo Nacional 2024–2030. Available online: https://planeandojuntos.gob.mx/ (accessed on 9 January 2025).
- Consejo Asesor Ministerial. Una Propuesta de Crecimiento del Ecosistema de Ciencia, Tecnología, Conocimiento e Innovación en Chile. 2022. Available online: https://minciencia.gob.cl/uploads/filer_public/6b/af/6baf786c-44b6-4120-90a2-563bb3e3d53e/consejo_asesor_ministerial_dt01-crecimiento_del_sistema_ctci.pdf (accessed on 22 September 2025).
- Menéndez, M.J.; Villarroel, K. Análisis del Ecosistema CTCI en Chile en un Contexto de Grandes Transformaciones. 2024. Available online: https://docs.consejoctci.cl/assets/documentos/analisis-panorama-ecosistema-ctci-vf.pdf (accessed on 24 August 2025).
- Presidencia del Consejo de Ministros. Informe de Evaluación del Plan Estratégico Sectorial Multianual 2016–2020 del Sector Presidencia del Consejo de Ministros Correspondiente al año 2019. 2019. Available online: https://www.gob.pe/institucion/rcc/informes-publicaciones/4873231-evaluacion-del-pesem-2016-2020-ano-de-evaluacion-2019 (accessed on 13 November 2025).
- Department of Science and Innovation. Department of Science and Innovation 2023/24 Annual Report & Annual Performance Plan 2024/25; with Deputy Minister Strategic Plan. Available online: https://pmg.org.za/committee-meeting/39751/ (accessed on 21 September 2025).
- National Advisory Council on Innovation. 2024 South Africa Science Technology and Innovation Indicators Report. Department: Science, Technology and Innovation Republic of South Africa. 2024. Available online: https://nstiip.naci.org.za/media/attachments/2025/06/23/2024-south-africa-science-technology-and-innovation-indicators-report.pdf (accessed on 23 September 2025).
- List, F. The National System of Political Economy; Longmans, Green and Co.: London, UK, 1909; Available online: https://oll.libertyfund.org/titles/lloyd-the-national-system-of-political-economy (accessed on 3 June 2024).
- Godin, B. National Innovation System: The System Approach in Historical Perspective. Sci. Technol. Hum. Values 2009, 34, 476–501. [Google Scholar] [CrossRef] [Scilit]
- Navarro, M. Los Sistemas Nacionales de Innovación: Una Revisión de la Literatura; Instituto de Análisis Industrial y Financiero: Madrid, Spain, 2001. [Google Scholar]
- Porto-Gomez, I.; Zabala-Iturriagagoitia, J.M.; Leydesdorff, L. Innovation systems in México: A matter of missing synergies. Technol. Forecast. Soc. Change 2019, 148, 119721. [Google Scholar] [CrossRef] [Scilit]
- Cooke, P. Regional innovation systems: Competitive regulation in the new Europe. Geoforum 1992, 23, 365–382. [Google Scholar] [CrossRef] [Scilit]
- Etzkowitz, H.; Leydesdorff, L. The Triple Helix—University-Industry-Government Relations: A Laboratory for Knowledge Based Economic Development. EASST Rev. 1995, 14, 14–19. [Google Scholar]
- Baber, Z. Globalization and Scientific Research: The Emerging Triple Helix of State-Industry-University Relations in Japan and Singapore. Bull. Sci. Technol. Soc. 2001, 21, 401–408. [Google Scholar] [CrossRef] [Scilit]
- Carayannis, E.G.; Campbell, D.F.J. Triple helix, Quadruple helix and Quintuple helix and how do Knowledge, Innovation and the Environment relate to Each other? A proposed framework for a trans-disciplinary analysis of sustainable development and social ecology. Int. J. Soc. Ecol. Sustain. Dev. 2010, 1, 41–69. [Google Scholar] [CrossRef] [Scilit]
- Ivanova, I. Quadruple Helix Systems and Symmetry: A Step Towards Helix Innovation System Classification. J. Knowl. Econ. 2014, 5, 357–369. [Google Scholar] [CrossRef] [Scilit]
- Carayannis, E.G.; Barth, T.D.; Campbell, D.F. The Quintuple Helix innovation model: Global warming as a challenge and driver for innovation. J. Innov. Entrep. 2012, 1, 2. [Google Scholar] [CrossRef] [Scilit]
- Maysami, A.M.; Elyasi, G.M. Designing the framework of technological entrepreneurship ecosystem: A grounded theory approach in the context of Iran. Technol. Soc. 2020, 63, 101372. [Google Scholar] [CrossRef] [Scilit]
- Pushpananthan, G.; Elmquist, M. Joining forces to create value: The emergence of an innovation ecosystem. Technovation 2022, 115, 102453. [Google Scholar] [CrossRef] [Scilit]
- Radziwon, A.; Bogers, M.; Bilberg, A. Creating and capturing value in a regional innovation ecosystem: A study of how manufacturing SMEs develop collaborative solutions. Int. J. Technol. Manag. 2017, 75, 73. [Google Scholar] [CrossRef] [Scilit]
- Adner, R. Match your innovation strategy to your innovation ecosystem. Harv. Bus. Rev. 2006, 84, 98–107. [Google Scholar]
- Isenberg, D.J. How to Start an Entrepreneurial Revolution. Harv. Bus. Rev. 2010, 88, 40–50. [Google Scholar]
- Harris, J.L. Bridging the gap between ‘Fin’ and ‘Tech’: The role of accelerator networks in emerging FinTech entrepreneurial ecosystems. Geoforum 2021, 122, 174–182. [Google Scholar] [CrossRef] [Scilit]
- Das, R. Cultural determinants of national innovativeness: A 56 country Bayesian analysis. Technol. Anal. Strateg. Manag. 2021, 34, 933–945. [Google Scholar] [CrossRef] [Scilit]
- Huang, X.; Ma, L.; Li, R.; Liu, Z. Determinants of innovation ecosystem in underdeveloped areas—Take Nanning high-tech zone in Western China as an example. J. Open Innov. Technol. Mark. Complex. 2020, 6, 135. [Google Scholar] [CrossRef] [Scilit]
- Frenkel, A.; Maital, S. Mapping National Innovation Ecosystems; Foundations for Policy Consensus: London, UK, 2014. [Google Scholar] [CrossRef] [Scilit]
- Jackson, D.J. What Is an Innovation Ecosystem? Available online: https://erc-assoc.org/sites/default/files/topics/policy_studies/DJackson_Innovation%20Ecosystem_03-15-11.pdf (accessed on 18 September 2022).
- Ranga, M. Building university-industry-government alliances for innovative regional ecosystems: Research and policy trends. In Proceedings of the Connecting Colombia: Development From Innovation’ International Conference, Bogota, Columbia, 7–9 September 2011. [Google Scholar]
- Russell, M.G.; Smorodinskaya, N.V. Leveraging complexity for ecosystemic innovation. Technol. Forecast. Soc. Change 2018, 136, 114–131. [Google Scholar] [CrossRef] [Scilit]
- Howoldt, D. Characterising innovation policy mixes in innovation systems. Res. Policy 2023, 53, 104902. [Google Scholar] [CrossRef] [Scilit]
- Duarte, M.P.; Carvalho, F.M.P.d.O. Is Globalisation sufficient for Innovation? A National Systems of Innovation approach in distinct levels of Competitiveness. Innov. Eur. J. Soc. Sci. Res. 2024, 38, 606–630. [Google Scholar] [CrossRef] [Scilit]
- Srholec, M. A multilevel analysis of innovation in developing countries. Ind. Corp. Change 2011, 20, 1539–1569. [Google Scholar] [CrossRef] [Scilit]
- Lu, Z. The triple helix model in the heterogeneous transitional Chinese economy: A comparative analysis of Zhejiang and Yunnan provinces. In Private Sector Development in an Emerging World: Inclusive Policies and Strategies for the Formal and Informal Economy; De Gruyter: Berlin, Germany, 2024; pp. 231–257. [Google Scholar] [CrossRef] [Scilit]
- Liu, X.; White, S. Comparing innovation systems: A framework and application to China’s transitional context. Res. Policy 2001, 30, 1091–1114. [Google Scholar] [CrossRef] [Scilit]
- Li, M.; Chen, H.; Li, J.; Liu, X. How to Improve the Synergetic Development Capabilities of the Innovation Ecosystems of High-Tech Industries in China: An fsQCA Analysis Based on the TOE Framework. Sustainability 2023, 15, 12579. [Google Scholar] [CrossRef] [Scilit]
- Chang, Y.-C.; Chen, M.-H. Comparing approaches to systems of innovation: The knowledge perspective. Technol. Soc. 2004, 26, 17–37. [Google Scholar] [CrossRef] [Scilit]
- Liu, Y.; Liu, Z.; Xu, K. Imitative innovation or independent innovation strategic choice of emerging economies in non-cooperative innovation competition. J. Ind. Manag. Optim. 2023, 19, 1893–1910. [Google Scholar] [CrossRef] [Scilit]
- Botta, E.; Mccormick, C.; Eis, J. A Guide to Innovation System Analysis for Green Growth; Global Green Growth Institute: Seoul, Republic of Korea, 2015; Available online: https://www.eco-business.com/research/a-guide-to-innovation-system-analysis-for-green-growth/ (accessed on 9 April 2024).
- Afzal, M.N.I.; Mansur, D.D.K.B.H.M.; Siddiqui, S.; Gope, J. A panel investigation of the triple helix (TH), quadruple helix (QH) relationship in ASEAN-5 economies. J. Innov. Econ. Manag. 2018, 27, 97–122. [Google Scholar] [CrossRef] [Scilit]
- Markard, J.; Truffer, B. Technological innovation systems and the multi-level perspective: Towards an integrated framework. Res. Policy 2008, 37, 596–615. [Google Scholar] [CrossRef] [Scilit]
- Ponsiglione, C.; Quinto, I.; Zollo, G. Regional innovation systems as complex adaptive systems: The case of lagging European regions. Sustainability 2018, 10, 2862. [Google Scholar] [CrossRef] [Scilit]
- Katz, J.S. What Is a Complex Innovation System? PLoS ONE 2016, 11, e0156150. [Google Scholar] [CrossRef] [Scilit]
- Pyka, A.; Gilbert, N.G.; Ahrweiler, P. Simulating Innovation Networks. 2002. Available online: https://www.researchgate.net/publication/200134754 (accessed on 12 February 2022).
- Leydesdorff, L.; Ivanova, I. “Open innovation” and “triple helix” models of innovation: Can synergy in innovation systems be measured? J. Open Innov. Technol. Mark. Complex. 2016, 2, 11. [Google Scholar] [CrossRef] [Scilit]
- Von Bertalanffy, L. Teoría General de los Sistemas, 11th ed.; Fondo de Cultura Económica: Mexico City, Mexico, 1968. [Google Scholar]
- Aguirre-Bastos, C.; Weber, M.K. Foresight for shaping national innovation systems in developing economies. Technol. Forecast. Soc. Change 2018, 128, 186–196. [Google Scholar] [CrossRef] [Scilit]
- Cortés, J.D. Research on Innovation in China and Latin America: Bibliometric Insights in the Field of Business, Management, and Decision Sciences. Lat. Am. Bus. Rev. 2022, 23, 141–166. [Google Scholar] [CrossRef] [Scilit]
- Erzurumlu, S.S.; Erzurumlu, Y.O.; Yoon, Y. National innovation systems and dynamic impact of institutional structures on national innovation capability: A configurational approach with the OKID method. Technovation 2022, 114, 102552. [Google Scholar] [CrossRef] [Scilit]
- Intarakumnerd, P.; Goto, A. Role of public research institutes in national innovation systems in industrialized countries: The cases of Fraunhofer, NIST, CSIRO, AIST, and ITRI. Res. Policy 2018, 47, 1309–1320. [Google Scholar] [CrossRef] [Scilit]
- Khan, M.S. Absorptive capacities approaches for investigating national innovation systems in low and middle income countries. Int. J. Innov. Stud. 2022, 6, 183–195. [Google Scholar] [CrossRef] [Scilit]
- Kwon, S.; Motohashi, K. How institutional arrangements in the National Innovation System affect industrial competitiveness: A study of Japan and the U.S. with multiagent simulation. Technol. Forecast. Soc. Change 2017, 115, 221–235. [Google Scholar] [CrossRef] [Scilit]
- Lee, K.; Lee, J.; Lee, J. Variety of national innovation systems (NIS) and alternative pathways to growth beyond the middle-income stage: Balanced, imbalanced, catching-up, and trapped NIS. World Dev. 2021, 144, 105472. [Google Scholar] [CrossRef] [Scilit]
- Sun, Y.; Cao, C. The evolving relations between government agencies of innovation policymaking in emerging economies: A policy network approach and its application to the Chinese case. Res. Policy 2018, 47, 592–605. [Google Scholar] [CrossRef] [Scilit]
- Hasche, N.; Höglund, L.; Linton, G. Quadruple helix as a network of relationships: Creating value within a Swedish regional innovation system. J. Small Bus. Entrep. 2019, 32, 523–544. [Google Scholar] [CrossRef] [Scilit]
- Malik, A.; Sharma, P.; Pereira, V.; Temouri, Y. From regional innovation systems to global innovation hubs: Evidence of a Quadruple Helix from an emerging economy. J. Bus. Res. 2021, 128, 587–598. [Google Scholar] [CrossRef] [Scilit]
- Maruccia, Y.; Solazzo, G.; Del Vecchio, P.; Passiante, G. Evidence from Network Analysis application to Innovation Systems and Quintuple Helix. Technol. Forecast. Soc. Change 2020, 161, 120306. [Google Scholar] [CrossRef] [Scilit]
- Prokop, V.; Hajek, P.; Stejskal, J. Configuration Paths to Efficient National Innovation Ecosystems. Technol. Forecast. Soc. Change 2021, 168, 120787. [Google Scholar] [CrossRef] [Scilit]
- Rong, K.; Lin, Y.; Yu, J.; Zhang, Y.; Radziwon, A. Exploring regional innovation ecosystems: An empirical study in China. Ind. Innov. 2020, 28, 545–569. [Google Scholar] [CrossRef] [Scilit]
- Smorodinskaya, N.V.; Katukov, D.D. When and why regional clusters become basic building blocks of modern economy. Balt. Reg. 2019, 11, 61–91. [Google Scholar] [CrossRef] [Scilit]
- Viale, R.; Pozzali, A. Complex Adaptive Systems and the Evolutionary Triple Helix. Crit. Sociol. 2010, 36, 575–594. [Google Scholar] [CrossRef] [Scilit]
- Wei, Y. Regional governments and opportunity entrepreneurship in underdeveloped institutional environments: An entrepreneurial ecosystem perspective. Res. Policy 2022, 51, 104380. [Google Scholar] [CrossRef] [Scilit]
- Guerrero, M.; Urbano, D. The impact of Triple Helix agents on entrepreneurial innovations’ performance: An inside look at enterprises located in an emerging economy. Technol. Forecast. Soc. Change 2017, 119, 294–309. [Google Scholar] [CrossRef] [Scilit]
- Provance, M.; Donnelly, R.G.; Carayannis, E.G. Institutional influences on business model choice by new ventures in the microgenerated energy industry. Energy Policy 2011, 39, 5630–5637. [Google Scholar] [CrossRef] [Scilit]
- Arenas, J.J.; Gonzalez, D. Collaboration for R&D Projects between the Industry and External Agents: Evidence from Manufacturing Companies in Peru. Lat. Am. Bus. Rev. 2019, 20, 37–60. [Google Scholar] [CrossRef] [Scilit]
- Arthur, W.B. The structure of invention. Res. Policy 2007, 36, 274–287. [Google Scholar] [CrossRef] [Scilit]
- Arthur, W.B.; Polak, W. The evolution of technology within a simple computer model. Complexity 2006, 11, 23–31. [Google Scholar] [CrossRef] [Scilit]
- De Silva, M.; Gokhberg, L.; Meissner, D.; Russo, M. Addressing societal challenges through the simultaneous generation of social and business values: A conceptual framework for science-based co-creation. Technovation 2021, 104, 102268. [Google Scholar] [CrossRef] [Scilit]
- Filho, M.F.; Heerdt, M.L. Innovation emergence: Public policies versus actors’ free interaction. Systems 2018, 6, 13. [Google Scholar] [CrossRef] [Scilit]
- Granstrand, O.; Holgersson, M. Innovation ecosystems: A conceptual review and a new definition. Technovation 2020, 90–91, 102098. [Google Scholar] [CrossRef] [Scilit]
- Guindalini, C.; Verreynne, M.-L.; Kastelle, T. Taking scientific inventions to market: Mapping the academic entrepreneurship ecosystem. Technol. Forecast. Soc. Change 2021, 173, 121144. [Google Scholar] [CrossRef] [Scilit]
- Khorsheed, M.S. Learning from Global Pacesetters to Build the Country Innovation Ecosystem. J. Knowl. Econ. 2016, 8, 177–196. [Google Scholar] [CrossRef] [Scilit]
- Könnölä, T.; Eloranta, V.; Turunen, T.; Salo, A. Transformative governance of innovation ecosystems. Technol. Forecast. Soc. Change 2021, 173, 121106. [Google Scholar] [CrossRef] [Scilit]
- Rogers, E.M. Diffusion of Innovations; Collier Macmillan Publishers: New York, NY, USA, 1983. [Google Scholar]
- Daneri, D.R.; Trencher, G.; Petersen, J. Students as change agents in a town-wide sustainability transformation: The Oberlin Project at Oberlin College. Curr. Opin. Environ. Sustain. 2015, 16, 14–21. [Google Scholar] [CrossRef] [Scilit]
- Sellitto, M.A.; Pereira, G.S.; Marques, R.; Lacerda, D.P. Systemic Understanding of Coopetitive Behaviour in a Latin American Technological Park. Syst. Pract. Action Res. 2018, 31, 479–494. [Google Scholar] [CrossRef] [Scilit]
- Tani, M.; Papaluca, O.; Sasso, P. The System Thinking Perspective in the Open-Innovation research: A systematic review. J. Open Innov. Technol. Mark. Complex. 2018, 4, 38. [Google Scholar] [CrossRef] [Scilit]
- Wei, T.; Zhu, Z.; Lei, N.; Cheek, R. Simulation of complex regional technology innovation ecosystem under resource constraints. Int. J. Simul. Process. Model. 2016, 11, 390. [Google Scholar] [CrossRef] [Scilit]
- Yilmaz, L. Innovation Systems are Self-organizing Complex Adaptive Systems. In AAAI Spring Symposium: Creative Intelligent Systems; AAAI: Washington DC, USA, 2008; Available online: https://www.researchgate.net/publication/221250774_Innovation_Systems_Are_Self-organizing_Complex_Adaptive_Systems (accessed on 9 March 2023).
- Farinha, L.; Lopes, J.; Bagchi-Sen, S.; Sebastião, J.R.; Oliveira, J. Entrepreneurial dynamics and government policies to boost entrepreneurship performance. Socio-Econ. Plan. Sci. 2020, 72, 100950. [Google Scholar] [CrossRef] [Scilit]
- Han, J.; Ruan, Y.; Wang, Y.; Zhou, H. Toward a complex adaptive system: The case of the Zhongguancun entrepreneurship ecosystem. J. Bus. Res. 2021, 128, 537–550. [Google Scholar] [CrossRef] [Scilit]
- Isenberg, D.J. Applying the Ecosystem Metaphor to Entrepreneurship: Uses and abuses. Antitrust Bull. 2016, 61, 564–573. [Google Scholar] [CrossRef] [Scilit]
- Kriz, A.; Rumyantseva, M.; Welch, C. How science-based start-ups and their entrepreneurial ecosystems co-evolve: A process study. Ind. Mark. Manag. 2022, 105, 439–452. [Google Scholar] [CrossRef] [Scilit]
- Kuzior, A.; Pidorycheva, I.; Liashenko, V.; Shevtsova, H.; Shvets, N. Assessment of National Innovation Ecosystems of the EU Countries and Ukraine in the Interests of Their Sustainable Development. Sustainability 2022, 14, 8487. [Google Scholar] [CrossRef] [Scilit]
- Suseno, Y.; Standing, C. The Systems Perspective of National Innovation Ecosystems. Syst. Res. Behav. Sci. 2018, 35, 282–307. [Google Scholar] [CrossRef] [Scilit]
- Kadyrova, A. Exploring Structures of Urban Social Innovation Ecosystems: Cases of Manchester, Utrecht, Stockholm, Sofia and Budapest. J. Soc. Entrep. 2024, 15, 77–99. [Google Scholar] [CrossRef] [Scilit]
- Larkin, A.; Hoolohan, C.; McLachlan, C. Embracing context and complexity to address environmental challenges in the water-energy-food nexus. Futures 2020, 123, 102612. [Google Scholar] [CrossRef] [Scilit]
- Bhattacharya, S.; Sinha, S.; Dey, P.; Saha, A.; Chowdhury, C.; Roy, S. Online social-network sensing models. In Computational Intelligence Applications for Text and Sentiment Data Analysis; Elsevier: Amsterdam, The Netherlands, 2023; pp. 113–140. [Google Scholar] [CrossRef] [Scilit]
- Sanchez, M.A.; Aguilar, L.; Castañón-Puga, M.; Rodríguez-Díaz, A. (Eds.) Computer Science and Engineering—Theory and Applications; Springer: Berlin/Heidelberg, Germany, 2018; Volume 143. [Google Scholar] [CrossRef] [Scilit]
- Lundvall, B.-Å.; Joseph, K.J.; Chaminade, C.; Vang, J. Handbook of Innovation Systems and Developing Countries: Building Domestic Capabilities in a Global Setting; Edward Elgar Publishing: Cheltenham, UK, 2011. [Google Scholar]
- Barrat, A.; Barthélemy, M.; Vespignani, A. Dynamical Processes on Complex Networks, 3rd ed.; Cambridge University Press: Cambridge, UK, 2010. [Google Scholar] [CrossRef] [Scilit]
- Shannon, C.E. A Mathematical Theory of Communication. Bell Syst. Tech. J. 1948, 27, 379–423. [Google Scholar] [CrossRef] [Scilit]
- Zhang, Y.; Qian, Y.; Huang, Y.; Guo, Y.; Zhang, G.; Lu, J. An entropy-based indicator system for measuring the potential of patents in technological innovation: Rejecting moderation. Scientometrics 2017, 111, 1925–1946. [Google Scholar] [CrossRef] [Scilit]
- Korber, M.; Paier, M.; Fischer, M.M. An agent-based view of the biotech innovation system. Reg. Direct. Int. Sci. J. 2009, 2, 33–55. [Google Scholar]
- Apenteng, B.A.; Boakye, K.G.; Opoku, S.T. A moderated moderation analysis of perceived adaptivity and organizational support for innovation in the relationship between role overload and emotional exhaustion. Health Care Manag. Rev. 2022, 47, 245–253. [Google Scholar] [CrossRef] [Scilit]
- Rosa, A.B.; Kimpeler, S.; Schirrmeister, E.; Warnke, P. Participatory foresight and reflexive innovation: Setting policy goals and developing strategies in a bottom-up, mission-oriented, sustainable way. Eur. J. Futur. Res. 2021, 9, 2. [Google Scholar] [CrossRef] [Scilit]
- Barreto, T.S.; Lanivich, S.E.; Cox, K.C. Temporal orientation as a robust predictor of innovation. J. Bus. Res. 2022, 138, 287–300. [Google Scholar] [CrossRef] [Scilit]
- Mewes, L.; Ebert, T.; Obschonka, M.; Rentfrow, P.J.; Potter, J.; Gosling, S.D. Psychological Openness and the Emergence of Breakthrough vs. Incremental Innovations: A Regional Perspective. Econ. Geogr. 2022, 98, 379–410. [Google Scholar] [CrossRef] [Scilit]
- Martiarena, M.L.; Temudo, M.P. Endogenous learning and innovation in African smallholder agriculture: Lessons from Guinea-Bissau. J. Agric. Educ. Ext. 2023, 30, 161–179. [Google Scholar] [CrossRef] [Scilit]
- Saeedikiya, M.; Aeeni, Z.; Temiz, S.; Kawamorita, H. Innovation Amplifies Growth Ambitions of Early-Stage Female Entrepreneurs: More in Nordics, Less in MENA Region. In The Emerald Handbook of Women and Entrepreneurship in Developing Economies; Emerald Group Publishing Ltd.: London, UK, 2021; pp. 371–390. [Google Scholar] [CrossRef] [Scilit]
- London, J.O.; Sheikh, N.J. Innovation in African-American high-tech enterprises: A multi-agent modeling and simulation approach. Entrep. Sustain. Issues 2020, 7, 3101–3121. [Google Scholar] [CrossRef] [Scilit]
- Ma, T.; Nakamori, Y. Agent-based modeling on technological innovation as an evolutionary process. Eur. J. Oper. Res. 2005, 166, 741–755. [Google Scholar] [CrossRef] [Scilit]
- Lin, J.; Fan, Y.; Xu, Z. Environmental Policy Stringency, Low-Carbon Innovation, and GVC Functional Specialization: The Moderating Roles of National Innovation Systems and Entrepreneurship. Systems 2026, 14, 183. [Google Scholar] [CrossRef] [Scilit]
- Malagón, H.; Huerta, A. Leveraging Isomorphism for Developing AI Focused Innovation Systems. In Proceedings of the 2025 AAAI Summer Symposium Series; The AAAI Press: Washington, DC, USA, 2025; p. 65. Available online: https://ojs.aaai.org/index.php/AAAI-SS/issue/view/660 (accessed on 19 May 2025).
- Brynjolfsson, E.; MCafee, A. The Second Machine Age; W.W. Norton & Company: New York, NY, USA, 2014. [Google Scholar]
- Jin, Y.; Yu, S.-C. The Moderating Effect of Cross-Cultural Psychological Adaptation on Knowledge Hiding and Employee Innovation Performance: Evidence from Multinational Corporations. Sustainability 2022, 14, 16638. [Google Scholar] [CrossRef] [Scilit]
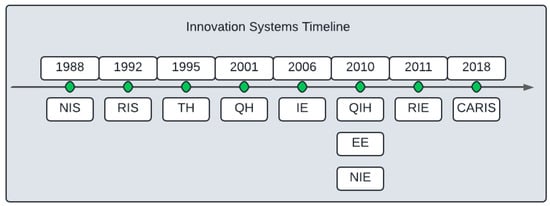
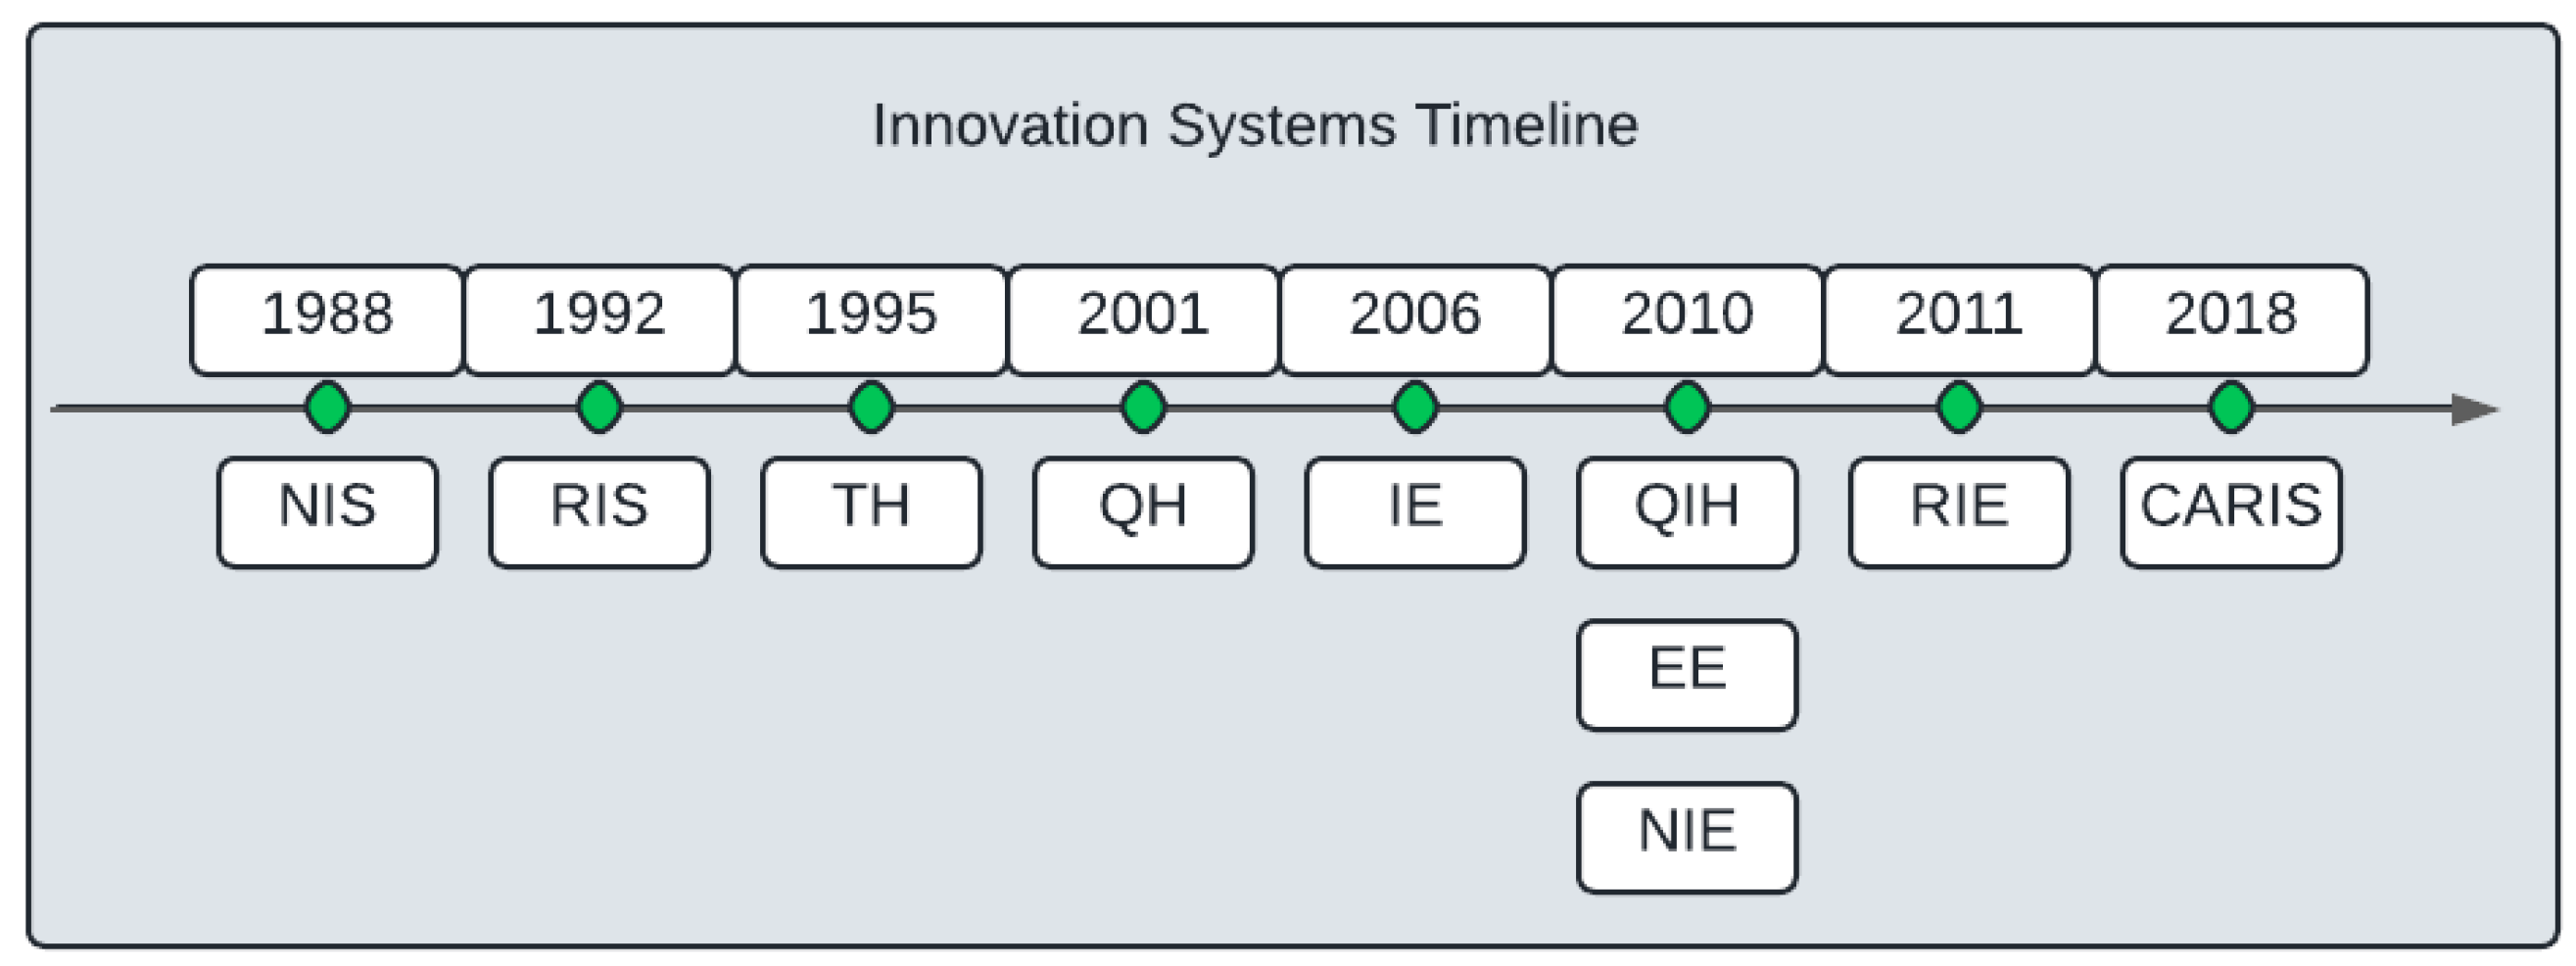
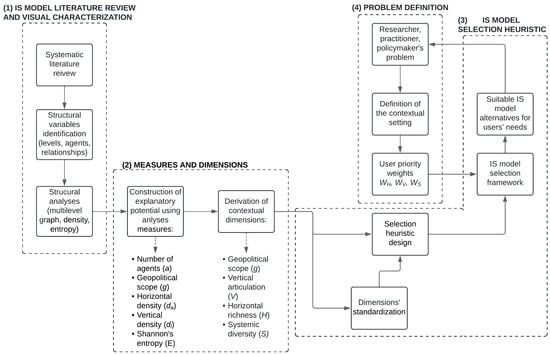
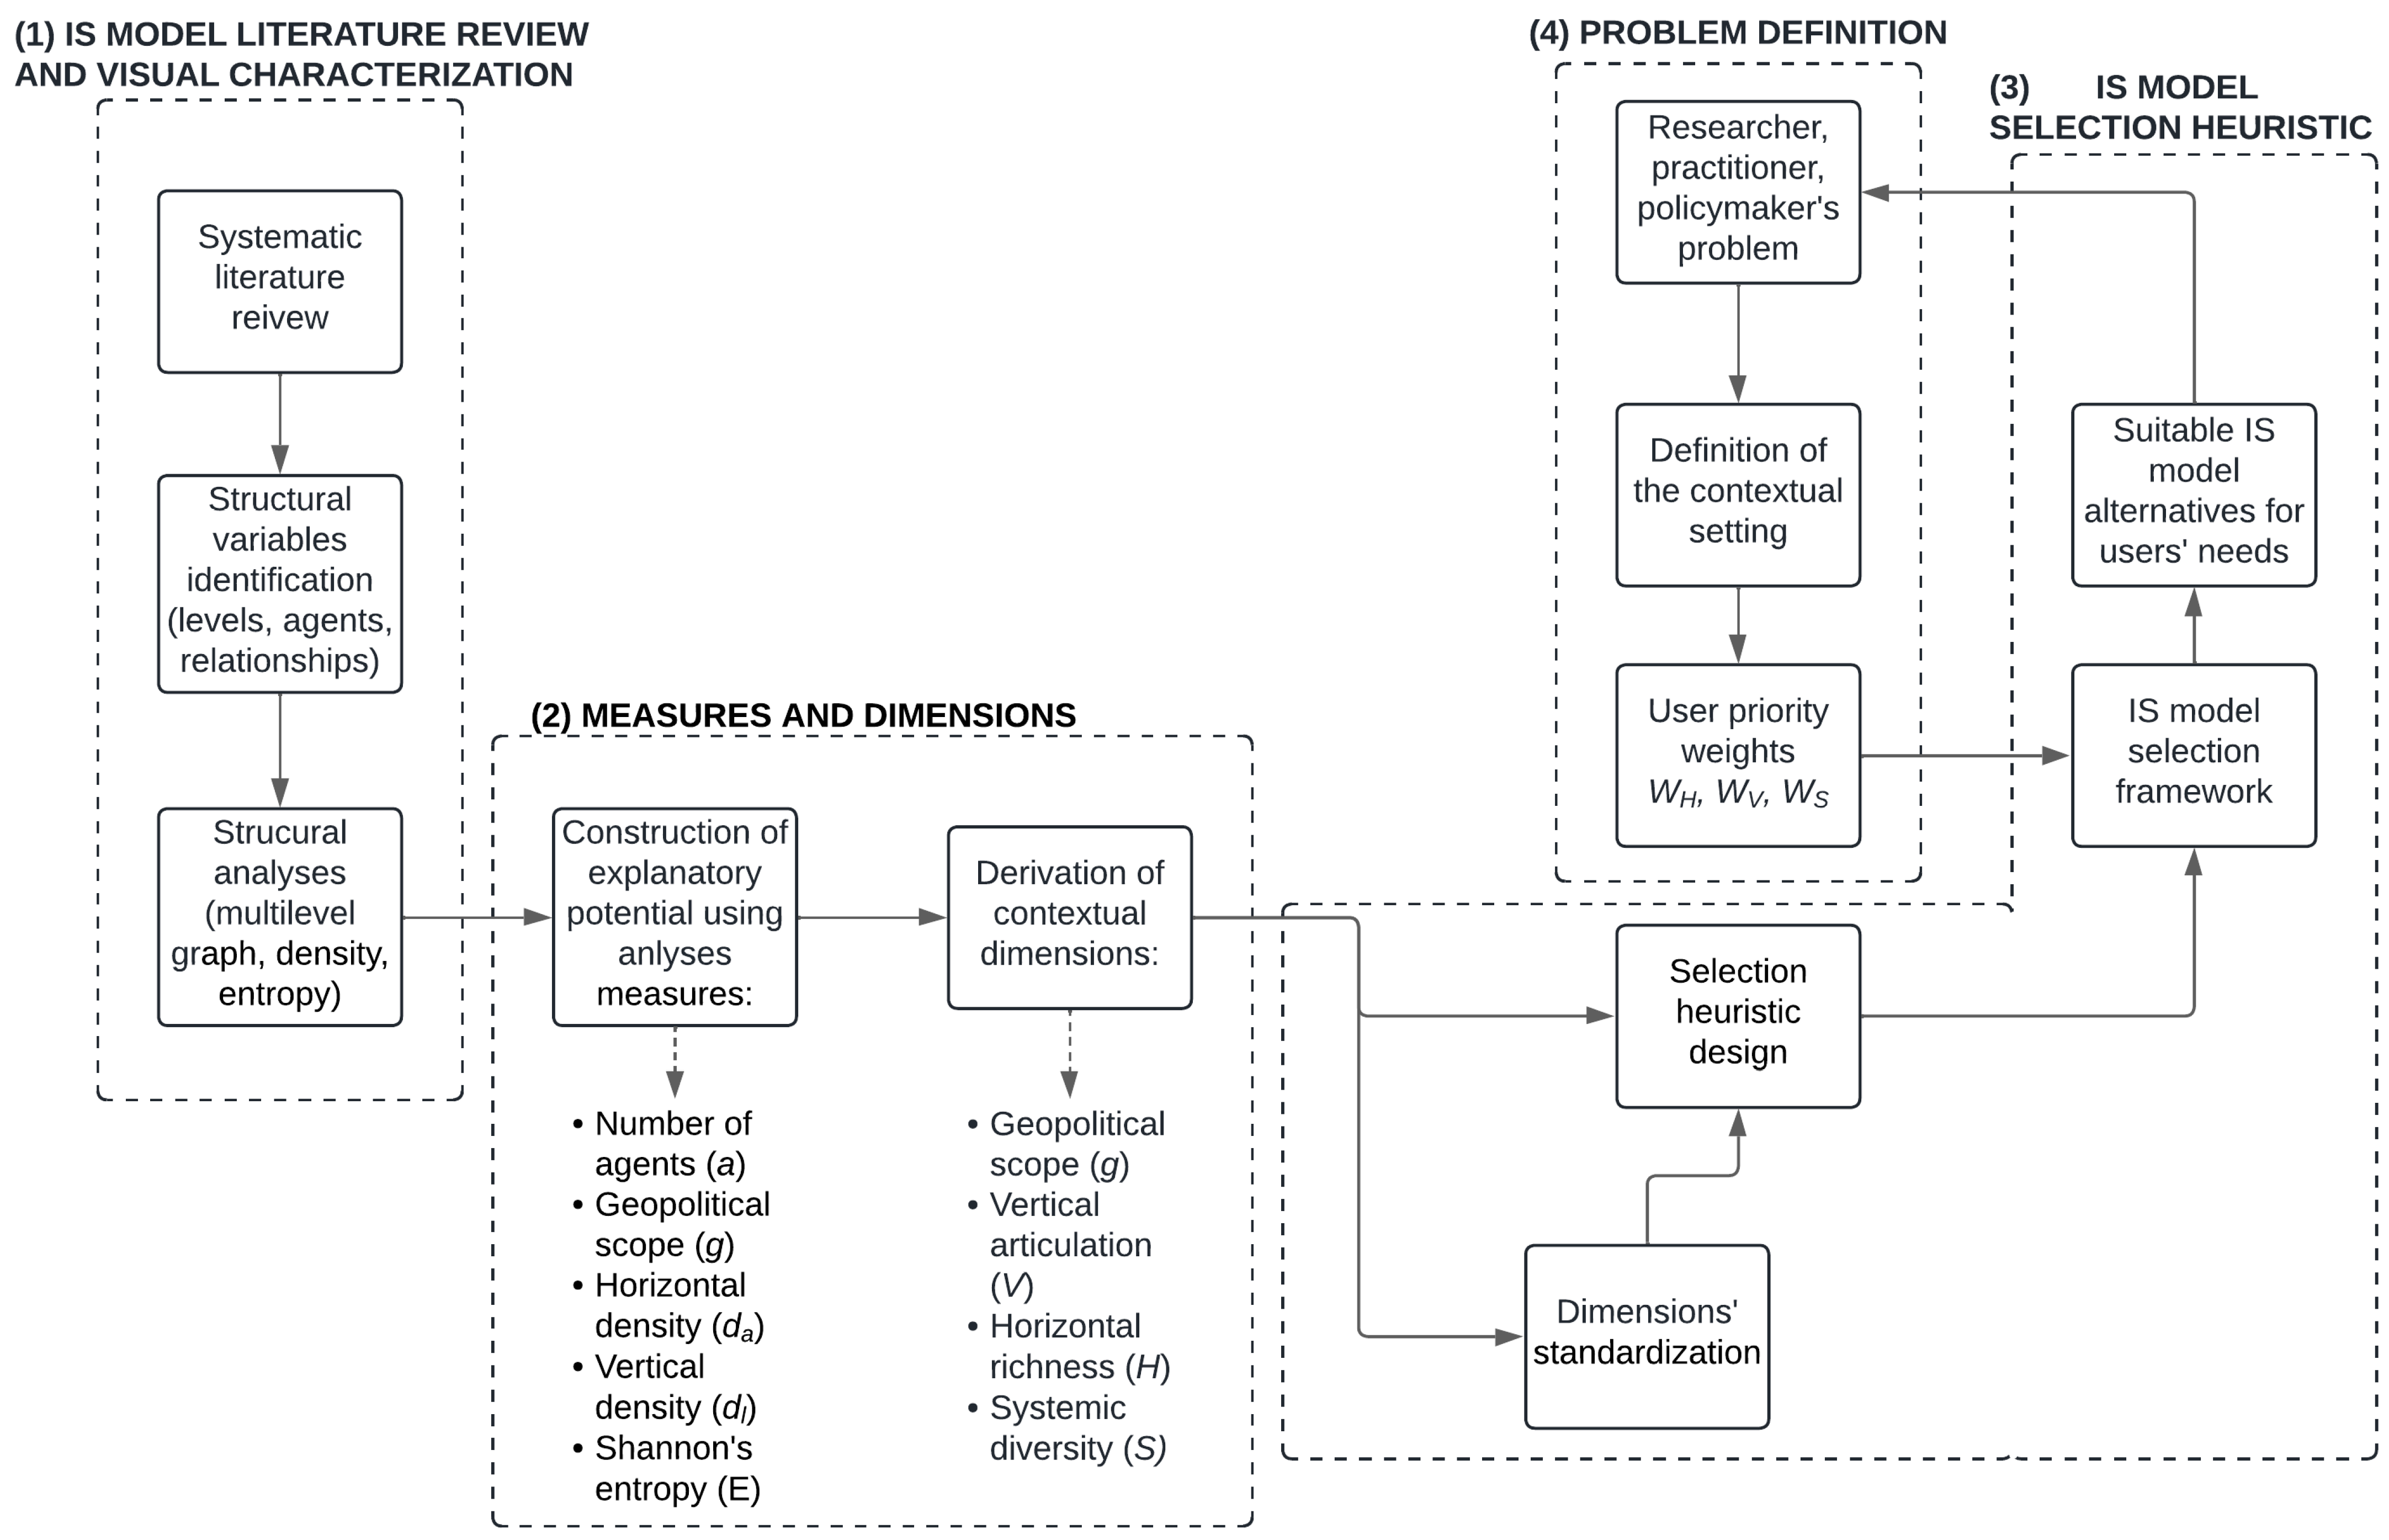
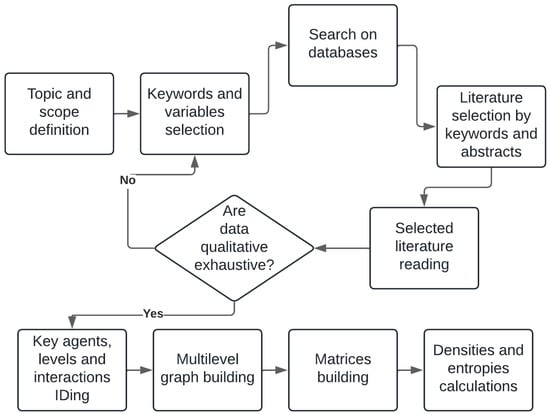
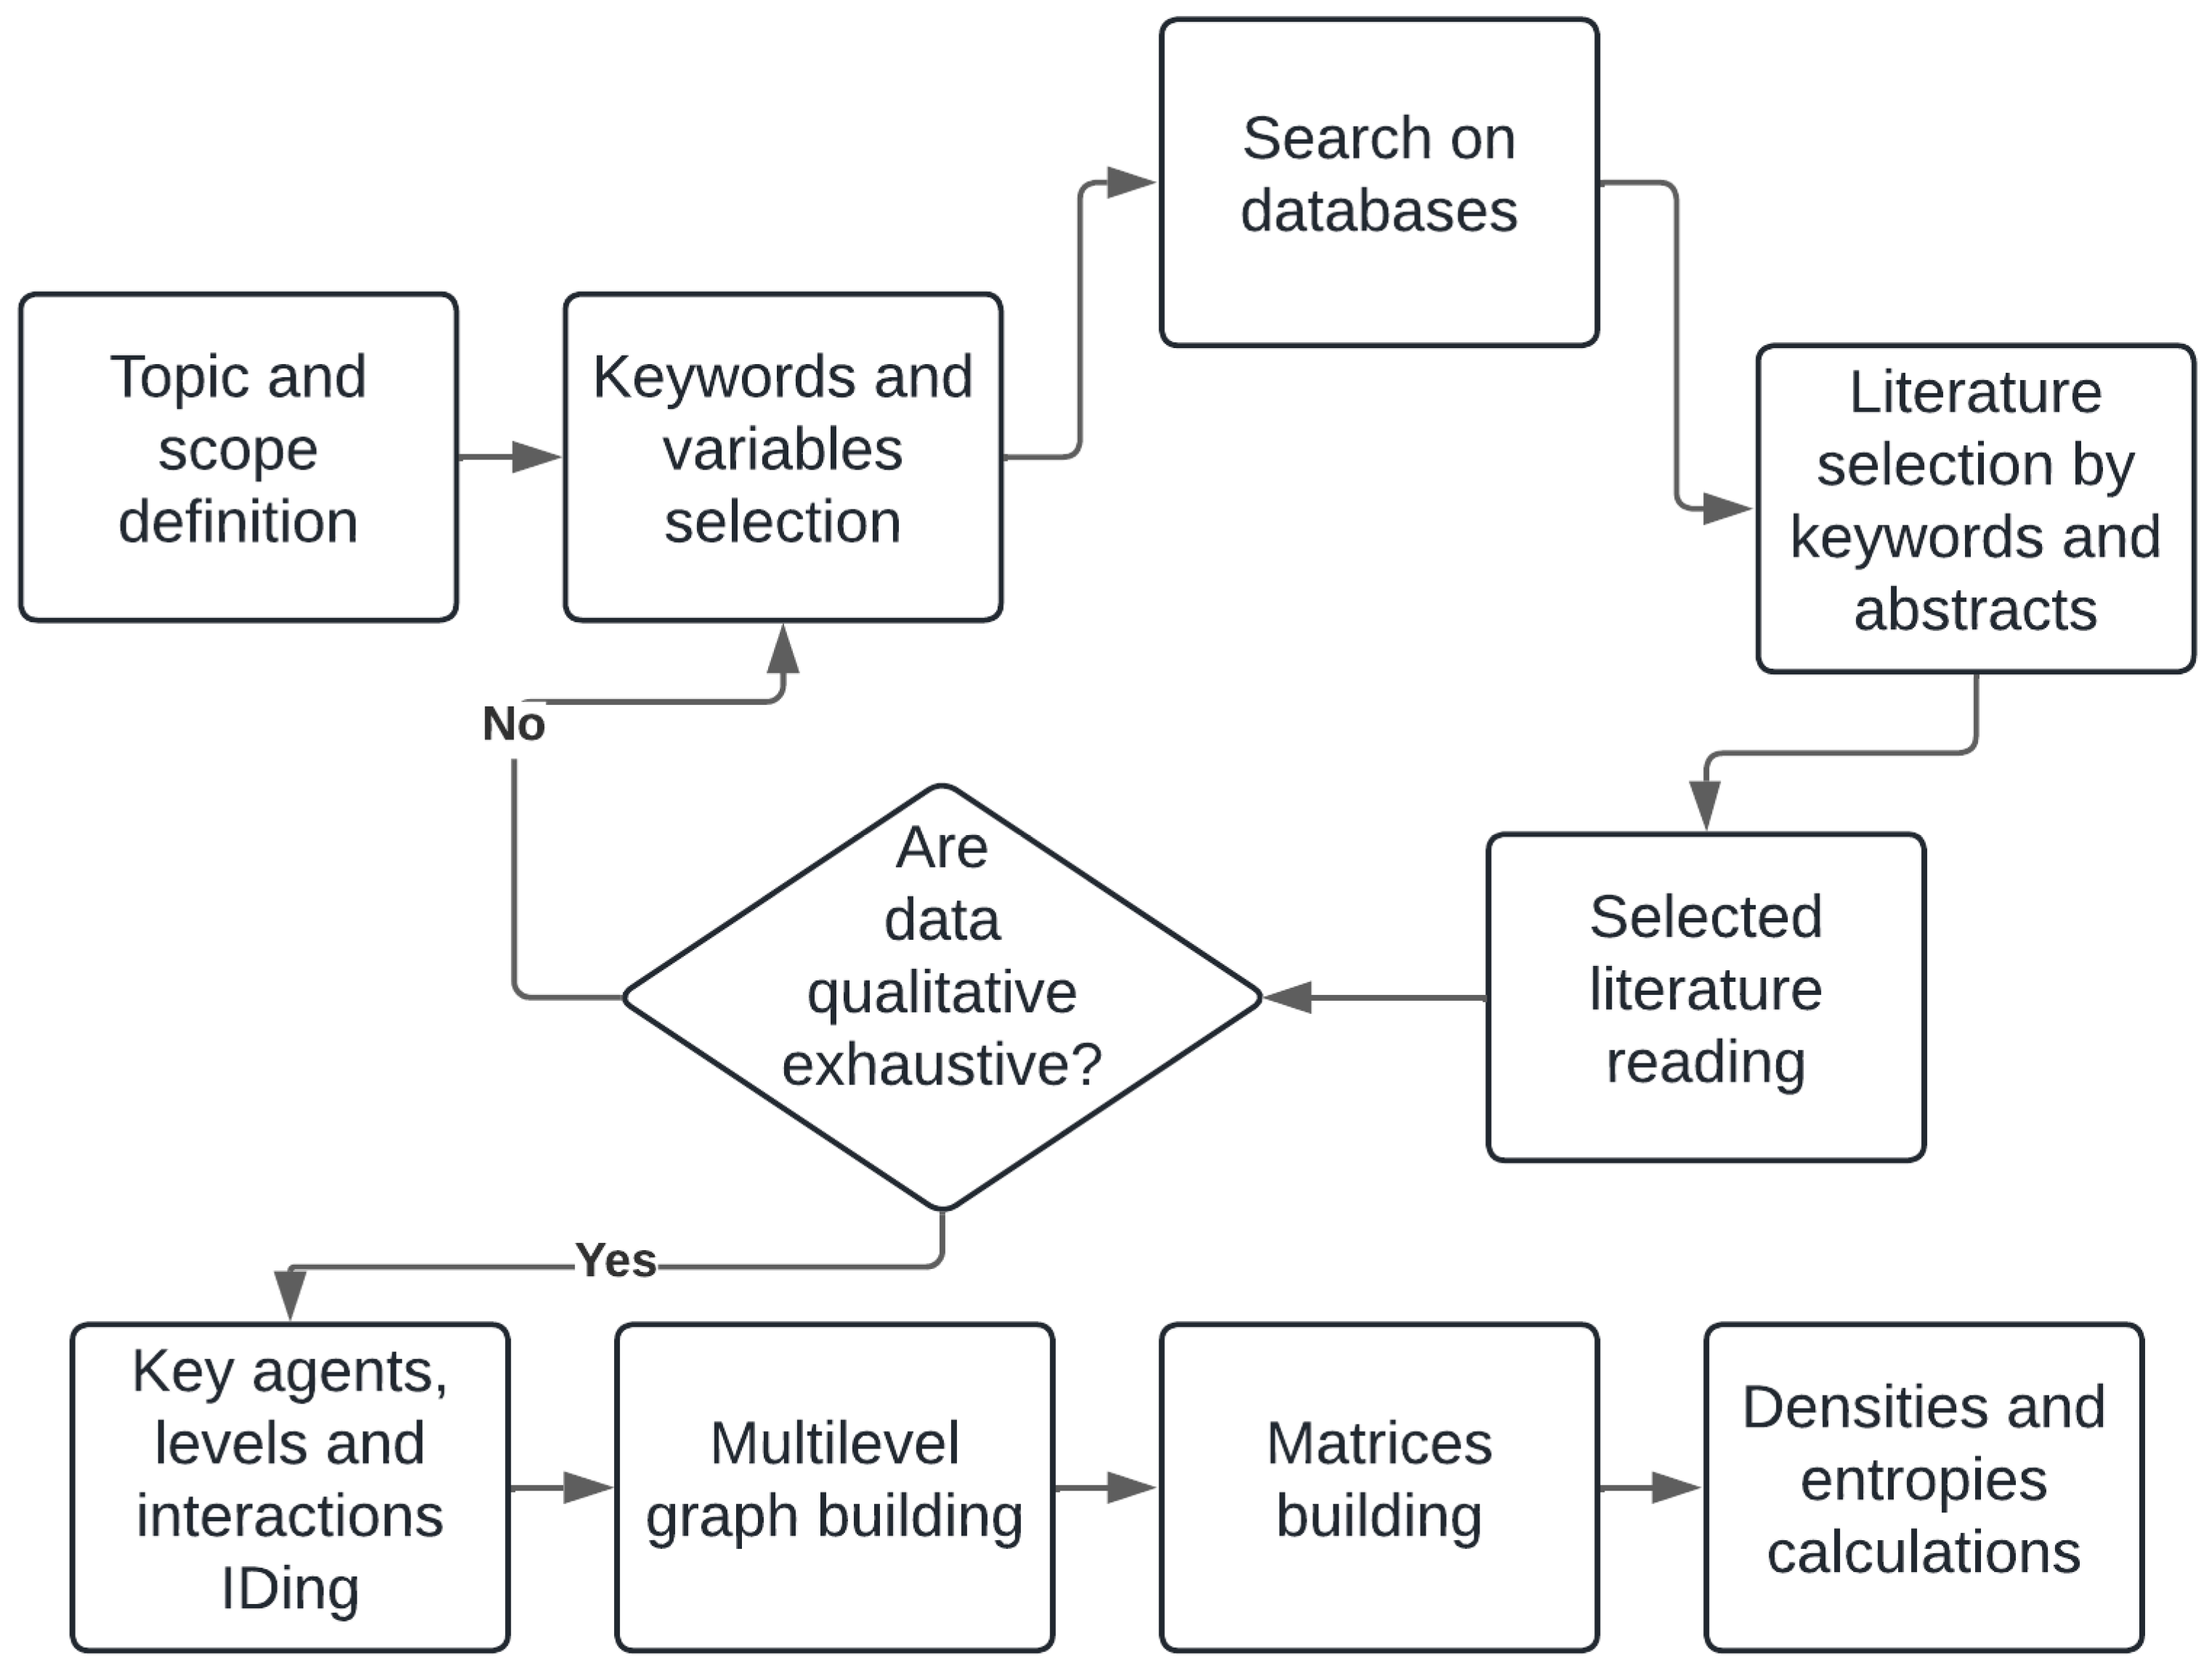
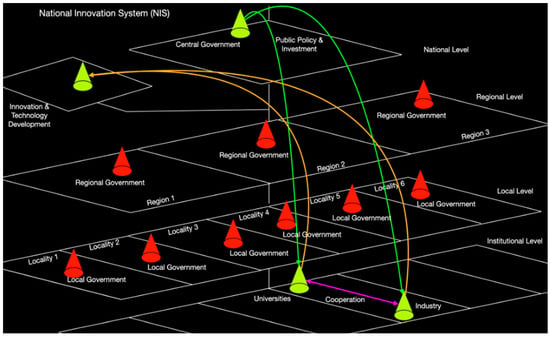
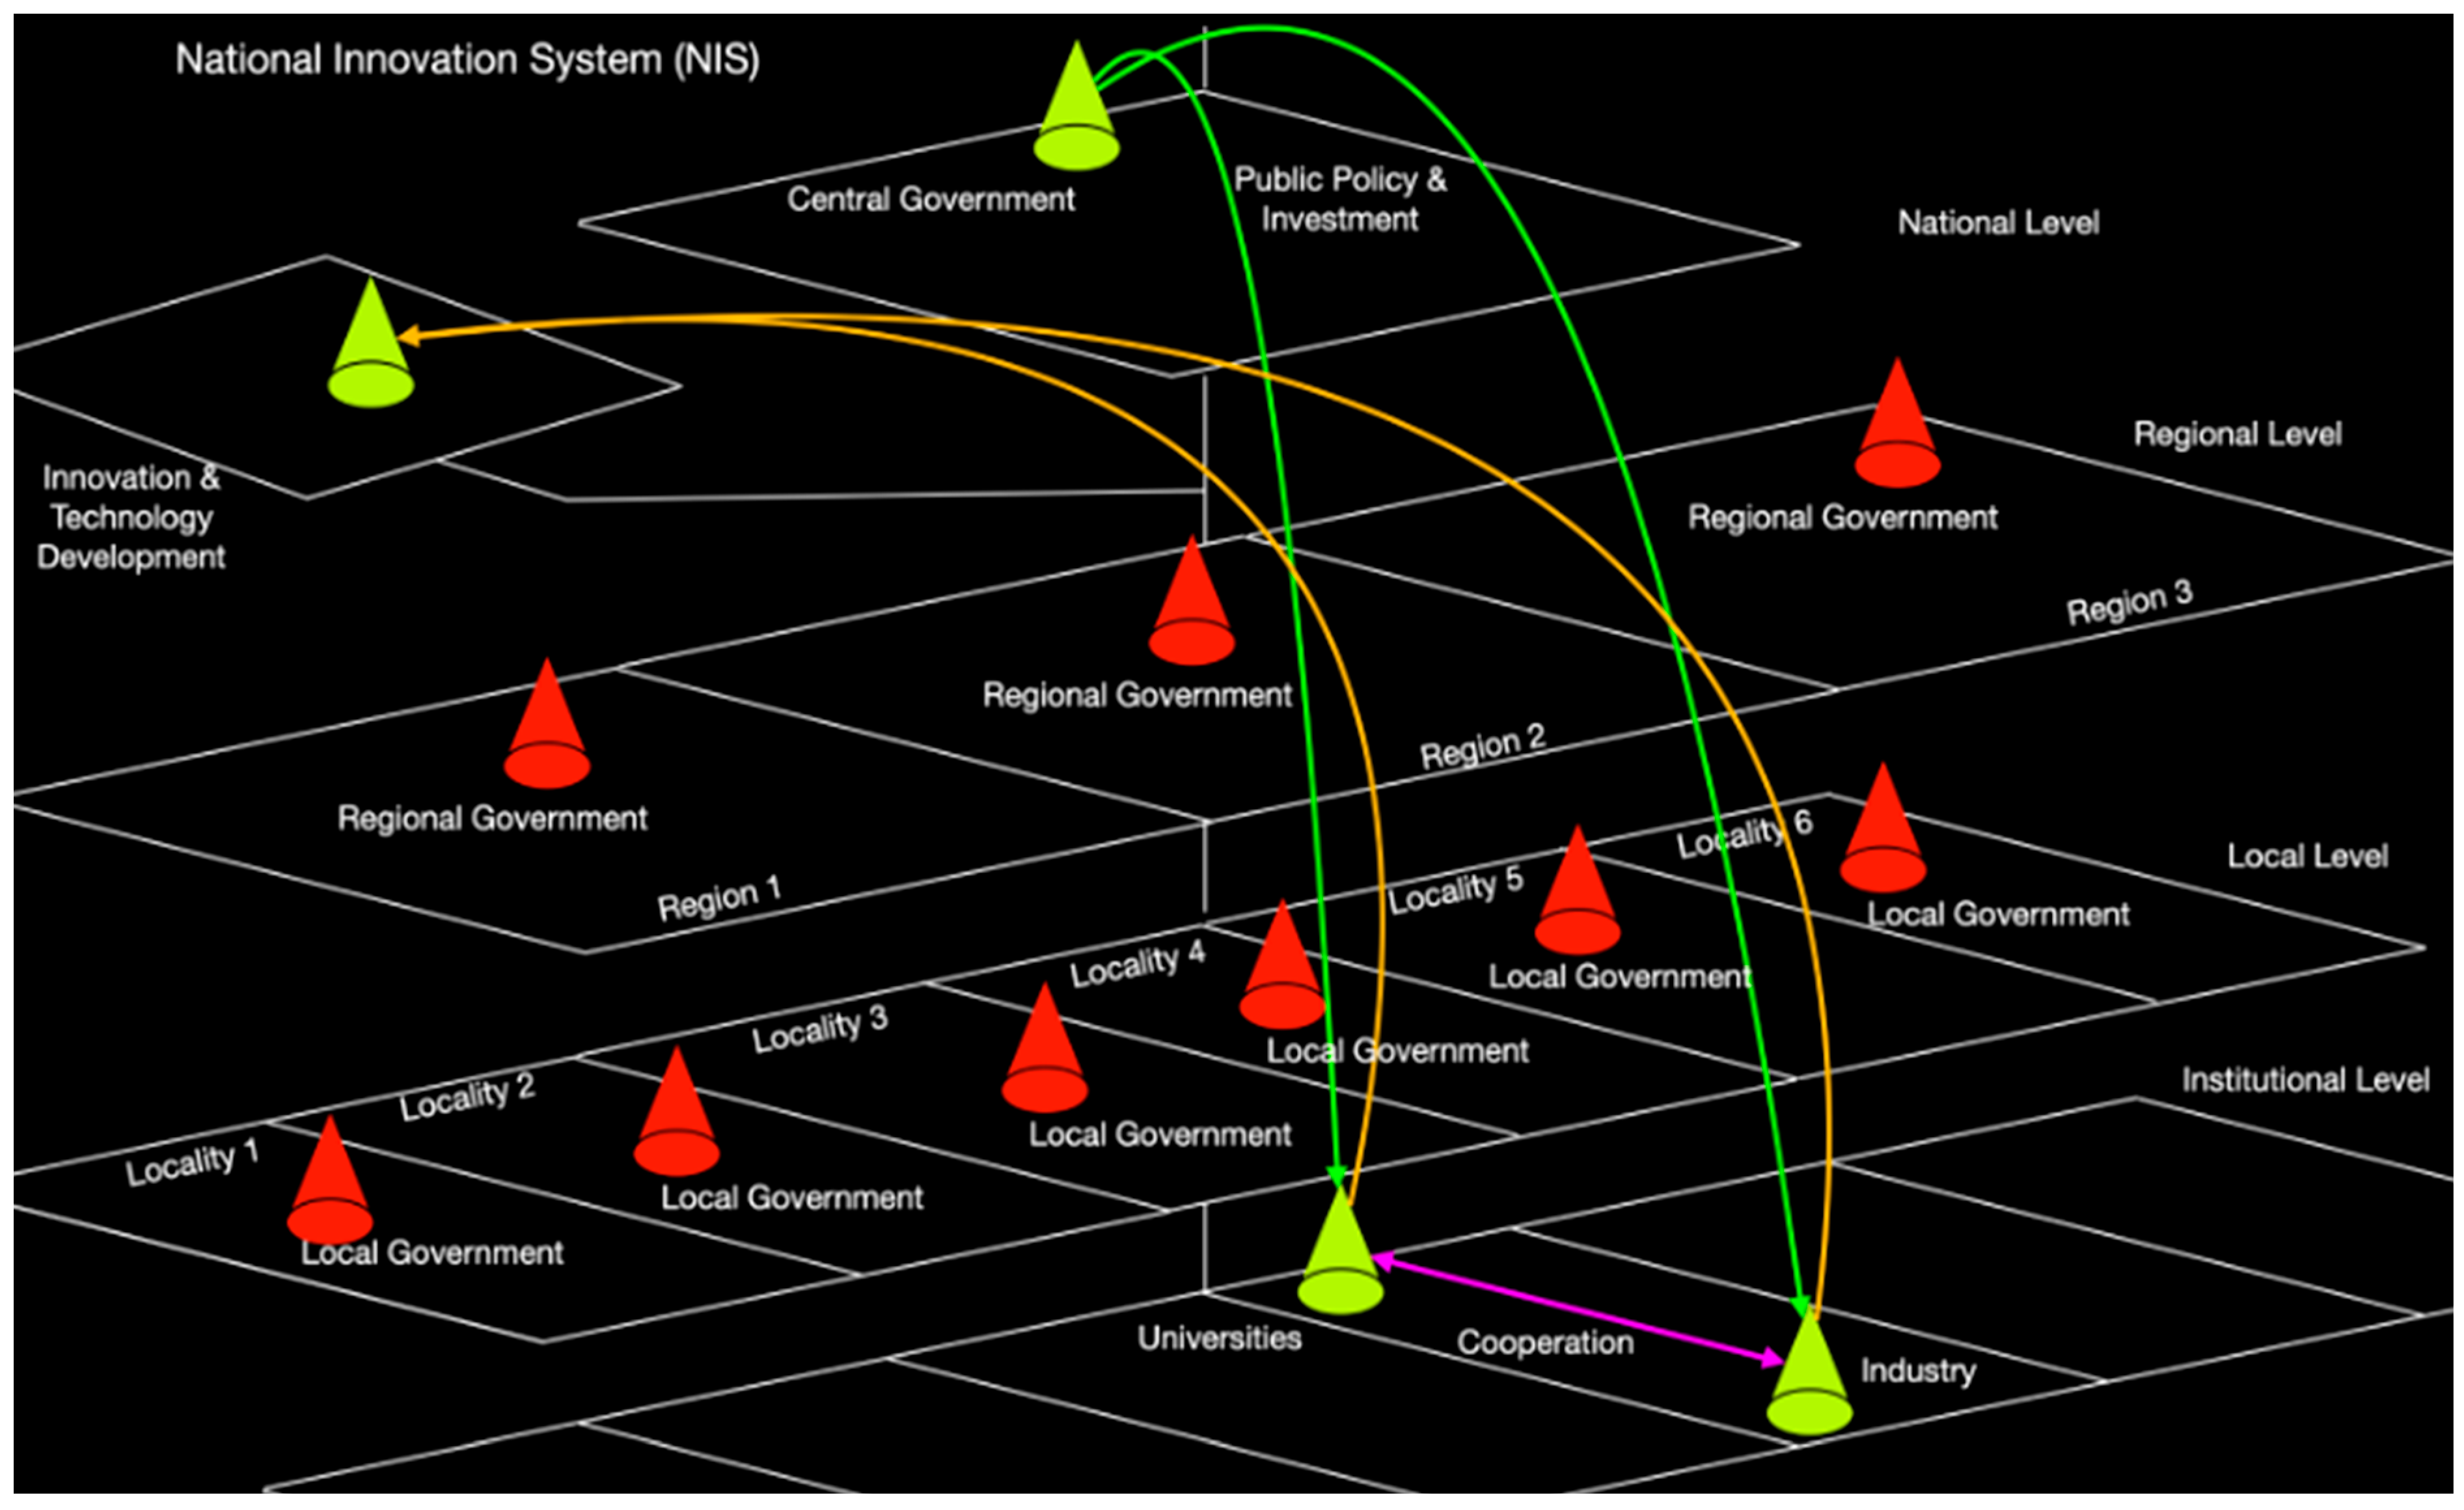
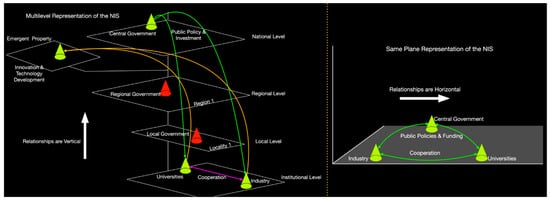
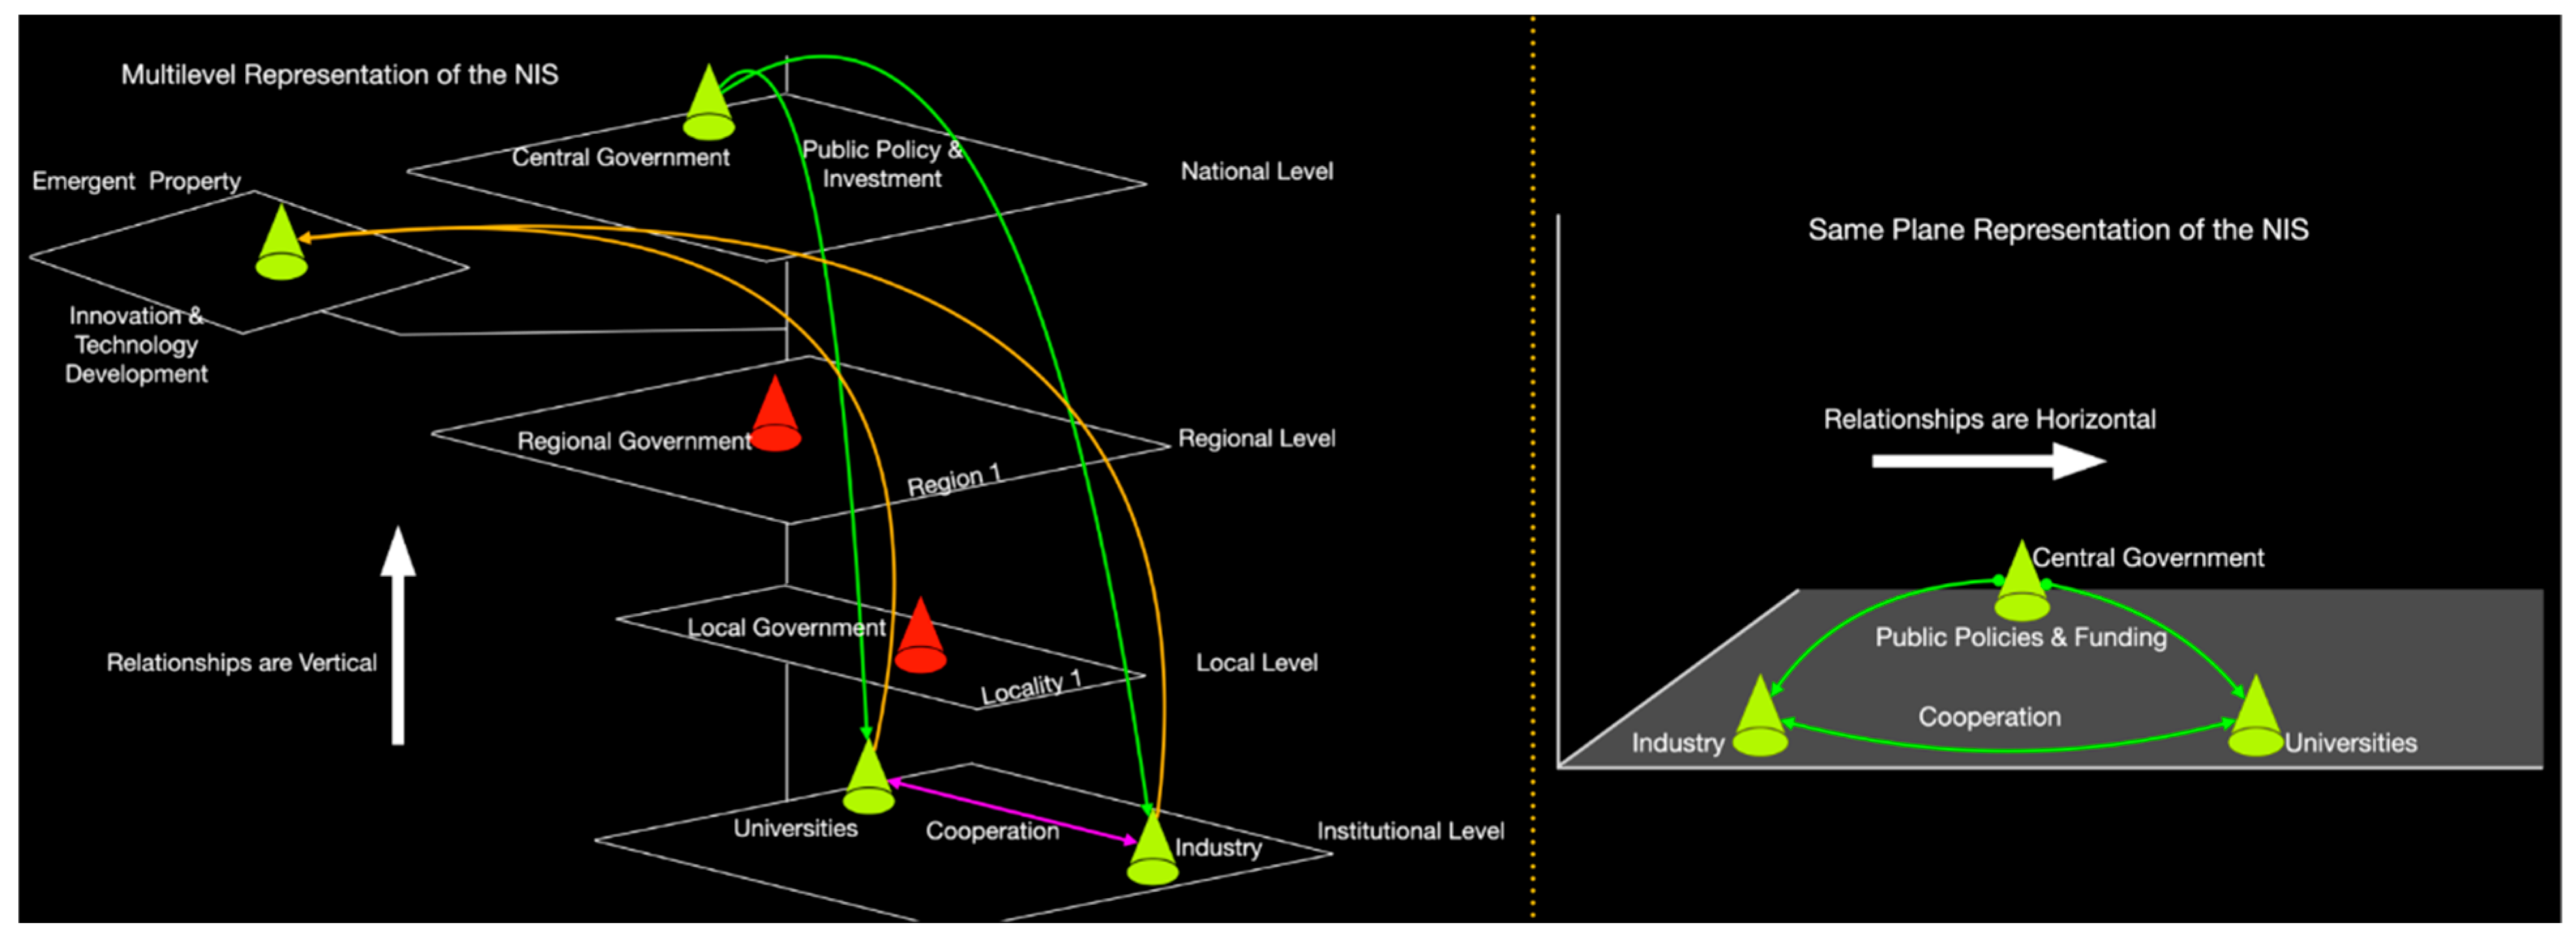
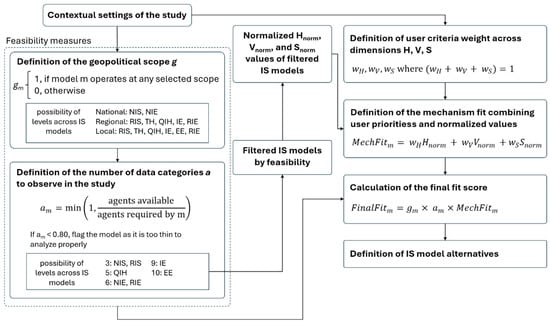
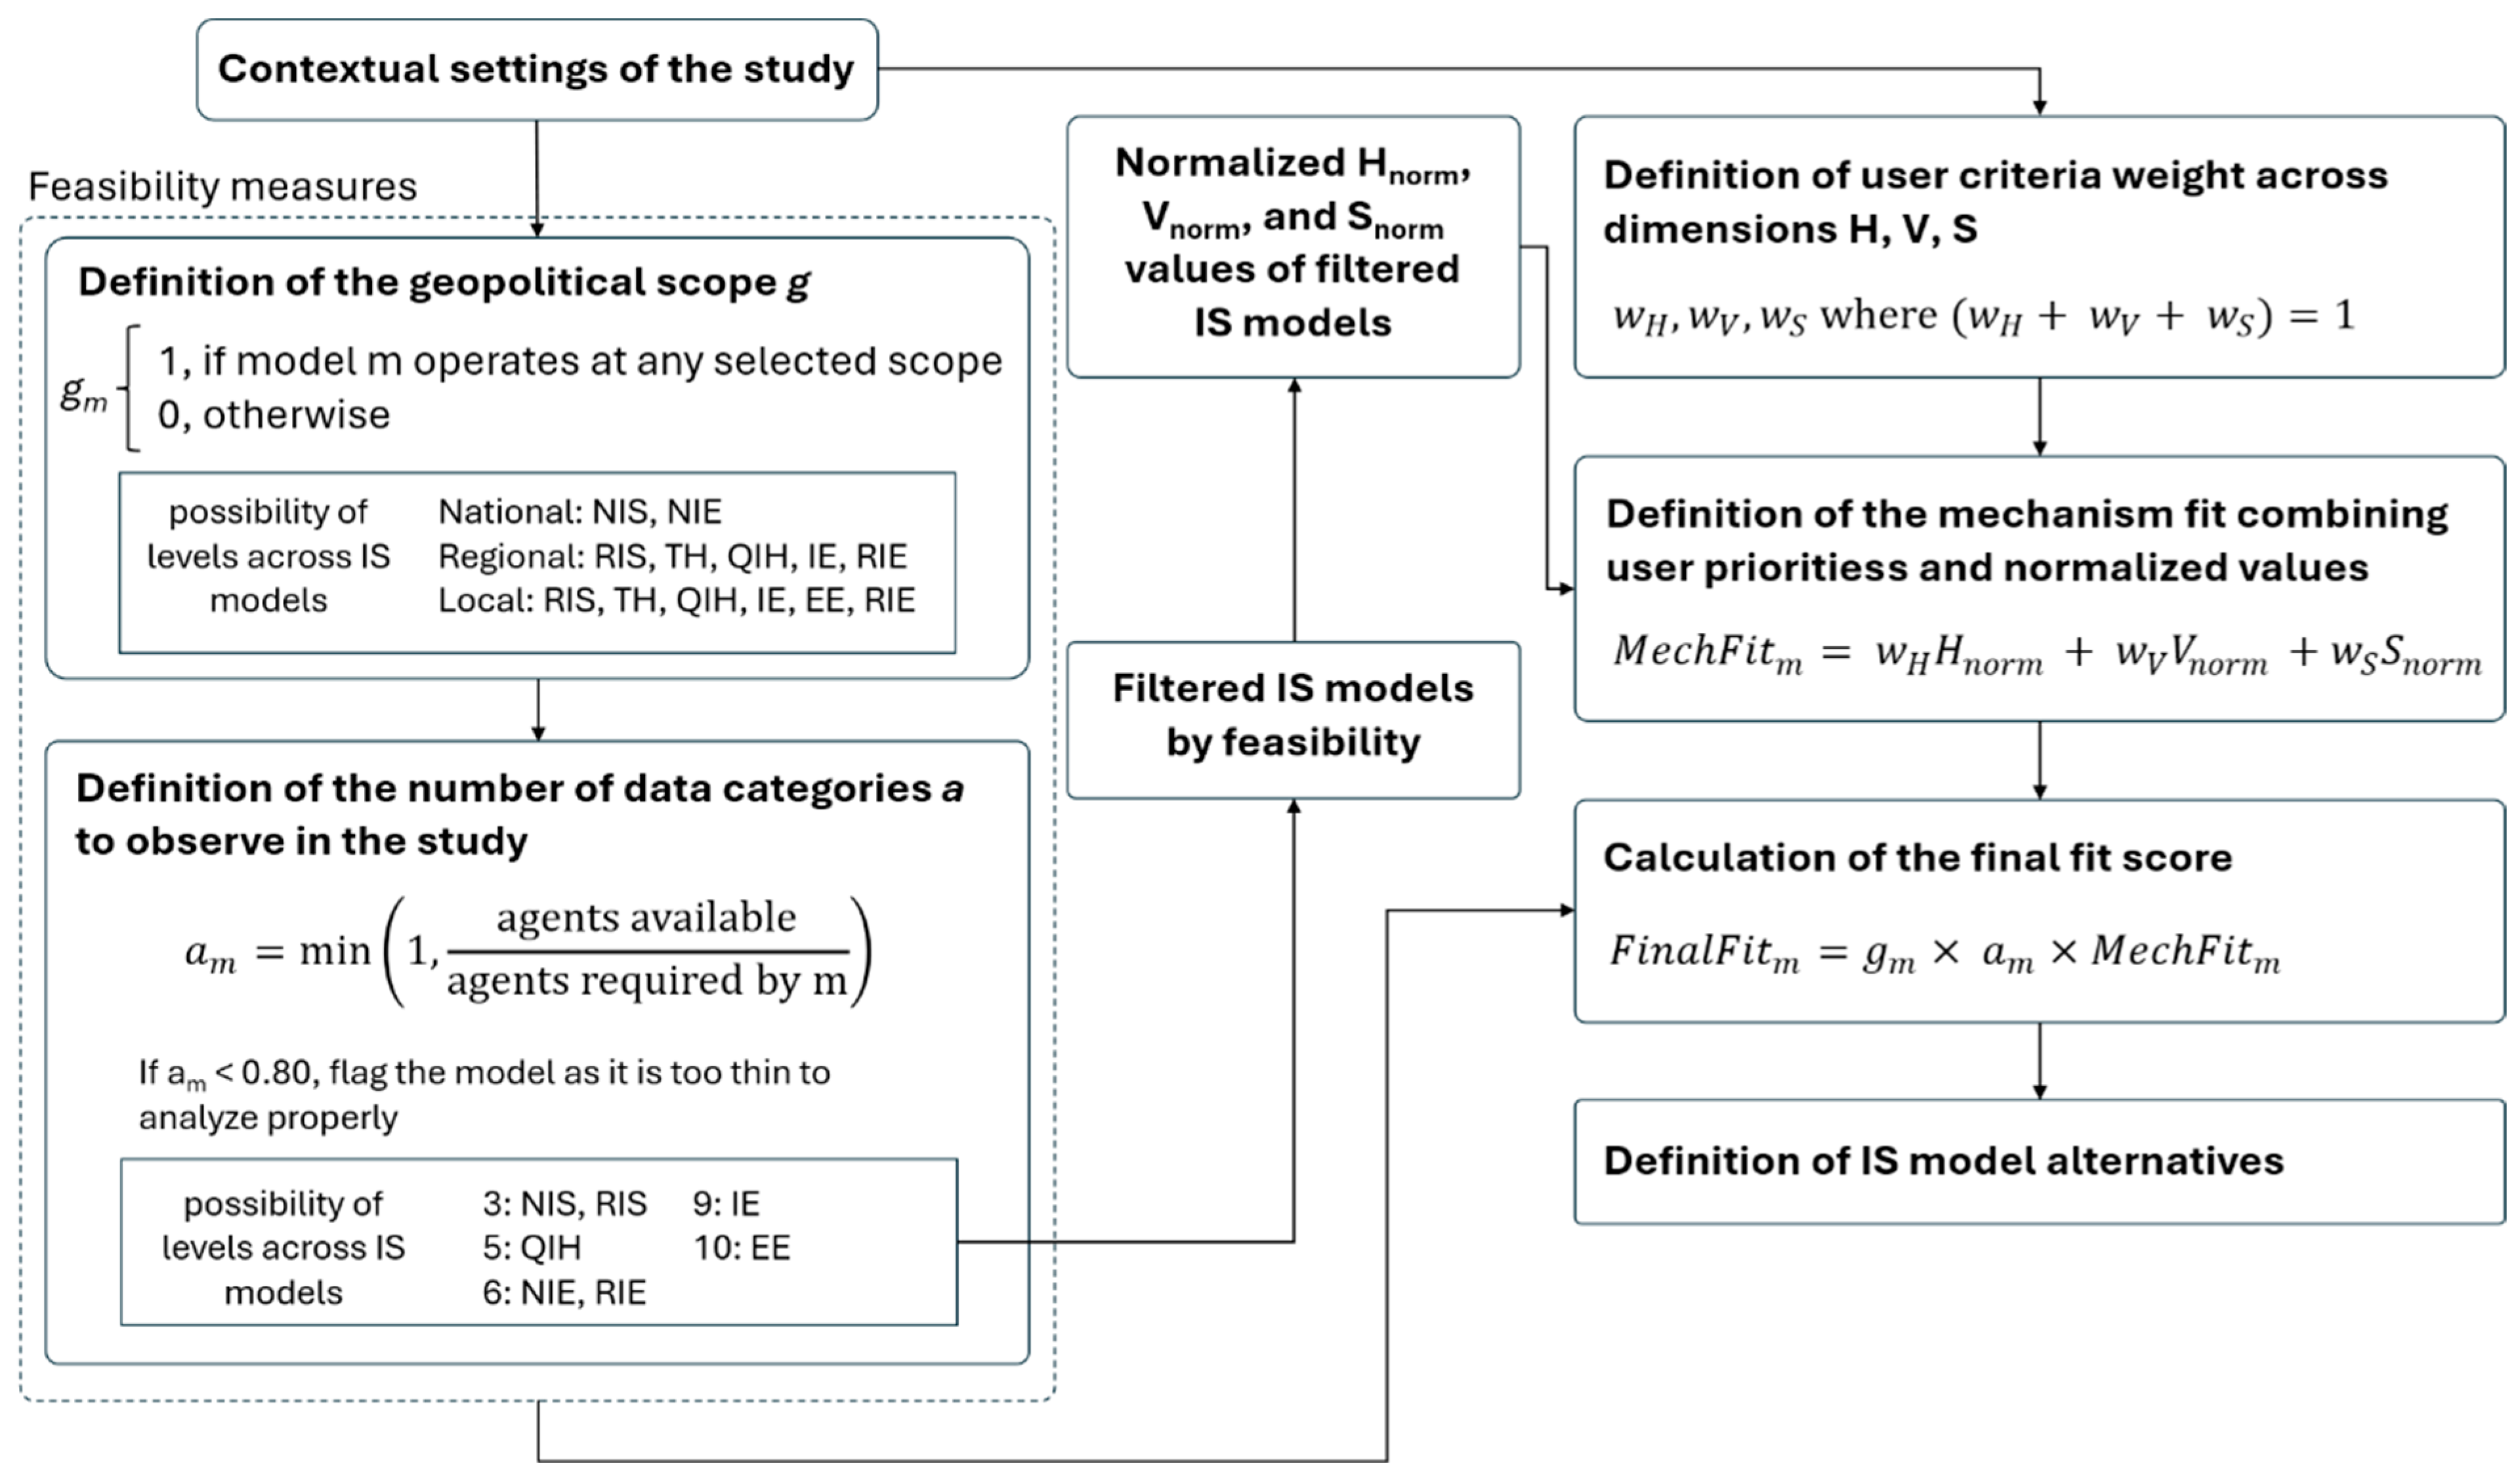

Disclaimer/Publisher’s Note: The statements, opinions and data contained in all publications are solely those of the individual author(s) and contributor(s) and not of MDPI and/or the editor(s). MDPI and/or the editor(s) disclaim responsibility for any injury to people or property resulting from any ideas, methods, instructions or products referred to in the content. |
© 2026 by the authors. Licensee MDPI, Basel, Switzerland. This article is an open access article distributed under the terms and conditions of the Creative Commons Attribution (CC BY) license.