


Abstract
Exploring information embedded in local network structure is essential for understanding the overall network structure and its functions. The development of innovation clusters in China’s Integrated Circuit (IC) industry has emerged as a key driver of industrial innovation. Different innovation clusters exhibit different collaboration patterns. Therefore, this study takes China’s Integrated Circuit Industry from 2011 to 2020 as the research object. It applies the motif-based method to analyze the three-node subgraphs and four-node subgraphs in the innovation network. The analysis focuses on collaboration patterns and the evolution of collaboration patterns, the distribution of collaboration patterns, as well as network motifs and network metrics. The results lead to the following conclusions. First, subgraphs featuring closed structures, particularly those with triadic closure, are identified as motifs and exhibit greater structural stability. In contrast, subgraphs lacking such closed configurations are classified as anti-motifs. However, transitions between anti-motifs and motifs are observed. Second, even systems of the same type may exhibit different subgraph ratio profiles and therefore belong to different motif families. At the same time, one motif superfamily may correspond to one or multiple motif concentration distributions. Third, network motifs in the innovation network are correlated with basic network characteristics.
1. Introduction
Over the past two decades, with the expansion of network size, mining hidden information in large-scale complex networks has become a research hotspot [1,2]. Significant achievements have been made in studies on node roles [3,4], global network structure characteristics [5,6], and evolutionary patterns [7]. Research in engineering [8], biology [9], and other disciplines has shown that networks with similar global network structure may exhibit very different local network structure due to differences in functional properties or generative mechanisms. In general, the properties of local network structure may differ substantially from the overall network topology [10,11]. These differences may also affect network dynamics [12]. Exploring and analyzing local network structure plays an important role in understanding the overall network structure and its functions. As a result, research on complex networks is no longer limited to node roles or global network structure. Increasing attention has been paid to mining local network structures and applying related methods, such as network community detection [13,14] and network motif identification [15,16].
Hierarchical features are widely observed in many real-world complex networks, such as social networks and the World Wide Web [10]. Oltvai et al. [17] identify a hierarchical organization described as individual, motif, module, and whole in complex biological networks. Motifs and modules are generally regarded as two important aspects in the study of local network structure. A module is a structural subnetwork composed of multiple nodes with different properties or types that share similar connection patterns. Connections among nodes within the same module are relatively dense, whereas connections between different modules are relatively sparse [18]. Such structure can be used to characterize network resilience [19] and other network properties. Compared with modules, motifs are usually simpler. They represent basic interaction patterns among a small number of nodes at the micro level [19], which can be regarded as lower-level structures of a network. However, the local properties reflected by motifs are closely related to network dynamics and generative mechanisms. Therefore, network motifs not only characterize specific local connection patterns, but also facilitate a bottom-up exploration of global network structural properties and functions.
In practice, provinces and cities in China are accelerating the construction of science parks and high-tech zones as innovation clusters in the Integrated Circuit Industry. These initiatives are supported by government policies, such as the policy issued by the Torch High Technology Industry Development Center Ministry of Science and Technology in 2020. Due to differences in openness level [20] and government policy [21], innovation clusters in different regions often exhibit different collaboration patterns. For example, the Shanghai Integrated Circuit Design Industrial Park, located in Zhangjiang High Tech Park, is based on the agglomeration of enterprises, research institutes, and universities. Innovation actors within this cluster cooperate closely and form a closed and networked innovation pattern. Besides, the Hefei National High-Tech Industrial Development Zone has formed a star-shaped innovation pattern. This pattern centers on collaboration with leading enterprises such as MediaTek Inc., MTK and GigaDevice Semiconductor Inc. Different collaboration patterns may exert different influences on the development of innovation clusters in the Integrated Circuit Industry across regions. Therefore, identifying diverse collaboration patterns within innovation clusters of the Integrated Circuit Industry is important for promoting both cluster development and overall industrial innovation.
Existing studies on innovation collaboration networks mainly rely on social network analysis and exponential random graph model approaches to reveal macro-level structural features and evolutionary dynamics, such as multi-centered structures, structural stratification, and dynamic reconfiguration [22,23,24]. Motif analysis is typically used as a complementary tool within these frameworks to capture micro- to meso-level structural patterns. Prior studies show that intermediate and fully connected motifs become increasingly prominent, with triadic closure facilitating network evolution and driving a transition from sparse or star-shaped structures toward more cohesive and distributed configurations [25,26,27]. In addition, motif structures are closely related to network resilience, as studies distinguish fragile linear chains from more robust reciprocal and redundant structures [28,29].
A review of the existing literature on network motifs shows that substantial progress has been made in studies on the definition of network motifs [30], algorithms and models [31], and applications [32]. These studies have demonstrated significant practical value in fields such as biological networks and critical transportation networks [33,34]. For innovation networks, the network motifs would provide distinct advantages in explaining collaboration patterns among innovation actors and in exploring structural changes in the innovation network. Their application in the field of innovation networks has considerable value. From a network structural perspective, networks are composed of local relational structures, where micro-level configurations such as dyads and triads play a fundamental role in shaping the overall network [35]. In innovation networks, structural characteristics influence innovation processes and outcomes [36]. Empirical evidence further shows that such networks tend to form closed triangle structures, exhibiting transitivity, and that these structures promote the formation of additional innovation collaboration ties [36]. In addition, shared partners contribute to improving information transmission efficiency within the network [35]. Therefore, understanding innovation networks from a micro-structural perspective is essential for explaining their formation and evolution.
Based on the above discussion, this study aims to apply network motif tools to identify local network structure with a given number of nodes. We examine the changing trends in subgraph frequency, analyze collaboration patterns in the innovation network and explore the relationship between the evolution of collaboration patterns and basic network characteristics. Taking China’s Integrated Circuit Industry as the research object, we construct innovation networks for ten different years and apply the motif identification method to obtain three-node subgraphs and four-node subgraphs. Furthermore, we analyze the changing trends in subgraph frequency and the evolution of network collaboration patterns, as well as their associations. This research provides a systematic, motif-based analysis that quantitatively examines the distribution, evolutionary dynamics, and resilience implications of different micro-level collaboration patterns, particularly under external shocks in the Integrated Circuit Industry. It also offers practical implications for policy design and the high-quality development of the Integrated Circuit Industry.
This study makes three main contributions to the literature on innovation networks and network motifs. First, it extends the application boundary and explanatory power of network motifs analysis in socioeconomic innovation systems. By applying motif-based analysis to collaborative patent data from China’s Integrated Circuit Industry between 2011 and 2020, the study indicates that motifs can capture micro-level collaboration patterns among innovation actors and also can reveal that closed structure subgraphs have higher statistical significance and stability than open structure subgraphs. Second, the study identifies a potential micro mechanism through which local network structure could contribute to network resilience. Compared with traditional community detection methods such as the Louvain algorithm or density-based clustering algorithms, motif-based analysis can identify connection patterns at the level of three-node subgraph and four-node subgraph, and the results show that closed triangular structures decline more slowly than anti-motifs when external shocks occur. Third, the study suggests that the external institutional environment may reshape the micro-structure of innovation networks. Although the network belongs to the same industry system, its subgraph ratio distribution has evolved into different motif families, especially after 2018 when the motif distribution patterns changed, which is highly likely to be associated with trade frictions.
The structure of the rest of this paper is organized as follows: Section 2 reviews the literature on innovation pattern clustering, the innovation network, and motif identification. Section 3 presents the research design, including network data sources, descriptive analysis, and research methods. Section 4 identifies collaboration patterns in the innovation network. Section 5 analyzes the distribution of collaboration patterns in the innovation network. Section 6 discusses the evolution of collaboration ties and changes in basic network characteristics. It also provides theoretical implications and discusses the limitations of this research and directions for future studies. Section 7 summarizes the main conclusions of this study.
2. Literature Review
This study adopts a network clustering method that differs from previous research, namely the motif identification method, which serves to identify the local network structure with a given number of nodes in order to explore innovation collaboration patterns. In addition, we review the different innovation roles of substructures in the innovation network and the effects of different structural states.
2.1. Innovation Pattern Clustering
Existing studies on innovation pattern clustering mainly focus on the macro-level operation of the innovation network. They measure collaboration patterns among innovation actors by capturing node attributes and edge relationships. Clustering algorithms in complex network research include node clustering, edge clustering, and density clustering. These approaches can identify local network structure such as network communities. For example, Blondel et al. [37] propose the Louvain algorithm based on node similarity to detect network communities. Rodriguez et al. [38] propose a density-based clustering algorithm to identify communities in networks. However, the local network structure obtained by these clustering algorithms is often not deterministic. These methods cannot specifically capture statistical characteristics of local network structure with a fixed number of nodes. Network motifs are typically named and studied according to the number of nodes they contain, such as three-node motifs and four-node motifs. Therefore, motif identification algorithms can specifically extract statistical features of network substructure composed of a given number of nodes. This approach provides a more effective way to examine innovation patterns in the innovation network and the influence of specific substructures on the overall network.
2.2. Innovation Network and Motif Identification
Research in network science shows that complex networks composed of nodes and edges can describe most complex systems in nature [39]. Concepts from network science have been applied to innovation studies. They guide the representation of both global network structure and local network structure in real-world innovation collaboration networks. These studies involve various types of relationships. Acemoglu et al. [40] map an innovation network and its strength using 1.8 million United States patents and their citation attributes. Zhang et al. [41] examine the impact of organizational network capital on innovation from the perspective of network dynamics. A study in network science indicates that large-scale properties of complex networks are regulated by their smaller components, namely network motifs [42]. Therefore, motif identification in the innovation network is important for understanding network structure and relationships.
In general, different substructures within the innovation network play distinct innovation roles. Taking the triadic structure as an example, it often enhances innovation agglomeration and innovation efficiency in the innovation network [5], which serves as a fundamental connection. As the smallest local network structure, the triadic structure tends to form triadic closure. It further expands on the basis of triadic closure and evolves toward larger and denser local network structure. This process helps cluster innovation actors within the innovation network. It promotes information exchange and the transfer of resources and technology, which in turn improves innovation efficiency [43]. At the same time, the agglomeration of innovation actors enhances network resilience when facing external risks. Therefore, the presence of triadic structure, especially the frequency of triadic closure, is an important factor influencing innovation efficiency and network resilience. Substructures with different numbers of nodes often have different effects on various aspects of network performance in the innovation network.
Further research shows that the open or closed status of network substructures also affects innovation efficiency and network resilience to different degrees. Taking the triadic structure as an example, the triangular structure represents the closed state of a triadic structure. As a basic substructure in networks [44], it widely exists in many networks. Compared with open triadic structure, it has higher transmission efficiency and stronger shock resistance. From the perspective of information transmission, the presence of triangular structure facilitates the flow of tacit knowledge, resources, and technology [45], thereby improving innovation efficiency. In addition, triangular structure has inherent structural stability, which contributes positively to overall network resilience. Therefore, understanding the role of open and closed substructures is important for analyzing the functions of different types of network motifs.
2.3. From Macro-Level Network Structures to Micro-Level Motif-Based Analysis
Existing studies predominantly rely on social network analysis and exponential random graph model approaches to examine overall structures and evolutionary dynamics, focusing on macro-level topological features (e.g., centrality, clustering, and multi-core structures), while remaining limited in capturing micro-level interaction patterns among a fixed number of nodes (e.g., motif-level or structural unit interactions). Liu et al. [22] use patent collaboration data in China’s Integrated Circuit Industry and employ social network analysis and exponential random graph models, finding that overall network resilience declines while node-level resilience evolves dynamically, and that network structure (e.g., central actors and structural embeddedness) significantly enhances system resilience, highlighting structurally driven and dynamically evolving characteristics of innovation networks. Chang et al. [23] construct a cooperation-knowledge dual-layer hypernetwork and apply social network analysis and exponential random graph models to show that the innovation network exhibits small clusters with large dispersion and a multi-centered structure, evolving toward a multi-center to multi-center spatial pattern, thereby revealing key macro-level topological features and evolutionary trends of industrial innovation systems. Chen et al. [24] build intercity patent collaboration networks and apply social network analysis and block modeling to identify changes in node positions and collaboration patterns, demonstrating that high-tech innovation networks exhibit clear structural stratification and dynamic reconfiguration.
Existing studies on motifs in innovation collaboration networks are still mainly used as complementary tools to overall network analysis, often in combination with social network analysis or exponential random graph model methods, to examine how subgraph structures influence broader innovation collaboration dynamics at the micro and meso levels. On the one hand, prior research focuses on the basic evolutionary patterns of motifs. For example, several studies [25,26,27] suggest that intermediate and fully connected motifs become increasingly prominent, triadic closure plays an important role in network evolution, and networks tend to shift from sparse or star-shaped centralized structures toward more cohesive and distributed collaboration patterns. On the other hand, some studies examine the relationship between motifs and network resilience. Qin Liu et al. [28] and Liu et al. [29] find that networks often lack resilience and can be improved by promoting the formation of collaborative ties. They also distinguish between fragile linear chain structures and more robust reciprocal structures, highlighting a transition toward patterns with richer redundant paths. However, existing research has not systematically examined, from a motif-based perspective, the quantitative distribution of different collaboration patterns, their evolutionary dynamics, and their implications for network resilience. In particular, how different micro-level collaboration patterns respond to external shocks remains unclear.
To summarize, theoretically, we extend motif theory from biological and transportation contexts to industrial innovation systems, and establish a linkage between micro-level motifs and macro-level resilience. This helps address the lack of micro-structural explanations in the existing literature. Empirically, we identify the evolutionary patterns of specific motif families in the innovation network of China’s Integrated Circuit Industry. We also show that closed motifs exhibit distinct stability under trade frictions. This finding provides new micro-level evidence for understanding the path of independent innovation in high-technology industries.
3. Research Design
We used collaborative patent data from the Integrated Circuit Industry between 2011 and 2020 to construct ten innovation networks. Then we calculated basic network characteristics from the perspectives of nodes, edges, communities and beyond. Furthermore, we applied Mfinder 1.2 for motif identification. Based on these results, we analyzed collaboration patterns in the innovation network of the Integrated Circuit Industry.
3.1. Network Data Sources and Descriptive Analysis
Incopat is one of the most representative patent platforms in China. Based on the IPC classification codes related to the Integrated Circuit Industry provided by the China Semiconductor Industry Association, we selected collaborative patents filed between 2011 and 2020, which include value chain segments such as design, manufacturing, packaging, equipment, and materials (See Table 1). In the data selection process, we only retained jointly applied patents. Nodes in the network represent innovation actors identified in patent records, while collaborative relationships between these actors are defined as edges. Specifically, the actors involved can be classified into four main types: firms, universities, research institutes, and government/social organizations. Firms are the most active participants. Based on the composition of co-applicants, firm–firm collaborations (patents jointly applied by multiple firms) overwhelmingly dominate the network, accounting for approximately 80.6% of the collaborative patents. This is followed by firm–university collaborations at 11.1% and firm–research institute collaborations at 3.6%. University–research institute collaborations account for 1.6%, while firm–government collaborations account for 1.2%. The remaining minor fraction consists of intra-type collaborations (such as university–university) and multi-party combinations (such as firm–university–research institute).
Table 1.
The IPC classification for the Integrated Circuit Industry.
These data are used to construct the innovation network of the Integrated Circuit Industry. To examine the evolution of the innovation network, we divided the data based on the patent grant year. For example, the network for 2011 only includes jointly applied patents that were granted in 2011. Compared to the application year, the grant year more accurately reflects the point at which innovation outcomes are formalized and legally protected, thus facilitating substantive partnership formation.
Then we constructed ten independent innovation networks. These networks were constructed by treating co-applicants of patents as nodes and their collaboration ties as edges. If there is at least one collaboration between two actors, the edge is assigned a value of 1. Otherwise, it is assigned a value of 0. Each network represents the collaboration among innovation actors in that specific year.
Table 2 presents the basic network characteristics of the innovation network in China’s Integrated Circuit Industry from 2011 to 2020. The results show that the number of collaborative patents increased steadily before 2017. After 2017, it fluctuated. Over time, the number of innovation actors in the innovation network continued to increase. The results also show that the average degree increased from 2.099 in 2011 to 2.869 in 2014, and then declined continuously. As time progressed, the average path length and the average clustering coefficient fluctuated considerably. However, the number of network communities increased year by year. The average size of network communities fluctuated, but it showed an overall increasing trend.
Table 2.
Basic network characteristics of the innovation network in the Integrated Circuit Industry from 2011 to 2020.
3.2. Research Method
Identification of motifs within the innovation network was carried out with Mfinder 1.2. A random network has the same nodes, edges, and degree sequence as the original network. It can be generated by the switching method [46]. For each patent that involves multiple innovation actors, we constructed subgraphs using a clique approach. This means that all nodes appearing in the same patent were connected pairwise by undirected edges.
During the subgraph computation process, we performed full enumeration for both the original network and the corresponding random networks. To ensure the reliability of the statistical results, the number of random trials was set to ten [47]. The random networks were generated using the Degree-preserving Switching Algorithm, also known as the Maslov Sneppen method. This algorithm randomly selects two edges and reconnects them, while avoiding self-loops and multiple edges, so that the degree of each node remains unchanged and the network structure is randomized. In addition to preserving the number of nodes, edges, and the degree sequence, this method also maintains basic structural features such as connected components to a certain extent. In each randomization process, the number of switching operations was typically set to more than ten times the number of edges, in order to ensure sufficient mixing of the network.
Regarding the number of random trials, it is important to balance statistical reliability with computational feasibility, especially for large-scale networks with thousands of nodes and edges. In the field of complex network motif identification, while higher numbers of randomizations are ideal for small networks, studies on large-scale socioeconomic or biological networks often adopt N = 100 as a robust reference [47]. This is because, for large networks, the frequency distribution of subgraphs in randomized ensembles typically converges to a normal distribution with very small variance. Consequently, even a limited number of randomizations is sufficient to obtain stable and reliable estimates of the mean and standard deviation required for Z-score calculation.
To empirically verify this assumption in our specific context, we conducted a sensitivity analysis using the 2020 innovation network. As shown in Table 3, the results indicate that under settings of N = 10, N = 50, and N = 100 randomizations, the Z-scores remain highly consistent and the identification of motifs and anti-motifs is exactly the same. Specifically, the Pearson correlation coefficient between the Z-scores obtained from N = 10 and N = 100 randomizations exceeds 0.999. This demonstrates that 10 randomizations are sufficient to support the identification and evaluation of network motifs.
Table 3.
Sensitivity analysis of Z-scores and motif types in the 2020 network under different numbers of random trials.
After identifying subgraphs in the original network (i.e., the innovation network of the Integrated Circuit Industry) and in the corresponding random network, we used the Z-score to determine whether a subgraph is a motif or an anti-motif [48].
In the equation, represents the frequency of the subgraph in the real network. and represent the average frequency and the standard deviation of the subgraph in the set of random networks. If , the corresponding subgraph is identified as a motif. Otherwise, it is identified as an anti-motif.
Figure 1 illustrates the process of network randomization and motif identification for subgraph 4-C. Subgraph 4-C (the subgraph composed entirely of solid lines) appears exactly six times in the original network. It appears twice, once, and once in the three random networks (the subgraphs with dashed lines). The frequency of subgraph 4-C in the original network is clearly higher than the average frequency in the random networks. Therefore, subgraph 4-C may be overrepresented and can be identified as a motif in the original network.
Figure 1.
Schematic diagram of network randomization and motif identification.
4. Identification of Collaboration Patterns in the Innovation Network of the Integrated Circuit Industry
4.1. Collaboration Patterns
In general, subgraphs with a given number of nodes can have many isomorphic types. According to the collaborative patent data of China’s Integrated Circuit Industry from 2011 to 2020, a total of 50,092 collaborative patents were completed by four or fewer innovation actors. This accounts for about 98.74 percent of all collaborative patents. Therefore, this study mainly examines collaboration patterns among three and four innovation actors. Specifically, we focus on three-node and four-node undirected connected subgraphs in the network.
Using the motif identification method described above, we identified three-node and four-node undirected connected subgraphs within the innovation network. The results are presented in Table 4. Table 4 shows schematic diagrams of two types of three-node subgraphs and six types of four-node subgraphs. These subgraphs are labeled as 3-A, 3-B, 4-A, 4-B, 4-C, 4-D, 4-E, and 4-F. The third column describes the collaborative meaning represented by each subgraph. The following two examples serve to clarify this point. Subgraph 3-B is called a fully connected triad or clique. It indicates that three innovation actors collaborate with each other to complete at least one patent. Subgraph 4-A indicates that one innovation actor collaborates separately with three other innovation actors, while the three actors do not collaborate with each other.
Table 4.
Three-node and four-node undirected connected subgraphs in the innovation network.
Furthermore, we take the innovation network of the Integrated Circuit Industry in 2020 as an example. As shown in Figure 2, the schematic diagram of the innovation network illustrates the collaboration patterns involving node 55. This node represents Nari Group Corporation, which is one of the innovative enterprises in China. The detailed collaboration patterns show that innovation actors may adopt different types of collaboration patterns depending on their partners.
Figure 2.
The 2020 Integrated Circuit Industry Innovation Network and the detailed innovation cooperation model centered on Node 55. (a) Innovation network of the Integrated Circuit Industry in 2020; (b) Detailed innovation collaboration patterns centered on node 55; (c) Each collaboration pattern.
4.2. Evolution of Collaboration Patterns
By analyzing subgraphs in the innovation network of the Integrated Circuit Industry by year, the evolution of local collaboration patterns can be observed. Table 5 presents the characteristics of three-node subgraphs and four-node subgraphs in the innovation network from 2011 to 2020. These characteristics include the absolute frequency and the relative frequency of subgraphs in the real network, as well as the Z-score and motif type. Taking the four-node subgraphs in the innovation network as an example, we examined the evolution of collaboration patterns from two perspectives: the importance of collaboration patterns and the number of collaboration patterns.
Table 5.
Characteristics of three-node and four-node subgraphs in the innovation network of China’s Integrated Circuit Industry from 2011 to 2020.
4.2.1. Evolution of the Importance of Collaboration Patterns
According to the results in Table 5, subgraph 3-A is consistently identified as an anti-motif, while subgraph 3-B is consistently identified as a motif. This result indicates that fully connected collaboration among innovation actors is relatively common in China’s Integrated Circuit Industry. Figure 3 shows the changing trend of Z-scores for four-node subgraphs in the innovation network from 2011 to 2020. The results indicate that motifs usually contain closed structures. Most of them include closed triangular structures and can be regarded as important collaboration patterns in the network. The motif status, indicated by a significantly positive Z-score, suggests the overrepresentation of these subgraphs and thus their importance in the innovation network compared to random expectations.
Figure 3.
Trend of Z-scores of four-node subgraphs from 2011 to 2020.
First, the Z-scores of subgraphs 4-C, 4-E, and 4-F are always greater than zero. This result means that their frequencies in the innovation network are consistently higher than their average frequencies in the random network. Therefore, these subgraphs are always identified as motifs. From a structural perspective, four-node subgraphs can be formed by combining three-node subgraphs. It is not a coincidence that subgraphs 4-C, 4-E, and 4-F are identified as motifs. These subgraphs can be generated from motif 3-B by adding one, two, or three additional edges. As a result, they all contain a triangular structure. Triangular structures are associated with higher transmission efficiency and greater stability; accordingly, these collaboration patterns can be regarded as important collaboration patterns in the innovation network.
Second, the Z-scores of subgraphs 4-A and 4-B are always less than zero. Therefore, they are consistently identified as anti-motifs. Subgraphs 4-A and 4-B can be considered as structures formed by adding one additional edge to anti-motif 3-A. These structures do not contain a triangular structure. Their transmission efficiency and stability are relatively lower. Accordingly, the importance of these collaboration patterns is relatively limited.
Third, the Z-score of subgraph 4-D is less than zero between 2011 and 2015, but becomes greater than zero after that period. This result indicates a transition from anti-motif to motif. Subgraph 4-D is formed by adding one additional edge to anti-motif 3-A. It does not contain a triangular structure and theoretically should be an anti-motif. The change in motif type may be related to its quadrilateral structure. Its stability and transmission efficiency are lower than those of a triangular structure. However, external factors such as technological progress [49] and changes in national strategy [50] may increase its transmission efficiency above the network average. As a result, it becomes a motif. The transition from anti-motif to motif indicates that the importance of this collaboration pattern gradually increases.
4.2.2. Evolution of the Number of Collaboration Patterns
We also analyzed the evolution of the number of collaboration patterns from the perspectives of absolute frequency and relative frequency.
In terms of absolute frequency, Figure 4 shows the evolution of the absolute frequency of six types of four-node subgraphs in the innovation network from 2011 to 2020. These subgraphs are classified according to motif type. Overall, from 2011 to 2016, the total number of all four-node subgraphs increased steadily as the scale of the collaboration network expanded each year. The total frequency increased from 221,602 in 2011 to 33,890,103 in 2016. However, starting in 2017, the frequencies of different types of four-node subgraphs began to fluctuate. For the three motifs, motif 4-C, motif 4-E, and motif 4-F began to decline significantly in 2018, 2019, and 2020, respectively. For the two anti-motifs, anti-motif 4-A declined after 2017 and showed another noticeable decrease in 2018. Anti-motif 4-B declined in both 2019 and 2020. For subgraph 4-D, its frequency began to decline in 2019, at which time it had already transformed into a motif. This pattern may be related to the U.S.–China trade war that began in 2018 and the subsequent trade frictions. These events are associated with changes in the overall scale of the innovation network in China’s Integrated Circuit Industry. They are also accompanied by a decrease in the number of network subgraphs.
Figure 4.
Evolution of the absolute frequency of six types of four-node subgraphs in the innovation network from 2011 to 2020.
Further analysis shows that the decline of motifs generally occurred later and at a slower rate than the decline of anti-motifs. One possible explanation is that motifs usually contain a triangular structure. Such structures are more stable and may therefore have stronger resistance to external shocks.
In terms of relative frequency, Figure 5 shows the evolution of the relative frequency of six types of four-node subgraphs in the innovation network from 2011 to 2020. With the development of the innovation network, the motif concentration of different four-node subgraphs shows considerable fluctuations. Taking subgraph 4-C as an example, we observe that its motif concentration from 2011 to 2020 follows a pattern of decrease, increase, decrease, increase, and decrease. The motif concentration of subgraph 4-A remains the highest among all types of subgraphs. It is much higher than the concentrations of other types and has remained above 90 percent since 2011. Compared with anti-motifs, motifs usually have lower motif concentration. However, when compared with the random network, the motifs are consistently overrepresented collaboration patterns in the real network.
Figure 5.
Evolution of the relative frequency of six types of four-node subgraphs in the innovation network from 2011 to 2020.
5. Analysis of the Distribution of Collaboration Patterns in the Innovation Network of the Integrated Circuit Industry
Comparing and analyzing the distribution of local network structure is important for understanding the evolutionary mechanisms of complex networks [51]. Milo et al. [51] systematically examine the similarity of local network structure in different biological, technological, and social networks. Based on this analysis, they propose the concept of motif superfamily. Networks with similar local network structure belong to the same superfamily. This result implies that these networks may share similar construction rules and evolutionary mechanisms. We examined motif superfamilies in the innovation network of the Integrated Circuit Industry. We used subgraph concentration, subgraph ratio profile, and subgraph combination as classification criteria to analyze the distribution of collaboration patterns.
5.1. Method for Analyzing the Distribution of Collaboration Patterns
Based on the study of Milo [51], we examined motif superfamilies in the innovation network by using three methods. The first is motif superfamily classification based on motif concentration. Motif concentration refers to the ratio between the frequency of the n-node subgraph i and the total frequency of all n-node subgraphs in the real network. This method does not generate random networks. It directly compares the relative frequency of all subgraphs at the same level in the real network and then determines the motif families’ classification and attributes.
The second is motif superfamily classification based on subgraph ratio profile. The subgraph ratio profile compares subgraphs of the same level in the real network with those in a large number of random networks. This process produces the Z-score of different types of subgraphs. The values are then normalized to obtain the subgraph ratio profile. Based on this result, motif family classification and attributes can be determined. Normalization emphasizes the relative importance of subgraphs. This approach is suitable for comparing networks of different sizes and different stages of evolution [52].
The third is motif superfamily classification based on subgraph combination. Higher-level subgraphs and even the global network structure can be formed through the combination of lower-level subgraphs. For example, three-node subgraphs can be combined to form n-node subgraphs with (n ≥ 4). This process helps explain the construction mechanism of the network and can be used to determine motif family classification and attributes. Taking the combination of three-node subgraphs to form four-node subgraphs as an example, different combination patterns can occur. These patterns include combinations involving only subgraph 3-A, combinations involving only subgraph 3-B, and combinations involving both subgraph 3-A and subgraph 3-B. The schematic illustration is shown in Figure 6.
Figure 6.
Example of subgraph combination between three-node subgraphs to form four-node subgraphs.
Subgraph combination intensity Ri refers to the ratio between the number of three-node subgraphs contained in the n-node subgraph i in the real network and the total number of three-node subgraphs. The calculation methods for the three types of combinations are shown below
Formulas (3)–(5) correspond to combinations involving only subgraph 3-A, only subgraph 3-B, and combinations involving both subgraph 3-A and subgraph 3-B. In these formulas, a and b represent the numbers of subgraph 3-A and subgraph 3-B contained in the n-node subgraph i. Note that the two types of subgraphs are considered independent, which means the structure of subgraph 3-A that form part of subgraph 3-B is not excluded from the count. represents the frequency of the n-node subgraph i in the real network. and represent the total frequencies of subgraph 3-A and subgraph 3-B in the real network. To compare networks with different sizes, the normalized value of subgraph combination intensity at the same subgraph level is used.
5.2. Classification of Collaboration Pattern Distribution Based on Three Methods
5.2.1. Based on Motif Concentration
The distribution of four-node subgraph motif concentration in the innovation network of the Integrated Circuit Industry shows four basic patterns, as illustrated in Figure 7.
Figure 7.
Motif concentration distribution of four-node subgraphs in the innovation network.
- Pattern 1. Nreal(4-A) > Nreal(4-C) > Nreal(4-B) > Nreal(4-E) > Nreal(4-F) > Nreal(4-D). This pattern is observed in the innovation networks of the Integrated Circuit Industry for the years 2011, 2012, 2013, 2016, and 2017.
- Pattern 2. Nreal(4-A) > Nreal(4-C) > Nreal(4-B) > Nreal(4-E) > Nreal(4-F) = Nreal(4-D). This pattern is observed in the innovation networks of the Integrated Circuit Industry for the years 2014 and 2015.
- Pattern 3. Nreal(4-A) > Nreal(4-B) > Nreal(4-C) > Nreal(4-E) > Nreal(4-D) > Nreal(4-F). This pattern is observed in the innovation network of the Integrated Circuit Industry for the year 2018.
- Pattern 4. Nreal(4-A) > Nreal(4-B) > Nreal(4-C) > Nreal(4-E) > Nreal(4-F) > Nreal(4-D). This pattern is observed in the two innovation networks of the Integrated Circuit Industry for the years 2019 and 2020.
The results show that the motif concentration of subgraph 4-A ranks first in the innovation network for each year. It remains above 90 percent from 2011 to 2020. The motif concentration of subgraph 4-C ranks second from 2011 to 2017, while the concentration of subgraph 4-B ranks third during the same period. After 2018, the ranking between the two subgraphs is reversed. The motif concentration of subgraph 4-E consistently ranks fourth. In addition, subgraphs 4-D and 4-F always rank in the last two positions. Except for 2018, the motif concentration of subgraph 4-F is consistently higher than that of subgraph 4-D.
5.2.2. Based on Subgraph Ratio Profile
Figure 8 presents the results of the subgraph ratio profile of four-node subgraphs in the innovation network of the Integrated Circuit Industry for each year. It also shows the matrix coloring results of network similarity obtained through the Pearson correlation coefficient. In general, a Pearson correlation coefficient greater than 0.8 indicates a high level of correlation between two networks. According to the results, the innovation networks of the Integrated Circuit Industry from 2011 to 2020 can be divided into three motif families. Motif family I comprises seven innovation networks from seven different years, all exhibiting Pearson correlation coefficients greater than 0.8 in their subgraph ratio profiles. Motif family II includes one innovation network from a specific year. Motif family III includes two innovation networks from different years. The correlation coefficients of their subgraph ratio profiles are greater than 0.99. Among the three motif families, the subgraph ratio profile values of subgraphs 4-C, 4-E, and 4-F are all greater than zero. These subgraphs are motifs and appear more frequently in the real network than in the random network. Among them, subgraph 4-F has the highest value, indicating the highest importance. The subgraph ratio profile values of subgraphs 4-A and 4-B are both less than zero, indicating these subgraphs are weak subgraphs. However, the main difference among the three motif families lies in the variation in the importance of other subgraphs other than subgraph 4-F. For example, the importance of subgraph 4-D in motif family II increases significantly compared with the other motif families.
Figure 8.
Subgraph ratio profile of four-node subgraphs in the innovation network and matrix of correlation coefficients.
5.2.3. Based on Subgraph Combination
The normalized curves of subgraph combination from three-node subgraphs forming four-node subgraphs in the innovation network, and the matrix of correlation coefficients, are shown in Figure 9. The analysis indicates that the subgraph combination rules of the innovation network in the Integrated Circuit Industry are generally similar. The correlation coefficients are greater than 0.97. Subgraph combination intensity R4-C occupies the dominant position. It is followed by R4-A. Subgraph combination intensities R4-B, R4-E, and R4-F are lower, while R4-D is the lowest. In addition, the correlation coefficients among the innovation networks of different years are all greater than 0.97. This result indicates a high level of similarity and confirms the consistency of the subgraph combination rules.
Figure 9.
Subgraph combination curves from three-node subgraphs forming four-node subgraphs in the innovation network, and matrix of correlation coefficients.
5.3. Comparison of Collaboration Pattern Distributions
Based on the four patterns of motif concentration distribution, the three types of subgraph ratio profile, and the rule of subgraph combination, the innovation networks of the Integrated Circuit Industry can be classified into corresponding motif families. The results are shown in Table 6. The results indicate that motif family I, which is based on subgraph ratio profile, includes Pattern 1 and Pattern 2 based on motif concentration. Motif family II and motif family III correspond to Pattern 3 and Pattern 4, respectively, indicating that different motif concentration distribution patterns can exist within the same motif family. The reason is that motif family classification based on the subgraph ratio profile can filter out unnecessary details that arises from relying solely on the absolute frequency of subgraphs. In motif family analysis based on motif concentration, when the size of subgraphs increases, the number of combinations often grows rapidly. This phenomenon makes motif concentration distribution patterns difficult to identify. Overall, motif family classification based on motif concentration and that classification based on subgraph ratio profile show a high level of consistency. Motif family classification based on subgraph combination places these innovation systems into a single family. The main reason is that the research object is the innovation network of the same industry. The technological characteristics and innovation costs of the industry contribute to structural consistency across both local and global network structures.
Table 6.
Motif family classification of the innovation network.
Milo et al. [51] suggest that systems often evolve over a long period in order to achieve specific goals or functions, which leads to the formation of different types of systems. However, different types of systems may have the same subgraph ratio profile. As a result, they belong to the same motif family and share similar local network structure. The results of this study show that even systems of the same type may have different subgraph ratio profiles. Therefore, they may belong to different motif families. Influenced by the external innovation environment and internal innovation conditions, an innovation network that serves the same function can be composed of different micro-level structures. For example, the innovation networks from 2011 to 2017 belong to motif family I, while the innovation network in 2018 belong to motif family II.
6. Discussion
6.1. Evolution of Collaboration Ties and Changes in Basic Network Characteristics
6.1.1. Network Nodes and Edges
In Table 2 and Figure 4, the number of innovation actors in the innovation network increases over time. However, the number of collaborative patents each year reaches a turning point in 2017. It changes from an increasing trend to a decreasing trend. This trend is similar to the overall change in the frequency of motifs. However, concerning this turning point, only motif 4-C exhibits the same timing. The decline in the frequency of other motifs occurs later than 2017. Some motifs even show a sharp increase from 2017 to 2018. Notably, motif 4-C represents an open structure, while the motifs that decline later are all of closed structure. This finding is consistent with the argument of Liu et al. [53]. Their study suggests that subgraphs without a triangular structure represent the least clustered and least efficient collaboration patterns. Motifs with closed structure usually show stronger resistance to external shocks. Therefore, the frequency of network motifs is generally positively related to the number of edges in the network. When the number of edges decreases, edges associated with motifs without closed structure are more likely to be reduced first. However, this pattern is not evident in the change trends of anti-motifs with three nodes or four nodes.
6.1.2. Network Clustering
The above results indicate that in certain years from 2011 to 2020, the average clustering coefficient of the innovation network is greater than 0.7, while in the remaining years, it is lower than 0.7. Overall, it shows a pattern of increase followed by decrease. Further analysis shows that subgraph 3-B, subgraph 4-C, subgraph 4-E, subgraph 4-F, and subgraph 4-D exhibit a similar trend. These motif types all contain closed structure. Therefore, the average clustering coefficient of the innovation network is related to the frequency of subgraphs that contain closed structure. A higher motif concentration of these subgraphs is associated with stronger overall network resilience.
Further analysis from the perspective of the change in average path length shows that the average path length of the network increases significantly after 2017. At the same time, the frequencies of almost all subgraphs show a declining trend after 2017. This pattern may be related to the view in previous studies that the trade conflict restricted technological innovation [54]. In addition, a greater number of subgraphs show a decline in 2018 compared with 2017. The average path length of the network increases to a greater extent in the same period. These results indicate that local network structure is closely related to the overall network characteristics.
6.1.3. Network Communities
From 2011 to 2020, the number of innovation actors and the number of network communities in the innovation network of the Integrated Circuit Industry increase gradually. However, the average number of nodes within communities shows a fluctuating pattern. This pattern indicates that the growth rates of innovation actors and network communities are not synchronized. From 2011 to 2014, the average number of nodes per community shows an increasing trend. This result indicates that the growth rate of innovation actors exceeds the growth rate of network communities. During the same period, the frequency of network subgraphs also shows an increasing trend. From 2018 to 2020, the average number of nodes per community shows a decreasing trend. This result indicates that the growth rate of innovation actors is lower than the growth rate of network communities. During the same period, most types of network subgraphs show a declining trend. Therefore, the frequency of network subgraphs may be related to the formation of network communities. When the frequency of network subgraphs decreases, this decline may contribute to the formation of new network communities.
6.1.4. Possible Explanations for the Declining Trend of Subgraphs Around 2018
What factors are associated with the declining trend of subgraphs around 2018? We consider three main explanations. The first involves policy-related factors, such as cyclical adjustments in China’s Integrated Circuit Industry policies, including the launch of the second phase of the national fund. The second involves industry-related factors, such as natural fluctuations in global semiconductor technological cycles. The third involves trade frictions.
Unlike domestic policies and technological cycles, which typically evolve gradually, trade frictions are characterized by their abrupt and disruptive nature. As discussed by Zhang et al. [55], geopolitical shocks such as the U.S.–China trade war are known to affect the semiconductor industry through export controls and supply chain disruptions. These shocks are inherently exogenous and discontinuous, which may propagate rapidly through key nodes and potentially induce short-term structural adjustments.
In contrast, domestic industrial policies typically operate over the long run, making them less likely to account for the sudden contraction observed around 2018. Similarly, technological cycles generally follow smoother evolutionary paths. While we cannot definitively isolate the impact of trade frictions from other confounding factors, the temporal alignment between the onset of trade tensions and the structural breakpoint in our network, combined with the heterogeneous responses of different motif types, suggests a potential association. This interpretation is further supported by Chen et al. [54], who found that the 2018 trade war was associated with a decline in technological innovation among Chinese ICT firms, even after controlling for major industrial policies. Therefore, we interpret the post-2018 structural shifts as being plausibly linked to the heightened external uncertainty driven by trade frictions. This interpretation is strengthened by the observation that policy adjustments are typically gradual and industry cycles may not precipitate such sudden structural breaks. In contrast, the timing and intensity of escalating trade frictions more closely align with the contractionary period, suggesting that trade frictions are a more direct and significant contributing factor.
6.2. Theoretical Contributions
This study makes several innovative contributions in the application scenarios of the motif identification method and in the exploration of collaboration patterns. These contributions provide useful references for future research.
First, this study extends the application boundary and explanatory power of network motifs analysis in socioeconomic innovation systems. Existing studies mainly apply network motifs to biological and ecological networks or transportation networks and other physical systems. For example, Tavella et al. [33] use motifs to identify key species in agricultural ecological networks. Shen et al. [34] conduct traffic pattern clustering based on motifs to alleviate congestion. These studies confirm the effectiveness of motifs in identifying local functional structures of systems. This study transfers this analytical framework to the field of innovation management. Using collaborative patent data of China’s Integrated Circuit Industry from 2011 to 2020, this study confirms that motif-based analysis is also suitable for capturing the micro collaboration patterns among innovation actors. Unlike previous studies that mainly focus on the global network topology of innovation networks, this study quantifies the statistical significance of three-node and four-node subgraphs. It shows that closed structure has higher statistical significance and stability than open structure in innovation networks. This finding extends motif theory from explaining structural stability in biological or physical systems to explaining the resilience mechanism of innovation networks. It provides empirical evidence for understanding the micro formation rules of innovation alliances.
Second, this study reveals the micro mechanism through which local network structure influences network resilience in innovation networks. It also compensates for the limitations of traditional community detection algorithms. Existing studies on innovation network structure often rely on the Louvain algorithm [37] or density-based clustering algorithms [38] to identify network communities. However, these methods mainly focus on community partition at the macro level. They cannot precisely capture the characteristics of local network structures with a fixed number of nodes or identify the statistical regularities of such structures. This study adopts a motif-based analysis method, which can accurately identify the connection patterns of innovation actors at the levels of three-node subgraphs and four-node subgraphs. Empirical results show that subgraphs containing closed triangular structures are identified as motifs. Their frequency decreases more slowly than that of anti-motifs with non-closed structure when facing external shocks. This finding indicates that closed triangular relationships in innovation networks are not only efficient channels for information transmission but also constitute the structural foundation for networks to resist external risks. This provides a new quantitative perspective for future research to evaluate innovation network resilience from the level of micro subgraph structures.
Third, this study reveals the shaping effect of the external institutional environment on the micro-structure of networks. The motif superfamily theory proposed by Milo et al. [51] suggests that systems with similar functions often share similar distributions of local network topology. However, the classification results of this study show that although China’s Integrated Circuit Industry innovation network from 2011 to 2020 belongs to the same industrial system and shares similar functional objectives, its subgraph ratio profiles lead to classification into three different motif families. In particular, after 2018, when the network was possibly affected by external shocks, its motif distribution pattern experienced a significant shift. This finding indicates that even within the same industry system, shocks from the external institutional environment can alter the generation rules of micro network structure. As a result, the network may belong to different motif families. This finding enriches the application context of motif superfamily theory in innovation systems. It also emphasizes that both technological logic and institutional environmental factors should be considered within a unified framework when analyzing the structural evolution of innovation networks.
6.3. Limitations and Future Research Directions
Although this study presents innovations in both research methods and research content, it still has several limitations that deserve further exploration. First, this study focuses only on China’s Integrated Circuit Industry as the research object. This focus may limit the generalizability of the findings. Future studies can extend the research scope to more countries and more industries in order to obtain more general conclusions.
Second, this study examines only three-node subgraphs and four-node subgraphs. Future research can identify subgraphs with larger numbers of nodes. This extension would allow further analysis of how subgraph structures with different numbers of nodes influence the overall network.
Third, this study mainly focuses on identifying structural patterns in the network. Future research may examine the empirical relationship between network subgraphs and network performance, including network resilience and network efficiency. Future research can combine firm-level survey data or more fine-grained product development records to directly examine the relationship between motif structures and time to market.
Finally, the link between the observed network changes and trade frictions proposed in this study should be understood as an inferential interpretation based on temporal patterns and theoretical reasoning, and readers should take into account the possible influence of other confounding factors. Existing studies provide supportive context. Zhang et al. [55] show that geopolitical shocks such as the U.S.–China trade war affect the semiconductor industry through export controls, transportation delays, and disruptions in key supply chain links, which are associated with reduced supply chain stability and resilience. Such discontinuous shocks are more closely related to short-term structural changes than gradual policy shifts or technological cycles. Chen et al. [54] find that the 2018 U.S.–China trade war is associated with a decline in technological innovation among Chinese ICT firms, and this relationship remains robust after controlling for major industrial policies such as Made in China 2025. In addition, our results show that the timing of structural changes in the network is highly consistent with the onset of the 2018 trade frictions, and that the heterogeneous responses across different motif types align with theoretical expectations. Nevertheless, we acknowledge an important limitation. This study does not construct a counterfactual framework to directly quantify the net effect of trade policies. Network evolution may also be jointly shaped by domestic industrial policy adjustments and global technological cycles. Future research may use quasi-experimental designs such as synthetic control methods or DID models to more rigorously identify the causal impact of external shocks on the micro-level structure of innovation networks.
6.4. Economic Implications and Organizational Significance of Motif Structures
In this section, we discuss how different motifs reflect different collaboration mechanisms among firms, universities, and research institutions in the Integrated Circuit innovation ecosystem.
First, we examine the organizational implications of motifs, especially their roles in trust formation and collaborative innovation. We analyze motifs characterized by closed triangular structures, such as 3-B, 4-C, 4-E, and 4-F, and interpreted their organizational forms in the Integrated Circuit Industry. These structures represent strong tie alliances among innovation actors. In a highly complex and fast-evolving industry that relies heavily on tacit knowledge, closed structures help build mutual trust, reduce communication costs, and limit opportunistic behavior. For example, a closed triangle formed by a university, a research institute, and a leading firm often reflects an integrated collaboration system that connects basic research, applied development, and commercialization. Fully connected four-node motifs such as 4-F often appear in tightly coordinated industrial clusters, including cooperation among design, manufacturing, packaging, and equipment firms. These structures indicate a high level of coordinated innovation, where actors are linked through long-term contracts or equity relationships and jointly respond to technological uncertainty and market fluctuations.
Second, we interpret the economic meaning of anti-motifs. We analyze star and chain structures, such as 3-A, 4-A, and 4-B, from the perspectives of resource dependence and structural holes. These structures are typically organized around a central hub with strong resource-mobilizing capacity, such as a leading firm or a top university, while peripheral actors are connected only to the center and remain disconnected from each other. This reflects a core-periphery dependency pattern or a situation where the central actor occupies a structural hole and serves as an exclusive intermediary for resource allocation and knowledge transfer [36]. From a transaction cost perspective, this structure allows rapid expansion of collaboration networks at low cost in the early stage of industry development and provides flexibility. However, it is also structurally fragile. Once the central node is disrupted or cooperation is interrupted, the entire subnetwork becomes unstable. This pattern is consistent with the sharper decline of open structures observed after 2018.
Third, we discuss the dynamic adaptation mechanism behind motif evolution. Based on the temporal analysis, we further examine the shift from open-dominant to closed-dominant structures. We propose that the relative increase in closed motifs after 2018 reflects a defensive alliance strategy adopted by innovation actors under heightened external uncertainty. When global supply chains become unstable and international collaboration risks increase, firms and research institutions tend to reduce broad weak-tie connections and move toward more stable and trust-based collaborations. This shift helps ensure technological control and supply chain security. The observed structural change suggests a transition in the innovation pattern of China’s Integrated Circuit Industry from outward-oriented resource integration to a more internally coordinated mode of collaboration.
6.5. Dynamic Evolution of Motifs Under External Shocks: Real-World Urgency
Our results identify 2018 as a structural breakpoint in network evolution. Based on the preceding analysis, we interpret this breakpoint as being plausibly associated with the escalation of trade frictions. This period is also linked to subsequent technology export controls targeting China’s Integrated Circuit Industry. We then examine how such external shocks are associated with changes in motif distribution.
First, anti-motifs show a rapid decline. The results indicate that open subgraphs characterized by star-shaped structures, such as 4-A and 4-B, experience the most pronounced decrease after 2018. These structures rely heavily on external connections of central nodes. When supply chains are disrupted or international collaboration becomes constrained, their single-point dependence makes them more vulnerable. This pattern is consistent with the weakening of loosely connected external collaboration ties under external pressure.
Second, motifs show relatively stronger stability. Subgraphs containing closed triangles, such as 3-B, 4-C, and 4-F, also decline in absolute terms. However, their rate of decrease is slower than that of open structures, and their relative concentration increases. This pattern can be interpreted as a defensive adjustment. Under increased uncertainty, innovation actors appear to shift from broad open collaboration toward more localized and trust-based cooperation. Closed structures provide multiple alternative paths and built-in redundancy, which are associated with greater stability under external shocks.
This shift from open expansion to more closed and cohesive structures can be interpreted as a potential adaptive response to external constraints, rather than solely endogenous evolution. It suggests that China’s Integrated Circuit Industry may be undergoing a process of structural adjustment under external pressure. However, While closed structures are associated with short-term resilience, excessive closure over time might lead to reduced knowledge diversity and innovation potential. Thus, our findings highlight a correlation between heightened external uncertainty and a tendency toward more trust-based, closed collaborations, which offers a plausible narrative for the observed structural resilience.
6.6. Link Between Motif Distribution and Innovation Performance
We used annual collaborative patents per actor as a proxy for innovation output efficiency, and calculated the global efficiency of the network as a structural proxy for information transmission. The results show that the Z-scores of closed triangular motifs such as Motif 3-B and related four-node motifs are positively associated with these performance indicators. Specifically, in years with a higher proportion of closed motifs, such as 2014 to 2017, the network exhibits higher global efficiency and maintains a relatively high level of per-actor patent output. In contrast, in the period after 2018, as the proportion of open anti-motifs increases and closed motifs decline, network efficiency is lower and the growth of per-actor output becomes slower. These findings are consistent with the view that closed structures are associated with higher innovation efficiency.
From a theoretical perspective, prior studies [35,36] suggest that closed triangular structures facilitate multi-party trust, promote the flow of tacit knowledge, and reduce opportunistic behavior. These mechanisms are associated with lower communication costs and shorter coordination time in multi-actor collaboration. At the mechanism level, this provides a structural basis that is consistent with faster joint research and development processes and product development. From the perspective of empirical scope and boundary conditions, although product development speed cannot be directly measured, frequent closed triangular structures are associated with a low-friction and high-trust collaboration environment. Such an environment is theoretically consistent with more efficient joint development of complex technologies such as integrated circuits.
To intuitively demonstrate the link between micro-structural motifs and macro-level innovation performance, we calculated the “Annual collaborative patents per actor” (Total Collaborative Patents/Number of Innovation Actors) as a proxy for innovation efficiency. We aligned this metric with the absolute frequency of the core closed motif (Subgraph 4-C) and the average path length (as a proxy for information friction).
Table 7 presents the association between closed motifs and innovation output efficiency from 2011 to 2020. The overall trend in the data suggests a strong association between structural cohesion and innovation efficiency. As shown in Table 7, during 2014–2017, the network maintained high innovation efficiency—exceeding 2.5 patents per actor—alongside a peak presence of closed motifs (4-C). For instance, in 2017, the frequency of Motif 4-C reached its maximum, corresponding to a robust innovation efficiency of 2.56. Following external shocks in 2018 associated with trade frictions, the sharp decline in closed motifs corresponds closely to a significant drop in innovation efficiency, from 2.36 in 2018 to 1.62 in 2020. This decline is accompanied by an increase in average path length from 3.929 to 4.321, indicating higher communication friction. This empirical evidence provides strong support for the argument that closed motifs are not merely structural artifacts but functional units that sustain innovation output and mitigate the negative impacts of external shocks by reducing information friction and enhancing trust-based collaboration.
Table 7.
The association between closed motifs and innovation output efficiency.
6.7. Policy Implications
Based on the motif analysis, we classify innovation clusters into two typical types, namely lagging clusters and leading clusters. Lagging clusters are characterized by the dominance of anti-motifs, such as 3-A and 4-A. The network tends to exhibit loose star or chain structures and lacks closed triangles. These clusters may expand rapidly, but they are associated with weak trust mechanisms, fragile collaboration, and lower resilience to external shocks. Leading clusters are characterized by a high frequency of motifs such as 3-B, 4-C, and 4-F. The network contains many closed triangles and fully connected subgraphs. These clusters are associated with stronger internal collaboration and higher resilience, but they may face the risk of over-embeddedness, which can lead to information homogeneity and path dependence.
For lagging clusters, we propose a strategy of promoting closure. The policy focus should be on bridging structural holes and strengthening trust among actors. Rather than only attracting leading firms as central nodes, policymakers can facilitate collaboration platforms among firms, universities, and research institutions, and support joint research programs. Such measures can encourage horizontal collaboration among previously disconnected actors and increase the frequency of closed triangular structures. This is associated with stronger trust foundations, higher resilience under uncertainty, and improved innovation efficiency.
For leading clusters, we propose a strategy of expanding boundaries. The policy focus should be on introducing heterogeneous resources and avoiding excessive internal lock-in. For clusters with highly closed structures, dense internal ties may limit exposure to new knowledge. Policy measures can encourage actors to establish connections across regions, industries, and international contexts. From the perspective of structural holes theory, such connections can introduce new knowledge and technological approaches and support continued adaptation.
More importantly, policy designers should adopt a dynamic perspective. In the early stage of cluster development, promoting closure may help stabilize collaboration and build resilience. As clusters mature, the focus can shift toward expanding boundaries to support innovation and renewal.
7. Conclusions
This study applies the network motif identification method to analyze the local structures of three-node and four-node subgraphs in the innovation network of China’s Integrated Circuit Industry. The analysis is conducted from several perspectives: the collaboration patterns in the network and their evolution, the distribution of collaboration patterns, and the relationship between network motifs and network structural indicators. The study draws the following conclusions.
First, regarding collaboration patterns and their evolution, two main findings emerge. Among the three-node and four-node subgraphs in the Integrated Circuit Industry network, subgraphs with closed structures are generally identified as motifs, while those without closed structures are identified as anti-motifs. However, transitions between anti-motifs and motifs can also occur. Moreover, during the last three years of the study period, the numbers of most network subgraph types show a declining trend. This decline might be associated with external shocks. Nevertheless, the rate and magnitude of the decrease in motif counts are generally lower than those of anti-motifs, indicating that motifs with closed structures typically exhibit stronger network stability.
We infer that subgraph frequencies show a declining trend around 2018, which may be associated with the U.S.–China trade conflict. We also considered alternative explanations, including domestic policy factors such as cyclical adjustments in China’s Integrated Circuit Industry policies and industrial factors such as global technological cycles in the semiconductor industry. However, both prior studies [54,55] and our findings suggest that trade frictions may be more closely related to the structural contraction observed around 2018. Domestic policies are generally associated with long-term network expansion, while technological cycles tend to follow smooth evolutionary patterns. These patterns appear less consistent with the heterogeneous responses observed across different network structures, such as closed versus open structures.
Second, regarding the distribution of collaboration patterns in the innovation network, the Integrated Circuit innovation networks from 2011 to 2020 belong to the same innovation system and therefore share similar bottom-up structural formation rules. However, they exhibit three different types of collaboration pattern distributions, corresponding to three superfamilies. This finding suggests that even systems of the same type may possess different subgraph ratio profiles and thus belong to different superfamilies. At the same time, a single superfamily may correspond to one or multiple subgraph concentration distribution patterns.
Finally, regarding the relationship between network motifs and network structural indicators, several correlations can be observed between motifs and basic network characteristics. When the network is affected by external shocks that reduce the number of links, the number of network motifs tends to decline accordingly. In particular, anti-motifs—those without closed structures—tend to decrease first. Meanwhile, the clustering level of the innovation network is largely influenced by the presence of closed subgraphs within the network. The formation of network communities is also influenced to some extent by the distribution of subgraphs. Therefore, adjusting the number and structure of network subgraphs may serve as a way to influence the overall performance of innovation networks.
Author Contributions
Conceptualization, X.G. and L.L.; Methodology, X.G. and L.L.; Formal Analysis, X.G. and Z.W.; Data Curation, X.G. and L.L.; Writing—Original Draft Preparation, X.G. and L.L.; Writing—Review and Editing, Z.W., H.Z.; Funding Acquisition, Z.W. and H.Z. All authors have read and agreed to the published version of the manuscript.
Funding
This research was funded by the Project of Cultivation for young top-notch Talents of Beijing Municipal Institutions, grant number BPHR202203237, the General Project of China Postdoctoral Science Foundation, grant number 2025M770691, and the Ministry of Education Philosophy and Social Sciences Innovation Team for Complex System Modeling in Economic Management in the Digital-Intelligence Era at the University of Chinese Academy of Sciences.
Data Availability Statement
The data that support the findings of this study are available from the Incopat databases. Restrictions apply to the availability of these data, which were used under license for this study. Data are available from the authors with the permission of the Incopat databases.
Conflicts of Interest
The authors declare no conflicts of interest.
References
- Xia, F.; Wang, W.; Bekele, T.M.; Liu, H. Big scholarly data: A survey. IEEE Trans. Big Data 2017, 3, 18–35. [Google Scholar] [CrossRef] [Scilit]
- Su, X.; Wang, W.; Yu, S.; Zhang, C.; Bekele, T.M.; Xia, F. Can academic conferences promote research collaboration? In Proceedings of the 16th ACM/IEEE-CS on Joint Conference on Digital Libraries, Newark, NJ, USA, 19–23 June 2016; pp. 231–232. [Google Scholar]
- Yuan, X.; Hu, Y.; Stanley, H.E.; Havlin, S. Eradicating catastrophic collapse in interdependent networks via reinforced nodes. Proc. Natl. Acad. Sci. USA 2017, 114, 3311–3315. [Google Scholar] [CrossRef] [Scilit]
- Cavallaro, L.; Costantini, S.; De Meo, P.; Liotta, A.; Stilo, G. Network connectivity under a probabilistic node failure model. IEEE Trans. Netw. Sci. Eng. 2022, 9, 2463–2480. [Google Scholar] [CrossRef] [Scilit]
- Watts, D.J.; Strogatz, S.H. Collective dynamics of ‘small-world’ networks. Nature 1998, 393, 440–442. [Google Scholar] [CrossRef] [Scilit] [PubMed]
- Barabási, A.-L.; Albert, R. Emergence of scaling in random networks. Science 1999, 286, 509–512. [Google Scholar] [CrossRef] [Scilit]
- Strogatz, S.H. Exploring complex networks. Nature 2001, 410, 268–276. [Google Scholar] [CrossRef] [Scilit]
- Dey, A.K.; Gel, Y.R.; Poor, H.V. What network motifs tell us about resilience and reliability of complex networks. Proc. Natl. Acad. Sci. USA 2019, 116, 19368–19373. [Google Scholar] [CrossRef] [Scilit]
- Eom, Y.-H.; Lee, S.; Jeong, H. Exploring local structural organization of metabolic networks using subgraph patterns. J. Theor. Biol. 2006, 241, 823–829. [Google Scholar] [CrossRef] [Scilit] [PubMed]
- Ravasz, E.; Somera, A.L.; Mongru, D.A.; Oltvai, Z.N.; Barabási, A.-L. Hierarchical organization of modularity in metabolic networks. Science 2002, 297, 1551–1555. [Google Scholar] [CrossRef] [Scilit]
- Guimera, R.; Nunes Amaral, L.A. Functional cartography of complex metabolic networks. Nature 2005, 433, 895–900. [Google Scholar] [CrossRef] [Scilit]
- Chen, P.-Y.; Hero, A.O., III. Universal phase transition in community detectability under a stochastic block model. Phys. Rev. E 2015, 91, 032804. [Google Scholar] [CrossRef] [Scilit] [PubMed]
- Yang, J.; Leskovec, J. Overlapping communities explain core–periphery organization of networks. Proc. IEEE 2014, 102, 1892–1902. [Google Scholar] [CrossRef] [Scilit]
- Magnani, M.; Hanteer, O.; Interdonato, R.; Rossi, L.; Tagarelli, A. Community detection in multiplex networks. ACM Comput. Surv. 2021, 54, 48. [Google Scholar] [CrossRef] [Scilit]
- Yu, S.; Feng, Y.; Zhang, D.; Bedru, H.D.; Xu, B.; Xia, F. Motif discovery in networks: A survey. Comput. Sci. Rev. 2020, 37, 100267. [Google Scholar] [CrossRef] [Scilit]
- Tran, N.T.L.; Mohan, S.; Xu, Z.; Huang, C.-H. Current innovations and future challenges of network motif detection. Brief. Bioinform. 2015, 16, 497–525. [Google Scholar]
- Oltvai, Z.N.; Barabási, A.-L. Life’s complexity pyramid. Science 2002, 298, 763–764. [Google Scholar] [CrossRef] [Scilit] [PubMed]
- Palla, G.; Derényi, I.; Farkas, I.; Vicsek, T. Uncovering the overlapping community structure of complex networks in nature and society. Nature 2005, 435, 814–818. [Google Scholar] [CrossRef] [Scilit] [PubMed]
- Dong, G.; Fan, J.; Shekhtman, L.M.; Shai, S.; Du, R.; Tian, L.; Chen, X.; Stanley, H.E.; Havlin, S. Resilience of networks with community structure behaves as if under an external field. Proc. Natl. Acad. Sci. USA 2018, 115, 6911–6915. [Google Scholar] [CrossRef] [Scilit]
- Oakey, R.P. Open innovation and its relevance to industrial research and development: The case of high-technology small firms. Int. Small Bus. J. 2013, 31, 319–336. [Google Scholar] [CrossRef] [Scilit]
- Nishimura, J.; Okamuro, H. Subsidy and networking: The effects of direct and indirect support programs of the cluster policy. Res. Policy 2011, 40, 714–727. [Google Scholar] [CrossRef] [Scilit]
- Liu, C.; Li, L.; Lu, K. Adapting under pressure: Resilience characteristics and evolution dynamics of innovation networks in China’s integrated circuit industry. Technol. Anal. Strateg. Manag. 2025, 1–16. [Google Scholar] [CrossRef] [Scilit]
- Chang, S.; Yang, X.; Hu, B. Evolution of the collaborative innovation network in China’s integrated circuit industry: A hypernetwork analysis. Technol. Anal. Strateg. Manag. 2025, 37, 4253–4269. [Google Scholar]
- Chen, Q.; Sun, T.; Wang, T. Network centrality, support organizations, exploratory innovation: Empirical analysis of China’s integrated circuit industry. Heliyon 2023, 9, e17709. [Google Scholar]
- Liu, Z.; Di, K.; Xu, R. Evolution of green collaborative innovation networks and their formation mechanisms: Evidence from high-end equipment manufacturing industry in Bohai Rim region, China. Environ. Dev. Sustain. 2025, 1–23. [Google Scholar] [CrossRef] [Scilit]
- Wang, F.; Cheng, M. How does the collaborative innovation network in construction industry evolve? Evidence from China. J. Civ. Eng. Manag. 2025, 31, 97–112. [Google Scholar] [CrossRef] [Scilit]
- Ning, X.; Tang, Y. Unraveling the evolution of collaborative innovation networks in megaprojects: Evidence from China. J. Constr. Eng. Manag. 2026, 152, 04026047. [Google Scholar] [CrossRef] [Scilit]
- Liu, Q.; Chen, R.; Gao, Q.; Yue, W. Improving sustainable development performance of new energy industry through green innovation network evolution empowered by digitalization: Based on temporal exponential random graph model. Energy Convers. Manag. 2025, 324, 119253. [Google Scholar] [CrossRef] [Scilit]
- Liu, Z.; Tang, T.; Pan, J.; Han, G. Anatomizing resilience: The multi-dimensional evolution and drivers of regional collaborative innovation networks. Systems 2025, 13, 1017. [Google Scholar] [CrossRef] [Scilit]
- Cheng, C.-Y.; Huang, C.-Y.; Sun, C.-T. Mining bridge and brick motifs from complex biological networks for functionally and statistically significant discovery. IEEE Trans. Syst. Man Cybern. Part B (Cybern.) 2008, 38, 17–24. [Google Scholar] [CrossRef] [Scilit] [PubMed]
- Wang, P.; Lui, J.C.; Ribeiro, B.; Towsley, D.; Zhao, J.; Guan, X. Efficiently estimating motif statistics of large networks. ACM Trans. Knowl. Discov. Data 2014, 9, 8. [Google Scholar] [CrossRef] [Scilit]
- Park, S.; Zhong, R.R. Pattern recognition of travel mobility in a city destination: Application of network motif analytics. J. Travel Res. 2022, 61, 1201–1216. [Google Scholar] [CrossRef] [Scilit]
- Tavella, J.; Windsor, F.M.; Rother, D.C.; Evans, D.M.; Guimaraes, P.R., Jr.; Palacios, T.P.; Lois, M.; Devoto, M. Using motifs in ecological networks to identify the role of plants in crop margins for multiple agriculture functions. Agric. Ecosyst. Environ. 2022, 331, 107912. [Google Scholar] [CrossRef] [Scilit]
- Shen, G.; Zhu, D.; Chen, J.; Kong, X. Motif discovery based traffic pattern mining in attributed road networks. Knowl.-Based Syst. 2022, 250, 109035. [Google Scholar] [CrossRef] [Scilit]
- Xu, X.; Huang, Y.; Lai, Q.; Feng, C. Testing the stakeholders’ partnership in a tourism waste management network: An ERGM approach. Environ. Sci. Pollut. Res. 2023, 30, 15335–15351. [Google Scholar] [CrossRef] [Scilit] [PubMed]
- Li, H.Y.; Liu, Q.; Ye, H.Z. Digital development influencing mechanism on green innovation performance: A perspective of green innovation network. IEEE Access 2023, 11, 22490–22504. [Google Scholar] [CrossRef] [Scilit]
- Blondel, V.D.; Guillaume, J.-L.; Lambiotte, R.; Lefebvre, E. Fast unfolding of communities in large networks. J. Stat. Mech. Theory Exp. 2008, 2008, P10008. [Google Scholar] [CrossRef] [Scilit]
- Rodriguez, A.; Laio, A. Clustering by fast search and find of density peaks. Science 2014, 344, 1492–1496. [Google Scholar] [CrossRef] [Scilit]
- Baggio, R. Network science and tourism–the state of the art. Tour. Rev. 2017, 72, 120–131. [Google Scholar] [CrossRef] [Scilit]
- Acemoglu, D.; Akcigit, U.; Kerr, W.R. Innovation network. Proc. Natl. Acad. Sci. USA 2016, 113, 11483–11488. [Google Scholar] [CrossRef] [Scilit]
- Zhang, Z.; Luo, T. Network capital, exploitative and exploratory innovations—From the perspective of network dynamics. Technol. Forecast. Soc. Change 2020, 152, 119910. [Google Scholar] [CrossRef] [Scilit]
- Stone, L.; Simberloff, D.; Artzy-Randrup, Y. Network motifs and their origins. PLoS Comput. Biol. 2019, 15, e1006749. [Google Scholar]
- Opsahl, T.; Panzarasa, P. Clustering in weighted networks. Soc. Netw. 2009, 31, 155–163. [Google Scholar] [CrossRef] [Scilit]
- Wang, X.; Yang, J.; Zhao, Y.; Jia, X.; Yin, R.; Chen, X.; Qu, G.; Zhao, W. Triangle counting accelerations: From algorithm to in-memory computing architecture. IEEE Trans. Comput. 2021, 71, 2462–2472. [Google Scholar] [CrossRef] [Scilit]
- Ahuja, G. Collaboration networks, structural holes, and innovation: A longitudinal study. Adm. Sci. Q. 2000, 45, 425–455. [Google Scholar] [CrossRef] [Scilit]
- Milo, R.; Kashtan, N.; Itzkovitz, S.; Newman, M.E.; Alon, U. On the uniform generation of random graphs with prescribed degree sequences. arXiv 2003, arXiv:cond-mat/0312028. [Google Scholar] [CrossRef] [Scilit]
- Sporns, O.; Kötter, R. Motifs in brain networks. PLoS Biol. 2004, 2, e369. [Google Scholar] [CrossRef] [Scilit] [PubMed]
- Milo, R.; Shen-Orr, S.; Itzkovitz, S.; Kashtan, N.; Chklovskii, D.; Alon, U. Network motifs: Simple building blocks of complex networks. Science 2002, 298, 824–827. [Google Scholar] [CrossRef] [Scilit]
- Chung, S.-H. Applications of smart technologies in logistics and transport: A review. Transp. Res. Part E Logist. Transp. Rev. 2021, 153, 102455. [Google Scholar] [CrossRef] [Scilit]
- Wei, N.; Xie, W.-J.; Zhou, W.-X. The performance of cooperation strategies for enhancing the efficiency of international oil trade networks. J. Complex Netw. 2022, 10, cnab053. [Google Scholar] [CrossRef] [Scilit]
- Milo, R.; Itzkovitz, S.; Kashtan, N.; Levitt, R.; Shen-Orr, S.; Ayzenshtat, I.; Sheffer, M.; Alon, U. Superfamilies of evolved and designed networks. Science 2004, 303, 1538–1542. [Google Scholar] [CrossRef] [Scilit]
- Xu, X.; Zhang, J.; Small, M. Superfamily phenomena and motifs of networks induced from time series. Proc. Natl. Acad. Sci. USA 2008, 105, 19601–19605. [Google Scholar] [CrossRef] [Scilit] [PubMed]
- Liu, L.; Zhao, M.; Fu, L.; Cao, J. Unraveling local relationship patterns in project networks: A network motif approach. Int. J. Proj. Manag. 2021, 39, 437–448. [Google Scholar] [CrossRef] [Scilit]
- Chen, Y.; Zhang, S.; Miao, J. The negative effects of the US-China trade war on innovation: Evidence from the Chinese ICT industry. Technovation 2023, 123, 102734. [Google Scholar] [CrossRef] [Scilit]
- Zhang, X.; Bai, S.; Goh, M.; Guo, Y. Climate and geopolitical risk correlations and response decisions for semiconductor global supply chains. Comput. Ind. Eng. 2024, 194, 110358. [Google Scholar] [CrossRef] [Scilit]
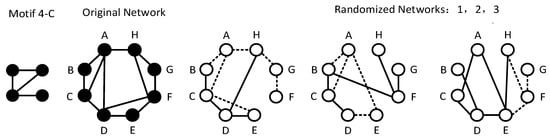
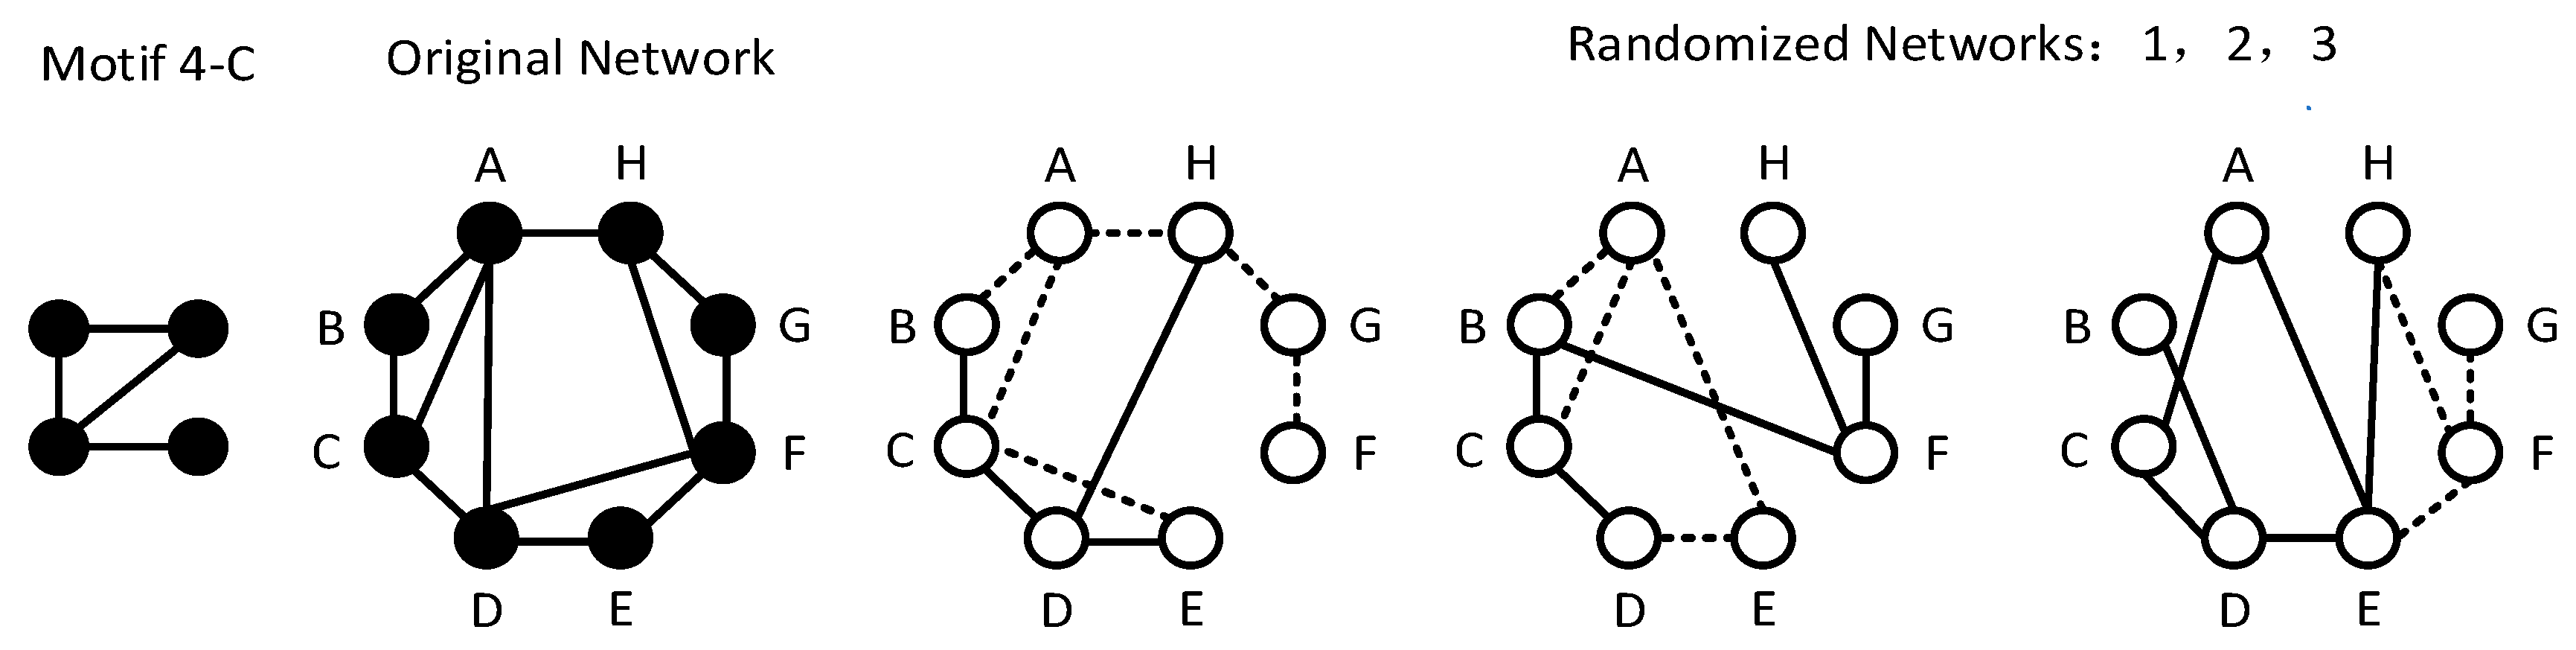
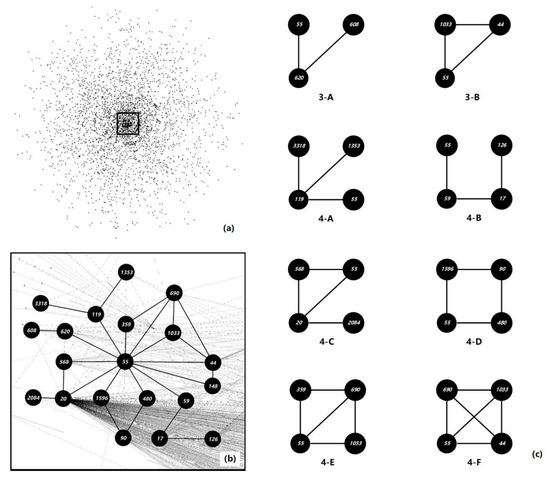
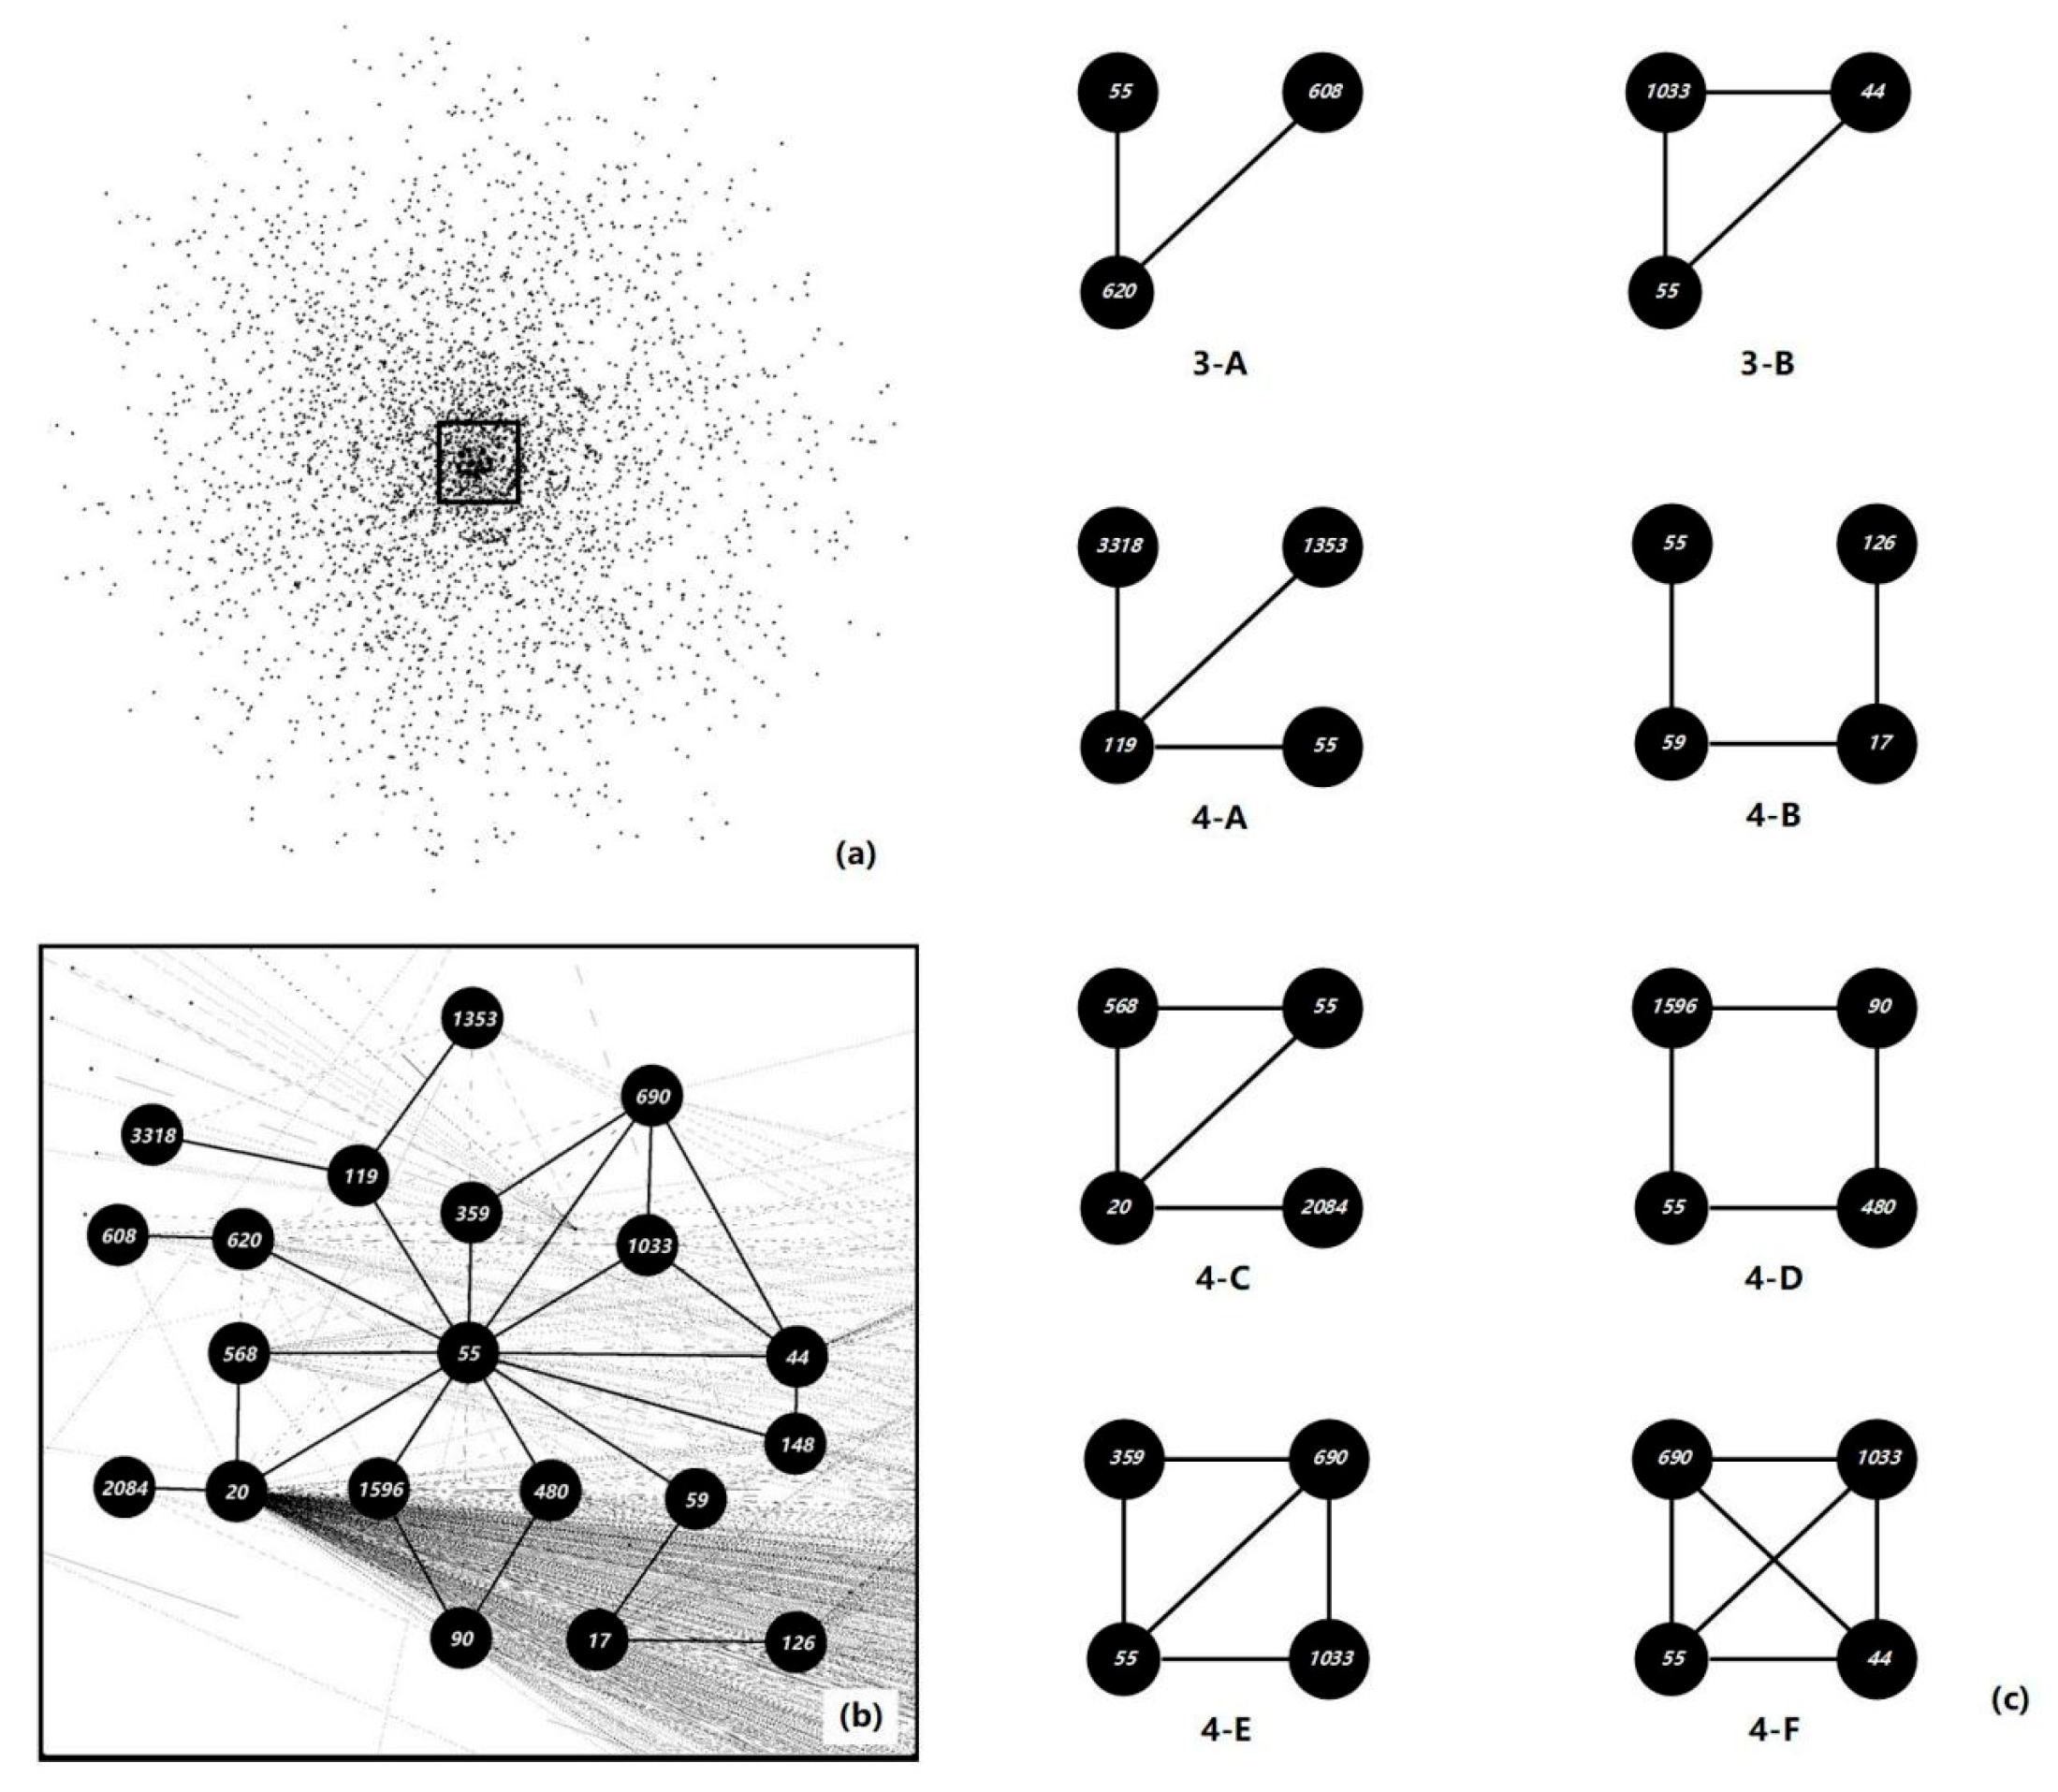
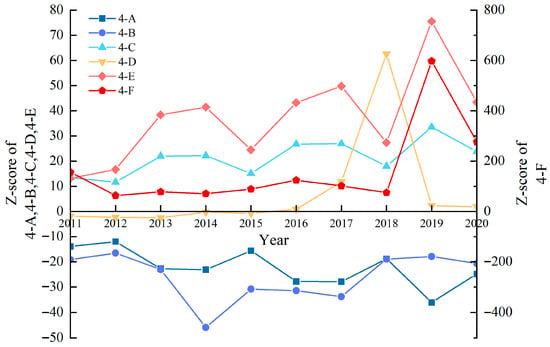
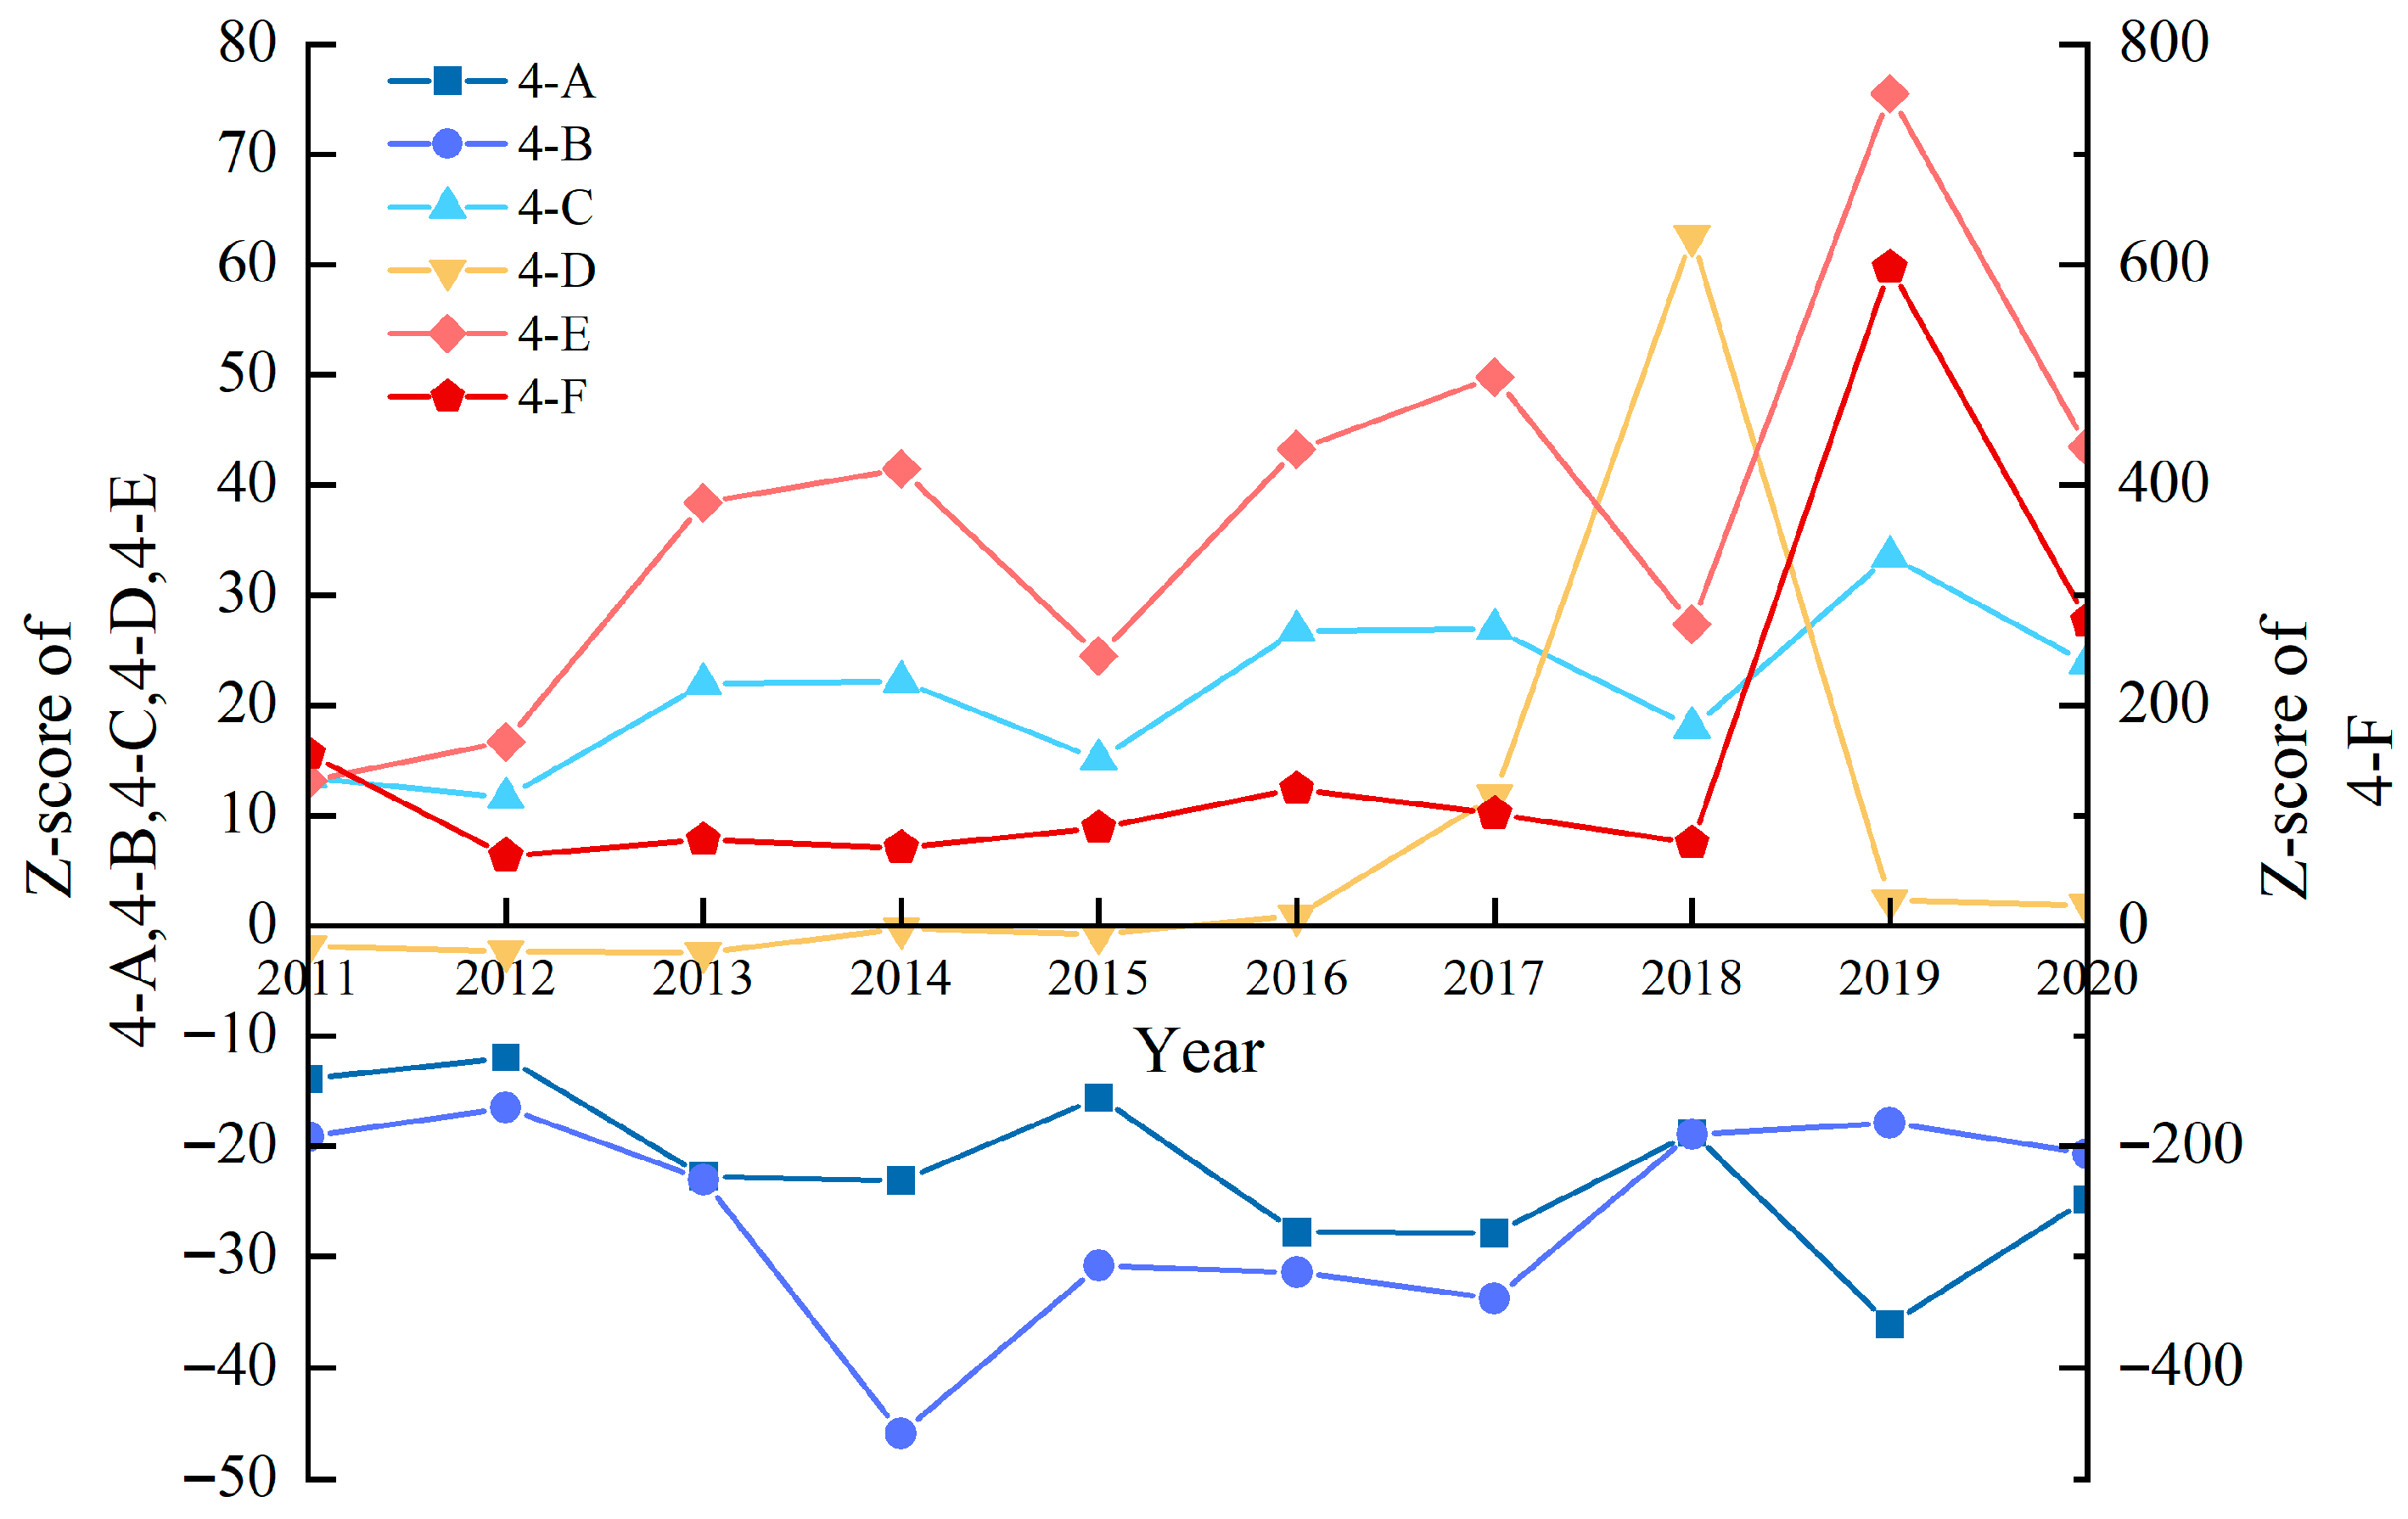
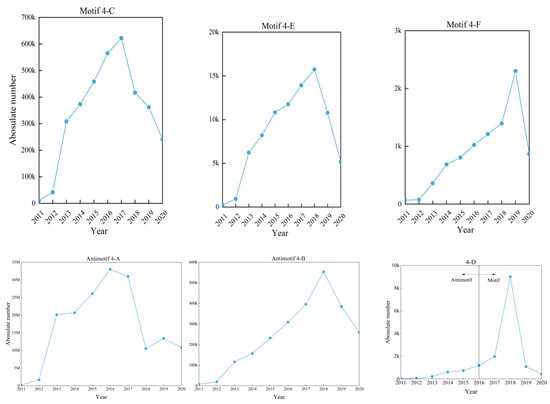
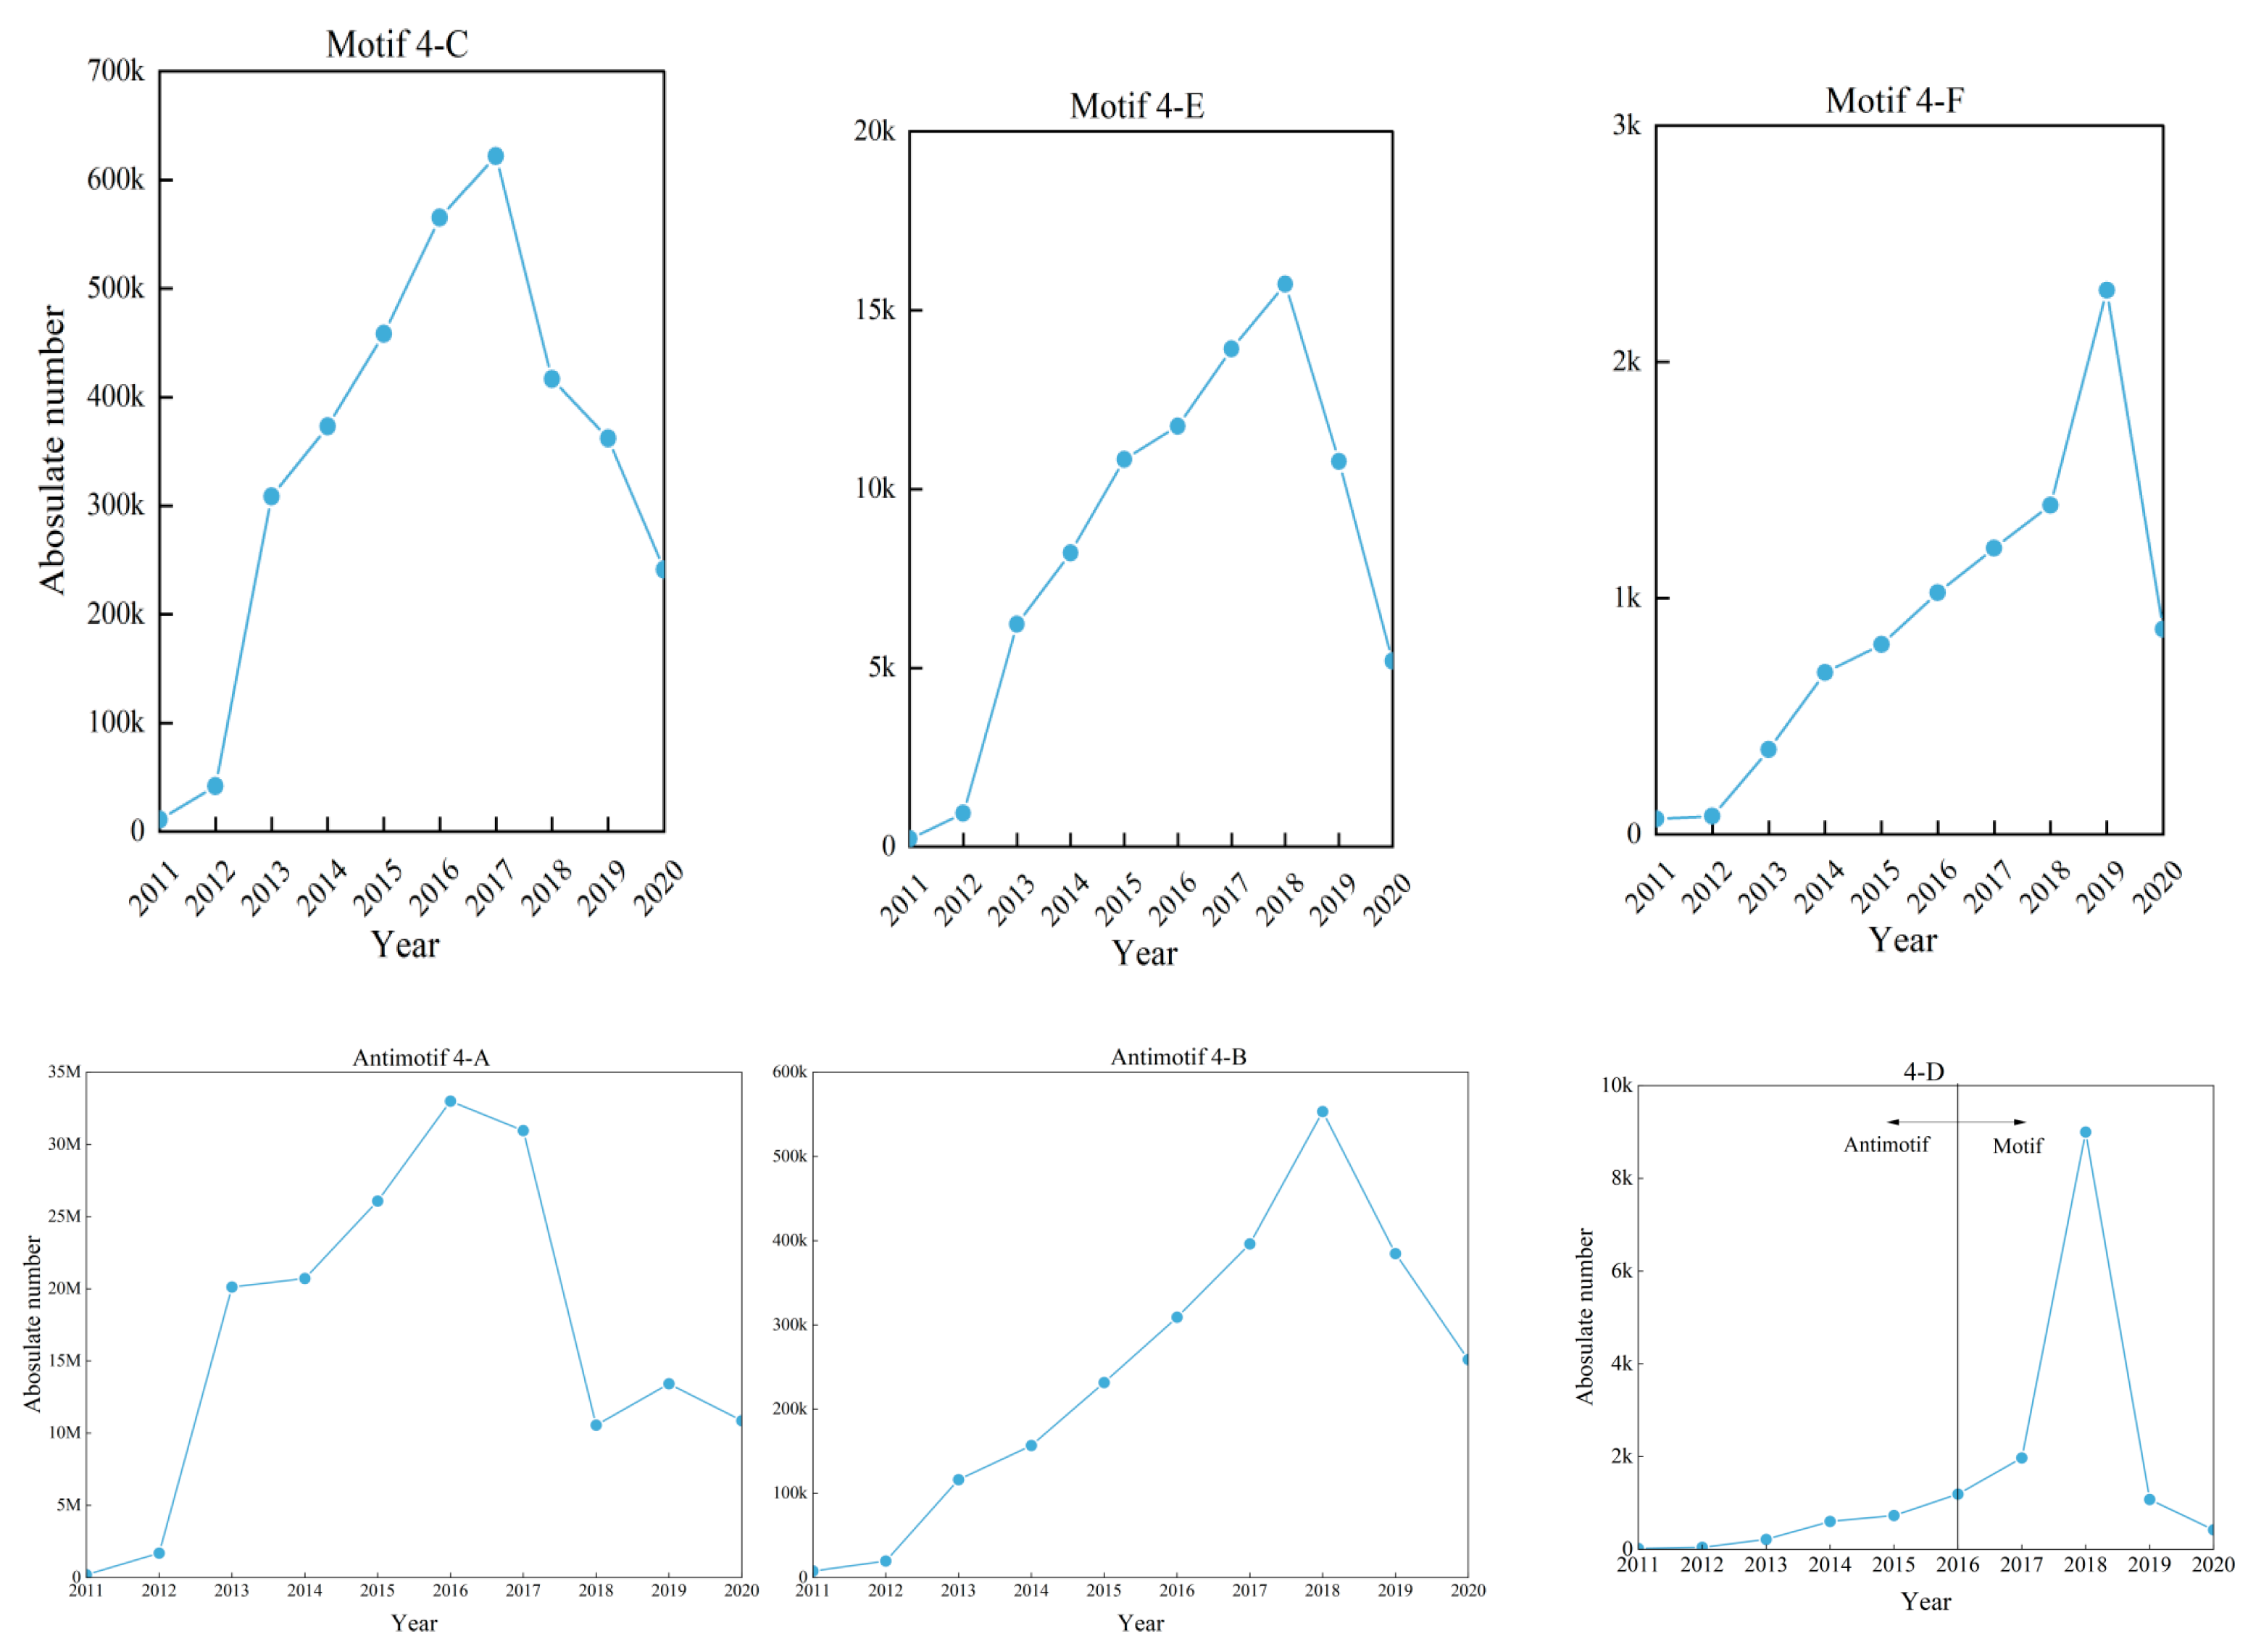
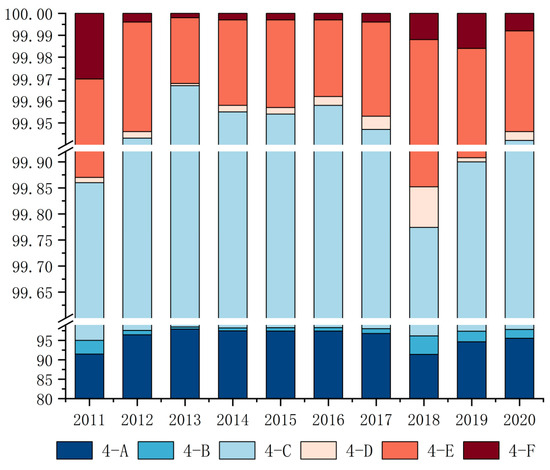
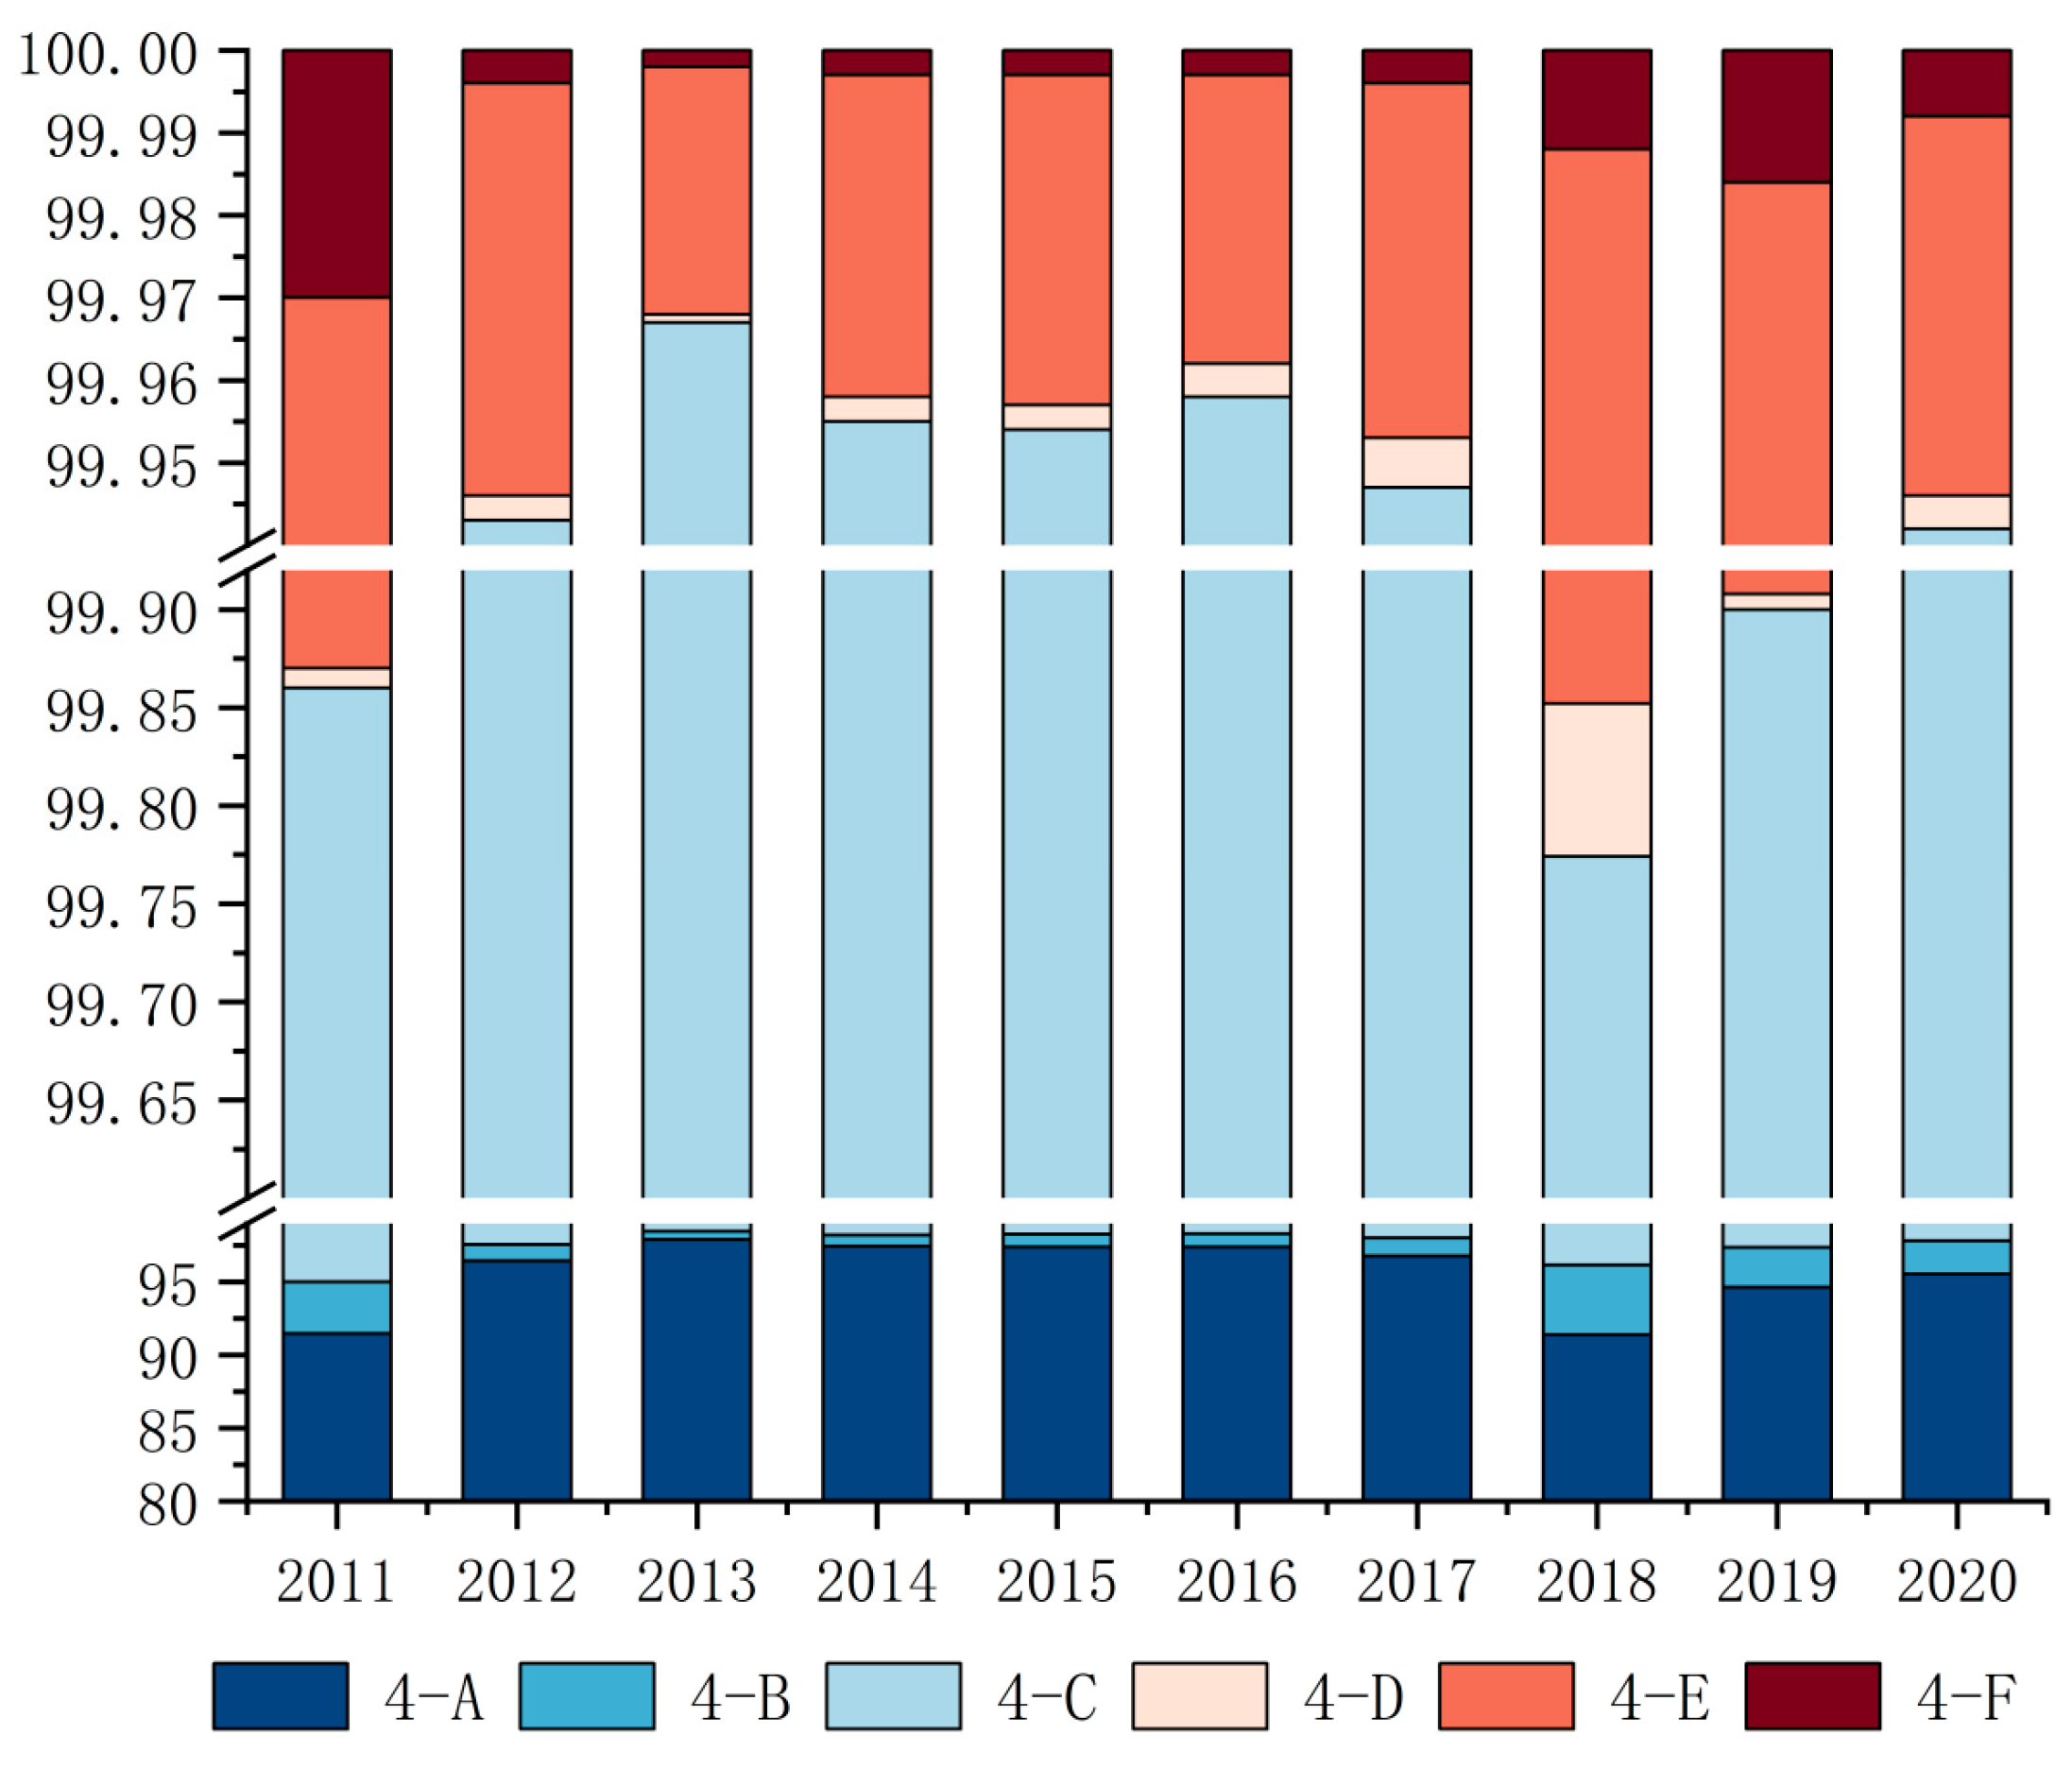
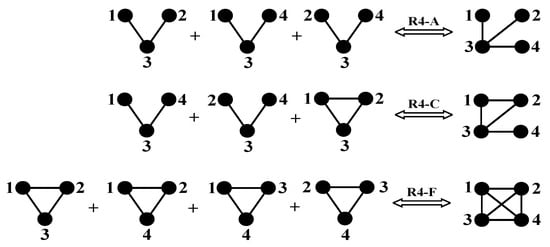
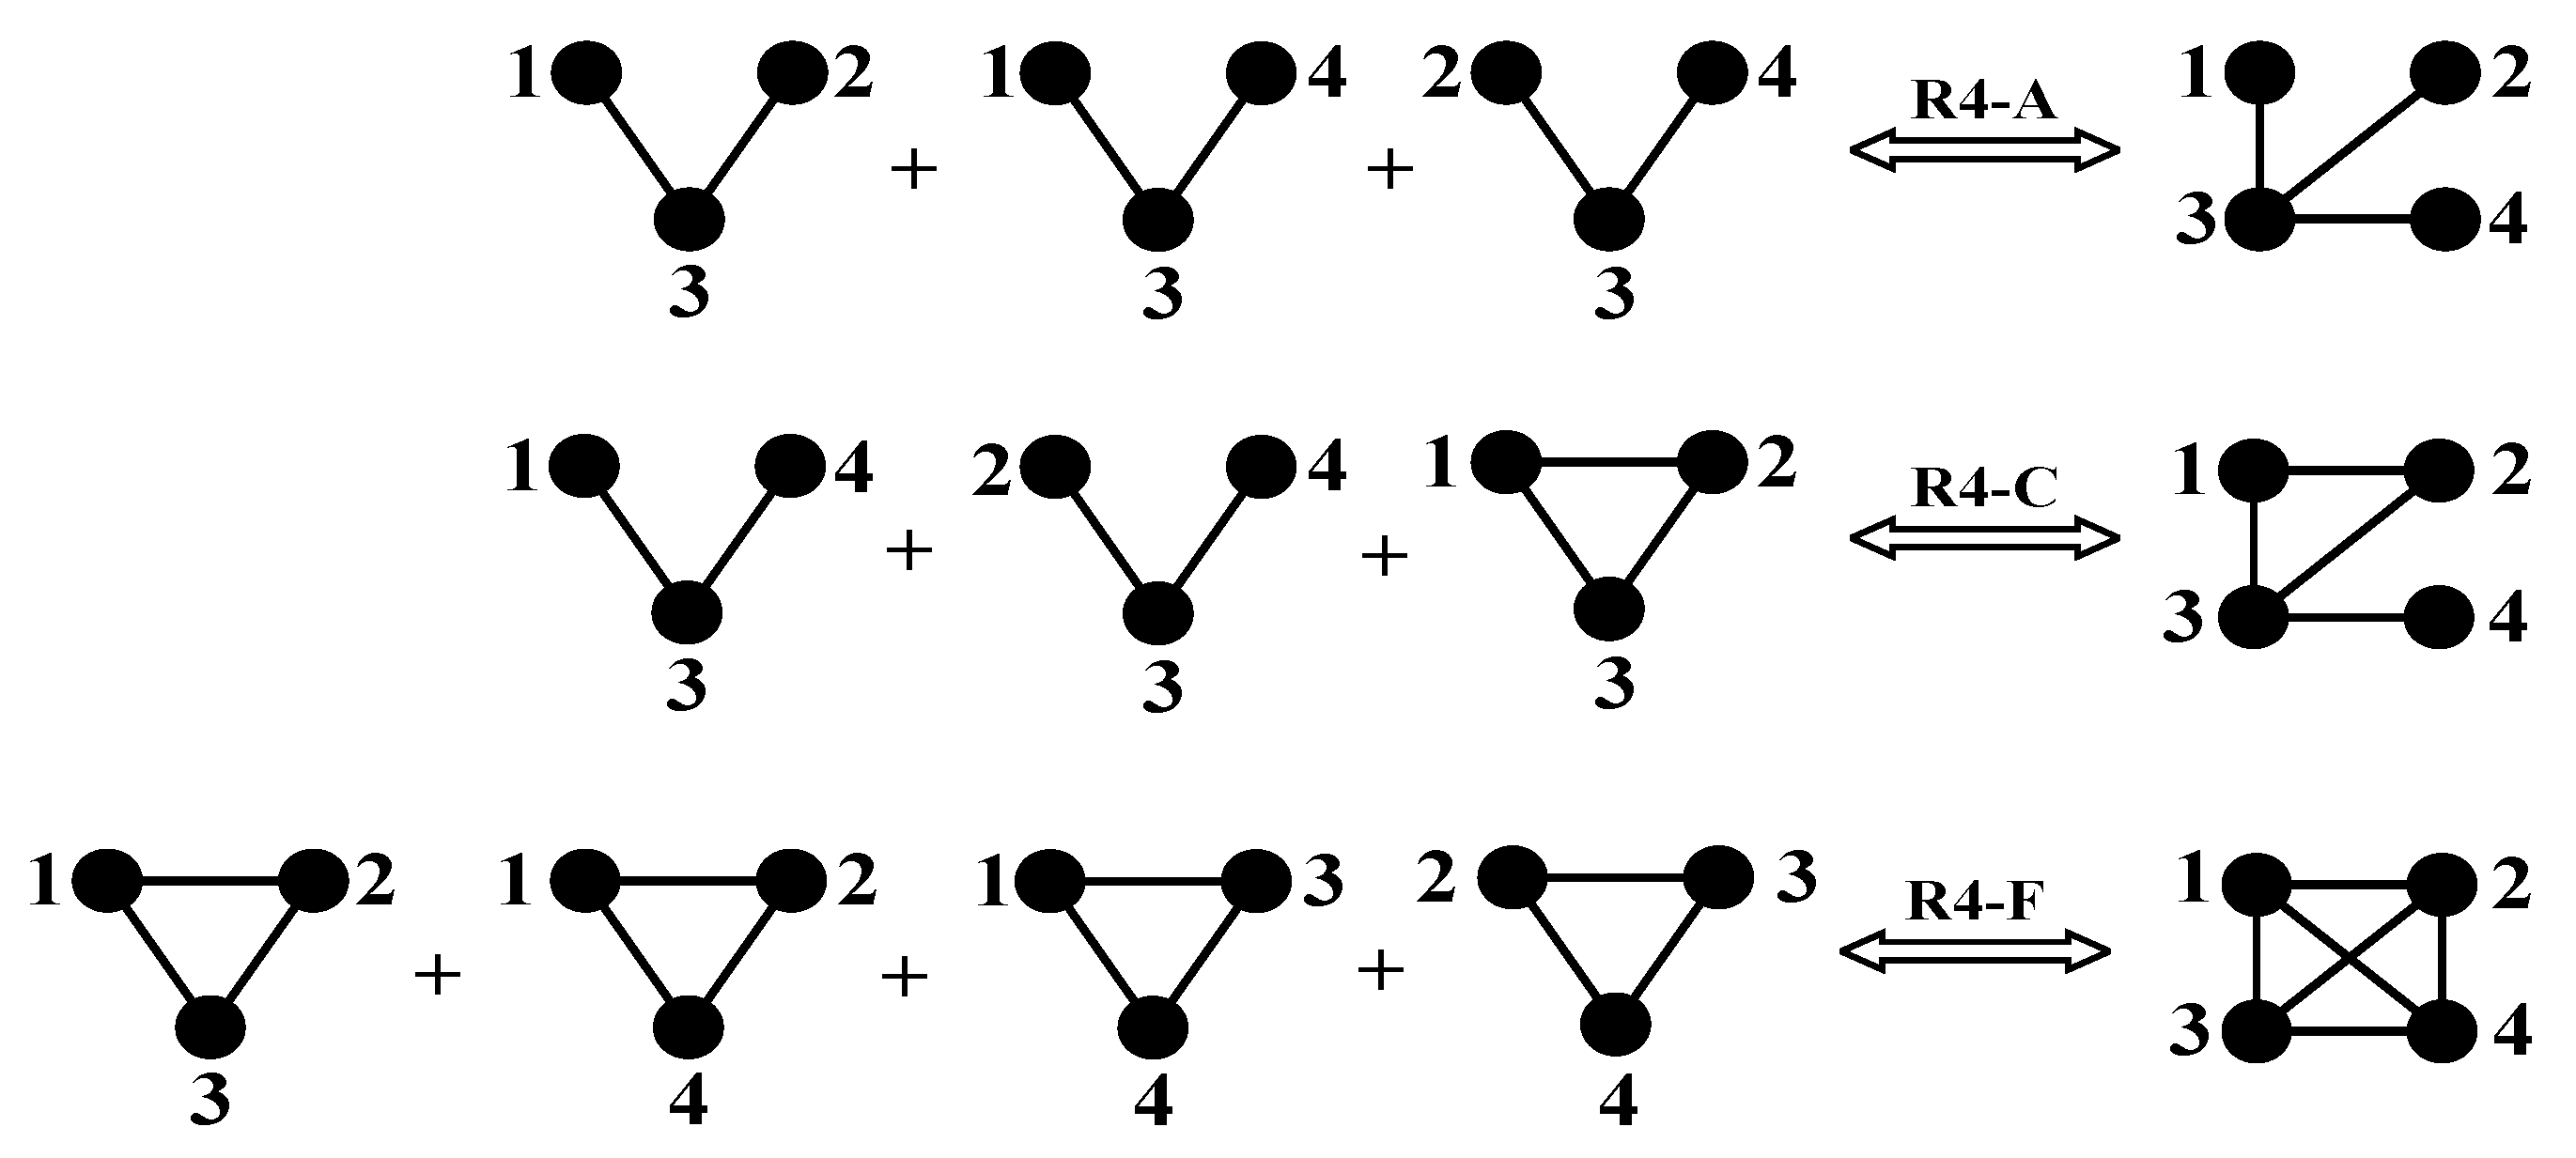
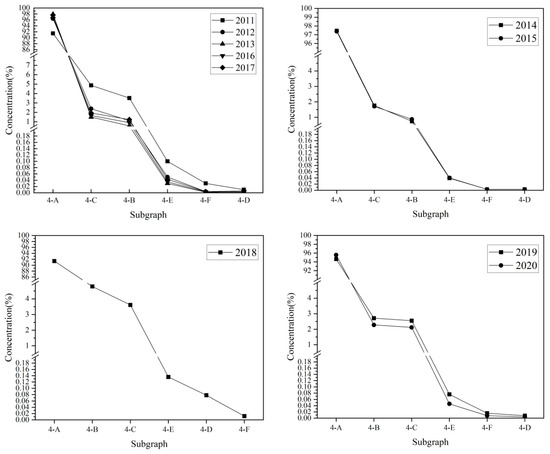
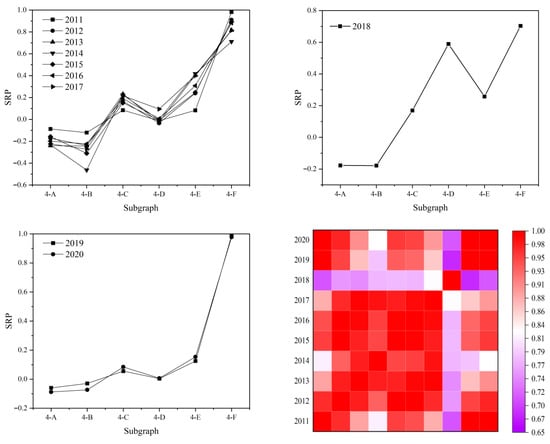
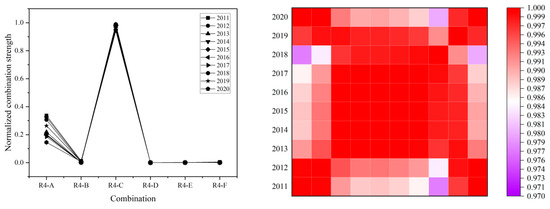
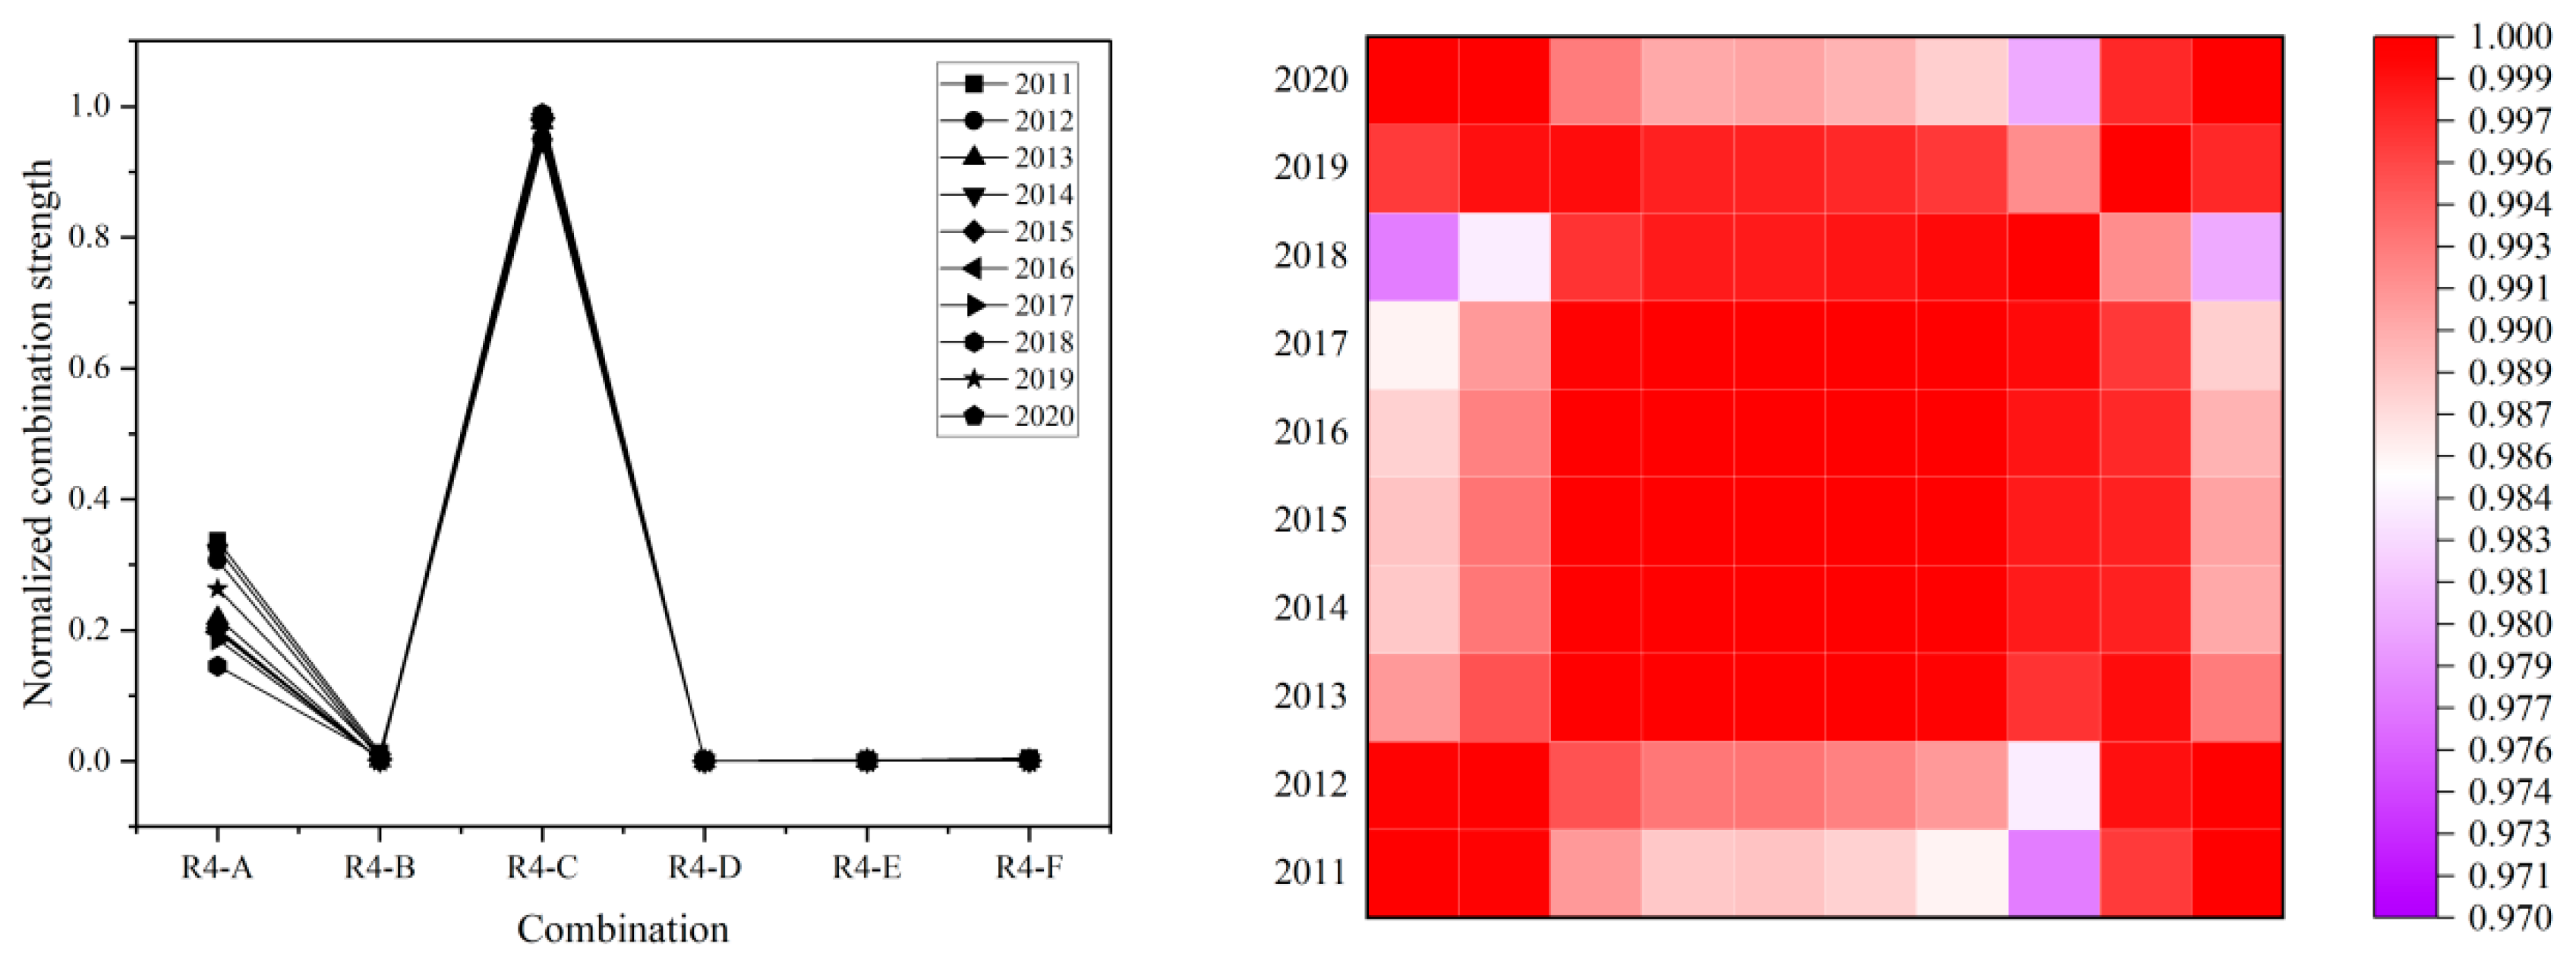



Disclaimer/Publisher’s Note: The statements, opinions and data contained in all publications are solely those of the individual author(s) and contributor(s) and not of MDPI and/or the editor(s). MDPI and/or the editor(s) disclaim responsibility for any injury to people or property resulting from any ideas, methods, instructions or products referred to in the content. |
© 2026 by the authors. Licensee MDPI, Basel, Switzerland. This article is an open access article distributed under the terms and conditions of the Creative Commons Attribution (CC BY) license.