


Abstract
The European Union aims to cut greenhouse gas emissions by 55% by 2030 and reach climate neutrality by 2050, targets that depend on expanding renewable generation in the European energy system. While photovoltaic (PV) capacity has grown quickly in several member states, others remain far behind. This paper frames that divergence as a systems planning problem: installed MW expands through diffusion-like dynamics, but the conversion of investment into energizable capacity is filtered by grid-integration constraints and institutional throughput. The study develops a macro-level framework for systems-level assessment and decision support to guide PV capacity planning and budget allocation using official 2012–2022 data for 22 EU countries. We combine (i) unsupervised clustering of standardized national deployment trajectories, (ii) bounded logistic fits interpreted as an operational diffusion-with-saturation representation that yield comparable growth parameters and maturity years (80–90% of the estimated ceiling), and (iii) a proportional reallocation scenario for countries below 5 GW in 2022. Three clusters emerge—steady growth, early plateau, and atypical paths—and an analytically tractable maturity indicator integrates capacity, rate, and timing in a single measure. In a 10 GW reallocation scenario, average progress toward the 5 GW benchmark rises from 9.8% to 23.1%, closing about 14.8% of the aggregate shortfall. The allocation experiment reveals a clear asymmetry: systems with an existing installed base convert additional MW into benchmark progress more efficiently than very low-baseline systems, where binding constraints are more likely to sit in permitting, interconnection queues, and hosting capacity rather than in finance alone. Turning these allocations into usable capacity depends on timely interconnection and power-electronics integration and on grid-enablement constraints such as interconnection readiness, inverter compliance, and local hosting capacity in high-penetration areas. The contribution is a transparent, updateable decision-support pipeline that links observed trajectory regimes to a maturity “clock” and an auditable allocation baseline, making the trade-off between closing capacity gaps and respecting feasibility filters explicit in an EU system with heterogeneous national subsystems. The proposed approach links macro-level maturity clusters to operational feasibility signals in the grid integration layer, showing that modeling-based allocation can improve system progress but cannot substitute grid-enablement measures, highlighting the importance of regional coordination in the EU energy system under heterogeneous national trajectories.
1. Introduction
The green transition is a part of the European Union’s goal regarding sustainable development [1]. The energy crisis generated by geopolitical events related to the Russia–Ukraine war has pushed ahead the green transition agenda, as highlighted by the 6th IPCC (Intergovernmental Panel on Climate Change) assessment report in 2022 and by the REPowerEU plan launched by the European Commission [2,3]. The green transition in the EU has the objective of reducing CO2 emissions by 55% by 2030 (compared to 1990 levels), which has major implications for the European energy system. In systems terms, this is not a single-sector expansion problem; it is a coupled transition in which generation build-out, network reinforcement, connection standards, and operational flexibility co-evolve and jointly constrain what can be delivered on the ground. Resource allocation should be optimized to maximize renewable energy production under binding system constraints (grid capacity, interconnection, and power-quality compliance). This paper therefore treats PV deployment as a socio-technical diffusion process embedded in a constrained infrastructure system: investment can raise nominal capacity, but the conversion into energizable, dispatchable, and compliant capacity is filtered through grid hosting limits, interconnection lead times, and inverter/grid-code requirements.
As EU countries are trying to reduce their dependence on fossil fuels, collective efforts were directed to reshaping national energy systems by implementing sustainable energy solutions, and solar power represents one of the main alternatives of clean sources [4]. Over the past decade, the share of PV energy in the European energy system has been growing, due to favorable policies implemented by the Commission [5]. Yet the EU is not one homogeneous “solar system.” It is a network of national subsystems that differ in legacy capacity, market design, permitting regimes, grid topology, and institutional implementation capacity. Such heterogeneity is exactly where systems analysis is useful: it helps separate differences in trajectory shape (diffusion regime) from differences in scale (absolute MW), and it clarifies why similar policy impulses can yield uneven outcomes.
National energy systems are very heterogeneous across EU, and the development of photovoltaic (PV) capacity is extremely unequal between the member states. While some countries have developed, in a short period of time, large photovoltaic facilities, others have remained with incipient or stagnant infrastructure due to systemic challenges. This situation raises questions about the efficiency and fairness of the allocation of financial resources available for the green transition and about whether budgetary reallocations translate into energizable capacity given interconnection and hosting-capacity limits. At the same time, most of the existing evidence remains descriptive, focusing on total capacities and growth rates rather than on explicit maturity timelines or budget-based allocation rules that can support reproducible, updateable planning decisions. From a systems perspective, two gaps are particularly costly for decision makers: (i) the absence of a common “maturity clock” that makes national diffusion stages comparable, and (ii) the absence of transparent allocation rules that can be re-run as new data arrive and that remain interpretable as a planning instrument rather than a black-box forecast.
This paper proposes a simple and applicable analytical framework that answers two key questions for policymakers:
- What is the growth rate of PV capacity in each member state, and when is it expected to reach 80–90% of its maximum potential?
- How can a fixed budget be distributed among countries to maximize overall progress and reduce disparities while remaining interpretable in a systems-planning context?
We propose a combination of methodologies: (i) unsupervised hierarchical clustering of standardized national trajectories (2012–2022, 22 countries); (ii) bounded logistic growth modeling that yields comparable maturity years (80–90% of the estimated ceiling); and (iii) a proportional reallocation scenario for an additional 10,000 MW of capacity directed to countries below 5 GW in 2022. The theoretical logic behind this sequence is deliberate: clustering identifies “regimes” of deployment dynamics; the logistic form operationalizes diffusion-with-saturation and yields an analytically invertible maturity metric; and the allocation experiment translates maturity and shortfall into a tractable decision rule under an explicit budget constraint. In other words, the pipeline links observed system behavior (trajectories) to an interpretable planning lever (allocation), while keeping the modeling assumptions visible. This approach provides an integrated perspective on the maturity of PV implementation and the relative efficiency of investments depending on the national context of energy systems. It also aligns with a core systems-engineering distinction between installed capacity and effective capacity: the latter depends on interconnection readiness, local hosting capacity, and compliance at the power-electronics interface. In this way, macro-level deployment data are translated into a decision-support planning tool that can be directly used in EU-wide PV capacity discussions and linked to grid-enablement priorities (interconnection readiness and power-quality compliance).
Key results include an estimate of the year in which each country reaches critical development thresholds (80% and 90% of estimated logistic capacity) and a budget allocation simulation indicating which countries can achieve significant improvements with moderate budgetary effort (e.g., average progress toward the 5 GW benchmark rising from 9.8% to 23.1%, closing ≈14.8% of the aggregate shortfall). The results also highlight asymmetries: countries with an existing installed base convert allocations into benchmark progress more effectively than very low-baseline systems, where binding grid and institutional constraints dominate. This asymmetry is not an empirical nuisance; it is a systems signal that the dominant constraint set differs by regime. Where a base exists, incremental MW interacts with network limits and inverter settings; where it does not, the binding constraints are permitting, project pipelines, interconnection queues, and institutional throughput.
Beyond these numerical results, the paper brings together several elements that, as far as we can tell, are not yet combined in the existing literature where macro-level approaches are used to analyze the development of PV capacities in national energy systems. First, it uses a data-driven classification of national deployment trajectories, rather than relying on ex ante regional groupings. Second, it defines a logistic-based maturity indicator that translates fitted capacity ceilings and growth rates into comparable 80% and 90% timelines. Third, it embeds these maturity profiles in a transparent allocation experiment that quantifies how much of the aggregate capacity gap can be closed under a given budget and benchmark. Consequently, these features turn retrospective deployment data into a practical planning tool that can be used at a systems level. Compared with most previous studies, which either analyze historical capacity trends or discuss policy targets in isolation, the present paper offers a compact macro-level framework that links trajectory types, maturity years and a concrete budget allocation rule to system feasibility considerations in the grid integration layer. In particular, it makes explicit that reallocating MW is necessary but not sufficient when hosting capacity, interconnection timelines, and inverter/grid-code compliance become binding. Conceptually, the contribution is a decision-support “bridge” between diffusion-stage diagnostics and a constrained allocation problem, framed in the spirit of systems thinking that prioritizes feedback, bottleneck, and feasibility filters over purely aspirational targets [6,7].
In the following sections we present a comprehensive overview of the current state of PV panel installation in EU countries, analyze the historical data regarding PV panel installation, identify growth rate patterns by country and derive maturity timelines for EU member states. Based on all these analyses, we develop a model that optimizes a limited resource allocation at the EU level, indicating how to prioritize financing across member states to translate into effective capacity rather than nominal targets.
2. Literature Review
In 2015, the United Nations (UN) announced 17 Sustainable Development Goals, setting the framework for a more sustainable economic development [8]. The 26th United Nations Climate Change Conference (COP26), organized in 2021 in Scotland, reunited representatives from 200 countries, who debated about the need for developing clean energy technologies that can contribute with a growing percentage to total global demand, while reducing environmental degradation and pollution [9]. Recent COP meetings, including COP28, have reiterated the objective of rapidly scaling up renewables by 2030 [10].
A more detailed overview of the international and EU policy context is provided in the appendices; in the main text, we focus on the strands of the literature that are directly linked to our empirical framework.
The EU has set a goal of increasing the renewable energy share in total energy production to 32% by 2030 and to 100% by 2050, thus reaching carbon neutrality. Regulatory frameworks regarding environmental protection are reshaping the energy sector, promoting the shift from traditional sources to green ones [8]. An important role is attributed to solar power technologies [11], as the PV sector has expanded significantly in the past decade and, combined with wind power, is expected to cover half of the global electricity demand by 2040 [9].
To analyze the development of the PV sector in the EU, we set three main areas of research relevant to our study: the evolution of PV installations in EU countries, patterns of production capacity growth at the national level and investment planning.
2.1. Trends in Photovoltaic Installation
A report published in 2022 [12] reflects that, between 2010 and 2021, annual solar PV installations increased by almost 1029%, while the rooftop share of PV has decreased from 54.3% in 2010 to 43.4% in 2021. This evolution indicates that in the early years of the evolution, PV installations were small scale (example: rooftops, residential use); however, over time the utility-scale segment (such as larger solar farms) has gained a larger share of new annual additions. Overall, all segments (commercial, industrial and residential) have grown and their share of total PV installations has fluctuated depending on specific factors (such as costs or policy incentives—see Figure 1). However, the evolution of the share of PV installation in commercial and industrial sectors with respect to total installations registered an increase in 2023 (35% compared with 31% in 2021) [13].
Figure 1.
Annual PV installation and share of rooftop evolution, 2010–2021 [12].
Scientific innovations in manufacturing and PV design facilitated a decrease in production costs, leading to an increase in the rate of PV panel installation. At the global level, by the end of 2024, cumulative installed solar photovoltaic capacity had reached about 1865 GW, while solar PV generation in 2023 exceeded 1600 TWh [14,15]. At the global level, China is leading in terms of the growth rate of installed solar capacity and level of investments [16].
In the EU, Spain was the first country to develop solar energy capacities and Germany became the leader in the early 2000s. Recent statistics show that EU PV capacity has roughly doubled since the mid-2010s and continues to expand rapidly [17]. The energy crisis in 2022 gave a new boost to rooftop capacity installation, with the yearly growth rate reaching 61% (2023 vs. 2022) if we consider all segments: industrial, commercial and residential.
Since 2019, EU member states developed 10-year National Energy and Climate Plans (NECPs), which included measures meant to be implemented by 2030, for each country to achieve renewable energy targets. According to the last update of NECPs (made in 2024), the total EU target of installed solar capacity is 605 GW by 2030 [13].
Across the EU, there are notable disparities in PV capacity growth rates, depending on many factors such as: economic conditions, governmental policies and energy mix. Germany, France and Italy have the biggest installed solar capacities, while CEE countries had a slower historical development rate of PV panel installation and have been trying to pick up the pace by introducing new incentive policies [18]. The variation in growth rates among member states highlights the importance of policy support regarding the transformation of national energy systems and public awareness regarding PV technology adoption [19]. The development of renewable energy facilities, particularly photovoltaic (PV) panels, is a major issue for energy efficiency. While local investment strategies have been predominantly discussed, there is a research gap regarding comprehensive system-level analyses focused on how to optimize resource allocation in the EU. Previous research results show that a decentralized approach to energy generation helps reduce dependence on fossil fuels, but it must be combined with optimized system-level output strategies [20]. For example, mismatches between local energy generation capacities and the demands of the broader grid can lead to inefficiencies and increased operational costs. Striking an optimal balance is essential to ensure that renewable energy integration maintains the reliability and stability of the power system [21].
Most of these contributions describe capacity trends and scenarios at an aggregate level, without estimating when individual countries reach deployment ceilings or how EU-wide capacity should be distributed across members. Our logistic maturity indicators and allocation experiment are designed precisely to address this gap.
Even if the installation levels of PV systems have increased significantly across the EU (Figure 2), the strongest increase can be observed in recent years (2021–2023), while countries such as Italy, Czech Republic, Slovakia and Romania have registered a high level of installations in the early years (2010 onwards).
Figure 2.
Annual market heat map, 2000–2023. Source: Solar Power Europe, 2023.
With high annual growth rates in PV installations in 2023 and 2024, EU member states such as Spain, Germany, Italy, the Netherlands, France and Poland were included among the top 15 performers in the world (Figure 3).
Figure 3.
Annual PV installation growth rate (2023–2024). Source: Solar Power Europe, 2023.
If we analyze the most recent data provided by [17] regarding installed solar PV capacity in 2024, Germany, Spain, Italy, the Netherlands, France and Poland are the top performers (with installed capacities between 20 and 38 GW), while countries like Greece, Belgium, Austria, Hungary and Portugal are identified as regions with medium installed capacity (between 5 and 9 GW). In the lower part of the ranking, Sweden, Czechia, Denmark, Bulgaria, Lithuania, Finland, Ireland, Slovenia, Estonia and Romania register a rather low PV installed capacity—between 1 to 5 GW—while Slovakia, Croatia, Cyprus, Luxembourg, Latvia, and Malta register the lowest capacities (under 1 GW).
Numerous studies document the growth of photovoltaic capacity over the last decade, emphasizing the role of public policy and technological progress (e.g., [15,17,22]. Some scenarios suggest that installed capacities in the EU could expand to around 440 GW by 2030, which, alongside other renewables like wind power, would significantly decrease greenhouse gas emissions [22,23]. A slowdown in the PV installation growth rate was noted in 2024, registering only 4%, down from 53% in 2023. The main reasons for this slowdown are the normalization of energy prices after the gas crisis, the decrease in financial incentives and the difficulties in solar energy storage and distribution grids. More optimistic forecasts suggest the EU could reach a target of 700 GW of installed solar PV capacity by 2030, based on 3–7% annual growth rates [24]. However, these studies mainly analyze historical data on absolute capacity to make forecasts, without explicitly estimating when a development ceiling will be reached. In this context, our contribution consists of logistic modeling of PV capacity, which allows us to estimate the years in which each country will reach 80% and 90% of its theoretical potential.
2.2. Classification of Countries by Development Trajectories
Certain countries benefit from geographical advantages that enhance PV energy production. Southern European countries have an advantage regarding solar irradiance levels, which lead to higher energy potential compared to northern nations [4]. Geography is an important factor to be considered when trying to explain the disparities in PV capacity growth across EU member states, as this influences the efficiency of the investment.
Several EU countries have been early adopters of PV technology. Countries like Germany, Spain, Italy and France have historically led in PV capacity, driven by favorable governmental policies regarding the green transformation of the energy systems, technological advancements, robust market conditions and favorable climate conditions. Germany, Italy and Spain account for 56% of the installed PV capacity installed across the EU. Germany stands out as a pioneering nation, achieving significant scale with an installed capacity of approximately 48 GW as of 2019, accounting for about 38% of total EU PV installations [25]. Spain possesses greater photovoltaic potential than many other EU member states due to its favorable climatological conditions [26]. By analyzing data from [15], we observe that in 2022, 12 EU countries increased their PV installed power by more than 1 GW (Germany, the Netherlands, Poland, France, Spain, Austria, Italy, Denmark, Hungary, Greece, Portugal). Other countries such as Cyprus, Czechia, Ireland and Bulgaria had lower PV capacity development rates, as their governmental policies were not as efficient in providing support and incentives for investors. Such disparities highlight how national policies, economic and geographic factors, and cultural characteristics influence the development of photovoltaic energy. Additionally, economic wealth, as indicated by GDP per capita, plays a crucial role in determining the pace of solar energy adoption within the EU [27]. Ref. [28] studied the correlation between renewable energy use and economic growth, concluding that high levels of economic development can represent a driving force for the industrial consumption of green energy.
The literature on grouping EU countries according to the shape of their PV evolution is limited. Some studies discuss regional differences, but without formal classifications based on historical data. Based on variations regarding solar capacity installation dynamics across the EU, we define clusters including countries with similar patterns of growth and then estimate deployment saturation timelines for each country. We adopt a comprehensive perspective that identifies an optimal allocation strategy for future resources to optimize overall solar energy production, shifting the focus from a local to a regional macro-level approach. In contrast to these more qualitative groupings, our clusters are built directly from the 2012–2022 deployment trajectories and feed into the logistic maturity and allocation analysis described in Section 3 and Section 4.
2.3. Resource Allocation and Investment Planning
The global debate about climate change and sustainability has increased public awareness regarding the need to transform energy systems and shift to renewable sources, encouraging both public and private investments. Global investments in the renewable energy sector experienced a rapid growth pace, shifting from under $50 billion in 2004 to almost $300 billion in 2019. Between 2013 and 2018, solar energy generation benefited from 46% of total global renewable energy investments [29]. For solar power, annual capital investments in PV panel installations increased from 19 billion Euro in 2020 to 60 billion Euro in 2023 but fell to 56 bn Euro in 2024 [30]. Still, solar power had the biggest share of new contributions to renewable energy production in 2024.
The main factors influencing investment planning for the installation of new PV panels are location, governmental incentives and grid conditions [31,32]. Ref. [33] also consider factors like technology complexity and granularity, politics, institutional capacities and social acceptance. These factors shape the decisions of public and private investors, which become increasingly more important as energy systems are being decentralized in EU countries.
Some studies use modeling of cost elements to forecast future trends in PV panel installation in different regions [34,35]. Governmental support mechanisms, such as feed-in tariffs, tradable green certificates, net metering and tax credits are found to be indispensable in making solar PV investments financially viable, though their effectiveness differs significantly across countries and regulatory environments [36]. Results obtained using deterministic models usually indicate zones with the highest solar potential as the best investment opportunity, as the ROI (Return on Investment) rates are higher than in other areas that benefit from moderate sunlight. On the other hand, models based on a probabilistic approach result in a more balanced distribution of investment capacity across regions. Ref. [37] proposed a stakeholder perspective combined with game theory to evaluate different scenarios in which various deployment strategies are explored for selecting the best locations for future investment in new PV capacity. The scope is to offer a data-driven framework for selection of the optimal configuration of integrated photovoltaic and energy storage systems, which would satisfy simultaneously the criteria of efficiency and equitable financial distribution among energy grid participants. The study findings reveal that governmental policies regarding subsidies should offer performance-based incentives to stabilize investment returns. Future research regarding investment planning in solar PV capacity should focus on models that include not only cost metrics, but also system-wide effects [38].
Most studies propose investment scenarios but do not offer a practical mechanism for distributing budgets among countries based on current needs and performance. Our study addresses this gap with a proportional allocation model optimized to maximize aggregate progress in the EU. Our contribution consists in integrating these directions into a unified, decision-oriented framework that allows for understanding and optimizing the dynamics of photovoltaic energy implementation at a macro level. Specifically, we work with observed country-level deployment paths, derive logistic maturity indicators and then use these, together with a common 5 GW benchmark, to explore how a fixed EU-wide capacity budget could be shared across lagging members.
In what follows, we adopt a macro-level approach that differs from most of these contributions. Instead of starting from cost curves or technical potential alone, we work directly with observed national deployment paths, classify them into trajectory types, and then estimate logistic growth parameters and maturity timelines. These elements are combined with a simple budget allocation rule, so that the same framework speaks both to the diffusion of photovoltaic capacity and to the distribution of future additions across member states.
3. Materials and Methods
3.1. Data Sample
This study uses annual data published by Eurostat, reporting the installed photovoltaic (PV) electricity production capacity for 22 European countries from 2012 to 2022. The dataset includes 297 usable records. Each entry is the net maximum electrical capacity (MW) of PV installations operated by main-activity producers.
Across the panel, the mean installed capacity is 3320.6 MW (SD 9475.4 MW). Values run from 0 MW—early years or countries that lag—to a peak of 67,477 MW, the EU aggregate in 2022. The median is only 103 MW, which tells the real story: the distribution is heavily skewed, with a handful of countries carrying most of the PV stock.
Figure 4 shows how these gaps evolve. The annual boxplots (log scale) for 2012–2022 make both trends visible at once: steady growth in the center of the distribution and persistent disparities between countries.
Figure 4.
Distribution of net installed photovoltaic capacity by country, 2012–2022 (log scale). Source: authors’ work in R (v4.4.2; R Foundation for Statistical Computing, Vienna, Austria) Note: Boxplot whiskers represent 1.5× the interquartile range (IQR) from the first and third quartiles; red dots indicate outlier observations beyond the whiskers..
A detailed description of the Eurostat extract and filters is provided in Appendix B.
3.2. Methodology
Our research methodology is based on a macro-level approach of the EU energy system, and our conceptual framework is designed to support the decision-making process regarding investment planning in new PV capacity development across EU countries. In systems terms, the decision problem is to convert heterogeneous historical behavior into an interpretable planning signal under constraints: national PV deployment follows diffusion-like dynamics, but the system-level outcome is filtered through feasibility limits (interconnection queues, hosting capacity, and power-quality compliance). The methodology therefore couples (i) a behavioral description of deployment trajectories with (ii) a maturity metric grounded in diffusion-with-saturation theory and (iii) a constrained allocation rule that can be audited and re-applied as data update ([6,7]. Figure 5 provides a compact overview of the empirical framework. The Eurostat capacity series are first cleaned and standardized and then grouped into trajectory types by hierarchical clustering (Section 3.2.1). In a second step, bounded logistic curves are fitted to each national series and analytically inverted to obtain 80% and 90% saturation years (Section 3.2.2 and Section 3.2.3). Finally, these maturity indicators feed into a simple allocation experiment that redistributes a fixed PV budget across lagging countries under a proportional shortfall rule (Section 3.2.4).
Figure 5.
Overview of the analytical framework. Source: authors’ work in R software 4.4.2.
3.2.1. Unsupervised Classification of PV Deployment Patterns
To analyze heterogeneity in photovoltaic (PV) deployment across European countries, we employ unsupervised clustering based on national-level capacity data spanning the period 2012–2022 [39,40]. The systems rationale is to identify distinct “deployment regimes” (trajectory shapes) that are consistent with different dominant bottlenecks—policy/pipeline limits, grid-integration limits, or late-stage saturation effects—rather than to merely rank countries by size. The underlying dataset is a custom extract from Eurostat table nrg_inf_epc (“Electricity production capacities by main fuel groups and operator”), filtered for the solar photovoltaic fuel group, net maximum electrical capacity, main-activity producers, unit megawatt (MW), and calendar years 2012–2022. Because the goal is regime identification, the clustering is performed on standardized trajectories (within-country centering and scaling), so that countries are grouped by dynamics rather than by absolute MW. Starting from the EU-27 plus Euro-area aggregates and all member states, we remove the aggregate series and then drop countries whose reported PV capacity in this category is zero over the entire period (Denmark, Luxembourg, Malta and Poland). In addition, Belgium’s series remains constant at 4.6 MW throughout 2012–2022 and therefore provides no information on deployment dynamics; it is excluded from the trajectory analysis for the same reason. The resulting balanced panel used in clustering and logistic estimation covers 22 EU member states: Austria, Bulgaria, Croatia, Cyprus, Czechia, Estonia, Finland, France, Germany, Greece, Hungary, Ireland, Italy, Latvia, Lithuania, the Netherlands, Portugal, Romania, Slovakia, Slovenia, Spain and Sweden (see also Table A1 and Appendix B for the full Eurostat extract and filters). Our maturity and allocation results should therefore be read as characterizing member states that already have at least a modest, growing base of grid-connected PV capacity from main-activity producers; extending the framework to rooftop-dominated or autoproducer-dominated systems would require broader indicators and lies outside the scope of this paper. This boundary condition is important in a systems-planning context because the constraint set differs by segment: utility-scale growth interacts primarily with grid hosting capacity and interconnection queues, while rooftop-dominant growth is more sensitive to distribution-grid reinforcement and household/SME incentives.
Let denote the raw data matrix, where each row corresponds to the PV capacity trajectory of country i, with T = 11 representing the years 2012 through 2022. To focus on temporal patterns rather than absolute magnitudes, each row was standardized as follows:
where is the mean and the standard deviation of row i. Countries with (i.e., constant trajectories) were excluded from clustering to avoid undefined values after standardization. This exclusion also avoids spurious “clusters” driven by reporting artifacts rather than by meaningful system behavior.
A dissimilarity matrix was computed using the Euclidean distance [41]:
where denotes the standardized PV-capacity value for country in year .
To choose the number of clusters, we combined visual inspection of the Ward.D2 dendrogram with quantitative diagnostics (i.e., see [42]). Using Euclidean distance on the row-standardized trajectories, the average silhouette is 0.70 at , 0.52 at , and declines further for (0.50 at , 0.48 at ). With Manhattan distance on the same standardization, the pattern is similar, with silhouettes of 0.67 at and 0.53 at . Under an alternative standardization that centers but does not rescale each country’s series, the corresponding silhouettes are 0.81 at and 0.73 at . These values are reported in Appendix C (Table A2). Across all specifications, yields the highest silhouette, but is consistently the second-best solution, with average silhouettes above conventional cut-offs for a well-separated partition. Given that the three-cluster structure isolates a small group of “early plateau” systems that would otherwise be merged into the high-capacity group at , we adopt as the main segmentation in the paper. This choice preserves a distinct regime that is system-relevant: an early-plateau trajectory is consistent with binding constraints that switch on before scale is achieved (e.g., interconnection throughput or local hosting limits), which would be masked in a coarser partition.
3.2.2. Nonlinear Estimation of Growth via Logistic Curves
To capture the long-term deployment behavior of solar photovoltaic (PV) capacity across European countries, we employ a nonlinear parametric model based on the logistic function [43,44]. The logistic form is used as an operational diffusion-with-saturation representation: early growth is approximately exponential, the mid-phase reflects rapid scaling, and the late phase slows as constraints and diminishing marginal opportunities become binding [45].
For , each temporal trajectory is modeled by a three-parameter logistic growth function of the form:
where denotes the modeled PV capacity for country i at time t, is the saturation level (carrying capacity), is the intrinsic growth rate, and ∈ R is the inflection point, i.e., the year when growth is most rapid. In the present context, is interpreted as an empirical ceiling implied by the observed trajectory and the chosen functional form, rather than as a physical potential estimate; it is therefore a maturity device, not a claim about ultimate technical potential.
The parameters , and are estimated for each country i using nonlinear least squares, via the Levenberg–Marquardt optimization algorithm with a bounded multistart routine [46]. Specifically, we initialize multiple starting values and impose mild bounds (e.g., Ki above the country’s observed maximum, ri > 0, and t0i within a reasonable window around the sample) that constrain to lie between 1.01 times and at most six times the country’s observed maximum capacity over 2012–2022, restrict to the interval , and bound between ten years before the start of the sample and thirty years after the last observed year to avoid implausible ceilings and spurious inflection years. These bounds play the role of systems plausibility constraints: they reduce the risk that short panels produce unrealistic saturation levels that would contaminate the maturity timelines and, in turn, the allocation experiment. This fitting approach minimizes the residual sum of squares between observed values and the modeled curve over the available time span. Prior to model fitting, no detrending or transformation was applied to preserve the original scale of installed capacity (MW). We retain only convergent fits that pass simple quality checks (e.g., positive ri and reasonable relative RMSE) and exclude the rest from timeline calculations. For each fitted curve we compute the root mean squared error (RMSE) and a normalized RMSE (NRMSE, defined as RMSE divided by the range of the observed capacity series). Fits are classified as reliable if , NRMSE < 0.30 and the implied 80% and 90% saturation years (Section 3.2.3) are finite and do not extend beyond the year 2100. Trajectories that do not meet these criteria are treated as non-interpretable logistic extrapolations in the main analysis and are reported only in Appendix D. This screening choice is conservative by design: the planning signal is based only on trajectories where the diffusion-with-saturation representation is empirically credible over the observed sample.
3.2.3. Analytical Estimation of Deployment Saturation Timelines
To extend the interpretability of the logistic growth model beyond curve fitting, we derive a closed-form estimator for the projected year in which photovoltaic (PV) deployment approaches a predefined proportion of its saturation level. This allows for consistent temporal benchmarking of deployment maturity across countries, grounded in the structural dynamics of the fitted model rather than arbitrary thresholds or visual inspection. In systems terms, the maturity year functions as a common “clock” that makes heterogeneous subsystems comparable, enabling a planner to distinguish late-stage saturation from early-stage pipeline constraints even when absolute MW differ.
Building upon the logistic model previously specified, we now analytically invert the same functional form to estimate the year when photovoltaic deployment reaches a given saturation level. Recall first the capacity trajectory in (3): . To estimate the year at which a country reaches a proportion ∈ (0,1) of its theoretical capacity ceiling, we solve for t such that . The solution follows directly from algebraic inversion of the logistic equation:
This expression provides a well-defined, interpretable quantity, i.e., the saturation year corresponding to the target proportion p. It is best read as a trajectory-consistent milestone (“when the fitted diffusion path reaches p of its implied ceiling”), not as a deterministic forecast of calendar completion. In our analysis, we compute for p = 0.8 and p = 0.9, corresponding to early and advanced stages of saturation, respectively. Estimates are reported only for countries with convergent, quality-screened logistic fits (Section 3.2.2), ensuring ri > 0 and reasonable fit quality; in practice, we retain only fits with , NRMSE < 0.30 and 80%/90% saturation dates before the year 2100; this removes the need for ad hoc truncation rules and guards against distortions in flat or anomalous time series. Maturity years for trajectories that do not satisfy these criteria are set to missing in the main tables and figures and are listed only in Appendix D together with their parameter estimates and diagnostics.
By operationalizing the logistic form in this way, we introduce a novel and analytically tractable indicator of deployment maturity, i.e., one that integrates capacity, rate, and timing within a single unified framework. This complements conventional summary statistics and enables comparative assessments of PV growth trajectories within and across regions.
3.2.4. Capacity Allocation Optimization Toward 2030 Targets
To extend the analytical framework beyond passive forecasting, we introduced a simple allocation scheme aimed at reallocating new photovoltaic (PV) capacity across underperforming countries. The rationale was to simulate a centrally guided policy intervention intended to accelerate solar deployment where historical growth has been inadequate. The exercise is intentionally stylized: it does not aim to reproduce detailed national planning exercises, but to provide a transparent benchmark for how a given EU-wide budget could be distributed across laggard systems under simple, clearly stated rules. In a systems framing, this is a first-pass resource-allocation heuristic under a single binding constraint (total MW budget). It is not presented as an engineering-optimal solution because the full constraint set—hosting capacity, interconnection queue capacity, permitting throughput, and cost heterogeneity—is not observed consistently at EU scale in the same panel. The value of the exercise is therefore interpretability and updateability: it yields a replicable “allocation baseline” against which richer constraint-aware scenarios can be compared.
Let denote the set of countries with low 2022 PV capacity, formally defined by the threshold:
For each country i ∈ , let be the installed capacity in 2022 and the desired level for 2030. In this application, we set a common benchmark of Ti = 5000 MW for all lagging countries (so that ). This threshold is not intended as a detailed national forecast, but as a symbolic ‘entry level’ at which PV capacity becomes system-relevant for the operation of a national power system. It is broadly consistent in order of magnitude with PV ambitions reported in recent national energy and climate plans, while remaining deliberately uniform for comparability. Countries with 2022 capacity below are interpreted as clearly modest PV adopters, for which an additional 5 GW would constitute a sizable absolute increase. It lies below the ambitions of the most advanced EU solar markets but well above the current capacities of the laggard group and therefore offers a uniform yardstick for comparing progress across countries. It also creates a system-relevant threshold that is easy to communicate in planning conversations: reaching a few gigawatts typically shifts PV from marginal to operationally material, with visible implications for connection management, balancing, and grid-code enforcement. The laggard definition is therefore scale-based, while the maturity metrics remain trajectory-based; using both allows the paper to separate “small but fast-growing” systems from “small and stalled” systems.
Let be the additional capacity allocated to country i. Given a total available PV capacity investment of B megawatts (here, B = 10,000), the allocation objective becomes:
The objective function maximizes the aggregate proportion of target capacity reached across the lagging subset. Equivalently, because all laggards share the same target , the allocation can be viewed as minimizing the aggregate residual shortfall subject to the same budget and non-negativity constraints. We implement a proportional allocation heuristic, distributing the budget B in proportion to each country’s shortfall , normalized over the total shortfall of all . Proportional shortfall rules are widely used in constrained systems when the aim is to close gaps transparently under limited resources: they are monotone, auditable, and avoid hidden weights that can obscure the policy logic. This transparent rule serves as a baseline policy scenario and ensures internal consistency with the cleaned dataset. Operationally, the rule is applied iteratively: at each step, the remaining budget is reallocated in proportion to the current shortfalls and increments are capped so that no country’s post-allocation capacity exceeds the 5 GW benchmark. This yields a unique allocation vector that maximizes the fraction of the initial gap closed under a simple MW-based objective and is fully consistent with the cleaned dataset. Importantly, this allocation should be interpreted as nominal MW placement; whether allocated MW becomes energizable capacity depends on feasibility filters (grid hosting, interconnection readiness, and compliance) that are discussed in the interpretation of results.
To gauge the importance of the budget size, we repeat the exercise for B , and summarize the corresponding fractions of the initial shortfall that are closed in Appendix E. We also outline, at a conceptual level, how the same proportional framework could be reformulated for generation-based objectives (using expected MWh) or for fairness criteria that scale shortfalls by population or GDP per capita; implementing these richer variants requires additional data on capacity factors, costs and grid constraints and is left for future work. A direct systems extension is to introduce country-specific feasibility weights (0–1) that proxy grid-enablement readiness (e.g., interconnection lead times or hosting-capacity headroom), so that allocations are discounted where the near-term conversion of MW into energizable capacity is unlikely. Such a variant preserves transparency while moving the experiment closer to constraint-aware planning once comparable indicators become available.
4. Results
The order of the results follows the three-step framework sketched in Figure 5. We begin with the unsupervised classification of national deployment trajectories, then turn to the logistic growth estimates and the associated saturation timelines and finally apply the allocation rule to a subset of lagging countries. This sequence mirrors the methodology in Section 3.2 and allows the empirical findings to be read directly in terms of the proposed framework.
4.1. Classification of National PV Expansion Profiles
The clustering procedure resulted in three well-differentiated groups of countries exhibiting distinct temporal patterns in PV deployment (see Figure 6).
Figure 6.
Dendrogram from hierarchical clustering (Ward.D2, Euclidean distance on row-standardized trajectories). Different colored rectangular borders delineate the three clusters obtained by cutting the dendrogram at . Source: authors’ work in R software 4.4.2.
Cluster 1 consists of 18 countries, including Germany, Spain, France, Czechia, Greece, and others with relatively smooth, monotonic growth over the decade. These countries show strong alignment in trajectory shape after normalization, despite variations in absolute installed capacity.
Cluster 2 contains Italy and Austria, two countries that exhibit early saturation patterns. Their capacity expansion curves indicate high baseline values with little or no increase during the study period, consistent with prior major investments made before 2012.
Cluster 3 contains Romania and Slovakia. Their PV paths do not follow the regional script—growth is abrupt in places, irregular in others, and in parts delayed—signals that often point to policy shifts or infrastructure constraints. Grouping them separately is useful: it flags countries whose trajectories diverge structurally from the typical pattern.
As a check, the principal component map (Figure 7) shows the three groups pulling apart cleanly. If we force k = 2, Italy and Austria peel off as one block, while the rest form a single, tighter cluster.
Figure 7.
Principal component projection of standardized trajectories with cluster assignments. Source: authors’ work in R software 4.4.2.
The full list of countries and their assigned clusters is presented in Table A1. These groupings form the basis for subsequent modeling efforts, allowing differentiated treatment of growth regimes in forecasting and optimization phases.
For completeness, we also inspected the two-cluster solution corresponding to the highest average silhouette. In that partition, the countries in Cluster 2 (“early plateau”) are absorbed into the high-capacity group, yielding a broad “high/plateau” cluster and a “low/irregular” cluster. While this split attains a higher silhouette (0.70 versus 0.52 in the baseline Euclidean specification), it conceals a distinction that is relevant for planning: systems that accumulated most of their PV capacity before 2012 and have grown only modestly since face different repowering and inverter-upgrade priorities than systems where capacity is still expanding rapidly. This consideration motivates our focus on the three-cluster structure in the remainder of the analysis.
4.2. Cluster-Level Maturity Indicators and Engineering Signals
To make the clustering results operational for system planners and power-electronics engineers, we summarize, for each trajectory cluster, both quantitative maturity indicators and indicative grid-integration needs. Table 1 reports, for each cluster, the number of countries, the median 2022 installed capacity, and the median estimated year in which 80% of the logistic saturation level is reached, together with a qualitative description of typical inverter and interconnection requirements. Using the bounded logistic fits described in Section 3.2.2 and Appendix D, Cluster 1 has a median 2022 PV capacity of 1252 MW and typical logistic ceilings around 3.2 GW; Cluster 2, which contains two large systems, has a median 2022 capacity of about 6312 MW and median ceilings close to 17.8 GW; Cluster 3 has median 2022 capacity around 668 MW and logistic ceilings of roughly 704 MW. These figures can be interpreted as indicative hosting-capacity envelopes for each deployment regime, within which reinforcement, storage and advanced inverter controls need to be planned.
Table 1.
Maturity clusters and indicative power-electronics/interconnection signals.
Cluster 1 (“steady growth”) groups most EU member states and combines relatively high installed capacity with projected 80% maturity dates that fall within the next decades. In such systems, distribution feeders are already moving toward high PV penetration, so planners need to ensure that new and replacement inverters provide robust volt/var and volt/watt support, fault-ride-through capabilities (LVRT/HVRT), and adequate harmonic and THD control. Hosting-capacity studies and MV/HV reinforcement are particularly relevant in this cluster, as incremental PV additions can trigger voltage-rise and reverse-power-flow problems.
Cluster 2 (“early plateau”) contains countries that invested heavily before 2012 and have since added relatively little capacity. In this group, the bounded logistic fits do not pass the reliability filter, which is consistent with trajectories that already sit close to a practical plateau. Here, the priority is not so much accommodating fast new growth as refreshing an aging inverter fleet and upgrading grid-code requirements. Even if additional PV capacity remains modest, system operators can use maturity maps to schedule the introduction of grid-forming functions, stricter power-quality limits, and coordinated storage–inverter operation as existing plants are repowered or reconfigured.
Cluster 3 (“atypical paths”) consists of countries with irregular or delayed trajectories, where PV capacity is still modest but is growing in a more volatile fashion. These systems are at risk of developing local pockets of very high penetration while the national average remains low. For such trajectories, maturity indicators help identify when and where distribution feeders are likely to hit voltage and congestion limits, so that advanced inverter settings and targeted MV/HV interconnection upgrades can be phased in ahead of time.
In all three clusters, the combination of trajectory grouping, logistic maturity years, and the 5 GW benchmark provides a bridge between macro-statistical analysis and concrete engineering practice: it indicates not only how far countries are from a reference capacity, but also when more demanding inverter functions and stricter power-quality enforcement should become standard on the most exposed parts of the network.
In practice, this can be aligned with existing European network codes and interconnection standards—such as the EU “Requirements for Generators” code and EN 50549-1/-2—which already specify LVRT/HVRT envelopes, reactive-power capabilities and voltage limits that new inverters must satisfy 8 [47,48,49].
4.3. National Growth Profiles in PV Deployment
The bounded logistic fits are well behaved for most countries and reveal markedly different growth stories. A representative example of the fitted curve and underlying data is provided for Germany in Figure A1 (Appendix F). Estimated saturation levels span more than two orders of magnitude: from around 70–100 MW in small systems such as Slovenia and Finland to about 404,800 MW in Germany, 122,600 MW in Spain and nearly 79,200 MW in France. This is consistent with Western Europe’s long-standing lead in large-scale PV build-out, while several smaller and mid-size markets are still in earlier deployment stages.
Estimated growth rates are equally diverse. Some late-expanding markets display very rapid logistic growth, notably Estonia (), Hungary (), the Netherlands (), Ireland and Latvia () and Sweden (). Others, such as Bulgaria, Greece and Portugal, combine moderate rates ( in the 0.05–0.36 range) with relatively high ceilings, implying more gradual but sustained scaling. Romania lies in an intermediate category: its estimated ceiling is modest ( MW), but the growth rate is high (), reflecting an early and relatively fast build-out.
The inflection points further contextualize these patterns. Romania (), Sweden (), Hungary and the Netherlands (–2020.7) and Estonia () exhibit early inflection years, indicating that much of their current capacity was installed before or around the middle of the sample period. By contrast, Greece (), Portugal (), Spain () and Germany () point to more protracted expansion toward higher ceilings.
For Austria, Czechia and Italy, the fitted curves either imply near-flat growth or produce implausibly distant saturation horizons. These trajectories fail our reliability criteria (Section 3.2.2) and are therefore excluded from the maturity comparisons in the main text; their parameter estimates and diagnostics are reported only in Appendix D. Belgium is likewise excluded from the maturity analysis because its series is constant at 4.6 MW over 2012–2022 and therefore does not provide an interpretable logistic growth path. This exclusion applies only to the maturity-year analysis. In the subsequent allocation experiment, countries such as Belgium and Austria may still be included because that exercise is based on observed 2022 capacity levels and shortfalls relative to the 5000 MW benchmark, rather than on reliable logistic maturity estimates. Table 2 summarizes the logistic parameters for the remaining countries with reliable fits.
Table 2.
Estimated logistic growth parameters for countries with reliable fits.
4.4. Estimating Temporal Saturation of Photovoltaic Deployment
A distinctive contribution of the present study lies in the analytical estimation of photovoltaic (PV) capacity saturation timelines at the national level, derived from the logistic growth models. Rather than extrapolating linear trends, we use each country’s fitted logistic curve to time “maturity”: specifically, the years in which capacity reaches 80% and 90% of the estimated ceiling .
For countries with stable and interpretable profiles, the resulting saturation timelines are highly heterogeneous. Among the large Western European leaders, Spain is projected to reach 80% of its ceiling around 2035 (and 90% around 2038), France around 2041/2046, and Germany around 2062/2072. These systems already operate at substantial scale, yet the model indicates considerable remaining room for expansion before approaching saturation.
By contrast, several high-growth but smaller systems are expected to mature much earlier. Sweden reaches the 80% threshold around 2021, Romania around 2015, Hungary and the Netherlands around 2022–2023, and Estonia and Latvia around 2022–2024. In these countries, the combination of relatively modest ceilings and high growth rates implies that many distribution feeders will encounter high PV penetration and associated power-quality constraints in the near term.
Intermediate timelines include Lithuania (80% around 2027–2028), Portugal (around 2031–2033), Finland (around 2030–2032) and Slovakia (around 2021–2025). Bulgaria stands out with a much later horizon (around 2079/2095), consistent with a high ceiling and slow growth.
For Austria, Czechia and Italy the bounded logistic fits either suggest near-zero effective growth or push 80% and 90% saturation dates far beyond the planning horizon. In line with our reliability rules, these countries are omitted from the comparative saturation tables and figures; their raw parameter estimates and diagnostics are relegated to Appendix D.
Table 3 reports the estimated 80% and 90% saturation years for countries passing the reliability filter, and Figure 8 plots the relationship between the projected 80% maturity year and the asymptotic capacity . Together, they define a maturity map that distinguishes fast-scaling small systems from gradually expanding large infrastructure.
Table 3.
Estimated years of photovoltaic saturation (80% and 90% of logistic capacity) for reliable fits.
Figure 8.
Projected year of 80% photovoltaic capacity saturation versus estimated asymptotic capacity (K) for EU countries. Source: authors’ work in R software 4.4.2. Note: Saturation year estimates are derived from country-specific logistic models fitted to historical deployment data. Capacity ceilings vary by more than four orders of magnitude, motivating the use of a logarithmic scale on the vertical axis.
The resulting maturity map covers 19 out of 22 countries, for which the bounded logistic model passes the reliability filters (RMSE/NRMSE and horizon constraints). For these systems, the implied 80% saturation years range from the mid-2010s (Romania and some of the “atypical” trajectories) to the late 2070s (Bulgaria), with most countries reaching 80% between the 2020s and 2050s. Large, still-expanding systems such as Germany are projected to reach 80% of their capped logistic ceiling in the early 2060s. Four trajectories (Belgium, Austria, Czechia and Italy) do not support a meaningful logistic extrapolation under our constraints; for these, we do not report maturity years in the main table and instead provide the parameter estimates and diagnostics in Appendix D. They are not used in the subsequent allocation experiment.
4.5. Scenario-Based Capacity Redistribution
Following the allocation procedure, 15 countries were identified as lagging, each exhibiting 2022 capacity levels well below the 5000 MW benchmark. Using a proportional shortfall heuristic, the 10,000 MW capacity budget was reallocated to these countries. This allocation step is based exclusively on observed PV capacities in 2022 and the associated shortfalls relative to the benchmark. Accordingly, countries whose trajectories were excluded from the logistic maturity analysis may still appear in the allocation exercise if their observed capacities place them in the laggard group.
Within the cleaned sample used throughout the paper, all countries display non-zero baselines; those with the largest shortfalls (e.g., Belgium, Latvia, Finland, Slovenia) receive the largest proportional shares. Here, “cleaned sample” refers to the country set retained for the shortfall-based allocation exercise, which is broader than the subset used for maturity comparisons. Belgium and Latvia, though not strictly zero, also ranked high in the need-based index due to their very limited infrastructure. In contrast, countries like Romania and Sweden, while still falling short, required comparatively smaller additions to approach meaningful progress toward the target.
Post-allocation results show that all 15 countries advance along their projected PV adoption path, though improvements remain modest in absolute terms under a 10,000 MW budget. This, while encouraging, still places the region far from a uniform or equitable solar future.
Bulgaria, Portugal and Romania benefit visibly from proportional top-ups given their non-trivial 2022 baselines; by contrast, countries starting from very low baselines (e.g., Belgium, Latvia, Finland, Slovenia) remain at low progress shares despite receiving sizable allocations.
Table 4 (see below) summarizes the redistribution effects. The results highlight the difficulty of closing capacity gaps with constrained resources, especially when current disparities are so pronounced. While this allocation provides a pragmatic improvement, it also implicitly signals that a 10,000 MW budget, though not trivial, may be insufficient to deliver parity by 2030.
Table 4.
Optimized PV capacity allocation for lagging countries (clean sample, 15 countries). Allocations are proportional to 2022 shortfalls toward a 5000 MW benchmark; total budget B = 10,000.
To further illustrate the disparities in photovoltaic deployment and the effects of the allocation strategy, Figure 9 presents the projected percentage of 2030 capacity targets reached across the 15 lagging countries after distributing a 10,000 MW budget. At the sample level, the aggregate shortfall with respect to the 5000 MW benchmark totals 67,666 MW, so the allocation closes only ≈14.8% of the gap. Average country progress rises from 9.8% to 23.1% (a gain of ≈13.3 percentage points), indicating modest but tangible improvements under tight resource constraints.
Figure 9.
Percentage of 2030 photovoltaic capacity target reached by each lagging country following an optimized 10,000 MW allocation. Source: authors’ work in R software 4.4.2.
To gauge how strongly these outcomes depend on the size of the intervention, we repeat the proportional shortfall exercise for alternative budgets of 5, 20 and 50 GW. With a 5 GW envelope, only about 7.4% of the initial gap is closed and the mean progress of laggard countries rises to roughly 16.4% of the 5 GW benchmark. Increasing the budget to 20 GW closes around 29.6% of the shortfall and lifts mean progress to 36.4%, while a 50 GW envelope closes approximately 73.9% of the gap and raises average progress to 76.4%. These figures, summarized in Appendix E, make clear that the baseline 10 GW envelope is modest relative to the aggregate shortfall of 67.7 GW, and that approaching parity with the 5 GW benchmark would require budgets on the order of several tens of GW.
Countries such as Bulgaria, Portugal, Romania, and Sweden stand out as relative improvers, with projected post-allocation progress of roughly 34–43%, reflecting the advantage of starting from non-trivial 2022 baselines. By contrast, countries beginning from very low baselines—Belgium, Slovenia, Finland, Latvia, and Ireland—remain around 15% despite receiving sizable shares of the budget. This underscores a key policy point: the same investment yields very different returns depending on initial conditions. The figure and the budget-sensitivity results highlight a persistent trade-off: spreading limited capacity thinly improves equity, but when the total envelope is small relative to existing gaps, it can only modestly shift aggregate system progress.
5. Discussion
EU goals call for a 55% cut in CO2 by 2030 (relative to 1990) and climate neutrality by 2050, with solar a central pillar amid recent geopolitical shocks. Deployment, however, remains uneven and shaped by constraints of the national energy system, local policy, economic conditions, and resource advantages: higher irradiance in the south and long-standing incentives in parts of the west, with Germany as an example [11,19,22,25]. Our results follow the same pattern: they highlight significant differences between EU countries in terms of the pace of adoption of photovoltaic energy. They help explain who moves quickly, who lags, and what levers—financial and technical—matter most.
Logistic-functional estimates show that some countries, such as Romania and Sweden, can reach maturity (80–90%) in a short term, even with moderate resources. Several smaller systems with high recent growth—Hungary, the Netherlands, Estonia, Latvia, and Slovakia—also approach early milestones. By contrast, Belgium’s trajectory is nearly flat. Substantial additional effort would be required to obtain meaningful gains—again in line with evidence that PV installation growth in the EU is uneven and closely tied to policy, economics, and resource conditions [4,11,22].
Simulating an optimal allocation of a 10,000 MW budget for the lagging countries showed an average increase from 9.8% to 23.1% of the 2030 target. At the sample level, the aggregate shortfall with respect to the 5 GW benchmark is about 67.7 GW, so our allocation model closes ≈14.8% of the gap. Allocations have the highest impact where there is already something to build on, yet ceilings are still distant. The pattern is familiar—new investments tend to follow policy support and high projected incomes [27,36,50]. When making decisions for new public investments, one can chase efficiency or aim for equity by helping those furthest behind. Most investment plans do a bit of both. They add targeted accelerators where momentum exists and put down foundations where systems are thin, while considering also grid upgrades [21,23]. Over 90% of governments invest in green-energy programs and broader sustainability agendas [50].
Our aim is practical: to help plan how limited financial resources for PV capacity development should be allocated at the EU level in order to maximize the system-level effects. Our research framework does three things. First, it pinpoints the laggards. Second, it puts countries on a comparable setting by deriving maturity years from bounded logistic fits. Third, it shows where a fixed budget buys the largest relative gains—i.e., where reallocations add most to the Union’s overall PV energy output. This logic is consistent with evidence that income gaps shape solar energy adoption across member states [27].
Considering the study findings, there are concrete insights that can be drawn by policymakers to optimize PV development across the EU and foster the green transformation of energy systems. Post-allocation, mean progress rises by about 13.3 percentage points (from 9.8% to 23.1%). This is meaningful yet modest once set against the budget-to-gap ratio (≈14.8%). [51] emphasize that while development in the EU is promising, it still does not fall onto the trajectory expected to meet the ambitious target of 1 TW of installed PV capacity by 2030. The countries with the highest potential for improvement are Bulgaria, Portugal, Romania and Sweden, which reach roughly 34–43% of their 2030 target under the proportional 10 GW scenario. The picture is different at the bottom of the distribution. Belgium, Slovenia, Finland, Latvia, and Ireland often remain near ~15% after reallocation. Low gains among very low-baseline countries illustrate the difficulty of scaling where foundational capacities are minimal. The policy lesson is familiar: efficiency versus equity. Concentrating funds where momentum exists lifts totals fastest; spreading them to very low-baseline systems serves fairness but moves the aggregate more slowly.
From a systems angle, money alone does not turn into usable capacity. It needs places to connect and a grid that can absorb it. That means timely interconnection, attention to power quality, and storage–inverter coordination—especially on feeders nearing high PV penetration [21,23]. In our view, gains among laggards are modest, which points to a simple conclusion: reallocation helps but will not be enough on its own. New funding programs for PV panel installations—paired with grid improvements—are required in order to meet the 2030 targets for solar energy production and make the EU energy system less dependent on fossil fuels.
While efficiency involves maximizing additional energy output per resources invested in 1 MW of installed capacity, this might favor concentrating resources in high-potential or mid-tier countries to rapidly enhance overall EU PV capacity, but equity principles highlight the need to spread investments proportionally across lagging nations. However, even if this equity approach promotes a fair distribution, it yields modest aggregate progress, consistent with a rise from 9.8% to 23.1% under the 10,000 MW budget constraint.
The limitations of the study include: the relatively short analysis period (2012–2022), the use of annual data (without seasonal granularity), the absence of differentiated costs, and parameters regarding the network or storage infrastructure. For example, in future research, the method of generation and transmission expansion planning—G&TNEP—can be used to identify the optimal location and size for new energy generation capacities, transmission lines and storage systems, based on functions formulated to minimize the investment and operating costs of projects [52]. Also, the assumption of logistic behavior may be restrictive for countries with irregular developments. If we look beyond our 2012–2022 estimation window, the EU solar energy sector kept expanding strongly in 2024: new installations reached about 65.5 GW, bringing the EU’s cumulative PV capacity to roughly 305 GW by year-end. Country totals illustrate the scale: Germany, ~90 GW (end-2024), and Spain, ~39 GW; in Eastern Europe, Poland, ~20–21 GW, Hungary, ~7.7 GW, and Romania, ~4.7 GW; and in the Nordics, Sweden, ~5 GW (IRENA, 2024). These magnitudes suggest that post-2022 policy and market conditions can lift near-term growth above what a 2012–2022 fit would imply; updating the dataset and refitting the models is therefore a natural next step. Other future research directions include: (1) integrating actual costs and network barriers into the allocation model; (2) extending the methodology globally or to regions bordering the EU; (3) simulating alternative distribution policies based on equity or technological neutrality.
6. Conclusions
This study is based on a system-level approach and proposes an original framework for efficient planning of investments in PV capacity deployment, built around three directions: data-driven grouping of national deployment paths, logistic curves that deliver comparable growth and maturity indicators, and a simple scenario for reallocating new capacity to lagging members. The core contribution is not another descriptive inventory of MW, but an updateable decision-support pipeline that converts heterogeneous national time series into (i) interpretable regime labels, (ii) a common maturity “clock,” and (iii) an auditable allocation baseline under an explicit resource constraint. The combination yields a clear maturity map and a way to test what modest budgets can and cannot deliver by 2030 in a transparent decision-support setting.
At the level of deployment clusters, the analysis points to three indicative hosting-capacity regimes. The “steady growth” class (Cluster 1) groups 18 systems with median 2022 PV capacity of about 1.25 GW and bounded logistic ceilings around 3.2 GW, corresponding to countries where PV is already material but still has substantial room to expand. The small “early plateau” class (Cluster 2) contains two large systems with median 2022 capacity near 6.3 GW and logistic ceilings around 18 GW, implying that several additional gigawatts of non-synchronous generation must be accommodated within existing networks. The “atypical paths” class (Cluster 3) has median 2022 capacity and logistic ceilings both around 0.7 GW, consistent with a small hosting envelope that has already been largely filled. Read as systems regimes, these clusters separate countries where the binding constraint is likely to be (a) the grid-integration layer, (b) the deployment pipeline, or (c) early saturation in local hosting envelopes. These regimes provide planning envelopes for reinforcement, storage siting and inverter-control requirements and for sequencing grid-enablement investments under heterogeneous national trajectories.
The results translate into systems-relevant engineering signals at the grid-integration layer. Countries on fast tracks (e.g., Sweden, Romania, Hungary, the Netherlands, Estonia, Latvia, Slovakia) will require earlier deployment of advanced inverter functions— reactive-power/voltage support and ride-through capabilities, together with faster MV/HV interconnection and observability upgrades—to keep power quality within limits as feeder penetration rises. Systems with large ceilings but later maturity (Germany, Spain, France) point to medium-term needs in converter sizing, curtailment management, and storage–inverter coordination, including DC-coupled architectures and congestion-aware control. Where baselines are very low, hardware alone is unlikely to move the needle; connection standards, protection settings, and digital monitoring must advance alongside funding to avoid delays at the point of interconnection and to avoid “paper capacity” that cannot be energized within planning horizons. This is the practical systems message: the same euro can buy very different “usable MW” depending on where the constraint sits in the interconnection–hosting–compliance chain.
The allocation experiment quantifies the policy room: distributing 10 GW across 15 countries below the 5 GW benchmark closes only ≈ 14.8% of the aggregate shortfall (~67.7 GW) yet lifts average progress from 9.8% to 23.1% (≈13.3 p.p.). Members with a non-trivial base—Bulgaria, Portugal, Romania, Sweden—advance to ~34–43%, while very low-baseline systems remain near ~15% despite sizable shares. The reading is straightforward: where a base already exists, incremental grid-integration measures for power-electronic converters (advanced settings, protection coordination, feeder reconfiguration, limited storage) pay off quickly; where it does not, multi-year grid enablement (substation upgrades, MVDC pilots, telemetry, flexible interconnection) must accompany spending to relax binding system constraints rather than merely reassign budget shares. Accordingly, budget reallocation can improve system-wide progress at the margin, but it cannot replace constraint-relaxing investments that raise the effective hosting envelope.
Methodologically, the paper is based on a system-level approach and contributes to a compact toolkit—clustering, bounded logistic fits, and an interpretable maturity metric—that is reproducible with official statistics and easy to update. It can be slotted into planning workflows that size inverter fleets, test grid-code compliance in simulation, and prioritize feeders for storage or reactive support or, at a higher level, to rank countries by the likelihood that interconnection and power-quality constraints will become binding before 2030. In the European context, the cluster-specific maturity horizons can be aligned with existing interconnection and power-quality frameworks, including the EU network code “Requirements for Generators” [47], the EN 50549-1/-2 standards for connecting generation to LV and MV distribution networks, and national specifications such as VDE-AR-N 4105. These codes already prescribe ranges for ride-through behavior, reactive-power capability and voltage limits; the maturity maps indicate when such requirements are likely to become binding for most new PV capacity in each regime. The cluster-level maturity summaries are designed precisely for this purpose: to translate trajectory classes into indicative timelines for when advanced inverter functions, stricter voltage and THD limits, and MV/HV upgrades become most urgent. As Eurostat series extend beyond 2022 and as comparable indicators of interconnection throughput and hosting headroom improve, the same pipeline can be re-run to refresh maturity maps and to turn the allocation baseline into a constraint-aware scenario tool—still transparent, still auditable, but closer to how system operators and regulators stage PV at scale.
Author Contributions
Conceptualization, C.T., R.I.D. and A.I.B.; literature review, R.I.D., M.G. and A.I.B.; methodology, C.T.; formal analysis, C.T.; discussion of results, C.T., R.I.D., M.G. and A.I.B.; writing—review and editing, C.T., R.I.D. and M.G.; conclusions, C.T.; supervision, C.T. All authors have read and agreed to the published version of the manuscript.
Funding
This work was partially supported by a grant offered by the Bucharest University of Economic Studies, project title “Analysis of current uncertainties generated by public policies and international tariff strategies on the economic environment (EconST2025)”, ctr no 6848/31.05.2025. This paper was also co-financed by the Bucharest University of Economic Studies (ASE) during the PhD program for Mr. Bulgaru.
Data Availability Statement
The country-level photovoltaic capacity series used in this study are publicly available from Eurostat’s electricity statistics as net maximum electrical capacity of photovoltaic installations operated by main-activity producers (table nrg_inf_epc). Global and EU-wide aggregates and contextual indicators reported in the text are drawn from datasets and reports published by the IEA and IRENA, as detailed in the References. The cleaned country–year panel and the main derived indicators used in the analysis (logistic parameters, lagging-country shortfalls, and the 10 GW allocation results) have been deposited in a public Zenodo repository (https://doi.org/10.5281/zenodo.17782383 accessed on 10 February 2026). A brief description of the Eurostat extract and filters is provided in Appendix B.
Conflicts of Interest
The authors declare no conflicts of interest.
Appendix A. Cluster Classification
Table A1.
EU countries’ cluster membership under Ward.D2 hierarchical clustering of row-standardized PV capacity trajectories (2012–2022), with .
Appendix B. Eurostat Data Extract and Filters
All PV capacity series used in this study are drawn from Eurostat table nrg_inf_epc (“Electricity production capacities by main fuel groups and operator”). The extract applies the following filters:
- -
- Fuel group: solar photovoltaic;
- -
- Indicator: net maximum electrical capacity;
- -
- Operator: main-activity producers;
- -
- Unit: megawatt (MW);
- -
- Time: 2012–2022;
- -
- GEO: starting from all EU-27 member states plus EU aggregates, we drop the aggregate series, then remove Denmark, Luxembourg, Malta and Poland (all reported zero in this category over 2012–2022) and Belgium (constant at 4.6 MW). The final panel used in the analysis covers: Austria, Bulgaria, Croatia, Cyprus, Czechia, Estonia, Finland, France, Germany, Greece, Hungary, Ireland, Italy, Latvia, Lithuania, the Netherlands, Portugal, Romania, Slovakia, Slovenia, Spain and Sweden. This exclusion applies only to the trajectory-based stages of the analysis. In the allocation experiment, countries such as Belgium may still be considered when observed 2022 capacity levels are used to define laggards and compute shortfalls relative to the benchmark.
The resulting country–year panel was exported as a .xlsx file and forms the input to the R code described in Section 3.2.
Appendix C. Clustering Diagnostics and Robustness Checks
Table A2.
Average silhouette widths by number of clusters and distance/standardization.
Appendix D. Logistic-Fit Diagnostics and Flagged Cases
To assess the quality of the bounded logistic models, we report for each country the estimated parameters and basic fit diagnostics. Table A3 lists the asymptotic capacity , intrinsic growth rate , inflection year , root mean squared error (RMSE), normalized RMSE (NRMSE), and the 80% and 90% saturation years implied by the fitted curve, together with a reliability flag. The latter takes value 1 for fits that satisfy the criteria in Section 3.2.2 (, NRMSE < 0.30, and 80%/90% saturation dates before 2100) and 0 otherwise. In the main analysis we use only maturity years from reliable fits; non-reliable cases are shown here for completeness but are not interpreted. This restriction applies to the maturity analysis only. In the allocation experiment, observed 2022 capacities from such countries may still be used to define laggards and calculate shortfalls, because that step does not require reliable logistic maturity estimates.
Table A3.
Logistic parameter estimates and fit diagnostics for national PV capacity trajectories (2012–2022).
Appendix E. Budget Sensitivity of the Proportional Shortfall Allocation
Table A4.
Fraction of aggregate shortfall to the 5 GW benchmark closed under alternative budgets.
Appendix F. Exemplification of the Logistic Fit
Figure A1.
Bounded logistic fit for Germany’s PV capacity (2012–2022), showing observed data and the estimated trajectory used to derive maturity years. Source: authors’ work in R software 4.4.2.
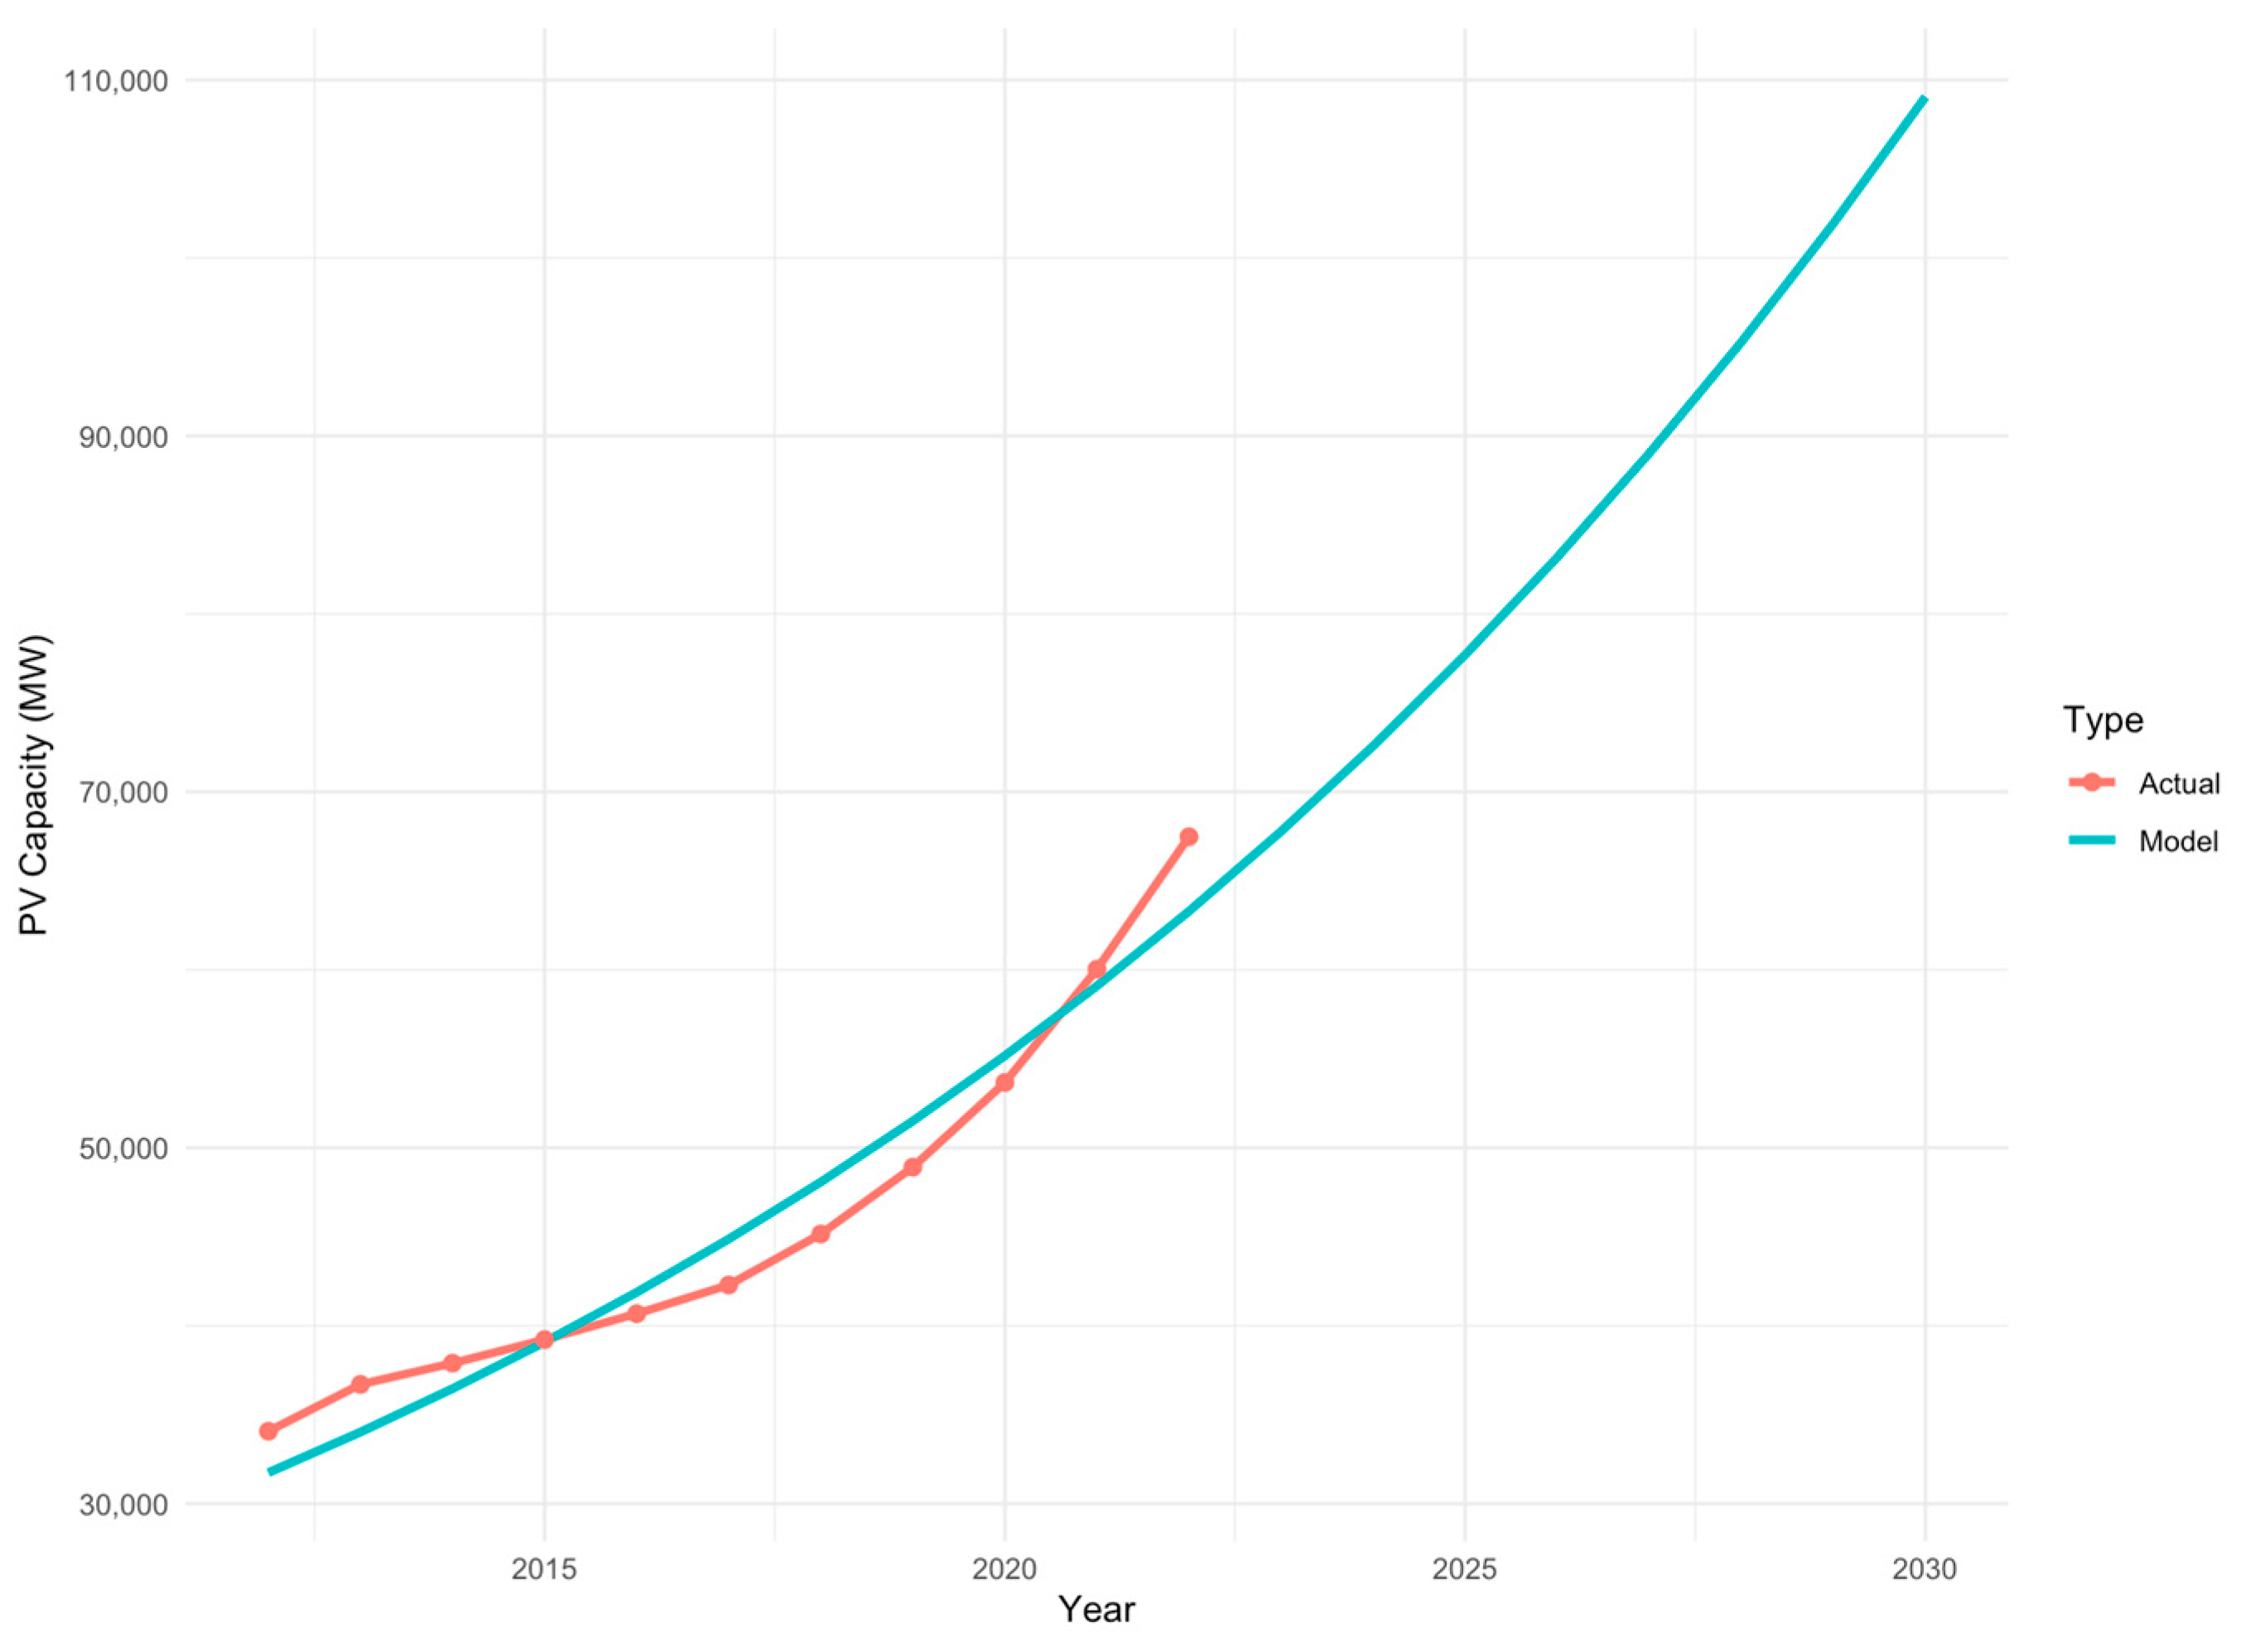
References
- Tudor, C.; Sova, R.; Stamatiou, P.; Vlachos, V.; Polychronidou, P. Future-Proofing EU-27 Energy Policies with AI: Analyzing and Forecasting Fossil Fuel Trends. Electronics 2025, 14, 631. [Google Scholar] [CrossRef] [Scilit]
- IPCC (Intergovernmental Panel on Climate Change). IPCC Sixth Assessment Report, WG III. 2022. Available online: https://www.ipcc.ch/report/ar6/wg3/ (accessed on 5 August 2025).
- European Commission. Communication from the Commission to the European Parliament, the European Council, the Council, the European Economic and Social Committee and the Committee of the Regions REPowerEU: Joint European Action for More Affordable, Secure and Sustainable Energy. 2022. Available online: https://eur-lex.europa.eu/legal-content/EN/TXT/?uri=COM%3A2022%3A108%3AFIN (accessed on 10 September 2025).
- Sampaio, P.; González, M. Photovoltaic solar energy: Conceptual framework. Renew. Sustain. Energy Rev. 2017, 74, 590–601. [Google Scholar] [CrossRef] [Scilit]
- Ali, A.; Ouhassan, Y.; Abouyaakoub, M.; Chahboun, M.; Hihi, H. The impact of desert regions on solar energy production with the evaluation of groundwater for maintenance: A case study in Morocco. Sustainability 2024, 16, 5476. [Google Scholar] [CrossRef] [Scilit]
- Meadows, D.H. Thinking in Systems: A Primer; Earthscan: London, UK, 2008; Available online: https://research.fit.edu/media/site-specific/researchfitedu/coast-climate-adaptation-library/climate-communications/psychology-amp-behavior/Meadows-2008.-Thinking-in-Systems.pdf (accessed on 5 February 2026).
- Sterman, J. System Dynamics: Systems Thinking and Modeling for a Complex World; Working Paper Series ESD-WP-2003-01.13-ESD Internal Symposium; Massachusetts Institute of Technology Engineering Systems Division: Cambridge, MA, USA, 2002; Available online: https://dspace.mit.edu/bitstream/handle/1721.1/102741/esd-wp-2003-01.13.pdf (accessed on 10 February 2026).
- Rivero-Iglesias, J.M.; Puente, J.; Fernandez, I.; León, O. A Novel Combined Hybrid Group Multi-Criteria Decision-Making Model for the Selection of Power Generation Technologies. Systems 2025, 13, 742. [Google Scholar] [CrossRef] [Scilit]
- Huang, G.; Tang, Y.; Chen, X.; Chen, M.; Jiang, Y. A comprehensive review of floating solar plants and potentials for offshore applications. J. Mar. Sci. Eng. 2023, 11, 2064. [Google Scholar] [CrossRef] [Scilit]
- IEA (International Energy Agency). Renewables 2024. Analysis and Forecast to 2030. Available online: https://iea.blob.core.windows.net/assets/17033b62-07a5-4144-8dd0-651cdb6caa24/Renewables2024.pdf (accessed on 20 November 2025).
- Meng, L.; Zhou, W.; Li, Y.; Liu, Z.; Liu, Y. Multi-objective optimization of solar thermal photovoltaic hybrid power generation system based on NSGA-II algorithm. MATEC Web Conf. 2021, 336, 02022. [Google Scholar] [CrossRef] [Scilit]
- IEA (International Energy Agency). Evolution of Annual Solar PV Installations and Share by Segmentation, 2000–2021. 2022. Available online: https://www.iea.org/data-and-statistics/charts/evolution-of-annual-solar-pv-installations-and-share-by-segmentation-2000-2021 (accessed on 18 September 2025).
- Lits, C. The Rise of Solar PV in the EU—Key Facts; Solar Power Europe: Brussels, Belgium, 2024; Available online: https://www.solarpowereurope.org/insights/interactive-data/total-eu-27-solar-pv-capacity-a-growth-story (accessed on 15 September 2025).
- Liu, H.; Qiu, C.; Guo, L.; Lian, J.; Yao, Y. Static mechanical loading tests on photovoltaic modules accounting for wind-induced non-uniformity: Crack evolution and electrical performance degradation. Sol. Energy Mater. Sol. Cells 2026, 299, 114208. [Google Scholar] [CrossRef] [Scilit]
- IEA (International Energy Agency). Solar PV Still Dominates Renewable Energy Capacity Additions. 2025. Available online: https://www.iea.org/energy-system/renewables/solar-pv (accessed on 14 March 2026).
- Koval, V.; Sribna, Y.; Brednyova, V.; Kosharska, L.; Halushchak, M.; Kopacz, M. An analysis of the economic and technological potential of solar-driven generation in renewable energy development. Polityka Energetyczna Energy Policy J. 2024, 27, 157–172. [Google Scholar] [CrossRef] [Scilit]
- IRENA (International Renewable Energy Agency). Renewable Energy Statistics 2025. Available online: https://www.irena.org/-/media/Files/IRENA/Agency/Publication/2025/Jul/IRENA_DAT_RE_Statistics_2025.pdf (accessed on 19 November 2025).
- Trifonov, I.; Trukhan, D.; Koshlich, Y.; Prasolov, V.; Slusarczyk, B. Influence of the Share of Renewable Energy Sources on the Level of Energy Security in EECCA Countries. Energies 2021, 14, 903. [Google Scholar] [CrossRef] [Scilit]
- Madsen, D.N.; Hansen, J.P. Outlook of solar energy in Europe based on economic growth characteristics. Renew. Sustain. Energy Rev. 2019, 114, 109306. [Google Scholar] [CrossRef] [Scilit]
- Yao, H.; Liu, J.; Chang, Y.; Liu, D.; Wang, R. Improving distributed renewable energy power planning through particle swarm algorithm. Int. J. Distrib. Syst. Technol. 2024, 15, 1–14. [Google Scholar] [CrossRef] [Scilit]
- Saidi, M.; Li, Z.; Elghali, S.; Outbib, R. Optimal sizing of hybrid grid-connected energy system with demand side scheduling. In Proceedings of the IECON 2019—45th Annual Conference of the IEEE Industrial Electronics Society, Lisbon, Portugal, 14–17 October 2019; pp. 2209–2214. [Google Scholar] [CrossRef] [Scilit]
- Jäger-Waldau, A. Snapshot of photovoltaics – February 2022. EPJ Photovolt. 2022, 13, 9. [Google Scholar] [CrossRef] [Scilit]
- Polverini, D. Regulating the circular economy within the ecodesign directive: Progress so far, methodological challenges and outlook. Sustain. Prod. Consum. 2021, 27, 1113–1123. [Google Scholar] [CrossRef] [Scilit]
- European Commission. EU Solar Energy Strategy; European Commission: Brussels, Belgium, 2022; Available online: https://energy.ec.europa.eu/topics/renewable-energy/solar-energy_en (accessed on 14 March 2026).
- Kut, P.; Pietrucha-Urbanik, K.; Tchórzewska-Cieślak, B. Reliability-oriented design of a solar-PV deployments. Energies 2021, 14, 6535. [Google Scholar] [CrossRef] [Scilit]
- Blanco-Díez, P.; Díez-Mediavilla, M.; Alonso-Tristán, C. Review of the legislative framework for the remuneration of photovoltaic production in Spain: A case study. Sustainability 2020, 12, 1214. [Google Scholar] [CrossRef] [Scilit]
- Wolniak, R.; Skotnicka–Zasadzień, B. Development of photovoltaic energy in EU countries as an alternative to fossil fuels. Energies 2022, 15, 662. [Google Scholar] [CrossRef] [Scilit]
- Simionescu, M.; Rădulescu, M.; Cifuentes-Faura, J. Renewable energy consumption-growth nexus in European countries: A sectoral approach. Eval. Rev. 2022, 47, 287–319. [Google Scholar] [CrossRef] [Scilit] [PubMed]
- IRENA (International Renewable Energy Agency). Global Landscape of Renewable Energy Finance 2020, Abu Dhabi. 2020. Available online: https://www.irena.org/-/media/Files/IRENA/Agency/Publication/2020/Nov/IRENA_GLREF_2020_Methodology.pdf (accessed on 19 November 2025).
- Hemetsberger, W.; Acke, D.; Schmela, M. EU Market Outlook for Solar Power 2024–2028. SolarPower 2024. Available online: https://www.solarpowereurope.org/insights/outlooks/eu-market-outlook-for-solar-power-2024-2028/detail (accessed on 15 July 2025).
- Muneer, W. Large-Scale Solar PV Investment Planning Studies; University of Waterloo: Waterloo, ON, Canada, 2011; Thesis presented at Master of Applied Science in Electrical & Computer Engineering; Available online: https://www.researchgate.net/profile/Wajid_Muneer/publication/268427625_Large-Scale_Solar_PV_Investment_Planning_Studies/links/552d52880cf2e089a3ad7368/Large-Scale-Solar-PV-Investment-Planning-Studies.pdf?__cf_chl_tk=0w4m9RlGWAUZVKPQkkrA6wSQNmzknjHOLBiVAee9Vrw-1758448283-1.0.1.1-IVbu8GG18cG1k_ufqLpxdtZIz21O2jZr6tO8cp7dBVo (accessed on 12 September 2025).
- Gómez-Restrepo, A.M.; González-Ruiz, J.D.; Botero, S.B. Financial Investment Valuation Models for Photovoltaic and Energy Storage Projects: Trends and Challenges. Energies 2024, 17, 2653. [Google Scholar] [CrossRef] [Scilit]
- Vinichenko, V.; Jewell, J.; Jacobsson, J.; Cherp, A. Historical diffusion of nuclear, wind and solar power in different national contexts: Implications for climate mitigation pathways. Environ. Res. Lett. 2023, 18, 094066. [Google Scholar] [CrossRef] [Scilit]
- Firoozi, A.A.; Firoozi, A.A.; Maghami, M.R. Harnessing photovoltaic innovation: Advancements, challenges, and strategic pathways for sustainable global development. Energy Convers. Manag. X 2025, 27, 101058. [Google Scholar] [CrossRef] [Scilit]
- Manolache, M.; Manolache, A.I.; Andrei, G. Floating Solar Energy Systems: A Review of Economic Feasibility and Cross-Sector Integration with Marine Renewable Energy, Aquaculture and Hydrogen. Mar. Sci. Eng. 2025, 13, 1404. [Google Scholar] [CrossRef] [Scilit]
- Jacobs, D.; Sovacool, B. Feed-In Tariffs and Other Support Mechanisms for Solar PV Promotion. Compr. Renew. Energy 2012, 1, 73–109. [Google Scholar] [CrossRef] [Scilit]
- Chen, Z.; Zhang, T.; Cui, W. A Cooperative Game Theoretical Approach for Designing Integrated Photovoltaic and Energy Storage Systems Shared Among Localized Users. Systems 2025, 13, 712. [Google Scholar] [CrossRef] [Scilit]
- Cangul, O.; Rocchetta, R.; Fahrioglu, M.; Patelli, E. Optimal Allocation and Sizing of Decentralized Solar Photovoltaic Generators Using Unit Financial Impact Indicator. Sustainability 2023, 15, 11715. [Google Scholar] [CrossRef] [Scilit]
- Greene, D.; Cunningham, P.; Mayer, R. Unsupervised learning and clustering. In Machine Learning Techniques for Multimedia: Case Studies on Organization and Retrieval; Springer: Berlin, Germany, 2008; pp. 51–90. [Google Scholar]
- Sinaga, K.P.; Yang, M.-S. Unsupervised K-means clustering algorithm. IEEE Access 2020, 8, 80716–80727. [Google Scholar] [CrossRef] [Scilit]
- Gower, J.C. Properties of Euclidean and non-Euclidean distance matrices. Linear Algebra Its Appl. 1985, 67, 81–97. [Google Scholar] [CrossRef] [Scilit]
- Sharma, S.; Batra, N. Comparative study of single linkage, complete linkage, and ward method of agglomerative clustering. In International Conference on Machine Learning, Big Data, Cloud and Parallel Computing (COMITCon); IEEE: New York, NY, USA, 2019; pp. 568–573. [Google Scholar]
- Oliver, F.R. Methods of estimating the logistic growth function. J. R. Stat. Soc. Ser. C Appl. Stat. 1964, 13, 57–66. [Google Scholar] [CrossRef] [Scilit]
- Tsoularis, A.; Wallace, J. Analysis of logistic growth models. Math. Biosci. 2002, 179, 21–55. [Google Scholar] [CrossRef] [Scilit]
- Fisher, J.C.; Pry, R.H. A simple substitution model of technological change. Technol. Forecast. Soc. Chang. 1971, 3, 75–88. [Google Scholar] [CrossRef] [Scilit]
- Rodríguez López, N.; Alvarez Cabal, J.V.; Cuiñas, M.C.; Ortega Fernández, F. Applicability of technology maturity level evaluation methodologies within small- and medium-sized organizations: Prospects and proposals. Systems 2023, 11, 387. [Google Scholar] [CrossRef] [Scilit]
- European Commission. Commission Regulation (EU) 2016/631 of 14 April 2016 Establishing a Network Code on Requirements for Grid Connection of Generators (Text with EEARelevance). Off. J. Eur. Union 2016, L 112, 1–68. Available online: https://eur-lex.europa.eu/eli/reg/2016/631/oj (accessed on 1 December 2025).
- CENELEC EN 50549-2:2019; Requirements for Generating Plants to be Connected in Parallel with Distribution Networks—Part 2: Connection to a MV Distribution Network—Generating Plants up to and Including Type B. CENELEC: Brussels, Belgium, 2019. Available online: https://knowledge.bsigroup.com/products/requirements-for-generating-plants-to-be-connected-in-parallel-with-distribution-networks-connection-to-a-mv-distribution-network-generating-plants-up-to-and-including-type-b (accessed on 1 December 2025).
- VDE-AR-N 4105:2018-11; Generators Connected to the Low-Voltage Distribution Network—Technical Requirements for the Connection to and Parallel Operation with Low-Voltage Distribution Networks. VDE FNN: Frankfurt am Main, Germany, 2018. Available online: https://www.vde.com/en/fnn/topics/technical-connection-rules/power-generating-plants (accessed on 1 December 2025).
- Androniceanu, A.; Sabie, O.M. Overview of green energy as a real strategic option for sustainable development. Energies 2022, 15, 8573. [Google Scholar] [CrossRef] [Scilit]
- Chatzipanagi, A.; Jäger-Waldau, A. The European solar communication—Will it pave the road to achieve 1 TW of photovoltaic system capacity in the European Union by 2030? Sustainability 2023, 15, 6531. [Google Scholar] [CrossRef] [Scilit]
- Refaat, M.M.; Aleem, S.H.E.A.; Atia, Y.; Zahab, E.E.D.A.; Sayed, M.M. A New Decision-Making Strategy for Techno-Economic Assessment of Generation and Transmission Expansion Planning for Modern Power Systems. Systems 2023, 11, 23. [Google Scholar] [CrossRef] [Scilit]
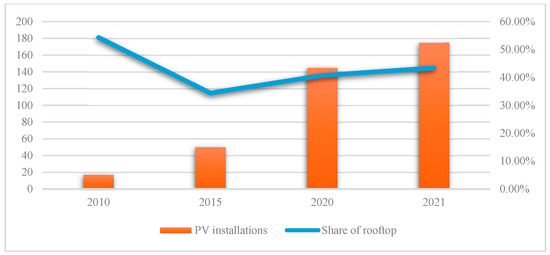
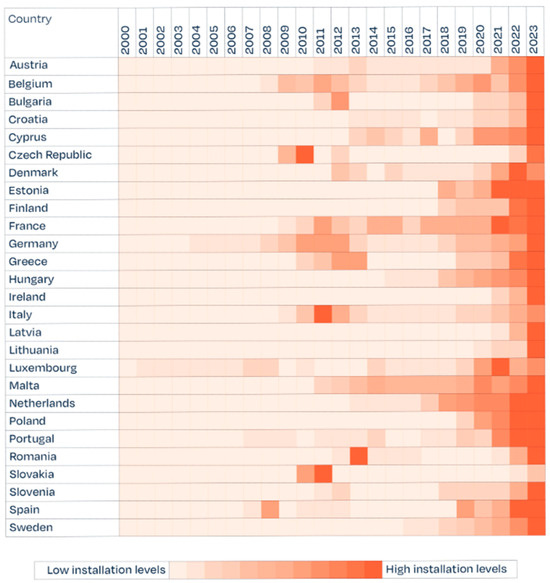
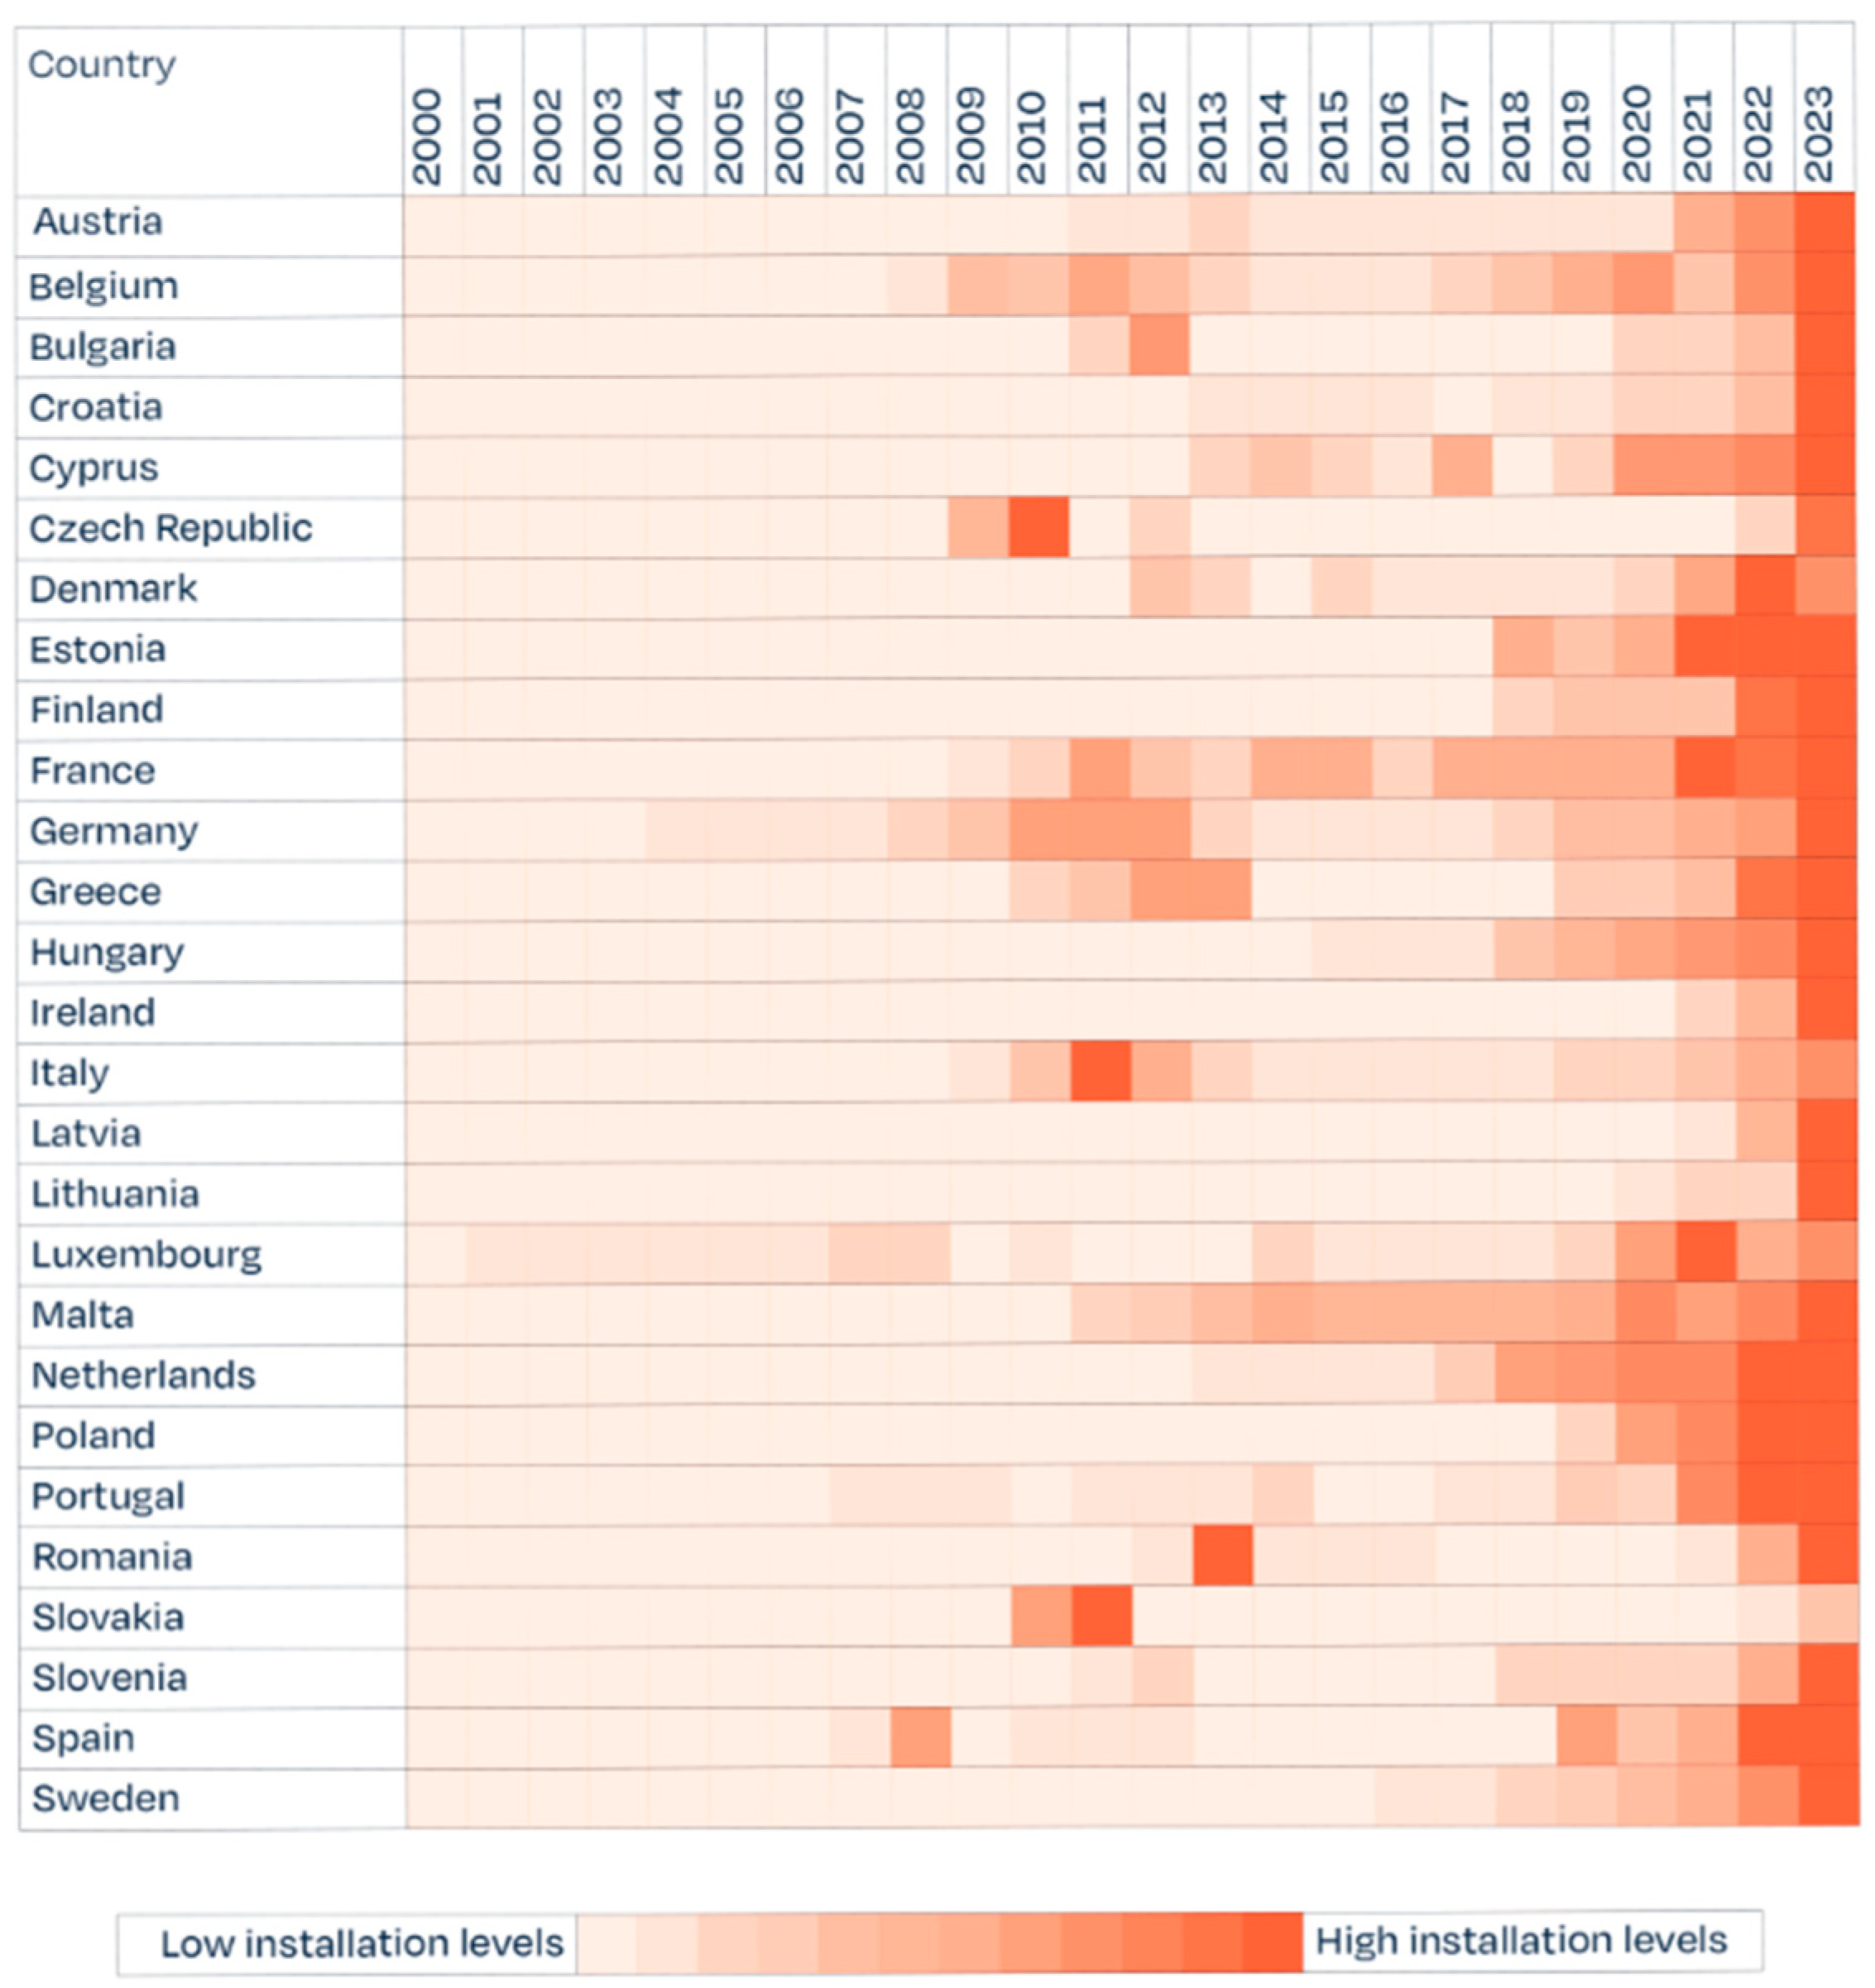
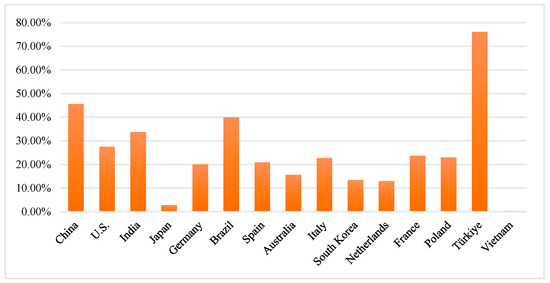
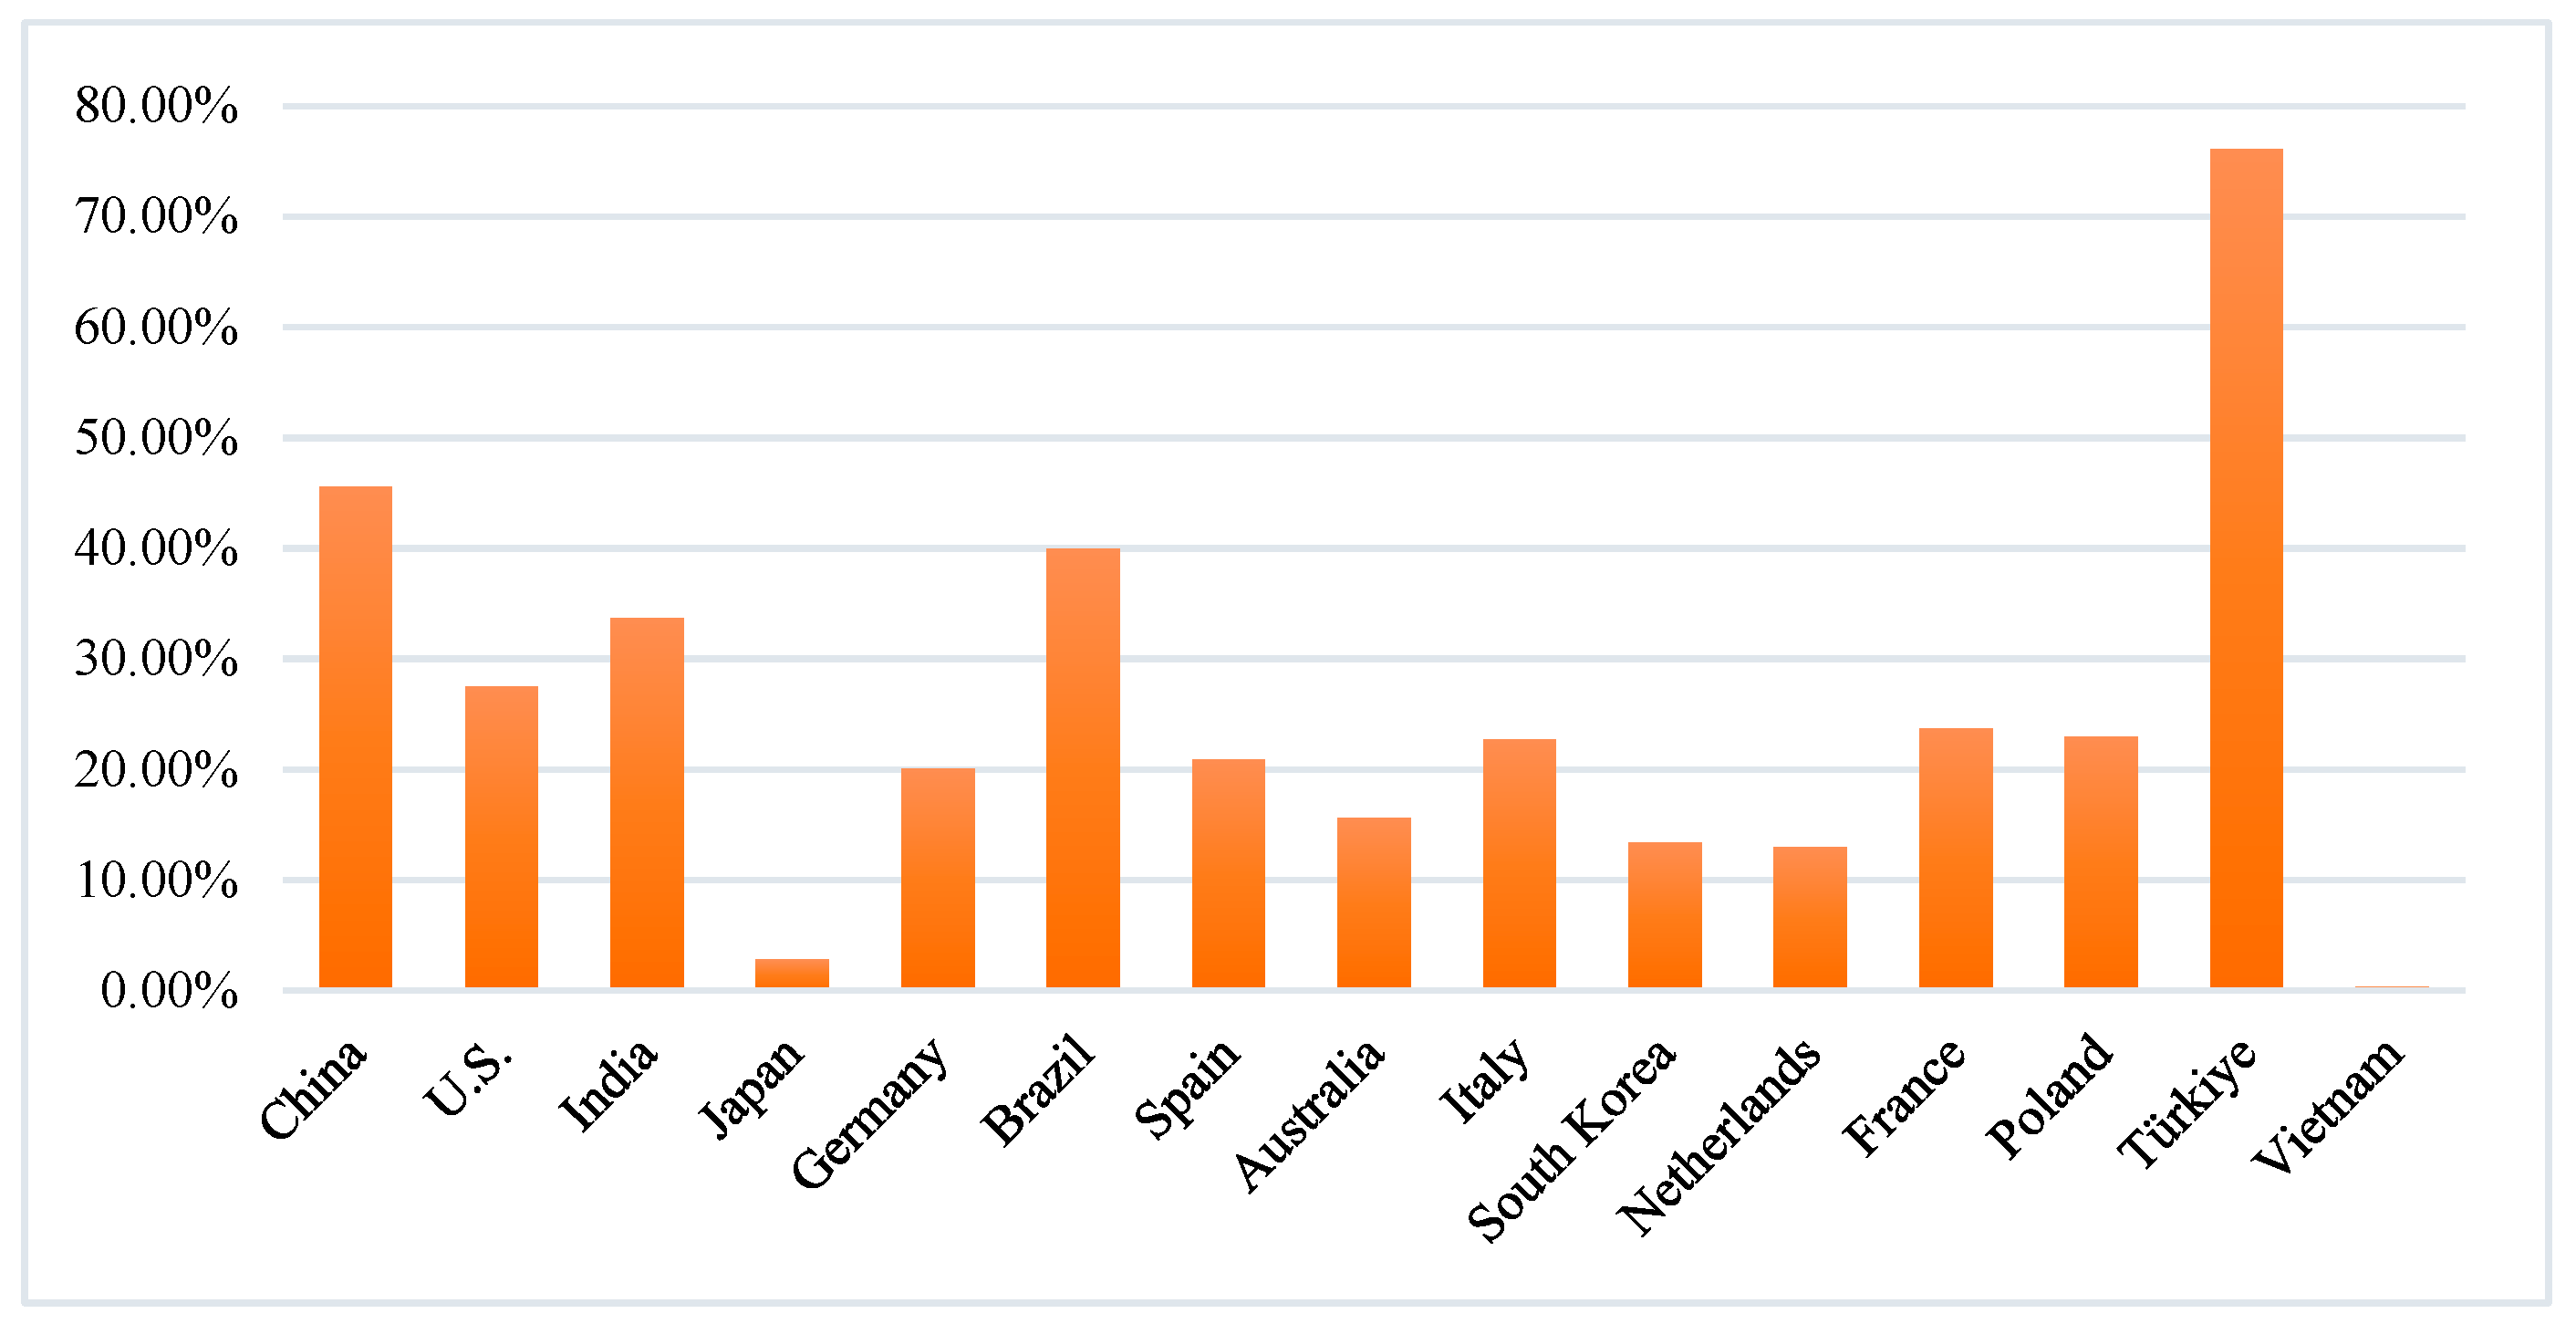
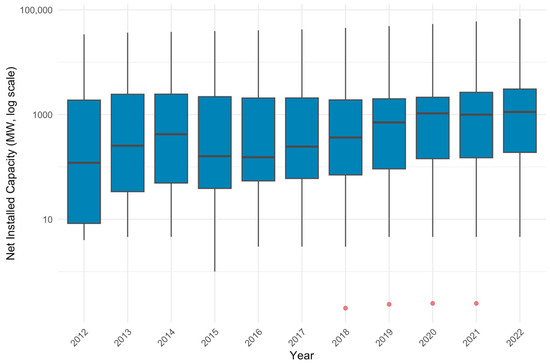
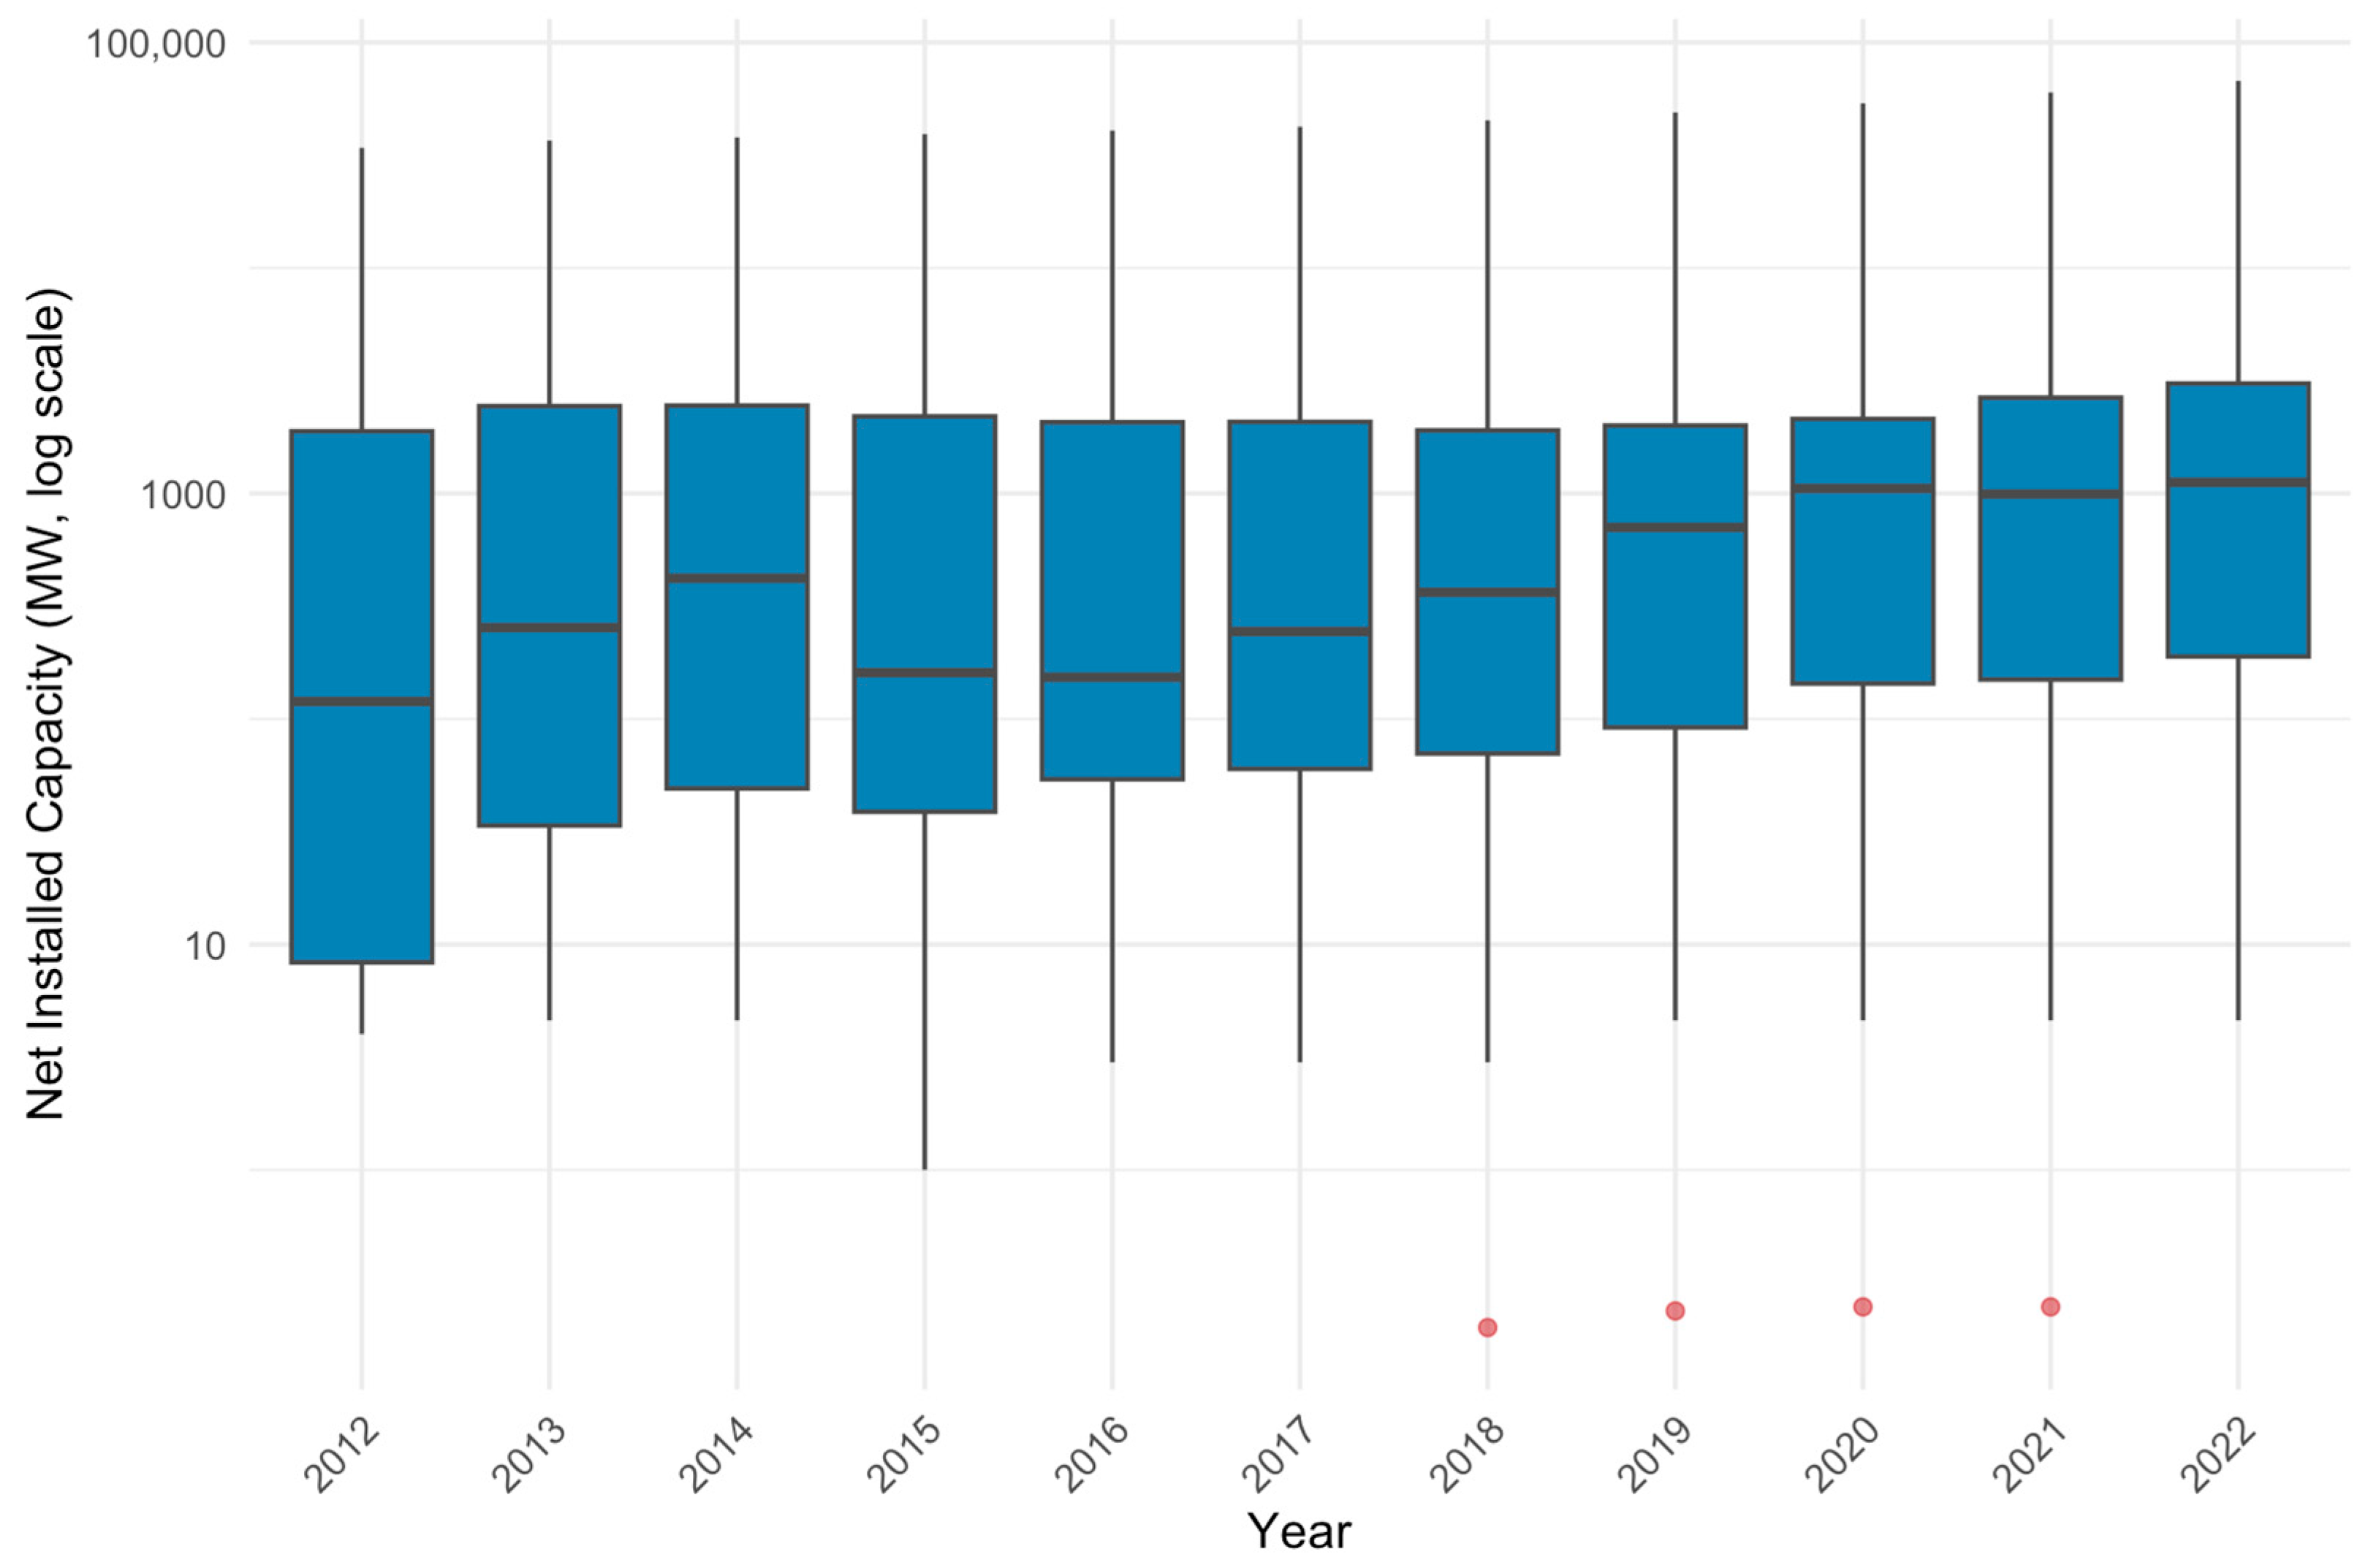
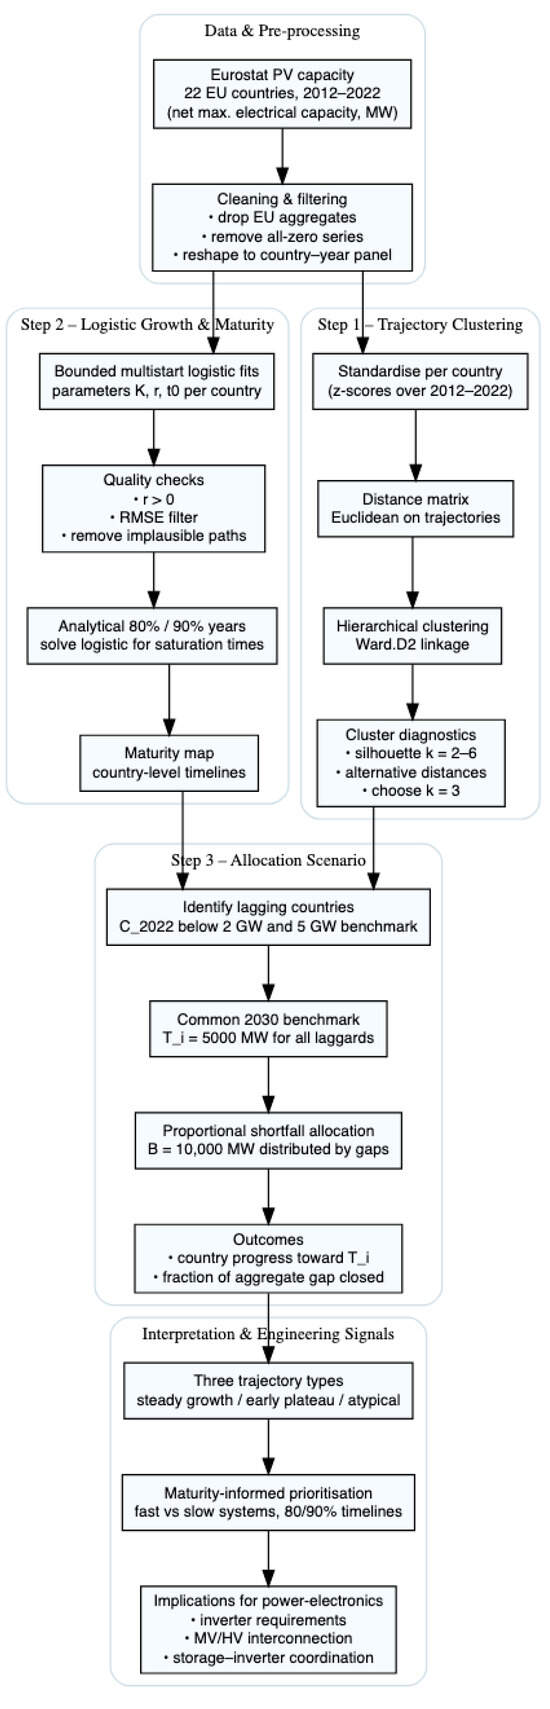
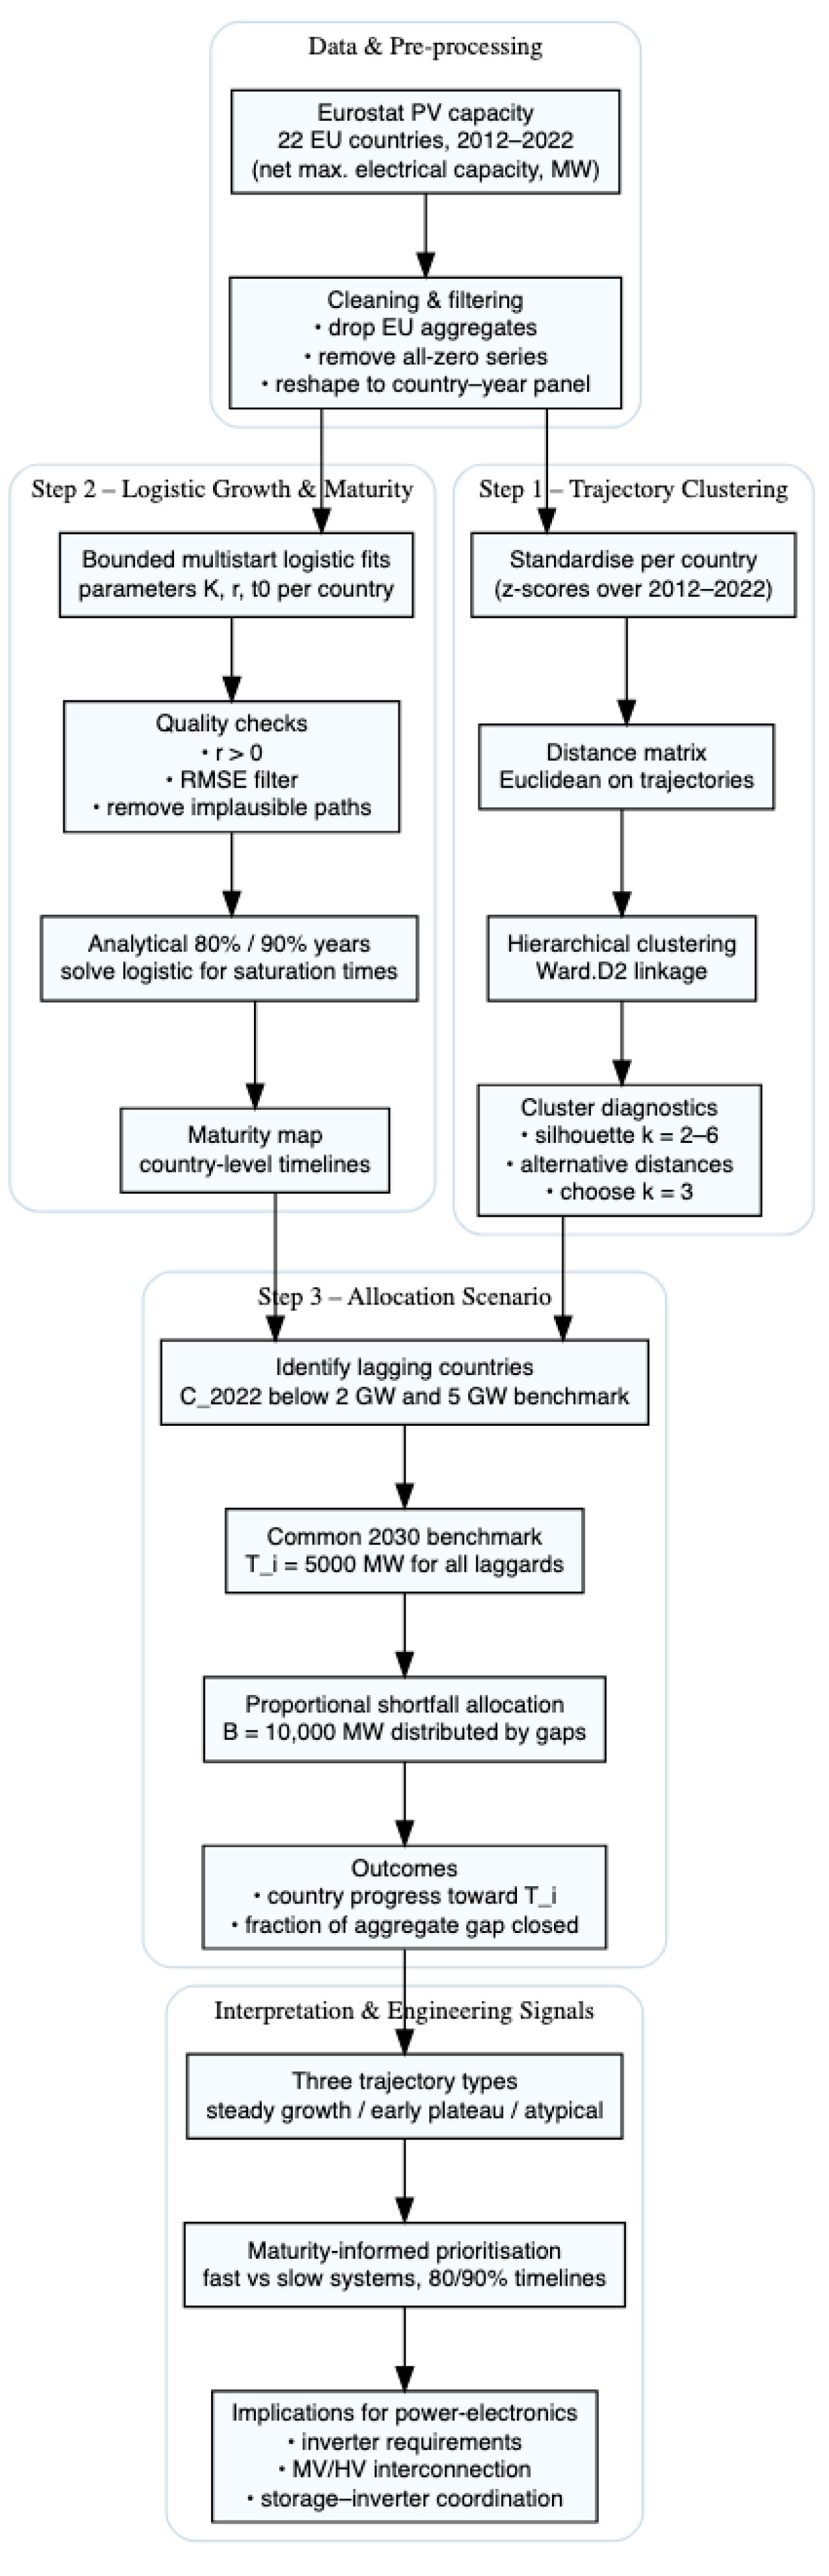
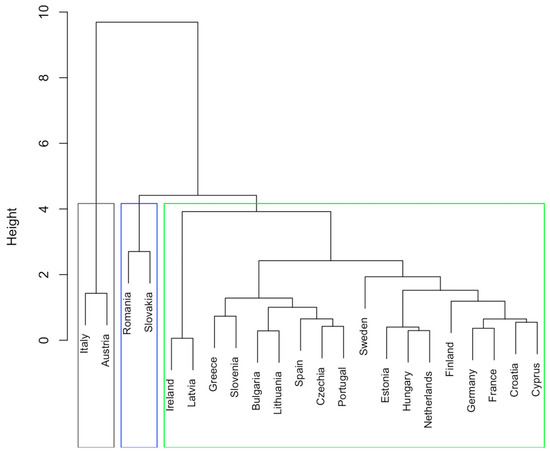
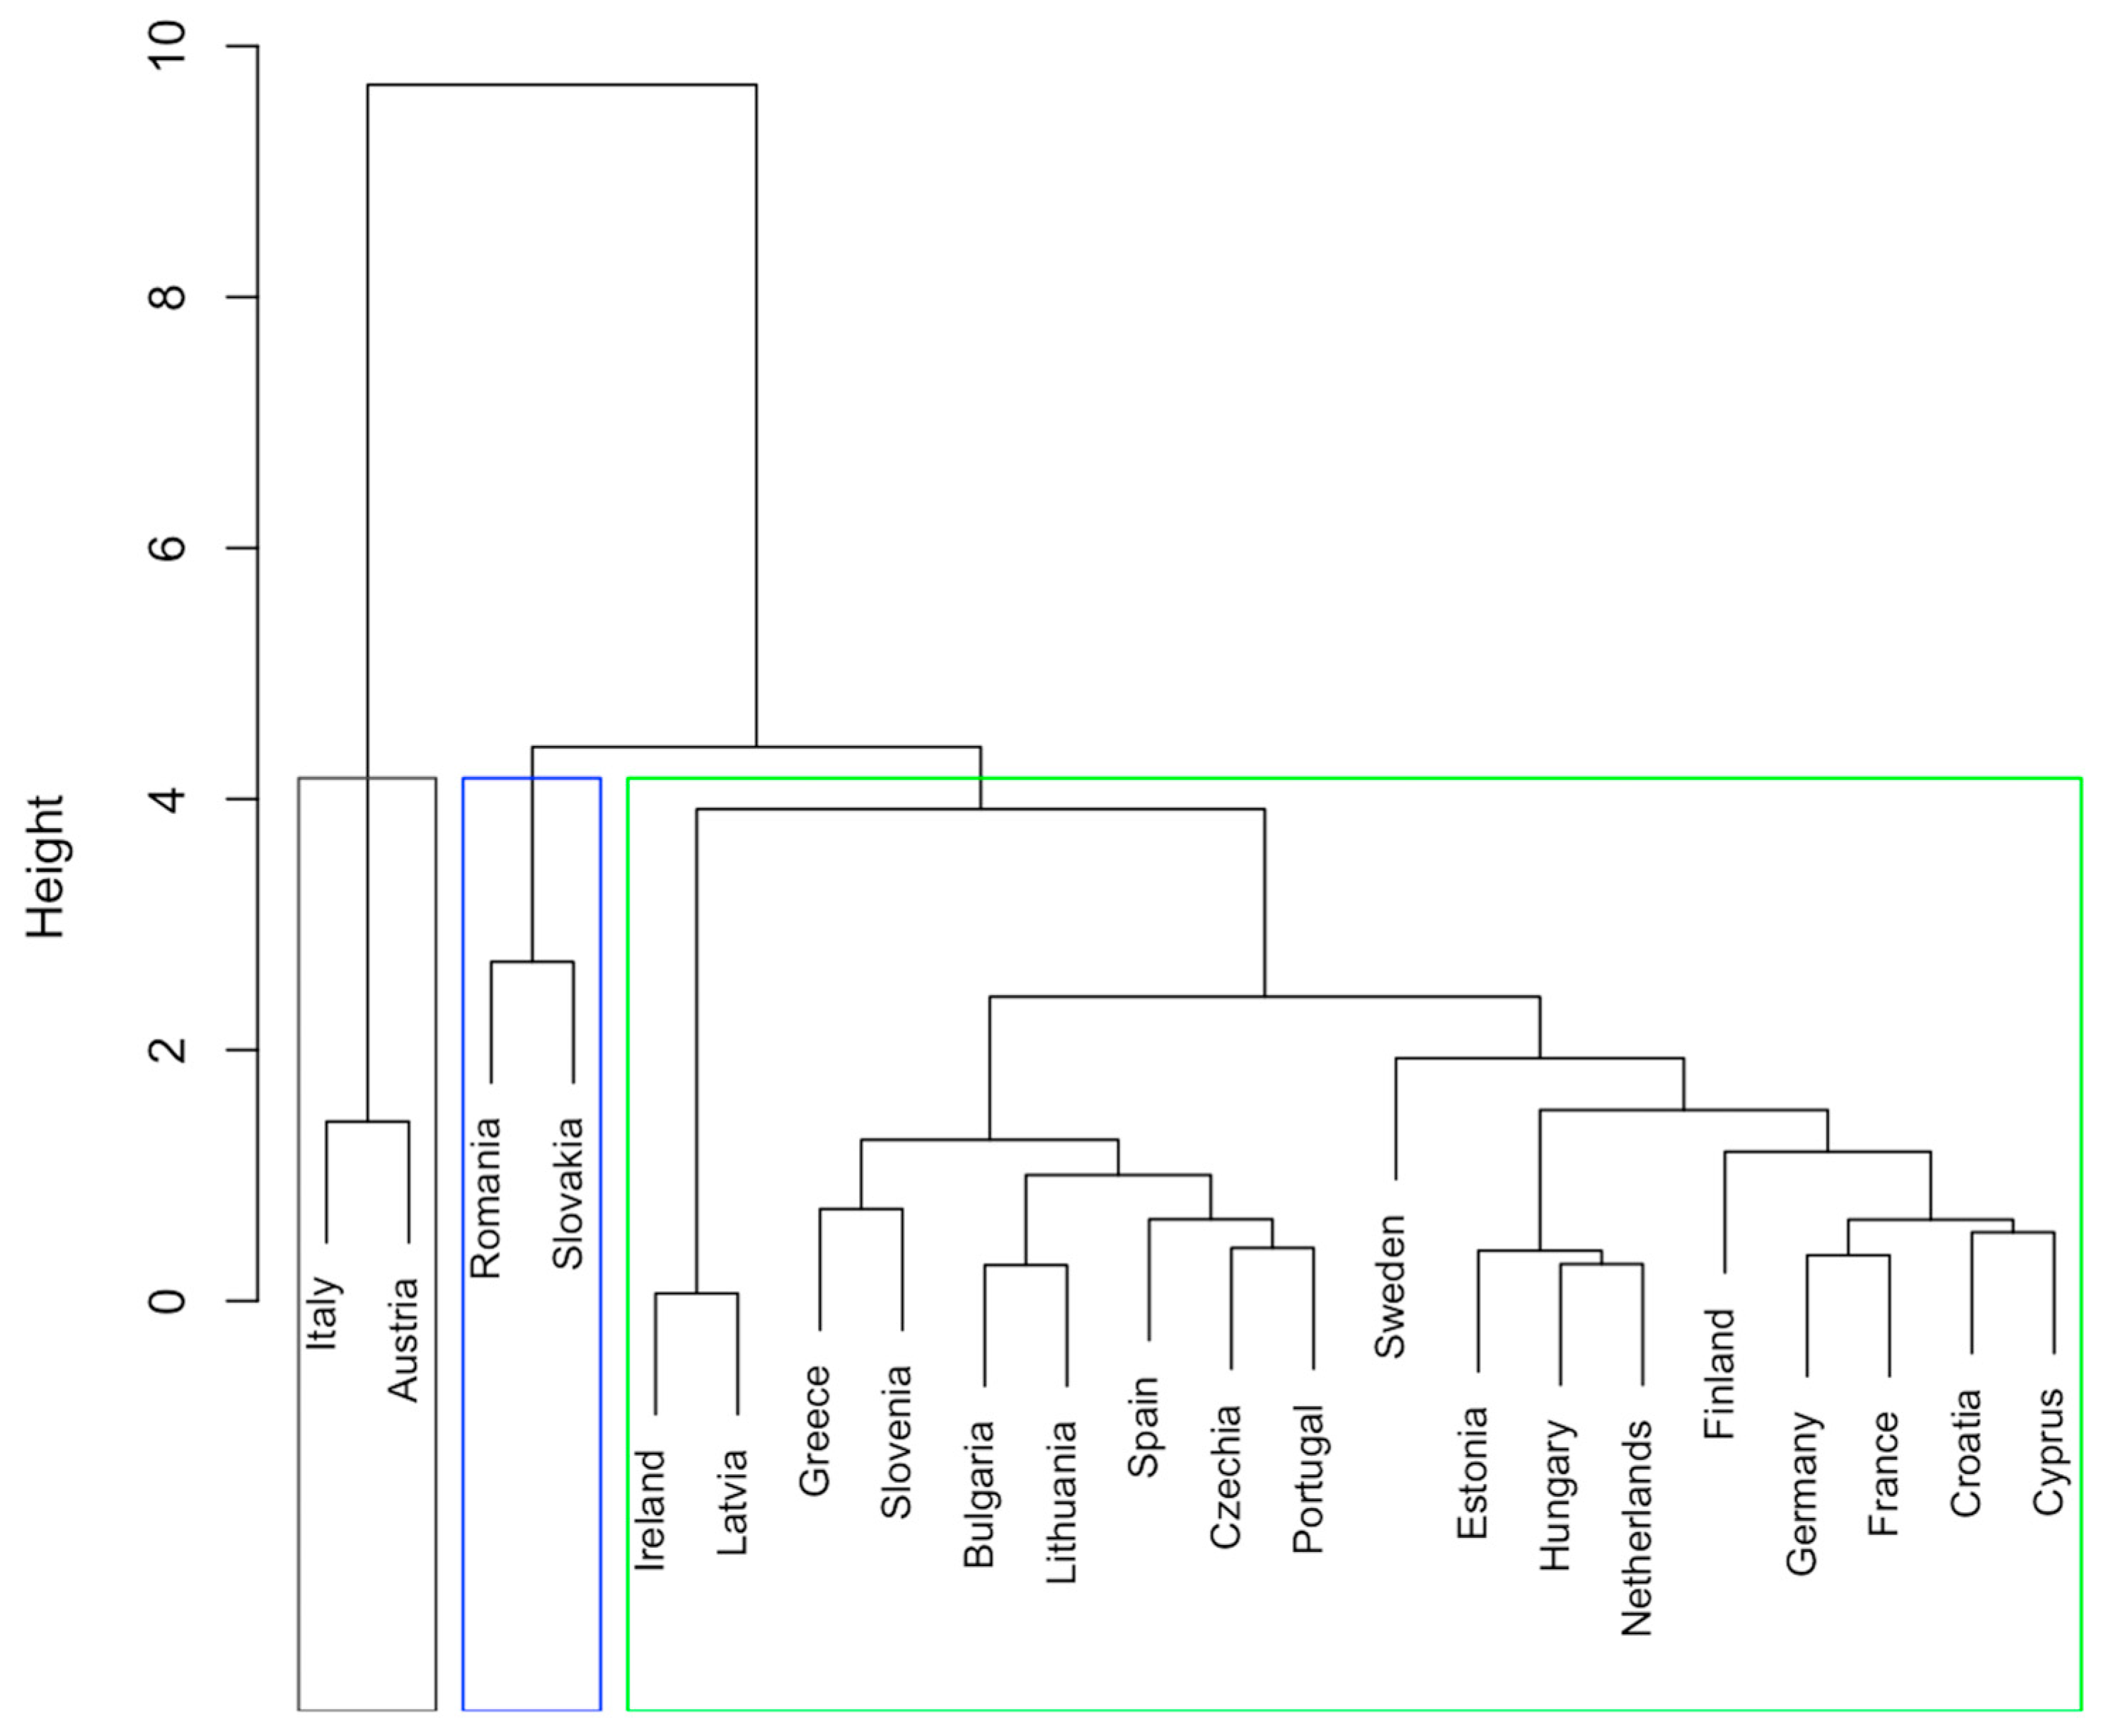
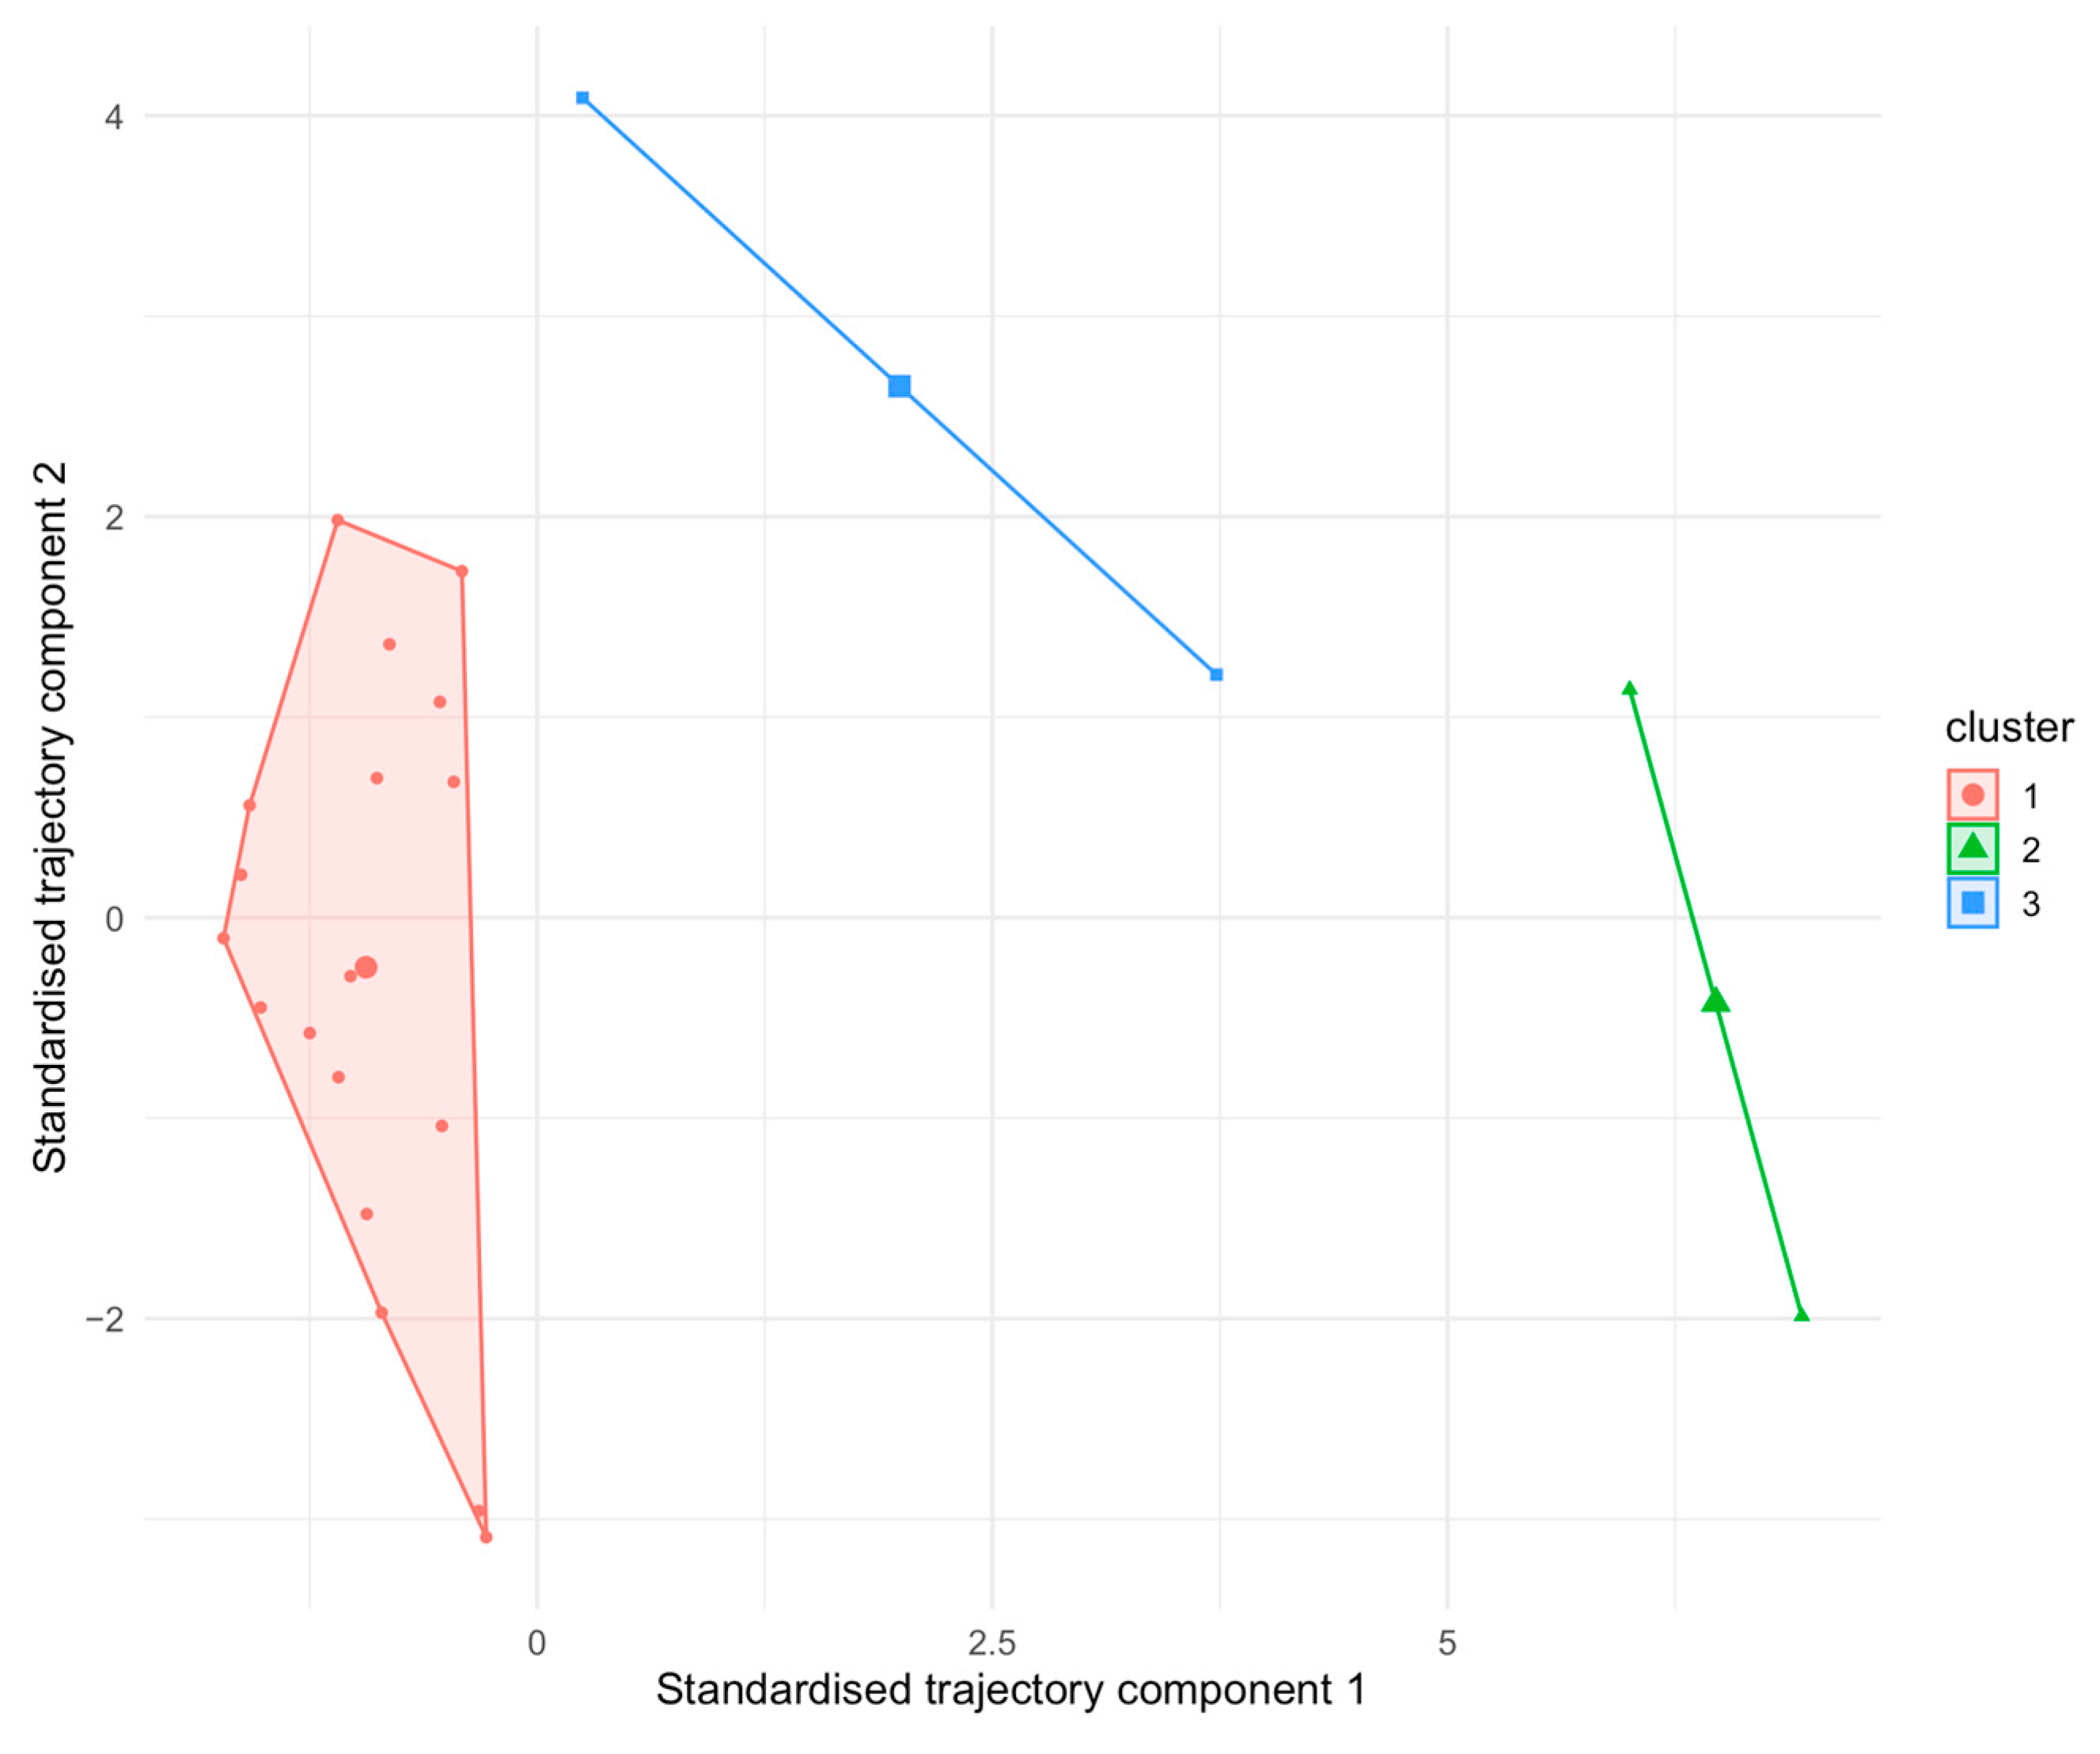
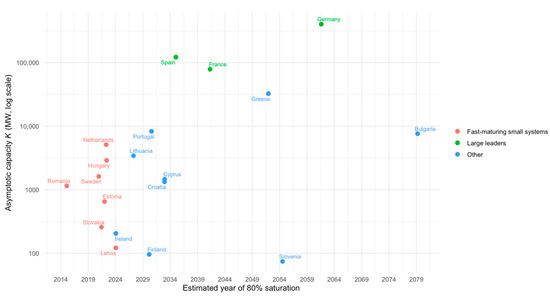
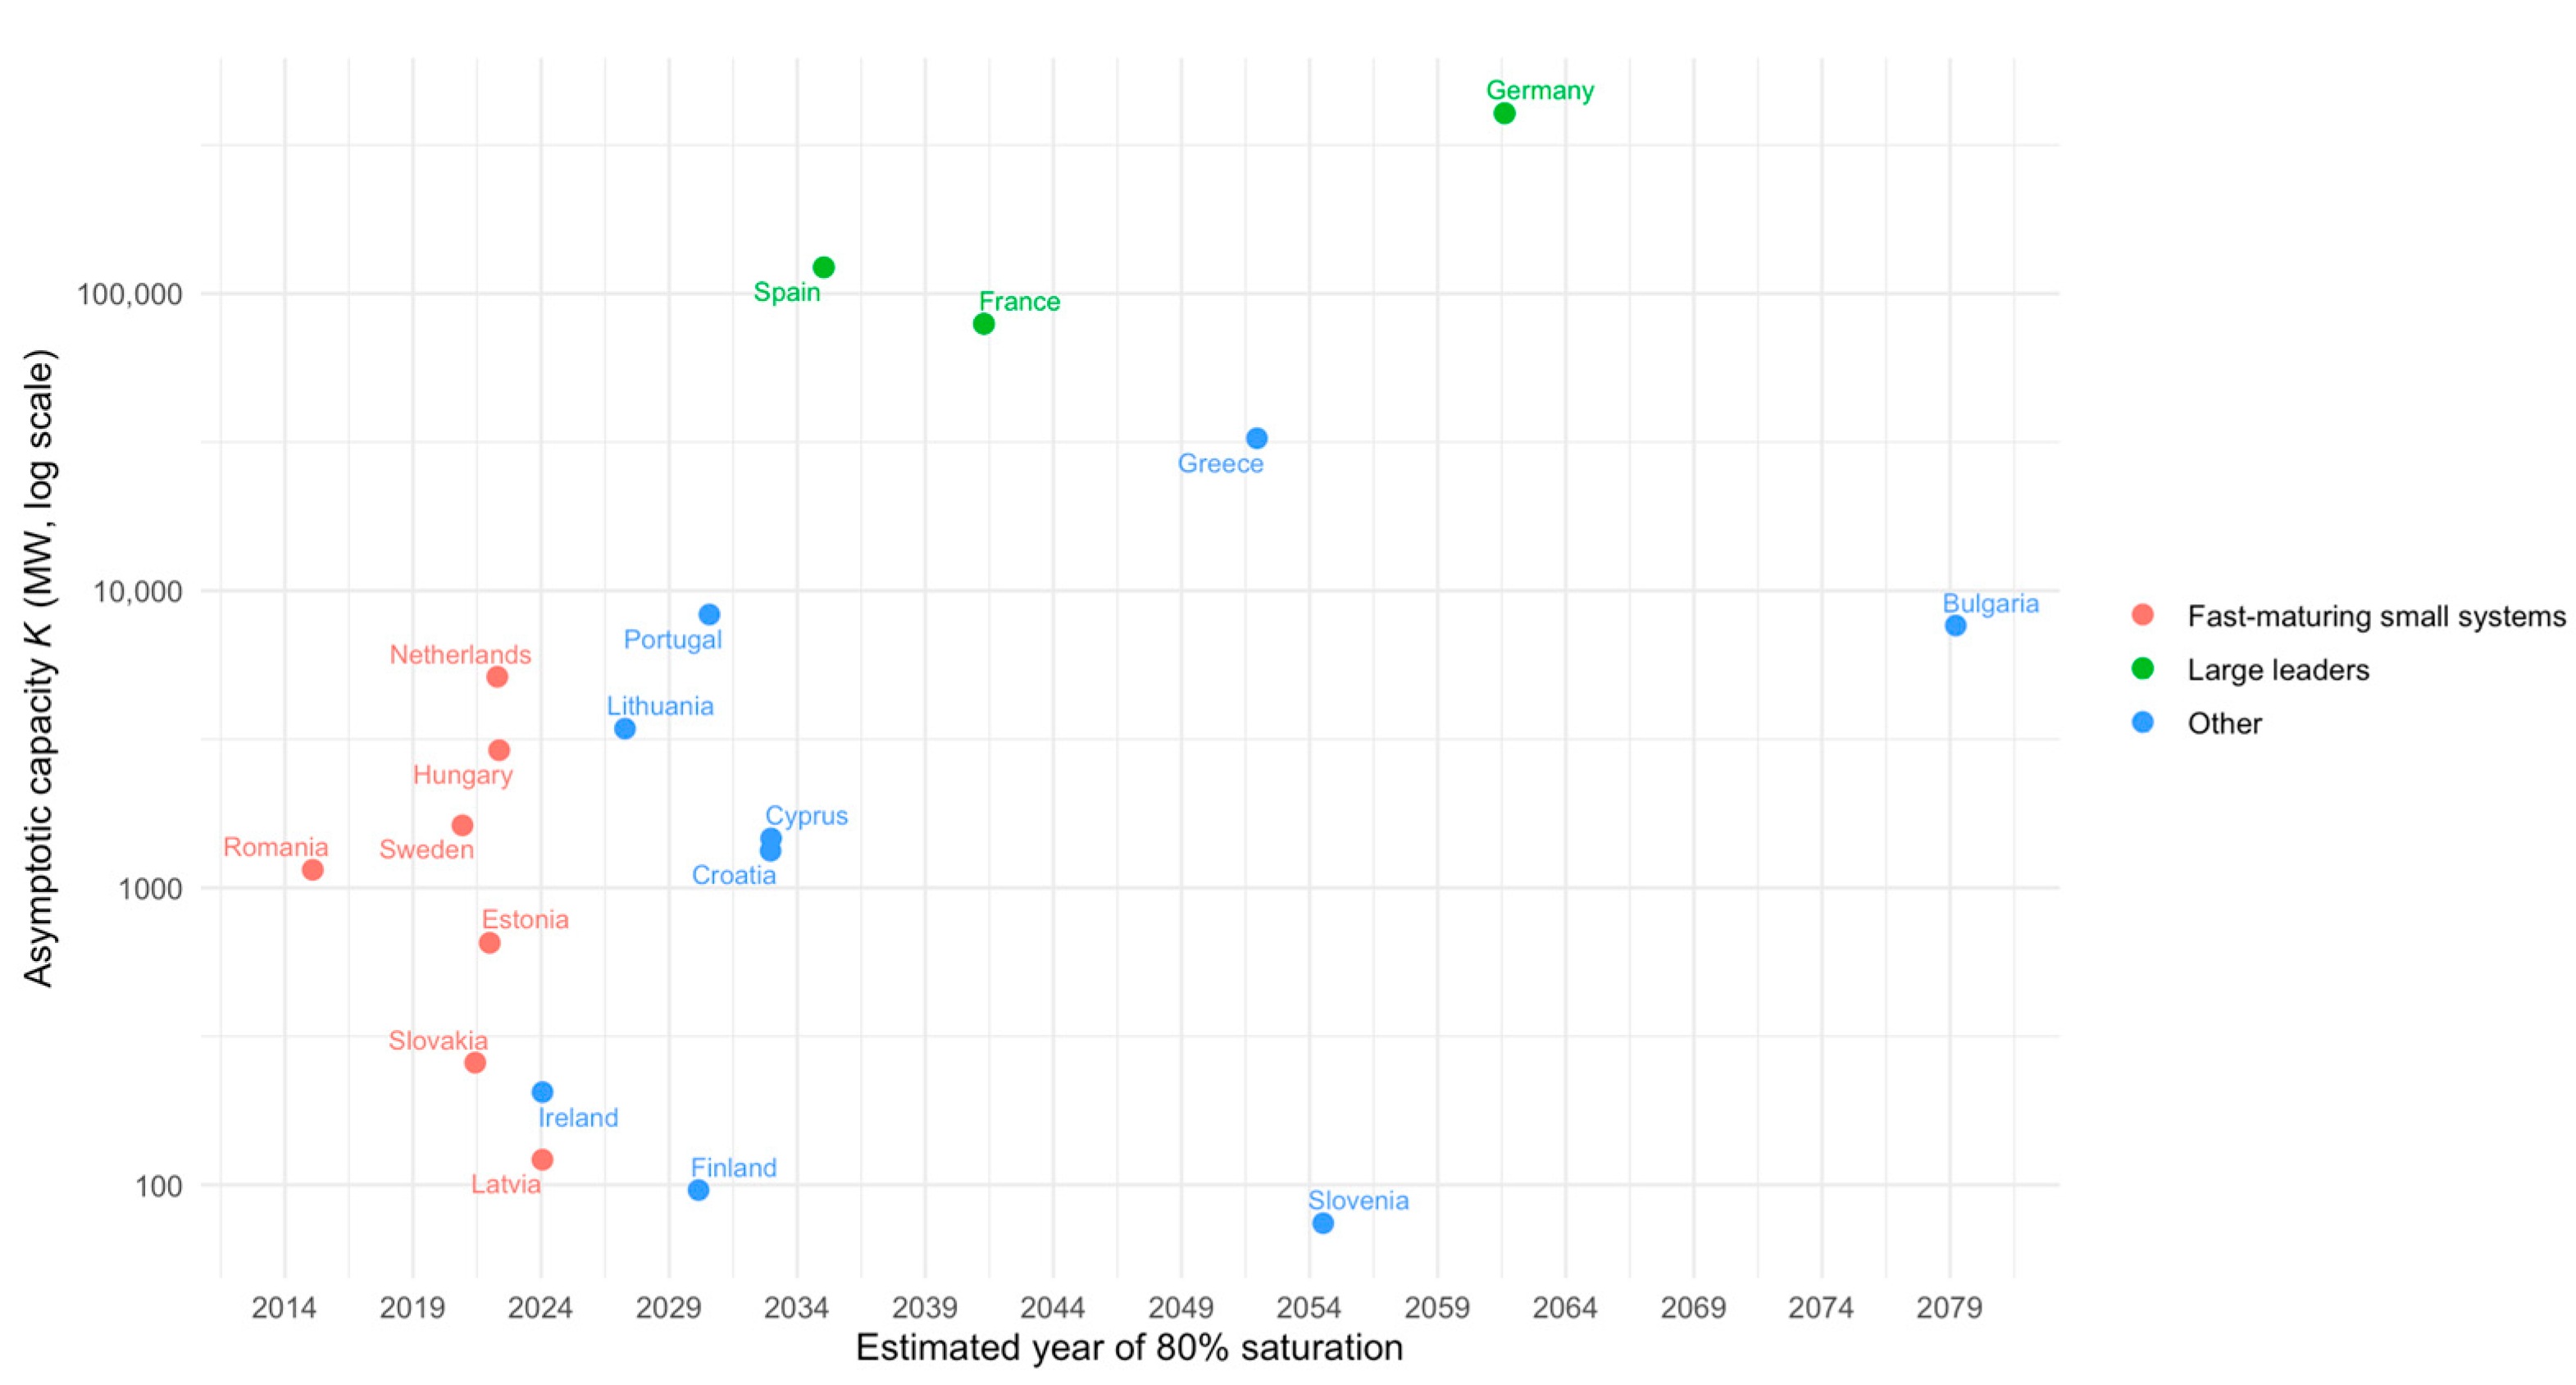
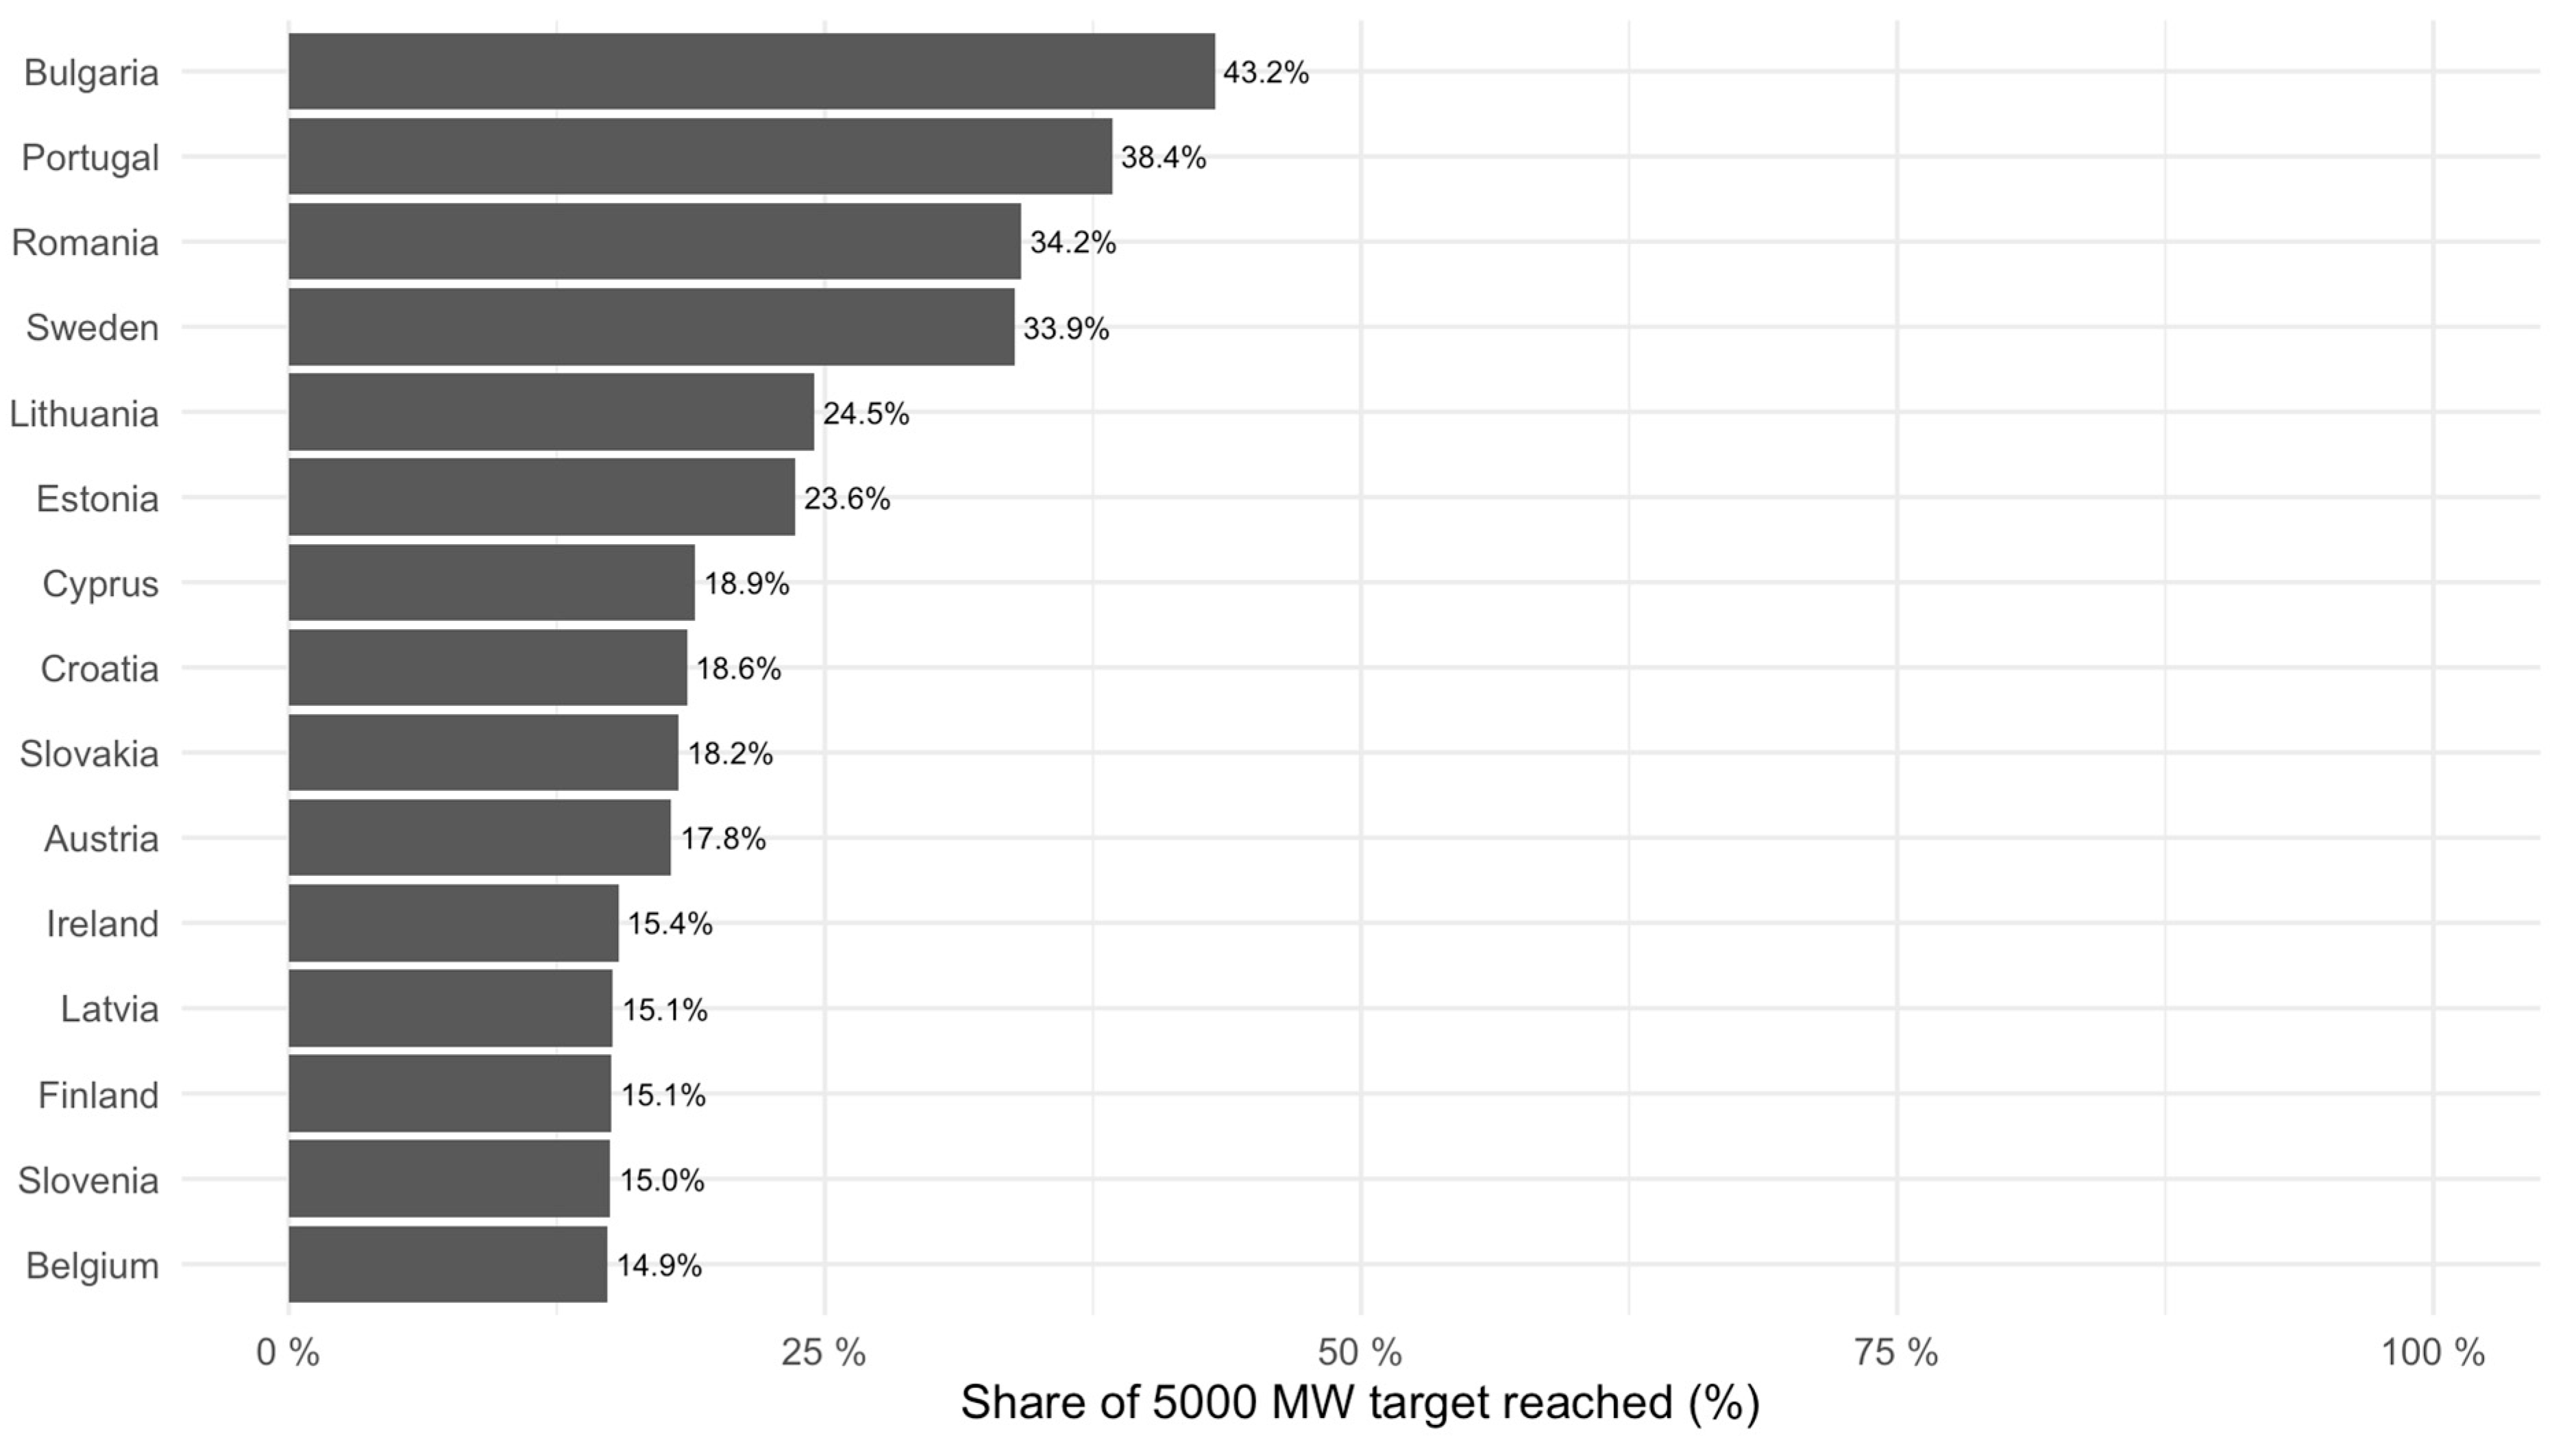

Disclaimer/Publisher’s Note: The statements, opinions and data contained in all publications are solely those of the individual author(s) and contributor(s) and not of MDPI and/or the editor(s). MDPI and/or the editor(s) disclaim responsibility for any injury to people or property resulting from any ideas, methods, instructions or products referred to in the content. |
© 2026 by the authors. Licensee MDPI, Basel, Switzerland. This article is an open access article distributed under the terms and conditions of the Creative Commons Attribution (CC BY) license.