


Abstract
Cities are increasingly expected to address digital transformation and sustainability challenges at the same time. However, existing urban indices generally approach smart city and sustainable city perspectives separately, which limits their ability to capture the integrated nature of contemporary urban development. In addition, many index-based studies rely on similar methodological choices. This study develops a composite Sustainable Smart City (SSC) index supported by a systematic scoring framework that brings smartness and sustainability together. The proposed framework follows a step-by-step procedure covering data preparation, normalization, weighting, aggregation, and final scoring. To address information overlap among indicators, a Redundancy-Penalized Entropy Weighting (RPEW) approach is applied. Then, overall SSC scores are calculated using a soft non-compensatory aggregation to emphasize balanced performance across dimensions. The framework is empirically illustrated through a cross-country case study including 38 OECD (Organization for Economic Co-Operation and Development) countries. A machine-learning-based polynomial forecasting approach is used for a limited number of indicators to deal with data gaps allowing the assessment to reflect more up-to-date conditions. The results highlight clear differences in SSC performance and show that strong outcomes in a single dimension are not sufficient to achieve high overall SSC scores. Instead, balanced progress across economic, digital, environmental, governance, mobility, and social dimensions plays an important role. In addition, the proposed framework provides a practical basis for comparative analysis, benchmarking, and policy-oriented evaluation of smart and sustainable urban development.
1. Introduction
Cities are facing increasing pressure due to rapid urbanization and growing resource demands. Urban populations continue to grow. This population growth creates significant problems for infrastructure, environmental protection, and public service delivery. At the same time, cities must respond to climate change, energy transition, and social inequality to improve citizens’ quality of life [1,2]. These issues make urban management more complex than ever before. In recent years, digital technologies have also become an important part of urban development. Cities are investing in data systems, digital infrastructure, and new technological solutions. These tools support transportation management, energy efficiency, environmental management and public administration [3,4]. As a result, urban development is increasingly influenced by both technological progress and sustainability concerns. Because of these changes, cities can no longer be evaluated using single indicators or narrow performance measures. Urban systems involve economic, environmental, social, and technological dimensions that interact with each other. For this reason, researchers and policymakers increasingly rely on multidimensional indicator frameworks to understand urban performance and guide policy decisions [5].
The smart city concept has emerged as a response to the growing complexity of urban systems. This concept generally refers to cities that use digital technologies and data-driven solutions to improve urban management, quality of life and service delivery. Information and communication technologies allow cities to efficiently manage urban processes and infrastructure. These technologies also support new forms of governance and decision-making [6,7]. However, smartness is not limited to technological infrastructure. Many studies emphasize the role of innovation capacity, knowledge creation, and digital connectivity in shaping smart urban development. Cities that are able to generate, adopt, and diffuse knowledge are better positioned to respond to rapidly changing urban conditions. In this sense, smart cities are often described as environments where technology, innovation, and human capital interact to improve urban performance and quality of life [8,9]. In this study, smartness is defined as the ability of a city to create, adopt, and utilize knowledge, innovation, and digital technologies to improve urban management and enhance the delivery of public services.
Sustainability also plays a central role in contemporary urban development. The main goal of sustainable cities is to ensure long-term urban resilience while protecting the environment and improving social well-being in an economic manner. Considering these points, urban sustainability requires efficient resource use, reduced environmental impacts, and inclusive social development. Cities must manage energy consumption, environmental quality, and social equity while maintaining economic vitality [10,11]. In this study, sustainability is defined as the ability of a city to maintain environmental quality, support economic prosperity, and promote social well-being while ensuring the responsible use of natural resources and long-term urban resilience.
Smart city initiatives mainly focus on technological innovation and digital infrastructure. But this focus is not enough for sustainable urban development. Smart technologies can improve the efficiency of urban systems. Yet, they do not solve environmental and social problems. For this reason, many studies emphasize that smart city policies should be combined with sustainability objectives. The Sustainable Smart City (SSC) concept has emerged from these two perspectives, smartness and sustainability. SSC approaches aim to integrate digital technologies with environmental protection, social well-being, and economic development. In this way, technological innovation can contribute not only to urban efficiency but also to long-term sustainable urban development [12,13,14].
In response to the growing complexity of urban systems, several index-based approaches have been developed to evaluate city performance. Many of these indices focus either on smart city development or on urban sustainability. Smart city indices generally emphasize technological infrastructure, digital connectivity, and innovation capacity [5,15]. The literature also includes several studies that compare different smart city assessment frameworks and indicator sets in order to evaluate their scope, methodology, and practical applicability [16,17]. Sustainable city indices typically focus on environmental performance, resource efficiency, and social well-being [18,19]. In recent years, some studies have attempted to combine these two perspectives under the concept of Sustainable Smart City (SSC). However, the number of index studies that explicitly integrate both smart and sustainability dimensions remains relatively limited [20,21,22]. Most existing indices also follow a similar methodological structure that includes indicator selection, normalization, weighting, and aggregation. In many cases, the selection of indicators is not clearly justified and indicators are assigned equal weights regardless of their informational contribution. Conventional normalization and aggregation approaches are frequently applied without considering the influence of outliers or scale differences across indicators. In addition, potential redundancy among indicators is often ignored. These issues may reduce the transparency and interpretability of index results and limit the ability of existing indices to fully capture the multidimensional nature of sustainable smart city development.
The motivation of this study is to address these gaps by proposing a systematic framework for scoring Sustainable Smart Cities (SSCs). Rather than treating smartness and sustainability as independent constructs, this research brings them together within an index structure. The proposed framework is designed to ensure methodological coherence across all stages of index construction, from data preparation to final scoring.
Based on this motivation, the study is guided by the following research questions:
- RQ1:
- How can smart and sustainable city dimensions be systematically integrated into a single composite index without losing their individual analytical meaning?
- RQ2:
- To what extent does a structured and transparent scoring framework improve the comparability of SSC performance across countries?
To answer these questions, this study makes several contributions to the literature. First, it develops an SSC index that brings smart and sustainable dimensions together using 55 indicators under 7 dimensions. Second, it proposes a systematical methodological framework for SSC scoring. Third, the framework is applied to a cross-country case study, demonstrating its practical usability and analytical value. Finally, this study also uses a forecasting approach to estimate unavailable values for the most recent year. By integrating forecasted data into the index calculation, the proposed framework allows for up-to-date SSC performance assessment while maintaining methodological consistency. In addition, robustness analysis is conducted to evaluate the sensitivity of the results to alternative weighting approaches.
This study is organized as follows. Section 2 provides an extensive literature review on indices. Section 3 represents the proposed methodology. The application of the proposed SSC Indexing Model is illustrated in Section 4. Section 5 discusses the results and explains the managerial implications. Lastly, conclusions are given in the last section.
2. Literature Review
In recent years, city indices have been widely used to evaluate urban performance in the contexts of digital, smart and sustainable cities. These indices aim to combine different aspects of urban systems into a single structure that allows comparison across cities or countries. As cities face increasing pressure from rapid urbanization, digital transformation, and environmental challenges, such index-based approaches have become more common in both academic studies and policy reports.
In the literature, studies can be grouped into two main categories. The first focuses on smart city indices, which mainly assess technological capacity, digital infrastructure, innovation, and data-driven urban services [5,15]. These indices usually emphasize efficiency, connectivity, and technological advancement. The second group consists of sustainable city indices, focusing on environmental protection, social well-being, resource efficiency, and long-term resilience [18,19]. These approaches are often closely linked to sustainability agendas and development goals [23].
While smart city and sustainable city indices provide useful insights, they are generally developed separately. As a result, they tend to capture only part of the broader urban development picture. Smart city indices often give limited attention to environmental and social issues, whereas sustainable city indices frequently overlook digitalization, technology and innovation aspects. This separation makes it difficult to evaluate cities in a multi-dimensional way.
The concept of the SSC has emerged as an attempt to address this limitation by bringing smartness and sustainability together within a single framework. However, indices that explicitly adopt an SSC perspective are still very limited in number. Moreover, existing SSC-oriented indices differ significantly in their structure and scope, and many of them do not fully capture the complexity of SSC development. In several cases, the balance between smart and sustainable dimensions remains weak, or the methodological structure is not sufficient or is not provided for assessments.
Given this situation, reviewing existing smart city, sustainable city, and SSC-related indices is an important step for understanding current studies and identifying their limitations. This review makes it possible to compare indicator selection procedures and methodological frameworks.
To identify relevant studies and index frameworks, Web of Science database was used. The search included combinations of keywords such as “smart city index”, “sustainable city index”, “smart sustainable city index”, “sustainable smart city index”, and “urban composite index”. To review widely recognized institutional index reports websites and publicly available sources on the internet were also used. This step was necessary because several widely used city indices are published as institutional reports rather than peer-reviewed academic articles. Based on this process, representative indices were selected for further analysis according to their relevance to smart city or urban sustainability assessment, transparency of methodology, and availability of indicator structures.
The following tables present well-known indices from the literature and they summarize their main characteristics. Dimensions and indicators of IESE Cities in Motion Index [24] are shown in Table 1.
Table 1.
Dimensions and Indicators of IESE Cities in Motion Index [24].
The IESE Cities in Motion Index [24] evaluates 183 global cities across nine dimensions, including economy, human capital, international profile, urban planning, environment, technology, governance, social cohesion, and mobility and transportation. Each indicator’s relative weight is determined using the complement of its coefficient of determination (R2) with respect to the rest of the indicators. It ensures that highly correlated variables have a smaller impact.
Dimensions and indicators of Arcadis Sustainable City Index [26] are shown in Table 2.
Table 2.
Dimensions and Indicators of Arcadis Sustainable City Index [26].
The Arcadis Sustainable Cities Index [26] aims to evaluate 100 global cities under 4 dimensions to provide a benchmarking framework for policy makers and urban planners. Each pillar is assigned an equal weight and normalized values are achieved using min-max method. The overall city score is calculated as the arithmetic mean of the four equally weighted pillars.
Table 3 represents indicators of the Corporate Knights Sustainable Cities Index [27].
Table 3.
Indicators of the Corporate Knights Sustainable Cities Index [27].
The Corporate Knights Sustainable Cities Index [27] evaluates 70 global cities through 12 quantitative indicators. Each indicator is normalized on a 0–1 scale relative to the best-performing city. A distinctive feature of the index is the Corporate Knights Socio-Economic Adjustment Factor (CKSEAF), which adjusts environmental scores according to the socio-economic context of each city, using human development index (HDI), income equality (1–GINI), and GDP per capita as adjustment parameters. The overall city score is calculated as the weighted sum of these adjusted indicators, with weights determined through expert evaluation.
Dimensions and indicators of Sustainable Development Report Index [28] are shown in Table 4.
Table 4.
Dimensions and Indicators of Sustainable Development Report Index [28].
The Sustainable Development Report assesses 167 countries using 125 indicators aligned with the 17 SDGs. Indicator values are normalized through a min–max transformation to express performance as a distance to target on a 0–100 scale. Goal-level scores are computed as the arithmetic mean of all indicators within each SDG. The overall SDG Index score for each country is obtained as the arithmetic mean of the 17 goal scores. Equal weighting is applied across all goals [28].
Another index developed by the United Nations is the City Prosperity Index (CPI) [29], introduced by UN-Habitat. The CPI is designed to enable city authorities, as well as local and national stakeholders, to identify opportunities and potential areas of intervention to enhance urban prosperity. The composite index is structured around six dimensions: productivity, infrastructure development, quality of life, equity and social inclusion, environmental sustainability, and governance and legislation. These dimensions provide a comprehensive framework for defining targets and goals that support the formulation of evidence-based policies, including the development of city visions and long-term strategies that are both ambitious and measurable. By 2020, the CPI had been applied to evaluate urban performance in 539 cities across 54 countries worldwide. The dimensions and indicators of the CPI [29] are provided in Table 5.
Table 5.
Dimensions and Indicators of the CPI [29].
The dimensions and indicators of the IMD Smart City Index [30], a smart city assessment framework, are presented in Table 6.
Table 6.
Dimensions and Indicators of the IMD Smart City Index [30].
The IMD Smart City Index [30] is used widely by academics [31]. It aims to measure how effectively a city uses technology to improve its citizens’ quality of life. It applies a combined weighting and scoring approach based on survey data collected from 120 residents per city. Results from the 2024, 2023, and 2021 editions are merged using a 3:2:1 temporal weighting ratio to account for data stability and recent developments. Within each of the two main pillars—Structures and Technologies—indicators are equally weighted across five thematic areas (health and safety, mobility, activities, opportunities, and governance). Scores are normalized to a 0–100 scale within each HDI group, and the final index score for each city is calculated as the arithmetic mean of the two pillar scores.
Indicators and dimensions of Global Power City Index [32] are demonstrated in Table 7.
Table 7.
Dimensions and Indicators of the Global Power City Index [32].
The Global Power City Index 2025 [32] measures 48 cities through 70 quantitative and qualitative indicators grouped under six dimensions: Economy, research and development, culture, livability, environment, and accessibility.
Table 8 presents India Smart City Index [33] structure.
Table 8.
Dimensions and Indicators of India Smart City Index [33].
The India Smart Cities Index [33] evaluates 53 Indian cities across six key dimensions: Living, Governance, People, Economy, Mobility, and Environment. Each dimension consists of multiple sub-factors represented by 58 measurable indicators. The index applies a decile-based scoring approach and it converts indicator values into ten-point scale scores (1–10) according to their percentile ranks across cities. Equal weighting is applied to all indicators, and each dimension score is obtained as the arithmetic mean of its corresponding indicator scores. The overall city score is then calculated as the average of the six-dimension scores, ensuring a balanced and comparable evaluation of smart city performance within the Indian urban context.
Tas and Alptekin [34] developed a Smart City Index for 30 metropolitan municipalities in Turkiye using a hybrid multi-criteria decision-making framework. Their indices’ indicators are shown in Table 9.
Table 9.
Dimensions and Indicators of Tas and Alptekin’s Index [34].
The study applied the MEREC (Method Based on the Removal Effects of Criteria) method to determine objective indicator weights and the MARCOS (Measurement of Alternatives and Ranking According to Compromise Solution) method to rank cities based on overall smart city performance. The index structure consists of six main dimensions—Livability, Economy, Environmental Sustainability, Research and Development, Accessibility, and Cultural Interaction—consisting of 19 indicators [34].
Pira [20] introduces an integrated SSC framework that brings together the core ideas of smart city initiatives and sustainability. Dimensions and indicators of Milad Pira’s SSCs Index are represented in Table 10.
Table 10.
Dimensions and Indicators of Milad Pira’s SSCs Index [20].
Using a two-stage content analysis, the study examines where the Smart City Index master indicators and the OECD (Organization for Economic Co-Operation and Development) Sustainable Development Indicators intersect and align. Based on this analysis, a unified set of 28 indicators is proposed, grouped into four broad dimensions: socio-cultural, economic, environmental, and governance [20].
Another study has been conducted by Gazzeh [35] to prioritize a core set of SSC indicators using a combined methodology: content analysis and Analytic Hierarchy Process. Dimensions and indicators of Gazzeh’s SSC Index are represented in Table 11.
Table 11.
Dimensions and Indicators of Gazzeh’s [35] SSC Index.
Dimensions and indicators of Ozkaya and Erdin’s [21] SSC Index are represented in Table 12.
Table 12.
Dimensions and Indicators of Ozkaya and Erdin’s [21] SSC Index.
Ozkaya and Erdin [21] evaluated smart and sustainable cities under 6 dimensions and 47 indicators. Their study uses Analytical Network Process (ANP) to weigh smart and sustainable city criteria. The study covers 44 cities around the world and comparisons were made by TOPSIS (Technique for Order Preference by Similarity to Ideal Solution).
Dimensions and indicators of Shmelev and Shmeleva’s [22] SSC Index are represented in Table 13.
Table 13.
Dimensions and Indicators of Shmelev and Shmeleva’s [22] Smart and Sustainable City Index.
To assess urban sustainability performance, this study applies a multi-criteria approach using a panel of 20 indicators to a set of 57 global cities. Various indicator weightings produced aggregate performance scores for global cities under four dimensions: economic, social, environmental and smart [22].
Haksevenler et al. [18] proposed a sustainable city index using United Nation’s [36] 17 Sustainable Development Goals (SDGs). Dimensions and indicators used in their study are shown in Table 14.
Table 14.
Dimensions and Indicators of the Sustainable City Index proposed by Haksevenler et al. [18].
This study [18] integrates SDGs as indicators and creates a sustainable city index consisting of 4 dimensions: environmental, social, economic, and institutional. Min-max normalization procedure, equal weighting and weighted sum aggregation methods have been selected to assess districts of Istanbul. Then, various multi-criteria decision-making methods have been used to analyze robustness of the methodology.
Cohen [15] defines smart city concept under 6 dimensions and 18 working areas. Dimension and indicators used in Cohen’s smart city index are represented in Table 15.
Table 15.
Dimensions and Working Areas of the Smart City Index proposed by Cohen [15].
Another smart city index has been introduced by Abu-Rayash and Dincer [5]. The index consists of eight dimensions and 32 indicators. Using four distinct weighing schemes, the model is applied to 20 cities worldwide, ranked for their smart performance. Their smart city index is shown in Table 16.
Table 16.
Dimensions and Indicators of the Smart City Index proposed by Abu-Rayash and Dincer [5].
The UN-Habitat Global Urban Monitoring Framework (UMF) [37] provides a comprehensive structure for monitoring urban development. The framework is consisted of 5 dimensions. And each dimension is linked with 4 objectives such as being safe and peaceful, inclusive, resilient and sustainability. This framework is designed for monitoring urban development rather than producing a score. Dimensions and indicators of UMF are provided in Table 17.
Table 17.
Dimensions and Indicators of UMF [37].
The UN-Habitat Global Urban Monitoring Framework [37] also outlines a dimension-based structure for urban assessment. Similar to the proposed SSC framework, it adopts a multidimensional perspective and relies on standardized indicators. However, the UMF mainly provides general guidance for monitoring purposes and does not specify a detailed methodology for normalization, weighting, and aggregation. In contrast, the proposed framework defines these steps explicitly to ensure consistent and comparable results across countries.
The indices and their methodologies identified in the literature review are summarized and compared in Table 18.
Table 18.
Methodological Comparison of Existing Smart and Sustainable City Indices.
The review of existing smart city and sustainable city indices shows that the integrated evaluation of smartness and sustainability remains limited in the current literature. In addition, many indices rely on simplified methodological choices, such as min–max normalization, equal weighting, and the calculation of overall scores through simple arithmetic averaging. These observations indicate a clear need for a more comprehensive and transparent SSC assessment approach. Motivated by this gap, this study aims to develop a composite SSC index and a systematical methodological framework that enables consistent scoring and comparison, while addressing both conceptual and methodological limitations observed in existing index-based studies.
From a broader perspective, urban indicator systems have evolved over time toward more integrated and multidimensional approaches. According to Gomez-Alvarez et al. [23], recent developments can be characterized as a “third generation” of urban indicator systems, which emphasize integrated, multidimensional, and policy-relevant frameworks. In line with this perspective, the proposed SSC index can be positioned within this third generation, as it brings together multiple dimensions and integrates smart city and sustainability aspects within a single structure [23]. In addition, Wong [38] highlights several key principles for developing robust and globally relevant urban indicator systems, such as consistency, comparability, and policy relevance. The proposed SSC framework follows these principles by relying on standardized international data sources, ensuring comparability across countries, and applying a transparent evaluation process. At the same time, certain aspects, such as the use of qualitative information, are not explicitly covered, as the focus of this study is on quantitative and indicator-based assessment.
3. Materials and Methods
3.1. Indicator Selection and Data Collection Process for the SSC Index
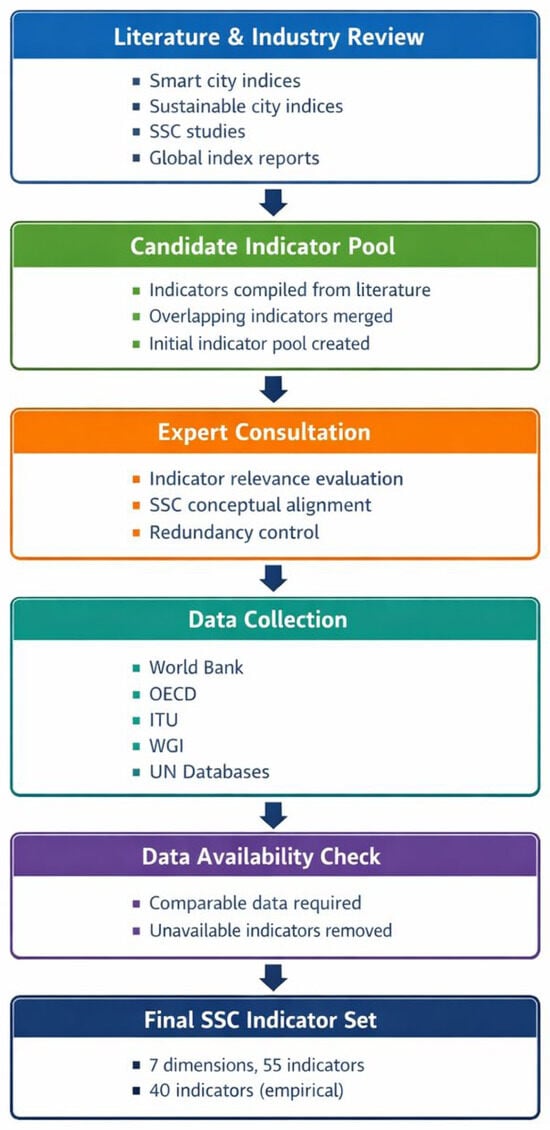
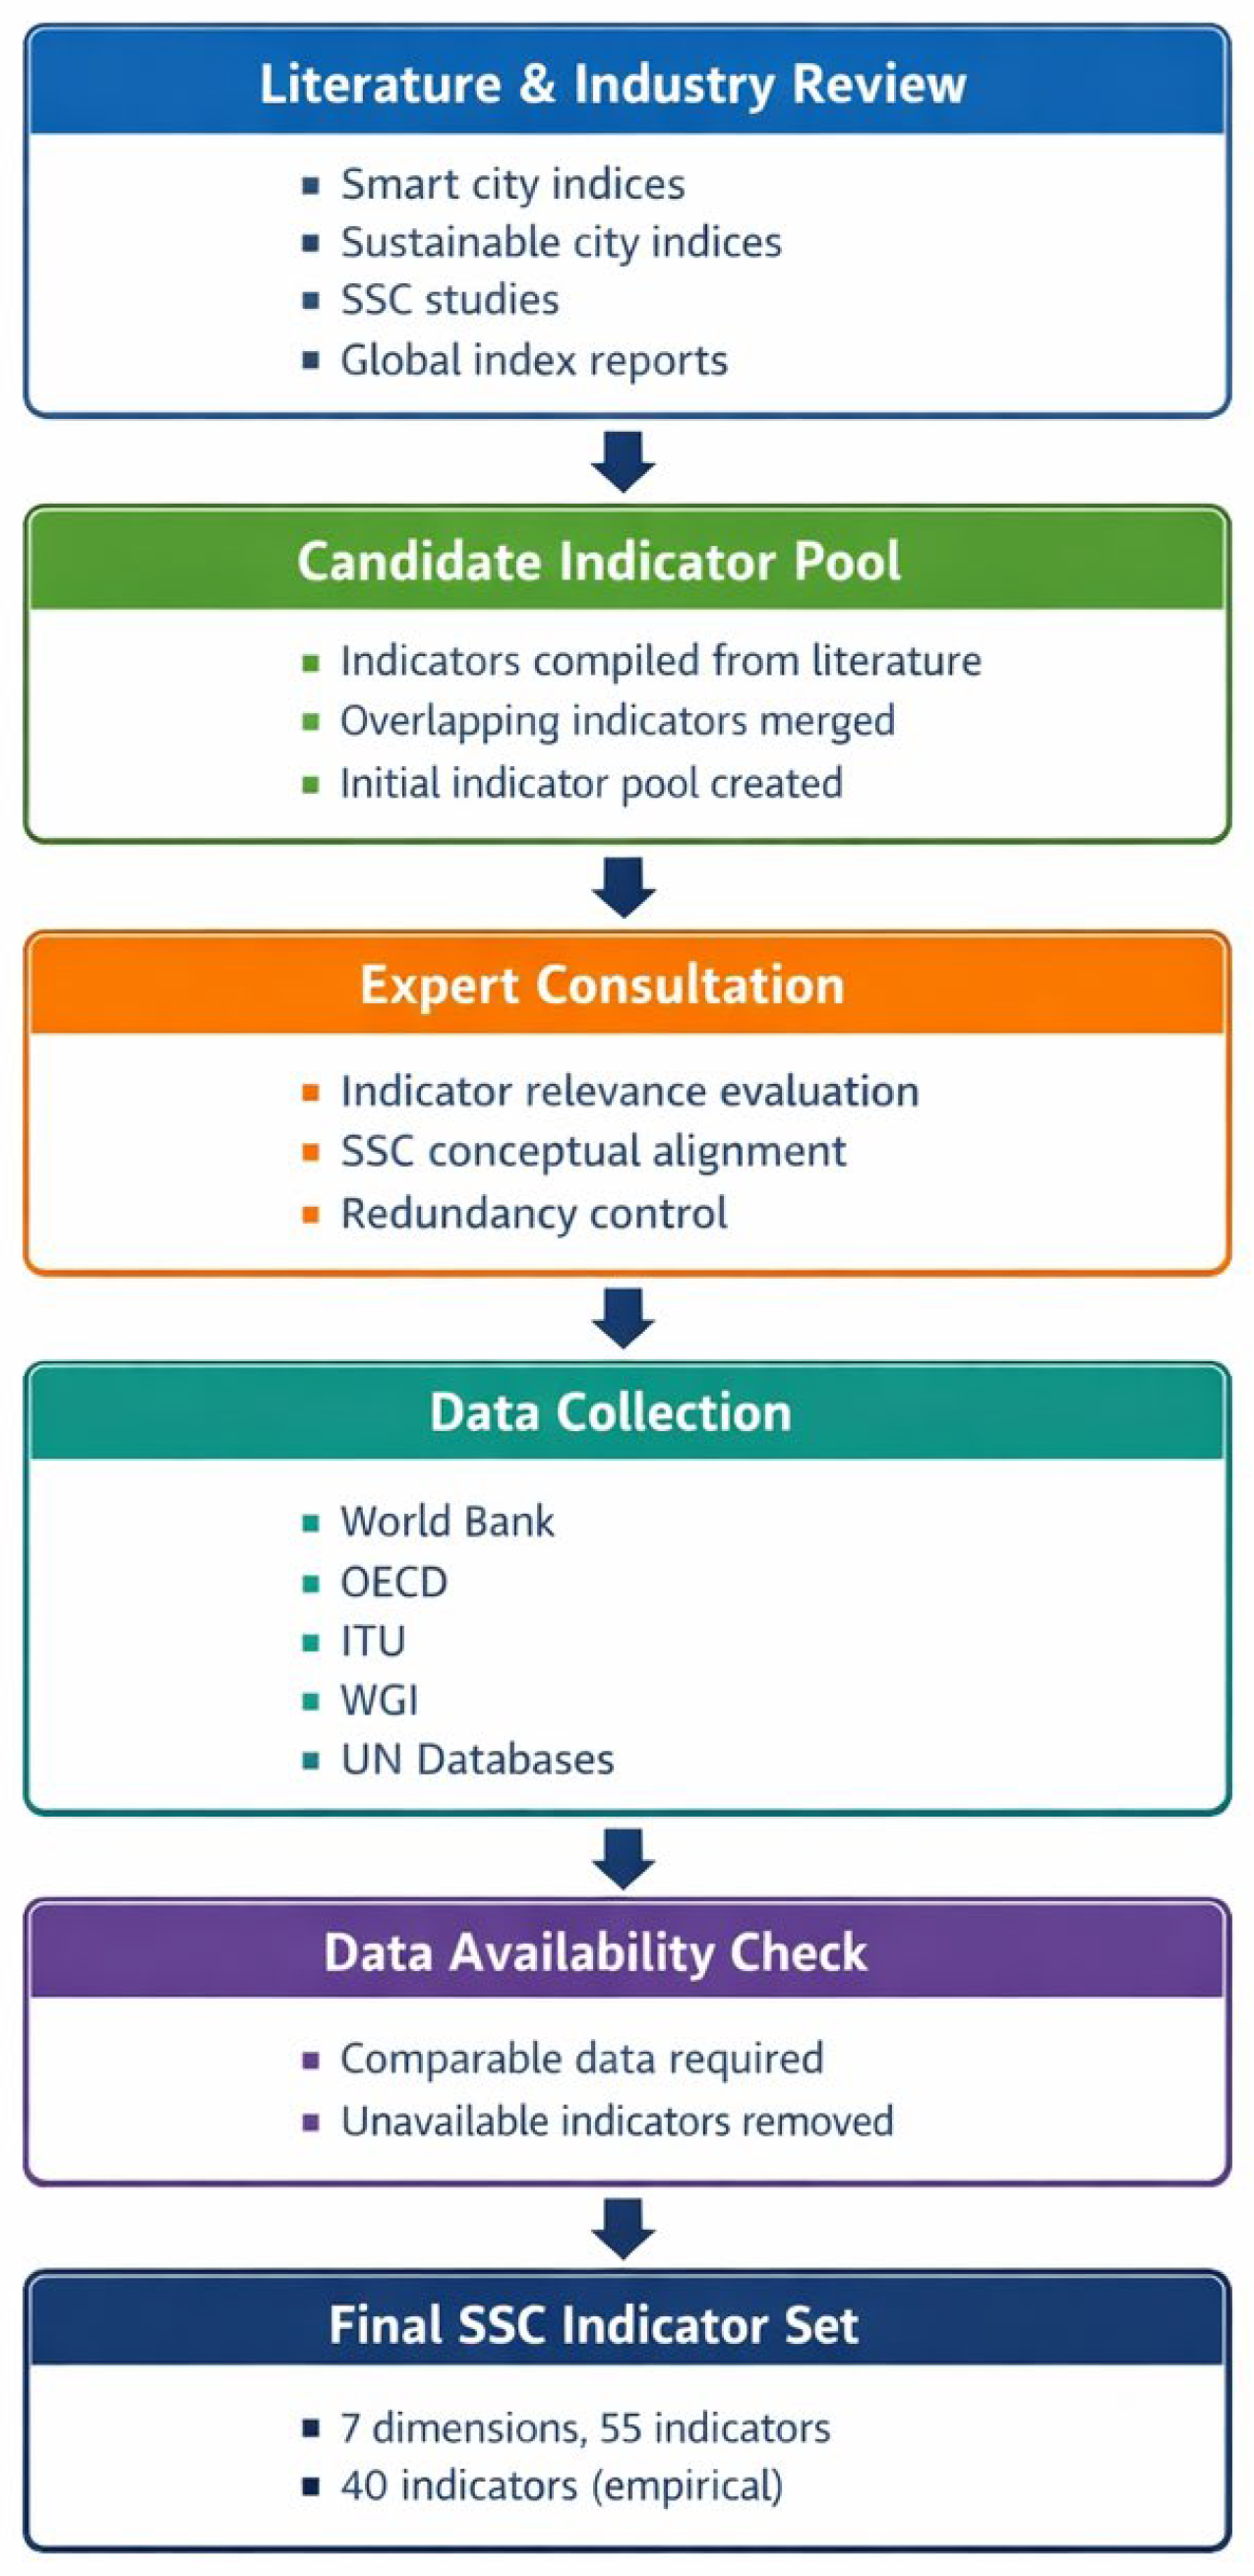
The selection of indicators is a critical step in index construction. In this study, the indicator selection process follows a structured procedure. First, existing indices including both academic studies and industry-based index reports are reviewed. Then, based on this review, preliminary pool of candidate indicators is compiled.
Next, a panel of experts evaluated the candidate indicators. The expert group consisted of three specialists with backgrounds in urban planning, sustainability, and smart city technologies. They are selected based on their academic and professional experience. The experts were asked to assess the relevance, clarity, and applicability of each indicator. Based on their evaluations, redundant or conceptually inconsistent indicators were removed.
The seven dimensions used in this study were identified through a synthesis of commonly used dimensions in existing smart city and sustainable city assessment frameworks presented in the literature review. In the proposed framework, the index is formed from indicators. Thus, normalization and weighting methods are applied directly to the indicators. After these procedures, the overall index scores are determined by the normalized indicator values using indicator weights. Therefore, alternative dimension structures do not affect the calculation of the overall index scores. However, they may influence the interpretation of the results, particularly at the dimension level, as well as the way indicators are grouped and presented within the framework. After the screening step, data are collected from internationally recognized databases such as the World Bank, OECD, ITU, UN and international databases to ensure reliability [39,40,41,42,43,44,45,46,47,48,49,50,51,52]. Finally, a data availability assessment is conducted. Indicators for which reliable data could not be obtained are excluded from the empirical application. The overall indicator selection and data collection procedure is illustrated in Figure 1.
Figure 1.
Indicator Selection and Data Collection Process.
3.2. Proposed SSC Indexing Model
This study proposes a composite SSC scoring model to assess cities across multiple dimensions of smartness and sustainability. Since the indicators differ in their measurement scales, directions (benefit or cost), and data distributions, the analysis follows a clear, step-by-step procedure that includes normalization, indicator weighting, final aggregation for scoring and robustness analysis under different parameter assumptions. The framework is structured to make indicators comparable, reduce the effect of extreme values and overlapping information, and avoid excessive compensation between dimensions, resulting in a more balanced and conceptually coherent evaluation of urban smart sustainability performance. The proposed SSC Indexing Model is illustrated in Figure 2.
Figure 2.
Proposed Sustainable Smart City Indexing Model.
3.2.1. Normalization and Winsorization
The indicators included in the SSC Index are measured in different units and exhibit heterogeneous distributions across cities. As discussed in Wong [38], the indicators could be benefit or cost-oriented. However, in this study, to ensure comparability a goalpost-based normalization approach is employed. Before the normalization process, a winsorization procedure is applied as a conservative data pre-processing step to limit the influence of extreme values.
For each indicator , lower and upper bounds are defined using the 5th and 95th percentiles of its empirical distribution across all cities. Specifically, the lower bound and the upper bound are computed as:
where and denote the 5th and 95th percentiles of indicator calculated across all cities. Observed values that fall outside this range are adjusted using the following winsorization rule:
where represents the observed value of indicator for city , and denotes the winsorized value. The 5th and 95th percentile thresholds are applied to reduce the effect of extreme values without removing too much information from the dataset. This allows the main pattern of the data to remain intact while limiting the influence of outliers. The adjusted indicator values are then normalized to a unit-free scale ranging from 0 to 1. Indicators where higher values represent better performance (benefit-oriented) and those where lower values indicate better performance (cost-oriented) are normalized using, respectively, Formulations (3) and (4):
where denotes the normalized value of indicator j for city i obtained after the winsorization and goalpost-based normalization procedures. As a result, all normalized indicator values are expressed on a common scale, where higher values represent better performance across all indicators.
3.2.2. Indicator Weighting: Redundancy-Penalized Entropy Weighting (RPEW)
To determine indicator weights objectively while accounting for information overlap, a Redundancy-Penalized Entropy Weighting (RPEW) approach is adopted. The method is grounded in information entropy theory, which evaluates the amount of information conveyed by each indicator based on its dispersion across alternatives [53]. To further address redundancy among indicators, an additional correlation-based penalty term is incorporated, ensuring that indicators conveying overlapping information do not receive disproportionate weights [54].
First, a probability matrix is constructed based on the normalized indicator values. For each indicator , the probability associated with city is computed as:
where denotes the total number of cities, ensuring that, for each indicator , the probabilities sum to unity across all cities.
Next, the entropy value of each indicator is then computed as:
where is a normalization constant ensuring that For observations with , the term is treated as zero, consistent with the limit properties of the entropy function.
The degree of divergence, representing the discriminatory power of each indicator, is defined using following formula:
To reduce redundancy among indicators, a correlation-based penalty factor is applied. The Pearson correlation coefficient between indicators and denoted by . This coefficient is calculated using the normalized values of the indicator across all cities. Based on this, the redundancy penalty is defined as follows:
where is the total number of indicators. This formulation penalizes indicators that convey information already captured by others, regardless of correlation direction.
The final indicator weights are obtained by combining both components:
This procedure ensures that indicators with higher discriminatory power and lower redundancy receive greater importance in the index construction.
3.2.3. Aggregation
The proposed SSC Index Model adopts a two-stage aggregation structure. It proceeds from indicators to dimensions and subsequently to an overall city score.
Each indicator is assigned to a predefined dimension (e.g., economy, environment, governance, mobility). To prevent dimensions with a larger number of indicators from dominating the results, indicator weights are re-normalized within each dimension:
where denotes the set of indicators belonging to dimension .
The dimension score for city is then calculated as:
This weighted aggregation allows compensability among indicators within the same dimension, reflecting their complementary nature.
3.2.4. Overall SSC Scoring
To calculate the overall SSC score, the study uses a soft non-compensatory aggregation based on the geometric mean. Unlike the arithmetic mean, this approach does not allow very strong performance in one dimension to fully make up for weak performance in another. This is in line with the multidimensional character of smart and sustainable urban development, where balanced progress across dimensions is more meaningful than excellence in only a few areas.
The overall SSC score for city is defined as:
where is the number of dimensions, denotes dimension weights, and is a small constant set to introduced to avoid numerical issues when dimension scores approach zero.
This scoring strategy favors cities that perform consistently across all dimensions, while disadvantaging those with strong imbalances between dimensions. In this way, the index remains closely aligned with the core idea of smart and sustainable cities, which emphasizes balanced and integrated urban development.
3.2.5. Robustness Analysis
4. Application of the Proposed SSC Indexing Model
4.1. SSC Index Structure and Indicator Set
The case study is built around the proposed SSC Index, a multidimensional composite framework developed to evaluate smartness and sustainability in urban systems in an integrated way. Rather than treating these two concepts separately, the index is designed to reflect how economic performance, digital innovation, environmental sustainability, governance quality, mobility systems, social well-being, and urban form interact with one another. In its final version, the SSC Index consists of seven dimensions and 55 indicators, each clearly specified in terms of measurement unit, benefit–cost orientation, and data source.
The Economic Performance and Competitiveness dimension captures the overall economic strength of cities, together with labor market conditions, income distribution, and institutional factors that shape urban economic outcomes. Indicators in this dimension reflect productivity levels, growth dynamics, employment conditions, investment attractiveness, and the effectiveness of regulatory and institutional frameworks.
The Innovation and Digital dimension represents a city’s technological capacity and its ability to generate, adopt, and diffuse knowledge. It includes indicators related to research and development activity, the availability of skilled human capital in science and technology, digital connectivity, the maturity of e-government services, and access to open data.
The Environment dimension focuses on environmental quality, resource efficiency, and climate resilience. It brings together indicators related to greenhouse gas emissions, renewable energy use, air quality, waste and water management practices, ecosystem protection, and exposure to environmental pressures.
The Mobility dimension addresses the performance of urban transport systems from the perspective of efficiency, sustainability, and safety. Indicators in this dimension cover traffic safety, transport-related emissions, vehicle ownership patterns, electrification, public transport usage, logistics infrastructure, accessibility, and rail network density.
The Governance dimension reflects the quality of institutions and public administration at the urban level. It includes indicators related to government effectiveness, transparency and accountability, control of corruption, civic participation, disaster preparedness, digital public service provision, and fiscal openness.
The Human Development and Social Inclusion dimension evaluates social well-being, equity, and access to essential services. It integrates indicators on health outcomes, educational attainment, youth participation in the labor market, social protection mechanisms, gender equality, access to sanitation, and broader social stability.
Finally, the Urban Form and Livability dimension captures the physical structure of cities and the quality of everyday urban life. Indicators in this dimension reflect urbanization patterns, population dynamics, housing affordability, access to green spaces, transport accessibility, and the overall quality of urban infrastructure.
Table 19 summarizes the full structure of the proposed SSC index, covering all seven dimensions and the 55 indicators that form its conceptual and methodological basis. This complete set of indicators defines the intended scope of the SSC index, independent of the data limitations encountered in the case study. For each indicator, the table reports its definition, measurement unit, benefit–cost orientation, and data source, ensuring transparency and supporting the reproducibility of the index.
Table 19.
Full Structure of the Proposed Sustainable Smart City Index.
4.2. Scope and Data Selection
The empirical application of the proposed SSC index is conducted within a clearly defined and comparable analytical scope. While the SSC methodology is conceptually designed for city-level assessment, the case study makes use of country-level data because comparable city-level information is not sufficiently available across countries. All indicators used in the analysis are based on officially reported and verifiable data obtained from internationally recognized sources, as detailed in Table 19.
The dataset used in this study was compiled from publicly available international statistical databases, including the World Bank Open Data, OECD Data, ITU Statistics, UN E-Government Knowledgebase, Our World in Data (OWID), ND-GAIN database, World Governance Indicators (WGI), WHO, ILO, UNICEF JMP, Institute for Economics and Peace, and The Global Economy database [39,40,41,42,43,44,45,46,47,48,49,50,51,52]. The corresponding source of each indicator is reported in Table 19.
The case study focuses on 38 OECD countries, which are selected to ensure a reasonable level of institutional, economic, and statistical comparability. OECD countries generally follow similar data quality standards and reporting practices, and they offer relatively consistent time series. This makes them suitable for cross-country benchmarking within the context of smart and sustainable cities. The deliberate focus on this group also helps avoid arbitrary country selection and strengthens the internal consistency of the case study.
The year 2023 is chosen as the reference period for the empirical application. While more recent data are not yet fully available across all indicators and countries, 2023 represents the most recent year for which a sufficiently complete and comparable dataset can be assembled.
Although the proposed SSC index is theoretically defined by 55 indicators, limitations in data availability require a smaller indicator set for the empirical analysis. In particular, 15 indicators are excluded from the case study because comparable cross-country data are not available. These exclusions are based solely on data constraints and do not reflect conceptual or methodological choices. As a result, the case study is conducted using a final set of 40 indicators.
Minor data gaps remain for certain indicators and countries in the 2023 dataset. When a limited number of indicator values are missing for a given country, these values are imputed using the mean of the corresponding indicator across the remaining OECD countries. In cases where 2023 data are entirely unavailable but historical observations exist; missing values are estimated using a machine learning–based polynomial forecasting approach. This forecasting step is applied conservatively and solely to ensure continuity of the dataset; methodological details are intentionally kept concise, as forecasting is not the primary focus of the study.
Through these data selection and preparation procedures, the case study demonstrates the applicability of the proposed SSC methodology under real-world data constraints while maintaining transparency, consistency, and analytical rigor. The resulting dataset forms the basis for the SSC score computation and country ranking presented in the following sections.
4.3. Indicator Screening and Data Treatment
While the proposed SSC index comprises 55 indicators in its full structure, the empirical implementation of the case study requires a systematic screening and treatment of indicators based on data availability conditions. As a result of this process, indicator exclusion and data forecasting are applied to adjust the available data.
First, 15 indicators are excluded from the case study due to the absence of consistent and comparable cross-country data for the selected reference year. The excluded indicators are INN8, ENV4, ENV5, ENV6, MOB3, MOB5, MOB6, MOB8, MOB9, GOV5, GOV6, GOV7, URB3, URB4, and URB5. These indicators are removed solely because reliable data could not be obtained. Importantly, this exclusion is driven by empirical data constraints rather than conceptual or methodological considerations.
Second, for seven indicators, complete data for 2023 are not available for all countries, even though historical observations exist. These indicators—INN1, INN2, INN3, ENV2, ENV3, MOB1, and MOB2—are therefore kept in the case study, and the missing 2023 values are estimated using a machine learning–based polynomial forecasting approach. This forecasting step is applied in a cautious manner, with the aim of maintaining temporal continuity while preserving the overall structure of the data.
After excluding indicators with unavailable data and addressing partially missing values through forecasting, the final case study dataset includes 40 indicators covering all seven dimensions of the proposed SSC index. This approach allows the analysis to remain empirically feasible while preserving the multidimensional structure and overall coherence of the proposed SSC framework.
4.4. SSC Scoring and Country Rankings
Following the data preparation and indicator screening procedures described in the previous sections, final SSC scores are calculated for each country using the proposed SSC Indexing Model. The empirical analysis is based on 40 indicators across seven dimensions and covers 38 OECD countries for the reference year 2023.
For each country, normalized indicator values are combined with the corresponding RPEW-based weights to obtain a single composite SSC score. Higher scores indicate stronger and more balanced performance in terms of sustainability and smartness. Based on these scores, countries are ranked in descending order in Table 20.
Table 20.
SSC Scores and Rankings of OECD Countries (2023).
The results reveal a clear differentiation in SSC performance levels across the sample. Countries such as Norway, Denmark, Sweden, Iceland, and Finland appear at the top of the ranking, whereas relatively lower SSC scores such as Türkiye, Mexico and Colombia are observed for countries positioned at the lower end of the distribution.
While Table 20 presents the overall scores, examining dimension-level results provides additional insight into the drivers of cross-country differences. Table 21 presents the ranking of countries withing each SSC dimension. The results show that having a strong performance in one dimension is not enough to appear at the top of the ranking. For example, the United States ranks first in the Innovation & Digital dimension. However, it ranks considerably lower in the overall SSC index due to relatively weaker performance in other dimensions such as mobility and environmental dimensions. Another notable example is Germany. It is ranked fourth in both Innovation & Digital and Social Inclusion & Human Development dimensions. However, its relatively moderate performance in other dimensions such as mobility and environmental indicators limits its overall SSC ranking. Estonia has the same patters as Germany and United States. Although it ranks fourth in the Environment dimension, lower scores in the other dimensions place Estonia in the middle of the overall SSC ranking. The dimension-level results also shows that countries ranked at the top of the overall SSC index tend to perform relatively well across several dimensions rather than excelling in only one area. In other words, balanced performance appears to be an important factor behind higher overall scores. Norway is a good example of this pattern. The country performs strongly in multiple dimensions, including mobility, environment, governance, and social indicators, which helps explain its leading position in the overall SSC ranking. Another notable pattern can be observed when comparing Austria and Canada. Although the two countries have relatively similar performance in several dimensions such as Economic Performance and Competitiveness, Social Inclusion & Human Development, and Urban Form and Livability, Austria achieves considerably higher scores in the environment and mobility dimensions. Despite Canada’s strong governance performance, these differences lead to a noticeable gap in the overall SSC ranking. This example illustrates the non-compensatory nature of the proposed scoring framework, where weak performance in certain dimensions cannot be fully offset by strong results in others.
Table 21.
Dimension-Level Rankings of OECD Countries (2023).
These findings not only show differences in SSC performance across countries but also serve as a foundation for discussing their managerial and policy implications in Section 5.
4.5. Robustness Analysis
Composite indices are often sensitive to methodological assumptions, particularly regarding the weighting of indicators. Different weighting methods may change the relative importance assigned to indicators which will affect the final ranking results. For this reason, robustness analysis is commonly conducted in index studies to examine whether the main findings remain stable under alternative methodological settings [55].
To evaluate the robustness of the proposed RPEW method, an additional analysis is carried out under equal weighting and conventional entropy weighting approaches. In all three scenarios, the same dataset, normalization procedure, and aggregation structure are preserved.
In the equal weighting approach, every indicator has the same importance. This is the case even if some indicators contain more information than others. Conventional entropy weighting partly improves this situation because indicators with greater variation across countries receive higher weights. However, the entropy method does not consider whether some indicators reflect very similar information. When indicators measure closely related aspects, their influence may be counted more than once. The proposed RPEW method tries to limit this problem. It introduces a penalty based on the correlations between indicators. If two indicators are highly related, their effective weights are reduced. In this way, groups of strongly correlated indicators are less likely to dominate the final SSC score.
The country rankings obtained under the three weighting approaches are shown in Table 22.
Table 22.
Comparison of Country Rankings under Alternative Weighting Schemes.
The analysis shows that overall rankings remain largely stable across three weighting approaches. Countries that have strong performances in seven dimensions such as Norway, Denmark, Sweden, and Finland appear at the top of the ranking. Similarly to proposed model countries that have weak performances in all dimensions, such as Chile, Costa Rica, Turkiye, Mexico and Colombia, these appear at the bottom of the ranking. Results are analyzed deeply in the next section.
5. Discussion and Managerial Implications
The results suggest useful differences in SSC performance across OECD countries. The countries that are placed at the top of the ranking have strong performances in every dimension of the proposed index. Norway, Denmark, Sweden, Iceland, and Finland illustrate this pattern. These countries do not always rank first in every category, but they maintain balanced performance across seven dimensions. Norway is a good example. It ranks highly in mobility, economy, and environment. It also maintains a good position in governance, social inclusion and human development. In contrast to Nordic countries, Colombia, Mexico and Türkiye perform poorly in every aspect which position them at the bottom of the ranking.
Another observation is that strong performance in one dimension alone does not guarantee a high overall ranking. The United States provides a clear example. Although it ranks first in the Innovation and Digital dimension, its overall SSC position is much lower. This suggests that technological leadership alone is not sufficient if other areas such as environment, governance, mobility, or social inclusion perform relatively weaker. Similar patterns can also be seen for Ireland and Belgium. Ireland is strong economically among others, yet its performance in urban form and livability dimension is weaker. Belgium performs better then Ireland in urban form and livability dimension but it has weak score in governance dimension. These countries perform strongly in some dimensions, yet they remain in the middle of the ranking due to weaker results in others. In this sense, the SSC framework highlights the importance of balanced development rather than isolated strengths.
The robustness analysis shows that the SSC rankings are generally stable across different weighting methods. When equal weighting and conventional entropy weighting are applied, the overall ranking structure does not change significantly. Countries that perform very well or very poorly tend to keep similar positions.
However, some moderate shifts can be observed for countries with uneven performance across dimensions. For example, the position of the United States and Australia declines under equal weighting, while countries such as Republic of South Korea and France move slightly upward. This indicates that weighting assumptions mainly affect countries whose strengths are concentrated in a limited number of dimensions.
The results also support the use of the RPEW method. Some indicators—especially those related to governance—measure similar aspects of institutional quality and may contain overlapping information. By penalizing highly correlated indicators, RPEW reduces this redundancy and helps ensure that the final SSC scores reflect multidimensional performance.
While the results highlight the importance of balanced performance across SSC dimensions, these dimensions should not be interpreted as fully independent. In practice, many of them influence each other. For example, improvements in governance may support innovation and digital development, while better mobility systems can contribute to environmental performance. In addition, these relationships may vary across countries and may also change over time. Policy makers can use the SSC index as a tool to identify strengths and weaknesses rather than as a fixed measure of performance.
The findings also have practical implications for policymakers and public administrators. The proposed SSC index can be used as a tool to identify areas that require policy attention instead of focusing only on overall rankings. Looking at the results at the dimension and indicator levels makes it possible to see where performance is relatively weak, such as governance, digital infrastructure, environmental management, or innovation capacity. This helps decision-makers focus on specific policy areas rather than applying general policy measures. For instance, if a country performs relatively well in environmental indicators but receives lower scores in governance or technology-related dimensions, policy efforts could be directed toward improving digital infrastructure, strengthening institutional coordination, or supporting innovation activities.
The framework can also be useful for benchmarking and long-term planning. Governments and urban administrations can compare their results with those of other countries. This helps them by observing where they stand in different dimensions of smart and sustainable development. Such comparisons may help identify policy areas that need improvement and allow decision-makers to learn from countries that perform better in certain areas. In this sense, the proposed index may provide a structured way for policymakers to monitor progress and guide future policy decisions related to smart and sustainable development [56].
6. Conclusions
This study aimed to develop a systematic framework for assessing SSC performance by combining smart and sustainable dimensions within a single composite index. In response to the first research question, the findings show that these dimensions can be combined without losing their individual analytical meaning when they are structured within a clear and coherent framework. Indicators are organized under well-defined dimensions. This allows smartness and sustainability to be treated as complementary elements rather than isolated or competing concepts within a consistent scoring logic.
Regarding the second research question, the results suggest that a structured and transparent scoring framework improves the comparability of SSC performance across countries. The proposed methodology highlights cross-country differences more clearly by reducing the influence of scale effects, overlapping indicators, and excessive compensation between dimensions. In addition, the robustness analysis indicates that the overall ranking structure remains largely stable under alternative weighting schemes. As a result, the SSC scores provide a more interpretable and balanced representation of overall urban performance.
The empirical results show that overall SSC rankings are closely related to how balanced countries perform across different dimensions. Countries that achieve relatively strong results in several SSC dimensions tend to rank higher overall. For instance, Nordic countries such as Norway and Sweden have higher performances across environmental, governance, mobility, and social indicators, which explains their leading positions in the SSC ranking. By contrast, some countries such as United States, Ireland and Belgium have high scores in certain dimensions but obtain lower overall scores because their performance is weaker in other areas. This pattern highlights the multidimensional nature of the SSC framework and suggests that strong results in a single dimension alone are not sufficient to have high overall SSC performance.
Despite these contributions, the study is subject to several limitations. First, although the SSC framework is conceptually designed for city-level analysis, country-level data are used due to the limited availability of city-level datasets. Second, data availability constraints required the exclusion of certain indicators from the empirical analysis, even though they remain part of the theoretical SSC framework. Thirdly, while forecasting techniques were applied to address missing recent data, these estimates represent an approximation and may not fully capture short-term structural changes. In addition, the results of the SSC index may be sensitive to variations in data availability, indicator selection, and weighting assumptions, particularly when the framework is applied in contexts with incomplete or heterogeneous datasets. Therefore, users of the model should interpret the results as a comparative analytical tool rather than an absolute measure of urban performance.
These limitations also point to promising directions for future research. In particular, future work will explore the application of the Choquet integral to model interaction effects and interdependencies among indicators and dimensions, which cannot be fully captured by conventional aggregation approaches. In addition, the study plans to employ Network Data Envelopment Analysis to examine SSC performance from a multi-stage efficiency perspective. Future studies may apply the proposed framework to city-level data as more consistent datasets become available, allowing for more detailed and policy-oriented SSC evaluations. Future research could also explore how stakeholder preferences, including those of policy makers, urban planners, and local communities, influence the relative importance of SSC dimensions and indicators within the index framework. Additionally, in future studies, the proposed framework may be systematically compared with other index approaches using the same data.
Author Contributions
Conceptualization, M.D.; methodology, M.U. and M.D.; writing—original draft preparation, M.U.; writing—review and editing, M.D.; visualization, M.U.; supervision, M.D. All authors have read and agreed to the published version of the manuscript.
Funding
This research is financially supported by Galatasaray University Research Fund Grant Number FBA-2025-1297.
Data Availability Statement
The original data presented in the study are openly available in [39,40,41,42,43,44,45,46,47,48,49,50,51,52].
Acknowledgments
The authors gratefully acknowledge the financial support provided by the TÜBİTAK-BİDEB 2211 National PhD Scholarship Program.
Conflicts of Interest
The authors declare no conflicts of interest.
Abbreviations
The following abbreviations are used in this manuscript:
| SSC | Sustainable Smart City |
| SSCs | Sustainable Smart Cities |
| OECD | Organization for Economic Co-Operation and Development |
| SDGs | Sustainable Development Goals |
| RPEW | Redundancy-Penalized Entropy Weighting |
| HDI | Human Development Index |
| R&D | Research and Development |
References
- Yin, C.; Xiong, Z.; Chen, H.; Wang, J.; Cooper, D.; David, B. A Literature Survey on Smart Cities. Sci. China Inf. Sci. 2015, 58, 1–18. [Google Scholar] [CrossRef] [Scilit]
- Kumar, H.; Singh, M.K.; Gupta, M.P.; Madaan, J. Smart City Transformation Framework: A Systematic Review and Research Agenda. Technol. Forecast. Soc. Change 2020, 153, 119281. [Google Scholar] [CrossRef] [Scilit]
- Martin, C.J.; Evans, J.; Karvonen, A. Smart and Sustainable? Five Tensions in the Visions and Practices of the Smart-Sustainable City in Europe and North America. Technol. Forecast. Soc. Change 2018, 133, 269–278. [Google Scholar] [CrossRef] [Scilit]
- Makkonen, T.; Inkinen, T. Inclusive Smart Cities? Technology-Driven Urban Development and Disability. Cities 2024, 154, 105334. [Google Scholar] [CrossRef] [Scilit]
- Abu-Rayash, A.; Dincer, I. Development of an Integrated Model for Environmentally and Economically Sustainable and Smart Cities. Sustain. Energy Technol. Assess. 2025, 73, 104096. [Google Scholar] [CrossRef] [Scilit]
- Caragliu, A.; Del Bo, C.; Nijkamp, P. Smart Cities in Europe. In Proceedings of the 3rd Central European Conference in Regional Science (CERS); Technical University of Košice: Košice, Slovakia, 2009; pp. 45–59. [Google Scholar]
- Kumar, T.M. Smart City E-Governance: Issues and Future. In E-Governance for Smart Cities; Advances in 21st Century Human Settlements; Kumar, T.M., Ed.; Springer: Singapore, 2015; pp. 155–176. [Google Scholar] [CrossRef] [Scilit]
- Toli, A.M.; Murtagh, N. The Concept of Sustainability in Smart City Definitions. Front. Built Environ. 2020, 6, 77. [Google Scholar] [CrossRef] [Scilit]
- Schipper, R.P.J.; Silvius, A.J.G. Characteristics of Smart Sustainable City Development: Implications for Project Management. Smart Cities 2018, 1, 75–97. [Google Scholar] [CrossRef] [Scilit]
- Yigitcanlar, T.; Kamruzzaman, M.; Foth, M.; Sabatini-Marques, J.; da Costa, E.; Ioppolo, G. Can Cities Become Smart without Being Sustainable? A Systematic Review of the Literature. Sustain. Cities Soc. 2019, 45, 348–365. [Google Scholar] [CrossRef] [Scilit]
- Höjer, M.; Wangel, J. Smart Sustainable Cities: Definition and Challenges. In ICT Innovations for Sustainability; Springer: Cham, Switzerland, 2015; pp. 333–349. [Google Scholar] [CrossRef] [Scilit]
- Bibri, S.E.; Krogstie, J. Smart sustainable cities of the future: An extensive interdisciplinary literature review. Sustain. Cities Soc. 2017, 31, 183–212. [Google Scholar] [CrossRef] [Scilit]
- Kaiser, Z.R.M.A.; Deb, A. Sustainable Smart City and Sustainable Development Goals (SDGs): A Review. Reg. Sustain. 2025, 6, 100193. [Google Scholar] [CrossRef] [Scilit]
- Bhattacharya, T.R.; Bhattacharya, A.; McLellan, B.; Tezuka, T. Sustainable Smart City Development Framework for Developing Countries. Urban Res. Pract. 2020, 13, 180–212. [Google Scholar] [CrossRef] [Scilit]
- Cohen, B. The Smartest Cities in the World 2015. Fast Company 2014. Available online: https://www.fastcompany.com/3038818/the-smartest-cities-in-the-world-2015-methodology (accessed on 8 March 2026).
- Sharifi, A. A Typology of Smart City Assessment Tools and Indicator Sets. Sustain. Cities Soc. 2020, 53, 101936. [Google Scholar] [CrossRef] [Scilit]
- Toh, C.K. Smart City Indexes, Criteria, Indicators and Rankings: An In-Depth Investigation and Analysis. IET Smart Cities 2022, 4, 211–228. [Google Scholar] [CrossRef] [Scilit]
- Haksevenler, B.H.G.; Senik, B.; Sengul, Z.; Sorhun, E. Developing a Framework for a Sustainable City Index: A Comprehensive Approach to Urban Sustainability. Sustain. Cities Soc. 2025, 130, 106669. [Google Scholar] [CrossRef] [Scilit]
- Choon, S.W.; Siwar, C.; Pereira, J.J.; Jemain, A.A.; Hashim, H.S.; Hadi, A.S. A Sustainable City Index for Malaysia. Int. J. Sustain. Dev. World Ecol. 2011, 18, 28–35. [Google Scholar] [CrossRef] [Scilit]
- Pira, M. A Novel Taxonomy of Smart Sustainable City Indicators. Humanit. Soc. Sci. Commun. 2021, 8, 197. [Google Scholar] [CrossRef] [Scilit]
- Ozkaya, G.; Erdin, C. Evaluation of Smart and Sustainable Cities through a Hybrid MCDM Approach Based on ANP and TOPSIS Technique. Heliyon 2020, 6, e05052. [Google Scholar] [CrossRef] [Scilit]
- Shmelev, S.E.; Shmeleva, I.A. Global urban sustainability assessment: A multidimensional approach. Sustain. Dev. 2018, 26, 904–920. [Google Scholar] [CrossRef] [Scilit]
- Gómez-Álvarez, D.; López-Moreno, E. Indicators for Measuring Urban Sustainability and Resilience. In Urban Planet: Knowledge Towards Sustainable Cities; Elmqvist, T., Bai, X., Frantzeskaki, N., Griffith, C., Maddox, D., McPhearson, T., Parnell, S., Romero-Lankao, P., Simon, D., Watkins, M., Eds.; Cambridge University Press: Cambridge, UK, 2018; pp. 163–179. [Google Scholar] [CrossRef] [Scilit]
- IESE Business School. Cities in Motion Index 2024; IESE Business School, University of Navarra: Pamplona, Spain, 2024; Available online: https://www.iese.edu/media/research/pdfs/ST-0649-E.pdf (accessed on 6 March 2026).
- ISO 37120:2018; Sustainable Cities and Communities—Indicators for City Services and Quality of Life. ISO: Geneva, Switzerland, 2018. Available online: https://www.iso.org/obp/ui/en/#iso:std:68498:en (accessed on 6 March 2026).
- Arcadis. The Arcadis Sustainable Cities Index 2024; Arcadis: Amsterdam, The Netherlands, 2024; Available online: https://www.arcadis.com/en/insights/perspectives/global/sustainable-cities-index-2024 (accessed on 6 March 2026).
- Corporate Knights. The Sustainable Cities Index; Corporate Knights: Toronto, ON, Canada, 2023; Available online: https://www.corporateknights.com/wp-content/uploads/2023/04/2023-Sustainable-Cities-Index-Report-1.pdf (accessed on 6 March 2026).
- Sachs, J.D.; Lafortune, G.; Fuller, G. Sustainable Development Report 2024; Sustainable Development Solutions Network: Paris, France, 2024; Available online: https://s3.amazonaws.com/sustainabledevelopment.report/2024/sustainable-development-report-2024.pdf (accessed on 6 March 2026).
- United Nations Human Settlements Programme (UN-Habitat). City Prosperity Index. Available online: https://data.unhabitat.org/pages/city-prosperity-index (accessed on 9 March 2026).
- IMD World Competitiveness Center. IMD Smart City Index 2025; IMD: Lausanne, Switzerland, 2025; Available online: https://imd.widen.net/s/psdrsvpbk7/imd_smart_city_2025_report (accessed on 6 March 2026).
- Hegazy, I.R.; Mahboob, A. Evaluating Riyadh’s Smart City Initiatives: Insights from the IMD Smart City Index Framework. Int. J. Low-Carbon Technol. 2024, 19, 2446–2460. [Google Scholar] [CrossRef] [Scilit]
- GPCI. Global Power City Index 2025 Summary; Mori Memorial Foundation: Tokyo, Japan, 2025; Available online: https://mori-m-foundation.or.jp/english/ius2/gpci2/index.shtml (accessed on 6 March 2026).
- Indian School of Business. India Smart Cities Index; Indian School of Business: Hyderabad, India, 2016; Available online: https://shaktifoundation.in/wp-content/uploads/2014/02/Smart-Cities-Index.pdf (accessed on 6 March 2026).
- Taş, M.A.; Alptekin, S.E. Evaluation of major cities in terms of smart cities: A developing country perspective. Procedia Comput. Sci. 2023, 225, 1717–1726. [Google Scholar] [CrossRef] [Scilit]
- Gazzeh, K. Ranking Sustainable Smart City Indicators Using Combined Content Analysis and Analytic Hierarchy Process Techniques. Smart Cities 2023, 6, 2883–2909. [Google Scholar] [CrossRef] [Scilit]
- United Nations. Transforming Our World: The 2030 Agenda for Sustainable Development; United Nations: New York, NY, USA, 2015; Available online: https://sdgs.un.org/2030agenda (accessed on 9 March 2026).
- UN-Habitat. Global Urban Monitoring Framework: A Guide for Urban Monitoring of SDGs and NUA and Other Urban-Related Thematic or Local, National and Global Frameworks; UN-Habitat: Nairobi, Kenya, 2022; Available online: https://unhabitat.org/the-global-urban-monitoring-framework (accessed on 18 March 2026).
- Wong, C. A Framework for “City Prosperity Index”: Linking Indicators, Analysis and Policy. Habitat Int. 2014, 45, 3–9. [Google Scholar] [CrossRef] [Scilit]
- World Bank. World Development Indicators; World Bank: Washington, DC, USA, 2026; Available online: https://data.worldbank.org (accessed on 6 March 2026).
- World Bank. Worldwide Governance Indicators (WGI): Interactive Data Access; World Bank: Washington, DC, USA, 2026; Available online: https://www.worldbank.org/en/publication/worldwide-governance-indicators/interactive-data-access (accessed on 6 March 2026).
- Organisation for Economic Co-operation and Development (OECD). OECD Data; OECD: Paris, France, 2026; Available online: https://data.oecd.org (accessed on 6 March 2026).
- International Telecommunication Union (ITU). ITU Statistics Database; ITU: Geneva, Switzerland, 2026; Available online: https://www.itu.int/en/ITU-D/Statistics (accessed on 6 March 2026).
- United Nations. United Nations E-Government Knowledgebase; United Nations Department of Economic and Social Affairs (UN DESA): New York, NY, USA, 2026; Available online: https://publicadministration.un.org/egovkb (accessed on 6 March 2026).
- Roser, M.; Ritchie, H.; Ortiz-Ospina, E. Our World in Data; Global Change Data Lab: Oxford, UK, 2026; Available online: https://ourworldindata.org (accessed on 6 March 2026).
- International Energy Agency (IEA). IEA Data and Statistics; IEA: Paris, France, 2026; Available online: https://www.iea.org/data-and-statistics (accessed on 6 March 2026).
- The Global Economy. Forest Area (% of Land Area)—Country Rankings. Available online: https://www.theglobaleconomy.com/rankings/forest_area/ (accessed on 6 March 2026).
- University of Notre Dame. Notre Dame Global Adaptation Initiative (ND-GAIN) Country Index; University of Notre Dame: Notre Dame, IN, USA, 2026; Available online: https://gain.nd.edu (accessed on 6 March 2026).
- World Population Review. Country Statistics Database. Available online: https://worldpopulationreview.com (accessed on 6 March 2026).
- World Health Organization. Global Health Observatory Data Repository; WHO: Geneva, Switzerland, 2026; Available online: https://www.who.int/data/gho (accessed on 6 March 2026).
- International Labour Organization. ILOSTAT Database; ILO: Geneva, Switzerland, 2026; Available online: https://ilostat.ilo.org (accessed on 6 March 2026).
- UNICEF; World Health Organization. Joint Monitoring Programme (JMP) for Water Supply, Sanitation and Hygiene. Available online: https://washdata.org (accessed on 6 March 2026).
- Institute for Economics and Peace. Global Peace Index 2024; Institute for Economics and Peace: Sydney, Australia, 2026; Available online: https://www.visionofhumanity.org (accessed on 6 March 2026).
- Shannon, C.E. A mathematical theory of communication. Bell Syst. Tech. J. 1948, 27, 379–423. [Google Scholar] [CrossRef] [Scilit]
- Zeleny, M. Multiple Criteria Decision Making; McGraw-Hill: New York, NY, USA, 1982. [Google Scholar]
- Boggia, A.; Cortina, C. Measuring Sustainable Development Using a Multi-Criteria Model: A Case Study. J. Environ. Manag. 2010, 91, 2301–2306. [Google Scholar] [CrossRef] [Scilit]
- Benites, A.J.; Simões, A.F. Assessing the urban sustainable development strategy: An application of a smart city services sustainability taxonomy. Ecol. Indic. 2021, 127, 107734. [Google Scholar] [CrossRef] [Scilit]



Disclaimer/Publisher’s Note: The statements, opinions and data contained in all publications are solely those of the individual author(s) and contributor(s) and not of MDPI and/or the editor(s). MDPI and/or the editor(s) disclaim responsibility for any injury to people or property resulting from any ideas, methods, instructions or products referred to in the content. |
© 2026 by the authors. Licensee MDPI, Basel, Switzerland. This article is an open access article distributed under the terms and conditions of the Creative Commons Attribution (CC BY) license.