


Abstract
In the context of multiple overlapping uncertainties, upstream disruptions in electric vehicle supply chain networks are becoming increasingly frequent. Given the dynamic and sudden nature of disruption risks, this paper introduces a stochastic stopping model to incorporate disruption risks into resilience governance. This study constructs a differential game model for resilience governance in electric vehicle supply chain networks, involving governments, suppliers, and core manufacturers. This study proposes a dynamic resilience differential equation, which integrates resilience investment efforts. Then, this study explores optimal resilience strategies and dynamic equilibrium trajectories of resilience levels under three game models. The results indicate that optimal resilience investment efforts are negatively correlated with the effort-cost coefficients, resilience decay rates, disruption probability, and damage rate. Conversely, these efforts are positively correlated with supply chain network resilience, benefits, and the resilience influence coefficients. Disruption probability and damage rate are negatively correlated with benefits. Disruption risks distort the time preferences of governance entities, causing them to overvalue immediate gains and undervalue future returns. Finally, both supply chain resilience and total benefits reach their optimal levels under the collaborative game model.
1. Introduction
High-uncertainty events persistently disrupt the electric vehicle supply chain, leading to frequent upstream supply disruptions [1]. Traditional upstream-downstream governance models face significant challenges. The 2020 chip shortage led to production cuts in the electric vehicle industry [2]. Meanwhile, the 2022 Russia-Ukraine conflict interrupted the supply of raw materials and components, including nickel and wiring harnesses, directly impacting European electric vehicle manufacturers’ production plans [3]. Amid this complex and volatile environment, the vulnerability of the electric vehicle supply chain networks has been increasingly apparent. Since 2021, China has elevated the resilience and security of critical industrial chains, including electric vehicles, to a national strategic priority. By 2025, explicit goals in China have been set to enhance national security capacities in key areas, secure energy and critical supply chains, and strengthen security governance. In reality, building resilience in electric vehicle supply chain networks is a process of collaborative and systemic optimization. The actions of entities, including governments, suppliers, and manufacturers collectively influence the resilience of supply chain networks. Therefore, enhancing supply chain resilience through systematic governance has become a core challenge for ensuring the secure and stable development of the electric vehicle industry.
Against this backdrop, scholars have extensively explored strategies for enhancing supply chain resilience [4,5,6]. However, the security and stability of supply chain networks depend not only on the strategies of relevant stakeholders but also on the resilience investment efforts made by governance entities. Furthermore, existing studies have investigated supply chain network resilience governance through game-theoretic frameworks [7,8,9]. However, they mainly focus on traditional sectors like food and manufacturing, and pay insufficient attention to the electric vehicle supply chain networks. Furthermore, research on the government’s influence regarding policy guidance and cost-sharing mechanisms remains lacking. Existing papers adopt static paradigms, which cannot capture the ongoing and long-term nature of business or the dynamic evolution of supply chain resilience. Finally, existing studies overlook the dynamic evolution of disruption risks and the effect of uncertainty on the supply chain network resilience.
To address these gaps, this paper constructs a dynamic differential game model for electric vehicle supply chain networks’ resilience governance under disruption risks. The model involves governments, suppliers, and core manufacturers. This study innovatively incorporates resilience investment efforts into the dynamic resilience equation. This study reveals the optimal strategies and resilient dynamic equilibrium trajectories of governance entities under three governance models, and further analyzes the impact of factors such as the effort cost coefficient on these optimal strategies. By establishing a forward-looking decision framework, this research aims to enhance adaptive governance capabilities for disruptive risks, thereby promoting more efficient recovery and sustainable development of the electric vehicle supply chain network. This study aims to answer three questions:
(1) How should governance entities determine their optimal resilience investments before and after a disruptive event?
(2) How should governance entities adjust their resilience investment efforts when the probability of the disruption and its potential damage rate increase?
(3) Does the cost-sharing mechanism remain effective in the event of a disruption?
The structure of this paper is as follows: Section 2 reviews the relevant literature. Section 3 presents the problem description and model assumptions; Section 4 constructs and analyzes three models; Section 5 compares and contrasts different scenario patterns; Section 6 presents a numerical analysis. Section 7 conducts multi-scenario analysis. Section 8 provides discussions. Section 9 presents the research conclusions, management implications.
2. Literature Review
2.1. Supply Chain Network Disruption Risks
Supply chain network disruption risk is an urgent challenge for various industries and has become a key research topic in the field of supply chain management. Lou et al. [10] applied an SIR model to analyze the impact of upstream mining disruptions on the resilience of the electric vehicle battery supply chain. López et al. [11] identified six types of geopolitical supply chain disruptions and their impacts through a comprehensive literature review. Manupati et al. [12] explored how disruption risks propagate through supply chain networks to evaluate product flows in multi-tier supply chains. Ke et al. [13] utilized U.S. manufacturing data to examine how firms use air transport to mitigate supply chain disruption risks. Lou et al. [14] analyzed how resilience strategies enhance supply chain performance during disruptions, providing a basis for manufacturing firms to select strategies in complex environments. Ma et al. [15] analyzed the backup production and financing strategies adopted by capital-constrained suppliers during supply disruptions. Kumar et al. [16] developed a multi-objective mixed-integer nonlinear programming model to design resilient and reliable semiconductor supply chains under disruption risks. Duong et al. [17] surveyed 285 construction firms to analyze disruption risks’ direct and indirect impacts on supply chain resilience.
Although prior literature has addressed supply chain disruption risks and mitigation strategies, few studies have systematically investigated their impact on the resilience of electric vehicle supply chain networks and the decision-making of their governance entities.
2.2. The Governance of Supply Chain Network Resilience
Zhong et al. [18] proposed four resilience enhancement strategies for the crude oil maritime supply chain, including signing long-term supply contracts, reinforcing receiving port facilities, and establishing strategic crude oil reserves. Nibbrig et al. [19] focused on production chains, integrating risk vulnerability assessment and resilience enhancement strategies through a three-tier optimization model. Liang et al. [20] examined the synergistic effect of governance mechanisms and digital capabilities on supply chain resilience. Hosseinzadeh et al. [21] proposed resilience strategies, including outsourcing, supplier development, and backup supplier contracts. Kettele et al. [22] proposed resilience strategies across strategic, tactical, and operational dimensions to mitigate food supply chain disruptions. Habibi et al. [23] found that supplier diversification improved performance during localized disruptions, but its effectiveness diminished when disruption risks propagated globally. Li et al. [24] found that government-led public-private partnerships in pandemic mask supply chains mitigated disruptions, enhanced resilience, and ensured public access.
However, enhancing supply chain resilience depends not only on the resilience strategies employed by governance entities but also on the level of resilience investment efforts. Existing studies overlook the impact of resilience investment efforts. Meanwhile, they fail to balance the differing interests among entities and neglect the synergistic effects generated by interdependent decision-making among entities in resilient governance.
2.3. Game Theory Approach
Existing studies primarily apply game theory to pricing or subsidy strategies among multiple entities [25,26]. Supply chain network resilience governance involves long-term interactions among multiple stakeholders, and its decision-making is an evolving process over time. Although scholars have employed evolutionary game theory to study supply chain resilience [8,27] and explore multi-actor collaboration, this approach has limitations in capturing the dynamic nature of resilience. Existing evolutionary game models treat corporate investments and resilience as static decisions and outcomes. Furthermore, these models focus on analyzing long-term evolutionary trends in group strategy selection, making it difficult to precisely capture the real-time, continuous dynamic adjustments of optimal control strategies by governance entities under disruption risks.
The complexity, global span, and technological intensity of the electric vehicle supply chain render it particularly vulnerable to inherently uncertain disruptions, where a single point of failure can trigger cascading crises. This vulnerability necessitates continuous and dynamic operational adjustments by firms. The differential game method effectively captures the continuous-time and strategic dynamics of firm operations [28]. Therefore, this study employs this method to investigate the dynamic decision-making processes of various governance entities under disruption risks.
This study makes three key contributions to bridge these gaps. First, it develops a dynamic differential game framework to analyze how governance entities within electric vehicle supply chain networks make optimal strategies across consecutive cycles before and after disruption risks. Second, it introduces a stochastic stopping model to capture the uncertainty of disruption occurrence. Third, it integrates resilience investment efforts into the governance framework and derives optimal strategies under three distinct models. Table 1 shows the differences between this paper and the relevant literature.
Table 1.
Comparison with Previous Studies.
3. Problem Description and Model Assumptions
3.1. Problem Description
Resilience investment efforts are initiatives undertaken by governance entities to maintain supply chain stability and enhance the resilience of the electric vehicle supply chain network.
Governments invest in resilience efforts to mitigate the economic and social welfare impacts of disruptions. These efforts include policy subsidies, national strategic reserves for critical components, and standards for digital twin applications. In addition, the governments guide and incentivize suppliers and manufacturers to incorporate a higher level of effort into their rational decision-making through cost-sharing mechanisms.
Suppliers provide foundational support for the stable operation of supply chain networks through resilience efforts such as information sharing and resilient supplier building. Manufacturers achieve cross-enterprise collaborative governance through efforts, including multi-source procurement, deployment of digital twin technology, and iterative technological innovation. Both aim to maximize their own interests. While undertaking social responsibilities, they carefully weigh the costs and benefits of their resilience-building efforts.
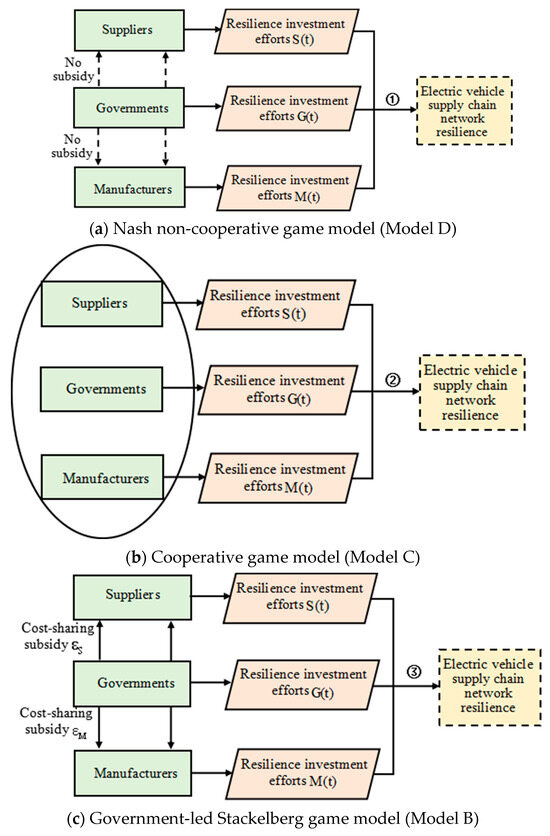
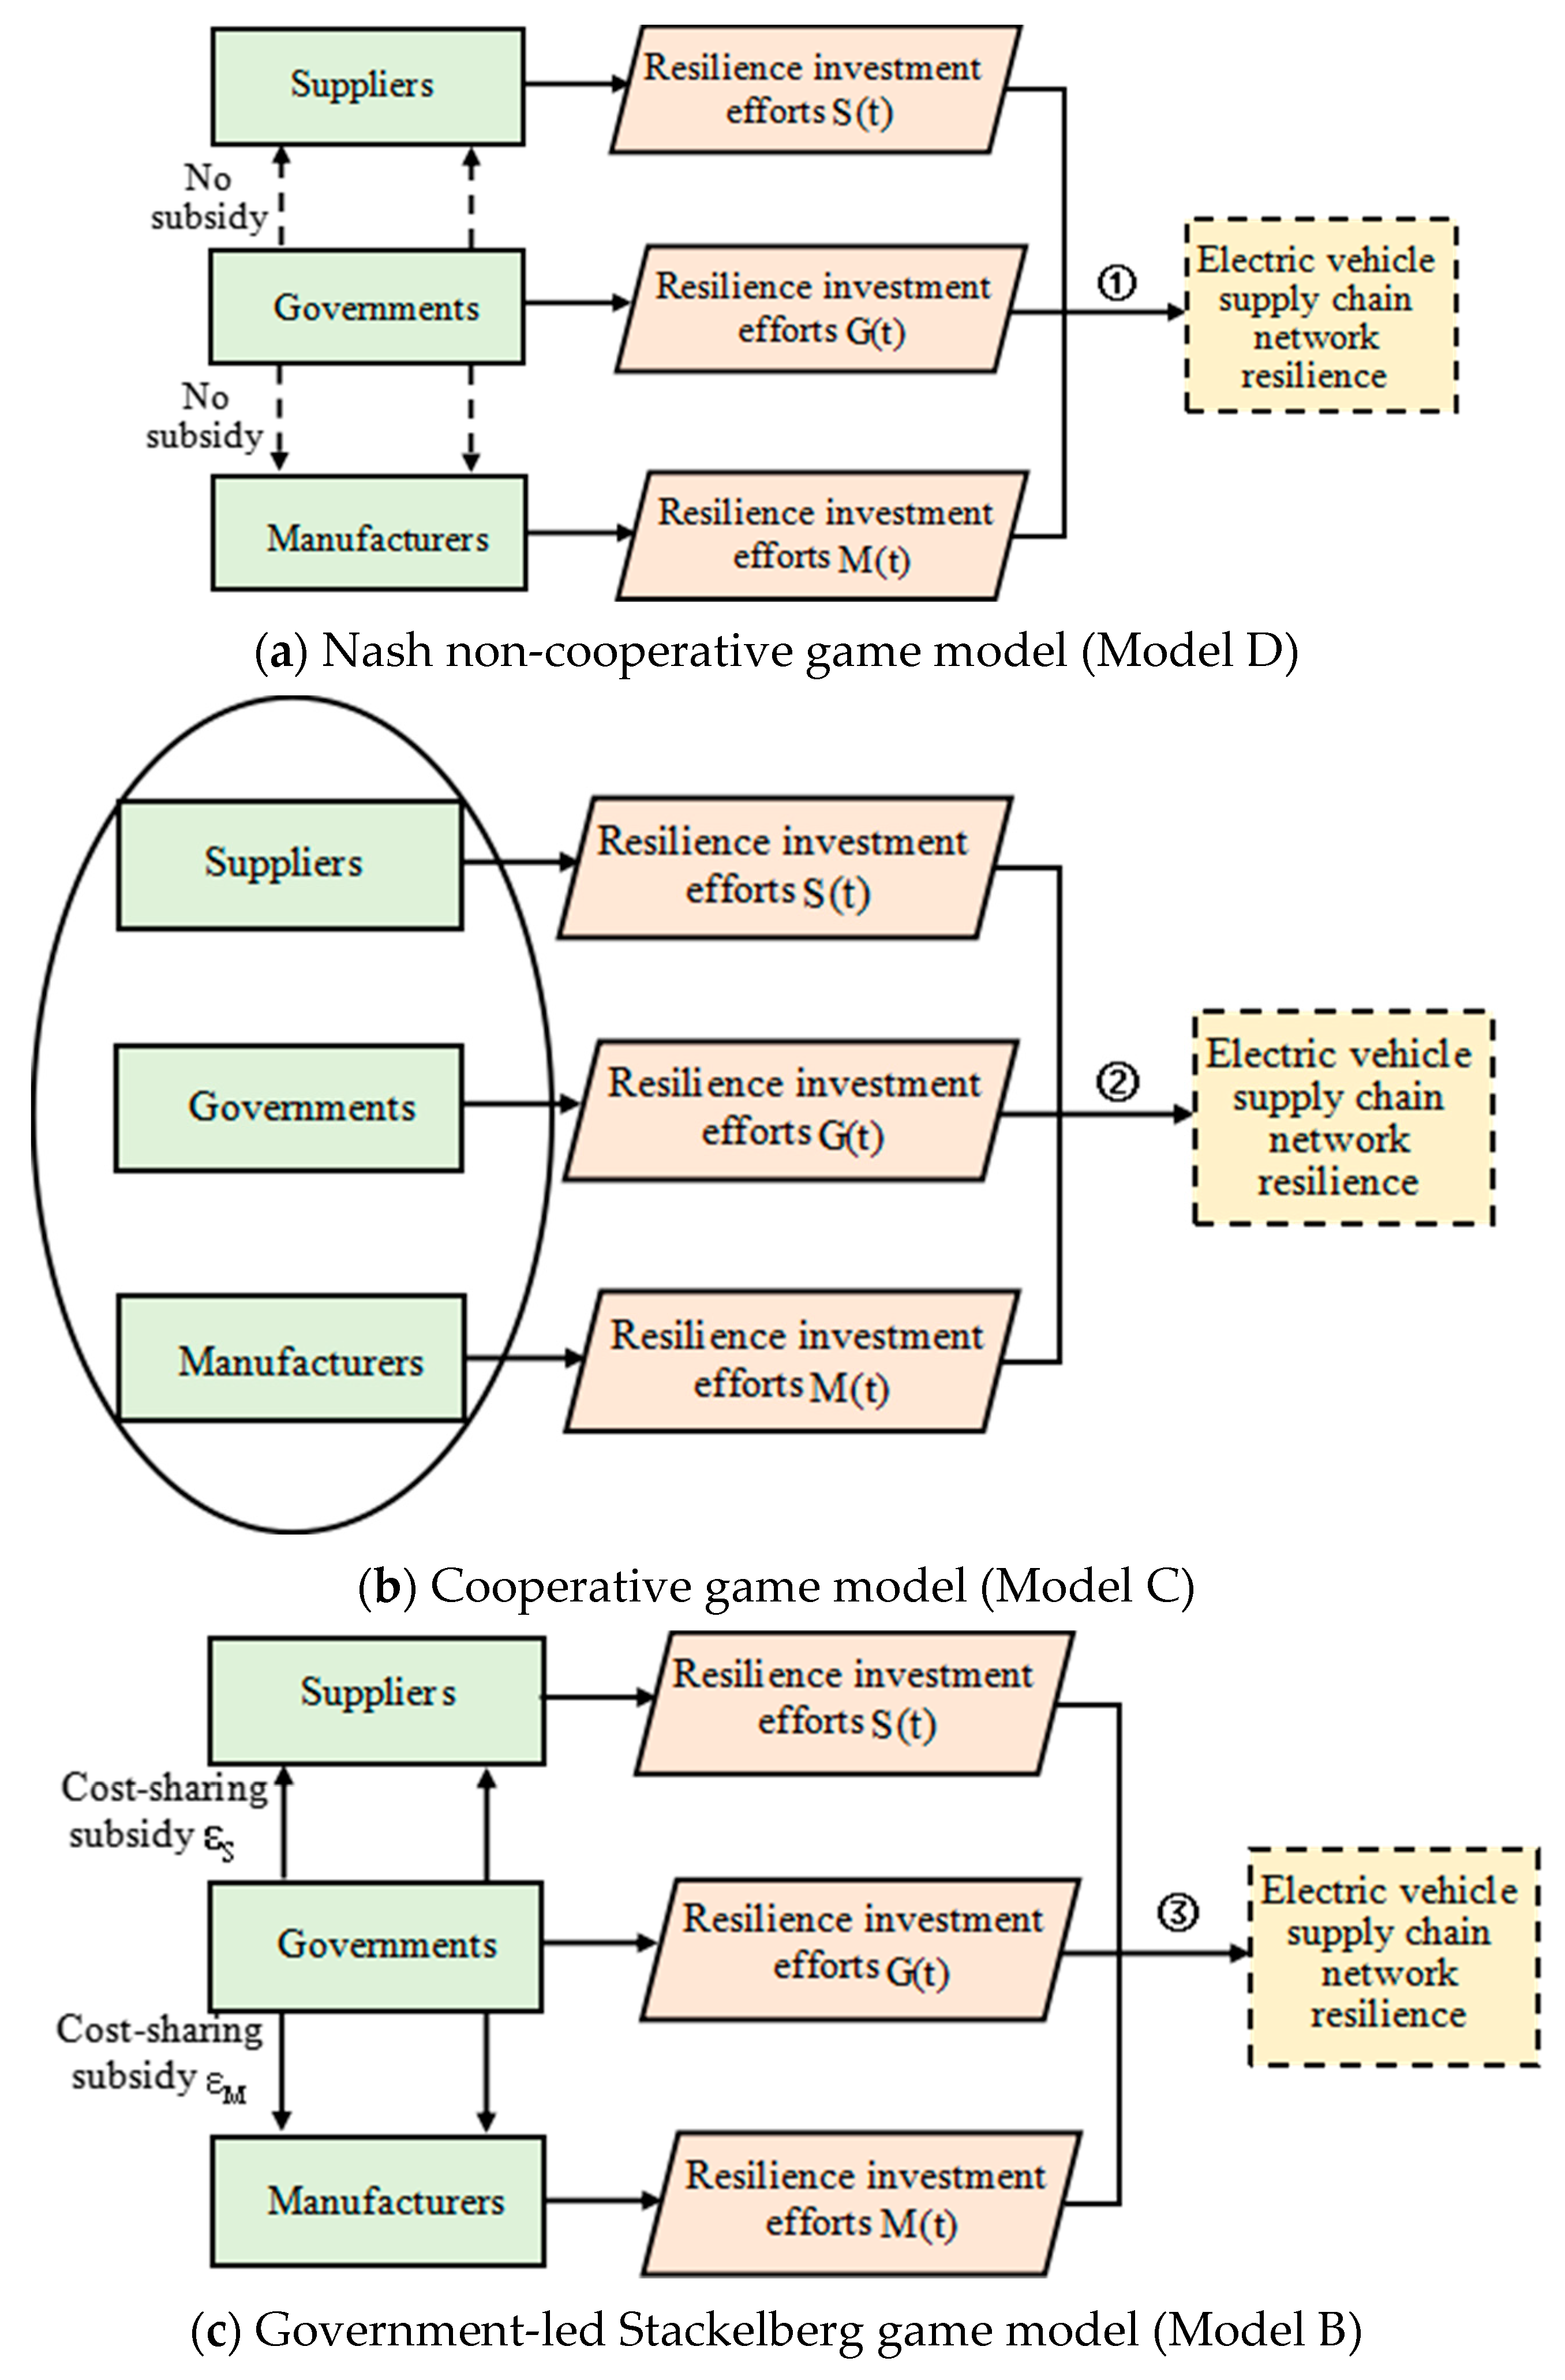
This study divides the resilience governance process of electric vehicle supply chain networks into three distinct models, as shown in Figure 1. ① Nash non-cooperative game model (Model D): governments do not share costs with suppliers and manufacturers. The three entities operate independently to maximize their own profits. ② Cooperative game model (Model C): governance entities collaborate in decision-making with the aim of maximizing the overall benefit of the entire governance system. ③ Government-led Stackelberg game model (Model B): governments, as dominant players, first determine their optimal resilience investment effort and allocate costs to suppliers and manufacturers at ratios and respectively. Subsequently, suppliers and manufacturers determine their own optimal resilience investment efforts based on the government’s strategy.
Figure 1.
Schematic Diagram of Resilience Governance in Electric Vehicle Supply Chain Networks under Three Models.
3.2. Symbol Definitions
Variables and parameters are defined in Table 2.
Table 2.
Model Symbols and Meanings.
3.3. Model Assumptions
Hypothesis 1.
Supply chain network resilience is a key indicator of the security and stability of the electric vehicle supply chain. Enhancing this resilience requires the joint efforts of governments, suppliers, and manufacturers. Based on the Nerlove classical model [32], resilience declines at a relative decay rate when governance entities exert zero effort in resilience investment. The dynamic evolution of the electric vehicle supply chain network resilience can be described as follows:
Among these, disruption risk can trigger “despair mentality” and “free-riding” behavior, eroding the information-sharing and trust foundations of the supply chain and thereby diluting the effectiveness of resilience efforts by governments, suppliers, and manufacturers. Therefore, we assume .
Hypothesis 2.
The cost of resilience investment increases with the level of effort exerted by the governance entities. Following the convexity of cost functions and the principle of increasing marginal costs [33], the resilience investment costs for governments, suppliers, and manufacturers are modeled as convex functions of their respective effort levels:
Hypothesis 3.
Given that the total revenue depends on both the overall resilience and the investment efforts of governance entities, we formulate the total revenue function accordingly, drawing on reference [34].
Here, “total revenue” refers to the aggregate income generated by collaborative governance among all entities, without deducting effort costs. The profit functional will be presented in the objective function section below. The total benefits from collaborative governance are allocated according to predetermined proportions: suppliers receive , manufacturers receive , and governments receive .
Hypothesis 4.
Governments, suppliers, and manufacturers operate within an infinite time horizon with the same discount factor , aiming to maximize their returns over this infinite period.
Hypothesis 5.
To incentivize resilience efforts by suppliers and manufacturers, the government share the cost of these efforts between the two parties, with cost-sharing ratios and
, where
.
Hypothesis 6.
Disruption risk can inflict devastating damage on the resilience of supply chain networks. Disruption risk occurs randomly, and its occurrence timing T is unknown. Drawing on reference [35], we assume that denotes the occurrence process of disruption risk, which is a jump process. The disruption risk may occur at any future time t with probability . Then
denotes the probability that the disruption risk does not occur at time t but occurs at time
. and denote the probability density function and probability distribution function of the disruption occurrence time T, respectively.
Major disruptions in the electric vehicle supply chain are characterized by abrupt onset and severe consequences. The 2022 Russia-Ukraine conflict, for instance, abruptly cut off the supply of key battery materials, causing rapid production halts, logistics failures, and order delays among electric vehicle manufacturers. Given the rapid nature of such decay, this study models such rapid decay as an instantaneous shock. Disruption risks cause an instantaneous decline in the resilience level of the electric vehicle supply chain network, resulting in discontinuity in the resilience level before and after the occurrence of such risks, i.e., , with a resilience loss of
. and denote the levels of supply chain network resilience before and after the risk of disruption, respectively. A higher damage rate from disruption risks leads to a steeper decline in resilience, causing greater economic losses in the supply chain network.
Hypothesis 7.
Disruption risks severely compromise both the resilience and profitability of electric vehicle supply chain networks. Governance entities adopt distinct response strategies based on the timing T of disruption risk occurrence, with denoting the pre-disruption and post-disruption phases respectively. Therefore, the utility functions for governments, suppliers, and manufacturers are respectively as follows:
The occurrence time T of the disruption risk is uncertain, with values ranging from
.
The pre- and post-disruption benefits of governance entities are stochastic and correlated with the timing T of the disruption. Taking the expectation over the random variable T, the expected net present values of the total benefits for governments, suppliers, and manufacturers are given by
,
, and
.
The expected net present values for governments, suppliers, and manufacturers over the entire phase are given by:
4. Model Construction and Analysis
This study examines optimal decision-making for governance entities across three game models: the Nash non-cooperative, collaborative, and government-led Stackelberg models. It focuses on their impact on the resilience and profitability of electric vehicle supply chain networks. The time variable t is omitted for brevity in the solution process.
4.1. Nash Non-Cooperative Game Model (Model D)
In the scenario, governments do not share costs with suppliers and manufacturers. The three governance entities make independent decisions to maximize their own benefits. They fully consider the impact of disruption risks and formulate optimal strategies to enhance the supply chain network resilience before and after disruptions. The objective functions for governments, suppliers, and manufacturers, respectively, are:
In Equations (9)–(11), , and denote the objective functions for governments, suppliers, and manufacturers, respectively, during the planning period.
Proposition 1.
Equilibrium outcomes in Nash non-cooperative game models: (1) The governments’ optimal resilience investment efforts before and after a disruption risk are, respectively:
The suppliers’ optimal resilience investment efforts before and after a disruption risk are, respectively:
The manufacturers’ optimal resilience investment efforts before and after a disruption risk are, respectively:
(2) The optimal trajectories of resilience for the electric vehicle supply chain network over time are described by the following two equations:
where
The post-disruption expected returns for governments, suppliers, and manufacturers are respectively , and . The optimal value functions for the expected returns of governments, suppliers, and manufacturers throughout the entire period are , and . The relevant parameters in the optimal value function are as follows: , ,
Detailed proofs are provided in Appendix A.
Corollary 1.
The relationship between optimal resilience investment efforts by governance entities under the Nash model and the disruption risk probability alongside damage rate: . The relationship between optimal resilience investment efforts by governments, suppliers, and manufacturers before and after disruption risks, and resilience decline rate: .
Corollary 1 indicates that the probability of disruption risks affects the strategy formulation by governance entities prior to the risk’s occurrence. The high probability of disruption risks leads entities to reduce resilience investment efforts. This is because the probability of disruption risks is incorporated into the discount rate. A higher discount rate diminishes the present value of future returns, which amplifies the myopic tendencies of governance entities and shifts their time preferences toward the present. Additionally, the resilience investment efforts are negatively correlated with the damage rate of disruption risks. This is because high-impact disruptions significantly undermine supply chain network resilience, which in turn reduces the returns on prior investments and the efficiency of resource utilization by governance entities. This severely undermines the motivation for their resilience investment efforts. The optimal pre-disruption effort is influenced by the current natural decay rate and the post-disruption decay rate. The magnitude of these rates directly reflects the sustainability of investment returns. After a disruption occurs, the resilience level of the supply chain network decays at an accelerated pace. Therefore, reducing the post-disruption decay rate is an effective approach to enhancing resilience and mitigating risks.
Corollary 2.
The relationship between the influence coefficients of resilience investment efforts by governments, suppliers, and manufacturers on supply chain network resilience and those efforts themselves: . Relationship between optimal resilience investment efforts and benefits influence coefficients for governments, suppliers, and manufacturers: .
According to Corollary 2, the resilience investment efforts of governance entities increase as the coefficients of their efforts on supply chain network resilience and on returns rise. Greater resilience investment efforts yield more effective improvements in supply chain network resilience. If sustained resilience investment efforts prove to efficiently translate effort into tangible value, governance entities will naturally optimize resource allocation by prioritizing this domain. Furthermore, the benefit impact coefficient refers to the marginal benefit obtained per unit of resilience investment effort. Only when governance entities achieve greater returns by enhancing resilience will they be willing to bear the upfront costs and efforts required for such investment. This provides clear guidance for policymakers and core enterprises in supply chain networks: it is essential to design mechanisms such as benefit sharing, risk pooling, or performance incentives to enhance the sense of gain among all parties involved in resilience investment efforts, thereby effectively mobilizing their initiative.
4.2. Cooperative Game Model (Model C)
In this scenario, governments collaborate with suppliers and manufacturers to enhance resilience. The entire governance system aims to maximize benefits:
Proposition 2.
Equilibrium outcomes in cooperative game models: the governments’ optimal resilience investment efforts before and after the disruption risk are, respectively: , ; the suppliers’ optimal resilience investment efforts before and after the disruption risk are, respectively: , ; the manufacturers’ optimal resilience investment efforts before and after the disruption risk are, respectively: , ; the optimal trajectories of resilience for the electric vehicle supply chain network over time are described by the following two equations:
where
The expected return of the entire system after disruption risk is . The optimal value function for the expected return over the entire period is , where , ,
Corollary 3.
In the scenario, , , , , , , , , , , , , , , .
Corollary 3 indicates that under disruption risks, governance entities should consider not only the probability and damage rate of a disruption but also the resilience decay rates before and after it when formulating strategies. Moreover, the optimal resilience investment efforts of governance entities are negatively correlated with the decay rate of supply chain network resilience. Finally, analysis of the optimal value function suggests that profit sharing among governance entities may induce free-riding behavior. If only one party invests in resilience while others free-ride, it will further undermine efforts to enhance supply chain network resilience.
4.3. Government-Led Stackelberg Game Model (Model B)
As the leading entity, governments play a role in coordinating relationships and sharing costs during the enhancement of resilience governance within the electric vehicle supply chain network. The objective functions for governments, suppliers, and manufacturers, respectively, are:
In Equations (13)–(15), , and denote the objective functions for governments, suppliers, and manufacturers respectively during the planning period.
Proposition 3.
Equilibrium outcomes in this model: (1) the governments’ optimal resilience investment efforts before and after the disruption risk are, respectively:
; the suppliers’ optimal resilience investment efforts before and after the disruption risk are, respectively:
; the manufacturers’ optimal resilience investment efforts before and after the disruption risk are, respectively:
; and the optimal cost-sharing ratios for suppliers and manufacturers by governments are, respectively:
(2) The optimal trajectories of resilience for the electric vehicle supply chain network over time are described by the following two equations:
where
The expected returns for governments, suppliers, and manufacturers following the disruption risk are, respectively, ,
and . The optimal value functions for the expected returns of governments, suppliers, and manufacturers throughout the entire period are , and . The relevant parameters in the optimal value function are as follows:
Corollary 4.
The cost-sharing mechanism is designed to incentivize behaviors that are in compliance with government standards. Since the cost-sharing coefficient is associated with the profit distribution ratio, it remains unchanged regardless of disruption risks. Compared to the Nash non-cooperative model, government cost-sharing modifies the effect of the profit distribution ratio on the optimal resilience investment efforts of suppliers and manufacturers. As the profit distribution ratio increases, resilience investment efforts gradually rise. The governments’ cost-sharing behavior aims to incentivize suppliers and manufacturers to enhance resilience investment efforts, but this requires a certain level of revenue guarantee as a precondition. Through upfront cost sharing, governments lower the firms’ burden, which directly translates into higher effort levels, thereby promoting more robust and sustained resilience investment.
5. Comparative Analysis of Results
This paper compares the optimal strategies, supply chain resilience levels, and stakeholder benefits across different models under disruption risks, analyzing their impact on governance entities’ decision-making.
Corollary 5.
Comparison of optimal strategy magnitudes among governance entities:
Corollary 5 indicates that under the cooperative game model, the equilibrium strategy of the governing entities and the steady-state resilience of the supply chain network are optimal. Conversely, under the Nash non-cooperative model, both are at their lowest levels. The government exerts the same level of effort in both the government-led Stackelberg game and the Nash non-cooperative game. However, by introducing a cost-sharing mechanism, the government can effectively incentivize suppliers and manufacturers to increase their investment efforts.
Corollary 6.
Comparison of total returns for governance entities across different models: , ; the optimal returns for the principal before and after disruption risks are, respectively, , , and , , .
According to Corollary 6, the total returns of the overall system achieve optimal levels respectively before and after disruption risks under the cooperative game model. Furthermore, the government-led Stackelberg game represents a Pareto improvement over the Nash non-cooperative game, achieved through cost-sharing behaviors that enhance the system’s overall benefits.
Corollary 7.
Under the same model, if , the relationship between the optimal strategies of the governing entities before and after the disruption risk: , , , , , , , , .
Corollary 7 indicates that under certain conditions, disruption risks cause permanent negative damage, making it more difficult to enhance resilience levels. The post-disruption equilibrium state is inferior to the pre-disruption state, and the marginal benefit for supply chain network governance entities is diminishing. Therefore, improving supply chain resilience requires both risk response and targeted interventions to restore marginal benefits and repair natural decay, preventing long-term low-resilience states.
6. Numerical Simulation and Analysis
Following the parameter assignment logic in references [36,37], the parameter values used in this paper are shown in Table 3.
Table 3.
Parameters and Values.
6.1. Time Trajectories of Electric Vehicle Supply Chain Networks Resilience Under Different Disruption Risks
Figure 2 and Figure 3 demonstrate that the cooperative model achieves the optimal supply chain resilience, followed by the government-led Stackelberg and then the Nash non-cooperative model, both before and after a disruption. Moreover, a higher disruption probability discourages resilience investment, exacerbating resilience loss, while a higher damage rate dictates the instantaneous magnitude of the resilience decline. After a disruption, resilience gradually recovers and stabilizes over time. These findings suggest that governance entities adjust their post-disruption investment efforts based on the severity of the damage, either increasing or decreasing them to mitigate future risks.
Figure 2.
Comparative Time Trajectories of Supply Chain Networks Resilience under Different Disruption risks.
Figure 3.
Impact of Disruption Risks on Electric Vehicle Supply Chain Networks Resilience.
6.2. Time Trajectory of Total Returns Under Different Disruption Risks
Figure 4 and Figure 5 show that the cooperative game model under disruption risk yields the highest overall system returns. Compared to the Nash non-cooperative game model, the government-led Stackelberg game model enhances the electric vehicle supply chain network resilience, thereby achieving a Pareto improvement in returns. Moreover, a higher disruption probability and damage rate drive greater post-disruption operational investment by governing entities. This investment is crucial for ensuring stable returns and promoting sustainable development of supply chain networks in high-risk environments.
Figure 4.
Comparative Time Trajectory of Total Returns under Different Disruption Risks.
Figure 5.
Impact of Disruption Risks on Total System Returns.
6.3. The Impact of Disruption Risk Probability and Damage Rate on the Pareto Improvement Effect of Cost-Sharing Contracts
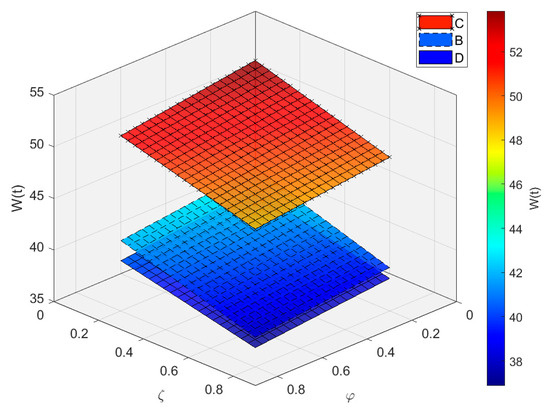
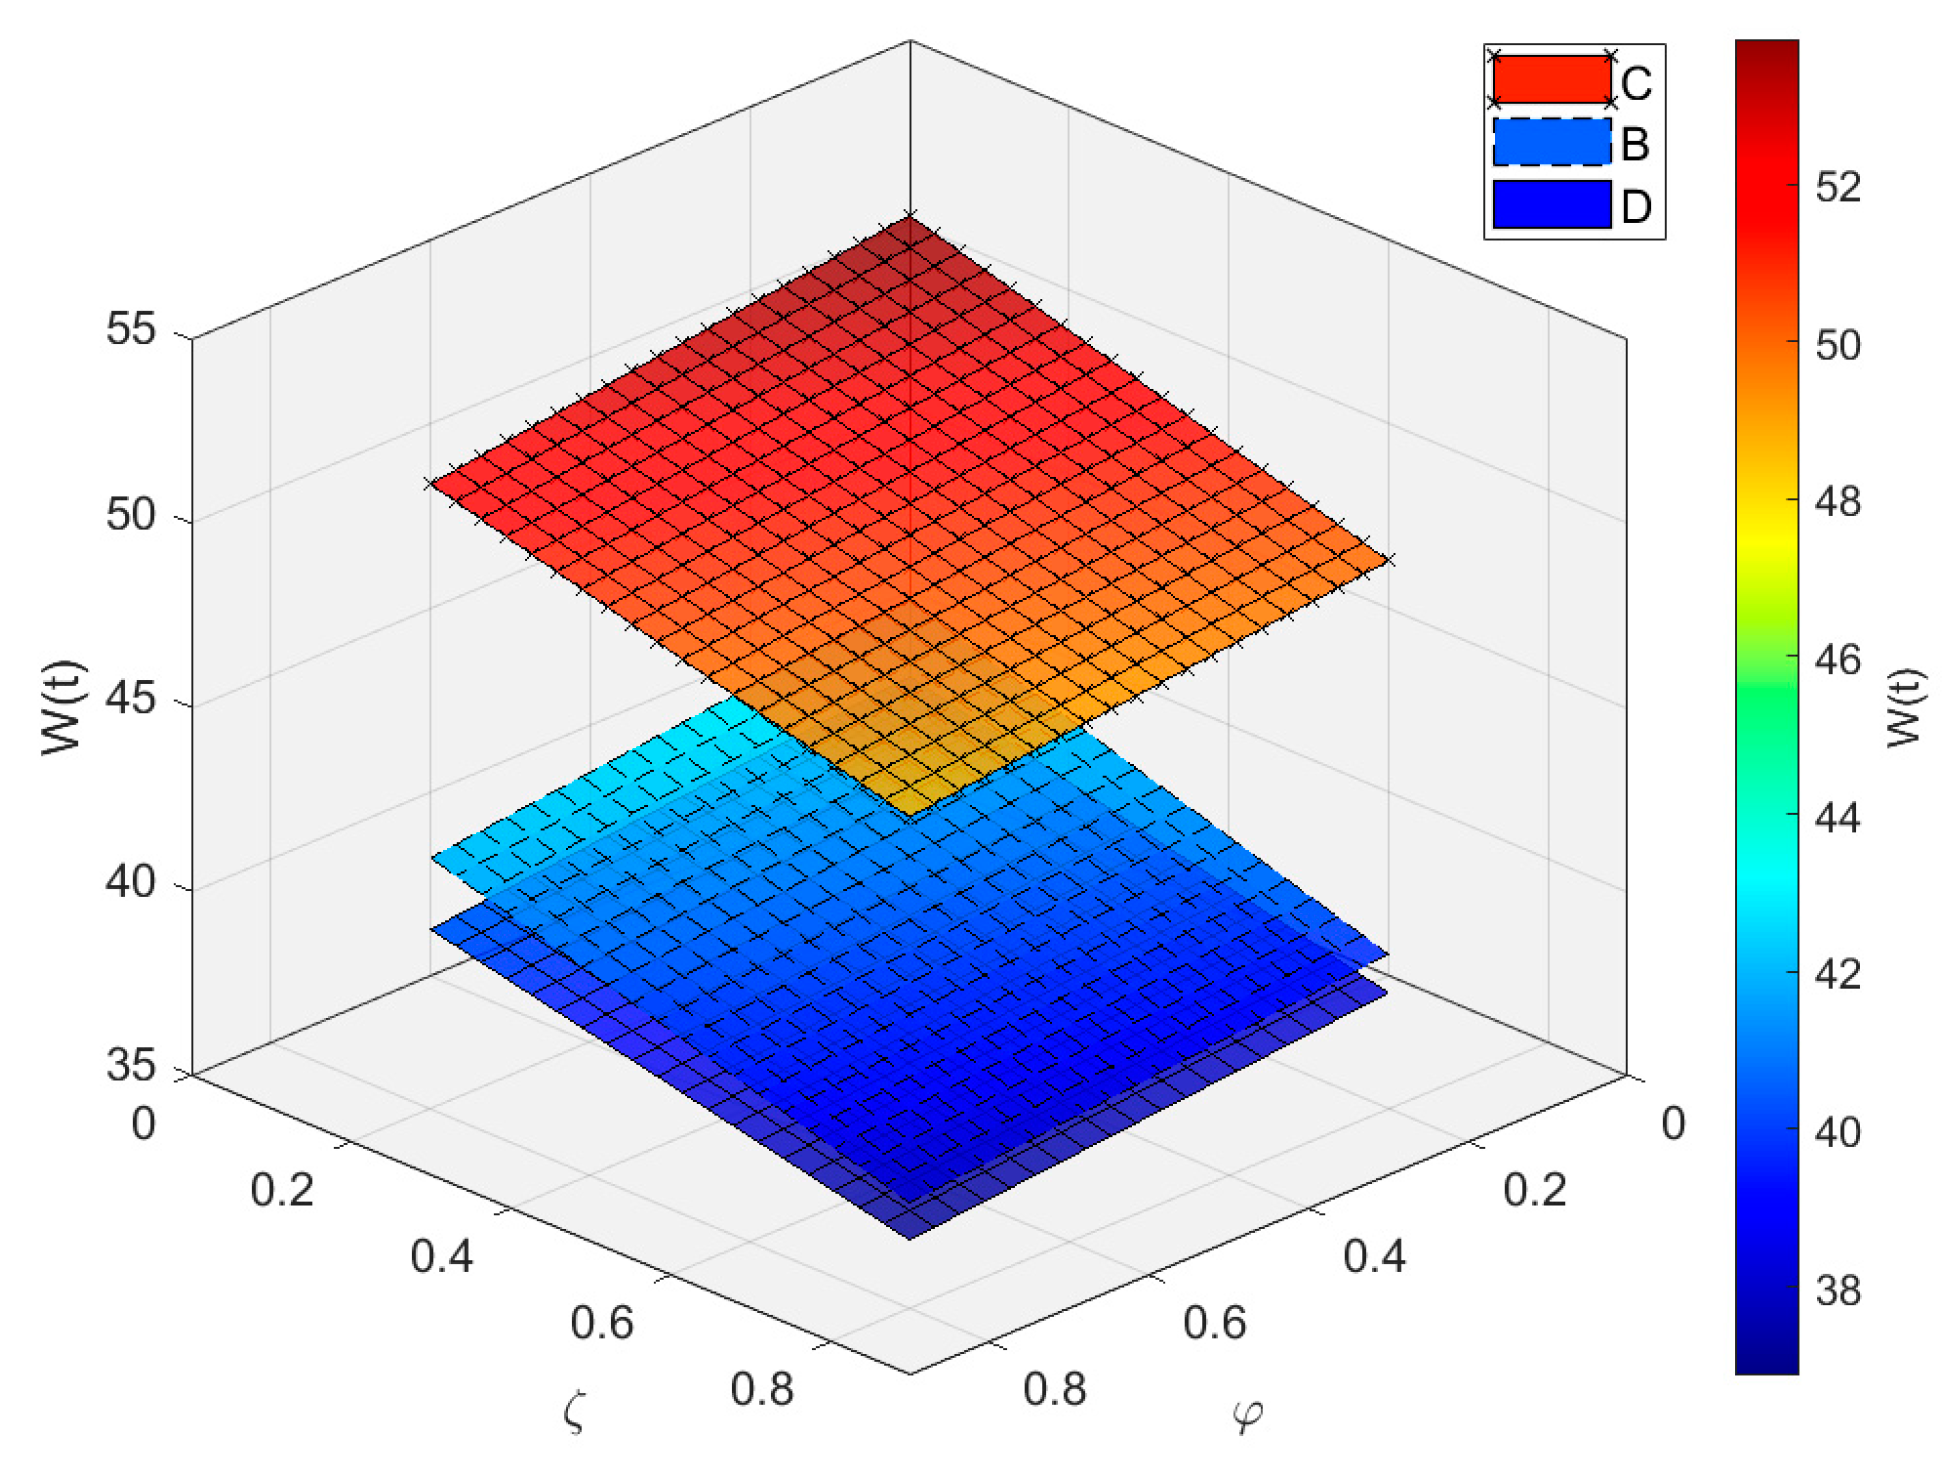
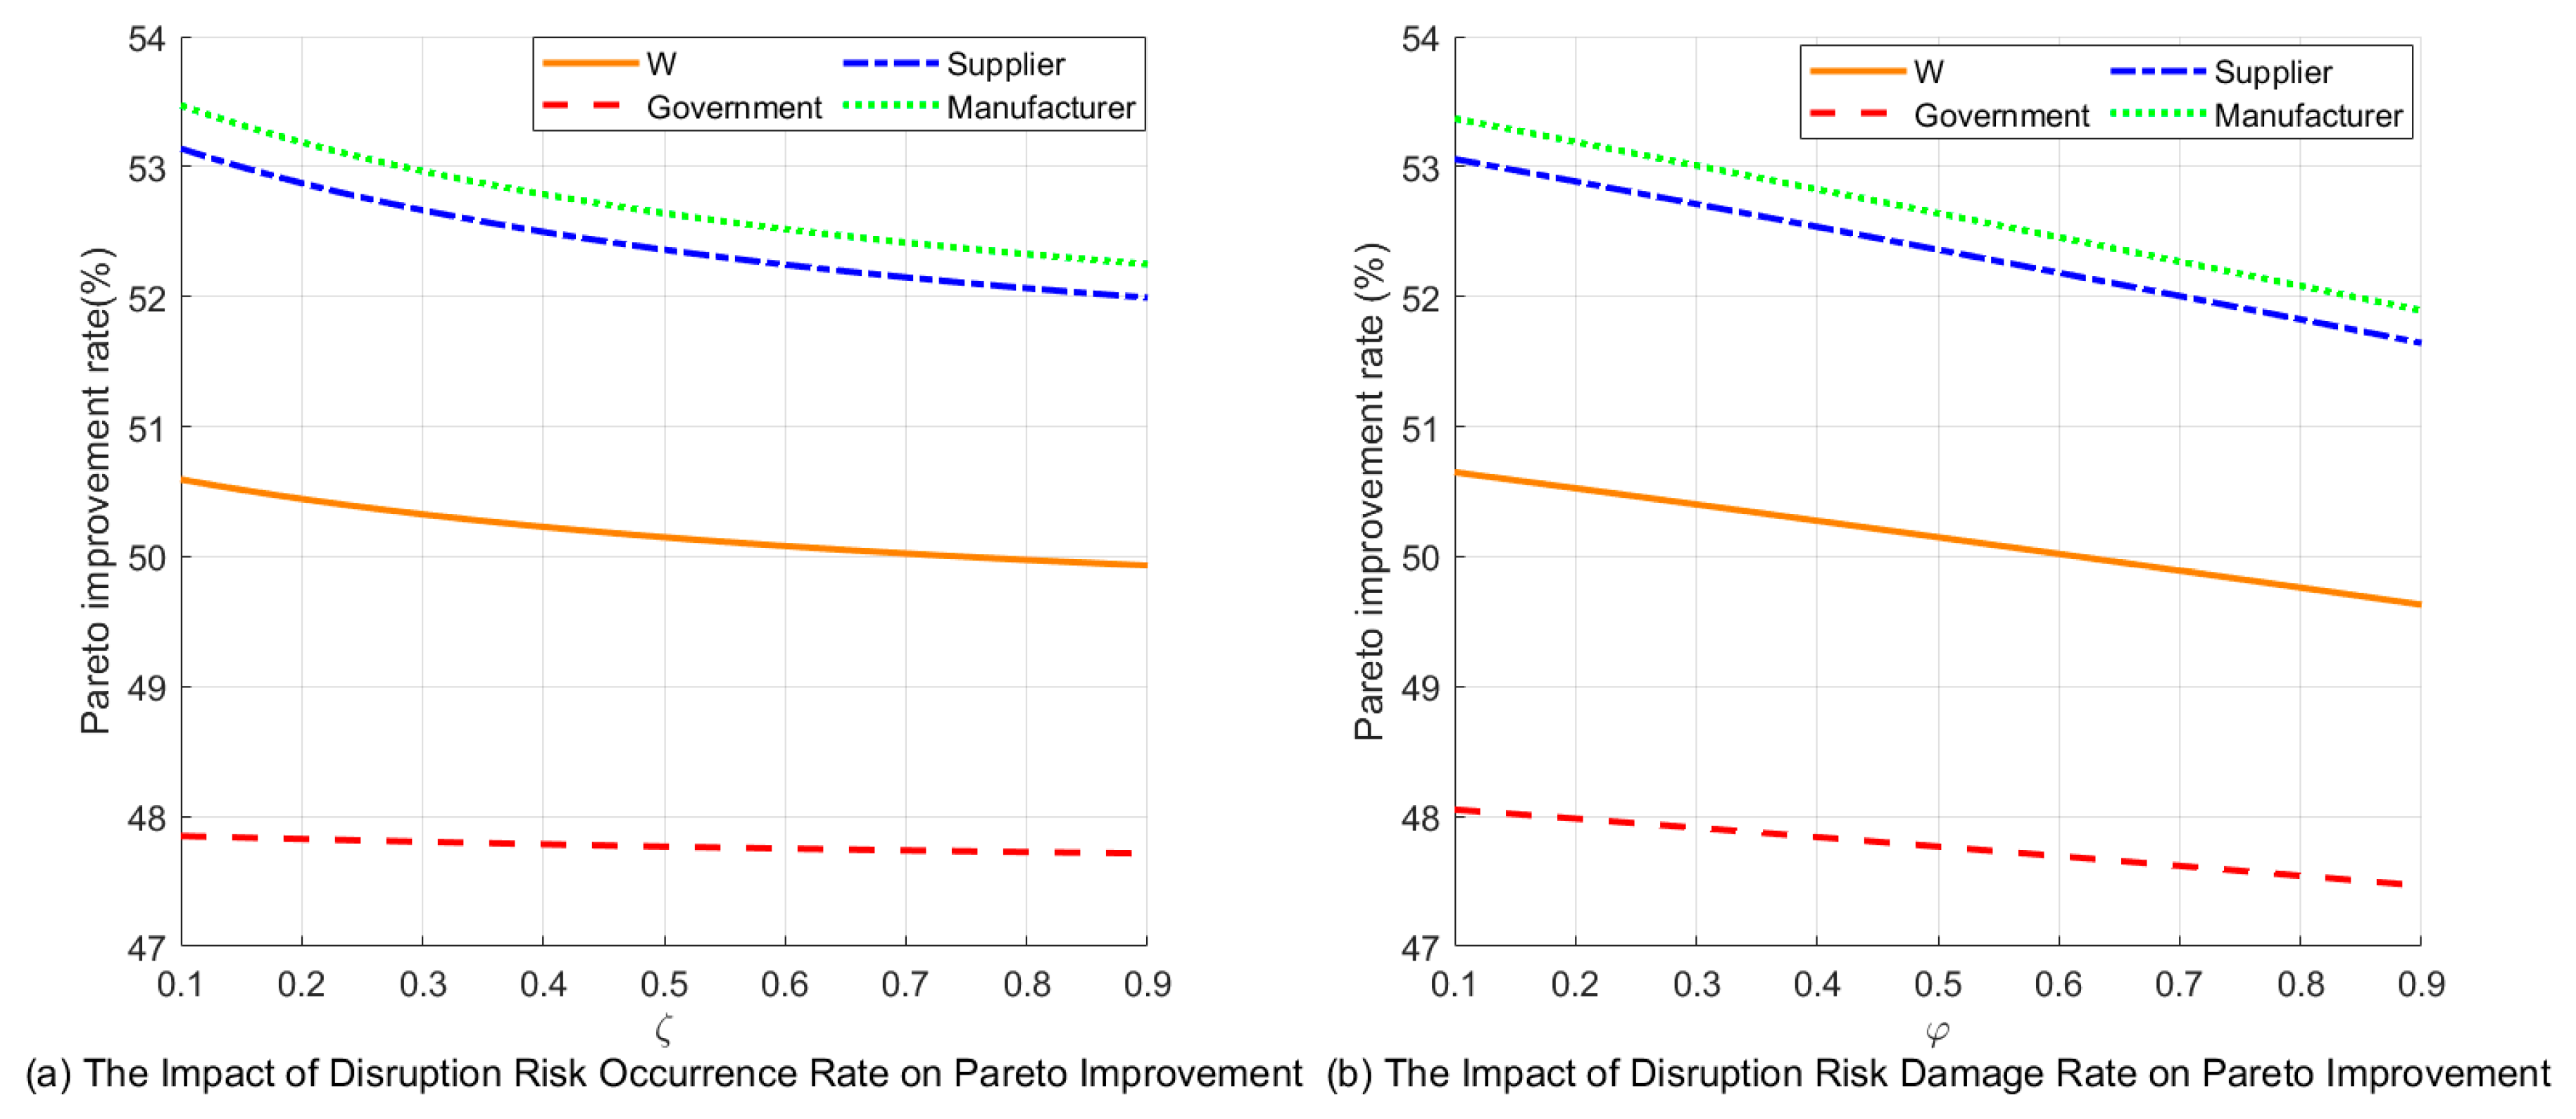
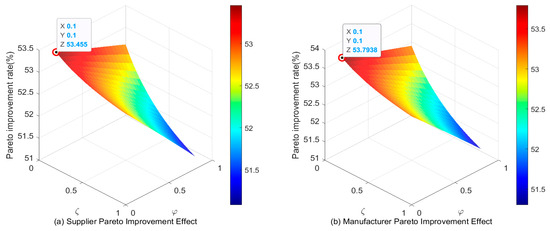
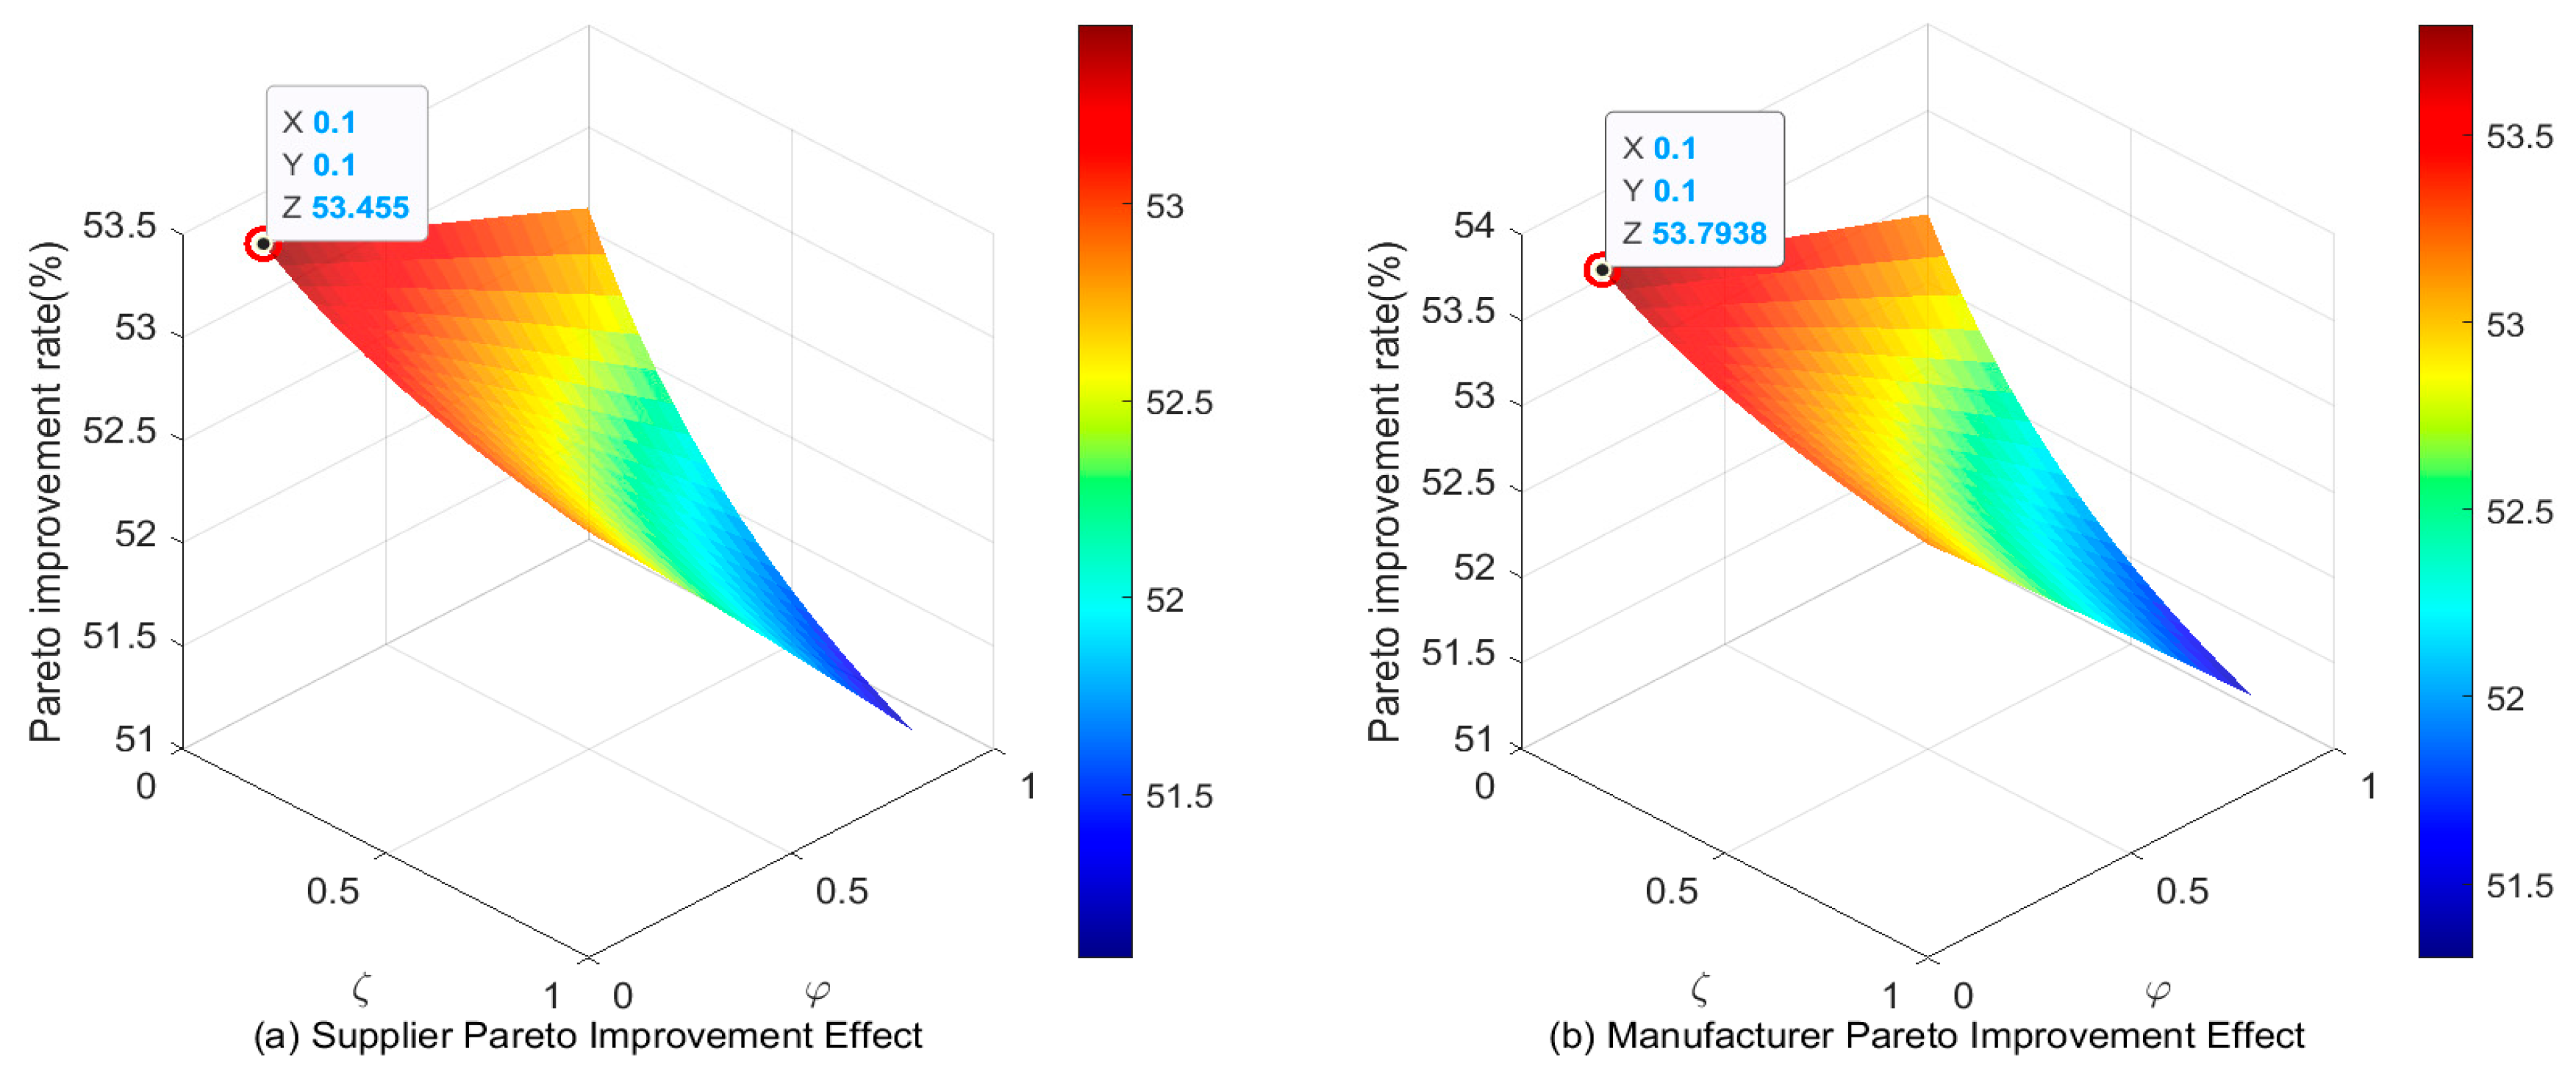
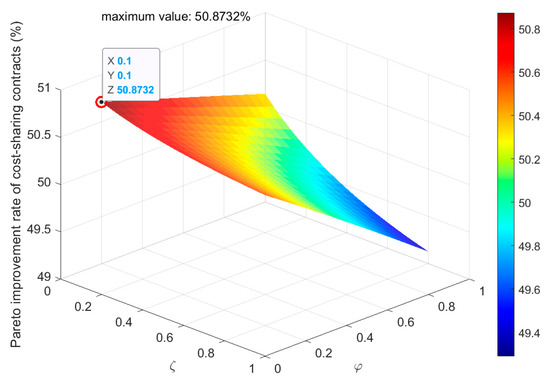
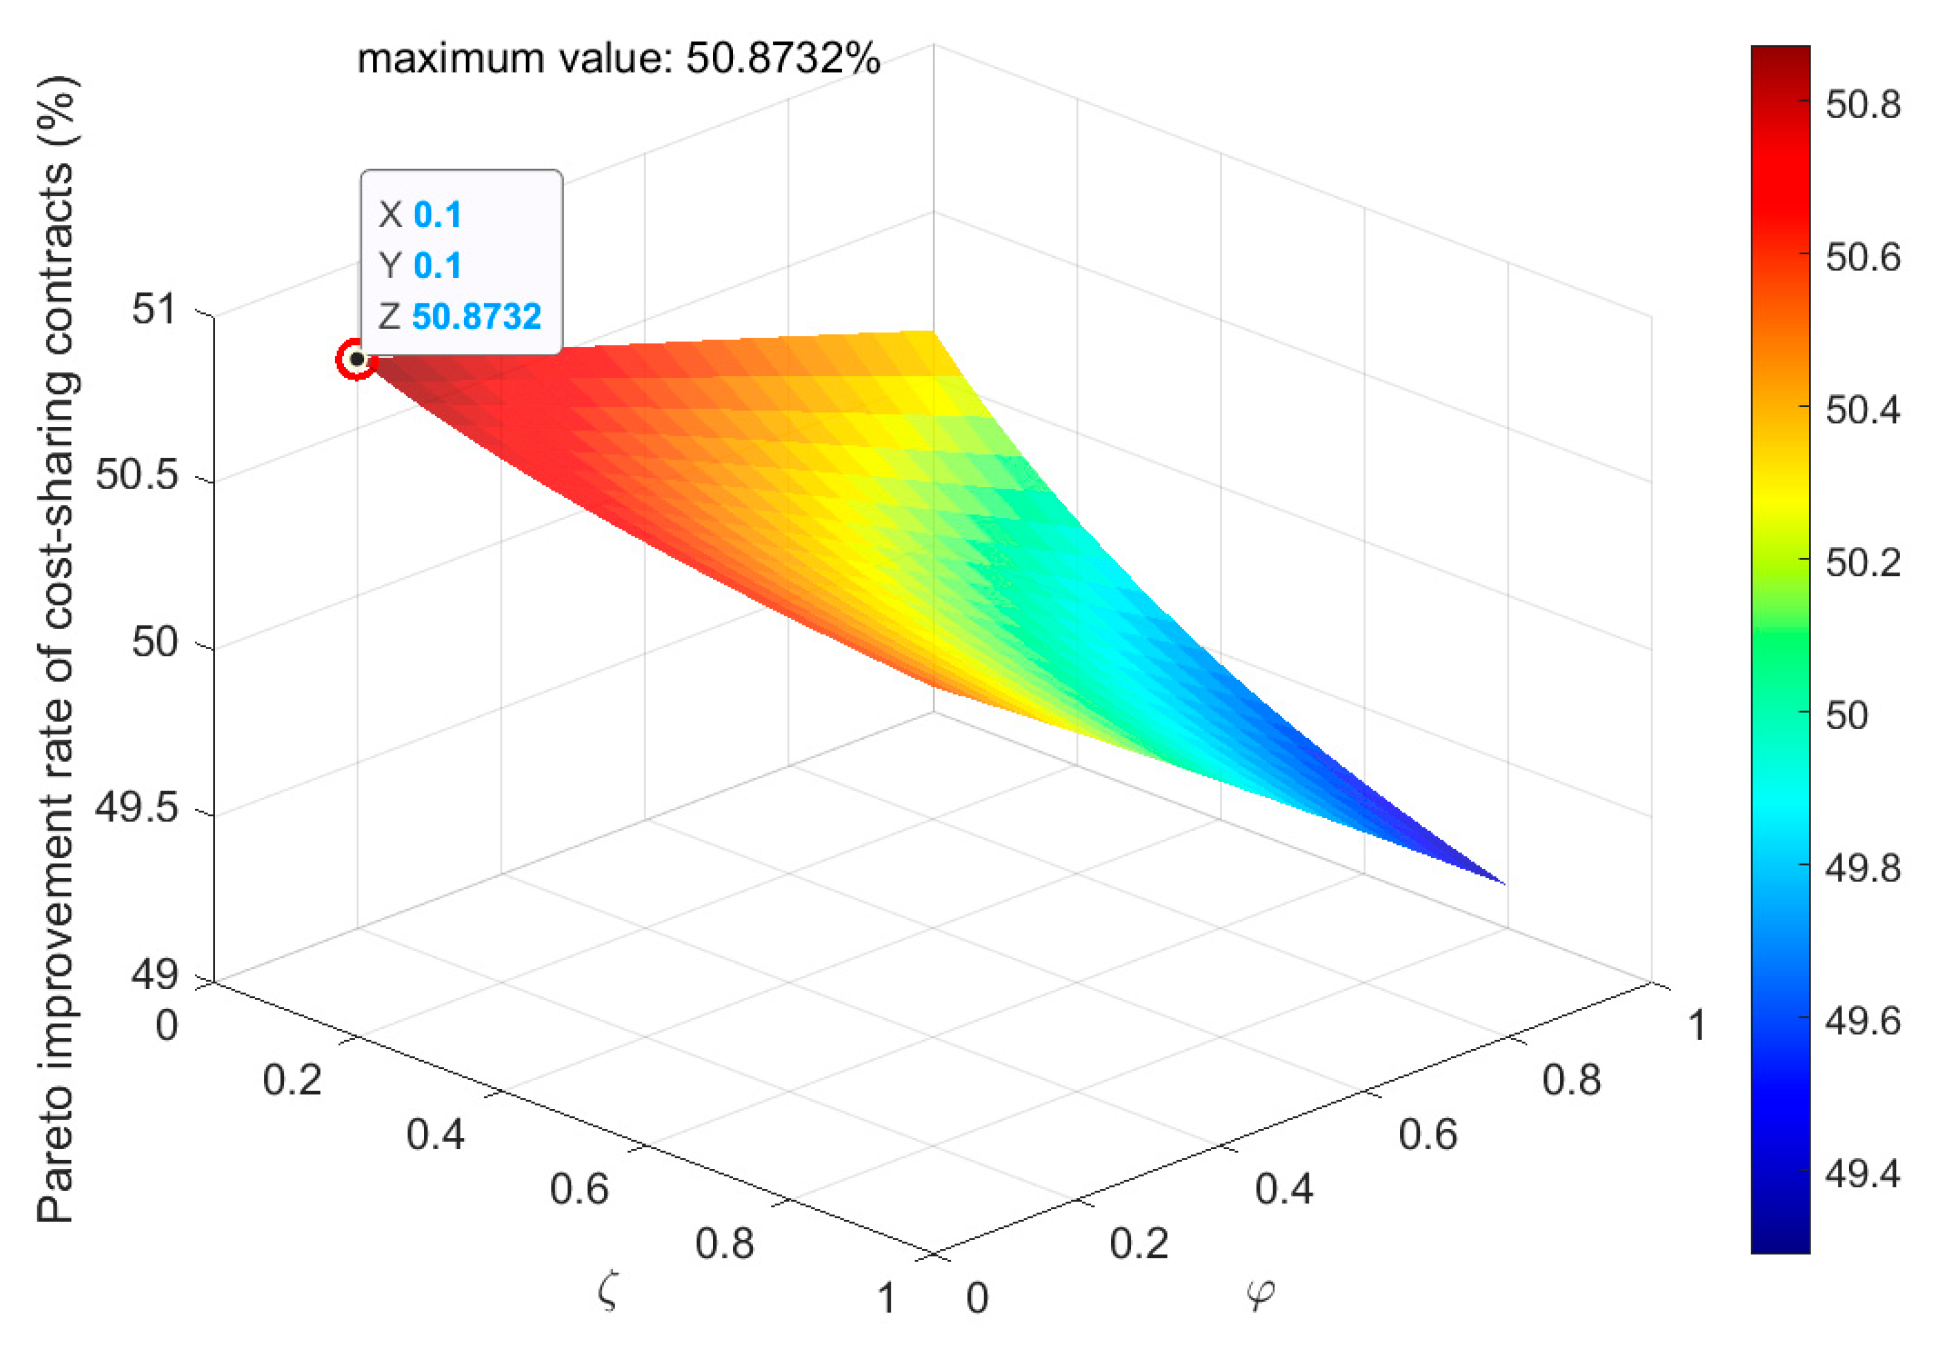
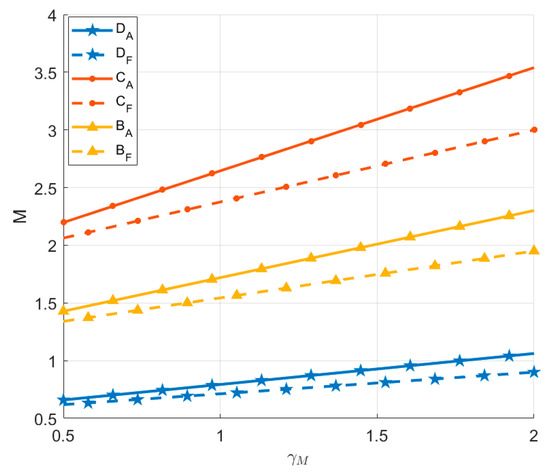
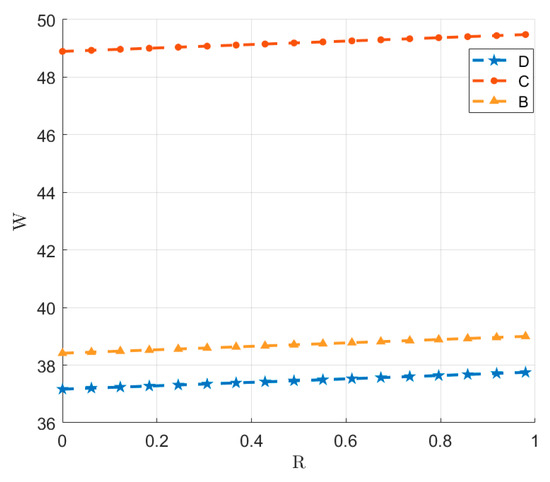
Figure 6, Figure 7 and Figure 8 demonstrate that under disruption risks, cost-sharing contracts can still achieve a Pareto improvement in both the governing entities’ benefits and the system’s overall returns. However, the effectiveness of this improvement diminishes with higher disruption probability and damage rates. When disruption probability and damage rates are high, suppliers and manufacturers show little incentive to invest. And the Pareto improvement effect of cost-sharing agreements becomes less pronounced. At this point, governments may choose not to undertake cost-sharing. Consequently, when designing cost-sharing contracts, governments should assess the potential disruption probability and damage rate to ensure the necessity and effectiveness of contract implementation.
Figure 6.
The Impact of Disruption Risks on the Effectiveness of Pareto Improvements.
Figure 7.
Impact of Disruption Risks on the Effectiveness of Pareto Improvements for Suppliers and Manufacturers.
Figure 8.
The Impact of Disruption Risks on the Pareto Improvement Effect of System Total Returns.
6.4. Impact of Resilience Investment Efforts on the Electric Vehicle Supply Chain Network Resilience
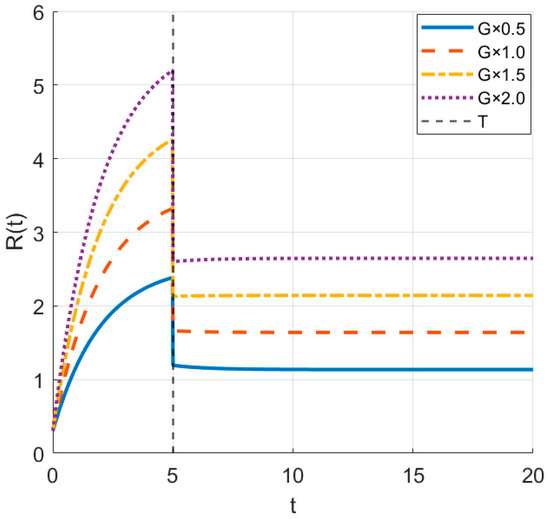
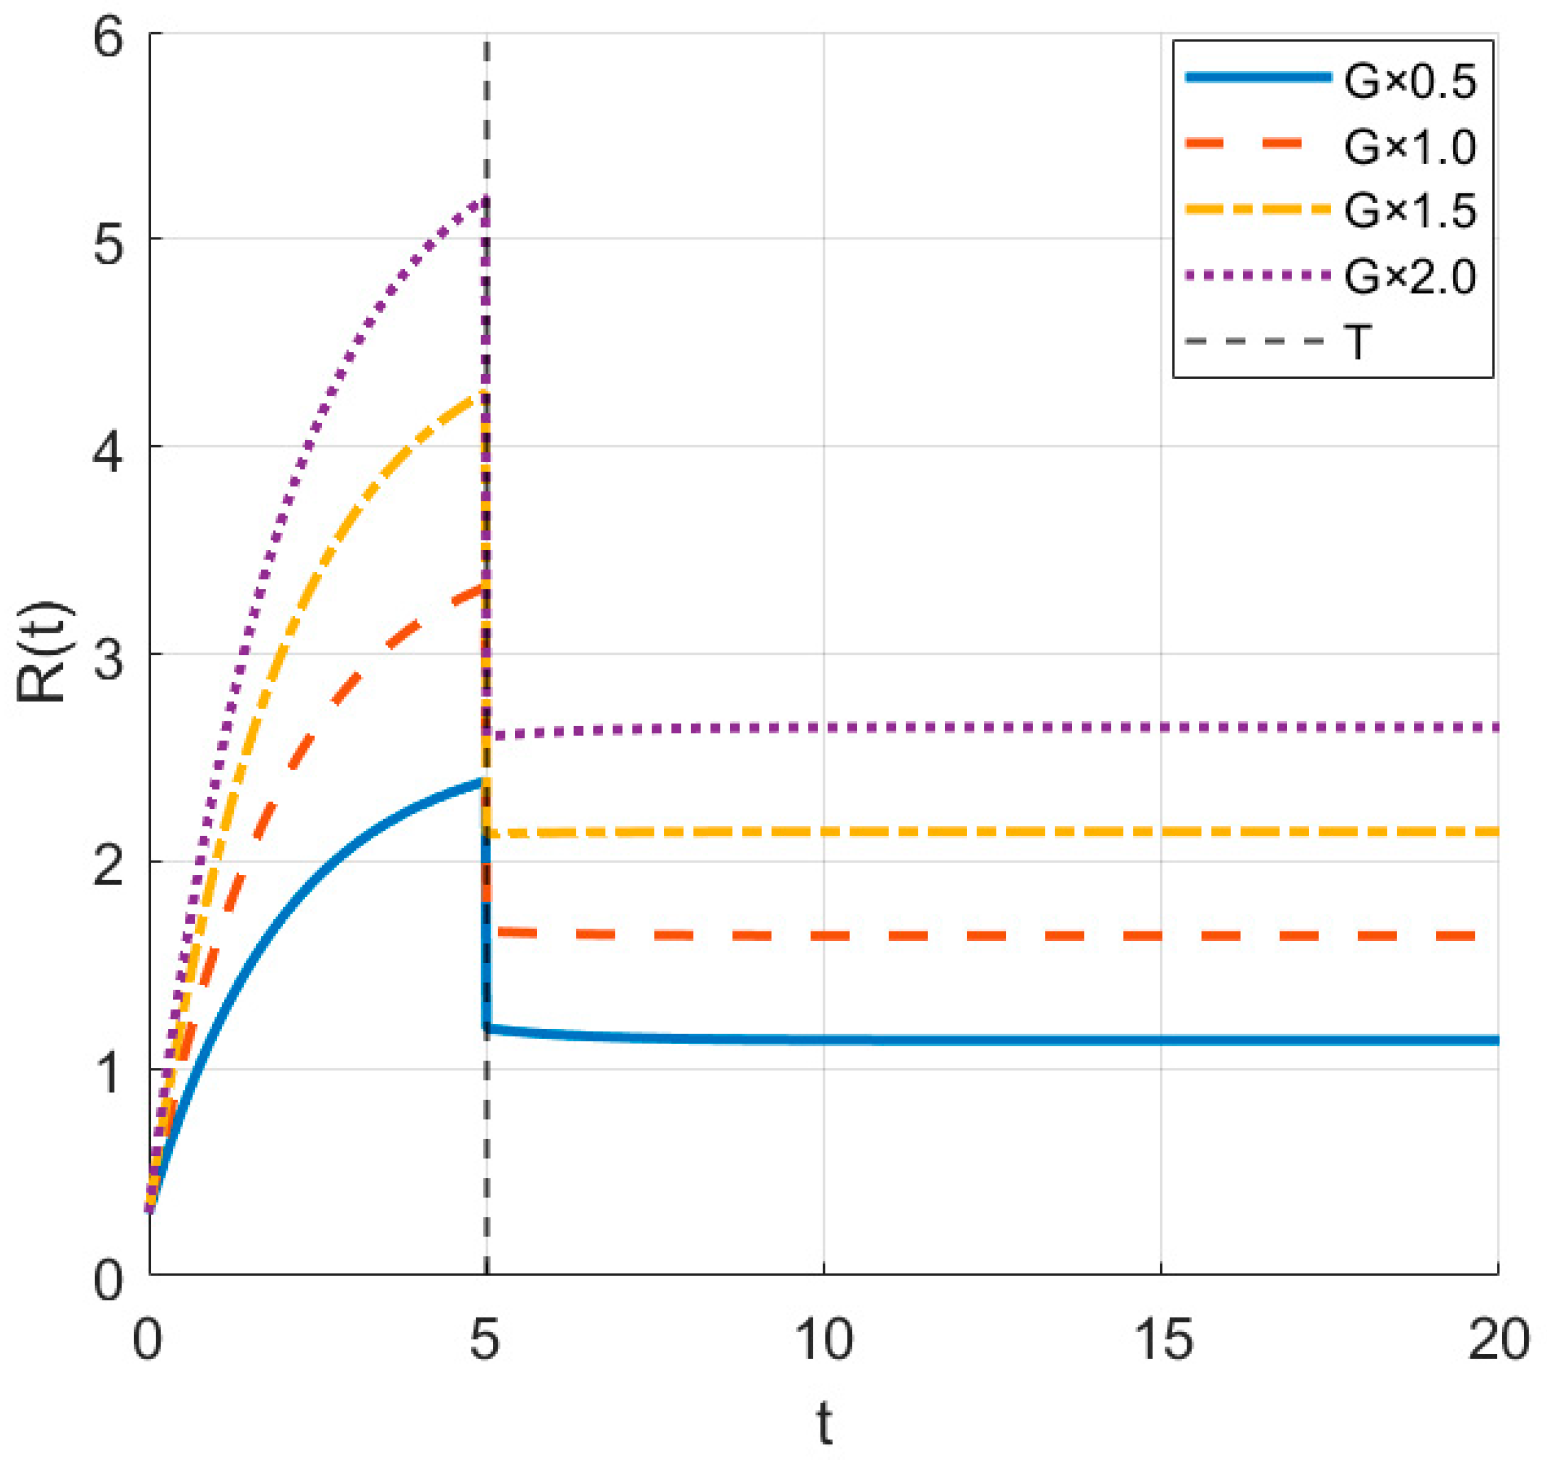
Taking governments under the Nash non-cooperative model as an example, Figure 9 demonstrates that supply chain network resilience increases with greater resilience investment. Disruption risk leads to an abrupt decline in resilience levels, reflecting the severity of the disruption shock. Following the disruption, resilience gradually recovers and stabilizes over time. Greater efforts in resilience ultimately result in higher resilience levels. This indicates that resilience investment efforts play a significant role in enhancing the recovery capacity of supply chain networks.
Figure 9.
Impact of Resilience Investment Efforts on Electric Vehicle Supply Chain Network Resilience.
6.5. The Impact of Effort Cost Coefficients on Resilience Investment Efforts
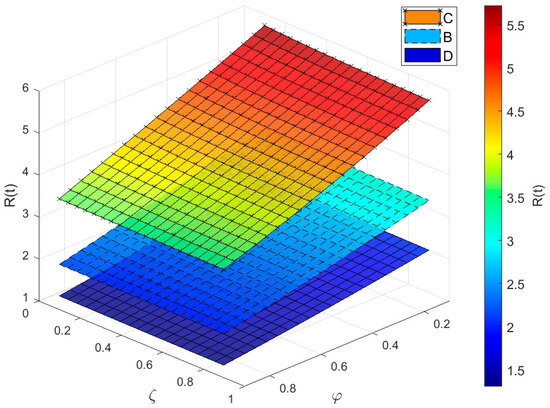
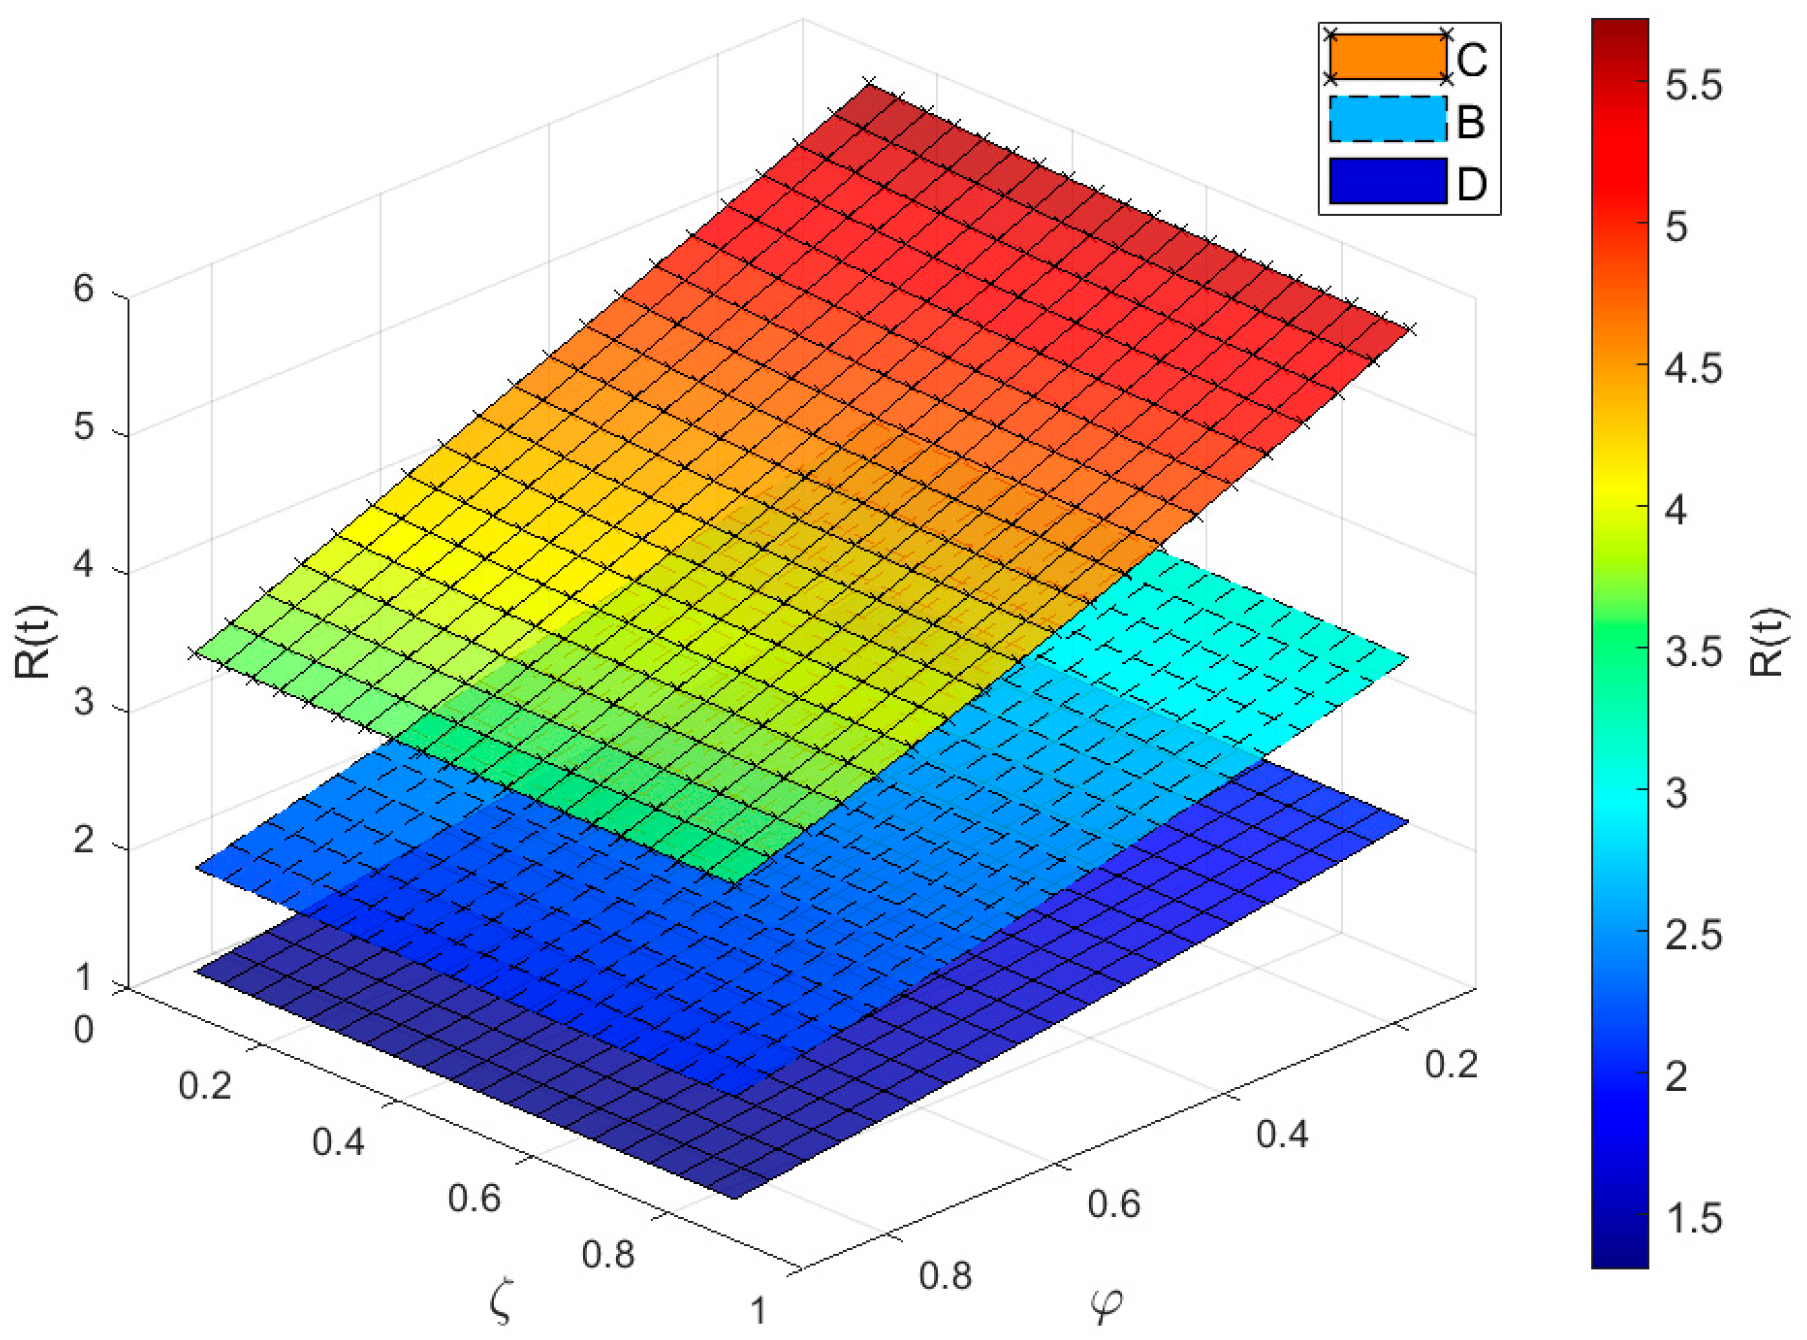
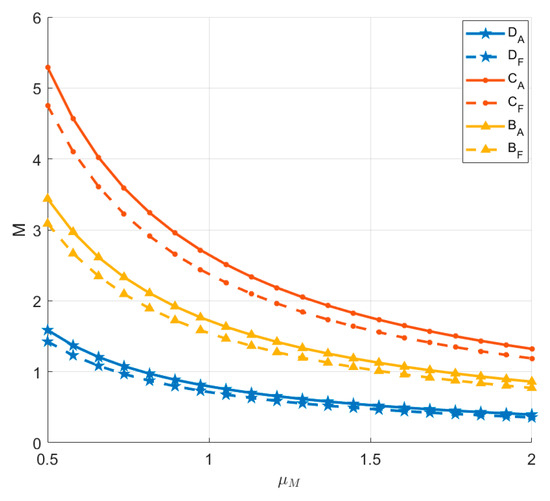
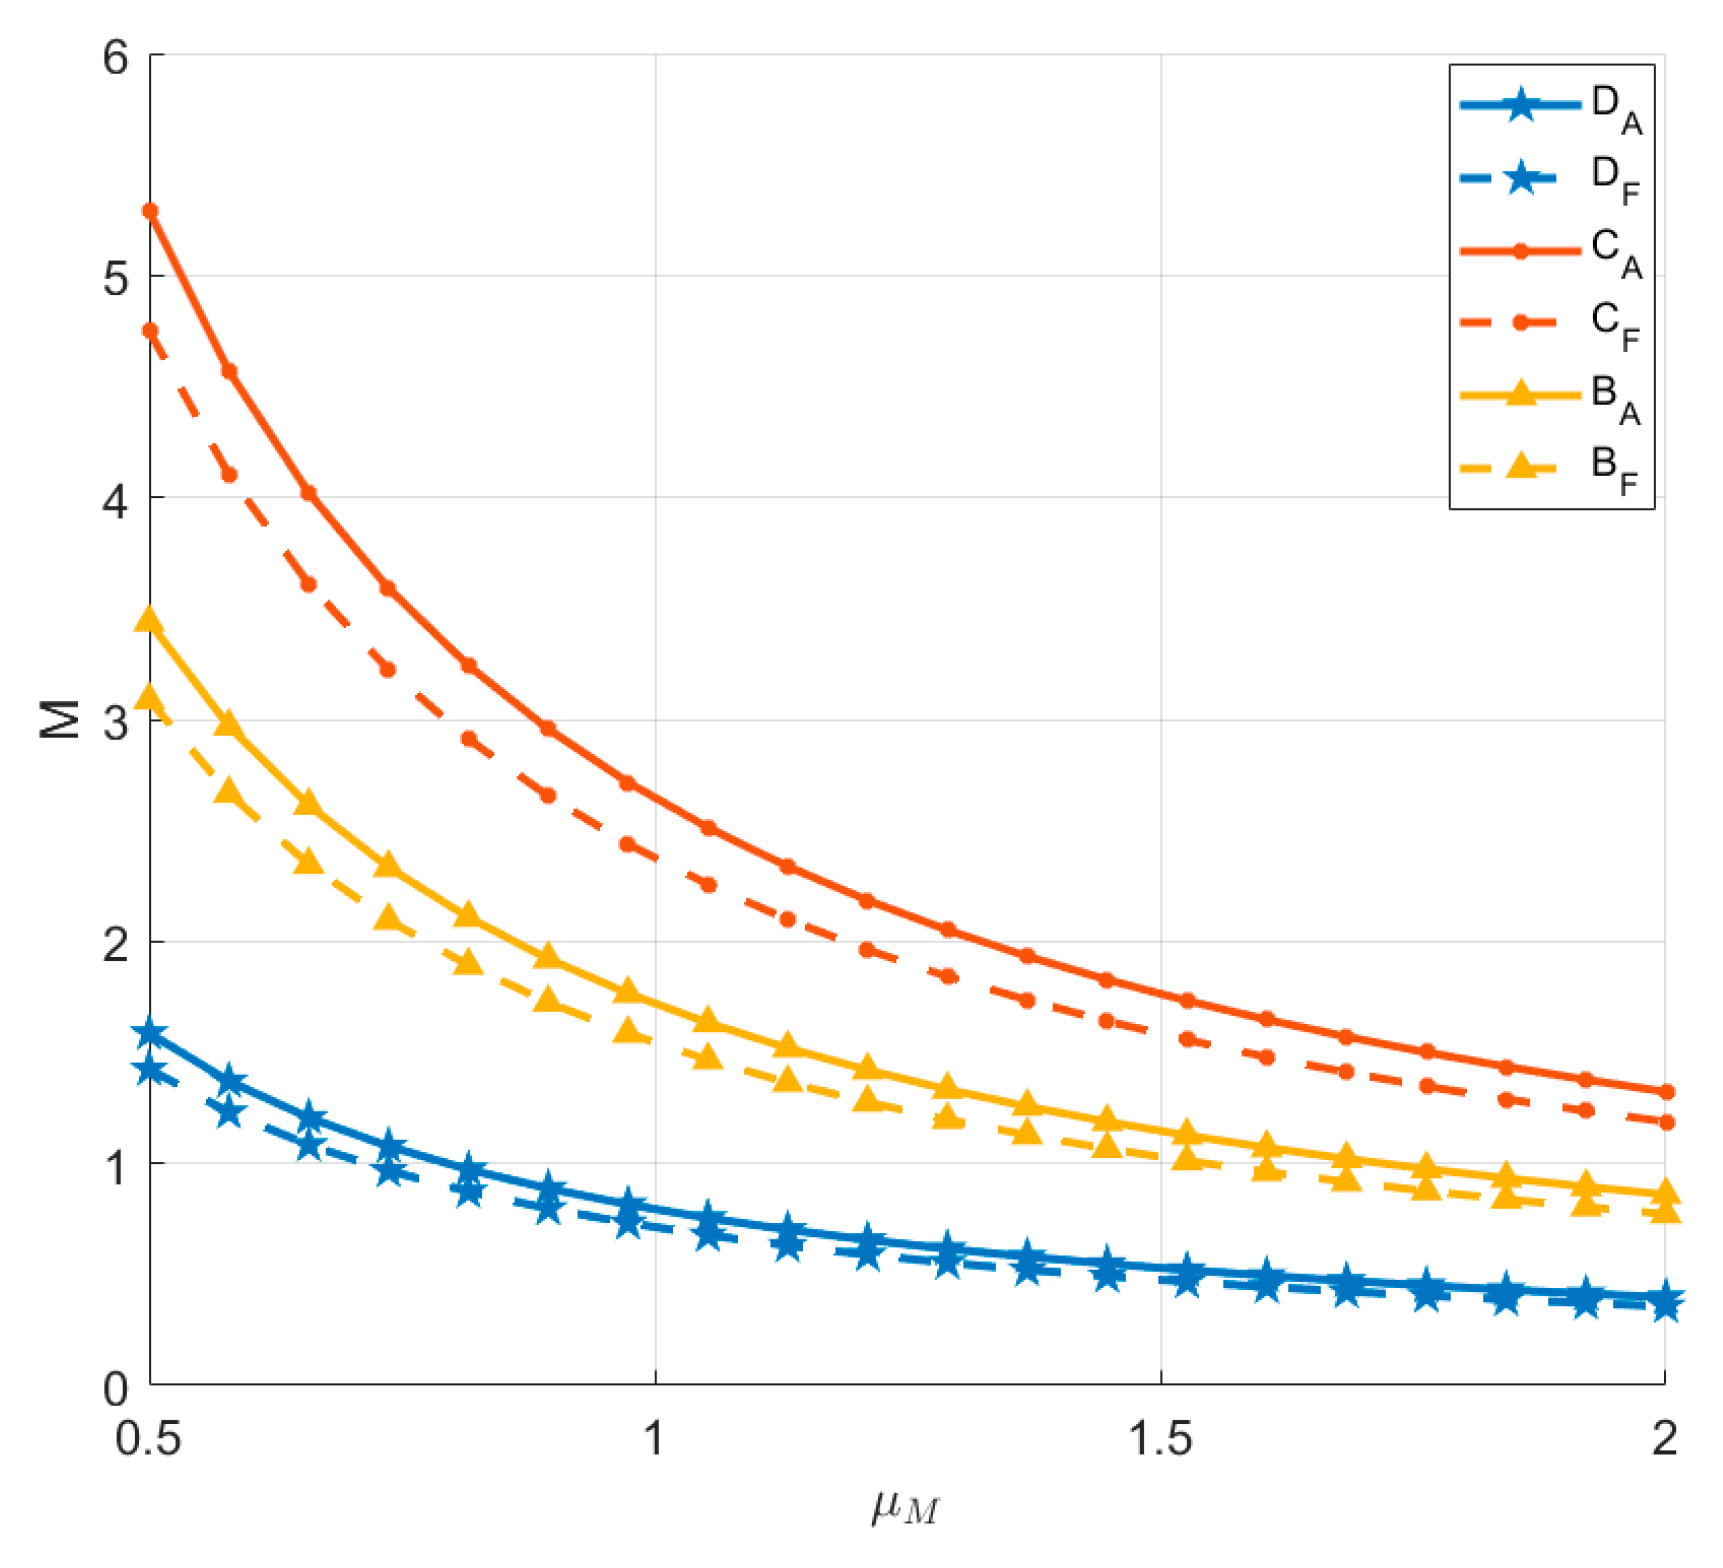
Taking manufacturers under three models as an example, Figure 10 demonstrates that the resilience effort level decreases in response to a higher effort cost coefficient. This result remains valid under different models. Regardless of the cost coefficient, the cooperative model is found to be the most conducive to resilience investment effort, with the government-led Stackelberg model ranking second. Conversely, the Nash model is observed to be the least favorable, with the resilience investment effort level being the lowest under this model. After the disruption risk, the impact curve of the cost coefficient on resilience investment efforts shifts downward. This is reflected in the inequalities , and . The results indicate that cooperative mechanisms motivate entities to maintain higher resilience investment efforts under the same cost pressures. Meanwhile, disruptive shocks dampen manufacturers’ willingness to invest effort, causing the level of effort they exert at a given cost to be lower than before the disruption.
Figure 10.
Impact of Manufacturer’s Effort Cost Coefficient on Resilience Investment Efforts.
6.6. Impact of Supply Chain Network Resilience Factors on Resilience Investment Efforts
Taking manufacturers under three models as an example, Figure 11 shows that a higher impact coefficient of supply chain network resilience drives greater investment effort. The impact coefficient following disruption risk exerts a lesser influence on resilience investment efforts compared to its effect prior to disruption risk. Under any given impact coefficient, the cooperative model demonstrates the highest resilience effort, followed by the government-led Stackelberg model and then the Nash non-cooperative model, in both pre- and post-disruption states.
Figure 11.
Impact of Supply Chain Network Resilience on Resilience Investment Efforts.
6.7. Impact of Supply Chain Network Resilience on Total Returns
As shown in Figure 12, total revenue increases with supply chain network resilience. At the same resilience level, the optimal returns decrease in the following order: cooperative game model, government-led Stackelberg game model, and Nash non-cooperative game model. This indicates that total returns are influenced not only by resilience but also by different game models. Under the collaborative model, information sharing allows entities to more efficiently transform resilience into collective gains. The government-led Stackelberg model yields higher benefits than the Nash model, resulting in a Pareto improvement.
Figure 12.
Impact of supply chain network resilience on total returns under different models.
7. Multi-Scenario Analysis
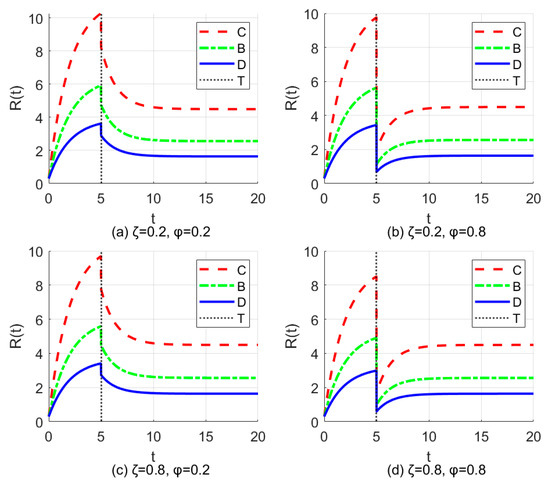
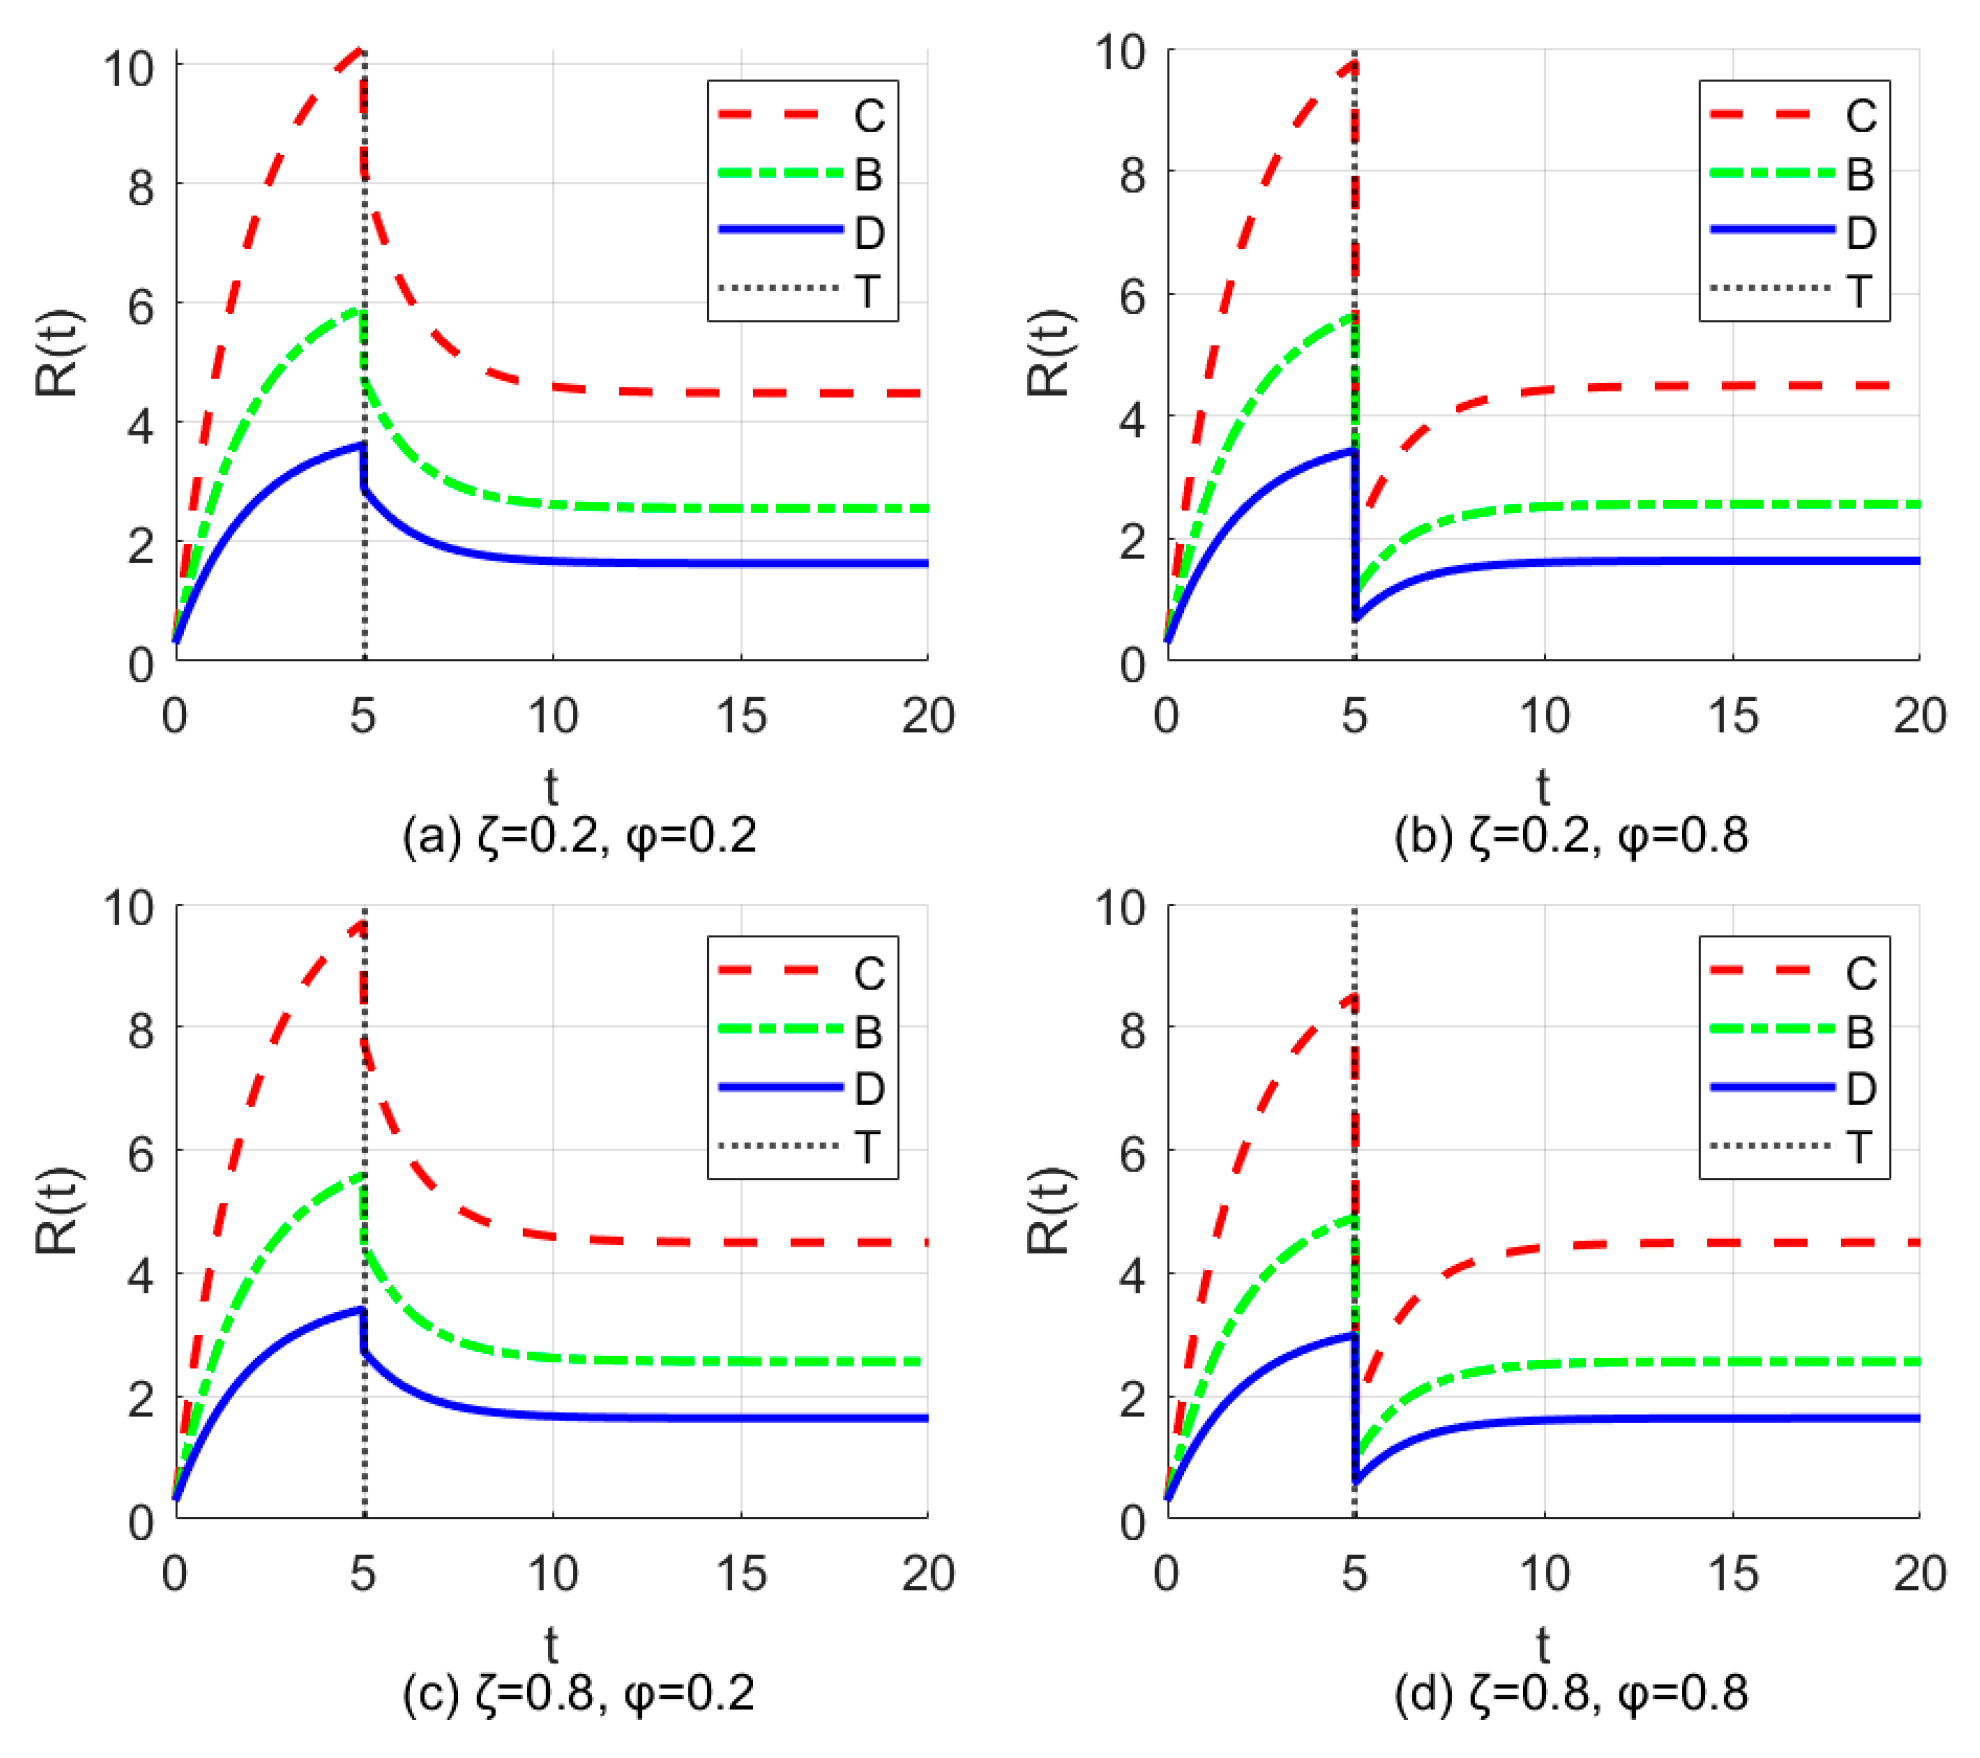
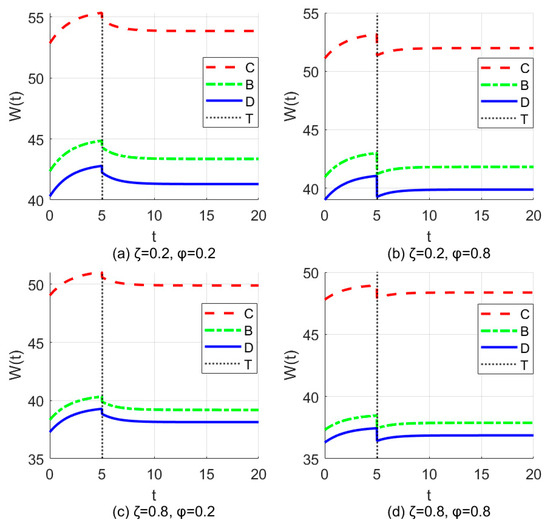
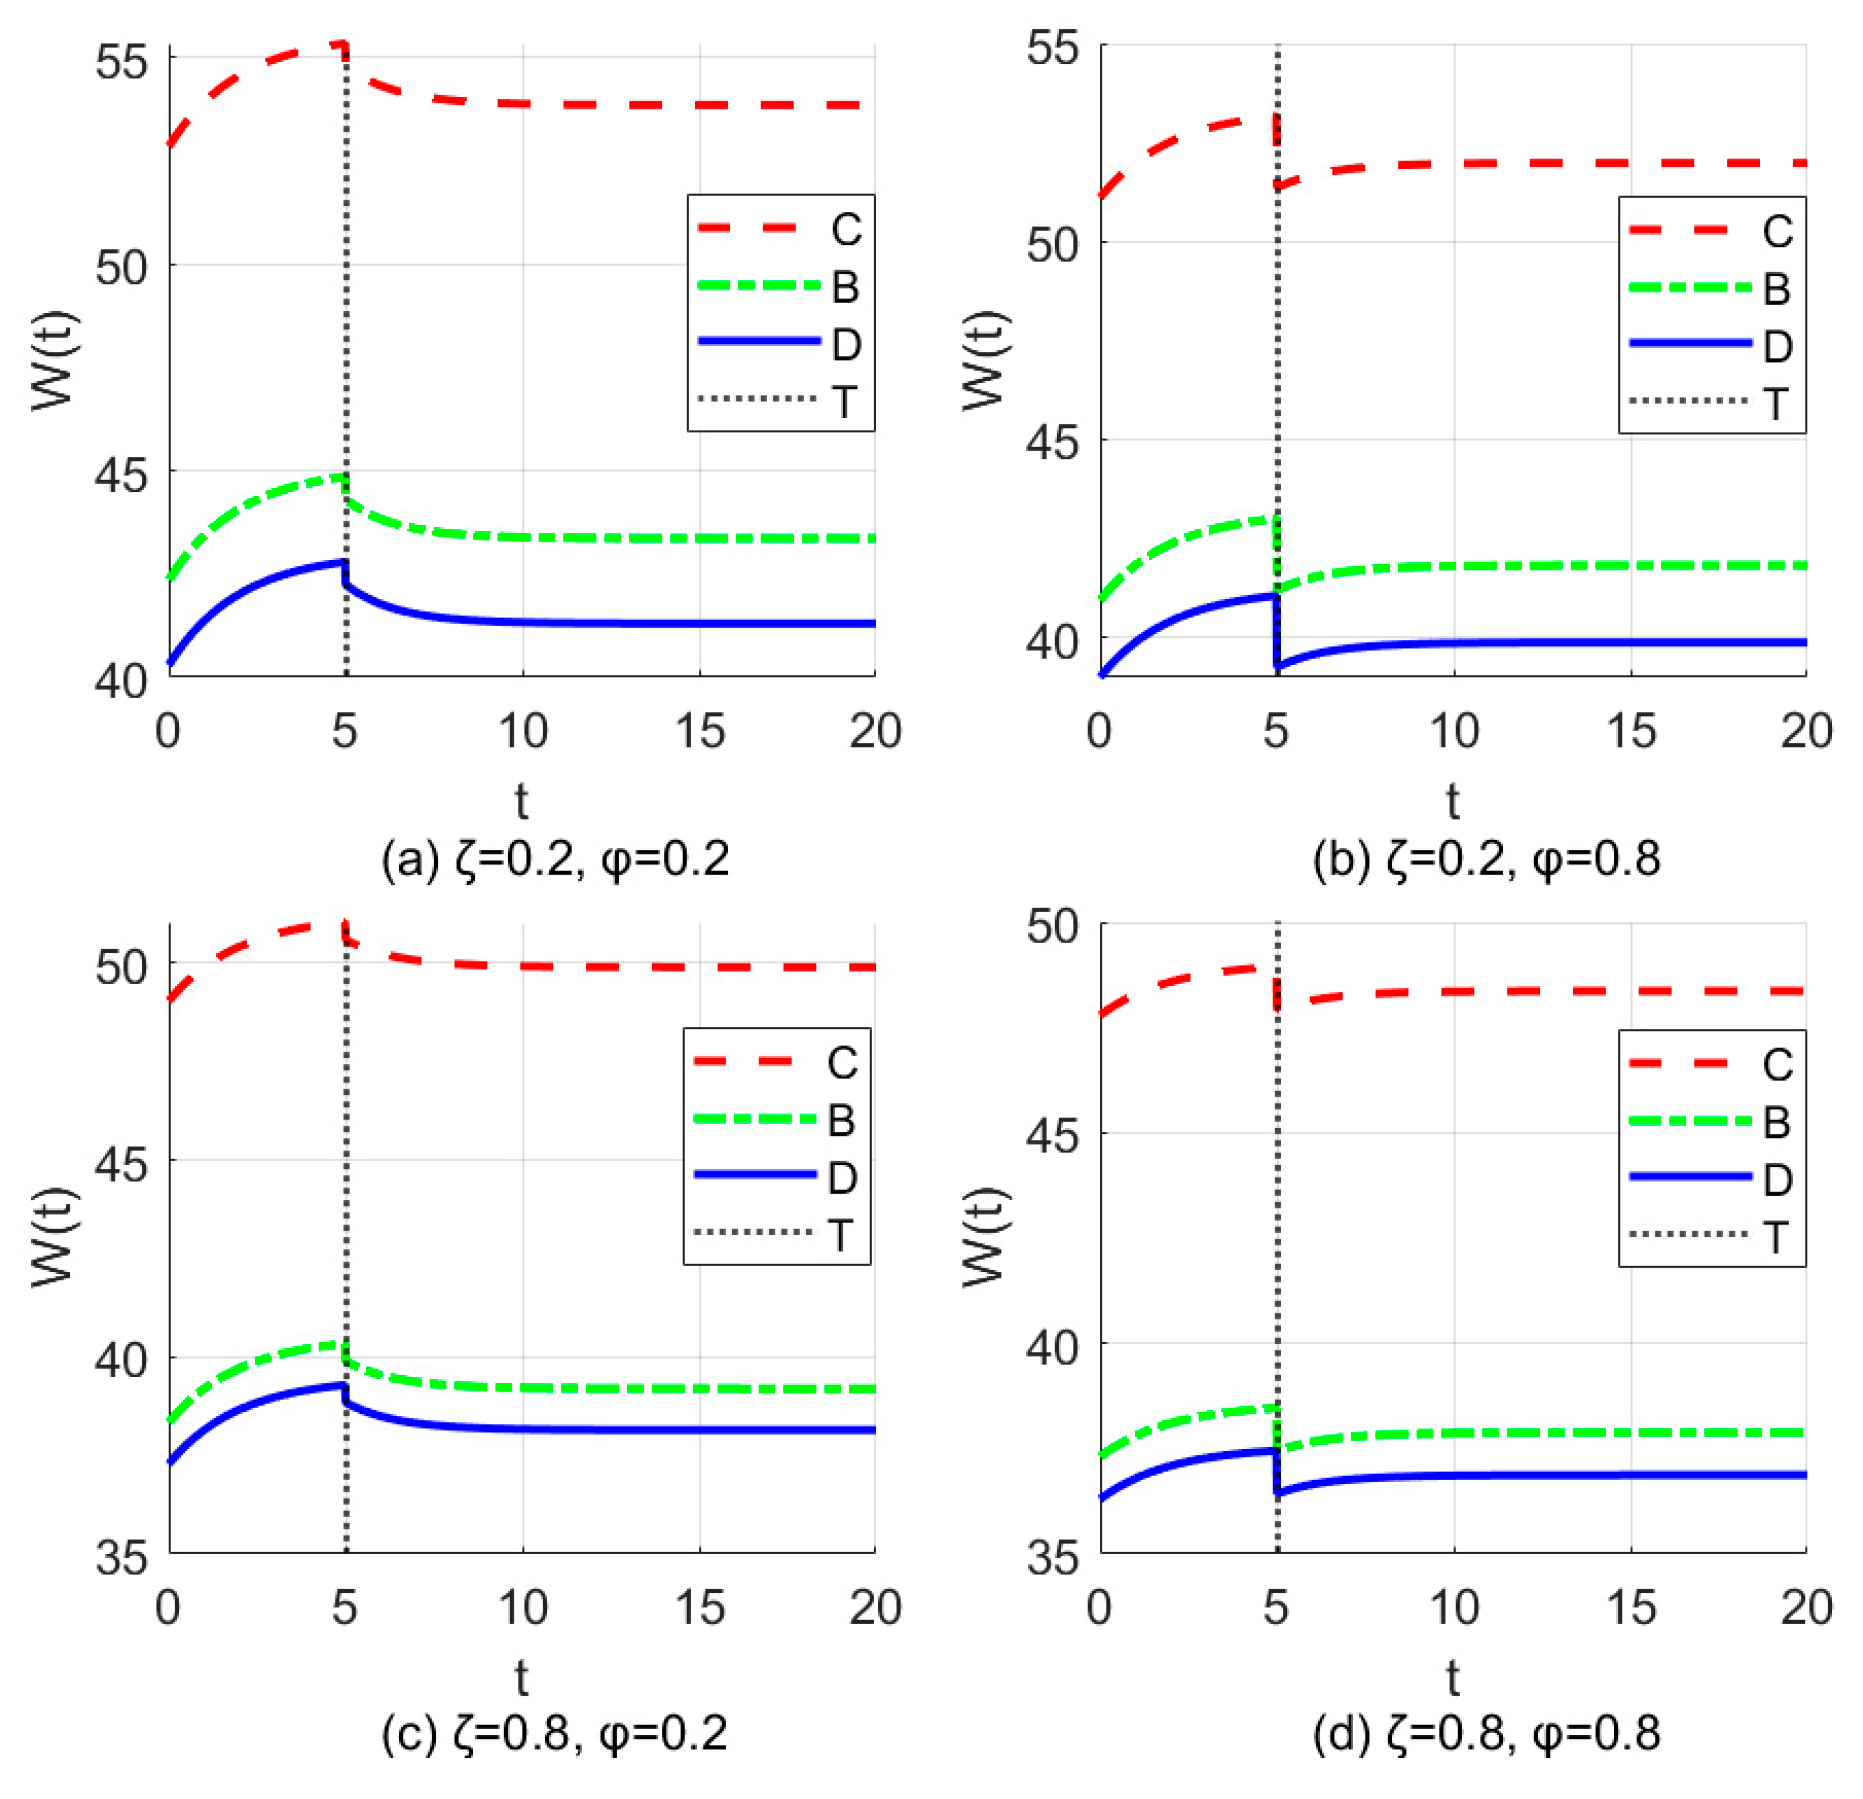
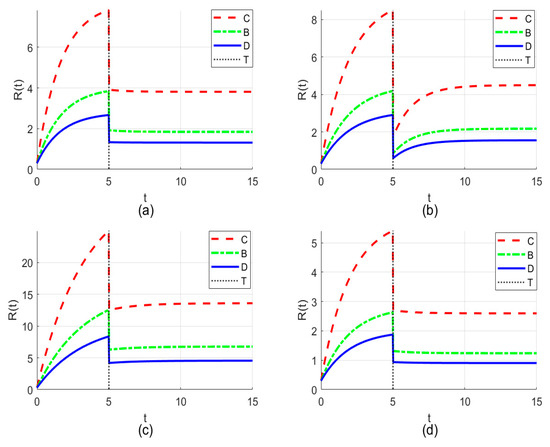
This study further validates the model’s explanatory power through multi-scenario numerical simulations. By varying key parameters, it illustrates the dynamic trajectory of electric vehicle supply chain network resilience under disruption risks. The simulation results are shown in Figure 13, where (a) to (d) correspond to the following parameter sets:
Figure 13.
Multi-scenario Analysis of Resilience Level Trajectories Under Disruption Risks. (a): , ; (b): ; (c): ; (d): .
(a): , ; (b): ; (c): ; (d): .
The simulation results demonstrate that the supply chain network resilience reaches its optimum under the cooperative model, followed by the government-led Stackelberg model, and lastly the Nash non-cooperative model, both before and after a disruption. Moreover, the resilience level eventually stabilizes at an equilibrium. In Figure 13, the comparison between Figure 13a,c shows that a higher effort impact coefficient or a lower natural decay rate increases supply chain resilience. Figure 13b shows that although high-risk parameters degrade overall resilience, the cooperative model maintains a comparative advantage, and Figure 13d confirms that a higher effort cost coefficient reduces resilience. These multi-scenario analyses validate the model’s explanatory power and applicability in assessing disruption risk impacts, underscoring the critical importance of collaborative governance, particularly under high-risk conditions.
8. Discussions
By modeling interactions among multiple governance entities and incorporating random disruption risks, this study overcomes the limitations of existing research focused on bilateral games and deterministic recovery strategies [9,15,38]. This study constructs a differential game model involving governments, suppliers, and manufacturers, incorporating disruption risk as an unexpected event into the decision-making framework. A stochastic stopping model is employed to characterize the uncertainty of disruption risks. This study confirms that the cooperative model achieves optimal resilience [7]. More importantly, by incorporating resilience investment efforts into a dynamic governance model under disruption risks, this research extends the findings to analyze the optimal strategies of entities before and after disruptions under various governance models.
This study demonstrates that disruption risk persistently distorts governance entities’ time preferences and long-term resilience investment willingness. In the Nash non-cooperative model, optimal resilience investment efforts are negatively correlated with the disruption probability and damage rate. This indicates that in the face of potential disruptions, entities will rationally choose to reduce preemptive efforts to mitigate risks, exhibiting a tendency toward decision-making myopia that sacrifices long-term resilience.
Further analysis shows that in the government-led Stackelberg game model, precise cost-sharing can effectively promote resilience investment efforts by suppliers and manufacturers, conditional on the government retaining a sufficient share of the total revenue. However, it further reveals that a higher cost sharing is not always optimal. When the disruption probability and damage rate exceed a critical threshold, the marginal benefits of government cost-sharing become negligible. This underscores the need for context-aware policy design, as blanket subsidies may prove futile in highly volatile environments.
This paper has the following limitations. First, this study considers only three governance entities, but in reality, supply chain networks involve many stakeholders, including industry associations and retailers. Second, this paper assumes that disruption risks are exogenous and instantaneous. In reality, disruption risks often exhibit ripple effects, and this simplification weakens the model’s ability to address complex risk scenarios. Third, this study assumes that governments, manufacturers, and suppliers are all perfectly rational “economic agents”. This assumption may fail to fully capture the bounded rationality and social preferences.
Additionally, disruption risks lead to demand uncertainty and time-varying characteristics. Future research can investigate the impact of this uncertainty and analyze the dynamic strategies employed by governmental and non-governmental entities to enhance the resilience of supply chain networks. Finally, technologies such as digital twins are playing an increasingly critical role in enhancing supply chain resilience. Future studies should broaden their perspective to conduct in-depth investigations into the role of digital twins in enhancing supply chain network resilience.
9. Conclusions
This study constructs a differential game model for electric vehicle supply chain resilience involving governments, suppliers, and manufacturers under disruption risk. It introduces a stochastic stopping model to characterize the uncertainty of disruption risk. This paper analyzes the impact of risk on strategies within the supply chain network and investigates the optimal strategies of governance entities under different models, along with the dynamic trajectory of network resilience. The main conclusions are as follows:
(1) Both the resilience levels of supply chain networks and total returns achieve optimal levels under the cooperative game model. The government-led Stackelberg model guides suppliers and manufacturers toward optimal decisions, effectively mitigating the double marginalization in the Nash non-cooperative game model and achieving a Pareto improvement.
(2) Governments will implement cost-sharing if the profit-sharing ratio meets specific conditions. Cost-sharing facilitates a Pareto improvement in benefits of governance entities and the entire system. However, disruption risks do not invalidate the government cost-sharing contract but diminish its effectiveness. When the probability and damage rate of disruption risks are high, the Pareto improvement effect of the cost-sharing contract becomes negligible.
(3) Disruption risks divide the entire operational period into two phases: pre-disruption mitigation and post-disruption attenuation, exerting dual impacts on the electric vehicle supply chain network. To avoid anticipated future profit losses, governance entities adopt conservative strategies and reduce resilience investment efforts prior to disruptions. After disruptions, if the damage rate exceeds a certain threshold, governing entities further diminish the marginal utility of resilience investments, making it difficult to restore prior levels of benefit.
(4) The probability and damage rate of disruption risks significantly reduce both the resilience investment efforts and benefits of governance entities. Moreover, optimal resilience investment efforts are positively correlated with the resilience and the returns of the electric vehicle supply chain network. These efforts, influenced by the effort cost and resilience impact coefficients, ultimately impact the resilience level of the supply chain network.
Based on the above research conclusions, we can obtain the following management implications:
(1) Governments must transition from universal subsidies to targeted governance. This study indicates that the Pareto-improving effect of cost-sharing contracts becomes negligible under high disruption probability and damage rates. Therefore, to ensure the effectiveness of the policy, governments should develop guidelines for assessing disruption risks. They should apply real-time data, including geopolitical risk indices and inventory coverage at key logistics nodes, to evaluate the impact of cost-sharing policies on supply chain resilience under various disruptions. Second, tiered cost-sharing policies should be formulated. For low-risk scenarios, fixed cost-sharing contracts based on benefit ratio can incentivize suppliers and manufacturers to invest in resilience efforts. When the supply chain network enters high-risk warning states, performance-linked incentive contracts should be activated to tie post-event rewards to the actual resilience performance of the networks. Finally, governments should strive to establish long-term cooperative mechanisms characterized by information sharing, risk sharing, and equitable benefit distribution. By developing data-sharing platforms and standardized collaboration agreements, they can reduce multi-party governance costs and guide all stakeholders toward a collaborative governance model.
(2) This study reveals that disruption risks dampen entities’ willingness to invest, shifting their focus toward immediate gains. To counter this, manufacturers and suppliers must overcome the short-termism driven by disruption risks and proactively integrate resilience into corporate strategy. First, to hedge against high-risk scenarios and secure long-term partnerships, they should establish formal specialized agreements with governments, such as creating cost-sharing joint inventories to solidify cooperative relationships. Second, they should strengthen critical resilience capabilities and build shared platforms with high impact multipliers, including standardized interfaces, flexible production systems, and digital twin platforms.
Author Contributions
Conceptualization, X.W. and X.Z.; methodology, X.W.; software, X.W.; validation, X.W., X.Z. and M.Z.; data curation, X.W.; writing—original draft preparation, X.W.; writing—review and editing, X.W., X.Z. and M.Z.; visualization, X.W. All authors have read and agreed to the published version of the manuscript.
Funding
This research was funded by Liaoning Provincial Department of Education Project, grant number LJ112410142044.
Data Availability Statement
The data supporting the results were incorporated in the article.
Conflicts of Interest
The authors declare no conflicts of interest.
Appendix A
Proof of Proposition 1.
To maximize return objectives throughout the entire operational period, governance entities responsible for the resilience of electric vehicle supply chain networks formulate optimal strategies for each moment both before and after disruption risks. Forward-thinking governance entities incorporate post-disruption benefits into their calculations when determining optimal strategies prior to identifying disruption risks. Based on the principle of reverse derivation, the HJB equation is constructed for scenarios following the occurrence of disruption risks.
, , and represent the optimal value functions for governments, suppliers, and manufacturers, respectively, following disruption risks in Nash non-cooperative game model.
Solving for the first-order optimality condition at the right-hand end of (A1) to (A3) yields Equation (A4).
Substitute (A4) into Equations (A1)–(A3) gives:
According to Equations (A5)–(A7), assuming the optimal value functions , , and for governments, suppliers, and manufacturers, respectively, where are all undetermined parameters. The undetermined parameters are derived using the identity relationship given:
Substituting Equation (A8) into (A4) and the optimal value function yields the optimal strategies and optimal value functions for governments, suppliers, and manufacturers in resilience governance of the electric vehicle supply chain network after the disruption risk.
According to , the HJB equations for governments, suppliers, and manufacturers throughout the operational period are given by Equations (A9)–(A11):
, and represent the optimal value functions for governments, suppliers, and manufacturers throughout the entire period. Analyzing the right-hand side first-order optimality Conditions (A9)–(A11) give:
Substituting (A12) into (A9) to (A11) yields:
Based on Equations (A13)–(A15), we assume the optimal value functions , , and for governments, suppliers, and manufacturers throughout the entire operational period. are undetermined parameters. Similarly, using the identity relationship, we obtain:
Substituting Equation (A16) into Equation (A12) and the objective function yields the optimal strategies and objective functions for each governance entity throughout the entire period. Substituting the optimal strategies before and after the disruption risk into the state equations reveals the optimal temporal trajectory of the resilience level in the electric vehicle supply chain network under this model. Further elaboration is omitted here. □
Proofs of Proposition 1 and Proposition 2 can be derived using the same method; therefore, we will not elaborate further here.
Proof of Corollary 1.
, we know ; thus, , . Based on the relevant conditions in the main text, , , , we can obtain, . In addition, , . Because , obviously, ; thus, .
For the other two models, similar methods can be employed to derive the results. Therefore, we will not elaborate further here. □
Proof of Corollary 2.
, obviously, . . For the relationship between the coefficient of resilience investment efforts and the coefficient of resilience level, as well as the coefficient of returns for the other two entities, similar methods can be used to derive the results. Therefore, we will not elaborate further. □
Proof of Corollary 3.
These results can be derived using methods analogous to those employed for Corollary 1; therefore, we will not repeat them here. □
Proof of Corollary 4.
This inference serves as an exposition and explanation of the government cost-sharing mechanism, without involving mathematical proof, and has been elaborated in the main text. □
Proof of Corollary 5.
, ; thus, .
For the other two models, similar methods can be employed to derive the results. Therefore, we will not elaborate further here. □
Proof of Corollaries 6 and 7.
These results can be derived using methods analogous to those employed for Corollary 5; therefore, we will not repeat them. □
References
- Proselkov, Y.J.; Roselkov, Y.J.; Zhang, L.; Xu, E.; Hofmann, E.; Choi, T.Y.; Rogers, D.; Brintrup, A. Financial ripple effect in complex adaptive supply networks: An agent-based model. Int. J. Prod. Res. 2024, 62, 823–845. [Google Scholar] [CrossRef] [Scilit]
- Wang, L.; Deng, T.; Li, Q. Can feature removal benefit the automotive manufacturers amid supply shortages? An analytical investigation. Omega 2025, 132, 103227. [Google Scholar] [CrossRef] [Scilit]
- Sarwar, D.; Rye, S. The impact of the Russia-Ukraine war on global supply chains: A systematic literature review. Front. Sustain. Food Syst. 2025, 9, 1648918. [Google Scholar] [CrossRef] [Scilit]
- He, N.; Li, Y.H.; Jiang, Z.Z. Information sharing options and collaborative inventoryoptimization under supply disruption risk. Syst. Eng.-Theory Pract. 2025, 1–17. Available online: https://link.cnki.net/urlid/11.2267.N.20250915.1020.012 (accessed on 10 February 2026).
- Khezeli, M.; Najafi, E.; Molana, M.H.; Seidi, M. A sustainable and resilient supply chain (RS-SCM) by using synchronisation and load-sharing approach: Application in the oil and gas refinery. Int. J. Syst. Sci. Oper. Logist. 2023, 10, 2198055. [Google Scholar] [CrossRef] [Scilit]
- Gu, B.; Liu, J.; Chen, J. Scenario-based strategies evaluation for the maritime supply chain resilience. Transp. Res. Part D Transp. Environ. 2023, 124, 103948. [Google Scholar] [CrossRef] [Scilit]
- Yang, L.; Chen, X.J.; Wang, X.P.; Zhao, Z.B. Study on the supply chain dynamics strategy of advanced manufacturing chain considering the level of effort under the improvement of security and stability level. Manag. Rev. 2025, 37, 226–238. [Google Scholar] [CrossRef]
- Chen, Z.X.; Wang, Y.; Jiao, D.Y. Research on the resilience investment behavior and governance of the supply chain in the “farming-supermarket” docking under government regulation. Manag. Rev. 2025, 37, 249–262. [Google Scholar] [CrossRef]
- Liu, J.; Kang, K.; Lu, L.; Dong, R.; Luo, X.; Li, C.; Long, P.; Yang, X.; Mao, S. Decision analysis considering the resilience level of the food supply chain under the risk of demand disruption. Flex. Serv. Manuf. J. 2025, 9, 1563938. [Google Scholar] [CrossRef] [Scilit]
- Lou, G.; Wang, H.; Tu, X.; Lai, Z.; Ma, H.; Ying, S. Resilience assessment of the electric vehicle lithium-ion battery supply chain under supply shortages of upstream mineral enterprises. Resour. Conserv. Recycl. 2025, 215, 108161. [Google Scholar] [CrossRef] [Scilit]
- López, C.; Morales-Contreras, M.F.; Langella, I.M.; Alonso-Monge, J. Modeling supply chain disruptions due to geopolitical Reasons: A systematic literature review. Transp. Res. Part E Logist. Transp. Rev. 2025, 202, 104290. [Google Scholar] [CrossRef] [Scilit]
- Manupati, V.K.; Schoenherr, T.; Ramkumar, M. Disruption risks in a multi-echelon supply chain considering ripple effects: Assessing its resilience based on recovery measures. Ind. Manag. Data Syst. 2025, 125, 3079–3102. [Google Scholar] [CrossRef] [Scilit]
- Ke, J.Y.; Cho, W.; Su, H. Flying through uncertainty: Air transportation’s impact on supply chain resilience and inventory efficiency. Transp. Res. Part E Logist. Transp. Rev. 2025, 197, 104042. [Google Scholar] [CrossRef] [Scilit]
- Lou, G.; Guo, Y.; Lai, Z.; Ma, H.; Tu, X. Optimal resilience strategy for manufacturers to deal with supply disruptions: Investment in supply stability versus dual sourcing. Comput. Ind. Eng. 2024, 190, 110030. [Google Scholar] [CrossRef] [Scilit]
- Ma, P.; Wu, Z.; Qiu, Y.; Cao, J.; Liu, M. Backup production decisions and financing strategies of a capital-constrained supplier with supply disruption. Comput. Ind. Eng. 2025, 207, 111311. [Google Scholar] [CrossRef] [Scilit]
- Kumar, D.; Soni, G.; Mangla, S.K.; Liao, J.; Rathore, A.; Kazancoglu, Y. Integrating resilience and reliability in semiconductor supply chains during disruptions. Int. J. Prod. Econ. 2024, 276, 109376. [Google Scholar] [CrossRef] [Scilit]
- Duong, A.T.B.; Ta, T.D.; Truong, D.Q.; Hoang, T.G.; Pham, H.; Hoang, T.H.; Quang, H.T. Direct and indirect effect of risk on construction supply chain in disruption era: A service-oriented view. Eng. Constr. Archit. Manag. 2025. Epub ahead of printing. [Google Scholar] [CrossRef] [Scilit]
- Zhong, M.; Huan, M.M. Enhancement strategies of crude oil maritime supply chain network resilience under uncertain disturbances. J. Shanghai Marit. Univ. 2024, 45, 40–48. [Google Scholar] [CrossRef]
- Nibbrig, M.H.; Azadeh, S.S.; Maknoon, M.Y. Adaptive resilience strategies for supply chain networks against disruptions. Transp. Res. Part E Logist. Transp. Rev. 2025, 200, 104172. [Google Scholar] [CrossRef] [Scilit]
- Liang, P.P.; Jili, H.H.; Lv, Y.Q.; Xu, Y. Configuring supply chain governance and digital capabilities for resilience: Evidence from the manufacturing sector. Adv. Prod. Eng. Manag. 2025, 20, 43–60. [Google Scholar] [CrossRef] [Scilit]
- Hosseinzadeh, A.; Taghipour, S. Enhancing multi-facility manufacturing resilience through integrated product and supply chain network design. CIRP J. Manuf. Sci. Technol. 2024, 52, 277–295. [Google Scholar] [CrossRef] [Scilit]
- Kettele, M.; Lechner, G. Assessing resilience measures in the Austrian dairy supply chain: A case-based simulation integrating strategic, tactical, and operational decisions. Int. J. Prod. Res. 2025, 63, 3982–4015. [Google Scholar] [CrossRef] [Scilit]
- Habibi, F.; Chakrabortty, R.K.; Abbasi, A.; Ho, W. Building resilient closed-loop supply chains: Resilience enablers and diversified sourcing under global disruptions. Int. J. Prod. Res. 2026, 64, 192–219. [Google Scholar] [CrossRef]
- Li, Y.Y.; Hong, I.H.; Yang, S.J.S. A public-private collaboration model of supply chain resilience to unpredictable disruptions: An exploratory empirical case study of medical mask production and distribution. Prod. Plan. Control 2024, 35, 1298–1312. [Google Scholar] [CrossRef] [Scilit]
- Rajabzadeh, H.; Wiens, M. Resilient and sustainable energy supply chains: Insights on sourcing and pricing strategies in a non-collaborative and collaborative environment. Int. J. Prod. Res. 2024, 62, 9011–9042. [Google Scholar] [CrossRef] [Scilit]
- Lyu, G.; Zhao, M.; Ji, Q.; Lin, X. Improving resilience via capacity allocation and strategic pricing: Co-opetition in a shipping supply chain. Ocean Coast. Manag. 2023, 244, 106779. [Google Scholar] [CrossRef] [Scilit]
- Long, Q.; Wu, X.; Wu, X.; Xu, Q. Evolutionary game analysis of governments, enterprises and consumers in resilient food supply chains during emergencies. Flex. Serv. Manuf. J. 2025, 1–39. [Google Scholar] [CrossRef] [Scilit]
- Jørgensen, S.; Zaccour, G. Developments in differential game theory and numerical methods: Economic and management applications. Comput. Manag. Sci. 2007, 4, 159–181. [Google Scholar] [CrossRef] [Scilit]
- Qi, N.; Zhang, A. Technological cooperation relationships among supply chain enterprises under the perspective of technological blockade: A tripartite evolutionary game model. J. Clean. Prod. 2024, 447, 141240. [Google Scholar] [CrossRef] [Scilit]
- Li, C.; Ke, Y.; Lu, L.; Xu, K. Healthcare supply chain resilience investment strategy analysis based on evolutionary game. Symmetry 2024, 16, 787. [Google Scholar] [CrossRef] [Scilit]
- Yu, R.; Liu, F.; Cheng, T.C.E.; Xu, X. AI-Blockchain synergy for resilient agricultural supply chains: An evolutionary game analysis. Int. J. Prod. Res. 2025, 1–27. [Google Scholar] [CrossRef] [Scilit]
- Nerlove, M.; Arrow, K.J. Optimal advertising policy under dynamic conditions. Economica 1962, 29, 129–142. [Google Scholar] [CrossRef] [Scilit]
- Yang, M.; Liu, D.H. Stochastic differential game model of diversified supply of emergency medical supplies led by government. Syst. Eng.-Theory Pract. 2023, 43, 1333–1352. [Google Scholar] [CrossRef]
- He, S.H.; Huang, M. Research on Disaster Adaptability Improvement Based on Differential Game Model in the Context of Big Data. J. Catastrophol. 2023, 38, 37–42. [Google Scholar] [CrossRef]
- Hu, J.S.; Liu, Y.H.; Ma, D.Q. Research on food supply chain dynamic strategy formulation and coordination under the prediction of food safety crisis. Chin. J. Manag. Sci. 2023, 31, 116–131. [Google Scholar] [CrossRef]
- Wang, W.L.; Liu, Q.; Feng, G.Z.; Zhang, S. Recovery efforts and contracts in a dual-channel supply chain under epidemic. Syst. Eng.-Theory Pract. 2023, 43, 857–870. [Google Scholar]
- Wang, W.H.; Hu, J.S. Dynamic quality and marketing decisions with envision of brand crisis in a dual channel supply chain. J. Syst. Manag. 2022, 31, 413–427. [Google Scholar]
- Taleizadeh, A.A.; Ahmadzadeh, K.; Sarker, B.R.; Ghavamifar, A. Designing an optimal sustainable supply chain system considering pricing decisions and resilience factors. J. Clean. Prod. 2022, 332, 129895. [Google Scholar] [CrossRef] [Scilit]

Disclaimer/Publisher’s Note: The statements, opinions and data contained in all publications are solely those of the individual author(s) and contributor(s) and not of MDPI and/or the editor(s). MDPI and/or the editor(s) disclaim responsibility for any injury to people or property resulting from any ideas, methods, instructions or products referred to in the content. |
© 2026 by the authors. Licensee MDPI, Basel, Switzerland. This article is an open access article distributed under the terms and conditions of the Creative Commons Attribution (CC BY) license.