


Abstract
The safe and efficient integration of small unmanned aircraft systems (sUAS) into the National Airspace System (NAS) requires a systems-based understanding of the interrelations among human, technological, and regulatory components. Existing Federal Aviation Administration (FAA) guidelines restrict most operations to visual line of sight (VLOS), which constrains operational scalability and underscores the need for system-level innovations supporting beyond-visual-line-of-sight (BVLOS) operations. This study adopted a socio-technical systems approach to evaluate how first-person view (FPV) technologies influence operator workload and situational awareness (SA), key human performance elements within the broader sUAS safety system. Participants meeting FAA Part 107 eligibility criteria were assigned to one of three visual configurations: (a) traditional VLOS, (b) FPV using a 21-inch monitor, or (c) FPV with immersive goggles. Workload was measured with the NASA Task Load Index (NASA-TLX), and Level 1 SA was assessed via post-task recall. ANOVA results revealed no statistically significant differences across visual conditions, indicating no evidence that FPV integration either increased cognitive load or impaired perceptual awareness compared to traditional methods. Complementary analysis of NASA’s Aviation Safety Reporting System (ASRS) identified SA as the most recurrent human-factor issue, suggesting system-level implications for human–machine interaction and training design. These findings contribute to the systemic understanding of human factors in UAS operations, supporting FPV’s potential as a viable subsystem for achieving safe and effective BVLOS integration within complex socio-technical aviation systems.
1. Introduction
Small Unmanned Aircraft Systems (sUAS) have expanded rapidly across commercial, recreational, and public service domains, propelled by lower acquisition costs, maturing sensor technologies, and reliable digital communications. Global forecasts anticipate strong growth in civil production of sUAS over the coming decade, signaling sustained demand and increasingly diverse use cases [1]. In the United States, however, this expansion has outpaced the development of policy and infrastructure for full integration into the National Airspace System. The Federal Aviation Administration (FAA) has strengthened the regulatory baseline through Part 107 UAS regulations and related integration roadmaps, yet most operations remain limited to visual line of sight (VLOS), a constraint that manages near-term risk but limits scalability and raises questions about safety equivalency with manned aviation as mission complexity and traffic density increase [2,3].
A systems perspective is needed because safety in unmanned operations emerges from the interactions among people, displays and sensors, procedures, and the regulatory environment rather than from any single element in isolation. More specifically, the capacity of a remote pilot to see and avoid other traffic and obstacles depends on individual vigilance, characteristics of the visual channel, ergonomics of the ground control station, team roles such as the visual observer, communication protocols, airspace structure, and training and certification processes [4,5]. Reports of near-midair conflicts, airspace incursions, and improper use underline the limits of unaided observation as missions expand in altitude, range, and task load [6,7]. Current FAA guidance, therefore, restricts operations to VLOS and, in most cases, prohibits reliance on optical or electronic vision aids during aircraft control [8]. This approach mitigates certain hazards but can also introduce new ones when pilots must divide attention between the aircraft in the sky and mission management at the ground station.
Within this socio-technical arrangement, First-Person View (FPV) technology is a promising subsystem. By streaming video from an onboard camera to a ground display or head-mounted device, FPV provides a flight deck-like perspective that may sharpen perception of motion cues, flight path, and local hazards in the near field [9]. Analogous approaches are well established in military aviation and in other high-consequence domains such as medicine, space operations, and hazardous site inspection, where remote visual access is essential for safe performance [10,11]. Despite this promise, current FAA guidance allows FPV only as a supplemental aid with a dedicated visual observer for most operations, and empirical evidence from civil contexts remains limited regarding how different FPV configurations affect pilot workload and situational awareness [8,12,13].
Situational awareness (SA) and workload are central human elements in this system. SA is commonly structured as perception, comprehension, and projection of environmental elements, with Level 1 SA focused on accurate perception of relevant cues such as obstacles, traffic, and terrain [14,15]. Workload, typically assessed with the NASA Task Load Index (NASA-TLX), reflects mental and temporal demand, effort, performance, frustration, and physical demand; these dimensions shape attention allocation and the likelihood of error under operational stress [16]. Changes to the visual channel through FPV may redistribute attention, improve detection of near-field hazards, or alter cognitive demands in ways that are not obvious without a controlled study. For example, immersive goggles might deepen focus on the forward scene but reduce peripheral awareness of bystanders and airspace cues at the launch site, whereas a monitor-based view might facilitate crew coordination but introduce additional head-down time.
Against this backdrop, the present study evaluates FPV as a configurable visual subsystem within a socio-technical system. The experimental comparison spans three conditions that reflect current practice and near-term pathways toward supervised operations beyond visual line of sight (BVLOS): traditional visual line of sight, FPV via a 21-inch monitor, and FPV via immersive goggles. Subjective workload is measured with the NASA-TLX, and Level 1 SA is assessed through post-task recall of salient environmental elements. In parallel, to connect controlled performance with operational reality, narratives from NASA’s Aviation Safety Reporting System (ASRS) associated with unmanned operations are analyzed to identify recurrent human factor themes, with particular attention to SA.
Embedded within this design are two study questions that guided analysis and interpretation.
- Research Question 1: What effect will the utilization of FPV techniques have on the sUAS operator’s perceived workload?
- Research Question 2: What effect will the utilization of FPV techniques have on the operator’s Level 1 SA?
In line with these questions, six directional hypotheses compared FPV against traditional visual line of sight and differentiated between monitor-based and immersive configurations.
H1.
sUAS pilot subjective workload will be lower in the LCD screen condition than in the VLOS condition.
H2.
sUAS pilot subjective workload will be lower in the visual immersion goggle condition than in the VLOS condition.
H3.
sUAS pilot subjective workload will be lower in the visual immersion goggle condition than in the LCD screen condition.
H4.
sUAS pilot post-task Level 1 will be higher in the LCD screen condition than in the VLOS condition.
H5.
sUAS pilot post-task Level 1 SA will be higher in the visual immersion goggle condition than in the VLOS condition.
H6.
sUAS pilot post-task Level 1 SA will be higher in the visual immersion goggle condition than in the LCD screen condition.
The expected outcome was that FPV, when configured either on a monitor or through immersive goggles, will perform at least equivalently to traditional VLOS with respect to operator workload and Level 1 SA, with potential condition-specific advantages that can be leveraged through training, interface design, and team procedures. More specifically, if FPV redistributes attention without adding cognitive burden, it can be positioned as a viable visual subsystem within a socio-technical architecture for supervised pathways toward operations beyond visual line of sight. This study contributes to the literature by providing controlled, Part 107-relevant evidence on how visual modality choices interact with human performance constructs, by linking those findings to patterns in ASRS narratives to ground implications in operational practice, and by articulating system-oriented design and policy considerations for ground control stations, crew role definitions, and competency-based training. In doing so, the work advances a systems perspective on unmanned aircraft integration that connects human factors, technology, and regulation in a coherent framework for future research and implementation.
The remainder of the paper is organized as follows. The next section reviews related literature on visual display modalities, workload, and SA in unmanned and analogous remote operations, with particular attention to how display design interacts with system factors such as training and operational context. The experimental design, participant sample, apparatus, and measurement instruments are then described, followed by the analysis of ASRS narratives and associated coding procedures. Results from both components are subsequently presented, and the paper concludes with a discussion of implications for human–machine interaction (HMI), training, and regulatory policy, along with study limitations and directions for future research.
2. Literature Review and Theoretical Framework
Effective sUAS operation depends on the operator’s ability to manage workload and maintain SA despite being physically separated from the flight environment [17]. Unlike manned aviation, sUAS pilots rely on indirect sensory inputs, video, telemetry, and displays, making SA and workload management critical to safety and performance [13]. FPV technology enhances immersion and control precision through real-time video but may also narrow visual attention, increase cognitive load, and reduce peripheral awareness [18].
This section analyzes existing research on SA frameworks, visual perception, HMI design, telepresence, and collision avoidance to identify current strengths, limitations, and gaps in understanding operator workload and awareness in sUAS contexts. By integrating findings across these domains, this review identifies the strengths and limitations of current knowledge while highlighting gaps that motivate the present research. In particular, the literature suggests that while FPV enhances operator immersion, it also introduces trade-offs that may increase workload and reduce SA. Recognizing these dynamics is essential for advancing UAS safety and informing the design of technologies, procedures, and regulations that support effective human-system performance.
2.1. Theoretical Framework of Situational Awareness in Aviation Contexts
Across high-stakes operational domains such as aviation, operators must interpret rapidly evolving information streams under strict temporal constraints. The progressive integration of automation and advanced display technologies since the late twentieth century has fundamentally altered these environments, shifting cognitive demands from direct vehicle control toward information integration and monitoring [15]. Whereas traditional “steam gauge” flight decks presented limited, discrete flight parameters, contemporary glass cockpits integrate navigation, weather, traffic surveillance, and system health into unified visual displays. Although these interfaces enhance operational capability, they also increase attentional and cognitive demands, requiring operators to continuously filter, prioritize, and integrate information to maintain SA [19].
Endsley’s three-level model of SA provides a foundational framework for understanding this process. Level 1 SA concerns the perception of relevant elements in the environment, Level 2 involves comprehension of their significance within the operational context, and Level 3 reflects the projection of future system states [14,20]. These levels are influenced by operator experience, workload, interface design, and task complexity, and they collectively support, but remain distinct from, decision-making processes themselves [21,22]. Importantly, failures at higher levels of SA are often rooted in breakdowns at the perceptual level, underscoring the critical role of Level 1 SA in complex, visually demanding tasks. Complementing this model, Wickens [22] conceptualized SA as comprising spatial, system, and task awareness. Spatial awareness involves maintaining orientation and predicting vehicle motion in three-dimensional space, while system awareness reflects understanding and supervision of increasingly automated systems. Task awareness encompasses the integration of mission goals, communication demands, and procedural priorities.
These components highlight that SA is not a unitary construct, but an emergent property shaped by perceptual access, cognitive workload, and interface design. These theoretical principles extend directly to UAS operations, where operators must achieve and maintain SA without direct sensory coupling to the aircraft. UAS pilots rely on ground-based HMIs to interpret telemetry, video feeds, and mission data, introducing spatial and sensory disconnects that can degrade perceptual fidelity [19]. Remote operation amplifies known SA challenges, including reduced peripheral cues, visual tunneling, latency, and asymmetric information flow between the operator and the vehicle. Addressing these challenges, Drury and Scott [23] proposed the Human–UAV Awareness Framework, which emphasizes the interdependence of operator awareness of vehicle state and environment, system awareness of operator intent, and overarching mission awareness. From this perspective, effective HMI design must support accurate perceptual access to task-relevant cues while minimizing cognitive overhead.
As automation and autonomy continue to advance, the human operator’s role increasingly centers on monitoring, interpretation, and intervention rather than direct control. In such contexts, maintaining accurate and timely perceptual awareness remains a foundational requirement for safe and effective performance. This theoretical framework requires focused examination of Level 1 SA in visual-based UAS operations, particularly as interface configurations and environmental complexity can potentially constrain operator perceptual access and attentional resources.
2.2. Visual Perception and Field of View (FOV)
Visual perception is a foundational component of SA for UAS operators, particularly for the detection, discrimination, and tracking of airborne hazards. An operator’s ability to perceive relevant visual cues directly influences reaction time, flight path control, and collision avoidance, all of which are critical to safe mission execution. Dynamic visual acuity, the ability to resolve fine detail in a target while relative motion exists between the observer and the object, has been shown to play a central role in air-to-air target detection and tracking tasks [24]. In sUAS operations, however, dynamic visual acuity is not determined solely by human visual physiology; it is also shaped by the characteristics of the visual display systems that mediate perception.
Empirical research demonstrates that target detectability degrades as visual complexity increases. Nakatsuka et al. [25] found that targets moving across visually complex backgrounds become increasingly difficult to detect due to reduced visual signal-to-noise ratio, particularly when target size is small and relative motion is high. These effects are exacerbated in FPV-mediated flight, where camera resolution, contrast, and motion artifacts further constrain perceptual clarity. As a result, hazard detection performance in UAS operations reflects an interaction between operator visual capability, environmental complexity, and interface design rather than any single factor in isolation.
Display characteristics such as resolution, refresh rate, and latency further modulate visual perception in teleoperated systems. Jun [26] demonstrated that differences between composite display viewing and FPV-based viewing during tele-robotic vehicle operations produced measurable changes in visual acuity and subjective workload, attributable to display fidelity and transmission delays. Consistent findings in aviation research indicate that even modest latency or degradation in display quality can distort motion perception, delay target recognition, and impair SA [27]. For sUAS operators relying on FPV camera feeds with limited depth cues and constrained resolution, such distortions may translate directly into delayed control inputs and suboptimal obstacle avoidance decisions.
Beyond display fidelity, field of view (FOV) represents a critical design variable influencing perceptual access and attentional allocation. FOV defines the angular extent of the environment visible through a display and governs the availability of peripheral visual information. Narrow FOVs, common in many FPV goggle systems, restrict peripheral vision and can degrade spatial orientation, increasing reliance on central vision and limiting detection of off-axis hazards [28]. Conversely, wider FOVs provide more immersive visual cues that can enhance depth perception and object localization but may also introduce optical distortion and increase cognitive demand by expanding the volume of visual information that must be processed [29].
Prior research in both manned and unmanned aviation operations underscores that FOV optimization involves a fundamental trade-off between immersion, usability, and workload. Excessively narrow displays may promote visual fixation and attentional tunneling, while overly wide displays can overwhelm operators and induce discomfort or disorientation, including motion sickness and simulator adaptation effects [30]. In FPV-based sUAS operations, this balance is particularly consequential: restricted FOV may result in missed hazard detections, whereas expanded FOV may increase mental demand and reduce task efficiency. These competing effects suggest that FPV display configuration can differentially shape perceptual access and attentional resources, with direct implications for both Level 1 SA and perceived workload in dense operational environments.
2.3. Human–Machine Interface (HMI) and Workload Models
Operator workload in UAS operations is closely coupled to the design of the HMI, which governs how perceptual information is transformed into control actions. In FPV flight, operators depend almost entirely on mediated feedback, visual displays and control inputs, making interface quality a primary determinant of both workload and SA. When interface design is poorly aligned with human perceptual and cognitive capabilities, demands on working memory increase, reaction times slow, and error likelihood rises, particularly during time-critical or precision maneuvers.
Predictive models of human motor control provide a useful theoretical basis for understanding how interface characteristics influence workload. Fitts’ Law describes the relationship between movement time, target distance, and target size, illustrating how increased latency, reduced control sensitivity, or imprecise mappings can elevate task difficulty [31]. Extensions of this framework, including the Steering Law and Cornering Law, address continuous movement through constrained paths and directional changes, both of which are central to FPV-based flight through obstacle-laden environments [32]. Collectively, these models highlight that interface responsiveness, control–display compatibility, and feedback fidelity directly affect operator effort and control precision, thereby shaping perceived workload.
In FPV systems, latency and reduced sensory feedback represent persistent challenges. Even brief transmission delays can disrupt closed-loop control, producing overcorrection, oscillatory flight behavior, and increased mental demand as operators attempt to compensate for delayed visual feedback [33]. The absence of tactile and proprioceptive cues further exacerbates these effects, forcing operators to rely exclusively on visual information for spatial orientation and control calibration, which increases attentional load and cognitive strain [34]. Under such conditions, small degradations in display quality or control responsiveness can disproportionately affect performance.
Ergonomic considerations further influence workload in FPV operations. Interfaces with poorly aligned controls, unintuitive mappings, or cluttered visual displays impose additional cognitive effort, whereas designs that support natural mappings between perception and action facilitate more efficient and stable control [35]. These ergonomic factors interact with display modality to shape how operators allocate attention and manage competing task demands.
Elevated workload has well-documented consequences for SA. As cognitive demand increases, operators are more likely to exhibit attentional narrowing, focusing on salient or centrally located cues at the expense of broader environmental awareness [15]. In FPV-mediated sUAS operations, this narrowing may manifest as fixation on the flight path or central visual feed, reducing sensitivity to peripheral hazards and degrading Level 1 SA. Accordingly, effective HMI design must minimize unnecessary cognitive effort and provide smooth, predictable feedback to preserve attentional resources. Optimizing FPV interfaces through latency reduction, ergonomic refinement, and workload-aware design remains essential for sustaining operator performance and safety.
2.4. Telepresence and Teleoperations
Telepresence, defined as the subjective experience of “being there” within a remote environment, plays a key role in shaping SA and workload in UAS operations. Sheridan [36] described telepresence as the extent to which mediated sensory inputs allow an operator to perceive and interact with a remote environment as if physically present. In FPV-based flight, visual immersion is the dominant contributor to telepresence, enabling operators to form intuitive spatial representations of the aircraft’s surroundings and to execute precise control actions. When effectively implemented, telepresence can enhance engagement, spatial understanding, and control fidelity.
However, teleoperation inherently introduces perceptual and cognitive challenges that complicate this relationship. FPV systems rely on real-time video transmission and indirect sensory feedback, which can introduce latency, sensory mismatch, and spatial disorientation. Draper et al. [29] demonstrated that even small delays or inconsistencies between visual input and control response can disrupt sensorimotor coordination, increasing workload and degrading performance. In UAS operations, where tactile and vestibular cues are absent, operators must rely almost exclusively on visual information, amplifying the cognitive demands associated with interpreting and compensating for mediated feedback.
While increased telepresence can improve task engagement and accuracy, it may also produce unintended attentional consequences. Cummings and Guerlain [34] found that highly immersive teleoperation environments can promote attentional tunneling, wherein operators concentrate on salient or centrally located visual elements at the expense of peripheral or contextual cues. In FPV flight, such narrowing may manifest as fixation on the central video feed or flight path, reducing sensitivity to emerging hazards and impairing higher-level SA. Thus, greater immersion does not inherently guarantee improved awareness; rather, it can alter attentional allocation in ways that both support and undermine performance.
Effective FPV-based sUAS operation therefore requires careful balancing of immersion and cognitive demand. Insufficient telepresence may lead to disengagement or reduced spatial understanding, whereas excessive realism or poorly calibrated system dynamics can overwhelm perceptual and attentional resources. Prior research suggests that optimal teleoperation performance emerges when sensory richness, display characteristics, and system responsiveness are aligned with human perceptual capacity and task demands [29,34]. Within this framework, FPV display configuration becomes a critical design variable, shaping how operators experience telepresence and allocate attention. Understanding how different FPV modalities influence this balance is essential for characterizing their effects on workload and Level 1 SA in dense operational environments.
2.5. Collision Hazard Detection and Sense-and-Avoid
Collision hazard detection represents a critical operational consequence of human factors in UAS operations. In manned aviation, pilots operate under the “see-and-avoid” principle codified in 14 CFR §91.113 [37], which presumes direct visual access to the external environment and continuous visual scanning to maintain safe separation. In contrast, UAS operators rely on FPV systems and mediated sensor information, fundamentally altering how hazards are perceived and increasing the cognitive demands associated with detecting, tracking, and responding to collision threats. Limitations in depth perception, motion parallax, and peripheral awareness inherent to FPV displays make hazard detection more effortful, particularly under conditions of elevated workload or environmental degradation.
Existing research has demonstrated that visual detection performance in remote operations is susceptible to delayed recognition and reduced sensitivity to peripheral hazards. Williams and Gildea [38] reported slower reaction times and decreased detection accuracy among operators monitoring camera feeds, especially when attention was divided across concurrent tasks. Such performance decrements are frequently attributed to attentional narrowing, whereby operators fixate on central visual elements at the expense of broader environmental awareness. In FPV-based flight, this tunneling effect may be exacerbated by constrained fields of view and display-centric scanning strategies, increasing the likelihood of missed or late-detected hazards. Environmental factors such as glare, low contrast, or cluttered visual scenes further degrade visual performance, compounding cognitive strain and elevating workload.
To mitigate these limitations, UAS operations increasingly incorporate supplemental detection and alerting technologies, including Automatic Dependent Surveillance–Broadcast (ADS-B), radar, and electro-optical sensing systems [39]. These technologies can extend detection range and enhance reliability beyond unaided visual perception. However, their integration into small UAS platforms remains constrained by size, weight, power, and cost considerations [40]. Moreover, many sensing systems rely on cooperative targets, limiting effectiveness against non-cooperative hazards such as birds, untracked aircraft, or obstacles lacking electronic signatures.
Emerging sense-and-avoid solutions seek to address these challenges through sensor fusion and algorithmic prediction, enabling systems to detect potential conflicts and either alert the operator or initiate automated avoidance maneuvers [41]. Despite promising advances, such technologies introduce additional human–automation interaction challenges, including data latency, false alarms, and the risk of automation complacency. Effective sense-and-avoid implementation therefore requires careful balancing of automation support and human oversight, ensuring that operators remain sufficiently engaged to maintain SA without being overwhelmed by redundant or poorly prioritized alerts. Within this context, understanding how FPV display configurations influence human hazard detection, workload, and perceptual awareness remains essential for safe operation in dense environments.
2.6. Beyond Visual Line of Sight Operations
BVLOS operations represent a significant expansion of UAS operational capability, enabling applications such as infrastructure inspection, long-range surveillance, and package delivery beyond the operator’s direct visual range. At the same time, BVLOS flight introduces substantial safety and regulatory challenges, as operators no longer maintain direct visual contact with the aircraft or its surrounding airspace. Under these conditions, safe operation depends heavily on the effectiveness of detect-and-avoid and sense-and-avoid technologies capable of identifying and responding to collision hazards without continuous human visual observation [41].
A broad range of sensing and detection approaches has been investigated to support BVLOS operations, including radar, electro-optical and infrared sensors, acoustic detection, and cooperative transponder-based systems such as ADS-B and Traffic Collision Avoidance System (TCAS) integrations. While these technologies can enhance detection range and reliability, their application to small UAS platforms remains constrained by size, weight, power, cost, and communication bandwidth limitations [40]. Furthermore, many cooperative systems depend on compliant targets, reducing effectiveness against non-cooperative hazards such as birds, terrain, or aircraft lacking active transponders.
Regulatory frameworks reflect these technical and human-factors challenges. In the United States, approval for BVLOS operations, such as waivers under FAA Part 107 regulations, typically requires operators to demonstrate robust detect-and-avoid capability, contingency management, and risk mitigation strategies tailored to environmental and operational variability [8]. These requirements underscore persistent concerns regarding system reliability, human oversight, and the ability to maintain adequate SA under degraded or uncertain conditions.
Human factors considerations remain central as automation levels increase in BVLOS contexts. Operators must often rely on indirect information sources, including telemetry, sensor fusion outputs, and video feeds, to maintain SA. This reliance can elevate cognitive workload and introduce vulnerabilities associated with automation bias, wherein operators may over-trust automated systems or fail to intervene promptly when system performance degrades [42]. Effective BVLOS operations therefore require carefully designed interfaces and training strategies that support sustained engagement, accurate interpretation of system state, and timely human intervention when necessary. These challenges highlight that, even as automation advances, human perceptual and cognitive limitations remain integral to UAS safety. Understanding how visual mediation, interface configuration, and workload influence SA in complex environments is essential for VLOS, BLVOS, and FPV operations.
2.7. Autonomous Obstacle Avoidance as a Performance Benchmark
Advances in autonomous UAV navigation have produced robust obstacle avoidance strategies that serve as practical performance benchmarks for comparison with human-operated control. Deep reinforcement learning and actor–critic frameworks have enabled UAVs to learn collision avoidance and navigation in complex, multi-obstacle environments, achieving high success rates and adaptable behavior in dense settings [43,44]. In addition to single-agent methods, cooperative control and multi-agent collision avoidance algorithms have been developed to support coordinated movement in shared airspace, integrating dynamic window approaches with optimal reciprocal collision avoidance techniques to improve path efficiency and mission completion time for multiple UAVs [45]. Classical path-planning and obstacle avoidance surveys further contextualize these capabilities, demonstrating a wide range of global and local planning algorithms that underpin autonomous navigation systems capable of safe trajectory generation under uncertainty [46]. These autonomous approaches currently operate with reaction times, perception fidelity, and trajectory optimization that exceed what is achievable in manual control, particularly in dense, high-workload demand environments. Rather than serving as a direct performance comparison, these autonomous benchmarks provide context for examining the perceptual and cognitive demands experienced by human operators, highlighting the need to empirically assess workload and SA across FPV display configurations in dense environments.
2.8. Summary
This section reviewed SA and workload in UAS operations through key human factors perspectives, including visual perception and field of view, HMI design, telepresence, collision hazard detection, and BVLOS operations, to examine how visually mediated flight influences human performance in UAS operations. Across these domains, a consistent pattern emerges: Operator performance is not determined by FPV technology alone but by the systematic interaction between visual display configuration, task demands, environmental complexity, and cognitive workload. While FPV systems can enhance immersion and control precision, current research also demonstrates that they can constrain perceptual access, narrow attentional focus, and elevate workload—effects that are particularly pronounced under conditions of high visual clutter, limited peripheral cues, or increased task density. Similarly, HMI and workload models indicate that latency, control–display compatibility, and ergonomic design directly influence operator effort and stability of control, with elevated workload contributing to reduced SA and increased susceptibility to missed hazards.
Table 1 consolidates key FPV and teleoperation studies by systematically mapping visual modality and field of view, task context, measured dependent variables (e.g., SA, workload, detection performance), critical findings, and identified methodological constraints. Examination of this structured synthesis reveals several convergent limitations in the existing literature. First, many FPV studies assess performance in low-complexity navigation or monitoring tasks that do not adequately stress perceptual or attentional resources, limiting generalizability to operationally realistic environments. Second, outcome measures are often examined in isolation, such as workload or task performance, without concurrent assessment of perceptual-level situational awareness, obscuring how workload and awareness interact during FPV-mediated flight. Third, few studies explicitly manipulate display configuration (e.g., FOV or display modality) as an experimental factor while controlling environmental complexity, making it difficult to disentangle the effects of visual mediation from task difficulty.
Table 1.
Summary of FPV and Teleoperation Studies Relevant to sUAS Visual Display Configuration, Workload, and SA.
Similarly, the current literature highlights a conceptual gap between human-operated FPV flight and emerging autonomous or semi-autonomous obstacle avoidance benchmarks, which routinely outperform human operators in dense environments but do so without addressing human perceptual or cognitive constraints. This contrast underscores the need for increased human factors research that characterizes where and why human performance degrades under FPV mediation, rather than treating automation performance as a direct substitute for human capability. Studies of collision hazard detection and sense-and-avoid further the operational implications of these human factor constraints. Although automated detection technologies and emerging sense-and-avoid systems provide important safety enhancements, their effectiveness remains bounded by technical, regulatory, and human–automation interaction challenges. In BVLOS contexts, increasing levels of automation do not eliminate the need for human oversight; instead, they shift the operator’s role toward monitoring and intervention, reinforcing the importance of maintaining accurate perceptual awareness and manageable workload through effective interface design.
Addressing these research gaps, the present study aimed to experimentally manipulate FPV display configuration during controlled sUAS flight tasks that impose elevated perceptual and attentional demands. By jointly assessing operator workload and Level 1 SA under obstacle-dense conditions, this research directly responds to gaps identified in current research and provides a clearer understanding of how visual mediation shapes human performance in FPV-based UAS operations, with implications for interface design, training, and future VLOS and BVLOS integration.
3. Methodology
In this study, a quantitative research method was used to investigate how FPV visual techniques affect operator workload and Level 1 SA during sUAS operations. In the first step, an experiment was conducted to quantify how FPV techniques influence operator workload and perception accuracy when completing a mission-oriented flight task in a dynamic environment. A quasi-experimental, between-groups design was utilized to allow for controlled manipulation of visual display conditions while maintaining sUAS operational realism. The independent variable was the visual display condition, with three levels: (a) VLOS, (b) FPV via a 21-inch LCD monitor, and (c) FPV using immersive goggles. These conditions represented increasing levels of perceptual immersion and visual constraint. The dependent variables were operator workload, measured using the NASA-TLX, and Level 1 SA, which was assessed through a structured post-task recall questionnaire.
In the second step, a secondary analysis of data from the ASRS database was conducted to provide contextual insight into real-world UAS operational challenges. This combined approach enabled examination of both controlled experimental effects and naturally occurring human factor trends, providing a more comprehensive understanding of how FPV systems impact safety and performance in remote flight operations.
3.1. Population and Sampling
The target population of this study included individuals eligible for an FAA Part 107 remote pilot certificate within the state of Florida. Participants were recruited from students at Jacksonville University and professionals from affiliated organizations, including the Jacksonville Fire and Rescue Department, a local Navy helicopter squadron, and the Jacksonville chapter of the Association for Uncrewed Vehicle Systems International. Eligibility criteria required participants to be at least 18 years old, possess adequate physical ability for safe UAS operation, and pass an Ishihara color vision test to ensure accurate color perception during SA assessment. Pre-experiment screening questionnaires gathered demographic information and confirmed that no participants had visual or cognitive impairments that could influence performance.
3.2. Experimental Instruments
The experimental setup consisted of a sUAS, supporting ground equipment, and validated measurement instruments for data collection. The DJI (Shenzhen, China) Inspire 1 quadcopter was used due to its reliability, GPS stabilization, and dual-controller configuration, which allowed the researcher to override participant inputs for safety. The aircraft’s onboard FPV camera, mounted on a three-axis gimbal, provided a stabilized 720p high-definition video feed at 60 frames per second. This live feed was transmitted via HDMI from the remote controller to either a Dell (Round Rock, TX, USA) 21-inch LCD monitor or a DJI (Shenzhen, China) FPV goggle headset, depending on the assigned condition. Both FPV displays had 1920 × 1080 resolution and 60 Hz refresh rates, offering consistent visual quality across treatments.
The experimental course was constructed outdoors on a flat, enclosed surface and consisted of two connected segments: a 100 ft (30 m) straight segment followed by a 50 ft (15 m) segment requiring a 90° right turn. The intended flight path was defined by a 40 in. (1.02 m) wide white vinyl centerline, bounded on each side by 40 in. (1.02 m) wide white-and-black checkered hazard zones, creating a visually constrained corridor for low-altitude manual flight. A diagram of the experimental course layout is presented in Appendix A. Participants were instructed to maintain flight along the centerline at an altitude between 4 and 7 ft (1.2–2.1 m) above ground level. Obstacles were positioned along the course to assess visual scanning and recall performance. White cardboard boxes (14 × 14 × 14 in.; 35.6 × 35.6 × 35.6 cm), placed on the centerline at 15 ft (4.57 m) intervals, served as potential balloon-release points to induce obstacle vigilance. Additional lateral obstacles constructed from cardboard boxes (approximately 2 × 2 × 4 ft; 0.61 × 0.61 × 1.22 m) were placed tangent to the centerline boxes on alternating sides of the flight path and marked with high-contrast fluorescent colors and pictograms. Supporting materials included vinyl sheeting, cardboard obstacles, and safety cones used during familiarization training. A stopwatch was used to record total flight time for each participant, and environmental conditions were maintained consistently across sessions to minimize external variability.
Four key instruments were used to collect data. The Ishihara Color Vision Test screened participants for color perception deficiencies that could influence visual recognition during flight. The Demographic Questionnaire gathered background information such as age, gender, prior sUAS or remote-control aircraft experience, and FAA certification status to describe the sample and identify potential covariates. The NASA-TLX measured subjective workload across six dimensions: mental, physical, and temporal demand, performance, effort, and frustration, yielding both subscale and composite workload scores. Finally, the Level 1 SA Assessment evaluated participants’ recall accuracy of obstacles encountered during the flight, including their number, color, position, and pictogram sequence (see Appendix B). The SA test provided an objective measure of perceptual awareness, scored on a 35-point scale.
3.3. Experimental Design and Procedure
Each participant attended a single experimental session lasting approximately 50 to 60 min. Upon arrival, participants received a briefing describing the study objectives, procedures, and safety protocols, followed by the completion of an informed consent form, a demographic questionnaire, and an Ishihara color vision test to confirm eligibility. Qualified participants then received standardized familiarization training to ensure a consistent baseline of flight proficiency before beginning the experimental task.
The familiarization training took place in a practice area adjacent to the main test site and introduced participants to the DJI Inspire 1 sUAS, its flight controls, and basic quadcopter aerodynamics. Participants were instructed on safety procedures and practiced maneuvering the aircraft through a marked corridor of traffic cones at low altitude. This practice flight allowed them to develop control precision and confidence while ensuring that all participants entered the experiment with comparable operational experience.
After training, each participant completed one experimental flight under one of the three assigned visual display conditions: (a) VLOS operation, (b) FPV using a 21-inch LCD monitor, or (c) FPV using immersive visual goggles. Flights were conducted within a controlled outdoor course consisting of two connected flight segments (100 ft and 50 ft in length).
Participants were instructed to complete the flight course as efficiently and safely as possible while maintaining obstacle awareness and responding appropriately to potential visual cues. Although participants were informed that balloon obstacles might be released from boxes on the course to simulate hazards, none were actually deployed; the anticipation served to sustain vigilance throughout the task. To ensure consistency, all participants operated from a fixed starting position, and the same flight instructions, course configuration, and environmental conditions were maintained across sessions.
Immediately after completing the flight, participants were escorted to a post-test area where they completed two assessments in sequence: the Level 1 SA Assessment and the NASA-TLX survey.
3.4. Data Analysis Process
Data were analyzed to examine the effects of visual display condition on two dependent variables: perceived workload and Level 1 SA. All statistical analyses were conducted using IBM SPSS Statistics (Version 27). Prior to formal hypothesis testing, data were screened for accuracy, missing values, and potential outliers using descriptive statistics and boxplots. Descriptive summaries were computed to characterize participant demographics and performance across the three experimental conditions: VLOS, FPV using a 21-inch LCD monitor, and FPV using immersive goggles.
Given the between-subjects design with three independent groups and continuous outcome measures, a one-way analysis of variance (ANOVA) was selected as the primary analytical framework. Two separate ANOVAs were conducted, one for NASA-TLX workload scores and one for Level 1 SA scores, because these measures represented conceptually and empirically distinct constructs rather than correlated dimensions of a single outcome. A multivariate approach (MANOVA) was initially considered; however, it was not utilized due to the absence of meaningful correlation between workload and SA measures, consistent with prior literature distinguishing these constructs.
Statistical assumptions relevant to parametric inference were evaluated using formal diagnostic procedures. Normality was assessed using Shapiro–Wilk tests and visual inspection of Q–Q plots, and homogeneity of variances was examined using Levene’s test. These diagnostics were applied to support model-based inference instead of reliance on visual inspection of raw-score histograms alone, which were used solely for exploratory visualization. When the assumption of variance homogeneity was violated, Welch’s ANOVA was utilized to provide a more robust test of group differences. Identified outliers were examined for potential measurement error or procedural anomalies before determining whether exclusion was warranted.
When omnibus ANOVA results indicated a statistically significant main effect (α = 0.05), post hoc pairwise comparisons were conducted using Tukey’s Honestly Significant Difference (HSD) test to identify specific between-group differences. Effect sizes were calculated using eta squared (η2) for all omnibus tests to support magnitude-based interpretation beyond p-values, with benchmarks of 0.01 (small), 0.06 (medium), and 0.14 (large). To contextualize inference given the modest sample size, a post hoc sensitivity analysis was conducted to estimate the minimum detectable effect size, clarifying the interpretive bounds of non-significant findings.
Although the primary analytical framework relied on parametric ANOVA, alternative analytical approaches were explicitly evaluated for suitability given the dataset characteristics. Nonparametric methods (e.g., Kruskal–Wallis tests) were considered but not adopted because the study hypotheses concerned mean differences in workload and Level 1 SA rather than rank-based comparisons, and diagnostic checks indicated approximately normal residual distributions across conditions. Robust parametric approaches were partially implemented; when the assumption of homogeneity of variance was violated, Welch’s ANOVA was used to mitigate sensitivity to unequal variances. Additional robust methods based on trimmed means were evaluated but offered limited interpretive advantage given the small and balanced group sizes. Bayesian estimation approaches were also considered. However, the limited sample size and absence of well-established prior distributions for FPV effects in civil sUAS operations would have rendered posterior estimates highly prior-sensitive, reducing interpretive clarity. Accordingly, a frequentist framework supplemented with assumption diagnostics, effect size estimation, and post hoc sensitivity analysis was selected as the most appropriate and transparent approach for the present data.
The reliability and validity of the measurement instruments were supported through prior validation evidence and standardized scoring procedures. The NASA-TLX has been extensively validated in aviation and human factors research as a reliable measure of subjective workload. The Level 1 SA assessment was scored using a predefined rubric derived from established SA research, ensuring consistency across participants. Results are reported using means, standard deviations, F-statistics, p-values, and effect sizes, with confidence intervals provided where appropriate for statistical precision.
4. Results
Statistical analyses were performed to examine variability among the three experimental groups. Separate ANOVAs were conducted for the two dependent variables, perceived workload and SA, as prior research indicates they represent distinct constructs [47,48,49]. Additional exploratory analyses were conducted using event data from the ASRS database, focusing on reports where the primary aircraft was a UAS.
4.1. Demographic Results
An initial demographic survey was administered to verify participant eligibility for the study. The sample size of this study consisted of 24 adults, with eight participants randomly assigned to three equal groups. All participants were at least 18 years old, comprising 17 males and seven females. Twenty participants were university students, while four were members of a Navy helicopter squadron based in Jacksonville, Florida. Table 2 presents the age and gender distribution for each participant group.
Table 2.
Age and Gender Demographics by Group.
Half of the participants (12, 50%) reported prior sUAS flight experience, and nine (37.5%) had experience flying radio-controlled aircraft. Their radio-controlled aircraft (RCA) flying experience ranged from 1 (low) to 7 (high) on a Likert scale, with a mean score of 1.41. Seven participants (29.1%) held a current Part 107 Remote Pilot Certificate, 16 (66.6%) held a Private Pilot Certificate, and five (20.8%) possessed FAA airplane category certificates, including Private, Commercial, CFI, CFII, or Airline Transport Pilot (ATP). Additionally, 13 participants (54.1%) identified as active computer gamers. Participants reported computer gaming experience ranging from 0 to 17.5 h per week, with an average of 3.23 h.
4.2. Descriptive Statistics
Descriptive statistics were calculated for the experiment participants’ NASA-TLX questionnaire scores and SA test scores, reflecting the participants’ perceived workload and Level 1 SA during their sUAS flight on the flight course, presented in Table 3. The participants’ total time to navigate the flight course ranged from 33 to 142 s with a mean time of 83.96 s (SD = 31.56).
Table 3.
Descriptive Statistics of the NASA-TLX and SA Tests Results. { TC “18 Descriptive Statistics of the NASA-TLX and SA Tests Results” \f A \l “1” }.
NASA-TLX Questionnaire and Situational Awareness Scores
Following each flight, participants completed the NASA-TLX assessment and an SA test measuring Level 1 SA. Weighted NASA-TLX scores ranged from 25.67 to 82.67 (M = 57.38, SD = 13.94), while SA test scores ranged from 4 to 31 (M = 13.58, SD = 5.46). The frequency distribution of participants’ weighted NASA-TLX scores is presented in Figure 1, while the distribution of their SA scores is shown in Figure 2. The histograms presented are provided for descriptive and exploratory purposes to illustrate variability and distributional shape within each group. Formal hypothesis testing was based on assumption diagnostics of model residuals.
Figure 1.
Weighted NASA-TLX Questionnaire Score Frequencies.
Figure 2.
SA Test Score Frequencies.
4.3. Hypothesis Testing—Perceived Workload
One-way ANOVAs were conducted to test Hypotheses 1–3, which examined the effect of three visual acuity techniques on participants’ perceived workload, as measured by the NASA-TLX during sUAS flight. Two separate one-way ANOVAs were performed for H1: the first included all participants, while the second excluded two outliers identified in the VLOS group for the NASA-TLX weighted scores.
4.3.1. ANOVA for NASA-TLX Weighted with Outliers
Results from the one-way ANOVA indicated that mean NASA-TLX weighted scores increased across the treatment groups from GOGS (M = 56.02, SD = 19.17) to LCD (M = 57.04, SD = 12.04) to VLOS (M = 59.08, SD = 10.94). However, as shown in Table 4, these differences in perceived workload among the three visual acuity techniques were not statistically significant, F(2, 21) = 0.092, p = 0.912. The associated effect size was negligible (η2 = 0.009), indicating that treatment group assignment accounted for less than 1% of the variance in NASA-TLX scores.
Table 4.
One-Way ANOVA Statistics for the NASA-TLX Results.
4.3.2. Welch ANOVA for NASA-TLX Weighted Without Outliers
Two outliers were removed from the VLOS group prior to analysis. Data for each treatment group were normally distributed according to the Shapiro–Wilk test (p > 0.05). However, the assumption of homogeneity of variances was violated, as indicated by Levene’s test (p = 0.023); therefore, a Welch ANOVA was performed. Results indicated that mean NASA-TLX weighted scores increased from the GOGS group (M = 56.02, SD = 19.17) to the LCD group (M = 57.04, SD = 12.04) to the VLOS group (M = 59.22, SD = 3.58), but these differences were not statistically significant, Welch’s F(2, 10.63) = 0.197, p = 0.824.
Both ANOVA tests, conducted with and without the removal of outliers, revealed no statistically significant differences in NASA-TLX weighted scores among the three visual acuity techniques used for sUAS flight. Consequently, the results did not support Hypotheses 1, 2, or 3.
4.4. Hypothesis Testing—Situational Awareness
One-way ANOVAs were also conducted to test Hypotheses 4–6, which examined the effect of three visual acuity techniques on participants’ Level 1 SA as measured by the administered SA test. Inspection of box plots for SA test scores revealed an outlier in the VLOS group. Accordingly, two ANOVAs were performed: the first included the outlier, and the second was conducted after its removal.
4.4.1. ANOVA for SA Test Scores with Single VLOS Group Outlier Included
A Shapiro–Wilk test confirmed that data for each treatment group were normally distributed (p > 0.05), and Levene’s test indicated that the assumption of homogeneity of variances was satisfied (p = 0.627). Table 5 presents the ANOVA results, which show that mean SA test scores increased from the LCD group (M = 12.13, SD = 4.19) to the GOGS group (M = 13.88, SD = 4.52) to the VLOS group (M = 14.75, SD = 7.48). However, these differences among visual acuity techniques were not statistically significant, F(2, 21) = 0.457, p = 0.640. The associated effect size was small (η2 = 0.037), indicating that visual acuity technique accounted for approximately 3.7% of the variance in SA test scores.
Table 5.
ANOVA Statistics for SA Test Results with VLOS Outlier Included.
4.4.2. ANOVA for SA Test Results with the Single VLOS Group Outlier Removed
The outlier identified, the highest SA score in the VLOS group, was removed prior to this analysis. However, its removal revealed a new outlier, the lowest value in the same group, which was also excluded before conducting the ANOVA. Data for each treatment group were normally distributed according to the Shapiro–Wilk test (p > 0.05), and Levene’s test confirmed homogeneity of variances (p = 0.399). The ANOVA results (Table 6) indicated that mean SA scores increased from the LCD group (M = 12.13, SD = 4.19) to the VLOS group (M = 13.67, SD = 2.25) to the GOGS group (M = 13.88, SD = 4.52). However, these differences were not statistically significant, F(2, 21) = 0.463, p = 0.636. The associated effect size was small (η2 = 0.047), indicating that visual acuity technique accounted for approximately 4.7% of the variance in SA scores.
Table 6.
ANOVA Statistics for SA Test Results without VLOS Outlier. { TC “26 ANOVA Statistics for SA Test Results without VLOS Outlier” \f A \l “1” }.
Consistent with the initial analysis including outliers, both ANOVA tests, conducted with and without outlier removal, showed no statistically significant differences in SA performance among the three visual acuity techniques. Therefore, the results did not support Hypotheses 4, 5, or 6. Given the modest sample size, the analytical strategy was designed to detect large effects while minimizing false inference from distributional violations. The observed effect sizes for both workload and Level 1 SA were substantially smaller than the minimum detectable threshold, indicating no evidence of large effects under the tested conditions rather than confirming equivalence across visual modalities.
4.5. Post Hoc Sensitivity Analysis
To contextualize the non-significant findings, a post hoc sensitivity analysis was conducted using G*Power (Version 3.1.9.7) to determine the minimum effect size detectable with the present sample. For a one-way ANOVA with three groups, α = 0.05, power = 0.80, and N = 24, the analysis indicated that the study was sufficiently powered to detect only large effects (Cohen’s f = 0.68), corresponding to η2 = 0.32.
The observed effect sizes for both perceived workload (η2 = 0.009) and Level 1 SA (η2 ≤ 0.047) were substantially smaller than this threshold. Accordingly, while the analyses revealed no statistically significant differences among visual conditions, the results should be interpreted as indicating no evidence of large effects, rather than confirming equivalence across conditions. Smaller effects cannot be ruled out and warrant investigation with larger samples.
4.6. ASRS Data Analysis
The preliminary experiment provided a foundation for comparison with a secondary dataset retrieved from the ASRS database. This analysis examined event reports involving UAS and compared those citing situation awareness as a causal factor to those that did not. A database search for reports containing “UAS” or “UAV” within the narrative or synopsis fields returned 754 submissions dated between July 2002 and September 2022. The dataset, downloaded in Microsoft Excel format, was filtered to include only cases where the “Make Model Name” field identified the primary aircraft as a UAS. This field contained 32 unique identifiers (e.g., “DJI Spark,” “Skydio 2,” “Large UAS, Fixed Wing,” “UAV-Unpiloted Aerial Vehicle”). After removing 27 reports with incomplete data, 257 valid UAS event reports (34%) remained for categorical analysis. The remaining 497 reports (66%) involved manned aircraft encountering UAS during operations.
4.6.1. Frequency of Reported Events by Year
As shown in Figure 3, UAS-related reports in the ASRS database have steadily increased since the first recorded event in 2007. A notable rise occurred between 2014 and 2016, coinciding with the FAA’s implementation of Part 107 operational rules in 2016, which expanded authorized UAS activity across the U.S.
Figure 3.
Frequency of Reported Events by Year. Note: Last report depicted from September 2022.
4.6.2. Reported Events by Altitude
Approximately 92% of event reports included altitude data, as presented in Figure 4. Of these, 66.4% occurred at or below 400 feet, consistent with typical small UAS operating limits, while 13.6% were reported above 10,000 feet, suggesting potential incursions into controlled airspace or encounters with manned aircraft.
Figure 4.
Frequency of Reported Events by Altitude. Note: Event reports with the altitude omitted from the report are categorized as unreported.
4.6.3. Reported Events by Time of Day and Mode of Operation
Most reported UAS operations occurred during daylight hours, accounting for approximately 76% of all events, while night operations represented 18.3% and 5.8% of reports did not specify the time of day. The majority of events (around 75%) were conducted under VLOS conditions, with the remaining 25% occurring BVLOS. Among BVLOS flights, 60.6% took place during daylight and 34.8% at night, whereas for VLOS operations, 81.2% occurred during daylight and 9.4% at night. BVLOS activity was most frequent between 1201 and 1800, while VLOS operations were more common between 0601 and 1200.
Workload Comparison: BVLOS vs. VLOS. As shown in Figure 5, workload was identified as a contributing human factor in 5.2% of VLOS event reports and 10.6% of BVLOS event reports within the 257-report dataset. This suggests workload was cited roughly twice as often in BVLOS operations compared to VLOS.
Figure 5.
Workload Comparison: BVLOS and VLOS. Note: BVLOS = beyond visual line of sight. VLOS = visual line of sight.
4.6.4. Reported Events by Human Factor Elements
The ASRS categorizes ten primary human factor elements including: workload, SA, communication breakdown, training/qualification, HMI, time pressure, distraction, confusion, fatigue, and other/unknown. Figure 6 illustrates the distribution of these factors among the 257 UAS event reports analyzed. Within this dataset, 143 reports identified SA as a contributing or causal factor. The additional human factor elements that co-occurred within this SA-related subset highlight overlapping influences such as workload, communication, and distraction.
Figure 6.
Human Factor Elements. Note: Data labels for each human factor element indicate percentage of element within the dataset of 257 reports.
4.7. ASRS Dataset Comparison Analysis—Situational Awareness Subset
A comparison analysis was conducted on event reports from the ASRS dataset in which the primary aircraft was identified as a UAS, focusing on differences between reports that did and did not cite SA as a causal factor. The aim was to examine event characteristics and identify factors that were either common or unique to each group.
4.7.1. Chi-Square Analysis
Chi-square tests were conducted to compare characteristics of reported events that identified SA as a causal factor with those that did not. Of the 257 total reports analyzed, 143 (55.6%) listed SA as a causal factor.
A statistically significant association was found between the region of the reported event and whether SA was identified as a causal factor, χ2(7) = 18.229, p = 0.011. However, because five cells (31.3%) had expected counts below five, this violated one of the assumptions of the chi-square test, limiting the robustness of this result.
4.7.2. Comparison by Operator: SA Listed as Causal Factor
Event reports were categorized by operator type: military, government, commercial, and recreational, with reports lacking this information classified as undisclosed (28 of 257). Figure 7 presents the distribution of events by operator, grouped by whether SA was identified as a causal factor. The majority of reports across most operator categories listed SA as a causal factor, except for government and recreational operations. In these two categories, approximately 60% (government) and 64% (recreational) of event reports did not identify SA as a causal factor.
Figure 7.
Reported Events by Operator; SA Listed as a Causal Factor. Note: Subset of 257 event reports where the primary aircraft is listed as a UAS. The NO column depicts the event reports where SA was not listed as a causal factor. The YES column depicts the event reports where SA was listed as a causal factor.
4.7.3. Comparison by Time of Day and Mode of Operation: SA Listed as a Causal Factor
Most events occurred during daylight hours (0601–1800), with night operations representing a similar proportion between the two groups: 18.5% of reports without SA listed as a causal factor, and 18.9% of those where SA was cited. Of the 257 total events analyzed, approximately 74% involved VLOS operations, while the remaining were BVLOS. SA was identified as a causal factor in 53% of BVLOS events and 56.5% of VLOS events.
Across both operation types, SA emerged as the leading human factor, appearing in 30.2% of BVLOS and 36% of VLOS reports. For BVLOS events, communication breakdowns (19%) and confusion (18.1%) were the next most frequent contributing factors. In contrast, for VLOS operations, confusion (18.3%) and training deficiencies (16%) followed SA. Notably, training issues were cited far less frequently under BVLOS conditions (1.7%) than during VLOS operations.
4.7.4. Association Between Region and SA as a Causal Factor
To address low expected frequencies in the initial chi-square analysis, the region variable was recategorized into disclosed and undisclosed groups. After this adjustment, all expected cell counts exceeded five, and a significant association was found between region disclosure and SA being listed as a causal factor: χ2(1) = 13.865, p < 0.001 (Figure 8).
Figure 8.
Chi-square Test of Association; SA and Region. Note: Event reports with the state of occurrence listed within the event report are categorized as disclosed. Event reports with the state of occurrence omitted from the event report are categorized as undisclosed.
Further testing by individual regions revealed no statistically significant associations, suggesting the overall effect was driven by the large number of undisclosed reports (161 of 257). When analyzed separately, the undisclosed subset showed a significant relationship between time pressure and SA, χ2(1) = 8.054, p = 0.005.
4.8. Characteristics of Disclosed vs. Undisclosed Reports
The omission of state information in 161 reports prompted a deeper comparison between disclosed and undisclosed submissions. Most reports cited SA as a causal factor, except for government (31.4%) and recreational (31.2%) operations. Commercial operator reports were nearly balanced, with 48% identifying SA as a factor. Among the 95 reports that did include the state of occurrence, SA was listed as a causal factor across most operator categories.
5. Discussion
The rapid expansion of sUAS operations within the NAS presents persistent challenges in balancing human and autonomous system performance. As automation and traffic management frameworks evolve, human operators remain integral to ensuring equivalent levels of safety, particularly regarding workload and SA [17,50]. This study investigated how different FPV visual techniques, including VLOS, FPV via LCD screen, and FPV via immersive goggles, affect sUAS operator workload and Level 1 SA. Findings showed no statistically significant differences among the groups for either variable. Complementary analysis of the ASRS database further contextualized experimental findings within operational settings. Within this dataset, SA emerged as the most frequently cited causal factor among all identified human factor elements.
5.1. Workload in FPV and VLOS Operations
Perceived workload, conceptualized by Hart and Staveland [16] as the mental cost incurred to achieve task performance, indicated no statistically significant differences across the three experimental conditions. Participants’ NASA-TLX scores indicated that operating with FPV goggles or LCD monitors neither increased nor reduced perceived workload relative to VLOS control. This suggests that FPV technologies, as evaluated in this study, maintain comparable cognitive demand to traditional visual flight. The results align with Rebensky [51], who observed no workload differences between FPV configurations that either separated or combined flight parameter displays. These convergent findings suggest that workload during sUAS operation may depend more on task characteristics than on display modality. All participants faced identical environmental demands, navigating the same obstacle-dense course at a fixed altitude, resulting in a uniform cognitive load regardless of visual method.
One plausible explanation for the absence of workload differences across FPV configurations is the use of compensatory attentional strategies by operators. When confronted with changes in visual modality or field of view, operators may dynamically reallocate attentional resources, adjust control strategies, or modify visual scanning behavior to maintain task performance without incurring additional perceived workload. In the present study, participants were able to adapt to each visual condition while navigating a standardized obstacle-dense course, suggesting that attentional compensation may have mitigated differences in display characteristics before they manifested as measurable changes in subjective workload.
Analysis of ASRS data reinforced these findings. Workload appeared as a causal human factor in only 6.6% of 257 UAS event reports, the third least frequent human factor category after fatigue and other/unknown factors. Although slightly higher in BVLOS operations (10.6%) than in VLOS (5.2%), the difference was minor and statistically insignificant. These findings collectively indicate no evidence that system automation or FPV implementation inherently elevates operator workload during routine sUAS missions. However, previous studies caution that automation’s benefits may diminish under abnormal or emergency conditions [52,53].
The relatively moderate NASA-TLX scores observed across all conditions (M = 57.38, SD = 13.94) also suggest the possibility of a partial floor effect, where the task demands may not have been sufficient to elicit large differences in perceived workload between visual modalities. While the flight environment imposed spatial precision requirements through constrained corridor geometry and frequent obstacle monitoring, the short task duration and controlled dynamics likely limited the escalation of subjective workload. Under such conditions, differences attributable to display modality may be attenuated, compressing between-group variability. Consequently, the absence of statistically significant workload differences should be interpreted as no evidence of large effects under the present task demands, rather than as definitive equivalence across visual conditions.
5.2. Situation Awareness Under FPV Conditions
Level 1 SA, perception of environmental elements, also revealed no statistically significant differences among the three visual conditions. Participants using FPV goggles or monitors achieved recall accuracy equivalent to those operating via direct VLOS. Despite the narrower electronic FOV (85–94°) compared to human binocular vision (~180°) [54,55], this reduction did not measurably degrade environmental perception.
The absence of significant differences in Level 1 SA across FPV configurations may reflect a degree of perceptual invariance under the tested conditions. Although FPV displays differ in immersion and field of view, operators may maintain comparable perceptual awareness by adjusting visual scanning patterns and selectively prioritizing task-relevant cues. In obstacle-dense but structured environments, salient visual information may remain sufficiently centralized within the operator’s field of regard, allowing effective perception of hazards regardless of display modality. From a SA perspective, this suggests that Level 1 SA may remain robust across FPV configurations when perceptual demands are predictable and time-critical decision thresholds are not exceeded.
Measurement characteristics may also have contributed to the observed null effects in Level 1 SA. Post-task SA assessments capture aggregated perceptual awareness but may not fully reflect transient lapses or moment-to-moment attentional shifts that occur during dynamic flight. If participants maintained consistently high perceptual awareness across conditions, ceiling effects may have constrained observable variance, limiting sensitivity to display-related differences. Moreover, subtle perceptual trade-offs, such as reduced peripheral awareness offset by increased central focus, may not translate into measurable differences on post-task SA instruments, particularly in short-duration or well-structured tasks. These considerations suggest that FPV configuration effects on Level 1 SA may become more apparent under prolonged exposure, increased visual clutter, or time-critical detection demands.
This outcome suggests that FPV devices provide adequate spatial and contextual cues for maintaining SA. The finding also indicates that the limiting factor may not be display technology but rather the cognitive mechanisms underlying attention allocation and fixation. Operators in all groups faced identical central task demands, maintaining flight stability and obstacle avoidance, likely channeling visual focus toward the aircraft and immediate hazards, yielding similar SA outcomes.
5.3. Visual Attention, Fixation, and Useful Field of View
Across all groups, cognitive load may have constrained the useful field of view (UFOV), defined as the area from which relevant information can be extracted without head or eye movement [56]. Prior research indicates that increased central task demands are associated with attentional narrowing and reduced peripheral detection [57,58,59,60]. Although visual attention was not directly measured in this study, established models of attentional allocation provide a plausible explanation for the observed uniformity in SA across visual conditions.
In this context, participants’ concentration on maintaining aircraft trajectory may have reduced sensitivity to peripheral obstacles, compressing between-group differences in recall performance. Mackworth [61] described this attentional narrowing as cognitive “tunnel vision,” a protective mechanism that limits sensory overload under high task demand. Given the consistency of task difficulty across conditions, it is plausible that similar levels of attentional narrowing occurred in all groups, thereby neutralizing any potential visual-modality advantage.
5.4. ASRS Data Interpretation
The ASRS dataset provided a valuable real-world operational comparison to the controlled experiment. Within 257 UAS event reports, SA emerged as the most prevalent human factor, reinforcing the centrality of perception and awareness in sUAS safety. The frequency of SA citations was similar across VLOS and BVLOS operations, mirroring the experimental results showing no performance difference among visual modalities.
Chi-square analysis revealed a significant association between report region and SA listing (p < 0.05), but further regional isolation tests found no single region driving this relationship. Notably, 161 reports lacked geographic identifiers, and SA was more frequently cited in reports where the location was disclosed. This discrepancy suggests potential underreporting or selective omission, possibly due to concern about regulatory consequences, a known limitation of self-report systems [62,63].
Both experimental and field data suggest no evidence of FPV implementation altering operator workload or SA under typical sUAS mission parameters. The findings of this study suggest that the human cognitive system, rather than the visual interface, may be the primary perception contrariant during teleoperation. sUAS operators appear to adapt to FPV visual inputs efficiently, maintaining equivalent awareness despite narrower FOV. This insight reinforces Endsley’s [14] three-level model of SA, highlighting perception (Level 1 SA) as the foundation upon which comprehension and projection develop, and suggests that perceptual awareness in UAS operations is constrained more by fixation control and information-processing limits rather than by display format.
5.5. Implications for HMI, Training, and Operations
This study and results inform interface design, training, and operational planning for routine and transitional sUAS operations but should be viewed as delimiting, rather than universally characterizing, FPV-related human performance effects across the full spectrum of UAS missions. The systems-level and operational implications of these findings are bounded by the conditions under which the study was conducted and should be interpreted accordingly. The results are most applicable to operators with foundational sUAS training and limited to moderate levels of operational experience, performing structured, short-duration flight tasks that emphasize continuous manual control rather than high-tempo supervisory decision-making. Under these conditions, operators appear capable of compensating for differences in FPV display configuration without measurable degradation in workload or Level 1 situational awareness.
With respect to task demands and environmental complexity, the findings apply primarily to visually structured, obstacle-dense environments that do not impose extreme time pressure, degraded visual quality, or concurrent mission demands. The absence of FPV-related performance differences should not be assumed to generalize to operations involving extended mission duration, dynamic or unpredictable hazards, degraded sensing (e.g., low contrast, latency, or visual clutter), or higher levels of automation coupling typical of advanced BVLOS operations. In such contexts, compensatory strategies may be insufficient, and FPV configuration effects on perceptual access, workload, and situational awareness may emerge more clearly.
5.6. Theoretical and Practical Significance
The findings of this study contribute to the growing body of human factors-focused literature in unmanned aircraft operations by highlighting the relationship between central task demand, fixation behavior, and SA. Differences between FPV configurations are more likely to emerge under higher workload conditions, increased environmental complexity, degraded visual quality, extended mission duration, or time-critical hazard detection scenarios where compensatory strategies may be insufficient. Under such conditions, constraints on perceptual access and attentional resources may become more pronounced, allowing display-related effects on workload and situational awareness to manifest more clearly. Theoretically, this study extends existing SA frameworks [14] by emphasizing the role of visual attention in constrained operating environments, where increased task demand narrows the UFOV and creates cognitive tunnel vision.
Practically, FPV techniques offer significant benefits to human performance in unmanned operations. By providing real-time visual feedback of the aircraft’s environment, FPV enhances an operator’s sense of presence [64], which may reduce response time and improve decision-making efficiency without increasing workload. The results suggest that FPV systems could facilitate safe, immersive BVLOS operations if properly integrated into HMI design. As BVLOS operations advance within the FAA’s regulatory framework, human factors considerations, particularly related to visual cognition and workload, should be a key focus to defining operational performance criteria.
6. Conclusions
This study examined the effects of FPV techniques on sUAS operator workload and Level 1 SA. Participants operated a sUAS using three visual modalities, including VLOS, FPV via LCD monitor, and FPV via immersive goggles. Quantitative analysis revealed no statistically significant differences in operator workload or SA among the three visual conditions. These findings indicate that FPV techniques, whether through LCD or goggles, may neither increase cognitive workload nor degrade perceptual awareness relative to VLOS operation. The analysis of ASRS data identified SA as the most frequently reported human factor in UAS incidents, while workload appeared infrequently. Collectively, these results suggest that FPV methods may be able to provide immersive operational advantages without imposing additional cognitive burden on operators, thereby supporting their integration in both VLOS and BVLOS operations.
6.1. Limitations of the Study
While the study yielded important insights, several limitations constrain the generalizability of the results. The controlled flight course, situated within a restricted environment, lacked the dynamic complexity and air traffic variability characteristic of real-world NAS operations. As a result, the findings may not fully capture the effects of high-density traffic, evolving hazards, or unpredictable environmental conditions on operator SA and workload. All obstacles in the experiment were static and visible prior to flight, potentially allowing brief pre-exposure that could have influenced participants’ situational recall. Future experiments should incorporate dynamic obstacles, delayed visual introduction, or unanticipated hazard presentation to better simulate operational unpredictability.
A further limitation relates to the measurement of Level 1 SA using post-task recall. Although recall-based assessments are commonly employed in SA research, they are susceptible to memory-related effects, particularly as task duration and complexity vary. In the present study, the relatively short flight duration likely minimized memory decay, enabling participants to rely heavily on short-term or working memory when completing the recall task. While this design choice supported isolation of perceptual exposure, it may have reduced sensitivity to subtle or cumulative differences in sustained SA across visual conditions. Under these short-duration, low-decay conditions, between-group variability in recall performance may have been compressed, potentially masking perceptual differences that could emerge during longer or more cognitively demanding missions. Additionally, the moderate workload levels observed suggest a potential floor effect, where short task duration and controlled dynamics may have reduced sensitivity to workload differences that could emerge under more demanding or prolonged operational conditions.
The sample was limited in size and drawn primarily from a university population, which restricts generalization to broader sUAS operator communities with more diverse experience levels and operational profiles. The modest sample size constrained statistical power and sensitivity to small or moderate effects, such that non-significant results should be interpreted as indicating no evidence of large effects rather than as proof of equivalence across conditions. Although random assignment and standardized procedures were used, potential group heterogeneity and individual differences may have contributed to unexplained variance. In addition, empirical distributions may exhibit irregular or non-Gaussian characteristics, reinforcing the need for robustness-oriented inference. While assumption diagnostics supported the use of parametric methods, the selected analytical framework necessarily potentially constrains interpretation of null findings. Alternative approaches, such as Bayesian estimation, may be better suited for future studies with larger samples or stronger prior information. Accordingly, the present findings should be interpreted as bounding the plausible magnitude of FPV effects rather than excluding the existence of more subtle performance differences.
Finally, the ASRS data used in the secondary analysis may contain inherent reporting biases due to its voluntary nature and incomplete submissions. Geographic omissions and underreporting of certain human factor categories may further distort interpretations of workload and SA patterns in real-world operations.
6.2. Recommendations and Future Research
Findings from this research underscore that workload and SA in sUAS operations may depend more on cognitive mechanisms than on display type. Policymakers and original equipment manufacturers (OEMs) should prioritize research into the cognitive and physiological limits of operator perception to inform HMI design and automation standards. Interfaces that dynamically adapt to an operator’s cognitive state, such as reducing information density under high workload conditions, could improve safety and performance. Examples from manned aviation, such as the Garmin 1000 Primary Flight Display, demonstrate how adaptive display logic can focus pilot attention on critical flight parameters during abnormal conditions [65].
Future studies should expand on this work by incorporating eye-tracking and neurophysiological metrics to directly assess fixation, attention, and workload distribution. Experiments using simulation software could also enable controlled manipulation of task complexity and obstacle dynamics while minimizing logistical constraints. Investigations could explore if reductions in UFOV are symmetrically distributed across the operator’s peripheral vision and how cognitive load influences that balance. Additionally, future research could examine SA and workload across various operational contexts using both ASRS and FAA UAS Sightings databases to strengthen understanding of real-world risks.
Alternative analytical approaches could be employed in future studies to better accommodate small-sample or heterogeneous datasets. Nonparametric methods (e.g., Kruskal–Wallis tests) may provide robustness to distributional violations, while robust ANOVA techniques or Bayesian estimation frameworks could yield richer uncertainty characterization and probabilistic effect estimates. Mixed-effects models may also be appropriate for repeated or hierarchical designs not present in the current study.
Establishing standardized proficiency evaluations for sUAS operators, similar to flight reviews in manned aviation, could also help ensure consistent safety performance. As the UAS industry expands, defining the minimum skills and human factors competencies necessary for safe BVLOS operation will be vital to maintaining the equivalent level of safety expected across all aviation domains.
Author Contributions
Conceptualization, R.S.J. and D.T.; Methodology, R.S.J. and D.T.; Software, R.S.J.; Validation, R.S.J. and D.T.; Formal analysis, R.S.J. and D.T.; Investigation, R.S.J.; Resources, D.T. and B.D.P.; Data curation, R.S.J.; Writing—original draft, R.S.J.; Writing—review and editing, R.S.J., D.T. and B.D.P.; Visualization, R.S.J. and B.D.P.; Supervision, D.T.; Project administration, D.T. All authors have read and agreed to the published version of the manuscript.
Funding
This research received no external funding.
Institutional Review Board Statement
The study was conducted in accordance with the Declaration of Helsinki, and the protocol was approved by the Institutional Review Board(s) of Jacksonville University (#2015-024) on February 11, 2019, and of Embry-Riddle Aeronautical University (IRB #19-C201) on 6 February 2019.
Informed Consent Statement
Informed consent for participation was obtained from all subjects involved in the study.
Data Availability Statement
The data presented in this study are available on request from the corresponding author due to privacy considerations.
Conflicts of Interest
The authors declare no conflicts of interest.
Appendix A
Figure A1.
Experimental Course Diagram.
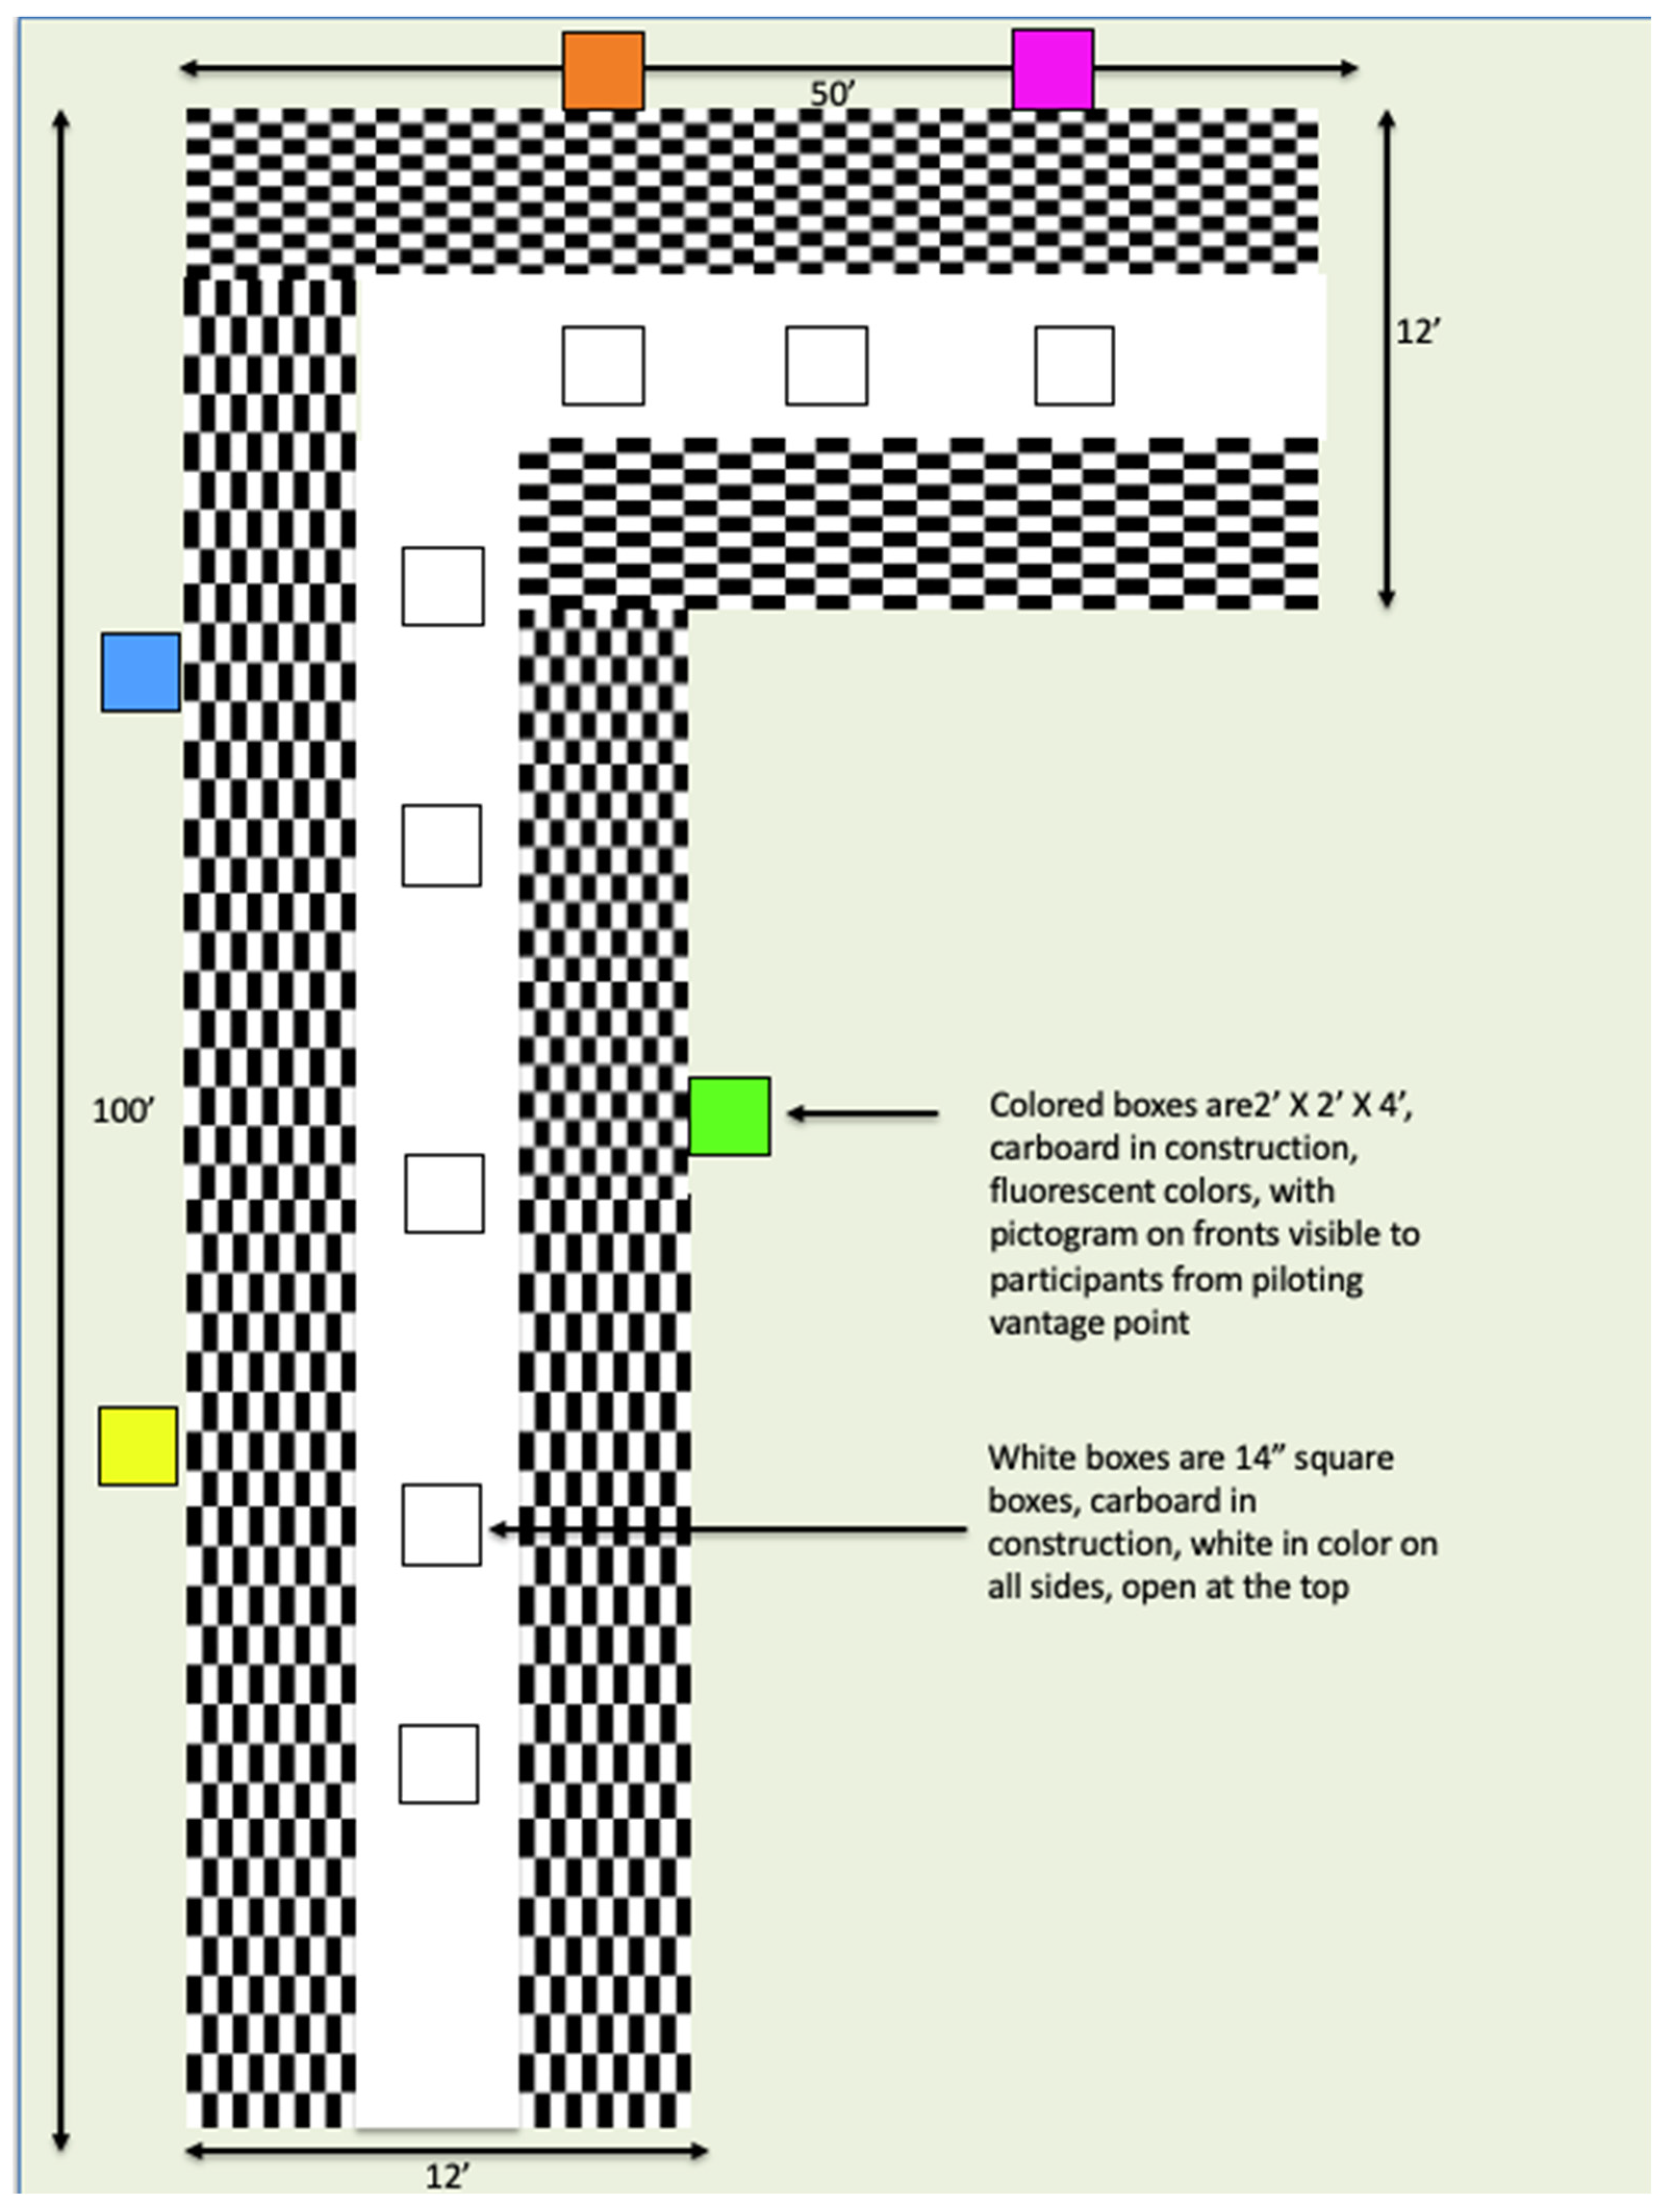
Appendix B
Figure A2.
Level 1 SA Assessment Diagram.

References
- Gertler, J. World Civil Unmanned Aerial Systems: 2022/2023 Market Profile and Forecast; Teal Group Co.: Fairfax, VA, USA, 2022; Available online: http://tealgroup.com/images/TGCTOC/WCUAS2023TOCEO.pdf (accessed on 12 October 2023).
- U.S. Department of Transportation. DOT and FAA Finalize Rules for Small Unmanned Aircraft Systems, 21 June 2016. Available online: https://www.transportation.gov/briefing-room/dot-and-faa-finalize-rules-small-unmanned-aircraft-systems (accessed on 8 November 2023).
- Schlag, C. The new privacy battle: How the expanding use of drones continues to erode our concept of privacy and privacy rights. Pittsburgh J. Technol. Law Policy 2013, 13, 1–22. [Google Scholar] [CrossRef] [Scilit]
- Gettinger, D.; Michel, A.H. Drone Sightings and Close Encounters: An Analysis; Center for the Study of the Drone at Bard College: Annandale-on-Hudson, NY, USA, 2015; Available online: http://dronecenter.bard.edu/files/2015/12/12-11-Drone-Sightings-and-Close-Encounters.pdf (accessed on 20 January 2024).
- Wallace, R.J.; Haritos, T.; Robbins, J. Building evidence the Federal Aviation Administration’s UAS safety strategy needs improvement. Int. J. Aviat. Aeronaut. Aerosp. 2018, 5, 10. [Google Scholar] [CrossRef] [Scilit]
- Federal Aviation Administration. Integration of Civil Unmanned Aircraft Systems (UAS) in the National Airspace System (NAS) Roadmap, 2nd ed.; FAA: Washington, DC, USA, 2017. Available online: https://www.faa.gov/sites/faa.gov/files/uas/resources/policy_library/Second_Edition_Integration_of_Civil_UAS_NAS_Roadmap_July%25202018.pdf (accessed on 30 June 2023).
- Woo, G.S.; Truong, D.; Choi, W. Visual detection of small unmanned aircraft systems: Modeling the limits of human pilots. J. Intell. Robot. Syst. 2020, 99, 933–947. [Google Scholar] [CrossRef] [Scilit]
- Federal Aviation Administration. Small Unmanned Aircraft System (Small UAS); Advisory Circular 107-2A; FAA: Washington, DC, USA, 2021. Available online: https://www.faa.gov/regulations_policies/advisory_circulars/index.cfm/go/document.information/documentID/1038977 (accessed on 10 April 2024).
- Betancourt, A.; Morerio, P.; Regazzoni, C.S.; Rauterberg, M. The evolution of first person vision methods: A survey. IEEE Trans. Circuits Syst. Video Technol. 2015, 25, 744–760. [Google Scholar] [CrossRef] [Scilit]
- Mailhot, C.B. Telepresence: What is it? Nurs. Manag. 1996, 27, 32I–32L. [Google Scholar] [CrossRef] [Scilit]
- Nagatani, K.; Kiribayashi, S.; Okada, Y.; Otake, K.; Yoshida, K.; Tadokoro, S.; Nishimura, T.; Yoshida, T.; Koyanagi, E.; Fukushima, M.; et al. Emergency response to the nuclear accident at the Fukushima Daiichi Nuclear Power Plants using mobile rescue robots. J. Field Robot. 2012, 30, 44–63. [Google Scholar] [CrossRef] [Scilit]
- Fern, L.; Kenny, C.A.; Shively, R.J.; Johnson, W. UAS integration into the NAS: An examination of baseline compliance in the current airspace system. In Proceedings of the Human Factors and Ergonomics Society Annual Meeting, Boston, MA, USA, 18 December 2012; Volume 56, pp. 41–45. [Google Scholar] [CrossRef] [Scilit]
- Stevenson, J.D.; O’Young, S.; Rolland, L. Beyond line of sight control of small unmanned aerial vehicles using a synthetic environment to augment first person video. Procedia Manuf. 2015, 3, 960–967. [Google Scholar] [CrossRef] [Scilit]
- Endsley, M.R. Measurement of situation awareness in dynamic systems. Hum. Factors 1995, 37, 65–84. [Google Scholar] [CrossRef] [Scilit]
- Endsley, M.R.; Garland, D.J. (Eds.) Situation Awareness Analysis and Measurement; CRC Press: Boca Raton, FL, USA, 2000. [Google Scholar] [CrossRef] [Scilit]
- Hart, S.G.; Staveland, L.E. Development of NASA-TLX (Task Load Index): Results of empirical and theoretical research. In Advances in Psychology; North-Holland: Amsterdam, The Netherlands, 1988; Volume 52, pp. 139–183. [Google Scholar] [CrossRef] [Scilit]
- Politowicz, M.S.; Chancey, E.T.; Glaab, L.J. Effects of autonomous sUAS separation methods on subjective workload, situation awareness, and trust. In AIAA Scitech 2021 Forum; AIAA: Reston, VA, USA, 2021; p. 1176. [Google Scholar] [CrossRef] [Scilit]
- Hobbs, A. Unmanned aircraft systems. In Human Factors in Aviation, 2nd ed.; Salas, E., Maurino, D., Eds.; Academic Press: Amsterdam, The Netherlands, 2010; pp. 505–531. [Google Scholar] [CrossRef] [Scilit]
- Endsley, M.R.; Jones, D.G. Designing for Situation Awareness: An Approach to User-Centered Design, 2nd ed.; CRC Press: Boca Raton, FL, USA, 2011. [Google Scholar] [CrossRef] [Scilit]
- Endsley, M.R. Toward a theory of situation awareness in dynamic systems. Hum. Factors 1995, 37, 32–64. [Google Scholar] [CrossRef] [Scilit]
- Endsley, M.R. Design and evaluation for situation awareness enhancement. In Proceedings of the Human Factors Society Annual Meeting, Chicago, IL, USA, 5–9 October 1988; Volume 32, pp. 97–101. [Google Scholar] [CrossRef] [Scilit]
- Wickens, C.D. Situation awareness and workload in aviation. Curr. Dir. Psychol. Sci. 2002, 11, 128–133. [Google Scholar] [CrossRef] [Scilit]
- Drury, J.L.; Scott, S.D. Awareness in unmanned aerial vehicle operations. Int. C2 J. 2008, 2, 1–10. [Google Scholar]
- Long, G.M.; Rourke, D.A. Training effects on the resolution of moving targets—Dynamic visual acuity. Hum. Factors 1989, 31, 443–451. [Google Scholar] [CrossRef] [Scilit]
- Nakatsuka, M.; Ueda, T.; Nawa, Y.; Yukawa, E.; Hara, T.; Hara, Y. Effect of static visual acuity on dynamic visual acuity: A pilot study. Percept. Mot. Ski. 2006, 103, 160–164. [Google Scholar] [CrossRef] [Scilit]
- Jun, H.Y. The Effect of Composite vs. First Person Perspective View in Real-World Telerobotic Operations. Master’s Thesis, Iowa State University, Ames, IA, USA, 2011. [Google Scholar]
- Ellis, S.R.; Stark, L. Statistical dependency in visual scanning. Hum. Factors 1986, 28, 421–438. [Google Scholar] [CrossRef] [Scilit] [PubMed]
- Long, G.M.; Crambert, R.F. The nature and basis of age-related changes in dynamic visual acuity. Psychol. Aging 1990, 5, 138–143. [Google Scholar] [CrossRef] [PubMed]
- Draper, M.H.; Viirre, E.S.; Furness, T.A.; Gawron, V.J. Effects of image scale and system time delay on simulator sickness within head-coupled virtual environments. Hum. Factors 2001, 43, 129–146. [Google Scholar] [CrossRef] [Scilit] [PubMed]
- Lintern, G. Transfer of landing skill after training with supplementary visual cues. Proc. Hum. Factors Ergon. Soc. Annu. Meet. 1979, 23, 301–304. [Google Scholar] [CrossRef] [Scilit]
- Fitts, P.M. The information capacity of the human motor system in controlling the amplitude of movement. J. Exp. Psychol. 1954, 47, 381–391. [Google Scholar] [CrossRef] [Scilit]
- Accot, J.; Zhai, S. Beyond Fitts’ law: Models for trajectory-based HCI tasks. In Proceedings of the SIGCHI Conference on Human Factors in Computing Systems, Atlanta, GA, USA, 22–27 March 1997; ACM: New York, NY, USA, 1997; pp. 295–302. [Google Scholar] [CrossRef] [Scilit]
- Ruff, H.A.; Narayanan, S.; Draper, M.H. Human interaction with levels of automation and decision-aid fidelity in the supervision of multiple simulated unmanned air vehicles. Presence 2002, 11, 335–351. [Google Scholar] [CrossRef] [Scilit]
- Cummings, M.L.; Mitchell, P.J. Operator scheduling strategies in supervisory control of multiple UAVs. Aerosp. Sci. Technol. 2007, 11, 339–348. [Google Scholar] [CrossRef] [Scilit]
- Wickens, C.D.; Hollands, J.G. Engineering Psychology and Human Performance, 3rd ed.; Prentice Hall: Upper Saddle River, NJ, USA, 2000. [Google Scholar]
- Sheridan, T.B. Telerobotics, Automation, and Human Supervisory Control; MIT Press: Cambridge, MA, USA, 1992. [Google Scholar]
- Right-of-Way Rules: Except Water Operations. Title 14 C.F.R. §91.113. 2004. Available online: https://www.ecfr.gov/current/title-14/chapter-I/subchapter-F/part-91/subpart-B/section-91.113 (accessed on 5 May 2024).
- Williams, K.W.; Gildea, K.M. A Review of Research Related to Unmanned Aircraft System Visual Observers; FAA Civil Aerospace Medical Institute: Oklahoma City, OK, USA, 2014. Available online: https://www.faa.gov/sites/faa.gov/files/data_research/research/med_humanfacs/oamtechreports/201409.pdf (accessed on 8 December 2024).
- Angelov, P. Sense and Avoid in UAS: Research and Applications; Wiley: Chichester, UK, 2012. [Google Scholar] [CrossRef] [Scilit]
- Clothier, R.A.; Williams, B.P.; Cox, K.; Hegarty-Cremer, S. Human see-and-avoid performance and its suitability as a basis for requirements for UAS detect-and-avoid systems. In Proceedings of the AIAA Aviation Technology, Integration, and Operations (ATIO) Conference, Denver, CO, USA, 5–9 June 2017; AIAA: Reston, VA, USA, 2017. [Google Scholar] [CrossRef] [Scilit]
- Hottman, S.B.; Hansen, K.R.; Berry, M. Literature Review on Detect, Sense, and Avoid Technology for Unmanned Aircraft Systems (DOT/FAA/AR-08/41); FAA: Washington, DC, USA, 2009.
- Parasuraman, R.; Riley, V. Humans and automation: Use, misuse, disuse, abuse. Hum. Factors 1997, 39, 230–253. [Google Scholar] [CrossRef] [Scilit]
- Duan, P.; Chen, D. Distributed cooperative path planning for multi-UAV in information-rich and dynamic environments. Drones 2025, 9, 38. [Google Scholar] [CrossRef] [Scilit]
- Zhang, S.; Li, Y.; Dong, Q. Autonomous navigation of UAV in multi-obstacle environments based on a deep reinforcement learning approach. Appl. Soft Comput. 2022, 115, 108194. [Google Scholar] [CrossRef] [Scilit]
- Chang, X.; Wang, J.; Li, K.; Zhang, X.; Tang, Q. Research on multi-UAV autonomous obstacle avoidance algorithm integrating improved dynamic window approach and optimal reciprocal collision avoidance. Sci. Rep. 2025, 15, 14646. [Google Scholar] [CrossRef] [Scilit]
- Debnath, D.; Vanegas, F.; Sandino, J.; Hawary, A.F.; Gonzalez, F. A review of UAV path-planning algorithms and obstacle avoidance methods for remote sensing applications. Remote Sens. 2024, 16, 4019. [Google Scholar] [CrossRef] [Scilit]
- Durso, F.T.; Hackworth, C.A.; Truitt, T.R.; Crutchfield, J.; Nikolic, D.; Manning, C.A. Situation Awareness as a Predictor of Performance for En Route Air Traffic Controllers (DOT/FAA/AM-99/3); FAA: Washington, DC, USA, 1999.
- Endsley, M.R. Situation awareness and workload: Flip sides of the same coin. In Proceedings of the International Symposium on Aviation Psychology, Columbus, OH, USA, 22–29 April 1993; Ohio State University: Columbus, OH, USA, 1993; Volume 2, pp. 906–911. [Google Scholar]
- Vidulich, M.A. The relationship between mental workload and situation awareness. In Proceedings of the Human Factors and Ergonomics Society Annual Meeting, San Diego, CA, USA, 30 July–4 August 2000; Volume 44, pp. 460–463. [Google Scholar] [CrossRef] [Scilit]
- Avanzini, G.; De Luca, V.; Pascarelli, C. Integrated platform for sUAS operations in sensitive areas with improved pilot situation awareness. In Proceedings of the IEEE Conference on Cognitive and Computational Aspects of Situation Management (CogSIMA), Tallinn, Estonia, 14–22 May 2021; IEEE: Piscataway, NJ, USA, 2021. [Google Scholar] [CrossRef] [Scilit]
- Rebensky, S. Impact of Heads-Up Displays on Small Unmanned Aircraft System Operator Situation Awareness and Performance. Master’s Thesis, Embry-Riddle Aeronautical University, Daytona Beach, FL, USA, 2020. [Google Scholar]
- Lin, J.; Matthews, G.; Reinerman-Jones, L.; Wohleber, R. Assessing operator psychological states and performance in UAS operations. In Augmented Cognition: Intelligent Technologies; Springer: Cham, Switzerland, 2018; pp. 131–147. [Google Scholar] [CrossRef] [Scilit]
- Liu, D.; Wasson, R.; Vincenzi, D.A. Effects of system automation management strategies and multi-mission operator-to-vehicle ratio on operator performance in UAV systems. J. Intell. Robot. Syst. 2009, 54, 795–810. [Google Scholar] [CrossRef] [Scilit]
- Walker, H.K.; Hall, W.D.; Hurst, J.W. (Eds.) Clinical Methods: The History, Physical, and Laboratory Examinations, 3rd ed.; Butterworth Publishers: Boston, MA, USA, 1990. [Google Scholar]
- Strasburger, H.; Pöppel, E. Visual field. In Encyclopedia of Neuroscience; Squire, L.R., Ed.; Elsevier: Amsterdam, The Netherlands, 2002. [Google Scholar]
- Ball, K.K.; Beard, B.L.; Roenker, D.L.; Miller, R.L.; Griggs, D.S. Age and visual search: Expanding the useful field of view. J. Opt. Soc. Am. A 1988, 5, 2210–2219. [Google Scholar] [CrossRef] [Scilit] [PubMed]
- Ikeda, M.; Takeuchi, T. Influence of foveal load on the functional visual field. Percept. Psychophys. 1975, 18, 255–260. [Google Scholar] [CrossRef] [Scilit]
- Drury, C.G.; Clement, M.R. The effect of area, density, and number of background characters on visual search. Hum. Factors 1978, 20, 597–602. [Google Scholar] [CrossRef] [Scilit] [PubMed]
- Williams, L.J. Cognitive load and the functional field of view. Hum. Factors 1982, 24, 683–692. [Google Scholar] [CrossRef] [Scilit]
- Seya, Y.; Nakayasu, H.; Yagi, T. Useful field of view in simulated driving: Reaction times and eye movements of drivers. i-Perception 2013, 4, 285–298. [Google Scholar] [CrossRef] [Scilit] [PubMed]
- Mackworth, N.H. Stimulus density limits the useful field of view. In Eye Movements and Psychological Processes; Routledge: London, UK, 1976; pp. 307–321. [Google Scholar]
- Eisenbraun, E.C. The aviation safety reporting system: Is immunity the vital provision. J. Air Law Commer. 1981, 46, 117. [Google Scholar]
- Haslbeck, A.; Schmidt-Moll, C.; Schubert, E. Pilots’ willingness to report aviation incidents. In Proceedings of the International Symposium on Aviation Psychology; Wright State University: Dayton, OH, USA, 2015; p. 596. [Google Scholar]
- Paes, D.; Kim, S.; Irizarry, J. Human factors considerations of first person view operation of unmanned aircraft systems in infrastructure construction and inspection environments. In Proceedings of the (CSCE) Canadian Society for Civil Engineering Annual Conference, Vancouver, BC, Canada, 31 May–3 June 2017; CSCE: Vancouver, BC, Canada, 2017. [Google Scholar]
- Garmin. G1000 Integrated Flight Deck Pilot’s Guide; Garmin Ltd.: Olathe, KS, USA, 2011; Available online: https://static.garmincdn.com/pumac/190-00498-07_0A_Web.pdf (accessed on 27 October 2024).
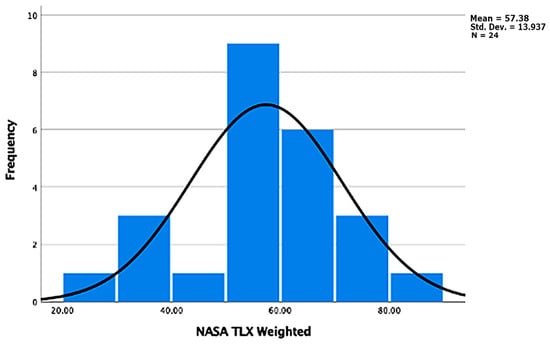
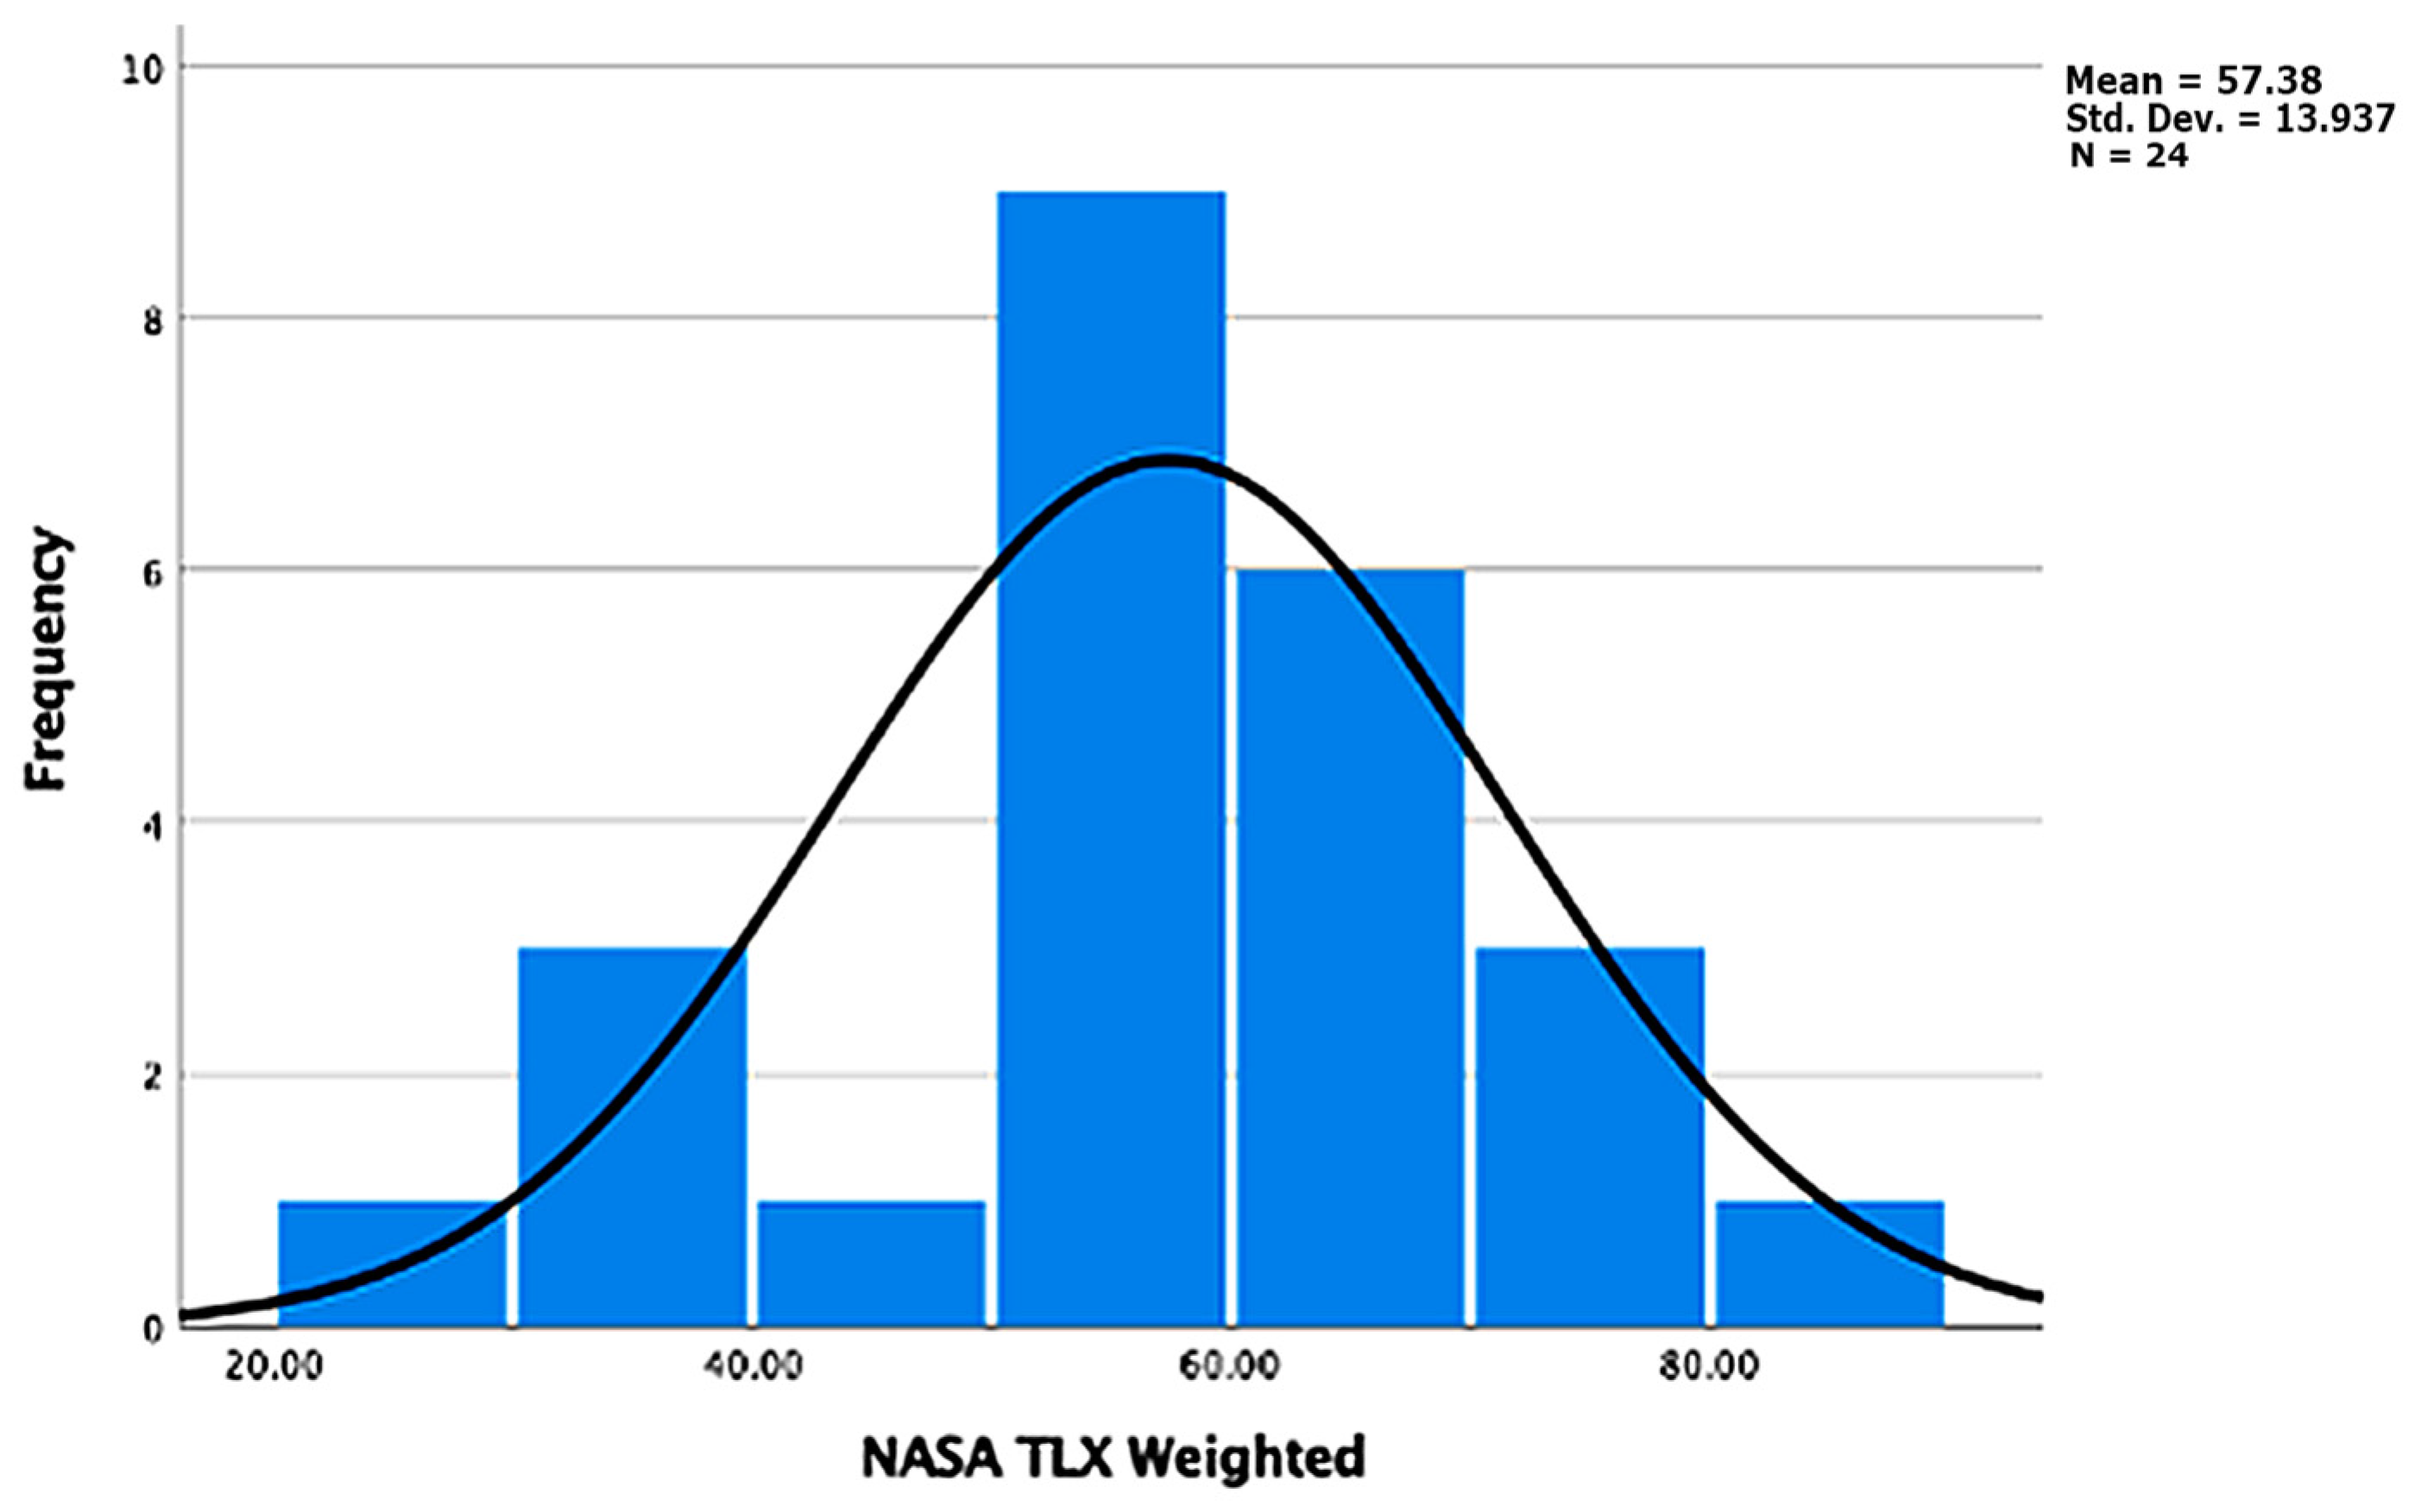
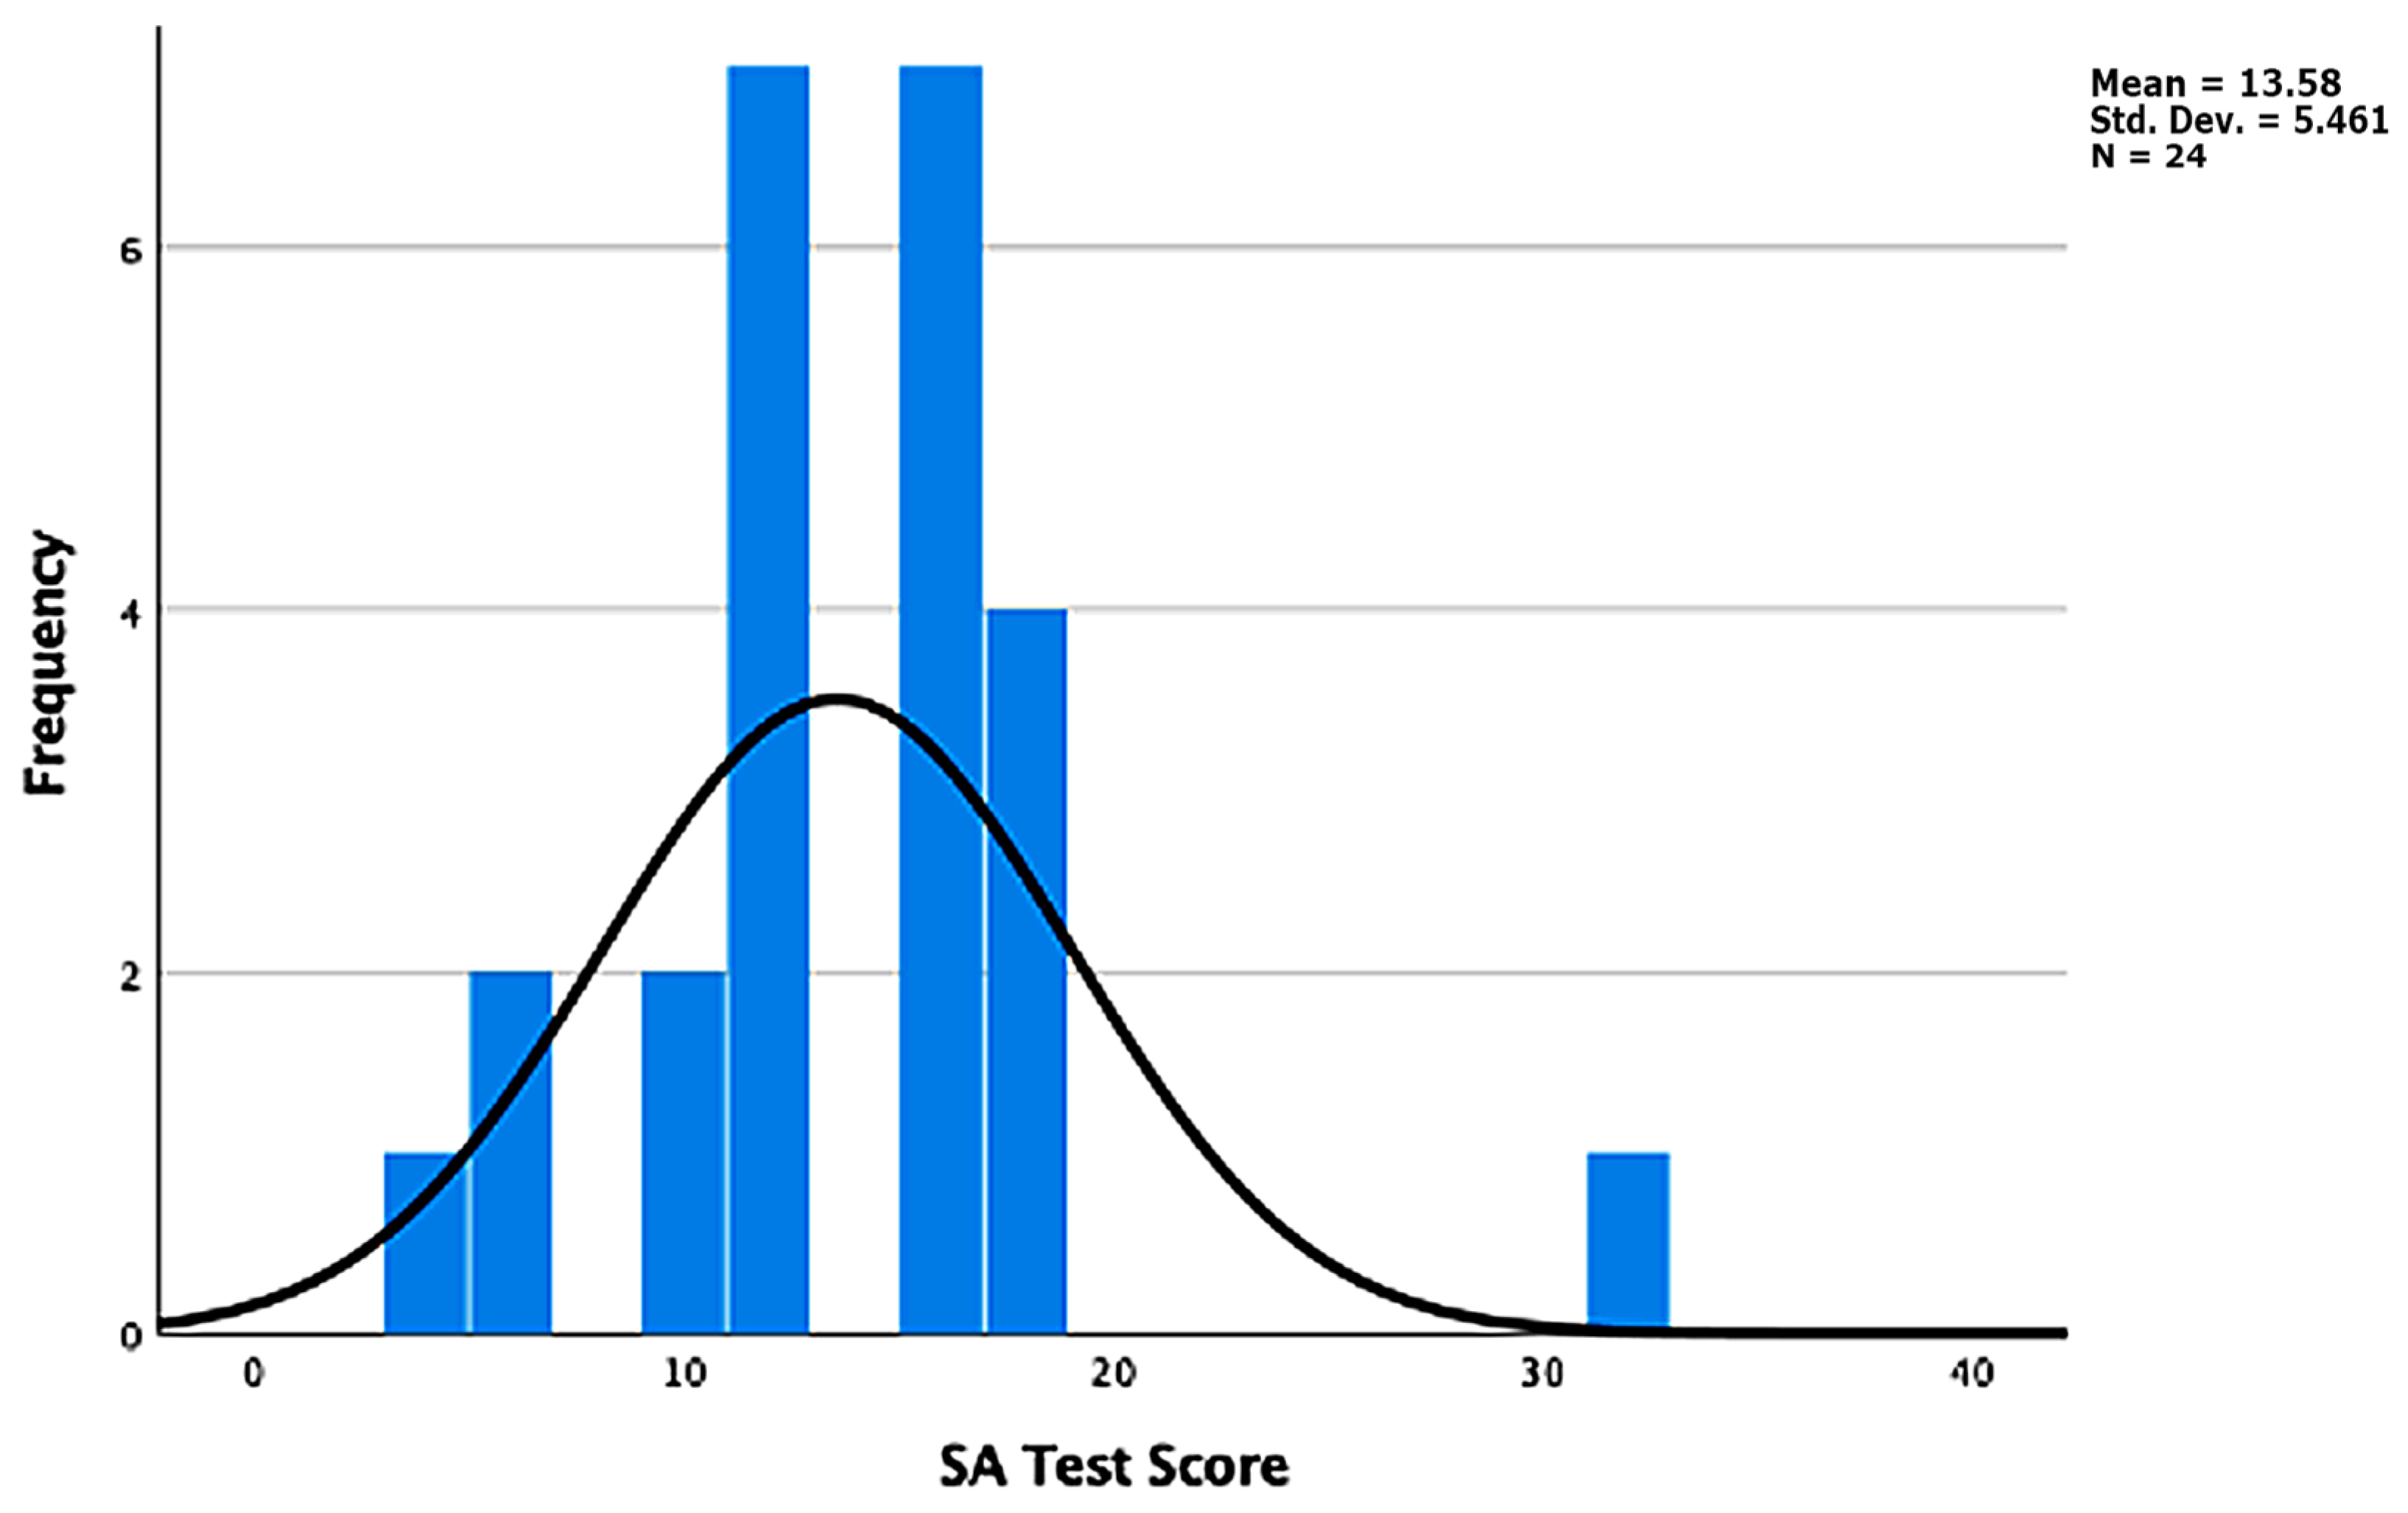
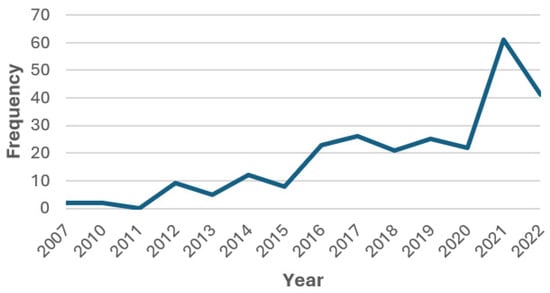
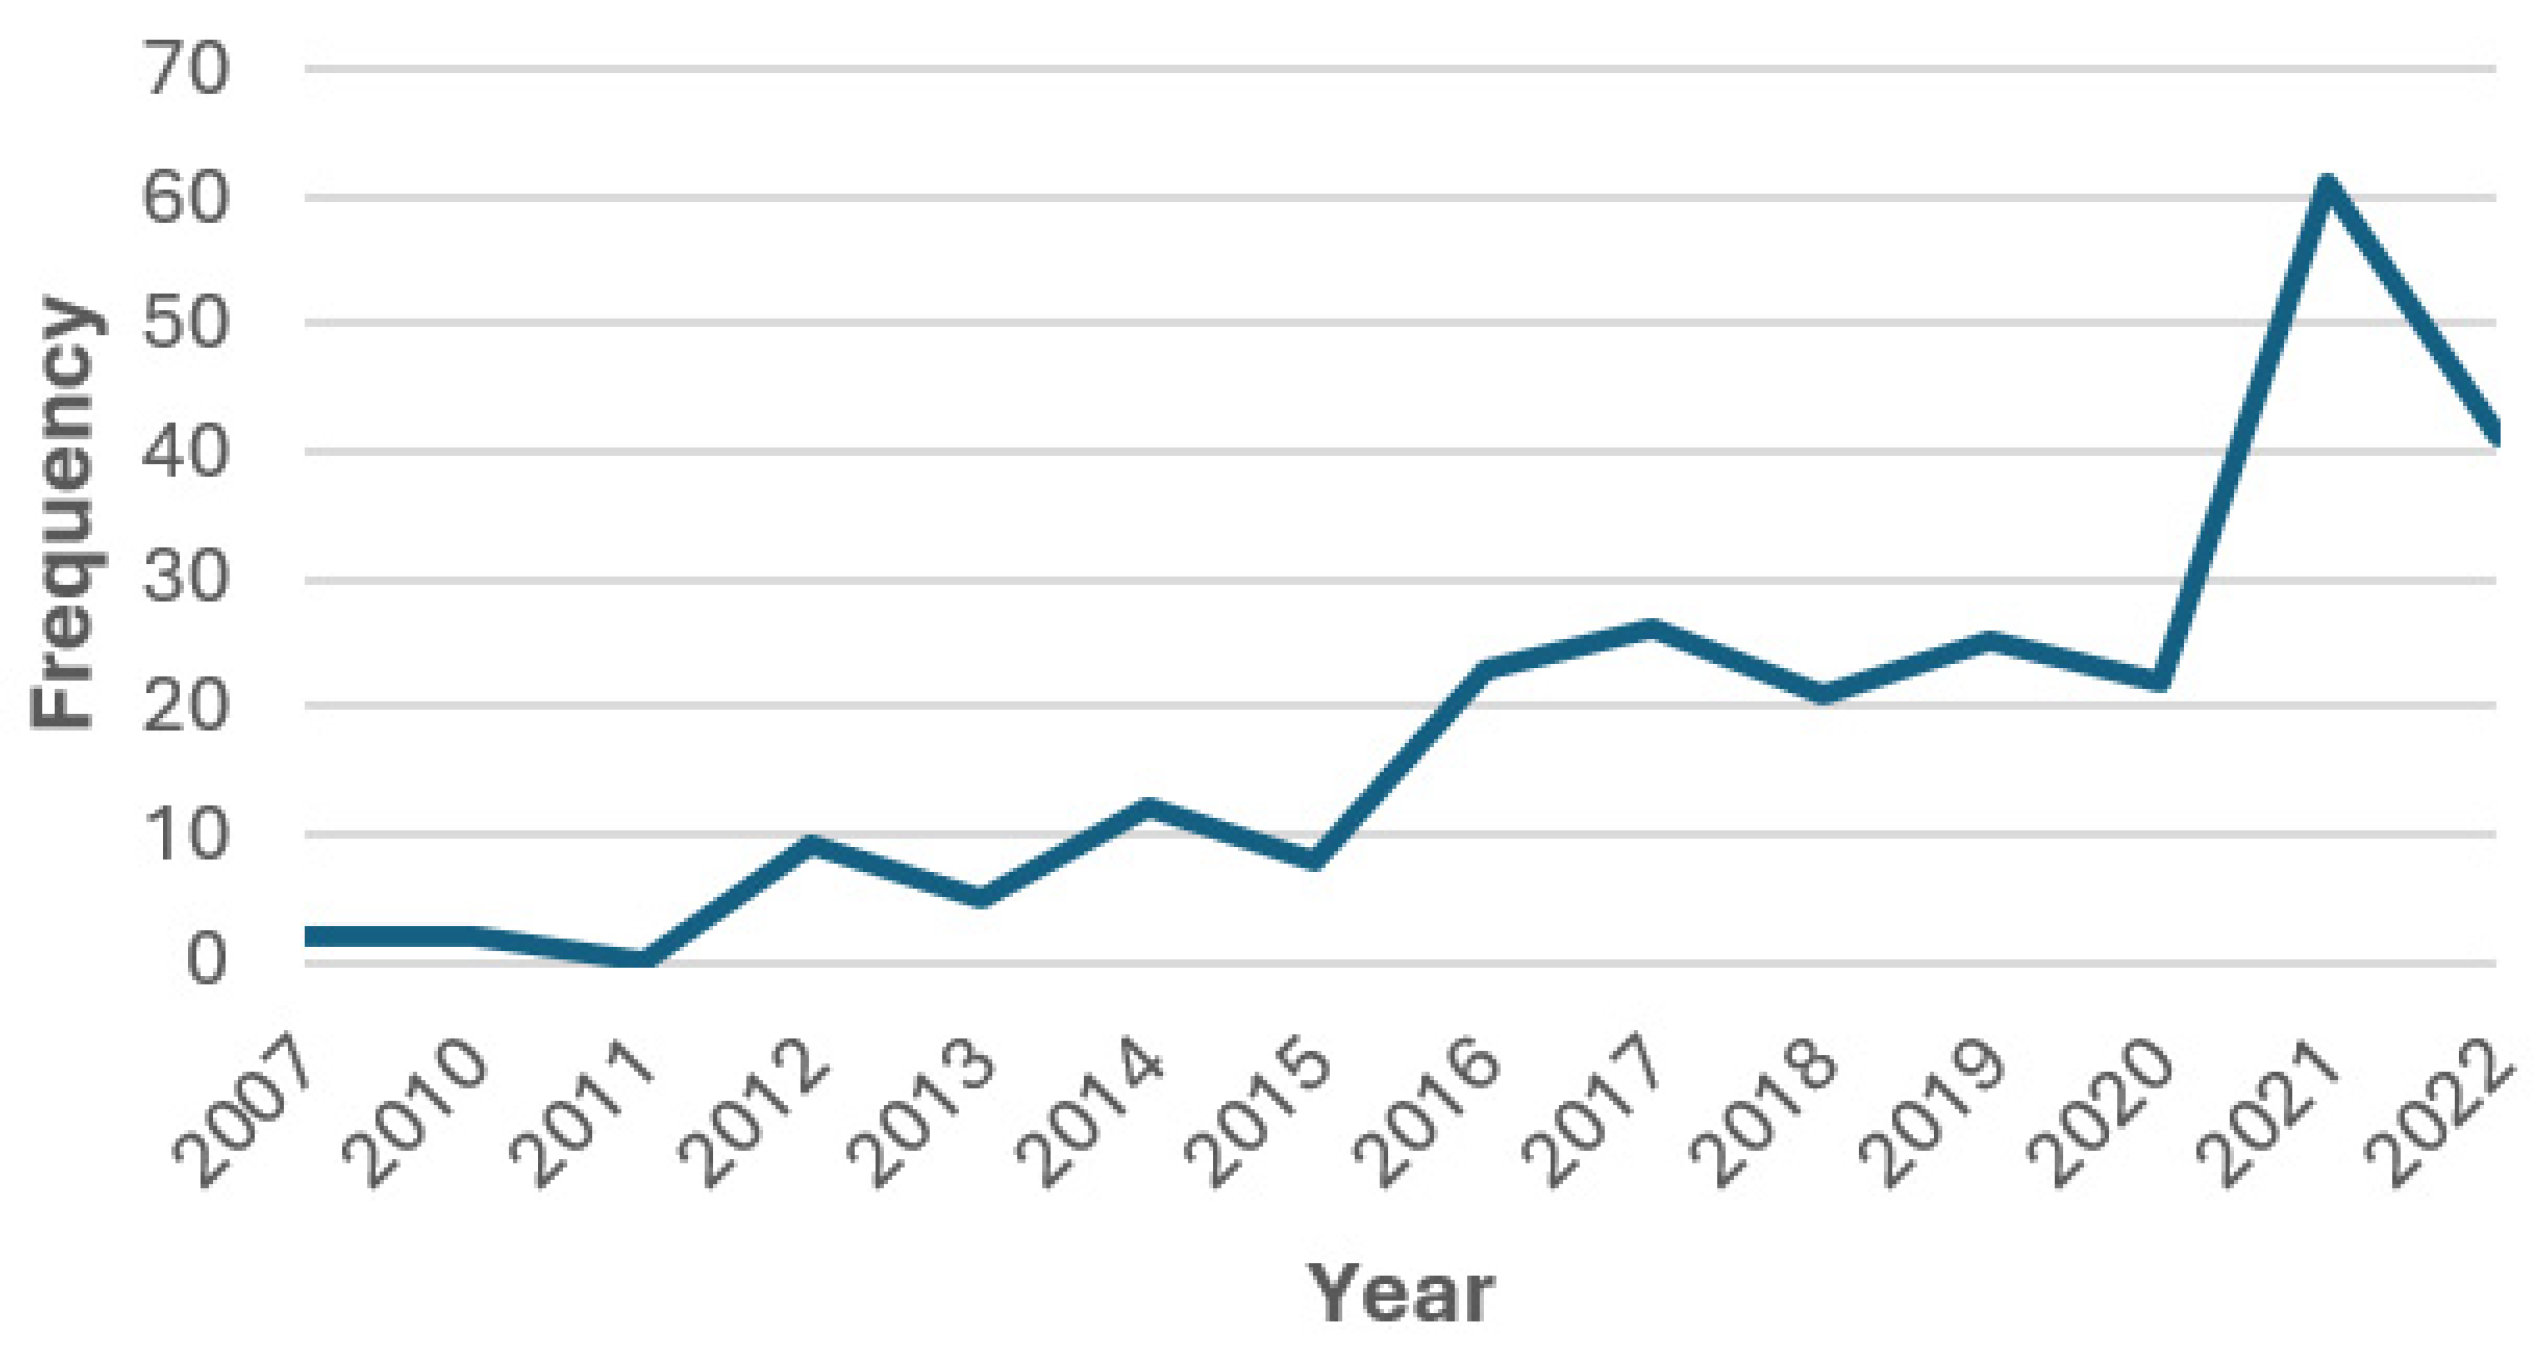
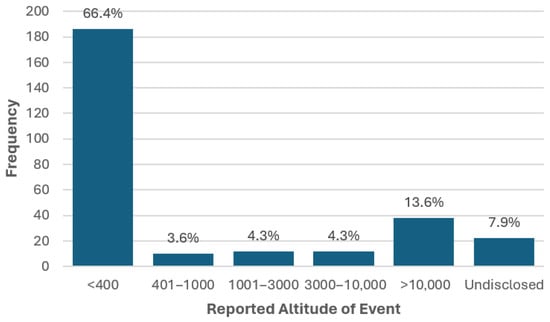
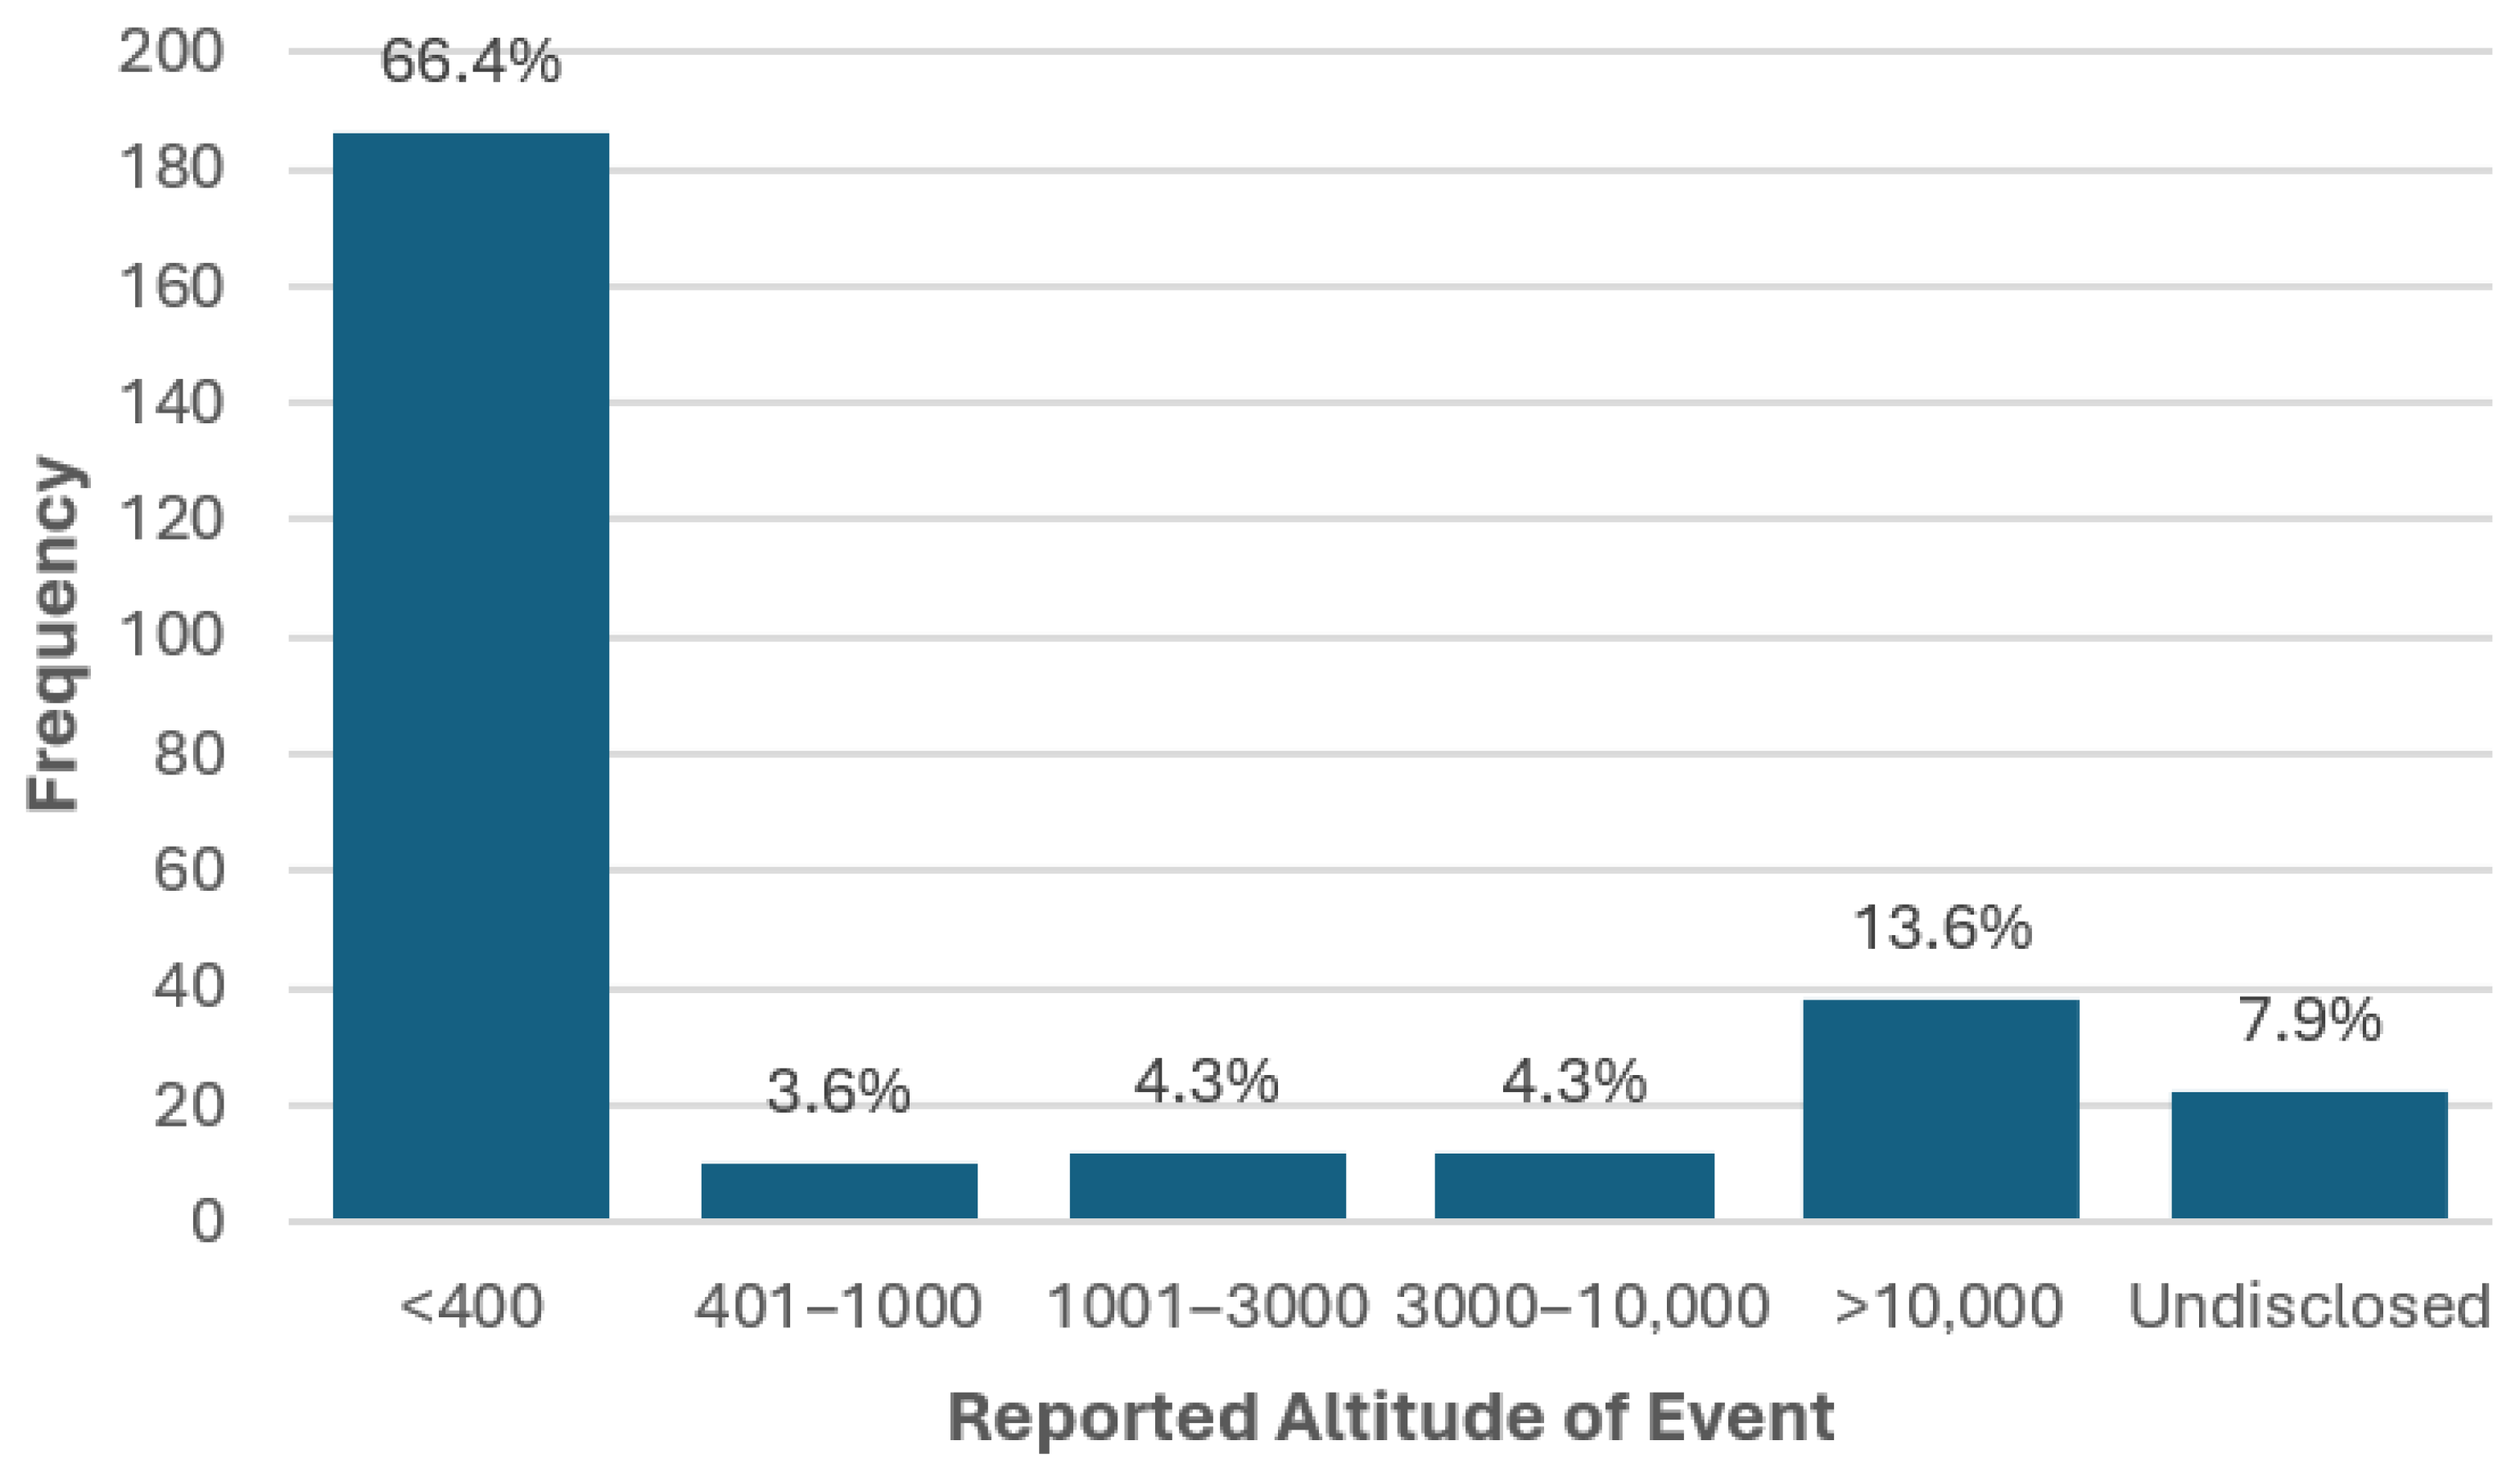
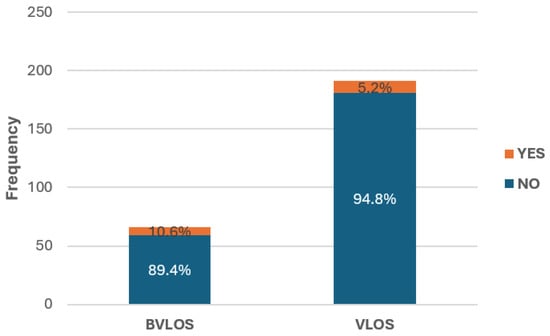
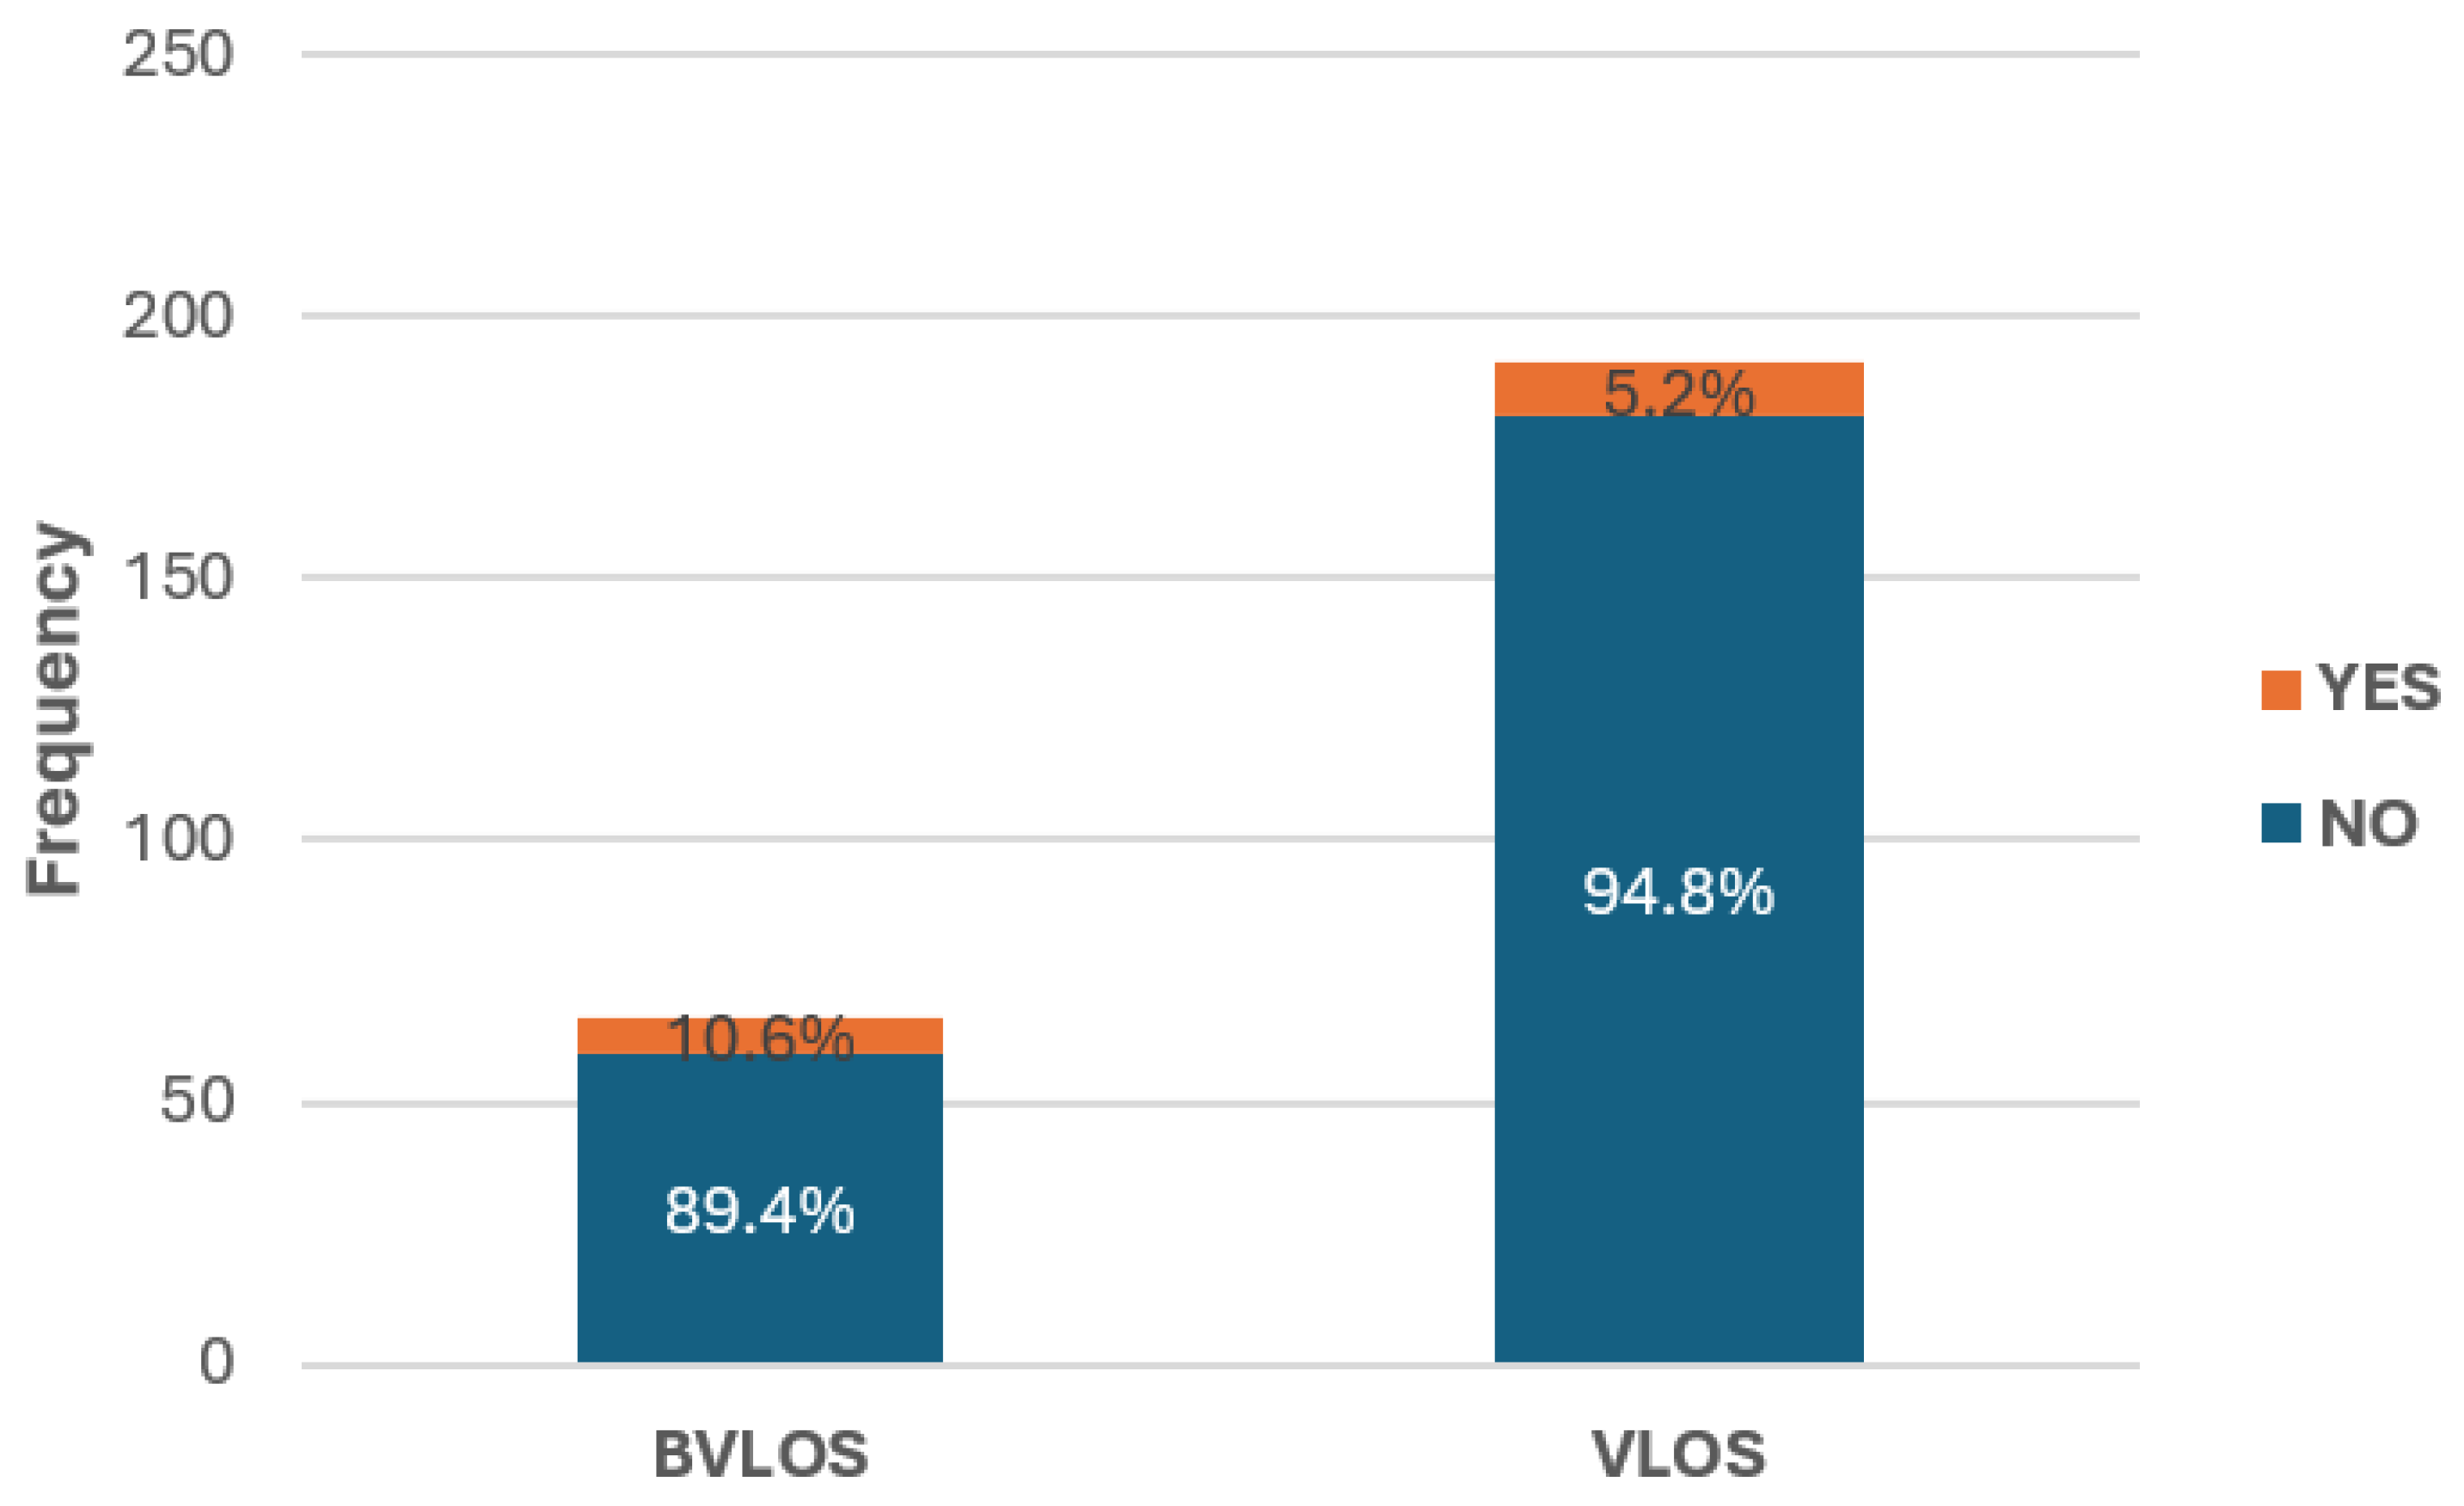
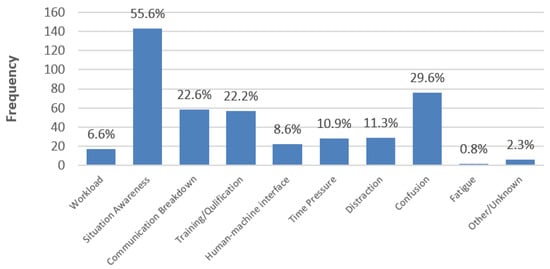
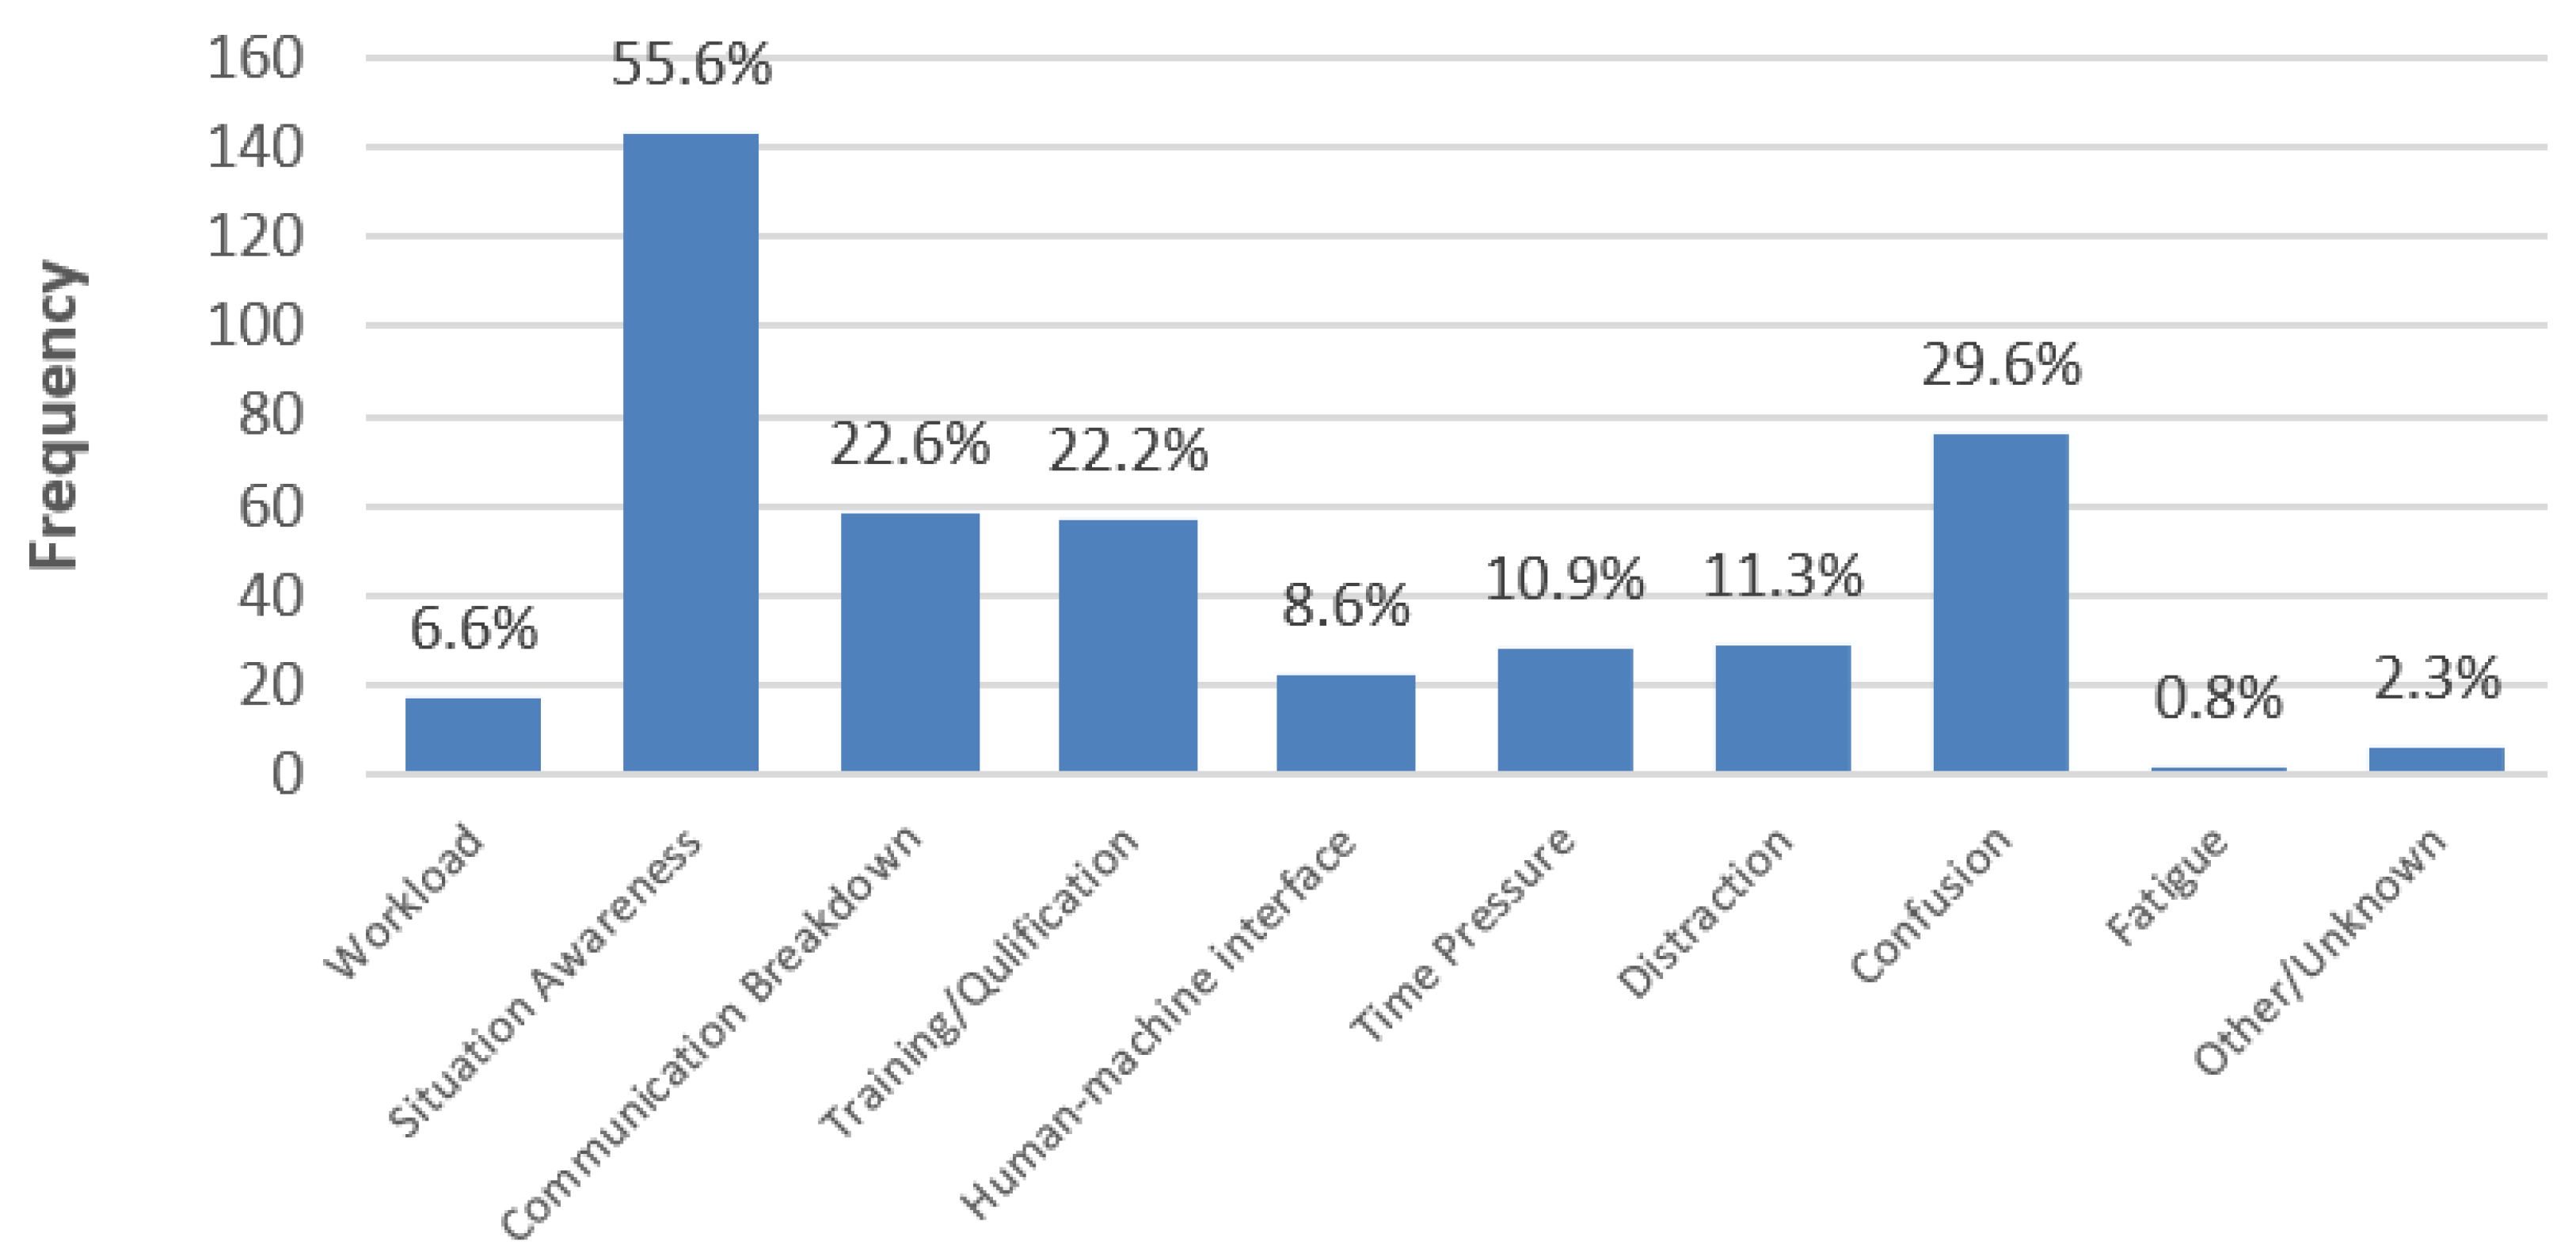
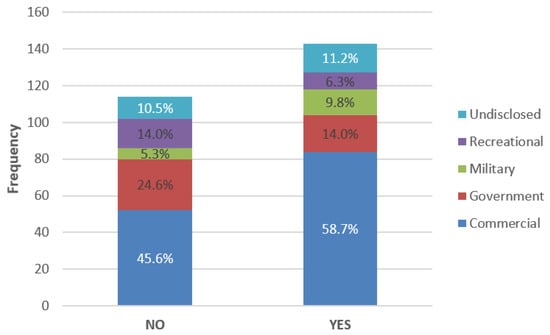
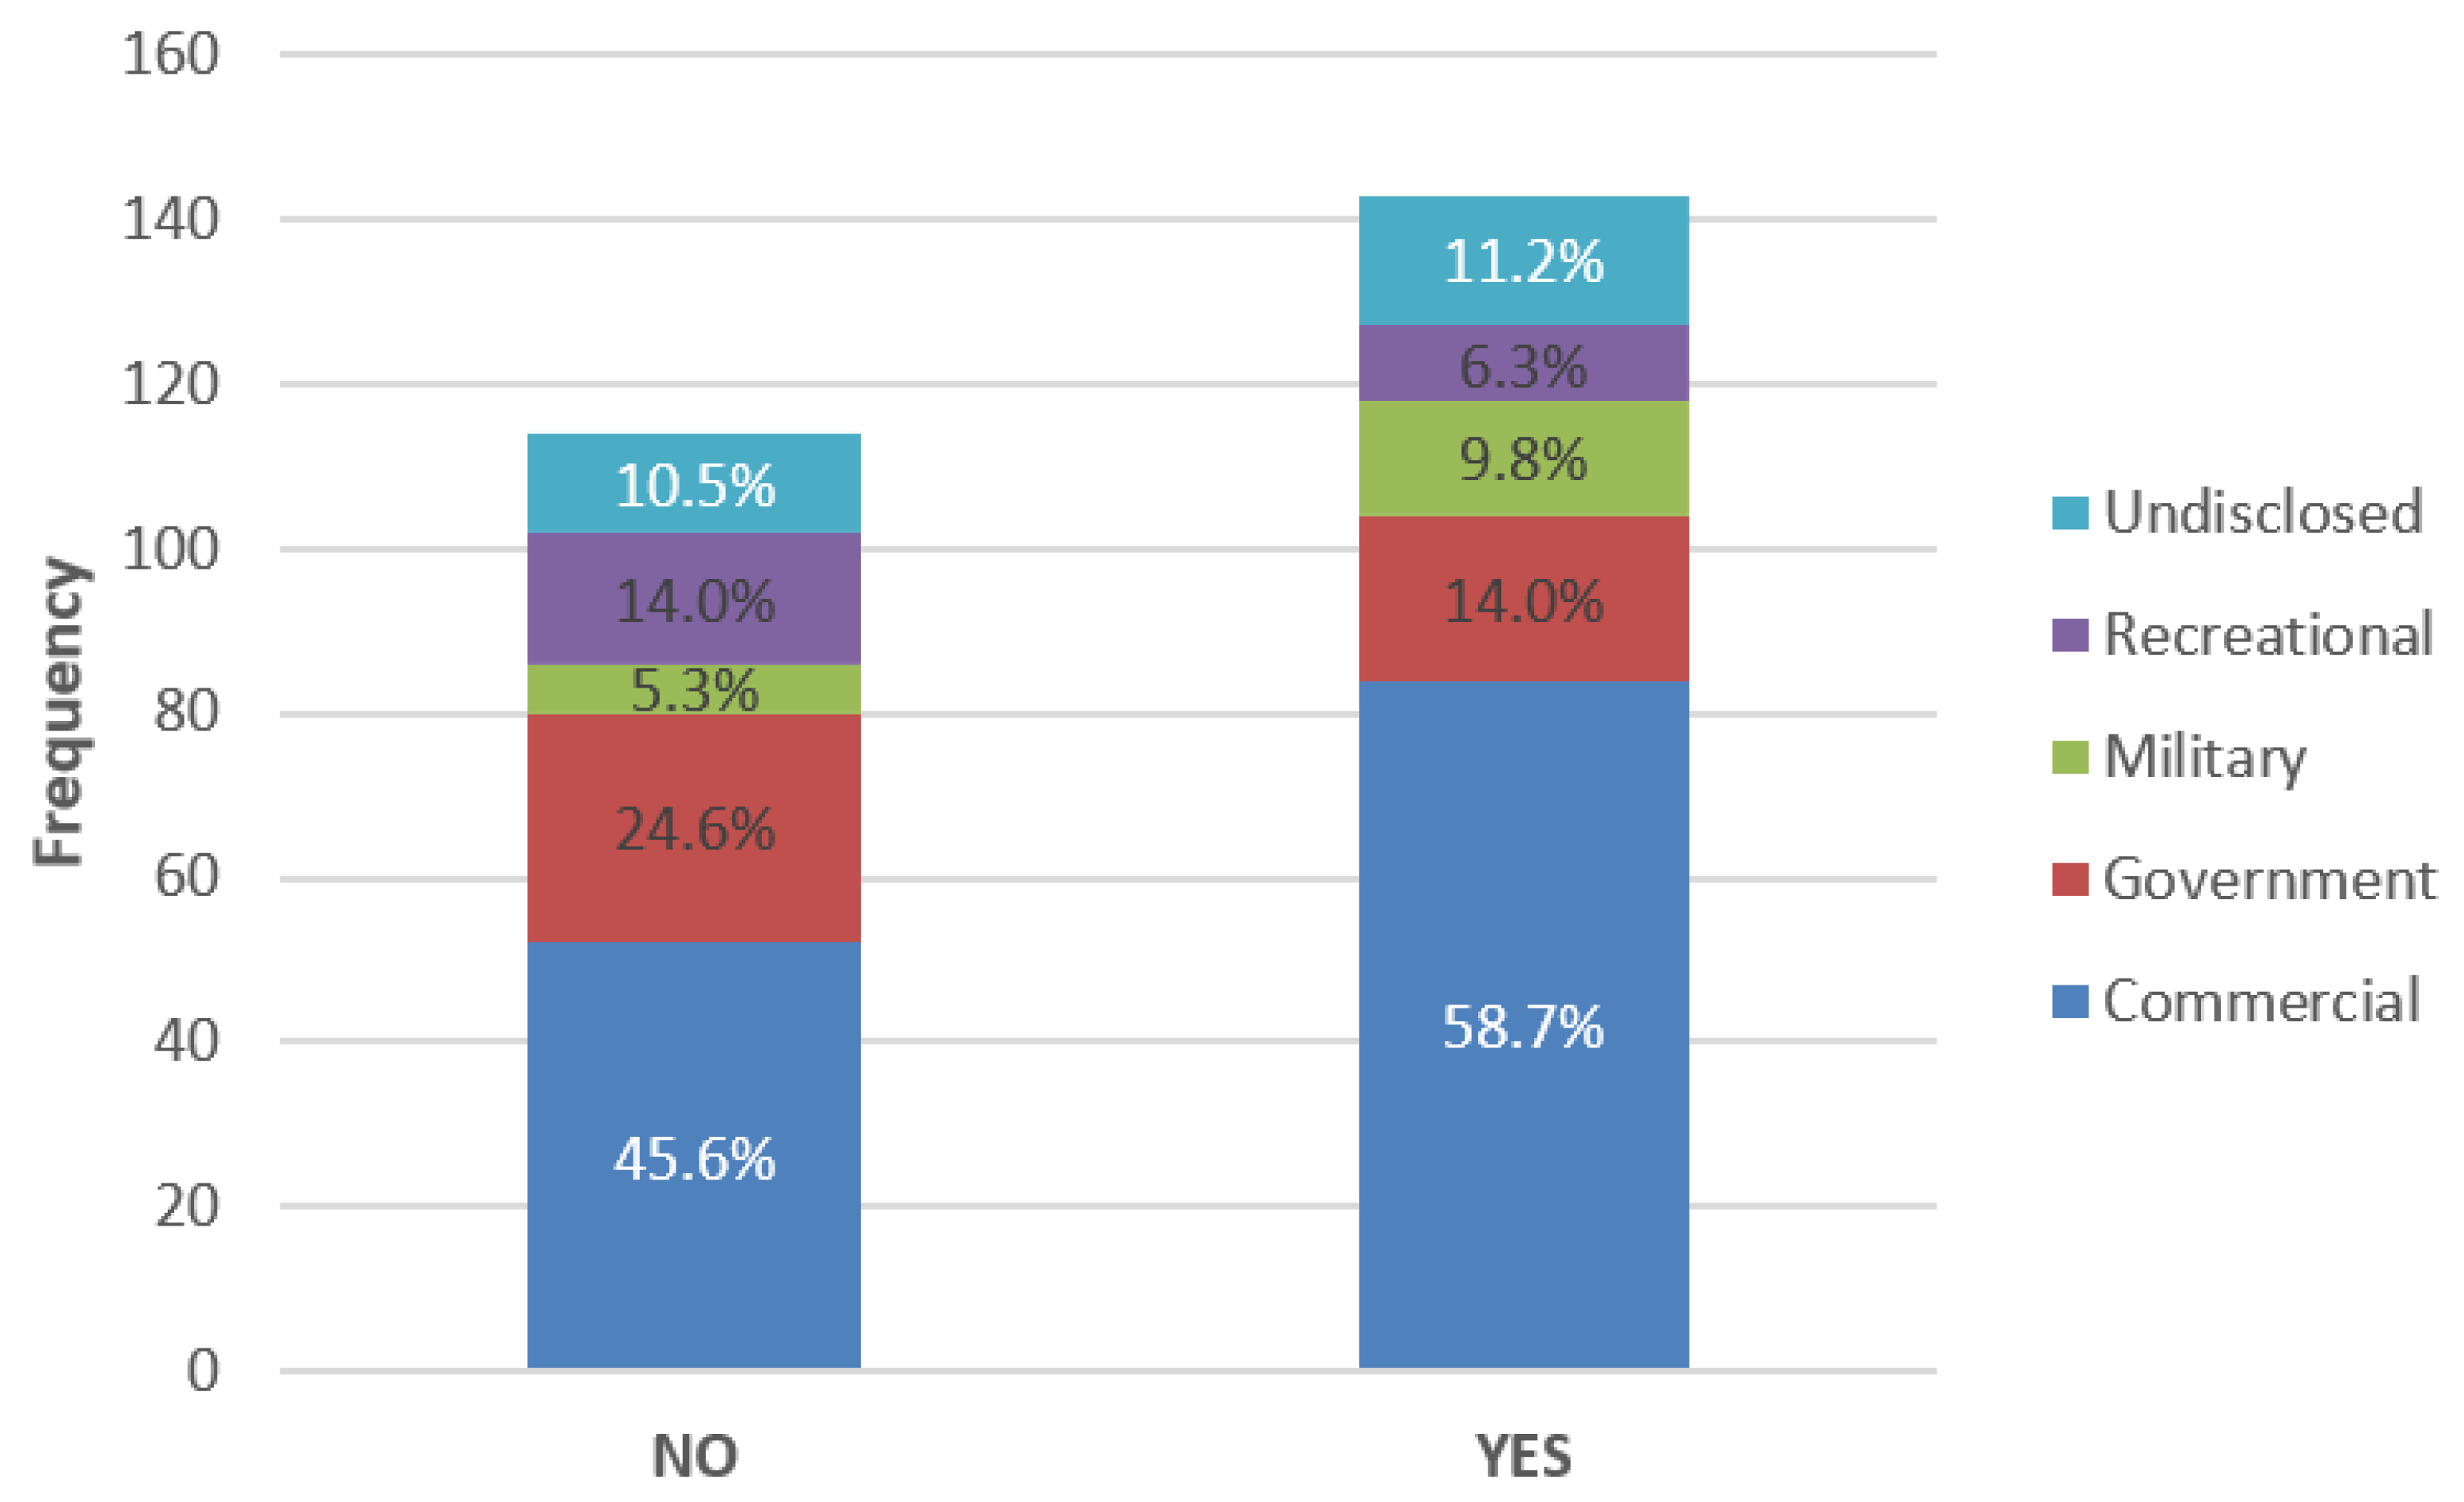
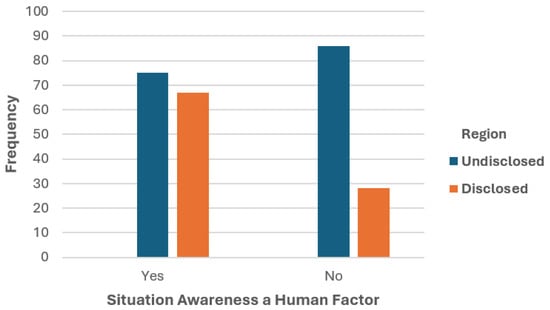
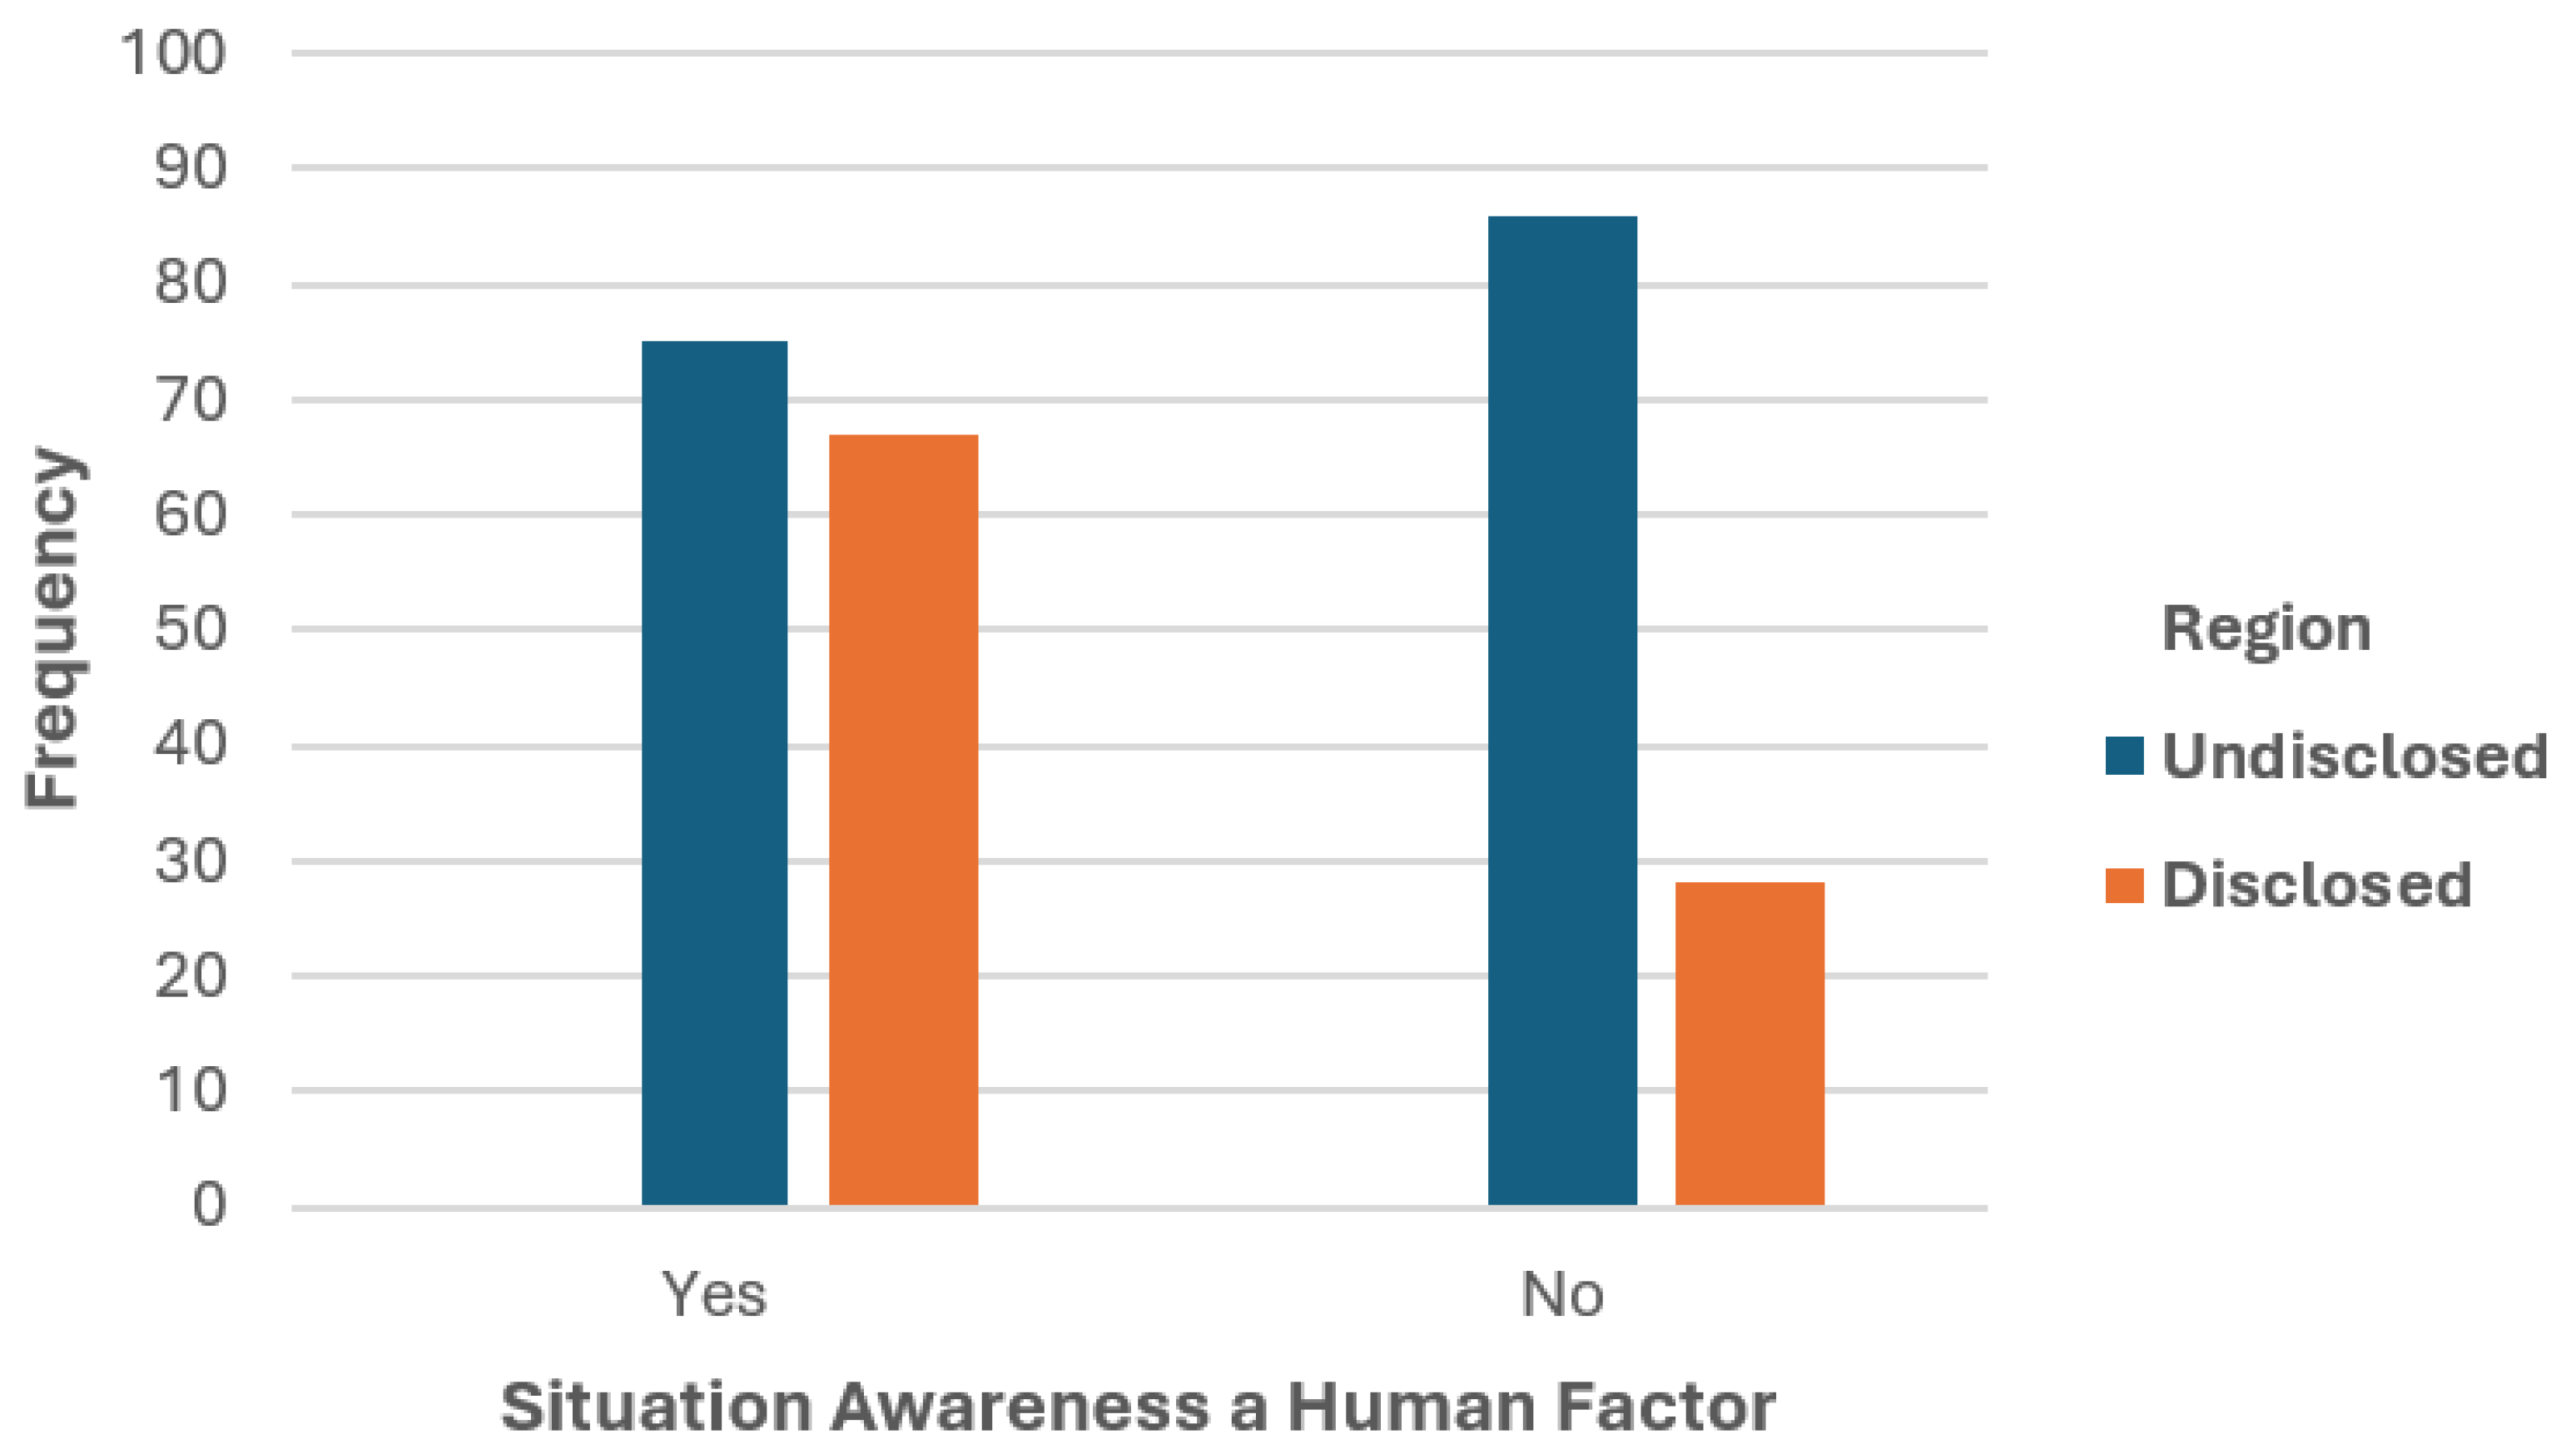

Disclaimer/Publisher’s Note: The statements, opinions and data contained in all publications are solely those of the individual author(s) and contributor(s) and not of MDPI and/or the editor(s). MDPI and/or the editor(s) disclaim responsibility for any injury to people or property resulting from any ideas, methods, instructions or products referred to in the content. |
© 2026 by the authors. Licensee MDPI, Basel, Switzerland. This article is an open access article distributed under the terms and conditions of the Creative Commons Attribution (CC BY) license.