


Abstract
In today’s increasingly fierce global competition in science and technology, China’s chip industry is facing a global technology blockade and market containment. Against this backdrop, research on the resilience of China’s chip industrial chain is of great significance to improve the survival and recovery ability of the chip industry under extreme conditions. Therefore, this study uses the system dynamics method to build a simulation model for the resilience of China’s chip industry. The model examines four regulatory scenarios: enhancing R&D intensity, elevating innovation development, promoting resource recycling and utilization, and expanding the depth of policy promotion. The simulation results of China’s chip industrial chain from 2014 to 2024 show the following: First, the resilience level of China’s chip industrial chain initially decreases but then subsequently increases. Second, all four regulatory scenarios improve the simulated resilience value of the industrial chain to varying degrees. Among them, the regulatory scenario of elevating innovation development has the most pronounced effect. However, while the improvement from promoting resource recycling and utilization is relatively limited, it helps to continuously improve the safety level of the chip industrial chain. Third, moderately increasing the total intensity of R&D and expanding the depth of policy promotion are conducive to regulation of the current chip industrial chain’s elasticity.
1. Introduction
The growing intensity of global techno-scientific competition is profoundly reshaping the international political and economic landscape, with rivalry among nations in high-technology sectors becoming especially pronounced [1]. The chip industry has emerged as the central arena of global competition. As a strategic emerging sector, the chip industry holds critical importance for advancements in information technology, national information security, and ultimately, economic security [2]. Against this backdrop, a deeper understanding and enhancement of the resilience of China’s chip industrial chain and an effective response to the severe challenges posed by dependence on US technology and supply chain disruptions are of significant theoretical and practical importance for overcoming export restrictions, enhancing self-reliance, and ensuring the security and stability of the domestic industrial chain.
In recent years, despite progress in the design and manufacturing capabilities of China’s chip industry, improvements across the industrial chain, and continuously growing market demand in 2023, the sector continues to face intricate challenges both at home and abroad: internationally, the rise of technological protectionism has restricted access to high-end chip technologies and equipment [3]. Domestically, there remains a gap between high-end chip design and manufacturing, as well as key materials, and internationally leading standards, with risks to industrial chain security becoming increasingly prominent [4]. Hence, bolstering independent research and development and enhancing autonomous and controllable capabilities within the industrial chain have become pivotal development priorities.
Current studies on the resilience of the chip industrial chain focus primarily on three dimensions: analyzing risk factors affecting industrial chain security and risk prevention—such as the recycling of waste chips, the security of critical mineral supplies, and gaps in core technologies [5,6]. The pursuit of independent technological innovation coupled with collaborative development entails exploring pathways for domestic substitution while emphasizing the role of industry–academia–research partnerships in building robust innovation networks [7,8]. This study analyzes the construction of the industrial chain ecosystem and policy support, examining the shaping influence of policy tools, financial assistance, and international collaboration—particularly in response to unilateral sanctions—and the development of sustainable supply chains in industrial ecology [9,10,11].
In summary, while scholars have undertaken preliminary research on the resilience of chip industrial chains, several shortcomings remain. First, existing studies on identifying and assessing the factors influencing resilience are predominantly static and fragmented, failing to comprehensively account for interactions between the internal and external factors that shape the resilience of the system. Second, the current literature on enhancing resilience tends to rely on qualitative analysis, with a lack of quantitative research in this area, thereby limiting its ability to offer comprehensive and effective theoretical guidance for strengthening the resilience of the chip industry. To address these issues, this study identifies and analyzes the key factors affecting the resilience of China’s chip industrial chain within the context of global technological competition. Using system dynamics, a risk management model is constructed to simulate and analyze changes in the supply chain’s resilience level between 2014 and 2023. Furthermore, the mechanisms and effects of various regulatory measures are investigated, providing decision-making references for enhancing the resilience of the chip industrial chain. The main contributions of this paper are as follows: First, from the perspective of global technological competition, a system dynamics model is established to depict the interactions among key internal and external influencing factors through systematic analysis and causal relationship analysis. Second, regulatory scenarios are designed on the basis of chip industry development plans and related policies, and the effects of various regulatory measures on the implementation and resilience level of the chip industrial chain are examined through simulation.
2. System Dynamics Model of the Chip Industrial Chain
2.1. System Boundary Definition
System dynamics is a discipline that examines the behavior and dynamic changes of complex systems and was established by Jay W. Forrester of the Massachusetts Institute of Technology in the 1950s. It seeks to understand and simulate the dynamic behavior of such systems by analyzing internal feedback loops, stocks, and flows, as well as time delays. A crucial step in the system dynamics modeling approach is the appropriate determination of system boundaries. To achieve the research objectives and emphasize the key foci of the study, this article simplifies the model around the essential upstream and downstream nodes of the chip industrial chain, along with external influencing factors. Furthermore, on the basis of the development timeline of the chip industry and data availability, the period from 2014 to 2023 was selected as the temporal boundary of the system.
The application of system dynamics has expanded from industrial management to a diverse range of disciplines. In management [12,13,14,15] and management science [16,17], it has become a classic approach for analyzing supply chains, developing strategies, and evaluating policies. Modeling complex feedback structures offers managers a deeper systemic understanding and supports decision-making.
Moreover, the methodology has been extensively applied across seven other cutting-edge domains: engineering [18,19], computer science [20], environmental science and ecology [21,22], earth science [23], medicine [24,25,26], psychology [27], and artificial intelligence [28]. In these disciplines, system dynamics furnish a unified, interdisciplinary methodological framework for comprehending and simulating the long-term behavior of diverse complex systems, as well as for evaluating intervention strategies, thereby attesting to its universal applicability and effectiveness in tackling complex challenges.
2.2. Risks and Challenges Faced in Improving the Resilience of the Industrial Chain
The resilience of the chip supply chain refers to the ability of the supply chain to restore its original operational capacity after being impacted and disrupted by various uncertainties and shocks, which would otherwise lead to disruption in the chip supply. Resilience theory emphasizes the dynamic interplay between risk and development, necessitating a profound understanding of both internal and external influencing factors to ensure that the system maintains safety, stability, and sustainable development capabilities when confronted with disturbances. The level of resilience in the chip supply chain is characterized by multi-dimensionality, complexity, and pervasiveness, and the risk of compromised resilience not only exists within each segment of the supply chain itself but also arises from external environmental factors affecting the supply chain.
Therefore, within the context of global technological competition, analyzing the key factors influencing China’s chip industry from both internal and external perspectives is essential. In terms of raw material supply and technological innovation, certain countries leverage political influence and public opinion to disrupt the critical mineral supply chains of competitors, which significantly undermines the upstream resilience of China’s high-end chip industry [29,30]. Moreover, optimizing the technological structure of the chip industry and enhancing overall technological security also play vital roles in strengthening supply chain resilience [31,32]. With regard to supply–demand matching and recycling, reduced subsidies for new energy vehicles, coupled with the impact of the global pandemic, have led to sluggish market demand, resulting in production capacity outstripping market needs and thereby intensifying market risk. As the number of retired batteries continues to grow, improper recycling could progressively increase the risks associated with battery disposal owing to the presence of metal resources alongside toxic and hazardous substances [33,34].
On the basis of previous scholarly research on resilience, this article summarizes the resilience dimensions of the chip industrial chain into four categories: resistance, innovation, adaptability, and circulation. Resistance and innovation are reflected in the upstream segment of the industrial chain, whereas adaptability and circulation manifest in the downstream segment. Moreover, this study adopts an adaptive resilience perspective, emphasizing the system’s ability to self-organize, learn, and transform in response to disruptions [35,36]. While engineering resilience focuses on rapid return to equilibrium and ecological resilience on stability of system states, adaptive resilience better suits the dynamic, innovation-driven nature of the semiconductor industrial chain under geopolitical uncertainty.
The resilience level is constructed as an equal-weighted composite of four conceptually distinct yet complementary dimensions: resistance (structural vulnerability), innovation (capability to generate new solutions), adaptability (dynamic response to change), and circulation (resource recycling efficiency). This approach follows established practice in the supply chain resilience literature when no empirical hierarchy exists [37,38,39]. While innovation and adaptability function as proactive capabilities, resistance and circulation represent structural and operational conditions. The equal weighting is adopted as an initial, neutral aggregation method to avoid subjective bias, with the understanding that dynamic feedback loops in the system dynamics framework will naturally reveal differential leverage effects (e.g., innovation dominance).
The four resilience dimensions and their implications within the system are presented in Table 1 below.
Table 1.
The resilience dimensions and connotations of the chip industrial chain.
2.2.1. Upstream of the Industrial Chain
The upstream industrial chain considers the supply of raw materials from the perspective of resilience and breakthroughs in core technologies from the perspective of innovation. The resistance dimension refers to the ability of the upstream sector to maintain production in the face of uncertainties regarding the supply of rare metals such as tantalum, niobium, and cobalt and precious metals such as palladium and platinum, which are essential for chip manufacturing and packaging. Resilience in terms of innovation refers to the capacity to develop novel solutions to address challenges or capitalize on opportunities when confronted with uncertainties arising from a lack of critical extraction and refining technologies, leading to technological shortcomings and reliance on imported core components in the upstream segment of the industrial chain.
In terms of resilience and resistance, the supply of metal resources required for chip production in China primarily comes from three sources: foreign imports, domestic mining, and resource recycling. The production and reserves of rare metals such as tantalum, niobium, and cobalt, as well as precious metals such as palladium and platinum, are highly concentrated. The former are distributed mainly in Africa and South America, whereas the latter are found predominantly in South Africa and Russia. Consequently, the production of high-end chips in China is heavily dependent on imported metal resources. Currently, the import dependence rates for the rare metals tantalum, niobium, and cobalt are 95%, 99%, and 90%, respectively, whereas the import dependence rates for the precious metals palladium and platinum are 95% and 98%, respectively. With the rapid development of our chip industry and the imposition of export controls by resource-supplying countries, the contradiction between resource supply and demand is becoming increasingly pronounced, leading to certain challenges in the cross-regional supply of key metal resources. This article draws on the approach of Yuan Xiaojing et al. [40] and analyzes domestic supply resilience from the perspective of resource availability over time, which refers to the number of years of extraction available from domestic reserves of tantalum, niobium, cobalt, palladium, and platinum. It also assesses the risks associated with foreign imports from the perspective of geopolitical stability by evaluating whether the production of mineral resources is concentrated in countries with geopolitical instability. This study selects the top three producing countries in terms of tantalum, niobium, cobalt, palladium, and platinum resources as the research subjects, with specific production distributions shown in Table 2. The formula for calculating foreign import risk is as follows:
Table 2.
The distribution of major mineral resources required for global chip production.
Within this context, i = 1, 2, 3, 4, and 5 represent the resources of tantalum, niobium, cobalt, palladium, and platinum metals, respectively. j = 1, 2, and 3 denote the major producing countries. indicates the share of metal resources produced by these major producing countries in the global market, and WGI represents the Worldwide Governance Indicators published by the World Bank, which are used to assess the quality of social governance in a country or region.
With reference to the research of Shen Feng et al. [41], the logistic model is employed to model the technology lifecycle curve. Patent data are utilized to assess technological maturity, thereby quantifying the technical risk within the chip industrial chain.
where M(k) represents the technological maturity of the chip when the number of patents is k, k is the function k(T) of time T, r represents the slope of the logistic model’s S-shaped curve, and b corresponds to the number of patents at the inflection point of the S-shaped curve. The logistic model was fitted by applying the least squares method within the MATLAB software (R2024b).
2.2.2. Downstream of the Industrial Chain
The resilience of the downstream segment of the industrial chain primarily encompasses two dimensions: demand fluctuations pertaining to adaptability and the recycling of chip waste associated with circulation. Adaptability refers to the capacity of the industrial chain to dynamically adjust production capabilities and market strategies in response to potential losses arising from imbalances in chip supply and demand, as well as market competition, to accommodate fluctuations in international demand. Chip demand is a critical factor influencing the resilience of both the chip market and the industrial chain. Drawing on the research of Ren Bin [42] and others, this paper employs the Bass diffusion model to simulate the demand for high-end chips.
Within this model, N(t) denotes the cumulative adoption volume of the chips; m represents the potential market size; p and q are the coefficients of external influence (policy-driven influence coefficient) and internal influence (innovation coefficient), respectively; and β1 and β2 capture the impact of changes in chip prices and the income of enterprises that are end-users of the chips on the diffusion process.
Circulation pertains to the sustainable development capacity of the chip industry, with particular emphasis on resource recycling and environmental protection. This encompasses measures such as enhancing the recycling rate for decommissioned chips, optimizing production processes to minimize waste and resource consumption, and advancing the adoption of green manufacturing practices. The overarching objective is to reduce reliance on primary resources and mitigate environmental risks.
2.2.3. External Factors Affecting the Industrial Chain
The external influencing factors of the industrial chain primarily involve macroeconomic conditions, national policies, and geopolitical risks. These factors affect the overall resilience of the chip industrial chain indirectly by influencing its internal resilience dimensions. Macroeconomic fluctuations may trigger certain shocks to the resilience of the chip industry. During economic downturns, chip manufacturers may cut production and market demand may contract. Similarly, government subsidies are likely to be reduced in periods of economic recession. The chip manufacturing process is highly complex and involves multiple stages, such as EDA design software, (Synopsys Fusion Compiler 2025.x) core intellectual property, chip production equipment, and raw materials. At present, these key technologies and resources are concentrated in a limited number of countries and regions. Against the backdrop of global technological competition, chips, as a core foundation of modern information technology, have become one of the key areas contested by major technological powers. In this context, China’s chip industry faces uncertainties associated with geopolitical risks. Moreover, as a strategic emerging industry, the development and upgrading of the chip sector are significantly influenced by policy support.
2.3. Causal Relationship Analysis
The system dynamics approach models complex real-world problems through causal relationship diagrams formed by interconnected feedback loops. Figure 1 presents the resilience causal relationship diagram of the chip industrial chain developed in this study, which comprises four primary feedback loops.
Figure 1.
Causal relationship diagram of the resilience system dynamics model of the chip industrial chain.
Loop 1: Resilience level of the industrial chain → Capacity investment → Chip production capacity → Chip supply → Domestic chip market holdings → Number of discarded chips → Number of discarded chips formally recycled → Resource recovery → Resistance → Resilience level of the industrial chain.
Loop 2: Resilience level of the industrial chain → Capacity investment → Chip production capacity → Chip output value → Total R&D investment → Technology maturity → Innovation → Resilience level of the industrial chain.
Loop 3: Resilience level of the industrial chain → Capacity investment → Chip production capacity → Chip supply → Degree of supply and demand balance → Adaptability → Resilience level of the industrial chain.
Loop 4: Resilience level of the industrial chain → Capacity investment → Chip production capacity → Chip supply → Domestic chip market holdings → Number of discarded chips → Number of chips processed or discarded irregularly → Circulation → Resilience level of the industrial chain.
Loops 1 and 2 reflect the interrelationship between the resistance and innovation capabilities of the upstream industrial chain and the resilience level of the industrial chain. Loop 1 indicates that an increase in the volume of resource recovery and utilization enhances the resistance of the industrial chain, thereby increasing its resilience level. Loop 2 shows that changes in R&D investment have a positive effect on innovation, which in turn influences the resilience level of the industrial chain. Loops 3 and 4 reflect the causes of adaptability and circularity in the downstream industrial chain and their effects on the industrial chain’s resilience level. Loop 3 illustrates the dynamic changes in resilience associated with the matching of chip supply and demand, which is related to adaptability. Loop 4 indicates that informal processing or disposal of discarded chips reduces the circularity of the industrial chain, thereby affecting its resilience level. The resilience level of the industrial chain negatively influences the industrial investment intensity of chip manufacturing enterprises, which subsequently affects adjustments in chip production capacity, leading to changes in chip supply and output value, ultimately forming a feedback connection across the four loops. External factors such as economic and policy conditions influence the resilience level of the industrial chain primarily by affecting chip demand. For example, economic uncertainty is reflected in changes in GDP growth, which affect the revenue of chip demand-side enterprises and government tax revenues, thereby influencing chip demand and R&D investment. Policy uncertainty is manifested in chip promotion policies, represented in the model by the intensity of policy promotion, which affects chip demand and consequently the resilience level of the industrial chain.
2.4. Model Flow Chart and Equations
The causal relationship diagram qualitatively expresses the causal relationships and feedback loops of the influencing factors in the system. It is necessary to further clarify the variable expressions and types of these influencing factors, draw stock and flow diagrams, and establish quantitative equation relationships between the variables to advance to the quantitative simulation stage. Figure 2 shows the flow diagram of the system dynamics model of resilience levels in the chip industrial chain, which includes five state variables and six rate variables.
Figure 2.
Flow diagram of the system dynamics model for the resilience of the chip industrial chain.
This paper focuses on the following processing procedures and explanations regarding the system stock-flow diagram and equation formulation. First, as the model involves numerous types of variables, the WITH LOOKUP table function is employed for normalization on the basis of the principle of functional mapping to eliminate the influence of inconsistent dimensions. Second, given that lag effects may exist among influencing factors in reality—for example, decisions to expand production capacity require time before construction is completed—the DELAY function is used in the model to represent such delay effects and better align with the actual system. Third, Vensim PLE software (Vensim 10.4.0) is utilized for modeling and analysis, with the simulation running from 2014 to 2023 and a time step of one year. Fourth, in the equations, IT refers to the initial time, IT denotes the variable value at the initial time, FT refers to the final time, FT denotes the variable value at the final time, LL represents the lower limit of the variable value, UL represents the upper limit of the variable value, and the units indicate the unit of measurement. Fifth, the model data are sourced from authoritative references, including the China Statistical Yearbook, official government websites, the World Bank’s BEE official website, the Derwent patent database, and industry research reports.
Abdul-Rahman and Alade developed a Composite Resilience Index (CRI) for university towns, using manually assigned equal weights to integrate multiple dimensions (such as social, economic, and environmental) to assess resilience and sustainability. The paper mentions potential limitations of this method but notes its suitability for initial index construction [37]. Q Shu and M Scott constructed a Composite Resilience Index for water–energy–food (WEF) systems, using equal weights to integrate availability and accessibility dimensions (such as WEF availability and Household accessibility) [38]. El Rashidy and Grant-Muller proposed a Composite Resilience Index for road transport networks, calculating the overall index by allocating equal weights to all indicators [39]. The paper discusses index variations under different scenarios and uses equal weights to simplify multi-dimensional integration. The core variable in the model is the “resilience level of the industrial chain,” which is divided into four dimensions: “adaptability,” “innovation,” “resistance,” and “circulation.” Based on the above international literature research, the model decides to use the equal weighting method to assign coefficients to the above four dimensions in the initial stage.
The main equations involved in the system dynamics model are as follows:
- (1)
- Resilience level of the industrial chain = 0.25 × resistance + 0.25 × innovation + 0.25 × adaptability + 0.25 × circulation; units: Dmnl.
- (2)
- Domestic chip market holdings = INTEG (increase − scrap, IT number of chip demand-side enterprises); units: ten thousand pieces.
- (3)
- Number of chip demand-side companies adopting = (policy promotion coefficient × (market size − cumulative number of chip adoptions) + innovation coefficient × (cumulative number of chip adoptions/market size) × (market size − cumulative number of chip adoptions)) × (1 − chip demand-side enterprise income influence factor − price influence factor); units: ten thousand pieces.
- (4)
- Chip demand = number of chip demand-side enterprises adopting; units: ten thousand pieces.
- (5)
- Scrap amount = domestic chip market holdings/chip life; units: ten thousand pieces.
- (6)
- GDP = INTEG (GDP change, IT GDP); units: ten thousand pieces.
- (7)
- GDP change = GDP × GDP growth rate × (1 − chip industry contribution factor); units: trillion.
- (8)
- Chip production capacity = INTEG (change in production capacity, IT chip production capacity); units: ten thousand pieces.
- (9)
- Change in production capacity = DELAY1 (capacity investment intensity × chip production capacity, capacity planning and construction time); units: ten thousand pieces.
- (10)
- Capacity investment intensity = 1.3 × resilience level of the industrial chain; units: Dmnl.
- (11)
- Chip production = chip production capacity × capacity utilization rate; units: ten thousand pieces.
- (12)
- Chip production costs = MAX (IT production prices × EXP (LN(1 − technical learning rate) × LN (chip production/9.135e6)/LN(2)), FT production prices); units: ten thousand yuan.
- (13)
- Chip prices = chip production costs/production cost ratio; units: ten thousand yuan.
- (14)
- Chip output value = 0.0001 × chip demand × chip prices; units: trillion.
- (15)
- Chip industry contribution factor = WITH LOOKUP (chip output value, ([(0,0) − (10,10)], (0,0), (50,0.6)); units: Dmnl.
- (16)
- Degree of supply and demand balance = ABS (chip supply − chip demand)/chip demand); units: Dmnl.
- (17)
- Innovation = chip technology maturity; units: Dmnl.
- (18)
- Chip technology maturity = 1/(1 + EXP (−0.1 × (cumulative number of chip patent applications − 15)); units: Dmnl.
- (19)
- Adaptability = degree of supply and demand balance × 0.5 (1 − industry competition level) × 0.5; units: Dmnl.
- (20)
- Circulation = 1/(1 + EXP (−0.003 × (amount of chips processed or discarded irregularly/10000 − 300))); units: Dmnl.
- (21)
- Amount of chips processed or discarded irregularly = amount of discarded chips × (1 − waste chip recycling rate); units: 10,000 pieces.
- (22)
- Amount of discarded chips = amount of scrap; units: 10,000 pieces.
- (23)
- Resistance = (foreign import stability + domestic supply stability + resource recycling factor)/3; units: Dmnl.
- (24)
- Resource recovery volume = waste chip quantity × waste chip recovery rate; units: ten thousand pieces.
- (25)
- Foreign import stability = tantalum import stability + niobium import stability + cobalt import stability + palladium import stability + platinum import stability; units: Dmnl.
- (26)
- Tantalum import stability = Congo WGI + Rwanda WGI + Brazil WGI; units: Dmnl.
- (27)
- Niobium import stability = Brazil WGI + Canada WGI + Congo WGI; units: Dmnl.
- (28)
- Cobalt import stability = Congo WGI + Russia WGI + Australia WGI; units: Dmnl.
- (29)
- Palladium import stability = Russia WGI + South Africa WGI + Canada WGI; units: Dmnl.
- (30)
- Platinum import stability = South Africa WGI + Russia WGI + Zimbabwe WGI; units: Dmnl.
- (31)
- Domestic supply stability = WITH LOOKUP(0.1 × domestic tantalum resources available years + 0.01 × domestic niobium resources available years + domestic cobalt resources available years + domestic palladium resources available years + 0.1 × domestic platinum resources available years, ([(0,0) − (100,1)], (0,0), (100,1)), Unit: Dmnl.
- (32)
- Domestic tantalum resources available years = proven tantalum reserves/tantalum mining volume; units: Dmnl.
- (33)
- Domestic cobalt resources available years = proven cobalt reserves/cobalt mining volume; units: Dmnl.
- (34)
- Domestic niobium resources available years = proven niobium reserves/niobium mining volume; units: Dmnl.
- (35)
- Domestic palladium resources availability = proven reserves of palladium/palladium mining volume; units: Dmnl.
- (36)
- Domestic platinum resource availability = proven platinum reserves/platinum mining volume; units: Dmnl.
- (37)
- Waste chip recycling rate = 20%; units: Dmnl.
- (38)
- Total R&D investment intensity = 10%; units: Dmnl.
- (39)
- Capacity planning and construction time = 1; units: year.
- (40)
- Proven tantalum reserves = WITH LOOKUP (Time, ([(IT, LL proven tantalum reserves) − (FT, UL proven tantalum reserves)], (IT, IT proven tantalum reserves, …, (FT, FT proven tantalum reserves)))); units: 10,000 tons.
- (41)
- Congo WGI = WITH LOOKUP (Time, ([(IT, LL Congo WGI) − (FT, UL Congo WGI)], (IT, IT Congo WGI, …, (FT, FT Congo WGI)))); units: Dmnl.
- (42)
- Number of chip companies = WITH LOOKUP (Time, ([(IT, LL number of chip companies) − (FT, UL number of chip companies)], (IT, IT number of chip companies, …, (FT, FT number of chip companies)))); units: companies.
- (43)
- Government taxes = 13% × GDP; units: trillion.
- (44)
- R&D investment = 6% × government taxes; units: trillion.
- (45)
- Total R&D investment = chip output value × R&D investment intensity R&D input; units: trillion.
- (46)
- Chip production = capacity utilization rate × chip production capacity; units: 10,000 pieces.
- (47)
- Capacity utilization rate = 70%; units: Dmnl.
- (48)
- Technical learning rate = 30%; units: Dmnl.
- (49)
- Sales amount = chip demand; units: 10,000 pieces.
- (50)
- Chip supply = chip production; units: 10,000 pieces.
- (51)
- Cumulative number of chip patent applications = INTEG (increase in patent applications, IT cumulative number of chip patent applications); units: 10,000 items.
- (52)
- GDP growth rate = WITH LOOKUP(Time, ([IT, LL GDP growth rate) − (FT, UL GDP growth rate)], (IT, IT GDP growth rate, …, (FT, FT GDP growth rate))); units: trillion.
We illustrate two sets of causal relationships within the SD framework with examples: supply chain resilience and capacity investment intensity, and industry competition intensity and supply chain adaptability.
Yan X et al. explored resilience investment decisions under supply chain disruptions, demand surges, and time sensitivity. Their research shows that enhancing resilience (e.g., through backup suppliers and capacity redundancy) can significantly increase the capacity of investment intensity to cope with uncertainty, and they demonstrated the long-term benefits of this investment through mathematical models [43]. Al-Banna A et al. explored the interrelationship between supply chain resilience, Industry 4.0, and investment. Their results show that enhancing resilience (e.g., digital transformation) can stimulate investment growth, particularly increasing capacity investment intensity, to build more flexible networks and optimize resilience under investment constraints [44]. The literature from these international scholars demonstrates that improving supply chain resilience can effectively increase capacity investment intensity.
Garrido-Vega P et al. directly analyzed how the competitive environment affects supply chain adaptability and agility and demonstrated through empirical data that increased competition can improve supply chain alignment capabilities, thereby improving supply–demand balance and overall performance [45]. Eckstein D et al., through empirical models, demonstrated that supply chain adaptability and agility can improve cost and operational performance, while product complexity, as a moderating variable, indicates that in highly competitive industries, these capabilities help to better achieve supply and demand balance [46]. The research emphasizes dynamic adjustments driven by competition. The literature from these international scholars illustrates that increased industry competition can effectively enhance the adaptability of the supply chain.
3. Simulation Results and Discussion
3.1. Model Testing
The validation of the system dynamics (SD) model employs specific methods, including structural testing, dimensional consistency testing, and behavioral testing. First, the variables, causal relationships, and model equations are compared with the actual structure of the high-end chip industrial chain and relevant literature to ensure that the model satisfies institutional validation requirements. Second, the SD model is examined via Vensim PLE software, and no dimensional consistency errors are detected.
C Jo et al. validated and calibrated the model by comparing it with historical macroeconomic data (including GDP-related growth trends and unemployment rate time series) to ensure that the model could accurately replicate real economic dynamics [47]. Wang Cuixia et al. used “new energy vehicle ownership” and “total GDP” to test the model’s real-world fit [33]. Finally, based on the practices of scholars at home and abroad, the model decided to use the “cumulative number of chip patent applications” and “GDP” to test the model fit. Historical statistical data from 2014 to 2023 are compared with simulated values, and errors are calculated to assess the model’s fitting quality. The analysis results are presented in Table 3, which shows that the validation errors for both cumulative chip patent applications and total GDP remain within ±15%, indicating a high degree of model fit and its ability to effectively “replicate” the real system, thereby confirming the model’s validity.
Table 3.
Error inspection of the cumulative number of chip patent applications and the total GDP volume.
3.2. Basic Scenario Simulation
The resilience of the chip industrial chain is composed primarily of robustness, innovation capability, adaptability, and circulation efficiency. Below, we simulate and analyze the dynamic changes in the overall resilience level of the industrial chain and the corresponding indicators for each resilience dimension under the benchmark scenario (basic scenario, BS).
The resilience level and changes across various dimensions of the chip industrial chain under the baseline scenario are illustrated in Figure 3 shows that between 2014 and 2023, the overall resilience of China’s chip industrial chain experienced slight fluctuations, with an initial downwards trend before beginning to rise in 2021. Specifically, it declined from 0.3583 in 2014 to 0.2382 in 2021, and subsequently increased to 0.3747 by 2023. In 2014, China’s share of the global chip market was only 6%. However, by 2021, breakthroughs in technologies such as memory chips had driven the domestic production rate of equipment to 27.4%, while the chip market share reached 16%. Following this, the market share continued to grow steadily. The shifts in supply chain resilience under the baseline scenario reflect a transition in China’s chip industry from a challenging and slower development phase to a more manageable and accelerated phase, demonstrating how the industry and supply chain evolved from an initial decline in resilience to a phase of continuous strengthening.
Figure 3.
Simulation of the resilience level of the chip industrial chain under the baseline scenario.
The changes in resilience levels across different dimensions under the baseline scenario are shown in the figure.
Innovation: Curve 3 shows that the simulated value of the innovation capability of China’s chip industry exhibited a steady upwards trend, rising from 0.4720 to 0.6278 between 2014 and 2023. Core chip technologies are reflected primarily in design, manufacturing, packaging, testing and validation, materials science, and architectural innovation. At present, China has gradually reached a world-leading level in certain technical domains, such as design and packaging. Among these, Huawei’s Kirin series chips have previously competed with international giants such as Qualcomm and Apple. Companies such as Changdian Technology, Tongfu Microelectronics, and Hua Tian Technology have already established a presence in advanced packaging technology and are approaching or have reached world-leading levels in terms of market share and technological prowess. However, owing to persistent bottlenecks in core equipment and materials, such as photolithography machines, wafers, and photoresists, the overall resilience of the industry’s innovation capability has not yet reached a high level.
Circulation: As shown in Curve 2, from 2014 to 2023, the simulated level of resilience in China’s chip industry shows a continuous upwards trend, increasing from 0.3532 to 0.4097. Discarded chips contain metal resources and toxic harmful substances. If these materials cannot be properly recycled, they will lead to resource waste and environmental pollution. The “Regulations on the Recycling and Treatment Management of Waste Electrical and Electronic Products” implemented in 2011 first included electronic waste such as chips in systematic management. The “Several Policies to Further Encourage the Development of the Software Industry and Integrated Circuit Industry” provides income tax reductions for integrated circuit manufacturing enterprises that meet environmental protection standards (such as “two-year exemption and three-year half reduction”), indirectly encouraging companies to invest in green recycling technology. As the number of discarded chips continues to grow, under the protection of relevant regulations, the resilience level in the dimension of chip circulation strength gradually increases.
Resistance: According to Curve 4, from 2014 to 2023, the resilience dimension of the chip industry’s resistance from raw material supply has shown a fluctuating decline, decreasing from −0.0580 to −0.2414 and remaining relatively low overall. The main reason is the extremely limited domestic reserves of rare metals such as tantalum, niobium, and cobalt and precious metals such as palladium and platinum, which are essential for chip production, leading to a heavy reliance on foreign imports. Metal resources are crucial to China’s technological, energy, and military development, and countries and regions such as the United States, the EU, Ukraine, and Chile have regarded mineral resources as important parts of international security strategies. Furthermore, Pettit et al. developed the Supply Chain Resilience Assessment Tool (SCRAM), defining resilience as a balance between capabilities and vulnerabilities. Dimensions (such as seven categories including financial and flexibility) allow for negative balances, representing “zones of vulnerability,” without requiring a +1 offset or mandatory positive labeling [48]. Agarwal et al. used graph theory to quantify the Supply Chain Resilience Index (SCRI), modeling dimensions (such as visibility and flexibility) as a network, allowing negative interaction values to represent negative impacts [49]. Therefore, the paper retains the range of variation as [−1, 1].
Adaptability: Curve 1 shows that from 2014 to 2023, the adaptability level of China’s chip industry exhibited overall fluctuations with a downwards trend and then shifted to an upwards trend in 2021, decreasing from 0.6661 in 2014 to 0.2361 in 2021 and then rising to 0.7027 in 2023. The risks to chip adaptability are reflected mainly in industry competition and supply-demand imbalance. National policy inclinations have propelled the robust development of the chip industry, leading to a surge in chip companies starting in 2015, which intensified industry competition and reduced adaptability resilience. In recent years, the withdrawal of many chip companies due to the tapering of subsidies has greatly diminished the resource waste caused by repetitive constructions, slowed industry competition and, coupled with the significant import substitution brought about by domestic chip production, has led to a balance in supply and demand, thereby increasing the resilience level of the adaptability of the industrial chain.
The resistance dimension remains negative throughout the simulation horizon, reflecting persistent absolute vulnerability arising from high import dependence on critical minerals and limited domestic resource availability. This does not contradict the upward trend in overall resilience, which is a composite index primarily driven by gains in innovation (via R&D feedback loops) and adaptability (improved supply–demand matching). Negative resistance values serve as a diagnostic indicator of upstream structural risks, while the system-level improvement demonstrates the compensatory role of downstream and innovation capabilities [50].
3.3. Scenario Simulation
In the process of regulating the resilience level of the real chip industrial chain, it is essential to answer two key questions, “what to regulate” and “how to regulate”, which are related to the formulation and implementation effectiveness of resilience level regulation policies and measures.
3.3.1. Regulation Strategies
The control of the resilience level in the chip industrial chain is a dynamic feedback system, and the resilience level changes with adjustments in measures and policy variations. The basis for the control scenarios set in this article is derived from the “2035 Development Strategy for China’s Integrated Circuits and Optoelectronic Chips”, “Several Policies for Promoting the High-Quality Development of the Integrated Circuit Industry and Software Industry in the New Era”, “Implementation Plan for the High-Quality Development of the Gold Industry (2025–2027)”, and “the national long-term plan for chip industry development”. On the basis of the overall development ideas proposed in the above documents, which include enhancing technical independence (total R&D investment intensity), ensuring the recovery and application of precious metals (waste chip recycling rate), and improving quality and industrial scale (innovation coefficient and policy promotion coefficient), this article establishes three scenarios for control measures, with specific scenario settings referenced in Table 4.
Table 4.
Scenario settings for various regulatory measures.
The shock magnitudes applied to total R&D intensity, innovation coefficient, waste chip recycling rate, and policy promotion coefficient (e.g., +25%, +50%, +75%, +100%) are stylized and hypothetical, intended to explore the direction and relative strength of policy leverage points rather than to replicate specific historical policy interventions. These levels are chosen to span a plausible range of policy ambition from moderate to aggressive, consistent with common practice in exploratory system dynamics research.
To examine the effectiveness of different regulatory measures, a system dynamics simulation of the policy measures was conducted. By adjusting the regulatory policy parameters, the impact of each policy on the resilience level of the chip industrial chain was studied and the dynamic changes in safety risk levels under different regulatory measures were analyzed. On this basis, corresponding policy implications are proposed. A1–A4 each implemented a specific regulatory measure on the basis of the benchmark scenario, and the simulation results are shown in Table 5.
Table 5.
Simulated values of industrial chain resilience levels under various regulatory scenarios from 2014 to 2023 (gradient-free regulation).
This article refers to the practices of Zhu Bangzhu [51] and others, using the average annual change rate of the resilience level of the industrial chain from 2014 to 2023 as a basis for comparing the effects of the implemented control measures. The simulation analysis reveals that scenarios A1–A4 have higher average annual change rates than the baseline scenario, indicating that the implementation of control measures in these four scenarios can effectively enhance the resilience of the industrial chain. Notably, the measure taken in scenario A3 is to enhance the innovative development process, which, when the model runs until 2023, has the highest value (0.4185) among all the scenarios and has the largest average annual change rate (2.63), demonstrating that improving the innovation coefficient is crucial for enhancing the resilience level of the chip industrial chain. Additionally, a comparison of the annual average growth rates reveals that the effectiveness of the four control measures in enhancing the resilience level of the chip industrial chain is ranked from greatest to least as follows: A3, A1, A4, and A2.
The implementation effects of three scenario combinations for regulation are discussed further below. Figure 4 and Figure 5 compare the changes in the resilience level of the industrial chain and the cumulative number of chip patent applications under the implementation of regulated combinations versus the baseline scenario. As shown in Figure 4, the resilience level after the implementation of the regulatory combination is significantly greater than that of the baseline scenario without regulatory measures in most cases, and the upwards trend increases over time, indicating that under the hypothetical scenario, policy measures may potentially enhance resilience. Figure 5 shows that by adjusting the resilience level through the regulatory combination simulation scheme, the cumulative number of chip patent applications under the assumed scenario increased to a certain extent year by year compared with the baseline scenario, indicating that the regulatory combination scheme may have effectively conveyed the results of technological innovation and the policy effect was achieved to a certain extent.
Figure 4.
Changes in the resilience level of the industrial chain.
Figure 5.
The cumulative number of chip patent applications.
3.3.2. Regulation Scale
The above regulatory scenario simulation revealed that increasing total R&D investment intensity, increasing the waste chip recycling rate, increasing the innovation coefficient, and increasing the policy promotion coefficient are effective measures for regulating the resilience level of the chip industrial chain. However, the regulation scale is still unclear, and further simulation of the regulation scale for each measure is needed. Below, we set the scale scenarios for the four regulatory measures (see Table 6) and simulate the dynamic changes in the resilience level of the industrial chain under different regulation scales. The shock magnitudes (e.g., +25%, +50%, +75%, +100%) are stylized and hypothetical, intended to explore the direction and relative strength of policy leverage points rather than replicate specific historical interventions. These levels span a plausible range of policy ambition (moderate to aggressive), consistent with common practice in exploratory system dynamics research [50].
Table 6.
Regulation scale scenario setting.
To provide partial empirical grounding for the shock magnitudes, we refer to observed policy amplitudes in China’s semiconductor sector. For instance, according to data from the Ministry of Industry and Information Technology (MIIT) and China Semiconductor Industry Association (CSIA), the industry’s R&D intensity (R&D expenditure as a share of sales revenue) increased from approximately 6–8% in 2015–2018 to 12–15% in leading firms post-2020 (e.g., SMIC, HiSilicon, 2021–2023). Additionally, following the first and second phases of the National Integrated Circuit Industry Investment Fund (“Big Fund”), annual patent application growth rates in IC design reached 60–120% in certain peak years (CNIPA statistics, 2018–2022). These observed ranges suggest that +50% to +100% policy-driven shocks are within plausible real-world amplitudes, although actual outcomes are influenced by multiple factors.
The results of the regulation scale scenario simulation are shown in Table 7. In terms of enhancing the intensity of total R&D investment, the turning point for the resilience level of the industrial chain occurs in the early stages of scenarios A1-1, A1-2, A1-3, and A1-4. In the early stage, R&D investments did not lead to an increase in the resilience level of the industrial chain under various regulatory scales. However, after 2018, as the intensity of R&D investment increased, the resilience level of the industrial chain significantly improved. This confirms the characteristics of knowledge-intensive industries such as the chip industry, where early investments are high but returns are slow, indicating that R&D investment in the chip industry should focus on sustainability and accept the reality of delayed returns. Moreover, in 2018, a large amount of redundant chip production capacity was reduced, and financial resources were further concentrated and optimized, which may be an important reason for that year becoming a turning point.
Table 7.
Simulated values of industrial chain resilience levels under various regulatory scenarios from 2014 to 2023.
In terms of promoting resource recycling and utilization, with the increase in the waste chip recycling rate, the turning point shifted to 2014. When the waste chip recycling rate reaches 47%, there is no turning point, meaning that when the waste chip recycling rate exceeds 47%, the resilience level of the industrial chain significantly improves annually. The continuously increasing high recycling rate of chips can increase the guaranteed capacity of key mineral resources such as tantalum, niobium, cobalt, palladium, and platinum, reducing resource dependency, while it can also avoid resource waste and environmental pollution. However, this is an exemplary result under the model scenario, not a universal optimum.
With respect to enhancing the innovation coefficient, continuous improvement in the innovation coefficient leads to a consistent increase in the resilience level of the industrial chain. The increase in the innovation coefficient forges the dynamic resilience of the chip industrial chain, essentially representing the genetic evolution of the technological ecosystem. The deep standardization of technical interfaces allows seamless integration of design and manufacturing, greatly compressing the process switching time. Implicit process knowledge is distilled into portable digital models, significantly shortening the reconstruction cycle of production capacity postcrisis. The modular revolution of equipment achieves cross-platform compatibility of core components, reducing interruption recovery times from years to months.
Regarding the depth of policy promotion, simulation results indicate that as the policy promotion coefficient continues to increase, the resilience of the industrial chain may be potentially enhanced. A turning point was clearly observed in 2020, mainly due to the increased difficulty of policy promotion caused by pandemic lockdowns. As China’s chip industry continues to develop, the strength of policy promotion should continually serve the domestic production process. This is fundamentally consistent with the path that Western countries take to develop their own industries. Excessive reliance on foreign products hinders the cultivation of the local industrial chain, which in turn affects the realization of technological breakthroughs and deep domestic replacement. This situation is likely to impact the resilience of China’s chip industrial chain in the uncertain future.
3.3.3. Sensitivity Analysis
Based on the results in the table above, this paper uses the total R&D investment intensity, waste chip recycling rate, innovation coefficient, and policy promotion coefficient as control variables, and the core variable “resilience level of the industrial chain” as the dependent variable to test the sensitivity of the model.
- (1)
- Scenario 1: A-1
According to the sensitivity analysis shown in the Figure 6 below, we can see that research and development (R&D) investment intensity gradually increases through the strategy of increasing total R&D investment intensity. The figure shows A1-1 (25% increase), A1-2 (50% increase), A1-3 (75% increase), A1-4 (100% increase), and BS (baseline scenario). Based on the results shown in the figure, from the perspective of model robustness, when the total R&D investment intensity varies within a reasonable range, the growth and decay trends of the core variable “resilience level of the industrial chain” remain unchanged. That is, the main oscillation behavior pattern indicates that the model has good robustness. The overall results show that the model results are not a coincidental reflection of a specific parameter value but have general applicability. The greater the R&D investment intensity from 2019 to 2023, the greater the improvement in the “resilience level of the industrial chain,” indicating that the effects of total R&D investment intensity have a time lag. This also identifies total R&D investment intensity as a key parameter for this model.
Figure 6.
Resilience level of the industrial chain in scenario 1.
- (2)
- Scenario 2: A-2
According to the sensitivity analysis shown in the Figure 7 below, the waste chip recycling rate is gradually increased by promoting resource recycling and utilization. The figure shows A2-1 (25% increase), A2-2 (50% increase), A2-3 (75% increase), A2-4 (100% increase), and BS (baseline scenario). Based on the results shown in the graph, from the perspective of model robustness, when the waste chip recycling rate varies within a reasonable range, the growth and decline trends of the core variable “resilience level of the industrial chain” remain unchanged. That is, the main oscillation behavior pattern indicates that the model has good robustness. The overall results show that the model results are not a coincidental reflection of a specific parameter value but have general applicability. The Table 7 and the Figure 7 show that when the waste chip recycling rate = 47%, the core variable “resilience level of the industrial chain” shows a significant year-on-year increase, and after 2021, a divergence from the BS (baseline scenario) occurs, indicating that the strategy’s effectiveness is significantly improved and identifying the waste chip recycling rate as a key parameter for this model.
Figure 7.
Resilience level of the industrial chain in scenario 2.
- (3)
- Scenario 3: A-3
According to the sensitivity analysis shown in the Figure 8 below, the innovation coefficient is gradually increased by implementing strategies to enhance the innovative development process. The figure shows A3-1 (25% increase), A3-2 (50% increase), A3-3 (75% increase), A3-4 (100% increase), and BS (baseline scenario). Based on the results shown in the graph, from the perspective of model robustness, when the innovation coefficient varies within a reasonable range, the growth and decay trends of the model’s core variable, “resilience level of the industrial chain,” remain unchanged. This indicates that the main oscillation behavior pattern demonstrates good model robustness. The overall results show that the model results are not a coincidental reflection of a specific parameter value but rather have general applicability. The Table 7 and the Figure 8 show that as the innovation coefficient increases, the model’s core variable, “resilience level of the industrial chain,” significantly improves year by year, and a divergence occurs after 2021 compared to the BS (baseline scenario), indicating a significant improvement in the strategy’s effectiveness and identifying the innovation coefficient as a key parameter for this model.
Figure 8.
Resilience level of the industrial chain in scenario 3.
- (4)
- Scenario 4: A-4
According to the sensitivity analysis shown in the Figure 9 below, the policy promotion coefficient is gradually increased by expanding the depth of policy promotion. The figure shows scenarios A4-1 (25% increase), A4-2 (50% increase), A4-3 (75% increase), A4-4 (100% increase), and BS (baseline scenario). Based on the results shown in the figure, from the perspective of model robustness, when the policy promotion coefficient varies within a reasonable range, the growth and decay trends of the core variable “resilience level of the industrial chain” remain unchanged. That is, the main oscillation behavior pattern indicates that the model has good robustness. The overall results show that the model results are not a coincidental reflection of a specific parameter value but have general applicability. The Table 7 and the Figure 9 show that as the policy promotion coefficient continuously increases, the core variable “resilience level of the industrial chain” significantly improves year by year, and a divergence phenomenon appears after 2021 compared to the BS (baseline scenario), indicating that the strategy’s effectiveness is significantly enhanced, and identifying the policy promotion coefficient as a key parameter for this model.
Figure 9.
Resilience level of the industrial chain in scenario 4.
4. Conclusions and Recommendations
4.1. Research Conclusion
On the basis of an analysis of the factors influencing the resilience of the chip industrial chain, this paper develops a system dynamics model that captures the interplay between key resilience dimensions within the industry. Using a system dynamics methodology, this study simulates the dynamics of the industrial chain’s resilience level under various policy scenarios and examines critical aspects of resilience-level regulation. The policy implications presented are derived directly from the simulation results under hypothetical scenarios and should be interpreted as exploratory insights rather than normative prescriptions. In this study, resilience serves simultaneously as a monitoring index (composite outcome) and an endogenous driver within the feedback structure, enabling the model to capture both static structural vulnerabilities and dynamic capability accumulation. The principal conclusions of this study are as follows:
- (1)
- From 2014 to 2021, the resilience of China’s chip industrial chain underwent a phase of decline, primarily due to the lack of significant returns on earlier investments, high external dependence on key mineral resources, a combination of chip overcapacity, and the impact of the global pandemic. These factors collectively contributed to a prolonged weakening of the industrial chain’s resilience. After 2021, a phase of recovery emerged, largely because earlier investments began to yield returns, overcapacity was alleviated, and postpandemic economic recovery took place, leading to a steady increase in the resilience of China’s chip industrial chain.
- (2)
- Across the various dimensions of resilience, both innovation and circulation exhibit a continuous upwards trend. The resistance demonstrated a slight downwards trend with fluctuations and remained below 0, indicating a low level of resilience in this dimension. Adaptability shows a pattern of initial decline followed by an increase, with a more rapid rise in the later stage, which is associated primarily with the improved equilibrium between supply and demand during the latter period.
- (3)
- Compared with the baseline scenario, all four regulatory scenarios can effectively enhance the simulated resilience level of the industrial chain, with the increase in the innovation coefficient having the most pronounced effect on promoting industrial chain resilience. The specific regulatory effects, ranked in descending order, are as follows: enhancing the innovation-driven development process, increasing the intensity of total R&D investment, expanding the depth of policy implementation, and promoting resource recycling and utilization.
In terms of the regulatory scale, the following insights can be drawn. First, the chip industry should focus on long-term development and appropriately increase investment in research and development, as the resulting increase in resilience levels has a lagging effect. Second, increasing the recycling rate of waste chips to over 47% can effectively improve resilience levels. Third, the increase in the innovation coefficient has a significant effect on enhancing the resilience of the chip industrial chain, and attention should be given to the strong impetus brought about by the evolution of the technological ecosystem and collaborative synergy among industry, academia, and research. Fourth, the effect of policy regulation is strongly influenced by unexpected events such as the pandemic, and as the policy promotion coefficient increases, the resilience of the industrial chain becomes more susceptible to the impact of such unforeseen incidents.
4.2. Policy Recommendations
As the world’s largest consumer of chips, China finds itself at a critical juncture amid profound change unseen in a century. The high-quality development of the chip industry has substantial practical importance, and there is an urgent need to establish a strategic framework for enhancing the resilience of the chip industrial chain at this new stage of development. To this end, based on the research findings presented in this paper and insights derived from the model’s exploratory simulations, the following policy recommendations are proposed, but real-world implementation would require further empirical validation and context-specific adaptation.
First, the controllability of key resource factors should be enhanced to establish a “filling the chain” support mechanism for improving the resilience of the chip industrial chain. Currently, key equipment and raw materials such as lithography machines and photoresists still rely on imports, which has a profound impact on the security of China’s chip industrial chain. It is recommended to promote the independent and systematic development of high-end chips, achieve breakthroughs in key technology areas such as EUV lithography machines, etching machines, and target materials, and strengthen the supply of high-level independent technological elements. Ensuring the supply of core raw materials such as cobalt, palladium, and platinum, which are relatively easy to recycle, is key to building a high-level resource recycling system. This requires vigorously promoting waste chip recycling technology and improving relevant regulations. Simultaneously, while ensuring key mineral resources, a multi-channel strategic layout and overseas expansion strategy should be adopted. Furthermore, it is necessary to strengthen the exploration and development of domestic mineral resources while ensuring sustainable development.
Second, horizontal and vertical extension as well as ecological coordination are achieved to forge a “stabilizing the chain” structure that enhances the resilience of the chip industrial chain. First, China’s chip industry has entered a period of considerable return on investment, and it is essential to continue increasing capital investment while gradually advancing toward full-process production of high-end chips, thereby ensuring stable funding supply across the industrial chain. Second, at the level of market supply and demand, it is important to provide sound guidance, avoid overcapacity and redundant construction, make full use of resources, progressively address the shortfall in high-end chips, and strengthen the stability of the market environment.
Third, the fundamental task of “consolidating the chain” in the chip industry should be achieved in the following ways: building an efficient innovation ecosystem centered on talent and international collaboration; focusing on key segments of the chip industrial chain to enhance the cultivation of specialized talent in fields such as integrated circuits and materials within universities and research institutions; improving mechanisms for attracting and retaining high-level overseas expertise; establishing a vocational training system that covers mid- to low-end positions across the entire chip industrial chain, including design, manufacturing, and packaging/testing; actively expanding the diverse international cooperation channels for key technologies and equipment in the chip industry under the dual circulation pattern; promoting the joint establishment of international laboratories and R&D centers; and actively participating in the formulation of global technical standards for chips and the planning of industry roadmaps to strengthen China’s influence on international rule-making.
Fourth, the “strengthening the chain” environment for the chip industrial chain should be optimized: The dual-driven approach of policy coordination and financial support should be strengthened. More targeted support policies for the chip industrial chain should be formulated and implemented, with a focus on promoting information sharing, capacity coordination, and technological interaction between upstream and downstream enterprises. Policy design should incorporate forward-looking solutions to address sudden supply chain shocks, such as supply disruptions, and establish sound risk monitoring and early warning response mechanisms for the chip industrial chain. The allocation of financial resources to weak links in the chip industrial chain and key core technology areas should be promoted. Policies such as tax incentives and special subsidies should be optimized to precisely stimulate innovation and domestic substitution in chip research and development. The application and promotion of domestic chips in key industries should be increased, guiding the industrial chain toward a safe, resilient, and advanced direction through market demand.
These insights are derived from exploratory simulations and should be interpreted as scenario-based patterns rather than prescriptive policy recommendations. Real-world implementation requires further empirical validation and context-specific adjustments.
While the regulatory measures simulated in this study—such as increasing R&D intensity, elevating the innovation coefficient, promoting resource recycling, and deepening policy promotion—can significantly enhance the resilience of China’s chip industrial chain in the short-to-medium term, policymakers must carefully navigate the inherent trade-offs between short-term resilience gains and long-term sustainability. Park et al. use a dynamic optimization model to explicitly analyze the trade-offs between short-term costs and long-term benefits of resilience investments, providing methodological grounding for our analysis [52]. Short-term resilience strategies, particularly aggressive increases in R&D investment and policy-driven demand stimulation, often require substantial upfront capital allocation and may lead to temporary fiscal strain, overcapacity risks, or resource misallocation if not carefully phased. For instance, rapid scaling of subsidies or production capacity expansion can yield immediate improvements in supply–demand balance and innovation output, yet excessive focus on short-term performance metrics may divert resources from foundational long-term investments, such as talent cultivation, basic research infrastructure, and international collaboration ecosystems. Over-reliance on policy promotion in the near term could also create dependency on government support, potentially weakening market-driven innovation mechanisms in the longer run. Conversely, prioritizing long-term sustainability—through gradual ecosystem building, green manufacturing transitions, and diversified global partnerships—may delay visible resilience improvements but ensure more robust, self-reliant, and environmentally sustainable development of the industrial chain. Therefore, a balanced policy approach is recommended: combining targeted short-term interventions to mitigate immediate vulnerabilities (e.g., geopolitical supply risks) with sustained, structural investments that foster endogenous innovation and circular economy practices. This dual-track strategy will help to achieve not only rapid recovery from disruptions but also enduring competitiveness in an increasingly volatile global technological landscape.
4.3. External Validity and International Applicability
Recent analyses of the global chip supply chain, such as the 2024 report by the Boston Consulting Group (BCG) [53] and the Chip Industry Association titled Emerging Resilience in the Chip Supply Chain, highlight the ongoing shifts toward greater geographic diversification, policy-driven investments, and regional dependencies in response to geopolitical tensions and supply disruptions. These developments underscore the importance of examining the external validity and international applicability of resilience models originally developed in a China-specific context, as similar dynamics—albeit with varying scales and constraints—are increasingly evident in other late-industrializing economies seeking to strengthen their positions in the global value chain.
While the system dynamics model developed in this study is tailored to the specific context of China’s chip industrial chain, its underlying framework—encompassing resilience dimensions such as resistance, innovation, adaptability, and circulation—holds potential for broader application. The model’s emphasis on feedback loops, policy interventions, and dynamic interactions between internal and external factors can inform resilience strategies in other emerging economies facing similar challenges in global technological competition. For instance, late-industrializing nations like India and Vietnam, which are increasingly integrating into the global chip value chain, could adapt this approach to address vulnerabilities in raw material supply, technological innovation, and market demand fluctuations. These countries share parallels with China, including rapid industrialization, dependence on imports for critical minerals, and exposure to geopolitical risks, making the model’s scenario-based simulations relevant for evaluating policy impacts on supply chain stability.
However, the generalizability of our findings is contingent upon unique contextual factors that may vary across regions. China’s distinctive advantages, such as its large-scale policy support (e.g., extensive R&D subsidies and industrial promotion initiatives), massive domestic market size, and centralized governance structures, play a pivotal role in amplifying the effectiveness of resilience-enhancing measures like innovation coefficient increases or resource recycling. In contrast, economies like India and Vietnam may face constraints in policy scale and implementation capacity, potentially leading to different outcomes when applying similar regulatory scenarios. For example, while the model demonstrates significant resilience gains from elevated innovation development in China, smaller-scale interventions in other contexts might yield more modest improvements due to limited talent pools or infrastructure. This highlights the need for context-specific calibrations, including adjustments to parameters like geopolitical risk indices or economic growth rates, to ensure accurate applicability.
Recent analyses of global chip supply chains underscore these dynamics, noting emerging resilience through geographic diversification and policy-driven investments, while emphasizing regional dependencies. Adapting our model to international settings could involve comparative simulations, testing its robustness across diverse economic landscapes to provide tailored insights for global supply chain management. Future research should empirically validate these extensions through case studies in other late-industrializing economies to enhance the model’s external validity.
Author Contributions
Conceptualization, B.K.; methodology, J.H.; writing—original draft preparation, B.K.; writing—review and editing, J.S. and D.C.; funding acquisition, J.H. and J.S. All authors have read and agreed to the published version of the manuscript.
Funding
This research is partially supported by the National Social Science Fund in China (The funder is National Office for Philosophy and Social Sciences, the funding number is 21XMZ002), the Natural Science Foundation of Chongqing (The funder is Chongqing Science and Technology Bureau, the funding number is CSTB2022NSCQ-MSX1294), and the Humanities and Social Science Research Project of the Ministry of Education in China (The funder is Ministry of Education of the People’s Republic of China, the funding number is 19YJCZH054).
Data Availability Statement
The data presented in this study are included in the article.
Acknowledgments
The authors extend their sincere gratitude to the anonymous reviewers for their insightful recommendations and constructive feedback, which have significantly contributed to the improvement of this manuscript. We also thank the editorial team for their diligent work, guidance, and patience throughout the review process.
Conflicts of Interest
The authors declare that no competing interests exist.
References
- Gu, T.A.; Xu, B.; Zhang, D.H.; Xu, G.T. The competition and challenges between China and the United States in basic research on key technologies. Sci. Technol. Rev. 2025, 43, 100–105. [Google Scholar] [CrossRef]
- Cai, H.B.; Zheng, H.Q.; Yu, T.C. The impact of the US ‘de-risk’ on the security of China’s industrial and supply chains and the response. Financ. Issues Res. 2024, 1, 33–43. [Google Scholar] [CrossRef]
- Liu, G.; Li, Y.F. Scale demand and chip industry upgrading path: Analysis based on Zhuhai chip industry innovation network. Sci. Stud. 2024, 42, 2497–2508. [Google Scholar] [CrossRef]
- Cai, C.H. The competitive situation of the global chip semiconductor industry and the opportunities of China. People’s Trib. 2022, 14, 92–96. [Google Scholar] [CrossRef]
- Liang, C.L. China’s chip industry will usher in a historic opportunity. Financ. Technol. Time 2018, 6, 95. [Google Scholar] [CrossRef]
- Hamzat, A.K.; Murad, M.d.S.; Subeshan, B.; Asmatulu, R.; Asmatulu, E. Rare earth element recycling: A review on sustainable solutions and impacts on semiconductor and chip industries. J. Mater. Cycles Waste Manag. 2025, 27, 3009–3032. [Google Scholar] [CrossRef] [Scilit]
- Wang, Z.; Li, Y.; Liu, P.P. The security situation of the supply chain of key minerals in the United States under the background of great power competition and its implications. Sci. Technol. Rev. 2024, 42, 21–29. [Google Scholar] [CrossRef]
- Cui, L.B.; Weng, S.M.; Mo, J.L. China chip import supply chain disruption risk, substitutability and its economic impact assessment. Int. Trade Issues 2023, 3, 124–140. [Google Scholar] [CrossRef]
- Feng, Y.C.; Cao, X.R.; Su, M.M.; Yan, Z.C. Research on the Restructuring of Innovation Networks of Chinese Chip Enterprises under Overseas Sanctions. Manag. Res. Dev. 2024, 45, 89–99. [Google Scholar] [CrossRef]
- Liu, Q.; Xue, D.; Li, W. A sustainable production segment of global value chain view on semiconductors in China: Temporal and spatial evolution and investment network. Sustainability 2024, 16, 8617. [Google Scholar] [CrossRef] [Scilit]
- Guo, H.; Shen, Z.; Chen, Y.; Dong, M. Analyzing the impact of government R&D subsidy and digital transformation on supply chain risk dynamics management and firm performance in the China’s chip industry. Int. J. Prod. Econ. 2025, 281, 109524. [Google Scholar] [CrossRef] [Scilit]
- Ji, X.; Zhai, Y.; Fu, S.; Lu, C. Towards the sustainable development of logistics system model: A system dynamics approach. PLoS ONE 2023, 18, e0279687. [Google Scholar] [CrossRef] [Scilit] [PubMed]
- Schmitt Olabisi, L.; Sidibé, A. Observations from a system dynamics modeling field school in Mali. Syst. Dyn. Rev. 2023, 39, 80–94. [Google Scholar] [CrossRef] [Scilit]
- Wu, D.D.; Liu, J.; Olson, D.L. Simulation Decision System on the Preparation of Emergency Resources Using System Dynamics: Simulation Decision. Syst. Res. 2015, 32, 603–615. [Google Scholar] [CrossRef] [Scilit]
- Cunico, G.; Aivazidou, E.; Mollona, E. System dynamics gamification: A proposal for shared principles. Syst. Res. Behav. Sci. 2022, 39, 723–733. [Google Scholar] [CrossRef] [Scilit]
- Bouloiz, H.; Garbolino, E.; Tkiouat, M.; Guarnieri, F. A system dynamics model for behavioral analysis of safety conditions in a chemical storage unit. Saf. Sci. 2013, 58, 32–40. [Google Scholar] [CrossRef] [Scilit]
- Rathore, R.; Thakkar, J.J.; Jha, J.K. Impact of risks in foodgrains transportation system: A system dynamics approach. Int. J. Prod. Res. 2021, 59, 1814–1833. [Google Scholar] [CrossRef] [Scilit]
- Morcillo, J.D.; Angulo, F.; Franco, C.J. Analyzing the Hydroelectricity Variability on Power Markets from a System Dynamics and Dynamic Systems Perspective: Seasonality and ENSO Phenomenon. Energies 2020, 13, 2381. [Google Scholar] [CrossRef] [Scilit]
- El-Sefy, M.; Ezzeldin, M.; El-Dakhakhni, W.; Wiebe, L.; Nagasaki, S. System dynamics simulation of the thermal dynamic processes in nuclear power plants. Nucl. Eng. Technol. 2019, 51, 1540–1553. [Google Scholar] [CrossRef] [Scilit]
- Zhou, H.; Yang, Y. Research on the mechanism of knowledge coupling affecting firms’ innovation results driven by digitization—Based on system dynamics methodology. Kybernetes 2023, 52, 4322–4339. [Google Scholar] [CrossRef] [Scilit]
- Elsawah, S.; Pierce, S.A.; Hamilton, S.H.; van Delden, H.; Haase, D.; Elmahdi, A.; Jakeman, A.J. An overview of the system dynamics process for integrated modelling of socio-ecological systems: Lessons on good modelling practice from five case studies. Environ. Model. Softw. 2017, 93, 127–145. [Google Scholar] [CrossRef] [Scilit]
- Zhong, S.; Lin, D. Evaluation of the Coordination Degree of Coal and Gas Co-Mining System Based on System Dynamics. Sustainability 2022, 14, 16434. [Google Scholar] [CrossRef] [Scilit]
- Lim, J.H.; Kim, H.W.; Hong, S.; Oh, J.W.; Bae, D.S. Simulation Technology Development for Dynamic Analysis of Mechanical System in Deep-Seabed Integrated Mining System Using Multibody Dynamics. Minerals 2022, 12, 498. [Google Scholar] [CrossRef] [Scilit]
- Davahli, M.R.; Karwowski, W.; Taiar, R. A System Dynamics Simulation Applied to Healthcare: A Systematic Review. Int. J. Env. Environ. Res. Public. Health 2020, 17, 5741. [Google Scholar] [CrossRef] [Scilit] [PubMed]
- Apostolopoulos, Y.; Lemke, M.K.; Barry, A.E.; Lich, K.H. Moving alcohol prevention research forward-Part II: New directions grounded in community-based system dynamics modeling. Addiction 2018, 113, 363–371. [Google Scholar] [CrossRef] [Scilit] [PubMed]
- Garbolino, E.; Chery, J.P.; Guarnieri, F. A Simplified Approach to Risk Assessment Based on System Dynamics: An Industrial Case Study. Risk Anal. 2016, 36, 16–29. [Google Scholar] [CrossRef] [Scilit]
- Zhu, X.; Guo, X.; Liu, H.; Li, S.; Zhang, X. The Influence of System Dynamics Resource Sharing on Collaborative Manufacturing Efficiency—Based on the Multiagent System and System Dynamics Method. Front. Psychol. 2022, 13, 837171. [Google Scholar] [CrossRef] [Scilit]
- Gadewadikar, J.; Marshall, J. A methodology for parameter estimation in system dynamics models using artificial intelligence. Syst. Eng. 2024, 27, 253–266. [Google Scholar] [CrossRef] [Scilit]
- Zhou, X.Y.; Xu, Y.S.; Li, Z.Y.; Wu, D.; Wang, S.Y. Resilience of strategic critical mineral trade networks: A full industry chain analysis in both natural and political contexts. Syst. Eng. Theory Pract. 2025, 1–25. Available online: https://link.cnki.net/urlid/11.2267.n.20250611.1839.006 (accessed on 30 January 2026).
- Guo, Q.; Liu, Y.; Lin, W. Risk Evaluation and Early Warning Study on Supply of Critical Minerals for China’s Chip Industry. Comput Econ. 2025. [Google Scholar] [CrossRef] [Scilit]
- Xiang, L.Y.; Zhao, Y.Z.; Yu, R.J. Risks and evolution of chip industry technology chain. Sci. Res. 2024, 42, 278–288. [Google Scholar] [CrossRef]
- Hmaidi, A. Huawei is Quietly Dominating China’s Semiconductor Supply Chain. Curr. Hist. 2024, 123, 68–79. [Google Scholar] [CrossRef] [Scilit]
- Wang, C.X.; Wei, L.; Li, W. Research on safety risk assessment and regulation of new energy vehicle industry chain from the perspective of resilience. Ind. Eng. Manag. 2025, 30, 1–19. [Google Scholar] [CrossRef]
- Kadeer, A.; Wang, X.; He, H.; Dai, L. Complexity analysis of a closed-loop supply chain for power battery recycling under government subsidies. PLoS ONE 2025, 20, e0322888. [Google Scholar] [CrossRef] [Scilit]
- Holling, C.S. Resilience and Stability of Ecological Systems [EB/OL]. 1973. Available online: https://www.annualreviews.org/doi/abs/10.1146/annurev.es.04.110173.000245 (accessed on 8 October 2025).
- Walker, B.; Holling, C.S.; Carpenter, S.R.; Kinzig, A. Resilience, adaptability and transformability in social–ecological systems. Ecol. Soc. 2004, 9, 5. [Google Scholar] [CrossRef] [Scilit]
- Abdul-Rahman, M.; Alade, W.; Anwer, S. A Composite Resilience Index (CRI) for Developing Resilience and Sustainability in University Towns. Sustainability 2023, 15, 3057. [Google Scholar] [CrossRef] [Scilit]
- Shu, Q.; Scott, M.; Todman, L.; McGrane, S.J. Development of a prototype composite index for resilience and security of water-energy-food (WEF) systems in industrialised nations. Environ. Sustain. Indic. 2021, 11, 100124. [Google Scholar] [CrossRef] [Scilit]
- El Rashidy, R.A.H.; Grant-Muller, S. A composite resilience index for road transport networks. In Proceedings of the Institution of Civil Engineers-Transport; Thomas Telford Ltd.: London, UK, 2019; Volume 172, pp. 174–183. [Google Scholar]
- Yuan, X.J.; Wang, A.J.; Ma, Z. Global governance system of cobalt resources and China’s participation path. Sci. Technol. Rev. 2024, 42, 70–80. [Google Scholar] [CrossRef]
- Shen, F.; Ma, T.J.; Zhao, X.R.; Xu, N.Y.; Feng, J.B.; Ma, Y. Analysis of the diffusion of private electric vehicles under the incentive policy reduction: A case study of Shanghai. J. Manag. Sci. 2021, 24, 79–104. [Google Scholar] [CrossRef]
- Ren, B.; Shao, L.N.; You, J.X. The generalized Bass model of China’s electric vehicles based on the theory of innovation diffusion. Soft Sci. 2013, 27, 17–22. [Google Scholar] [CrossRef]
- Yan, X.; Li, J.; Sun, Y.; De Souza, R. Supply chain resilience enhancement strategies in the context of supply disruptions, demand surges, and time sensitivity. Fundam. Res. 2025, 5, 496–504. [Google Scholar] [CrossRef] [Scilit] [PubMed]
- Al-Banna, A.; Rana, Z.A.; Yaqot, M.; Menezes, B. Interconnectedness between supply chain resilience, industry 4.0, and investment. Logistics 2023, 7, 50. [Google Scholar] [CrossRef] [Scilit]
- Garrido-Vega, P.; Sacristán-Díaz, M.; Moyano-Fuentes, J.; Alfalla-Luque, R. The role of competitive environment and strategy in the supply chain’s agility, adaptability and alignment capabilities. Eur. J. Manag. Bus. Econ. 2023, 32, 133–148. [Google Scholar] [CrossRef] [Scilit]
- Eckstein, D.; Goellner, M.; Blome, C.; Henke, M. The performance impact of supply chain agility and supply chain adaptability: The moderating effect of product complexity. Int. J. Prod. Res. 2015, 53, 3028–3046. [Google Scholar] [CrossRef] [Scilit]
- Jo, C.; Kim, D.H.; Lee, J.W. Forecasting unemployment and employment: A system dynamics approach. Technol. Forecast. Soc. Chang. 2023, 194, 122715. [Google Scholar] [CrossRef] [Scilit]
- Pettit, T.J.; Croxton, K.L.; Fiksel, J. Ensuring supply chain resilience: Development and implementation of an assessment tool. J. Bus. Logist. 2013, 34, 46–76. [Google Scholar] [CrossRef] [Scilit]
- Agarwal, N.; Seth, N.; Agarwal, A. Evaluation of supply chain resilience index: A graph theory based approach. Benchmark. Intern. J. 2022, 29, 735–766. [Google Scholar] [CrossRef] [Scilit]
- Sterman, J. System Dynamics: Systems Thinking and Modeling for a Complex World; MIT Library: Cambridge, MA, USA, 2002. [Google Scholar]
- Zhu, B.Z.; Tang, J.J.; Jiang, M.X.; Wang, P. Research on risk simulation and regulation of carbon market based on system dynamics. Syst. Eng. Theory Pract. 2022, 42, 1859–1872. [Google Scholar] [CrossRef]
- Ardila-Rueda, W.; Savachkin, A.; Romero-Rodriguez, D.; Navarro, J. Balancing the costs and benefits of resilience-based decision making. Decis. Support Syst. 2025, 191, 114425. [Google Scholar] [CrossRef] [Scilit]
- Varadarajan, R.; Koch-Weser, I.; Richard, C.; Fitzgerald, J.; Singh, J.; Thornton, M.; Casanova, R.; Isaacs, D. Emerging Resilience in the Semiconductor Supply Chain. Boston Consulting Group. Semiconductor Industry Association. 2024. Available online: https://web-assets.bcg.com/57/d1/ad16a66b41f5a178aca9274ca36f/emerging-resilience-in-the-semiconductor-supply-chain.pdf (accessed on 30 January 2026).
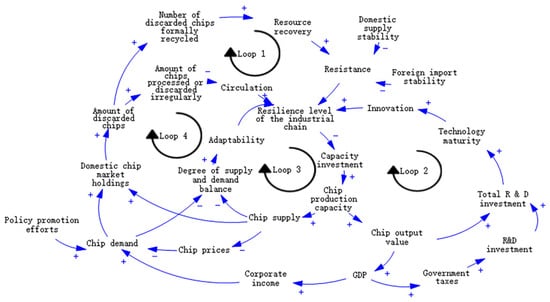
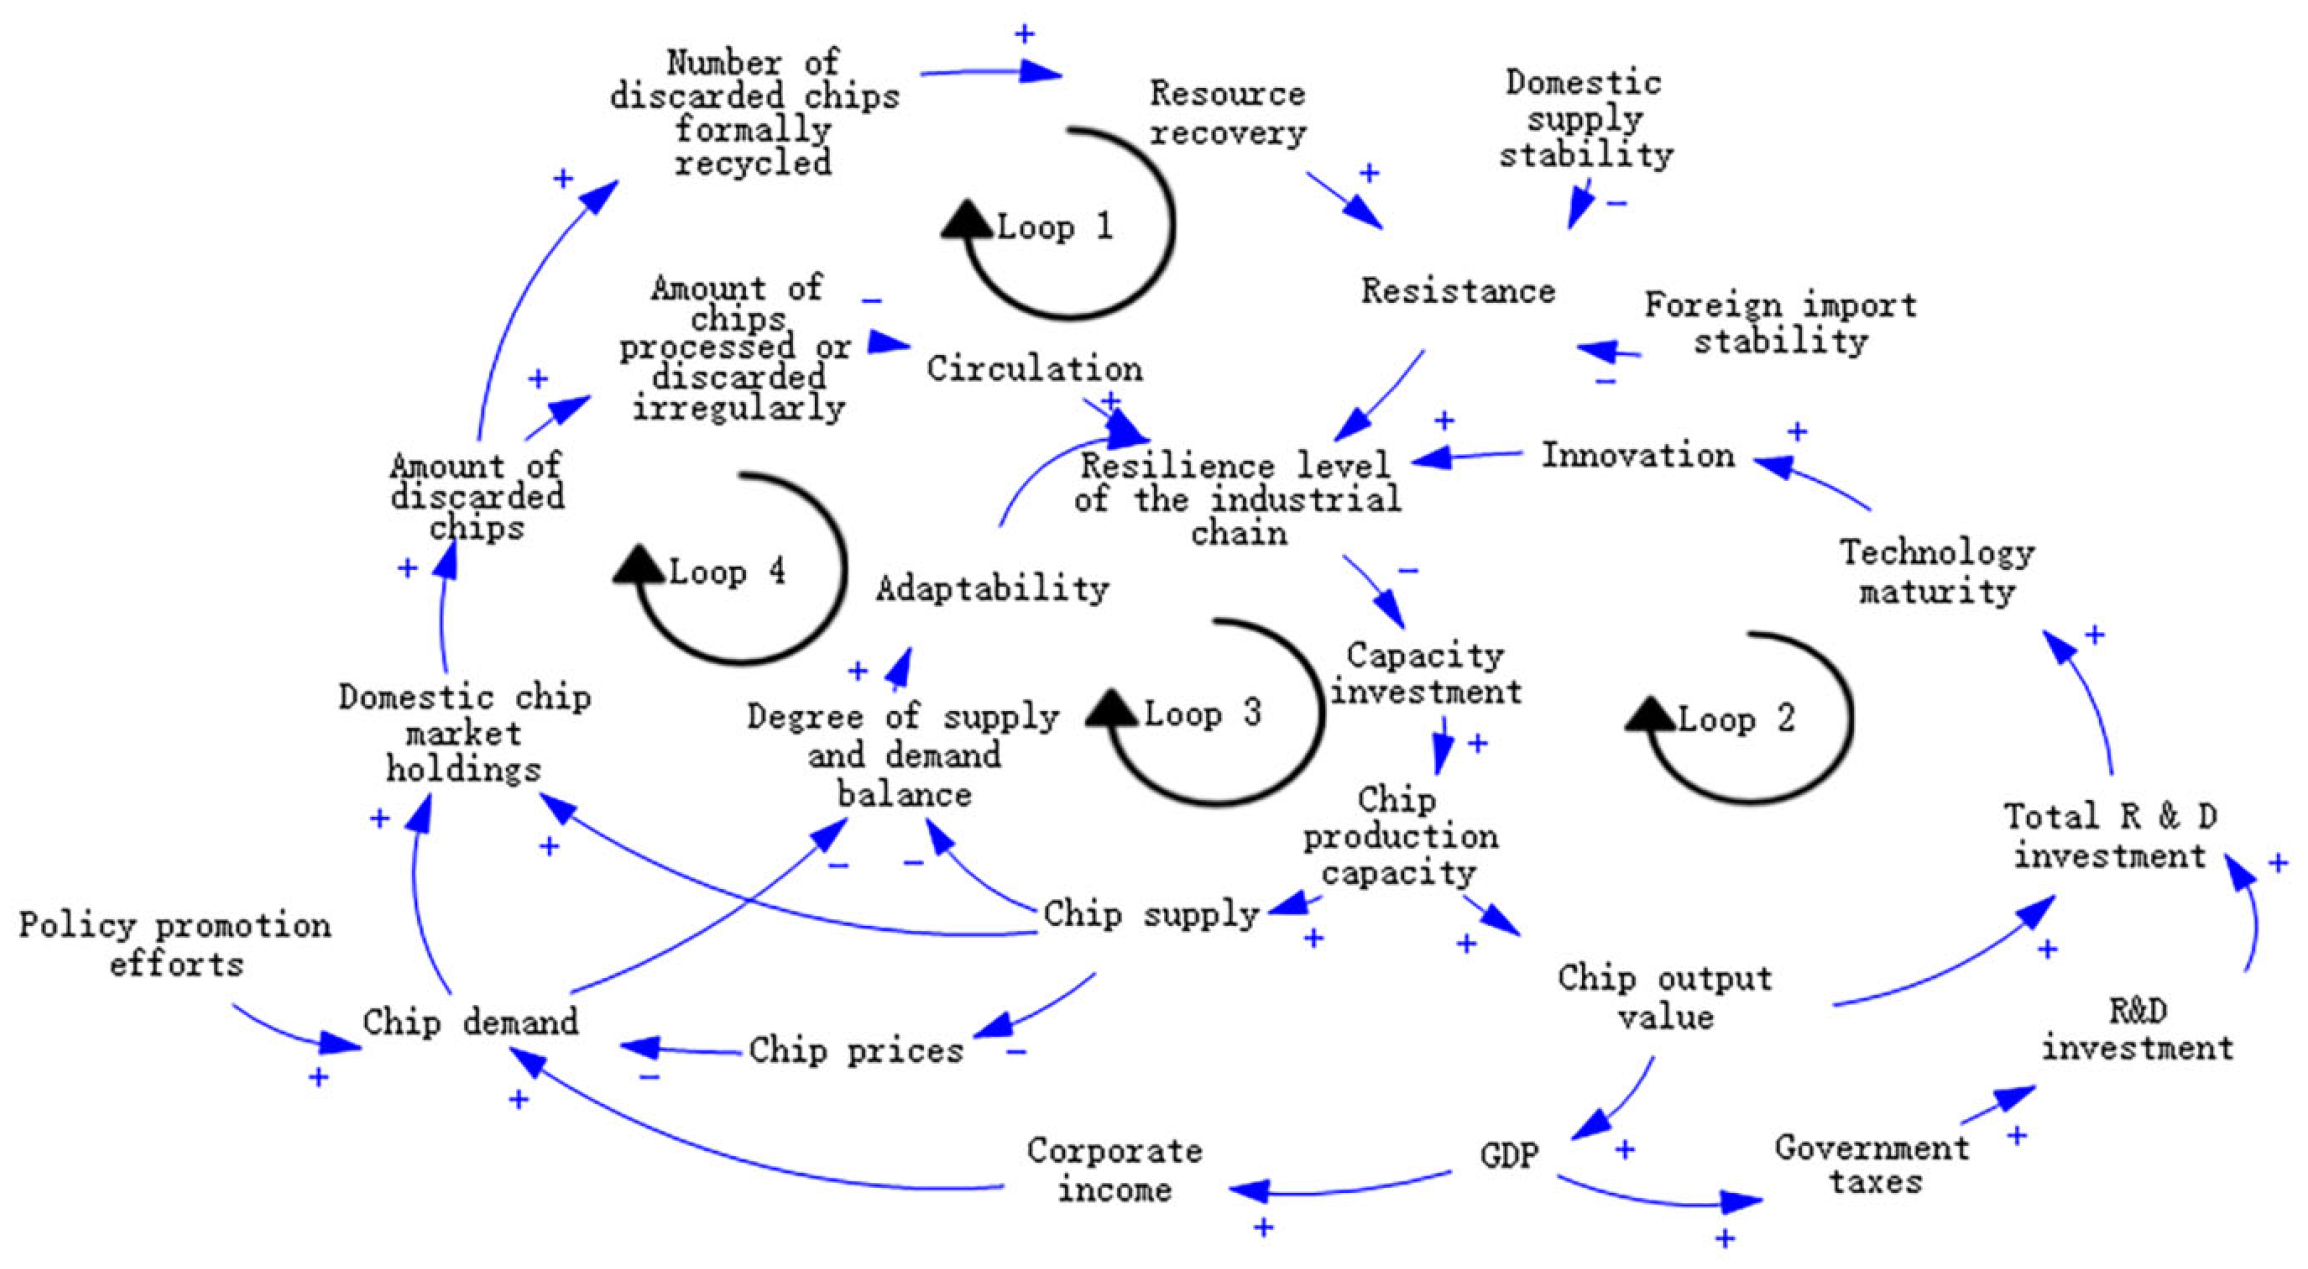
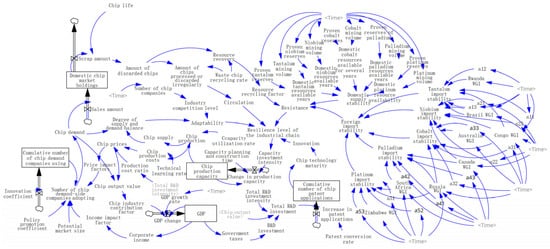
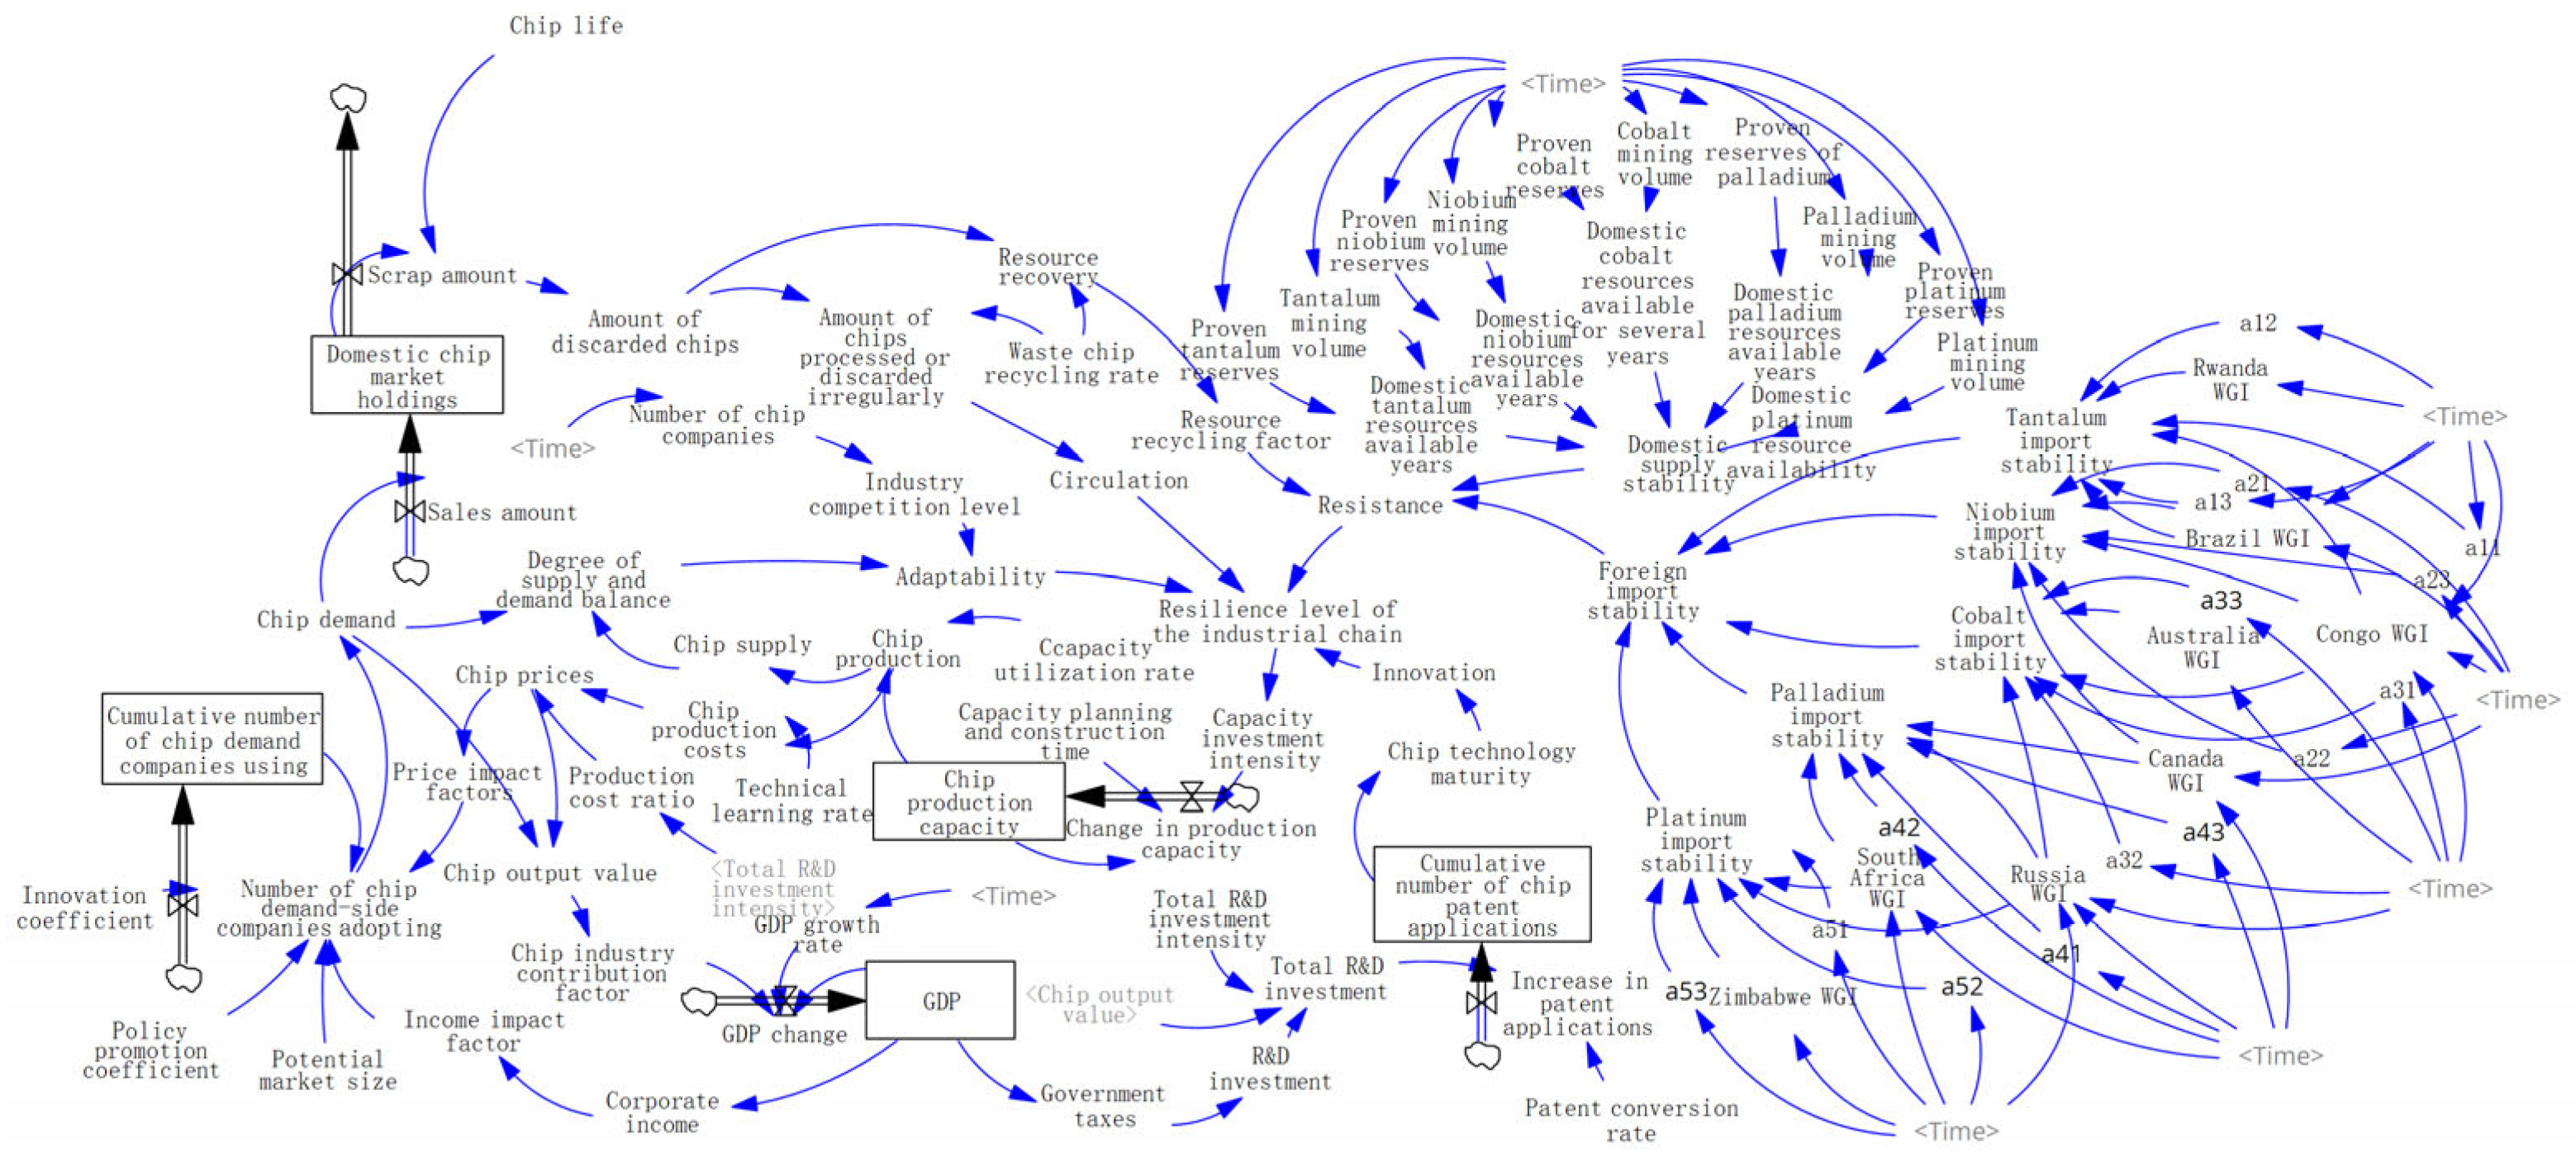
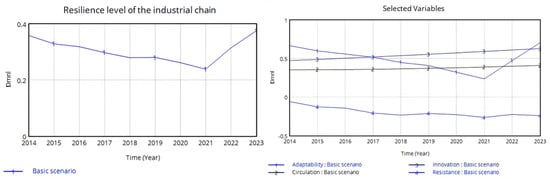
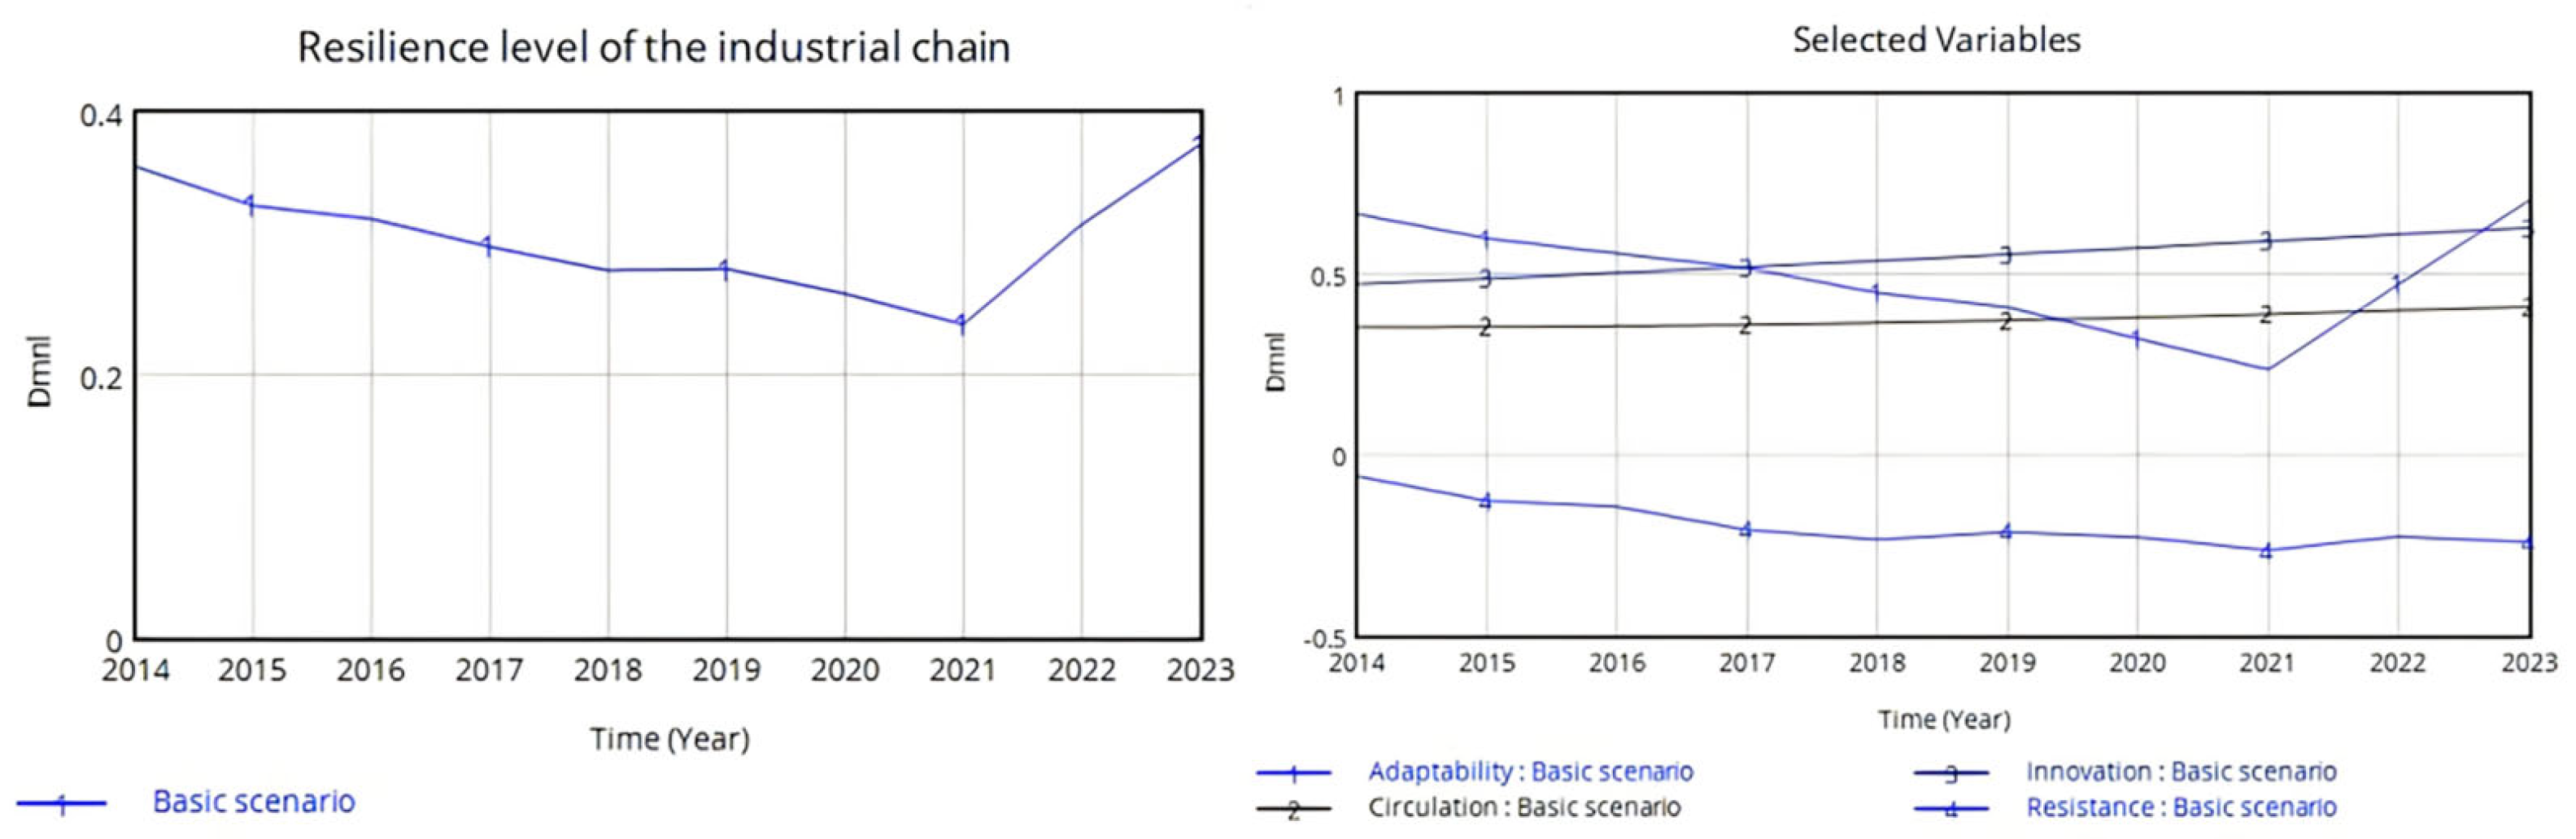
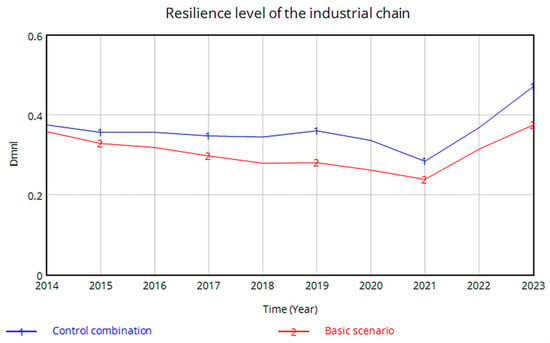
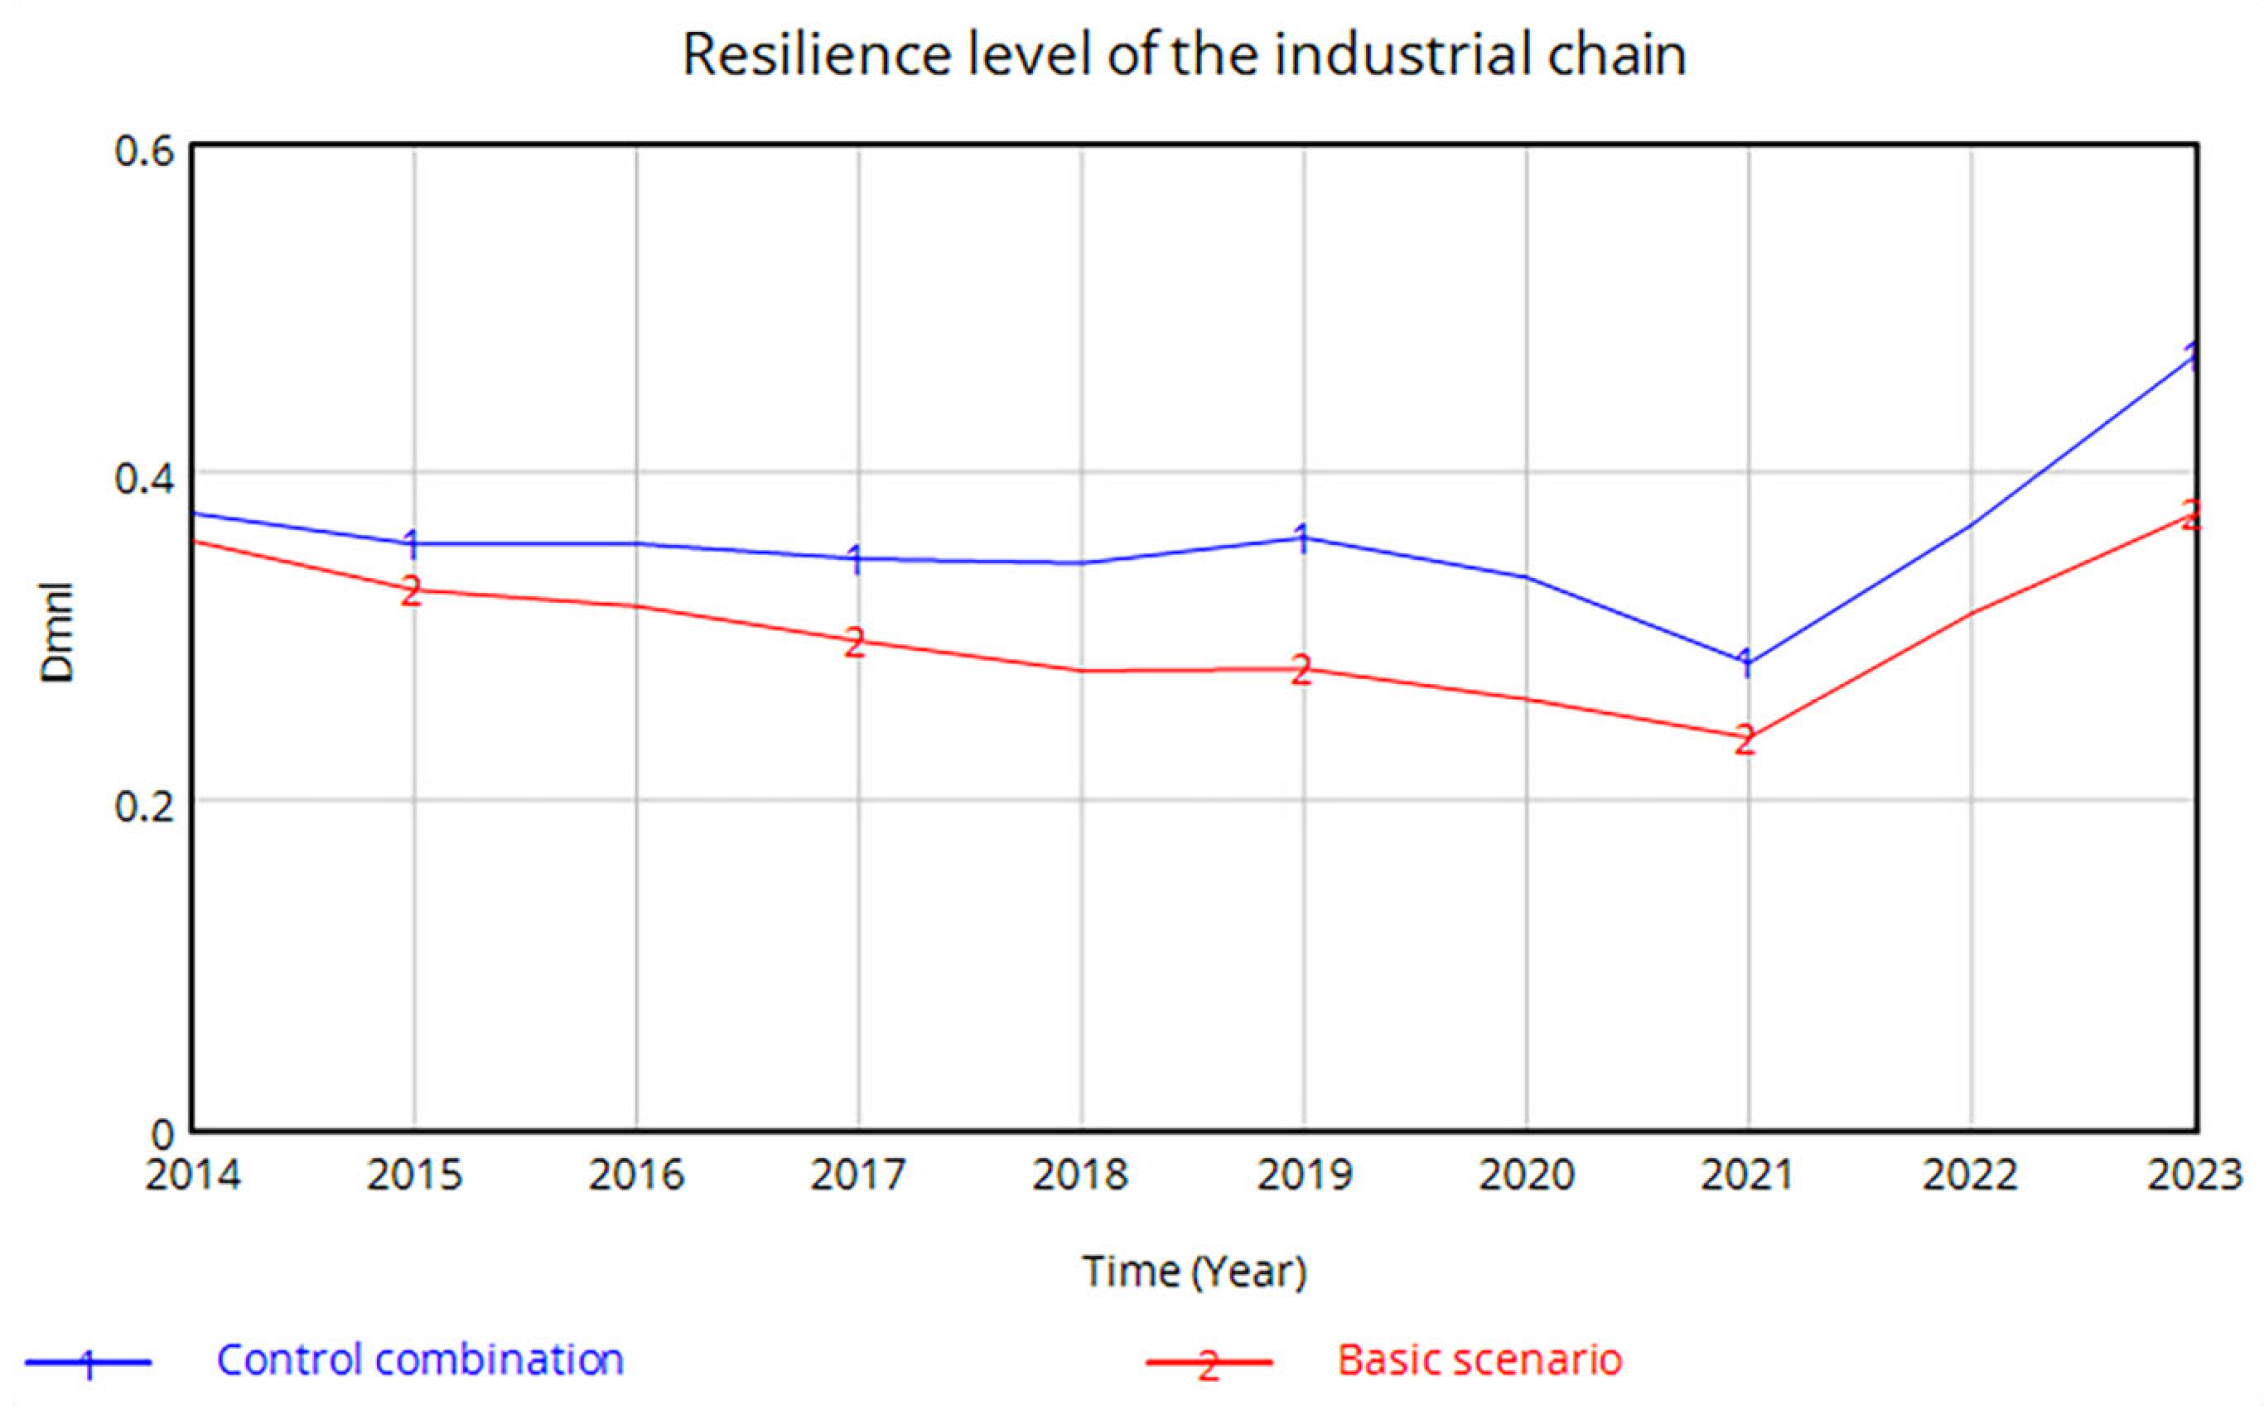
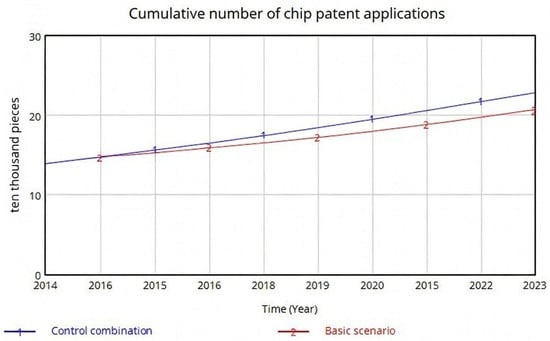
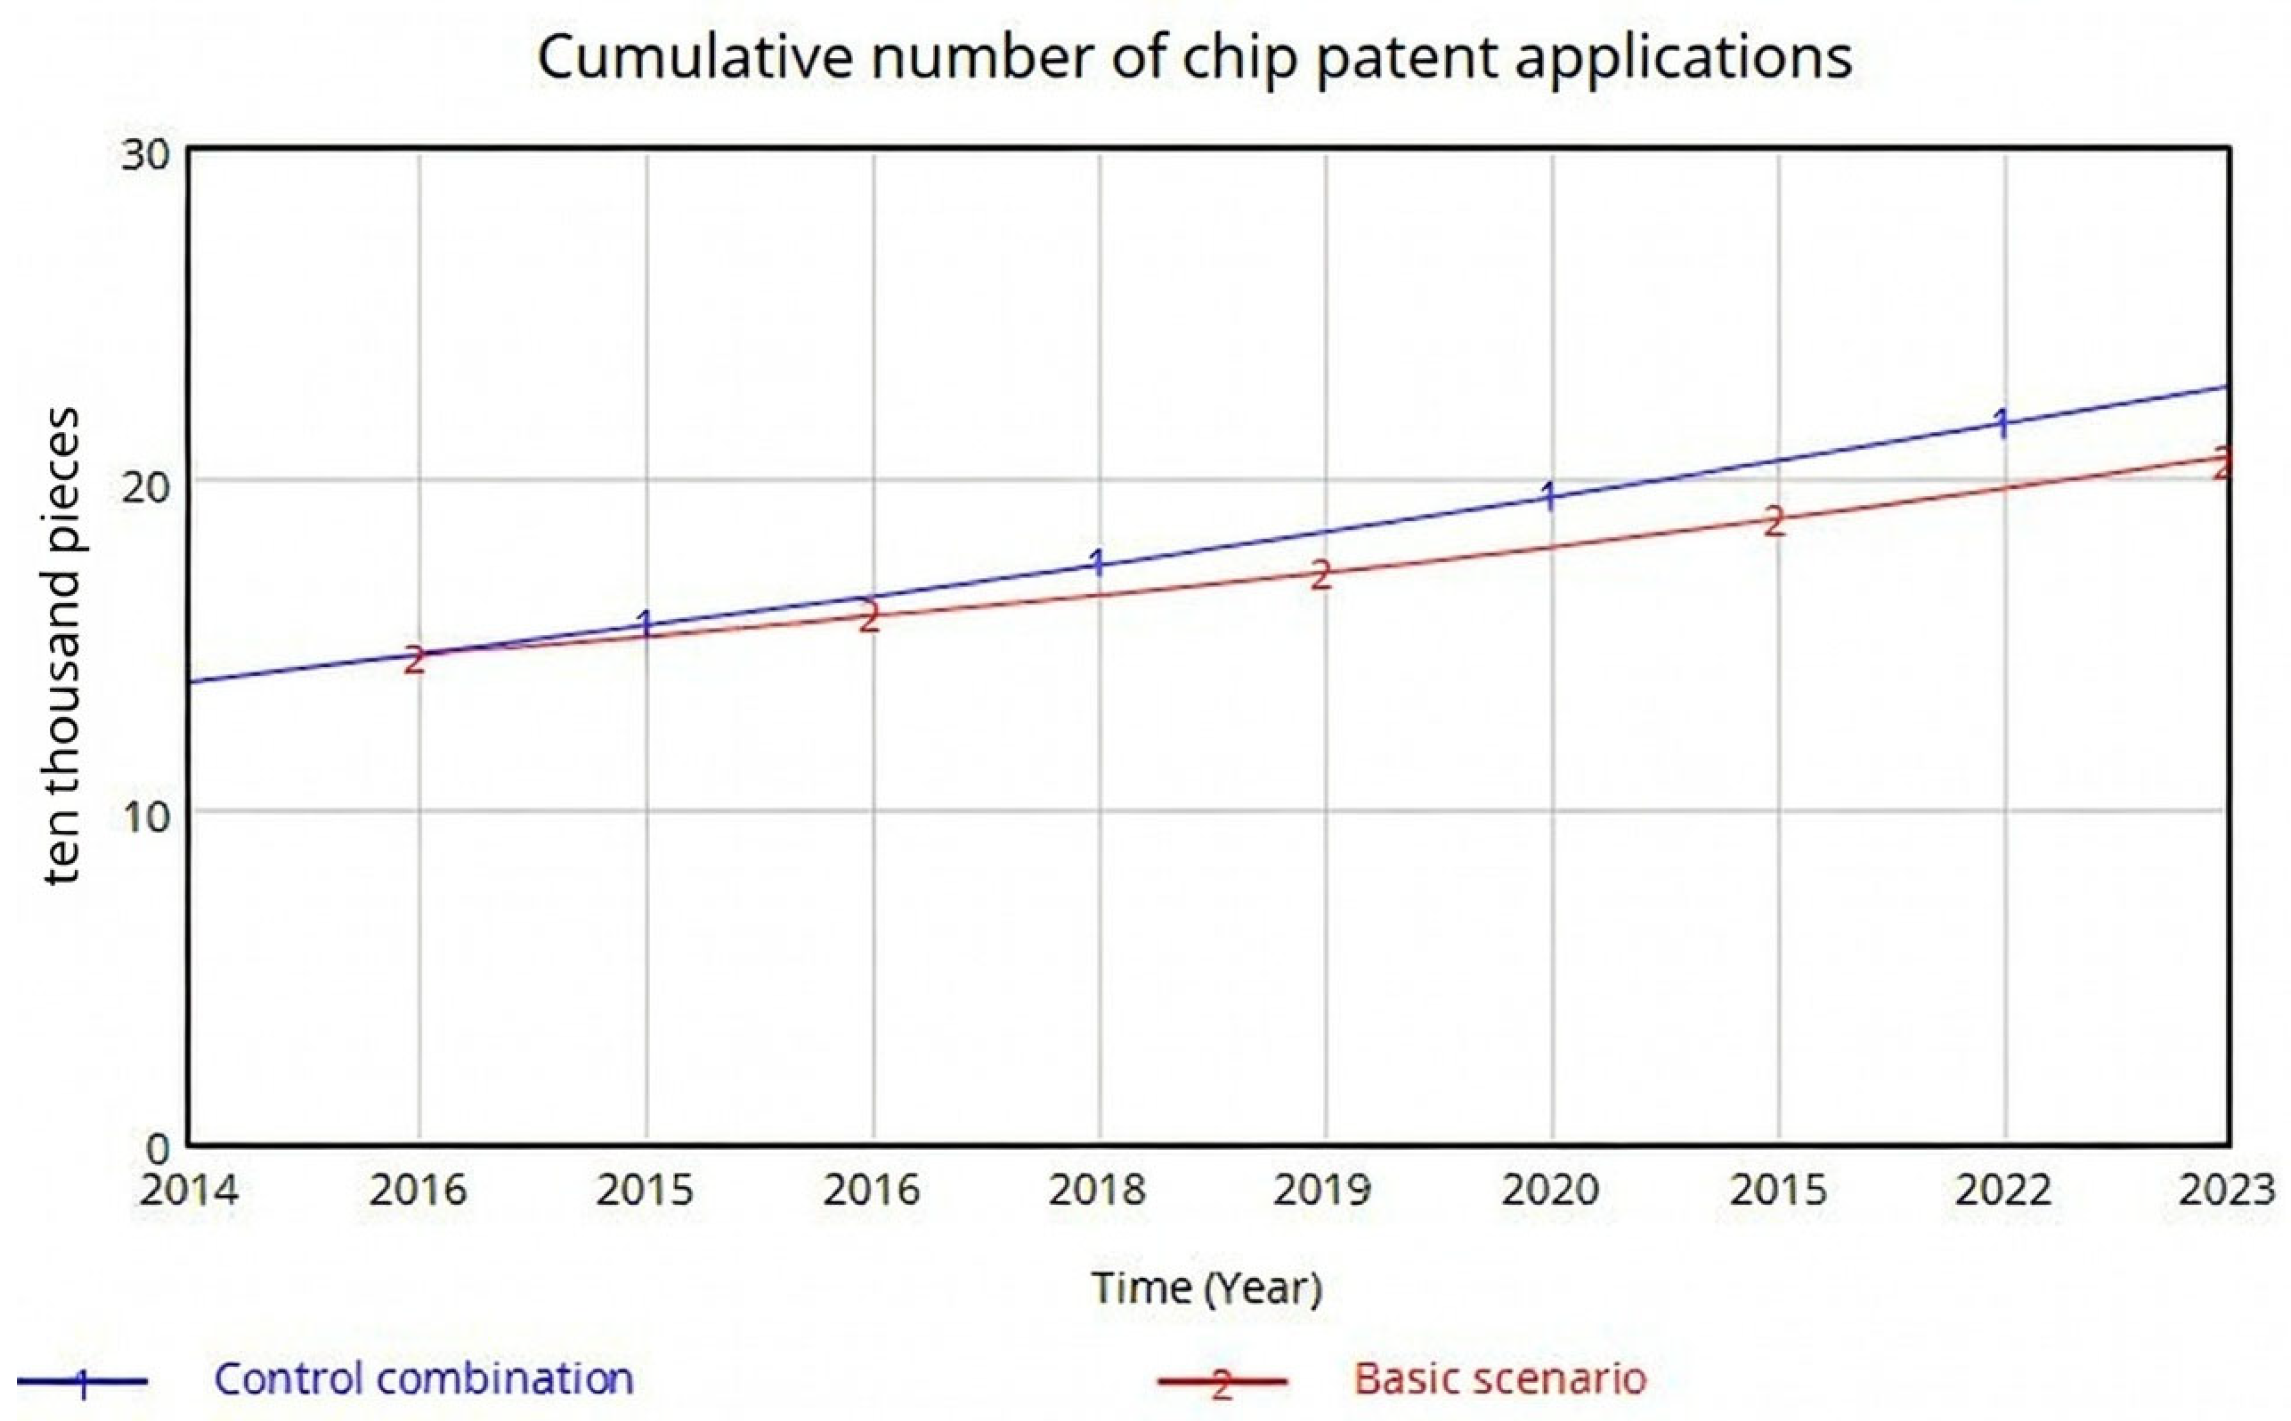
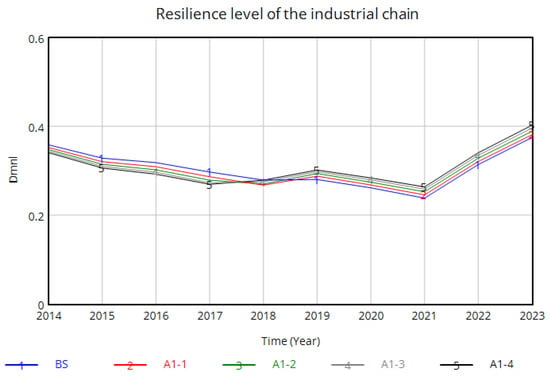
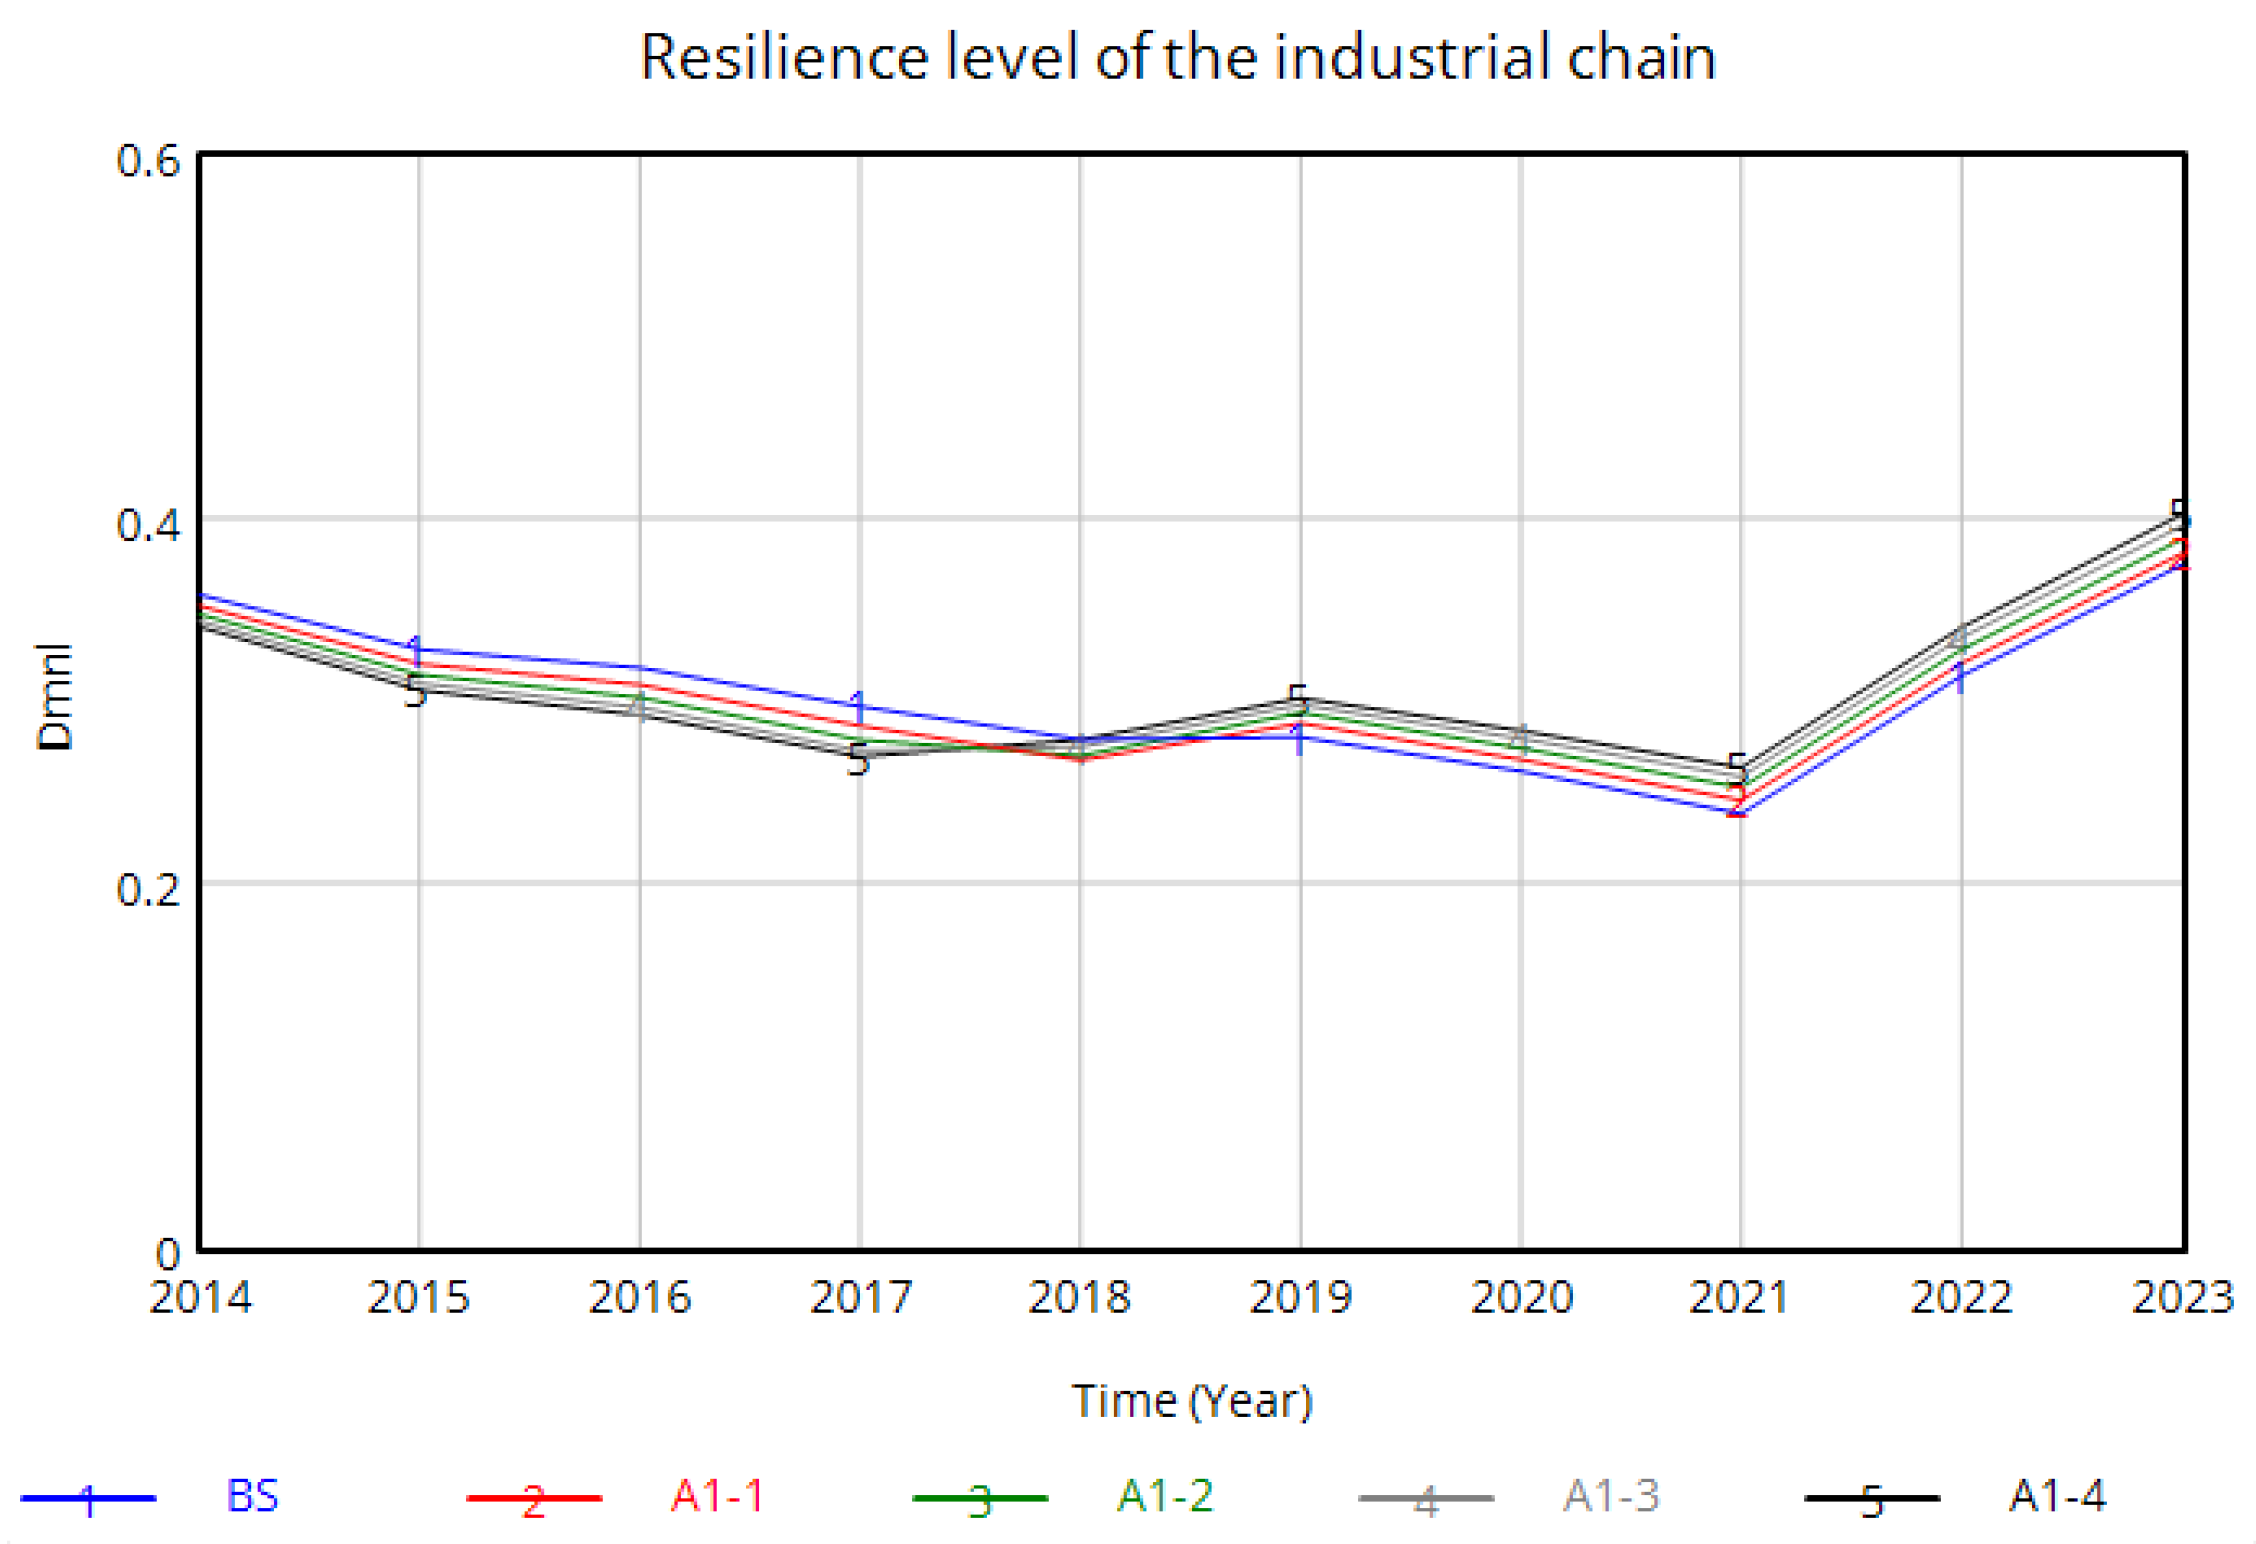
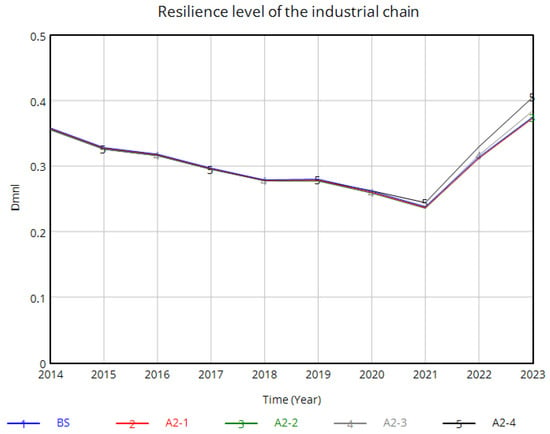
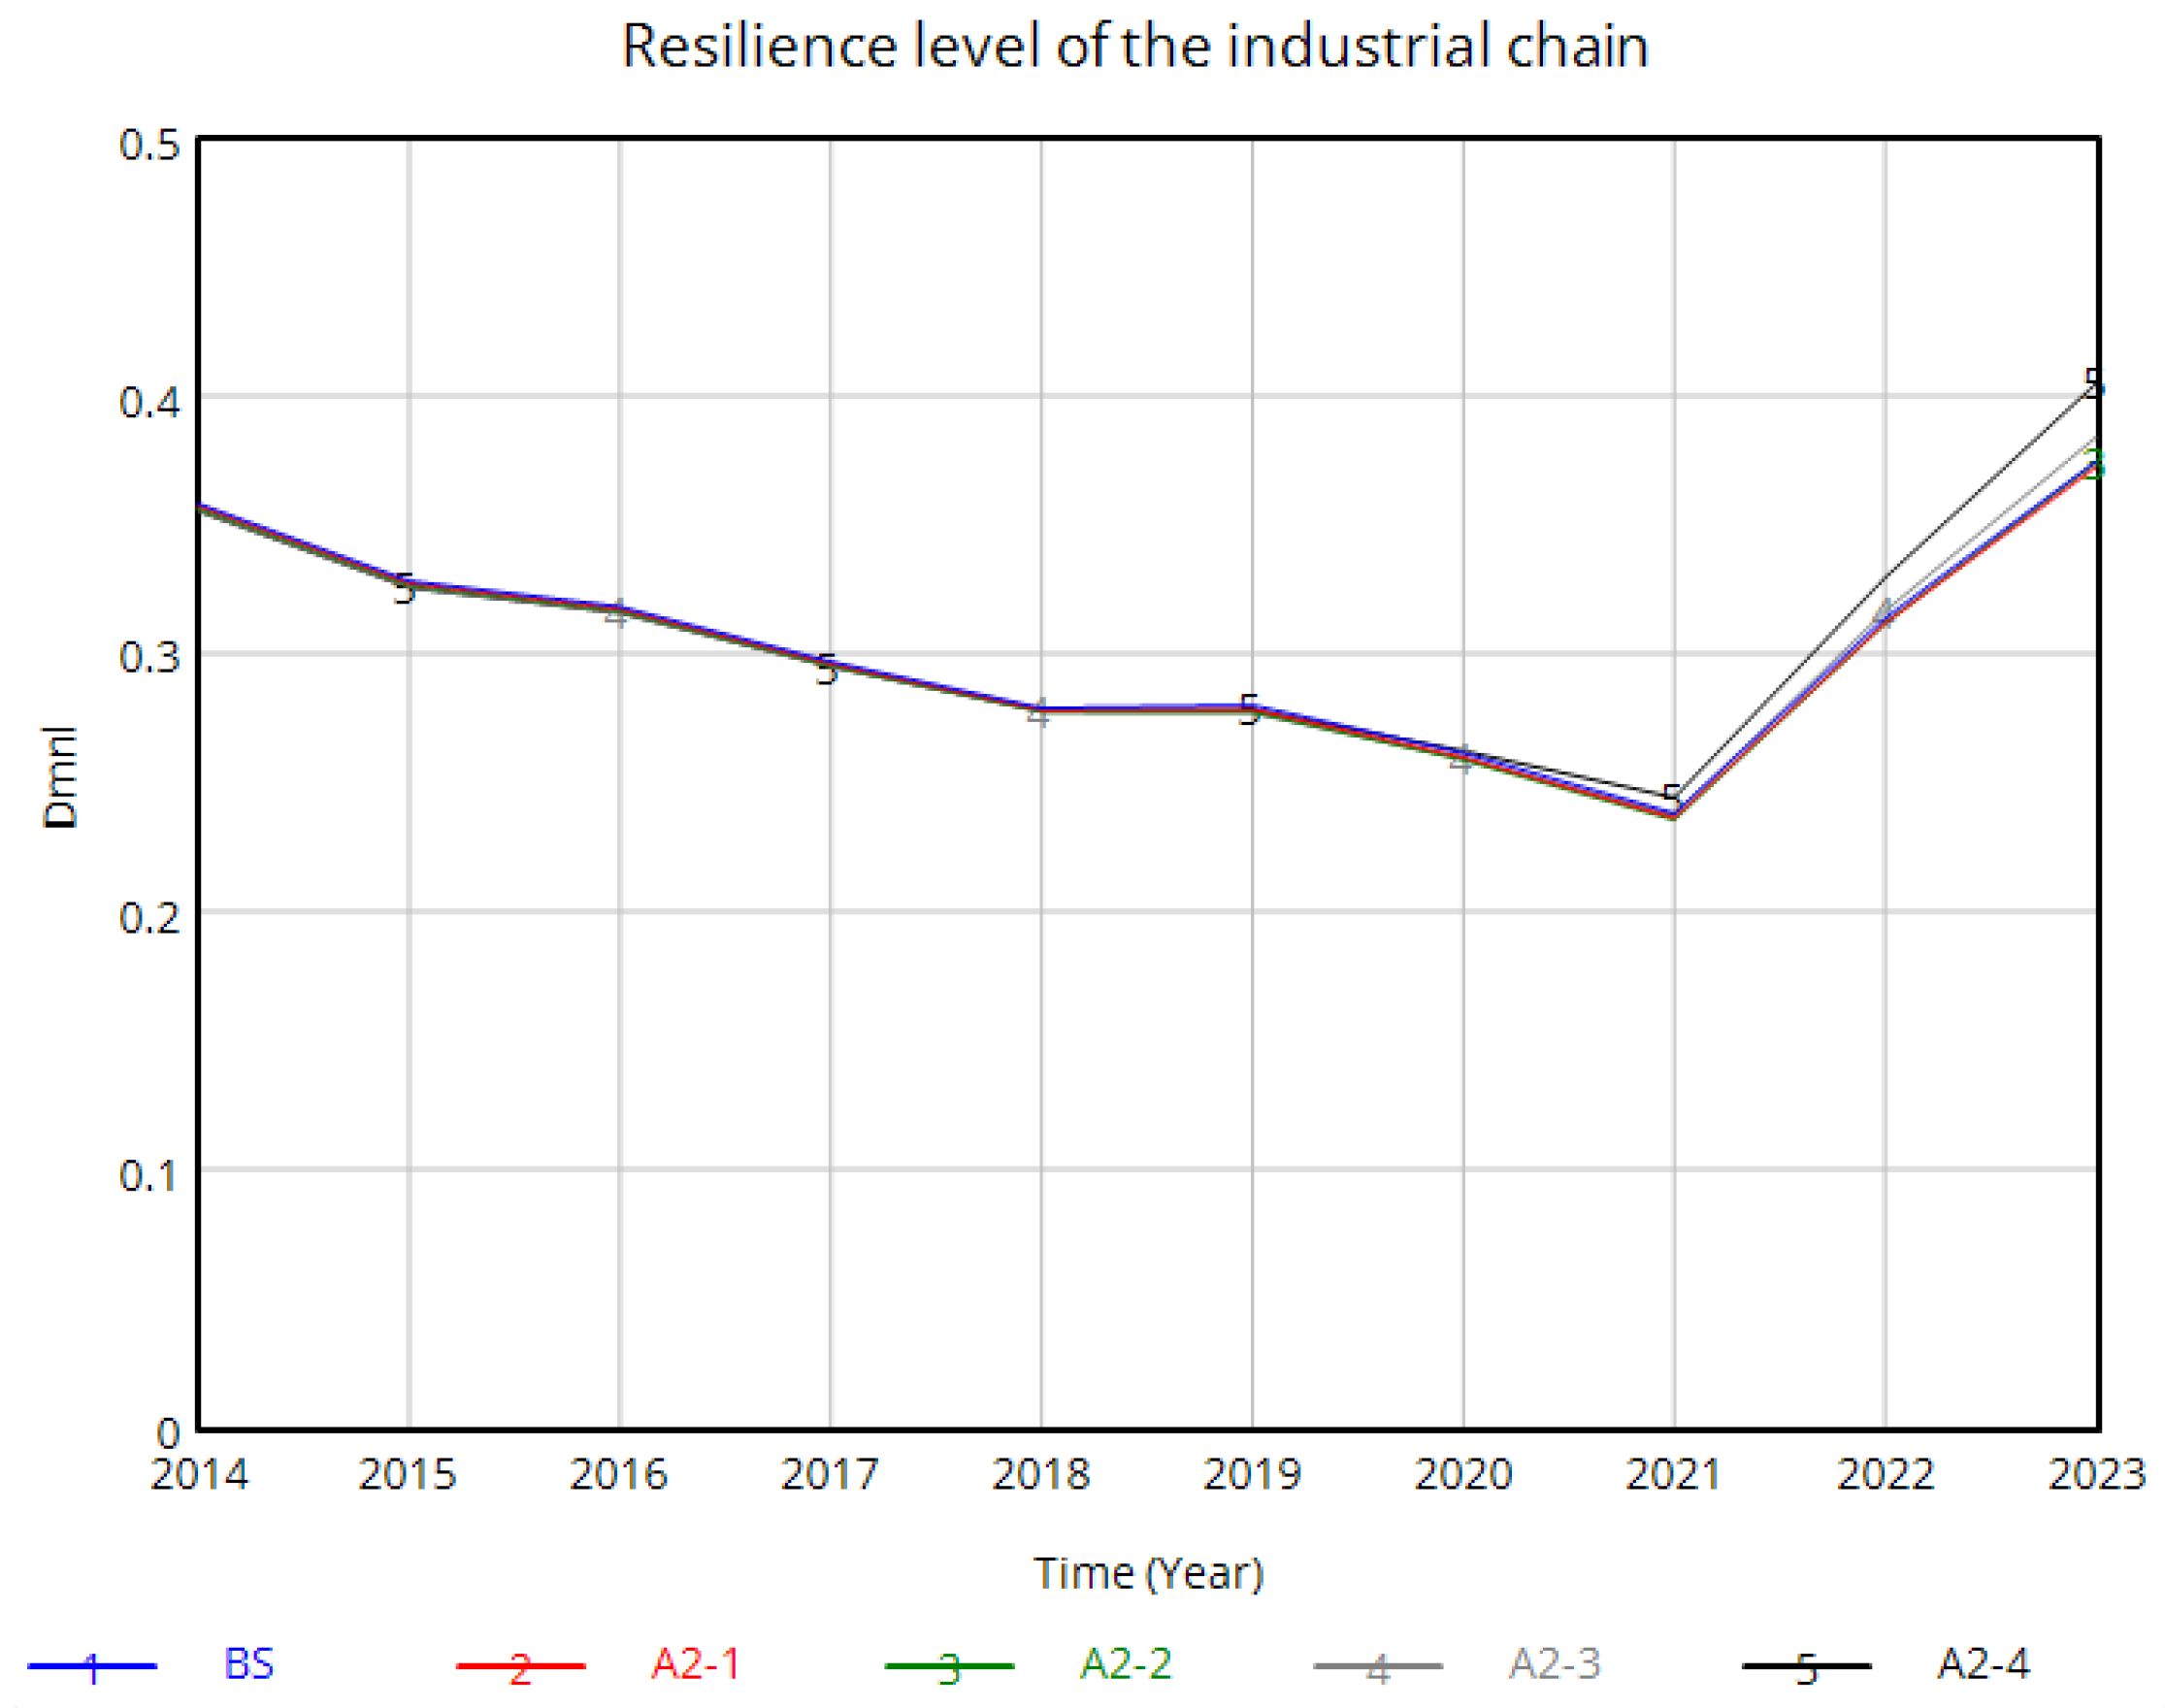
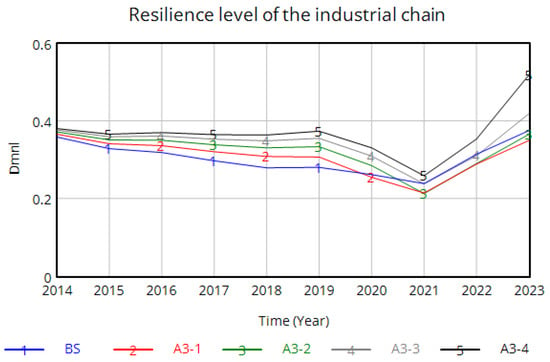
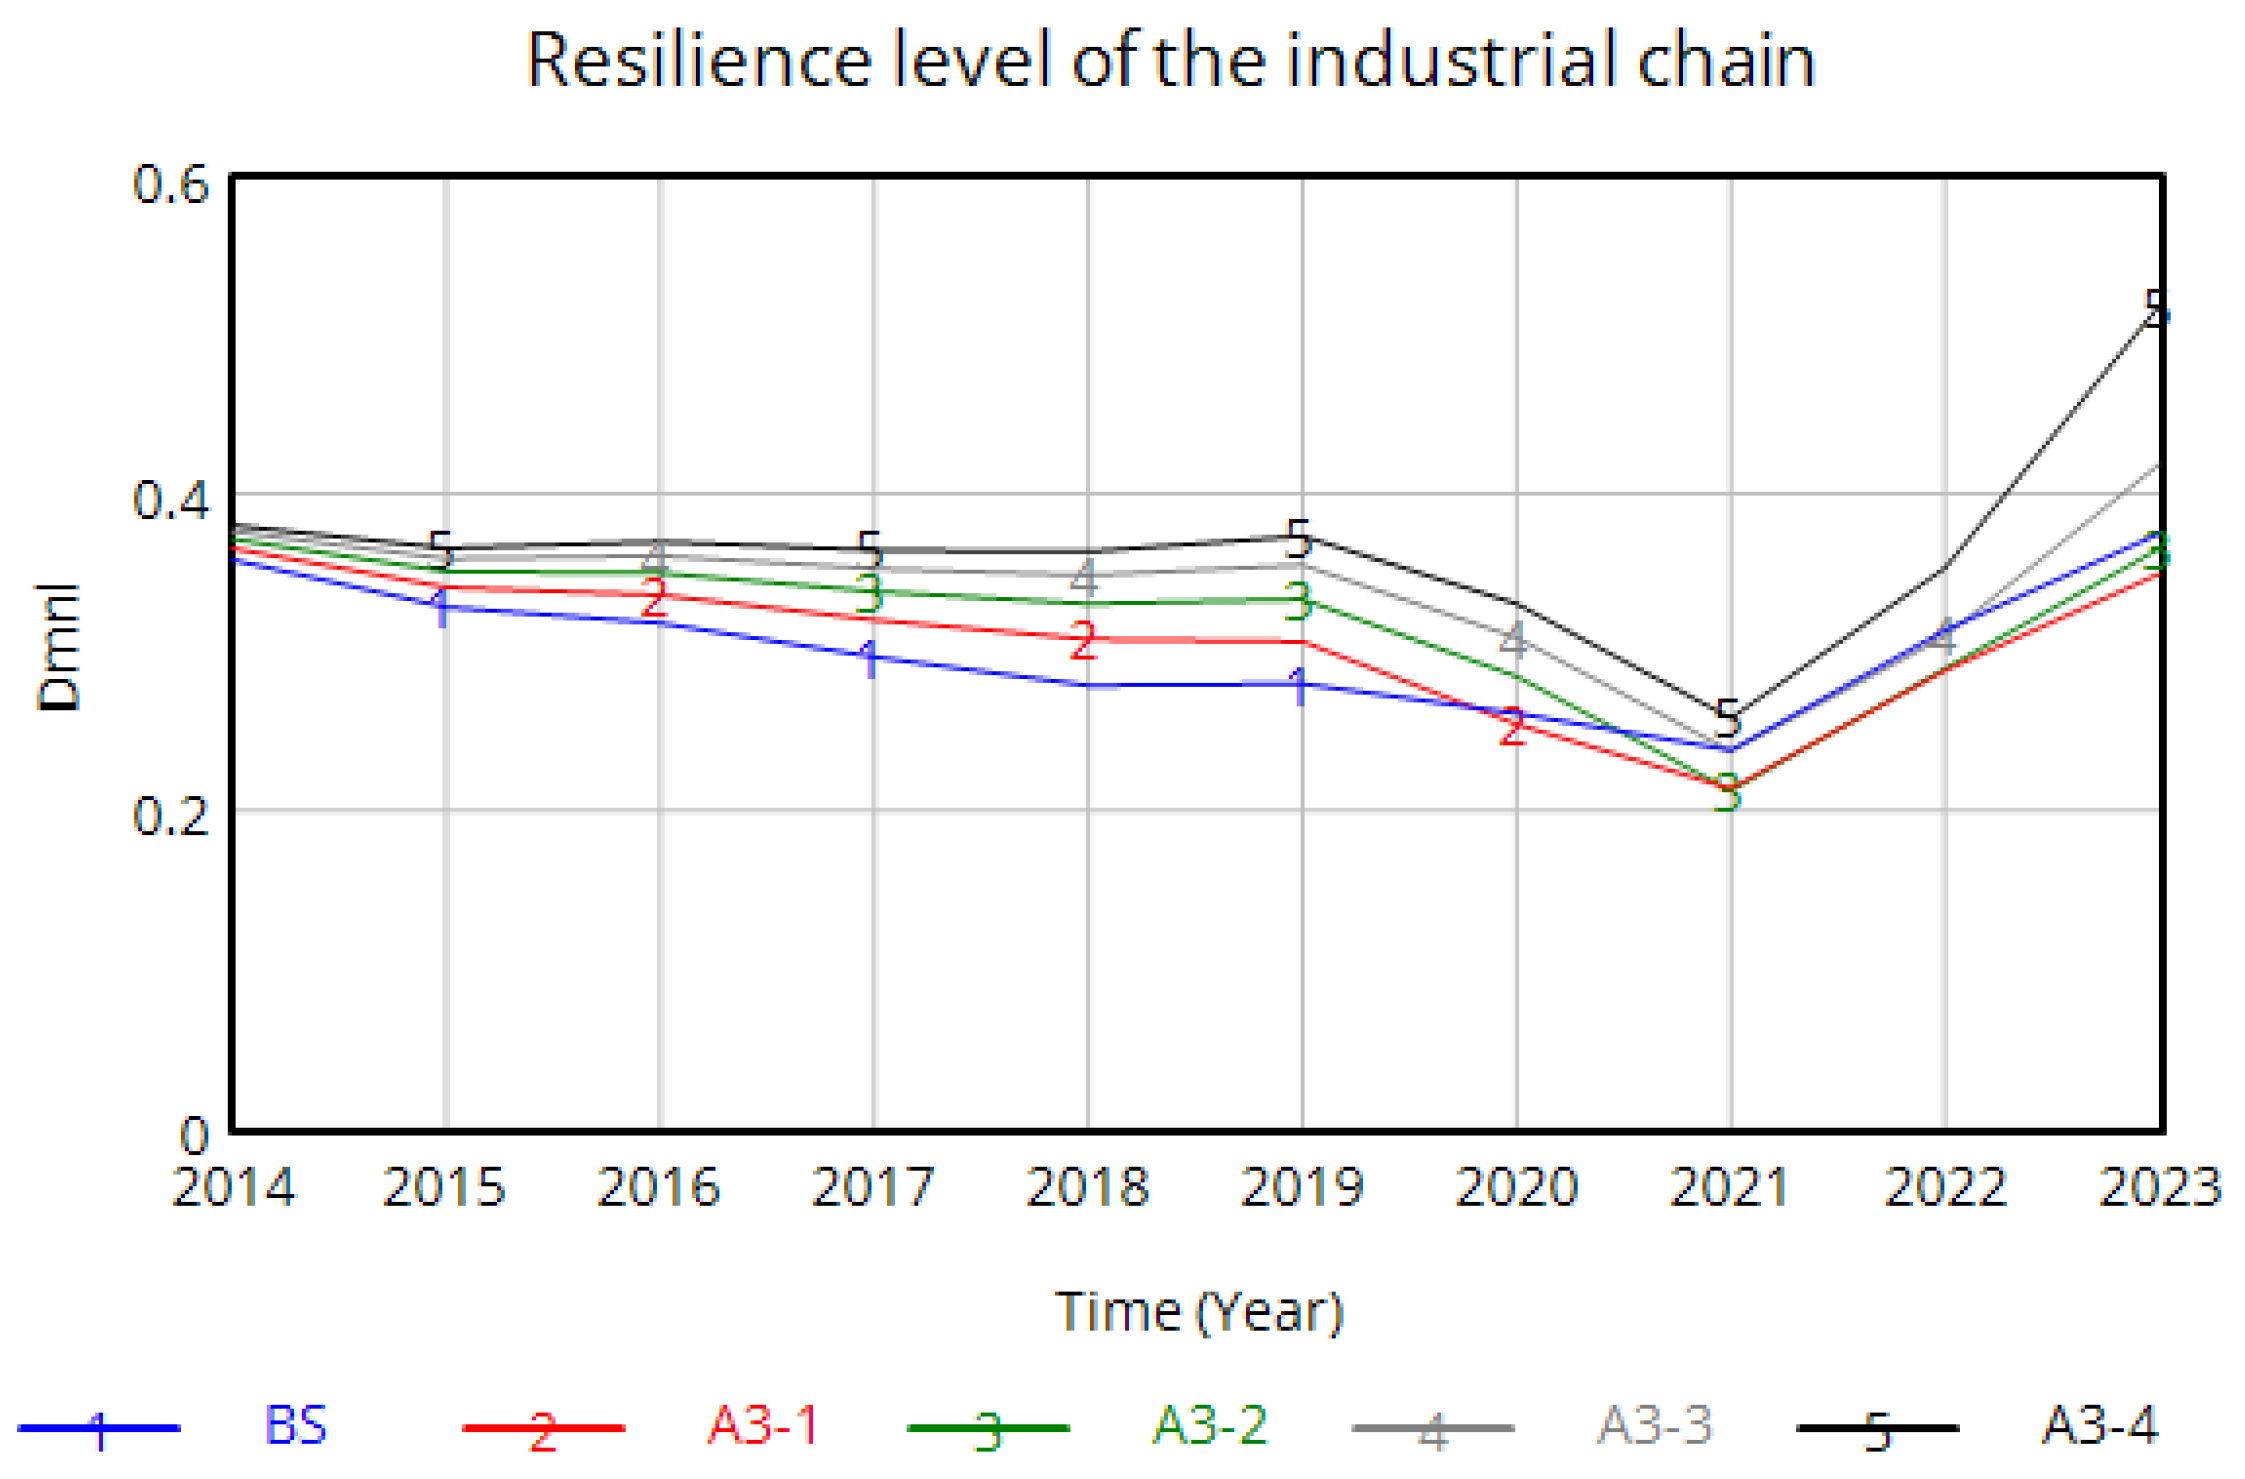
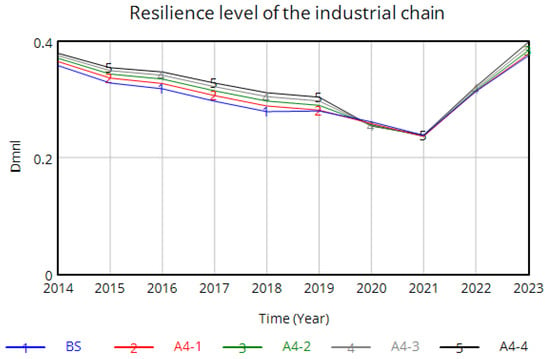

Disclaimer/Publisher’s Note: The statements, opinions and data contained in all publications are solely those of the individual author(s) and contributor(s) and not of MDPI and/or the editor(s). MDPI and/or the editor(s) disclaim responsibility for any injury to people or property resulting from any ideas, methods, instructions or products referred to in the content. |
© 2026 by the authors. Licensee MDPI, Basel, Switzerland. This article is an open access article distributed under the terms and conditions of the Creative Commons Attribution (CC BY) license.