


Highlights
Please indicate how your work links to systems science via your contributions to systems practice, theory, and/or methodology.
- •
- This study conceptualizes an AI-enabled computing course as a socio-technical instructional system with explicit boundary, readiness, operating, human-response, governance, and outcome layers, extending systems theory to AI-supported curriculum redesign.
- •
- It couples PLS-SEM, bootstrap indirect-effect analysis, and correlation-based item-level importance–performance analysis with implementation-layer platform evidence, a systems methodology that connects latent constructs to component-level redesign priorities.
What are the main findings and the implications of the main findings?
- •
- Course readiness was associated with perceived instructional system quality; quality was strongly associated with engagement; and engagement carried a substantial share of the association between quality and satisfaction.
- •
- Assessment innovation, AI/digital-skill weighting, teaching experience, case and courseware integration, resource renewal, and personalization were the top redesign priorities, supporting a six-stage redesign loop that centers high-quality learning rather than maximum AI use.
Abstract
Artificial intelligence (AI) integration in computing education is often evaluated as tool adoption, although course performance emerges from interdependencies among students, instructors, tasks, platforms, assessment, governance, and environmental constraints. This study conceptualized AI-enabled computing courses as socio-technical instructional systems and examined associations within a theoretically proposed readiness–quality–engagement–satisfaction pathway. The primary dataset comprised 122 responses from courses such as Algorithms and Data Structures, and Principles and Applications of Databases at a Chinese science and engineering university; 108 responses remained for inferential analysis after a conservative joint quality screen. A separate 57-response survey database (GaussDB) provided implementation-layer evidence. Factorability diagnostics, formative and reflective measurement assessment, partial least squares structural equation modeling (PLS-SEM), 5000-resample bootstrap indirect-effect analysis, sensitivity analysis, and correlation-based item-level importance–performance analysis were applied. Course readiness was associated with instructional system quality, which was associated with engagement. Quality was directly associated with satisfaction and indirectly associated through engagement, explaining 55.2% of satisfaction variance. Assessment innovation, AI/digital-skill weighting, teaching experience, case and courseware integration, resource renewal, and personalization were priorities; the GaussDB evidence highlighted connectivity and diagnostic usability. The results support a six-stage redesign loop centered on high-quality learning rather than maximum AI use and provide a reproducible baseline for longitudinal, multi-institutional evaluation.
1. Introduction
Artificial intelligence (AI), particularly generative AI and code-capable large language models, is changing computing education at several coupled levels. It can produce explanations, algorithms, code, test cases, debugging suggestions, and formative feedback; it can also reorganize the division of cognitive work between students, instructors, platforms, and institutional rules. International guidance therefore increasingly emphasizes human oversight, transparency, data protection, assessment redesign, and the preservation of learner agency rather than unconstrained tool use [1,2]. In China, the policy environment has moved in the same direction. The 2025 national agenda for educational digitalization called for AI to be integrated into curriculum, teaching, assessment, and governance, and the 2026 AI + Education Action Plan framed the change as a systematic transformation involving talent development, infrastructure, application ecosystems, and safety [3,4].
Computing courses provide a demanding setting in which to examine this transformation. Algorithms and Data Structures and Principles and Applications of Databases combine abstract reasoning with executable artifacts, depend on prior knowledge, and frequently require a stable software or cloud environment. AI can reduce the cost of searching for syntax and examples, but it can also generate plausible yet incorrect code, conceal misconceptions behind polished output, weaken provenance, and blur the boundary between assistance and substitution [5,6,7,8,9,10]. The pedagogical question is therefore not whether students can access AI, but whether the course as a whole coordinates prerequisites, learning objectives, authentic tasks, platform affordances, feedback, assessment evidence, and ethical constraints.
Many studies of AI in higher education focus on acceptance, perceived usefulness, or isolated learning tools [5,8,11,12]. These perspectives are valuable but can under-specify the interdependence among the social and technical components that produce course-level outcomes [13,14]. Socio-technical systems theory treats organizational performance as a joint product of human and technical subsystems rather than as the additive effect of a technology. The information-systems success tradition similarly distinguishes system and information quality, use, user experience, and net benefits, while recognizing their reciprocal relationships [15,16]. Applied to education, constructive alignment and engagement research suggest that learning outcomes depend on the consistency of goals, activities, assessment, and students’ cognitive, behavioral, and affective participation [17,18,19,20].
Recent studies in Systems have begun to connect AI-enhanced learning with self-efficacy, motivation, critical thinking, practical teaching reform, and systems thinking [21,22,23]. However, three gaps remain. First, AI-enabled course reform is rarely modeled as a bounded instructional system with explicit people, process, technology, governance, and environmental layers. Second, satisfaction models often do not distinguish boundary readiness from the quality of the operating instructional system or examine engagement as a theoretically proposed link between system quality and student-level outcomes. Third, practical bottlenecks such as cloud connectivity, error-message usability, resource updating, team organization, and assessment evidence are often separated from latent-variable modeling, even though they can be decisive system constraints. A broader reading of the information-systems success, constructive-alignment, and engagement literature likewise indicates that system quality, learner response, and outcome evaluation should be modeled as distinct yet coupled constructs [15,16,17,18,19,20].
This study addresses these gaps through an empirical analysis of AI-enabled courses such as Algorithms and Data Structures and Principles and Applications of Databases at a Chinese science and engineering university. It combines a 122-response AI-enabled instruction survey with a separate 57-response database (GaussDB) course survey that captures implementation-layer evidence from cloud database teaching. Three research questions guide the analysis: (RQ1) How do students evaluate the readiness, instructional, engagement, assessment, and outcome components of the AI-enabled course system? (RQ2) How are course readiness, AI-enabled instructional system quality, learning engagement and experience, and overall satisfaction associated? (RQ3) Which design elements and implementation bottlenecks should receive priority in the next course-reform cycle?
This study makes three contributions. Theoretically, it reframes AI-enabled course reform from tool adoption to socio-technical instructional system redesign. Methodologically, it combines conservative response-quality screening, factorability diagnostics, formative and reflective measurement, PLS-SEM, bootstrap indirect-effect analysis, sensitivity analysis, and correlation-based item-level importance–performance analysis. Practically, it translates the evidence into a six-stage redesign and feedback loop that links alignment, authentic tasks, activity-platform coordination, assessment reconstruction, governance, and continuous monitoring.
2. Theoretical Background and Research Model
2.1. The AI-Enabled Course as a Socio-Technical Instructional System
A course is a system when its components are mutually dependent, operate within a definable boundary, exchange resources and information with an environment, and produce outcomes through coordinated processes [13,14]. In the present study, the system boundary is the AI-enabled computing course as experienced by students. Within that boundary, people include students, instructors, and project teams; processes include objective alignment, active learning, feedback, assessment, and resource release; technologies include AI tools, learning-management systems, code environments, and cloud databases; and governance includes data rules, academic-integrity expectations, security requirements, and exception handling. The environment comprises institutional policy, the broader AI ecosystem, cloud-service conditions, and program-level curriculum requirements. Table 1 maps each system layer to its function, empirical representation, and analytical role.
Table 1.
Socio-technical architecture and empirical representation.
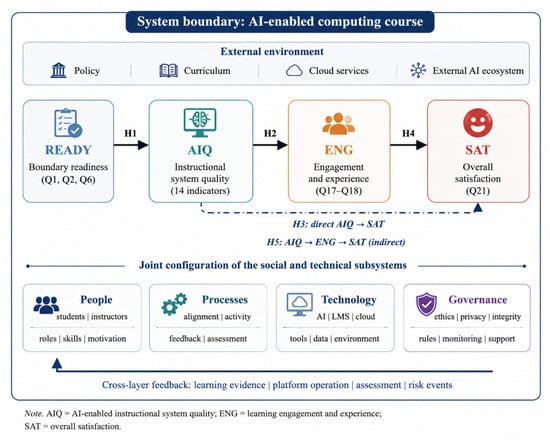
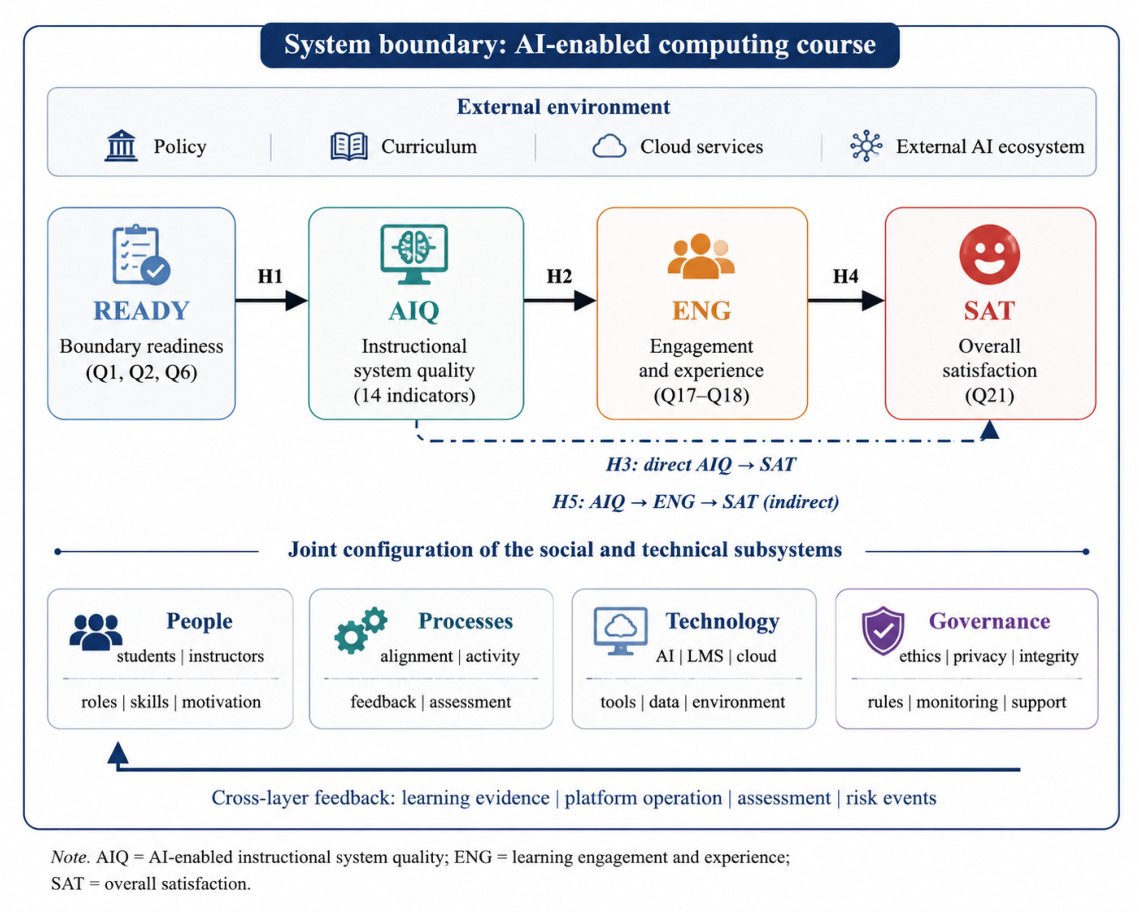
This framing changes the unit of analysis. The relevant intervention is not using AI in isolation. It is the configuration through which AI is embedded in authentic tasks, made operational through platforms and resources, interpreted by teachers and students, constrained by rules, and evaluated through observable learning evidence. A failure in any layer can propagate. Unclear objectives can make an accurate AI response educationally irrelevant; an unstable platform can convert a well-designed task into troubleshooting overhead; an assessment that captures only final output can reward unverified generation; and weak feedback can prevent students from converting AI support into durable knowledge. Figure 1 depicts the system boundary, the joint subsystem configuration, and the hypothesized research model.
Figure 1.
Socio-technical system boundary, joint subsystem configuration, and hypothesized research model.
2.2. Boundary Readiness and Instructional System Quality
Boundary readiness concerns whether students enter the course at an appropriate point in the curriculum, recognize the need for programming foundations, and understand the intended learning objectives. These indicators are not interchangeable manifestations of a single attitude. They are distinct conditions that jointly form readiness; removing one condition changes the meaning of the construct. A formative specification is therefore appropriate [24].
Readiness should be associated with higher perceived instructional system quality for three reasons. First, prior programming knowledge determines whether AI explanations and code suggestions function as cognitive scaffolds or opaque substitutes. Second, clear objectives allow students to judge whether AI output is relevant to the task rather than merely fluent. Third, appropriate course sequencing reduces the likelihood that platform and syntax difficulties consume the cognitive capacity needed for algorithmic or database reasoning. The resulting hypothesis is as follows:
H1.
Course readiness is positively associated with AI-enabled instructional system quality.
2.3. Instructional System Quality and Learning Engagement
AI-enabled instructional system quality is conceptualized as an integrated evaluation of task authenticity, support for foundational knowledge, the accuracy of assistance for real problems, the alignment of AI with learning objectives, the design and currency of cases and courseware, platform operational stability, personalization, and assessment. This is a reflective construct because the indicators are treated as observable manifestations of an underlying evaluation of how well the integrated course system operates. The 14 indicators cover different facets of the course, but they are specified as reflective because a respondent’s overall evaluation of how well the integrated AI-enabled instructional system operates is expected to govern all of them jointly: the indicators are treated as interchangeable manifestations of that evaluation and are expected to covary. A formative specification would instead imply that each facet independently produces system quality and that omitting one facet (for example, assessment) would change the meaning of the construct, which does not match the measurement intent. The high inter-item correlations, composite reliability, and loading ranges reported in Section 4.3 are consistent with the reflective reading. Because measurement-model misspecification can bias structural estimates, we nevertheless report the parallel-analysis and HTMT diagnostics explicitly (Section 4.2 and Section 4.3) and treat a higher-order or formative re-specification as a priority for the next instrument iteration (Section 5.7).
High-quality operation should support engagement by reducing unproductive friction while increasing opportunities for comparison, debugging, validation, explanation, and reflection. In an algorithms course, for example, a student may ask AI for alternative algorithms but must compare complexity, correctness, and boundary cases. In a database course, a student may generate SQL and then inspect execution results, constraints, access control, and security risks. These activities are more likely to increase enthusiasm and teaching-experience favorability when resources, platforms, and assessment expectations work coherently. Thus, the hypothesis is as follows:
H2.
AI-enabled instructional system quality is positively associated with learning engagement and experience.
2.4. Satisfaction and the Mediating Role of Engagement
Overall satisfaction can arise directly from favorable evaluations of cases, courseware, platform reliability, personalization, and assessment. Yet socio-technical quality has educational value only when it changes the learning process. Engagement theory distinguishes the conditions supplied by the institution from the energy, attention, and participation invested by the learner [19,20]. Accordingly, instructional system quality should be associated with satisfaction both directly and indirectly through a more favorable learning experience and greater enthusiasm [25]. Two scope decisions should be made explicit. First, ENG is operationalized as the learner’s experienced response to the operating system—teaching-experience favorability and learning enthusiasm—rather than as a comprehensive measure of the behavioral, cognitive, and affective dimensions of engagement [19,20]; the construct should therefore be read as a narrow, experiential indicator of engagement, and Section 5.7 acknowledges this as a measurement limitation. Second, teaching-experience favorability is conceptually adjacent to general satisfaction; the two are kept distinct because Q17 evaluates the ongoing teaching process whereas satisfaction (Q21) is a global retrospective judgment, and their empirical separability is examined in Section 4.3. Table 2 summarizes the five hypotheses and their theoretical rationales.
Table 2.
Hypotheses and theoretical rationales.
H3.
AI-enabled instructional system quality is positively associated with overall satisfaction.
H4.
Learning engagement and experience are positively associated with overall satisfaction.
H5.
Learning engagement and experience mediate the association between AI-enabled instructional system quality and overall satisfaction.
3. Materials and Methods
3.1. Context and Data Sources
The primary dataset was collected through the AI-Enabled Teaching Situation Questionnaire administered in algorithms and data structures (Python 3.14.6), SQL, and database-related courses. The available records span December 2025 to April 2026 and contain 122 complete responses to 21 five-point rating items. Items cover course sequencing, prerequisites, objective clarity, AI integration, knowledge support, authentic problem solving, cases and courseware, resource updating and downloading, platform stability, personalization, ethics and values, teaching experience, learning enthusiasm, assessment innovation, AI/digital-skill weighting, and overall satisfaction.
A second dataset was collected in July 2023 from a GaussDB (for openGauss-2.0.0)-supported SQL course and a transportation-enterprise database development project. It contains 57 row-level responses on learning gains, instructional format, total and laboratory hours, project gains, course and project improvement preferences, SSL recognition, satisfaction, platform problems, and self-reported knowledge mastery. This dataset was not merged with the primary survey because it came from a different cohort, instrument, and time period. Instead, it was used as implementation-layer evidence to examine whether the latent-model priorities were consistent with concrete platform and project constraints. The July 2023 GaussDB survey was originally administered as an anonymized end-of-course evaluation with informed consent; the 2025 institutional approval (No. 2025025) explicitly covers the secondary research use of these anonymized 2023 records together with the primary survey.
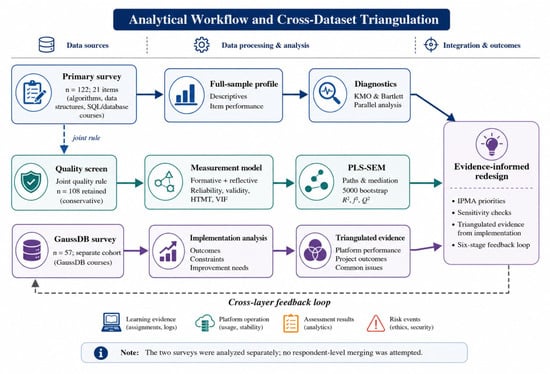
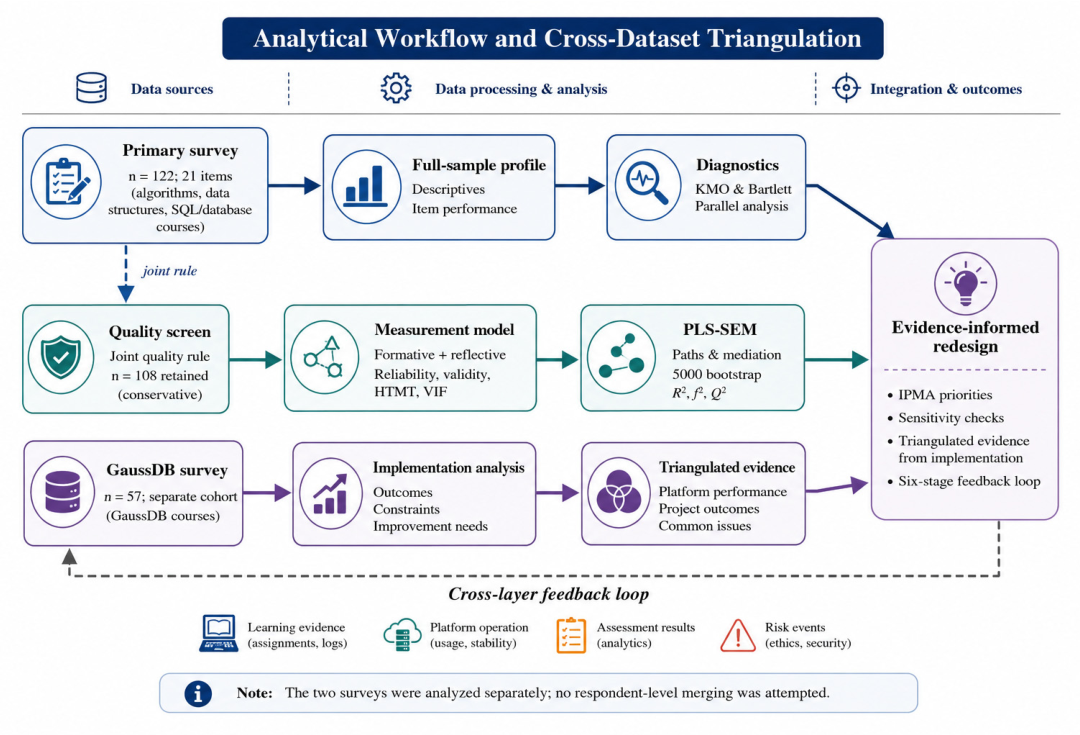
The system-generated GaussDB default report supplied with the materials represented an earlier snapshot with 10 responses. All analyses in this study used the 57-row source spreadsheet as the statistical basis. No names or student identifiers were included in the reproducibility dataset. IP addresses, exact timestamps, and submission-channel fields were excluded from the shared data. Table 3 summarizes the data sources and their analytical roles, and Figure 2 illustrates the overall analytical workflow.
Table 3.
Data sources and analytical roles.
Figure 2.
Analytical workflow and cross-dataset contextual comparison.
3.2. Instrument Operationalization
All primary-survey options were mapped to 1–5 scores, with 5 representing the most positive evaluation. Q14 asked about the frequency of platform failures and was reverse-scored so that a higher value represented greater operational stability. Course readiness (READY) was specified formatively through Q1, Q2, and Q6. AI-enabled instructional system quality (AIQ) was measured reflectively through Q3–Q5, Q7–Q15, and Q19–Q20. Learning engagement and experience (ENG) was measured reflectively through Q17 and Q18. Overall satisfaction (SAT) was the single-item outcome, Q21. Q16, perceived development of ethics and values, was retained as a descriptive contextual outcome but excluded from the PLS model because it represents a broader developmental consequence rather than the same operational quality domain. Table 4 reports the full construct operationalization and item mapping.
Table 4.
Construct operationalization and item mapping.
The 21-item AI-Enabled Teaching Situation Questionnaire was developed in Chinese by the course team. Item content was derived from the socio-technical architecture in Table 1 and from the stated learning objectives of the participating courses, so that each system layer was represented by at least one item. Draft items were reviewed by two instructors of the participating courses and one colleague with survey-design experience for content coverage, wording clarity, and rating-scale suitability, and the draft was piloted with a small group of students from a parallel class; ambiguous wording identified in the review and pilot was revised before formal administration. All items used five-point category scales in which a higher category indicates a more positive evaluation, and the response anchors were labeled at every point. The instrument was administered in Chinese; the item labels in Table 4 were translated into English by the authors for reporting purposes, with back-translation checks of key terms.
The construct mapping was theory-driven rather than generated mechanically from exploratory factor extraction. This distinction is important because the survey contains conceptually adjacent, positively worded evaluations that may share a general course-halo factor. The factorability and parallel-analysis results were therefore used as diagnostics of common structure and method risk, not as the sole basis for deleting or combining theoretically distinct indicators.
3.3. Response-Quality Screening
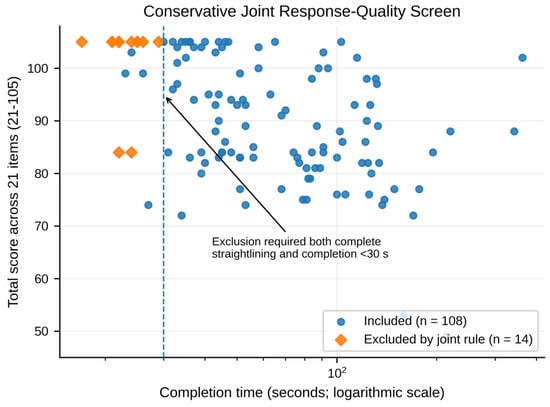
Careless-response screening must balance false positives against the risk that low-effort responses distort covariance estimates [26,27]. The survey exhibited genuine ceiling concentration, so identical responses were not automatically treated as invalid. A conservative joint rule was used: a response was excluded from inferential analysis only when all 21 items had the same score and completion time was below 30 s. Descriptive results retained all 122 responses to preserve the reported distribution of course evaluations; inferential analyses used 108 responses. Structural estimates were then repeated with the full sample as a sensitivity check. Table 5 reports the screening outcomes and the analytical sample, and Figure 3 illustrates the conservative joint response-quality screen. The 30 s cutoff corresponds to less than 1.5 s per item, which is below any plausible reading time for a 21-item instrument; combining it with the identical-response criterion ensures that fast but genuinely consistent respondents are retained. In total, 30 of the 122 respondents (24.6%) gave identical scores on all 21 items—consistent with the documented ceiling concentration—but only the 14 respondents who simultaneously completed the survey in under 30 s were excluded. Retained and excluded cases were drawn from the same strongly ceiling-concentrated response distribution, and the full-sample sensitivity analysis (Section 4.5) changed no path direction or relative ordering (coefficient differences below 0.05), indicating that the screening rule does not drive the substantive conclusions.
Table 5.
Response quality and analytical sample.
Figure 3.
Conservative joint response-quality screen.
3.4. Analytical Strategy
The analysis proceeded in five stages. First, item means, standard deviations, medians, top-two-category shares, 95% confidence intervals, skewness, and excess kurtosis were computed. Second, the 20 non-satisfaction items were examined using a Spearman correlation matrix, overall and item-level Kaiser–Meyer–Olkin (KMO) statistics, an approximate Bartlett test of sphericity, and 1000-permutation parallel analysis that preserved each item’s observed marginal distribution [28]. Spearman correlations were used because the items were ordinal and strongly negatively skewed.
Third, the measurement model was evaluated before the structural model. Reflective constructs were assessed using Cronbach’s alpha, composite reliability (CR), average variance extracted (AVE), and outer loadings [29,30,31,32,33]. Discriminant validity was examined using the heterotrait–monotrait ratio (HTMT). The formative readiness construct was assessed using indicator weights, outer loadings, bootstrap confidence intervals, and variance inflation factors (VIFs). A nonsignificant formative weight was not treated as an automatic deletion criterion when the indicator had content validity and acceptable collinearity.
PLS-SEM was selected because this study estimates a theory-guided model containing both formative and reflective constructs, emphasizes explained variance and indirect associations in a comparatively small screened sample, and requires joint evaluation of these measurement and structural components [29,30]. This choice does not relax the measurement or inferential limitations acknowledged in Section 4.2, Section 4.3 and Section 5.7. Fourth, PLS-SEM used a centroid inner-weighting scheme, Mode A for reflective constructs, and Mode B for the formative construct. Standardized path coefficients, R2 values, outer loadings, weights, total and indirect effects were evaluated with 5000 nonparametric bootstrap resamples. Conventional f2 reference values of 0.02, 0.15, and 0.35 were used descriptively for small, medium, and large effects [34]. With n = 108, the inverse square-root method implies a minimum detectable path of approximately 0.239 at α = 0.05 and 80% power, which is below the smallest direct path estimated in the model [35].
Fifth, a correlation-based item-level importance–performance analysis used the screened-sample item mean as performance and the Pearson correlation with satisfaction as importance. The mean performance and mean importance values defined the quadrant cutoffs. Items with above-average importance and below-average performance were interpreted as priorities [36]. The GaussDB survey was summarized with counts and percentages. p-values and bootstrap intervals quantify sampling uncertainty under the specified model.
The correlation-based item-level importance–performance analysis was specified as a diagnostic extension: performance was the screened-sample item mean, and importance was the item-satisfaction Pearson correlation.
4. Results
4.1. Descriptive Profile of the Instructional System
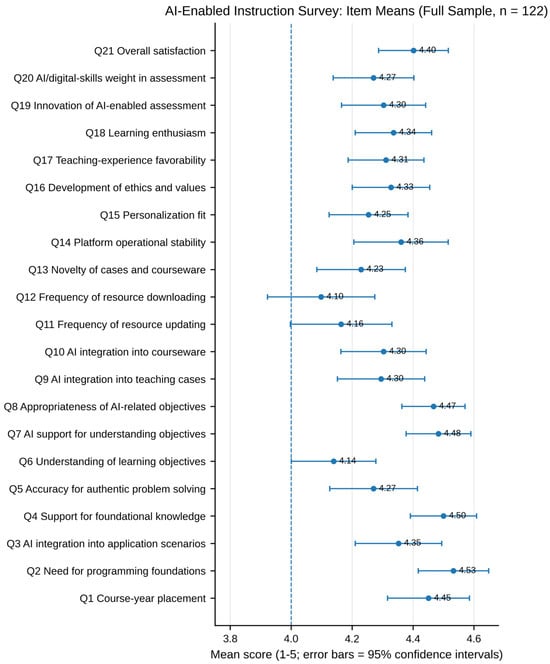
Across the 21 items, the average item score was 4.33 out of 5, indicating a generally favorable evaluation with substantial ceiling concentration. Overall satisfaction reached a mean of 4.40, and 93.4% of respondents selected the top two categories. The highest-scoring system conditions were the perceived need for programming foundations, support for foundational knowledge, AI support for understanding objectives, the appropriateness of AI-related objectives, and course-year placement, all with means of 4.45 or higher. Table 6 reports the full item-level descriptive statistics, and Figure 4 displays the item means with 95% confidence intervals.
Table 6.
Full item descriptive statistics for the AI-enabled instruction survey (n = 122).
Figure 4.
Item means and 95% confidence intervals for the full AI-enabled instruction survey.
The comparatively lower-scoring elements were resource downloading, direct understanding of learning objectives, resource updating, novelty of cases and courseware, personalization fit, authentic-problem accuracy, and the weighting of AI and digital skills in assessment, with means between 4.10 and 4.27. These means remain above the scale midpoint; in a high-satisfaction system they identify the components with the greatest relative room for improvement.
4.2. Factorability, Common Structure, and Method Risk
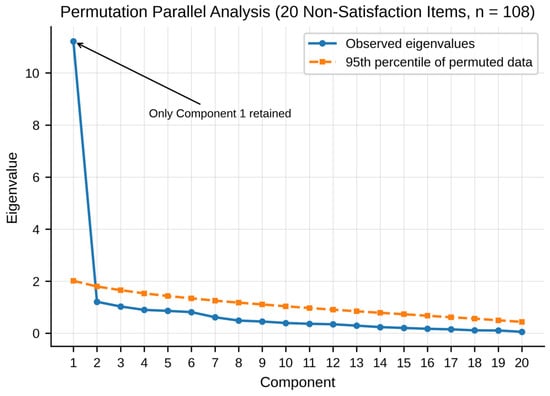
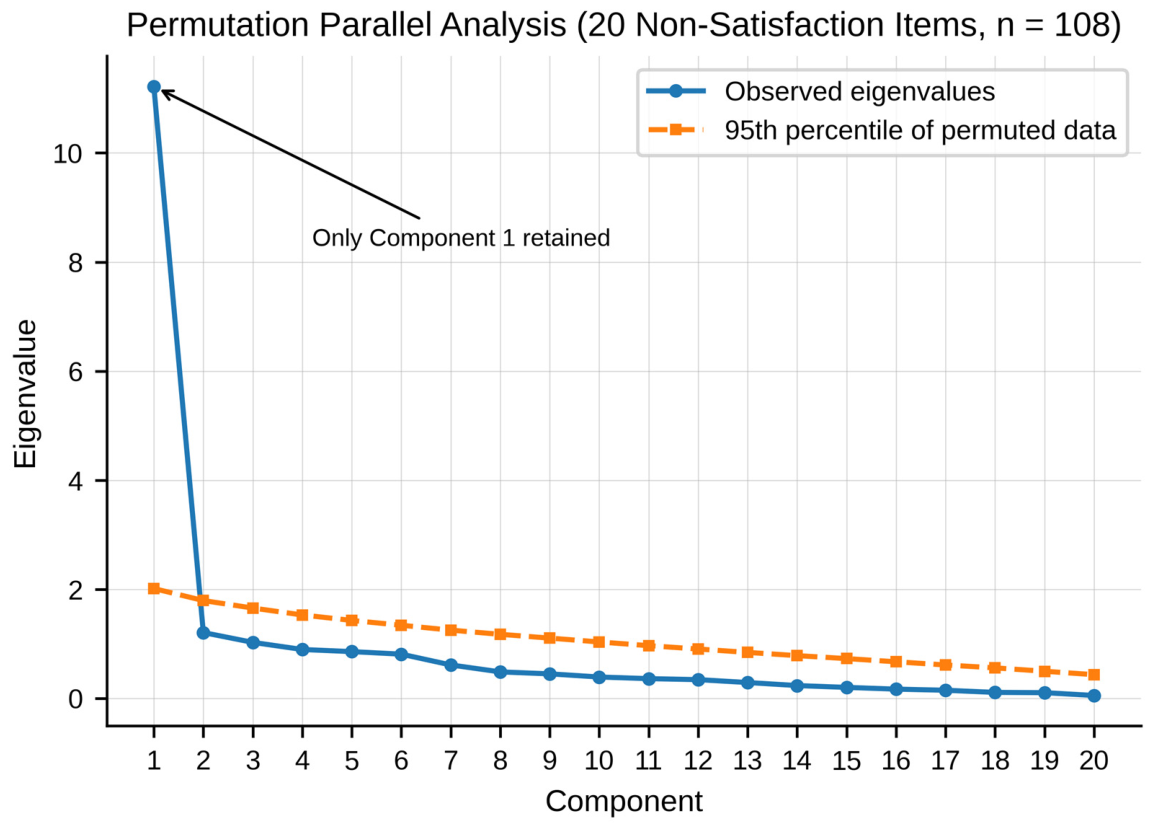
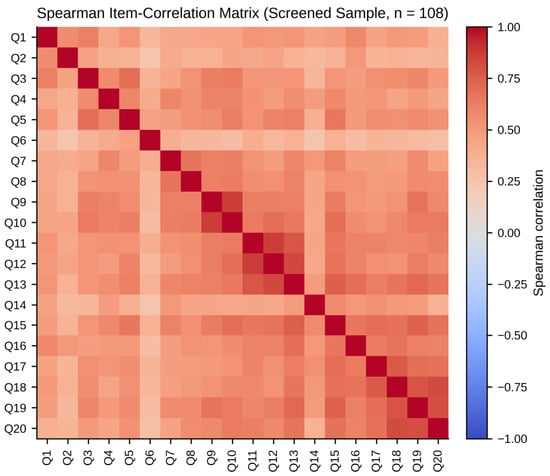
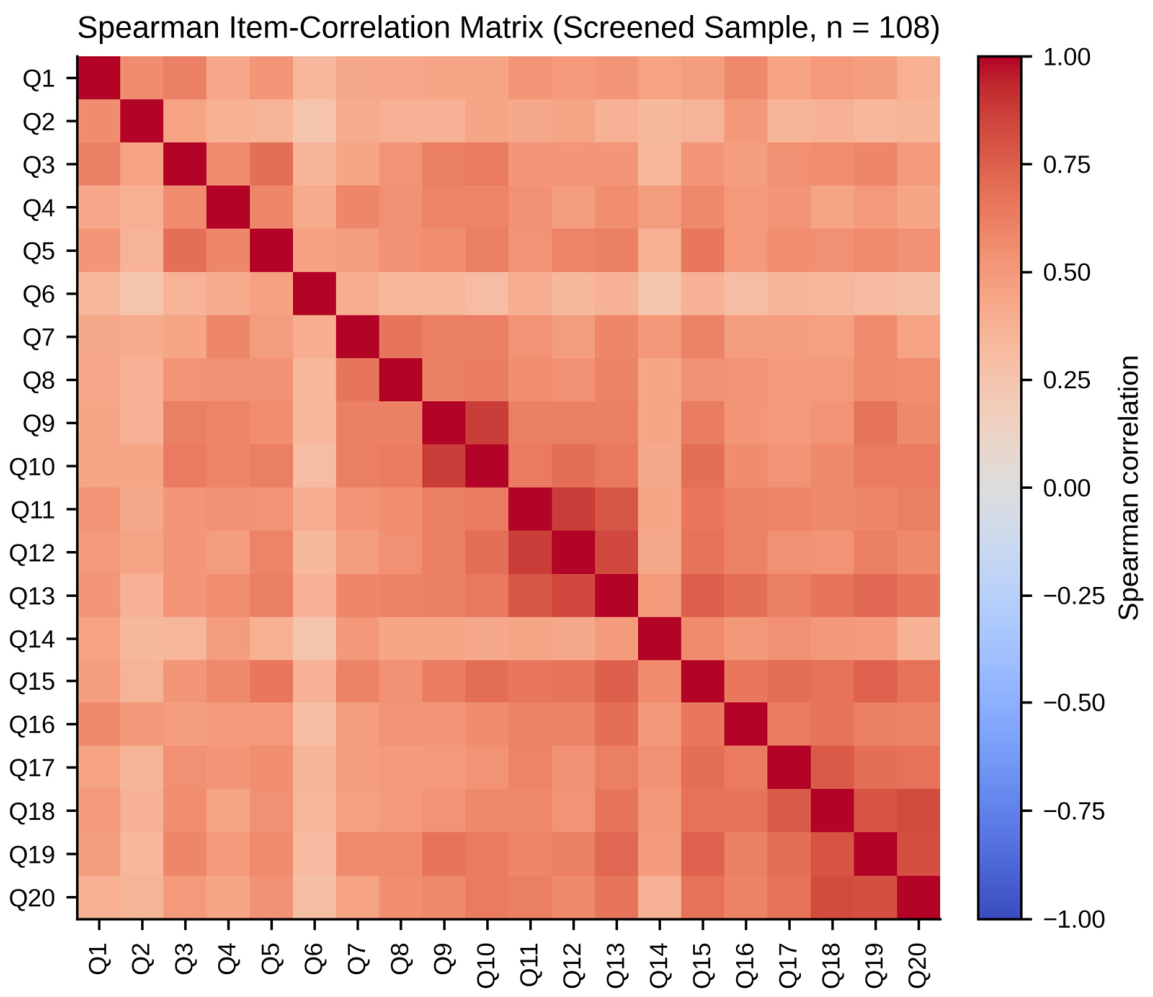
The 20 non-satisfaction items showed strong factorability, with an overall KMO of 0.915, a minimum item-level KMO of 0.843, and a significant Bartlett test, indicating that the correlation matrix contained sufficient common variation for latent-variable analysis. Permutation parallel analysis retained one factor: the first observed eigenvalue was 11.22 and accounted for 56.1% of the total variance, whereas the second eigenvalue fell below the random 95th percentile. Table 7 summarizes the factorability and parallel-analysis diagnostics, Figure 5 shows the permutation parallel-analysis results, and Figure 6 presents the Spearman item-correlation matrix for the screened sample.
Table 7.
Factorability and parallel-analysis diagnostics.
Figure 5.
Permutation parallel analysis for the 20 non-satisfaction items.
Figure 6.
Spearman item-correlation matrix for the screened sample.
The one-factor result is substantively informative rather than merely a technical result. It suggests that students may evaluate multiple system components through a strong general AI-enabled course-quality lens. This pattern is compatible with a course-level halo, common source, similarly valenced wording, and the ceiling distribution. The multi-construct model is therefore a theory-guided decomposition of this integrated system evaluation. At the construct level, the HTMT estimate between AIQ and ENG (0.842) lies close to the conventional 0.85 threshold, and its bootstrap 95% confidence interval [0.727, 0.928] extends above it, so the empirical distinctiveness of these two constructs cannot be regarded as fully established. The multi-construct model is therefore interpreted as a theory-guided decomposition of a strongly integrated course evaluation rather than as confirmed evidence of separable dimensions; if clearer separation cannot be achieved in the next instrument iteration, a more parsimonious higher-order or single-factor model should be preferred (Section 5.7).
4.3. Measurement Model
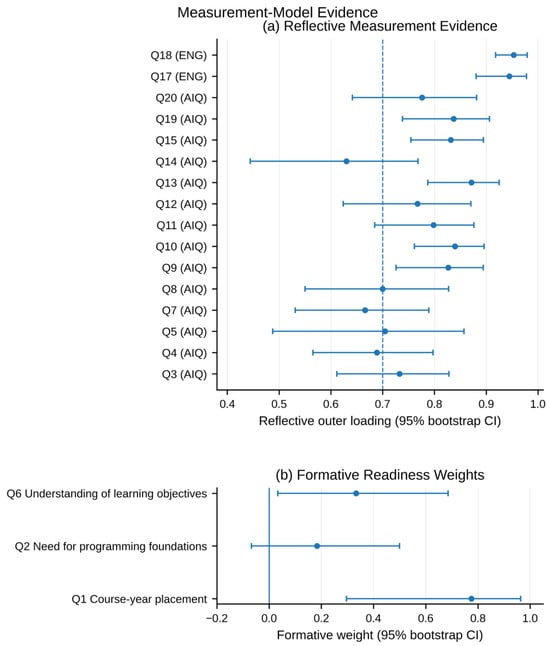
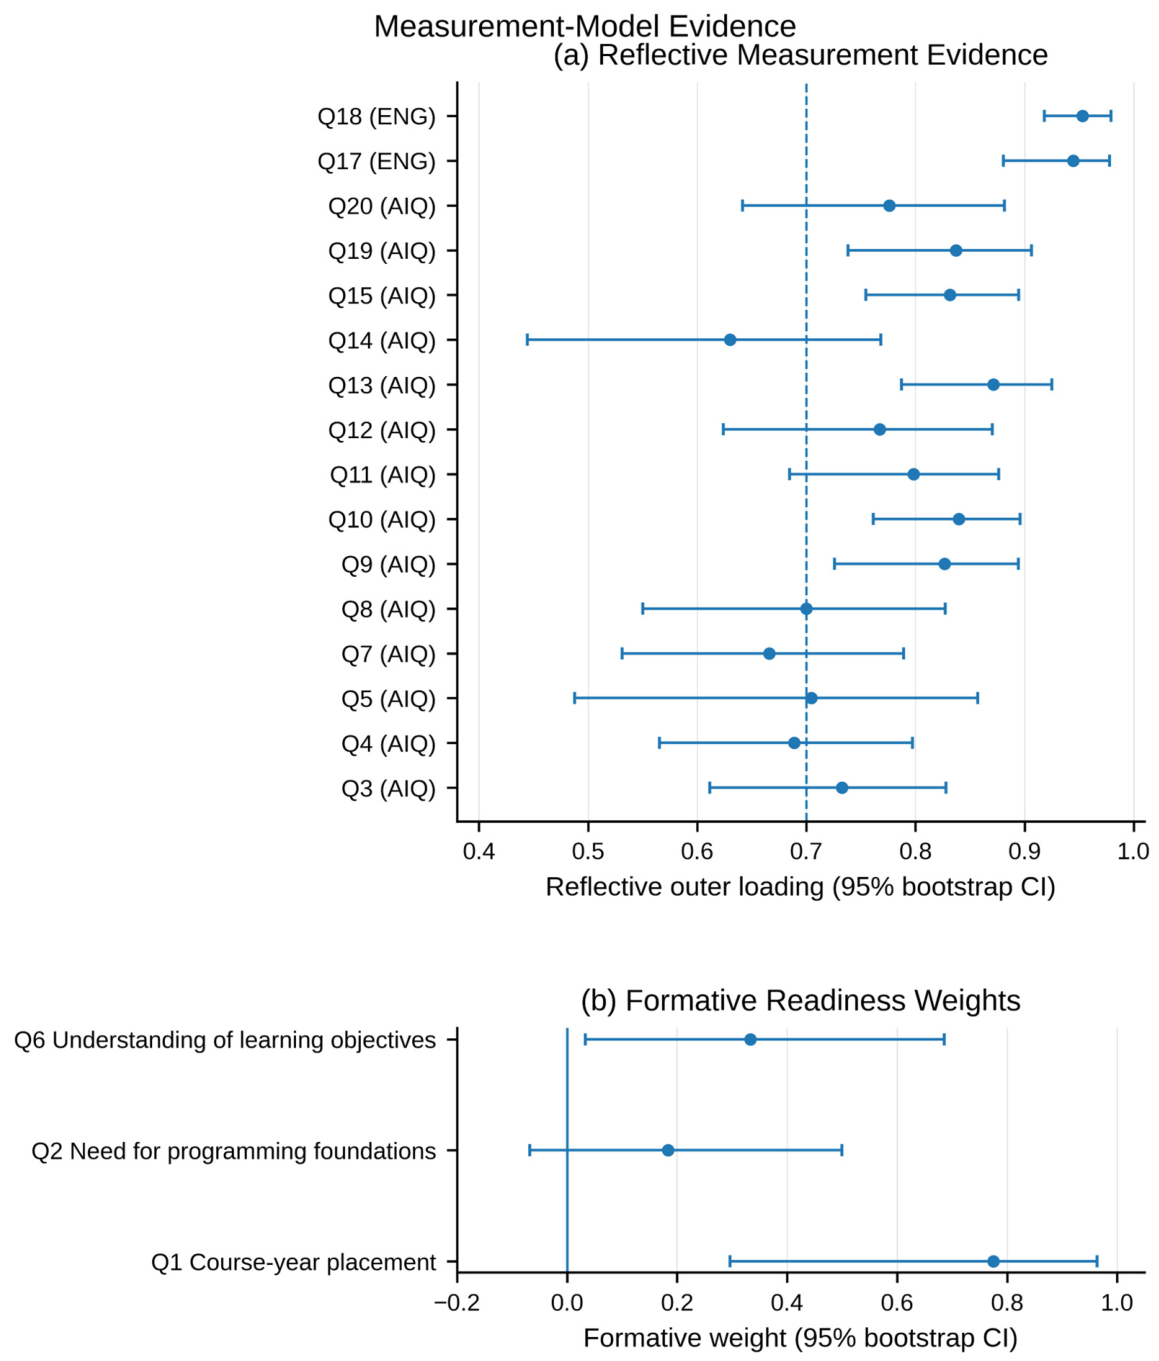
Both reflective constructs showed high internal consistency and convergent validity: composite reliabilities exceeded 0.94, average variance extracted exceeded 0.58, and standardized outer loadings exceeded 0.63. The HTMT value between instructional system quality and engagement was 0.842, below the conventional threshold of 0.85; however, its bootstrap 95% confidence interval [0.727, 0.928] extends above this threshold. Discriminant validity between these constructs therefore cannot be considered fully established, consistent with the cautious interpretation in Section 4.2. Table 8 summarizes reliability, convergent validity, and measurement modes; Table 9 reports construct correlations and discriminant-validity context; and Table 10 and Figure 7 present the reflective outer loadings and formative readiness weights with bootstrap confidence intervals.
Table 8.
Reliability, convergent validity, and measurement-mode summary.
Table 9.
Construct correlations, square roots of AVE, and discriminant-validity context.
Table 10.
Reflective outer loadings and bootstrap confidence intervals.
Figure 7.
Reflective outer loadings and formative readiness weights with bootstrap confidence intervals.
For the formative readiness construct, all variance inflation factors were below 1.25, indicating no problematic collinearity. Course-year placement carried the largest weight, followed by objective understanding; both weights were statistically significant. The weight for the perceived need for programming foundations was positive but nonsignificant. The item was retained because it represents a theoretically necessary readiness condition with an adequate outer loading; deleting it would narrow the construct from readiness to sequencing and objective clarity. Table 11 reports the formative readiness indicator diagnostics.
Table 11.
Formative readiness indicator diagnostics.
4.4. Structural Model and Mediation
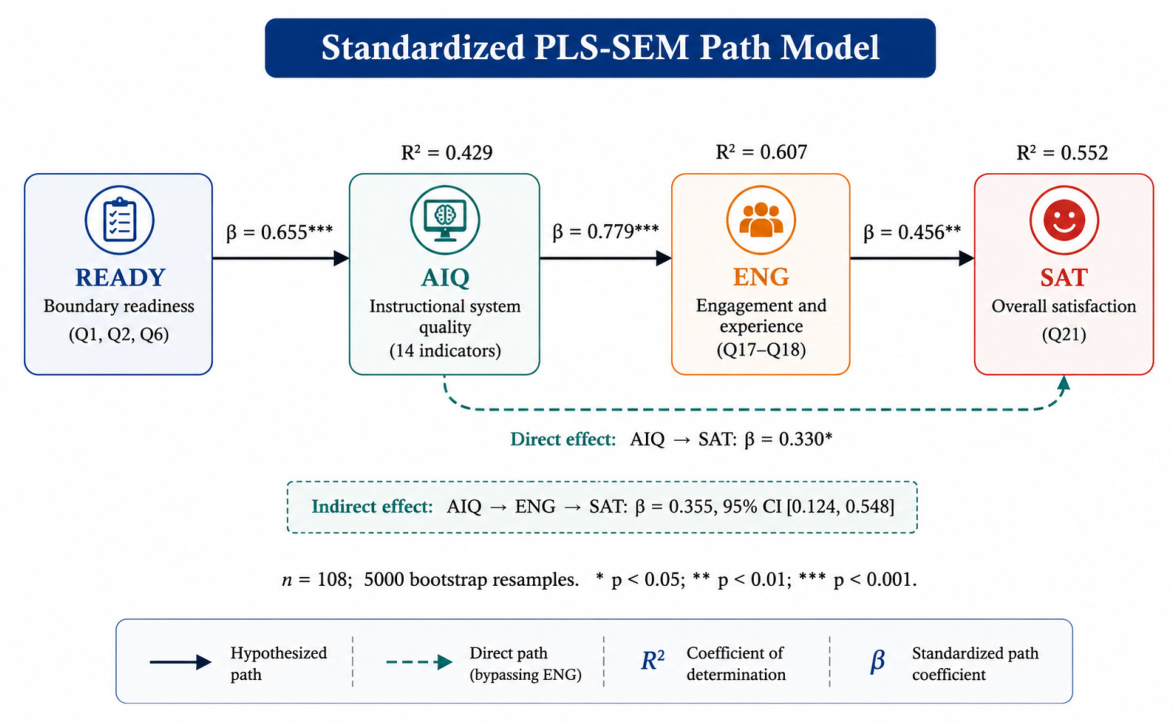
All five hypotheses were supported by the screened-sample estimates. Course readiness was positively associated with AI-enabled instructional system quality, supporting H1, and instructional system quality was strongly associated with learning engagement and experience, supporting H2; these two upstream paths carried the largest standardized coefficients in the model. Quality retained a smaller but significant direct association with satisfaction, supporting H3, while engagement was positively associated with satisfaction, supporting H4. Table 12 reports the structural hypotheses and bootstrap inference.
Table 12.
Structural hypotheses and bootstrap inference (n = 108; 5000 resamples).
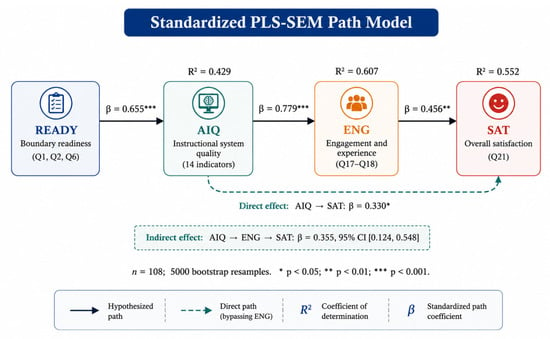
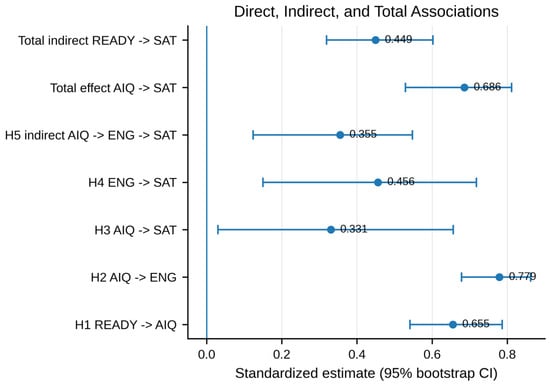
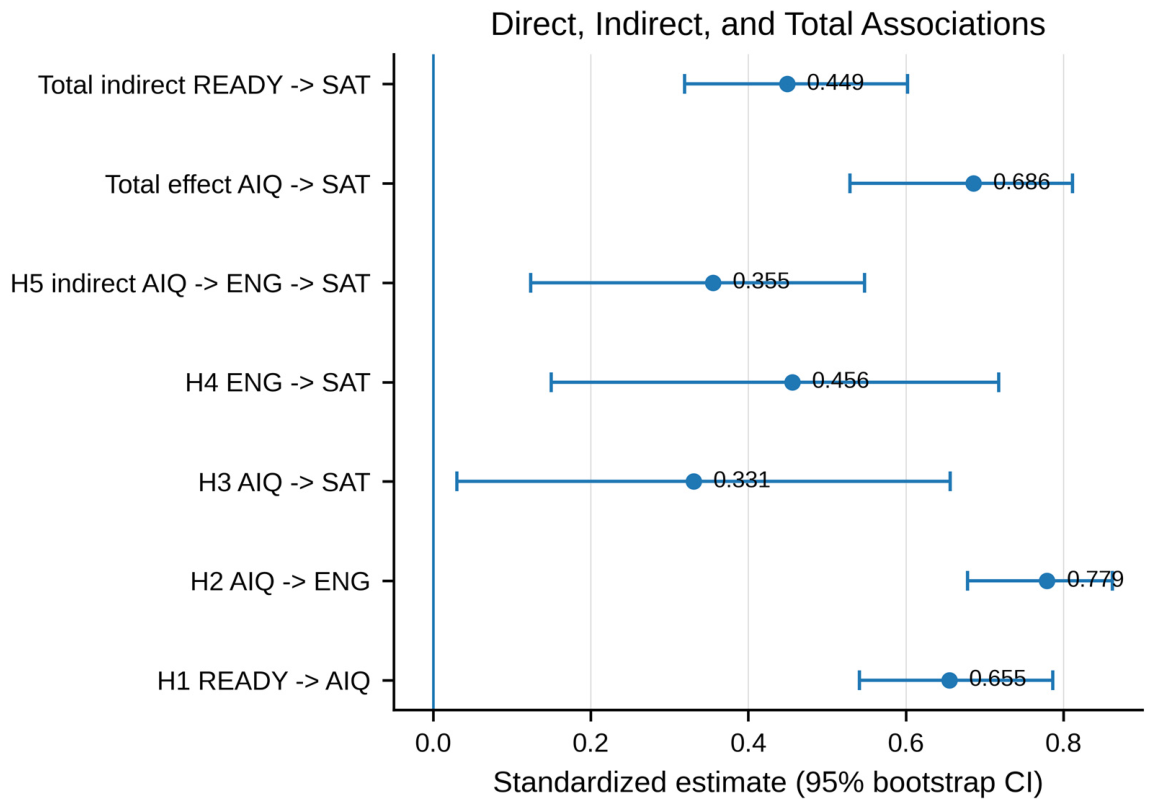
The indirect effect of instructional system quality on satisfaction through engagement was 0.355 and statistically significant, supporting H5: engagement carried more than half of the total association between quality and satisfaction. The model explained 42.9% of the variance in instructional system quality, 60.7% in engagement, and 55.2% in satisfaction, with large effect sizes on the two upstream paths and small-to-moderate effect sizes on the satisfaction paths. The pattern is consistent with the proposed theoretical pathway, with higher instructional system quality associated with satisfaction both directly and indirectly through a more engaging learning experience. Because all primary-model variables were measured concurrently in a single student survey, this estimate supports an indirect association consistent with the proposed theoretical pathway; it does not establish a causal or temporal mediation mechanism. Figure 8 displays the standardized path estimates and explained variance, and Figure 9 shows the bootstrap confidence intervals for the direct, indirect, and total associations.
Figure 8.
Standardized PLS-SEM path estimates, explained variance, and indirect association.
Figure 9.
Bootstrap confidence intervals for direct, indirect, and total associations.
4.5. Full-Sample Sensitivity Analysis
The full-sample sensitivity analysis produced the same path directions and ordering, with coefficient differences below 0.05 for every direct, indirect, and total effect, and full-sample R2 values were modestly higher. The substantive conclusions are therefore robust to the exclusion rule, and the screened estimates provide the more conservative reporting basis. Table 13 compares the screened-sample and full-sample estimates.
Table 13.
Screened-sample versus full-sample sensitivity analysis.
4.6. Correlation-Based Item-Level Importance–Performance Priorities
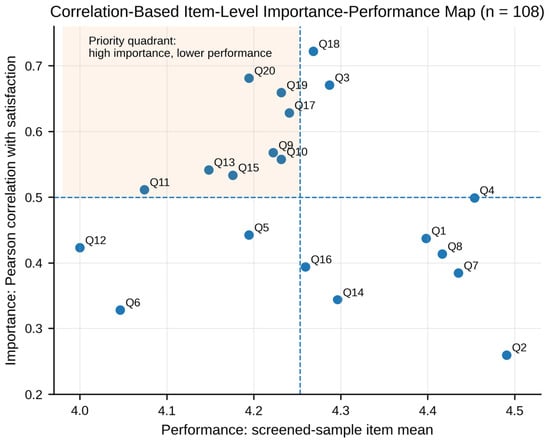
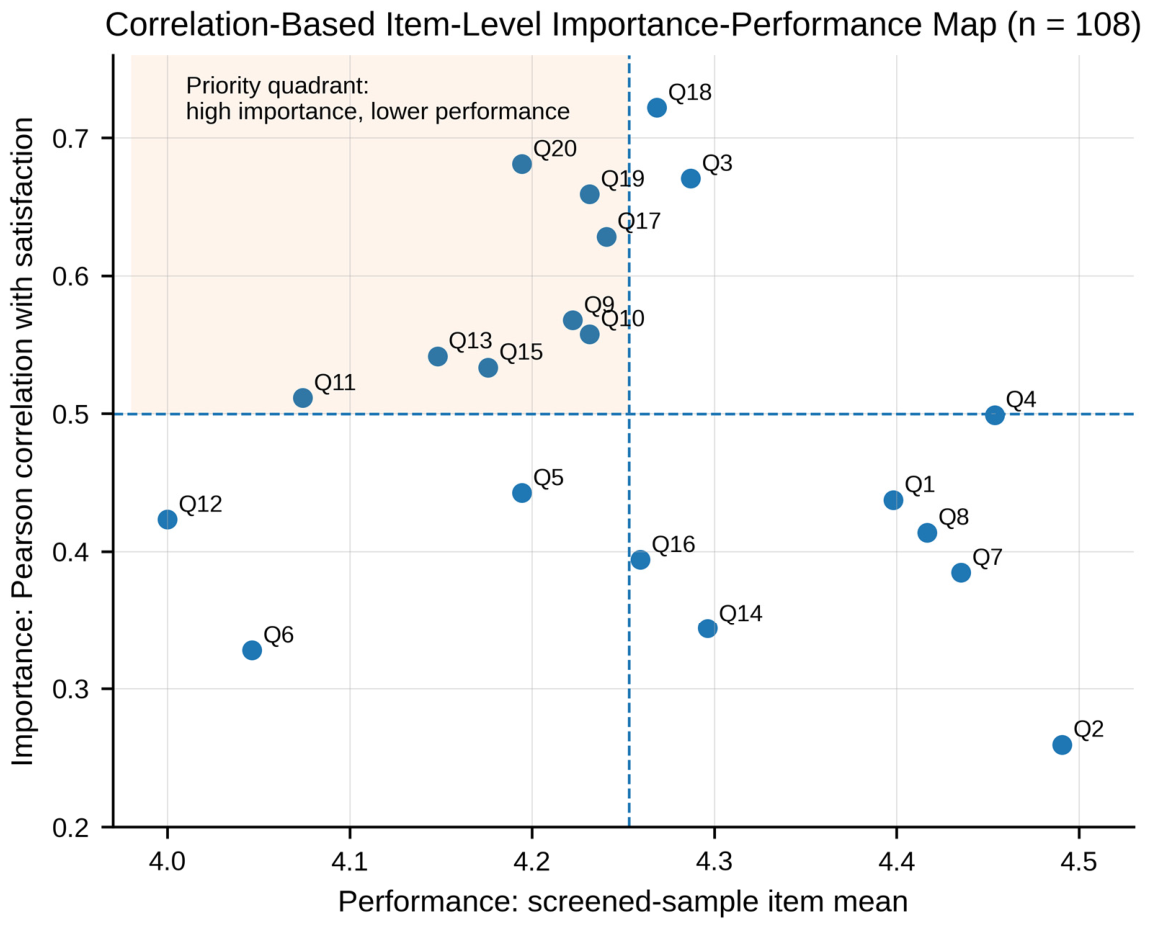
The screened-sample mean performance was 4.25, and the mean item-satisfaction correlation was 0.50. Eight items fell into the priority quadrant of high importance and comparatively lower performance: the weighting of AI and digital skills in assessment, innovation of AI-enabled assessment, teaching-experience favorability, AI integration into teaching cases and into courseware, novelty of cases and courseware, personalization fit, and frequency of resource updating. Learning enthusiasm and AI integration into application scenarios were highly important but slightly above the performance cutoff, marking strengths to maintain rather than immediate weaknesses. Table 14 lists the priority items and their redesign implications, and Figure 10 shows the importance–performance map.
Table 14.
Priority items from the correlation-based item-level importance–performance analysis.
Figure 10.
Correlation-based item-level importance–performance map for the screened sample.
The priority pattern concentrates on the process-control and renewal functions of the system. Assessment defines what behavior is rewarded; cases and courseware define the problems through which AI is used; updating and novelty determine whether the environment remains aligned with fast-changing tools; personalization affects fit; and teaching experience is the human response through which these components are integrated.
4.7. GaussDB Implementation-Layer Evidence
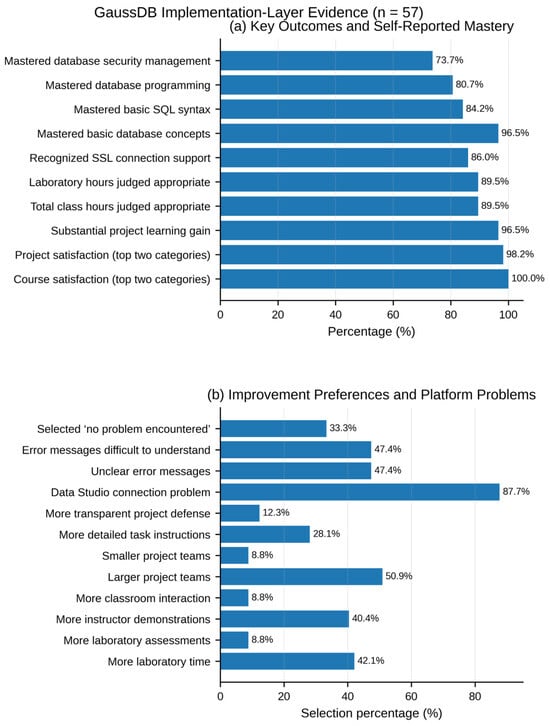
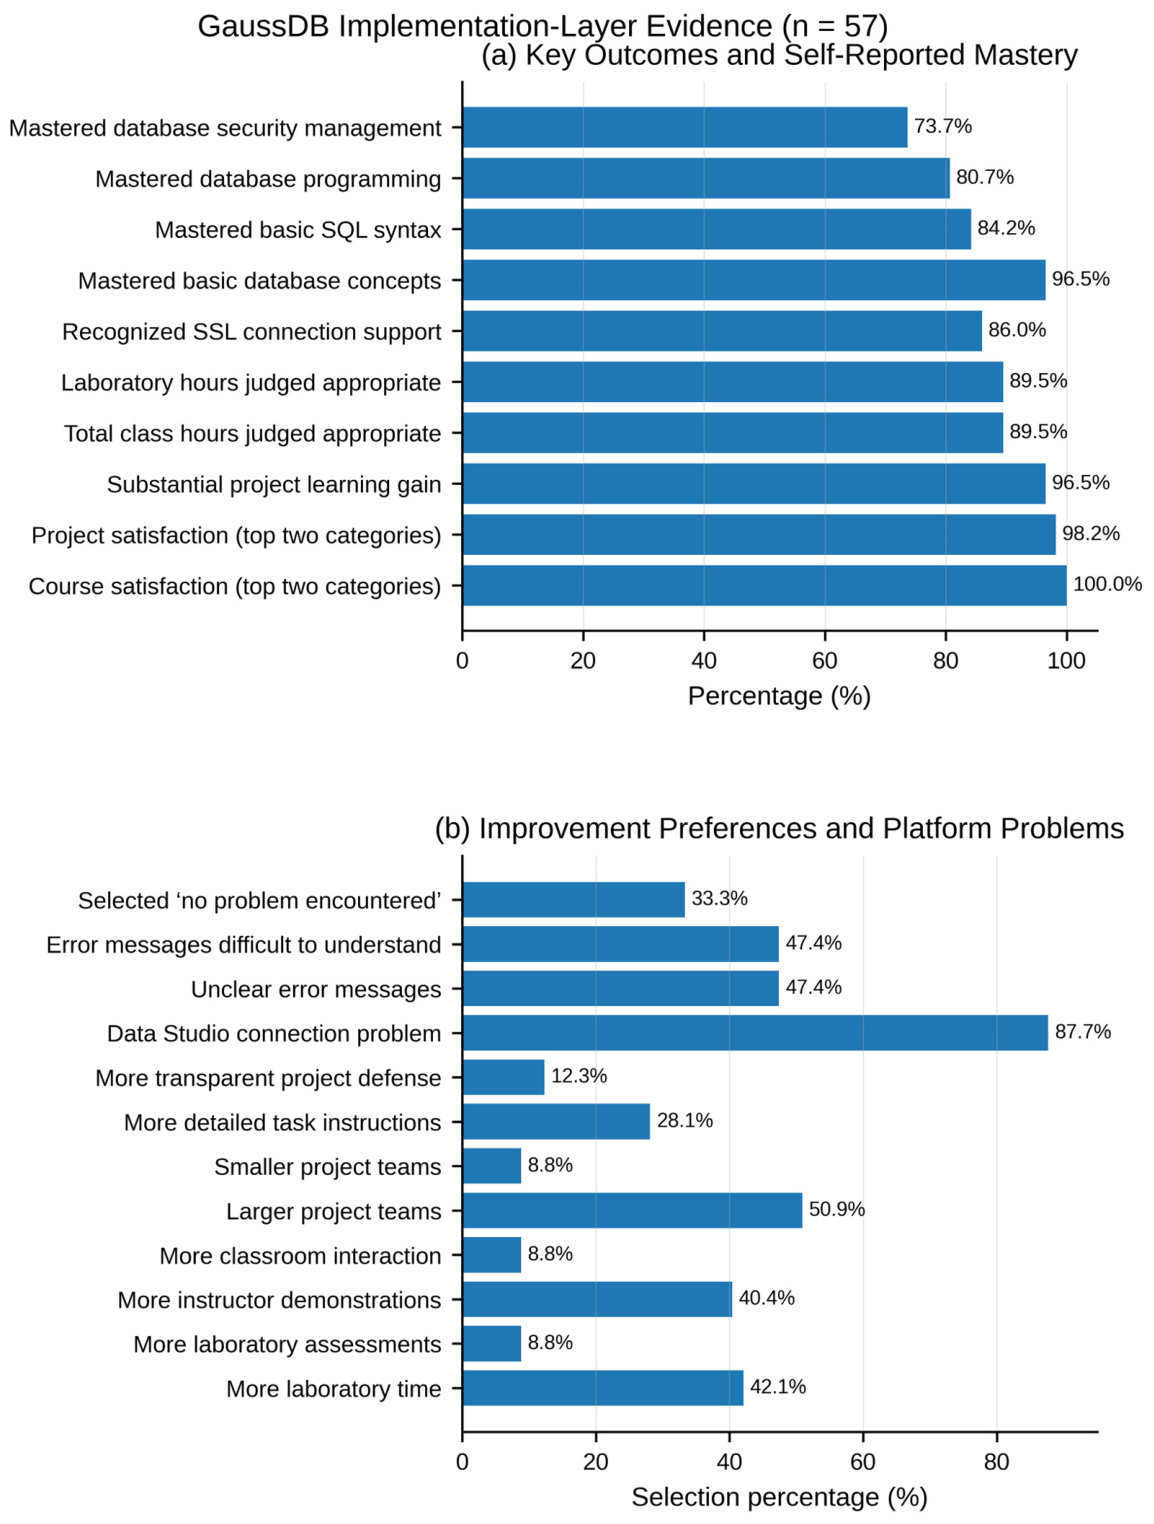
The GaussDB survey showed very positive overall outcomes: every respondent selected one of the top two course-satisfaction categories, 98.2% selected one of the top two project-satisfaction categories, and 96.5% reported substantial project learning gain. Both total class hours and laboratory hours were judged appropriate by 89.5% of respondents. Self-reported mastery declined with increasing content complexity, from 96.5% for basic database concepts to 73.7% for database security management, with SQL syntax and database programming in between. Table 15 summarizes the selected GaussDB outcomes and implementation bottlenecks.
Table 15.
Selected GaussDB outcomes and implementation bottlenecks (n = 57; multi-select percentages are non-exclusive).
The implementation evidence also revealed system constraints. Data Studio connection problems were selected by 87.7% of respondents, and unclear or hard-to-understand error messages by 47.4% each. The most frequent improvement requests were larger project teams, more laboratory time, and more instructor demonstrations, each selected by more than 40% of respondents. Fifteen respondents selected both a specific platform problem and the no-problem option; the multi-select frequencies are therefore reported as descriptive, non-exclusive categories. This item-design weakness means the platform-problem percentages should be read as upper-bound, non-exclusive descriptive indicators rather than as mutually exclusive incidence rates. Figure 11 visualizes the key outcomes, improvement preferences, and platform problems.
Figure 11.
GaussDB implementation-layer evidence: key outcomes, improvement preferences, and platform problems.
These findings complement the primary model. High satisfaction can coexist with infrastructure friction, uneven mastery of advanced content, and requests for additional scaffolding. The cloud platform is not a background variable: connection stability, diagnostic clarity, demonstration, task specification, and team architecture determine whether the intended learning process can operate. Because the GaussDB dataset comes from a different cohort, instrument, and time period and cannot be linked to the primary sample, it is used as contextual, implementation-layer evidence only, not as triangulation of, or validation evidence for, the PLS-SEM model.
5. Discussion
5.1. Readiness Defines the Operational Boundary of AI Support
The READY-to-AIQ path was large, suggesting that students’ evaluation of AI-enabled instruction is conditioned by course placement, prerequisite knowledge, and objective clarity. This is a systems result because the same technical capability can have different educational consequences under different boundary conditions. An AI-generated explanation may be a useful scaffold for a student who can test and contextualize it, but a persuasive substitute for a student who lacks foundational schemas. Likewise, an AI-enhanced case cannot compensate for an unclear objective because students cannot determine which features of the output matter.
The comparatively low mean for direct understanding of course objectives (Q6) reinforces this interpretation. Course teams should make the boundary conditions observable at the start of the course through prerequisite diagnostics, worked examples, short bridge modules, and explicit statements of permitted, required, and prohibited AI use. A practical design artifact is an objective–task–AI–evidence matrix: each learning objective is linked to a disciplinary task, the permitted AI function, the required student verification, and the assessment evidence. This matrix prevents AI features from expanding independently of the curriculum’s intended capabilities.
The nonsignificant formative weight for Q2 should not be interpreted as evidence that programming foundations are unimportant. The item measured agreement that foundations are needed, not actual proficiency, and formative indicators need not covary strongly. Future studies should link survey responses to diagnostic scores or prerequisite-course performance to distinguish perceived necessity from demonstrated readiness.
5.2. Engagement and the Proposed Indirect Pathway
The strongest structural relationship was AIQ to ENG, and the indirect effect through engagement was slightly larger than the direct AIQ-to-satisfaction path. This pattern is consistent with the proposed theoretical pathway: system quality is indirectly associated with satisfaction through greater enthusiasm and a more favorable teaching process. It is not sufficient for cases, platforms, or AI tools to be available; they must organize activity that requires students to interpret, compare, test, debug, explain, and revise.
In algorithms and data structures, this can be implemented through competing-solution tasks in which students compare AI-proposed algorithms, derive complexity, construct counterexamples, and explain why an apparently elegant solution fails under boundary conditions. In SQL and database courses, students can use AI to propose schemas or queries, but must validate functional dependencies, constraints, execution plans, security permissions, and results on adversarial data [37]. Such tasks preserve AI’s productivity advantages while making human judgment visible.
Because the design is cross-sectional, these paths are interpreted as theory-consistent associations; the longitudinal evaluation design in Section 6.2 specifies how temporal ordering will be tested in the next reform cycle.
5.3. Assessment Is the Course System’s Control Subsystem
Assessment innovation and the weighting of AI/digital skills were the two highest-priority items in the correlation-based item-level importance–performance analysis. In systems terms, assessment is a control subsystem: it specifies target behavior, generates performance signals, and determines how the course responds [38]. When assessment observes only a final report or code artifact, it cannot distinguish independent reasoning, uncritical generation, productive human–AI collaboration, or post hoc editing. The control signal is therefore noisy and can drive the system toward superficial output optimization.
Assessment should shift from product inspection to auditable process evidence [1,39,40]. Recommended evidence includes problem framing, prompt and query iterations, retained and rejected model outputs, test cases, version history, human modifications, fact-checking, error analysis, and a brief reflection on limitations. This evidence should be combined with controlled no-AI checks of core concepts, live debugging, oral defense, and transfer tasks. A rubric can separately score disciplinary reasoning, AI-use strategy, verification quality, software or data-engineering standards, communication, ethics, and individual team contribution.
The appropriate percentage assigned to AI-assisted work is course-specific. A defensible design might reserve a portion for unaided core competence, a portion for the project process and version evidence, a portion for validated human–AI output, and a portion for oral defense, transfer, and ethical reasoning. The key principle is not a universal formula but alignment between the capability claimed and the evidence collected.
5.4. Infrastructure and Resource Renewal Create a Hidden Performance Ceiling
Resource updating, case novelty, courseware integration, and personalization were all priorities in the correlation-based item-level importance–performance analysis, while the GaussDB survey exposed connection and diagnostic-usability problems. These findings show how infrastructure and content renewal create a hidden ceiling on course performance. Students cannot spend cognitive effort on schema design, query optimization, or algorithmic reasoning when a substantial share of time is consumed by environment configuration, connection failures, or opaque error messages.
A course-level service architecture should therefore include versioned environment specifications, tested setup scripts, backup mirrors, offline datasets, a common-error knowledge base, and a defined escalation path. Resource governance should include a release calendar, version numbers, change logs, and periodic retirement of obsolete cases. Because AI tools evolve rapidly, case novelty should not mean novelty for its own sake; it should mean that tasks remain representative of current capabilities, failure modes, and professional constraints.
Team size and laboratory time also require systems design rather than simple expansion. Larger teams may reduce workload but can obscure individual contribution; more laboratory time may help only when it is redirected from repeated configuration toward high-value design, debugging, and verification. Role rotation, individual checkpoints, repository evidence, and peer assessment can preserve accountability within collaborative projects.
5.5. Governance, Ethics, and Responsible AI Use
The governance layer must make privacy, security, attribution, academic integrity, and exception handling operational rather than aspirational. International guidance and competency frameworks emphasize human oversight, transparency, data protection, and the ability of students and teachers to evaluate AI outputs critically [39,41,42,43]. In computing courses, these requirements extend to source-code provenance, licensing, confidential data, credentials, insecure generated code, prompt leakage, and the security implications of cloud databases.
A course governance protocol should define which tools and data may be used, where generated artifacts and prompts are stored, what must be disclosed, how suspected errors or integrity breaches are escalated, and how students can complete essential work when a platform fails. Governance is therefore coupled to assessment and infrastructure: rules that cannot be observed in evidence or supported by the technical environment will not function as effective system controls.
5.6. Contribution to Systems Research
This study contributes to Systems research in five ways. First, it specifies the system boundary and separates environmental constraints, readiness conditions, the operating instructional system, the human response subsystem, governance, and outcomes. Second, it treats AI-enabled quality as a joint configuration of tasks, resources, platforms, personalization, and assessment rather than as a property of an AI tool. Third, the indirect-association model identifies engagement as a theory-consistent link between system operation and satisfaction. Fourth, the correlation-based item-level importance–performance analysis and GaussDB evidence translate latent associations and implementation observations into component-level redesign priorities. Fifth, the proposed feedback loop makes monitoring and iteration part of the system rather than an after-the-fact evaluation.
This framing also clarifies why high satisfaction is not equivalent to a fully optimized system. A system can receive high aggregate ratings while still containing bottlenecks, weak control signals, and fragile infrastructure. Systems analysis therefore requires attention to variance, dependencies, boundary conditions, and failure modes, not only mean approval [14].
5.7. Methodological Limitations and Future Research
Several limitations qualify the findings. First, the primary sample came from one university and a limited set of computing courses, restricting external validity. Second, the instrument did not include demographic variables, actual year level, prior achievement, AI-use frequency, or teacher/class identifiers; subgroup differences and measurement invariance could not be assessed. Third, all primary-model variables were measured through one cross-sectional student survey. The dominant first factor, high correlations, and HTMT confidence interval indicate common-method and halo risks [44]. Fourth, overall satisfaction was a single item. Fifth, the GaussDB survey was a separate descriptive dataset and used a multi-select format in which respondents could select both a problem and the no-problem option. Sixth, the sample size supports the estimated effects but is not sufficient for complex multigroup or higher-order modeling. Because course, teacher, year-level, prior-achievement, and demographic identifiers were unavailable, the clustering of students within courses or instructors could not be modeled, and the independence assumption underlying the bootstrap inference cannot be verified; subgroup and measurement-invariance analyses are likewise precluded, which further limits the generalizability of the structural paths.
Future research should use multi-course and multi-university samples; repeated measurements before, during, and after implementation; objective concept tests; code-repository and platform-log indicators; project-quality and security-defect measures; and instructor or observer ratings. A stepped-wedge, matched-cohort, or randomized task-level design could strengthen causal inference. Measurement development should include cognitive interviews, pilot testing, balanced item wording, multi-item outcome constructs, and out-of-sample validation. Where adequate sample sizes are available, predictive assessment, latent classes, configurational analysis, and system-dynamics or process-mining methods could reveal heterogeneous pathways and feedback delays.
The one-factor parallel-analysis result and the HTMT confidence interval define the measurement agenda for the next instrument iteration. The multi-construct model is a theory-guided decomposition of an integrated course evaluation, and the planned combination of cognitive interviews, balanced wording, multi-source measures, and confirmatory out-of-sample testing will substantiate the distinctiveness of READY, AIQ, and ENG.
6. Design Implications: A Six-Stage Redesign and Feedback Loop
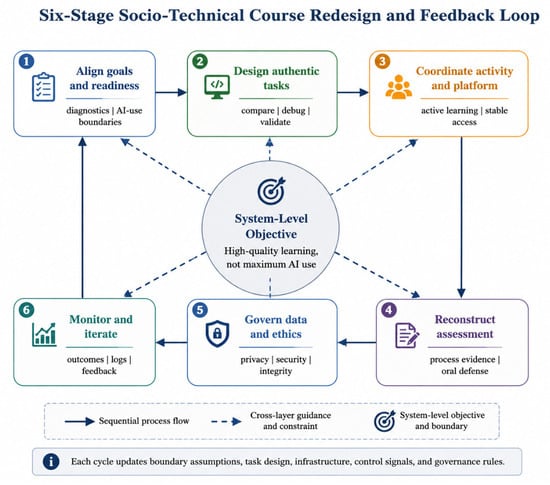
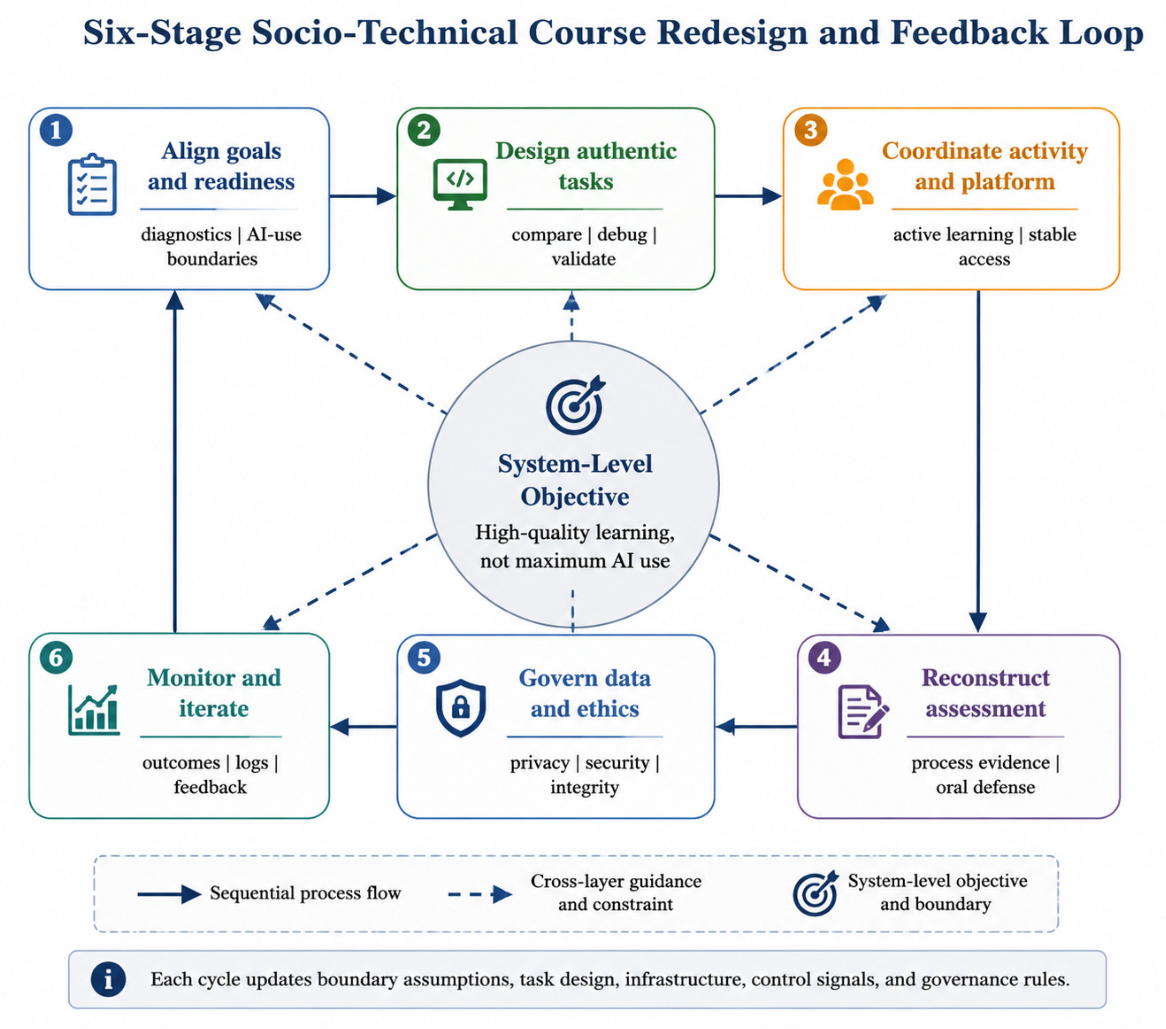
The empirical findings imply that course reform should be managed as an iterative system redesign rather than a one-off technology deployment. The proposed loop has six stages. Each stage produces artifacts and monitoring evidence that feed the next stage and, through iteration, update earlier design assumptions. Table 16 details the six-stage redesign architecture, and Figure 12 depicts the redesign and feedback loop.
Table 16.
Six-stage socio-technical redesign architecture.
Figure 12.
Six-stage socio-technical course redesign and feedback loop.
6.1. Staged Implementation
A feasible implementation begins with one or two high-value tasks rather than an immediate full-course overhaul. In the diagnostic stage, the course team maps program outcomes, identifies prerequisite gaps, and documents AI-use rules. In the pilot stage, it selects an authentic task such as algorithm comparison with complexity validation or transportation-enterprise database design with security auditing. The task package should include a common brief, test data, expected evidence, scoring rubric, platform specification, and backup environment.
During implementation, the team monitors resource use, platform failures, help requests, prompt and revision traces, and formative performance. After the pilot, satisfaction should be considered together with concept gains, code or query quality, security defects, oral-defense performance, and student workload. The redesign should expand only when these multiple indicators show that AI use improves the intended capabilities without disproportionate integrity, privacy, or infrastructure costs.
6.2. Evaluation Design for the Next Reform Cycle
The next cycle should be evaluated as a longitudinal socio-technical intervention. A practical quasi-experimental design would compare successive course offerings or matched sections while holding core content and staffing as constant as possible. Baseline measures would include prerequisite knowledge, AI literacy, and prior performance. Process measures would include platform use, failure and help logs, repository activity, task completion, and classroom observation. Outcomes would include concept tests, project quality, transfer tasks, security and correctness defects, engagement, satisfaction, and ethical reasoning.
The analytical plan should test measurement invariance across courses or cohorts, estimate change over time, and examine whether platform stability or prior knowledge moderates the quality–engagement relationship. Qualitative interviews can explain why students respond differently to the same system configuration. This mixed evidence would allow the feedback loop to be calibrated around learning quality rather than survey positivity alone.
7. Conclusions
This study reframed AI-enabled computing-course reform as the redesign of a socio-technical instructional system. Students reported high overall satisfaction, but the data also revealed a structured set of redesign needs. Course readiness was associated with perceived instructional system quality; quality was strongly associated with learning engagement and experience; and engagement carried a substantial share of the association between quality and satisfaction. Assessment design, the weighting of AI and digital skills, teaching experience, case and courseware integration, resource renewal, and personalization were the primary improvement priorities. Separate GaussDB evidence showed that connectivity, diagnostic usability, laboratory time, instructor demonstration, team organization, and advanced database content remain operational constraints even in a highly rated course.
The central implication is that high-quality reform does not maximize AI use. It coordinates prerequisites, objectives, authentic tasks, human judgment, stable infrastructure, auditable assessment, and governance within a monitored feedback loop. The proposed six-stage architecture offers a testable design for the next reform cycle. Stronger evidence will require multi-source, longitudinal, and multi-institutional evaluation, but the present results provide a reproducible systems-oriented baseline for moving from technology addition to instructional system redesign.
Author Contributions
Conceptualization, Z.Z. and S.L.; methodology, Z.Z.; software, Z.Z.; validation, Z.Z., L.H. and Y.Y.; formal analysis, Z.Z.; investigation, S.L., L.H. and X.Z.; resources, S.L.; data curation, Z.Z. and Y.Y.; writing—original draft preparation, Z.Z.; writing—review and editing, Z.Z., S.L., L.H., Y.Y. and X.Z.; visualization, Z.Z.; supervision, S.L.; project administration, S.L.; funding acquisition, S.L. All authors have read and agreed to the published version of the manuscript.
Funding
This work was supported by Fujian University of Technology Characteristic Course “SQL Language Fundamentals and Applications” (Grant No. E3600393) and the project “Research on the Construction of High-Level Innovative Information Management and Information Systems Programs in Science and Engineering Universities” (Grant No. GJ-YB-24-09).
Institutional Review Board Statement
This study was conducted in accordance with the Declaration of Helsinki and approved by the Institutional Review Board of Fujian University of Technology (approval No. 2025025; date of approval [17.03.2025]). The approval covers both the primary AI-enabled instruction survey and the secondary analysis of the anonymized GaussDB course-evaluation records collected in July 2023; the original respondents consented to the research use of their anonymized evaluations.
Informed Consent Statement
Informed consent was obtained from all subjects involved in this study.
Data Availability Statement
The data generated or analyzed in this study are available from the corresponding author upon reasonable request.
Conflicts of Interest
The authors declare no conflicts of interest.
References
- Miao, F.; Holmes, W. Guidance for Generative AI in Education and Research; UNESCO: Paris, France, 2023. [Google Scholar] [CrossRef] [Scilit]
- OECD. OECD Digital Education Outlook 2023: Towards an Effective Digital Education Ecosystem; OECD Publishing: Paris, France, 2023. [Google Scholar] [CrossRef] [Scilit]
- Ministry of Education of the People’s Republic of China; National Development and Reform Commission; Ministry of Industry and Information Technology; Ministry of Science and Technology; National Data Administration. AI + Education Action Plan. Available online: https://www.moe.gov.cn/srcsite/A16/s3342/202604/t20260410_1433240.html2026; (accessed on 25 July 2026).
- Ministry of Education of the People’s Republic of China; Cyberspace Administration of China; National Development and Reform Commission; Ministry of Science and Technology; Ministry of Industry and Information Technology; Ministry of Public Security; Ministry of Finance; Ministry of Human Resources and Social Security; National Data Administration. Opinions on Accelerating Educational Digitalization. Available online: https://www.moe.gov.cn/jyb_xwfb/s5147/202504/t20250417_1187731.html2025; (accessed on 25 July 2026).
- Zawacki-Richter, O.; Marín, V.I.; Bond, M.; Gouverneur, F. Systematic review of research on artificial intelligence applications in higher education-where are the educators? Int. J. Educ. Technol. High. Educ. 2019, 16, 39. [Google Scholar] [CrossRef] [Scilit]
- Kasneci, E.; Sessler, K.; Küchemann, S.; Bannert, M.; Dementieva, D.; Fischer, F.; Gasser, U.; Groh, G.; Günnemann, S.; Hüllermeier, E.; et al. ChatGPT for good? On opportunities and challenges of large language models for education. Learn. Individ. Differ. 2023, 103, 102274. [Google Scholar] [CrossRef] [Scilit]
- Tlili, A.; Shehata, B.; Adarkwah, M.A.; Bozkurt, A.; Hickey, D.T.; Huang, R.; Agyemang, B. What if the devil is my guardian angel: ChatGPT as a case study of using chatbots in education. Smart Learn. Environ. 2023, 10, 15. [Google Scholar] [CrossRef] [Scilit]
- Lo, C.K. What is the impact of ChatGPT on education? A rapid review of the literature. Educ. Sci. 2023, 13, 410. [Google Scholar] [CrossRef] [Scilit]
- Lau, S.; Guo, P.J. From “Ban It Till We Understand It” to “Resistance Is Futile”: How university programming instructors plan to adapt as more students use AI code generation and explanation tools such as ChatGPT and GitHub Copilot. In Proceedings of the 2023 ACM Conference on International Computing Education Research, Chicago, IL, USA, 7–11 August 2023; pp. 106–121. [Google Scholar] [CrossRef] [Scilit]
- Zhai, C.; Wibowo, S.; Li, L.D. The effects of over-reliance on AI dialogue systems on students’ cognitive abilities: A systematic review. Smart Learn. Environ. 2024, 11, 28. [Google Scholar] [CrossRef] [Scilit]
- Lambovska, M. A Fuzzy Model for Team Control and Its Application. Manag. Prod. Eng. Rev. 2018, 9, 108–119. [Google Scholar] [CrossRef] [Scilit]
- Bond, M.; Khosravi, H.; De Laat, M.; Bergdahl, N.; Negrea, V.; Oxley, E.; Pham, P.; Chong, S.W.; Siemens, G. A meta systematic review of artificial intelligence in higher education: A call for increased ethics, collaboration, and rigour. Int. J. Educ. Technol. High. Educ. 2024, 21, 4. [Google Scholar] [CrossRef] [Scilit]
- Bostrom, R.P.; Heinen, J.S. MIS problems and failures: A socio-technical perspective. Part I: The causes. MIS Q. 1977, 1, 17–32. [Google Scholar] [CrossRef] [Scilit]
- Baxter, G.; Sommerville, I. Socio-technical systems: From design methods to systems engineering. Interact. Comput. 2011, 23, 4–17. [Google Scholar] [CrossRef] [Scilit]
- DeLone, W.H.; McLean, E.R. The DeLone and McLean model of information systems success: A ten-year update. J. Manag. Inf. Syst. 2003, 19, 9–30. [Google Scholar] [CrossRef] [Scilit]
- Petter, S.; DeLone, W.; McLean, E. Measuring information systems success: Models, dimensions, measures, and interrelationships. Eur. J. Inf. Syst. 2008, 17, 236–263. [Google Scholar] [CrossRef] [Scilit]
- Biggs, J. Enhancing teaching through constructive alignment. High. Educ. 1996, 32, 347–364. [Google Scholar] [CrossRef] [Scilit]
- Freeman, S.; Eddy, S.L.; McDonough, M.; Smith, M.K.; Okoroafor, N.; Jordt, H.; Wenderoth, M.P. Active learning increases student performance in science, engineering, and mathematics. Proc. Natl. Acad. Sci. USA 2014, 111, 8410–8415. [Google Scholar] [CrossRef] [Scilit] [PubMed]
- Fredricks, J.A.; Blumenfeld, P.C.; Paris, A.H. School engagement: Potential of the concept, state of the evidence. Rev. Educ. Res. 2004, 74, 59–109. [Google Scholar] [CrossRef] [Scilit]
- Kahu, E.R. Framing student engagement in higher education. Stud. High. Educ. 2013, 38, 758–773. [Google Scholar] [CrossRef] [Scilit]
- Jia, X.-H.; Tu, J.-C. Towards a new conceptual model of AI-enhanced learning for college students: The roles of artificial intelligence capabilities, general self-efficacy, learning motivation, and critical thinking awareness. Systems 2024, 12, 74. [Google Scholar] [CrossRef] [Scilit]
- Chen, Y.; Bao, J.; Weng, G.; Shang, Y.; Liu, C.; Jiang, B. AI-enabled multi-mode electronic information innovation practice teaching reform prediction and exploration in application-oriented universities. Systems 2024, 12, 442. [Google Scholar] [CrossRef] [Scilit]
- Liang, J.; Zhang, Y.; Xu, H.; Zeng, M.; Luo, Y. Enhancing student systems thinking in generative artificial intelligence-supported logistics management education in China: An integrated model with PLS-SEM and fsQCA. Systems 2026, 14, 311. [Google Scholar] [CrossRef] [Scilit]
- Diamantopoulos, A.; Winklhofer, H.M. Index construction with formative indicators: An alternative to scale development. J. Mark. Res. 2001, 38, 269–277. [Google Scholar] [CrossRef] [Scilit]
- Zhou, M.; Peng, S. The usage of AI in teaching and students’ creativity: The mediating role of learning engagement and the moderating role of AI literacy. Behav. Sci. 2025, 15, 587. [Google Scholar] [CrossRef] [Scilit] [PubMed]
- Meade, A.W.; Craig, S.B. Identifying careless responses in survey data. Psychol. Methods 2012, 17, 437–455. [Google Scholar] [CrossRef] [Scilit] [PubMed]
- Huang, J.L.; Curran, P.G.; Keeney, J.; Poposki, E.M.; DeShon, R.P. Detecting and deterring insufficient effort responding to surveys. J. Bus. Psychol. 2012, 27, 99–114. [Google Scholar] [CrossRef] [Scilit]
- Horn, J.L. A rationale and test for the number of factors in factor analysis. Psychometrika 1965, 30, 179–185. [Google Scholar] [CrossRef] [Scilit] [PubMed]
- Hair, J.F.; Risher, J.J.; Sarstedt, M.; Ringle, C.M. When to use and how to report the results of PLS-SEM. Eur. Bus. Rev. 2019, 31, 2–24. [Google Scholar] [CrossRef] [Scilit]
- Hair, J.F.; Hult, G.T.M.; Ringle, C.M.; Sarstedt, M. A Primer on Partial Least Squares Structural Equation Modeling (PLS-SEM), 3rd ed.; Sage: Thousand Oaks, CA, USA, 2022. [Google Scholar]
- Nunnally, J.C.; Bernstein, I.H. Psychometric Theory, 3rd ed.; McGraw-Hill: New York, NY, USA, 1994. [Google Scholar]
- Fornell, C.; Larcker, D.F. Evaluating structural equation models with unobservable variables and measurement error. J. Mark. Res. 1981, 18, 39–50. [Google Scholar] [CrossRef] [Scilit]
- Henseler, J.; Ringle, C.M.; Sarstedt, M. A new criterion for assessing discriminant validity in variance-based structural equation modeling. J. Acad. Mark. Sci. 2015, 43, 115–135. [Google Scholar] [CrossRef] [Scilit]
- Cohen, J. Statistical Power Analysis for the Behavioral Sciences, 2nd ed.; Lawrence Erlbaum Associates: Hillsdale, NJ, USA, 1988. [Google Scholar]
- Kock, N.; Hadaya, P. Minimum sample size estimation in PLS-SEM: The inverse square root and gamma-exponential methods. Inf. Syst. J. 2018, 28, 227–261. [Google Scholar] [CrossRef] [Scilit]
- Ringle, C.M.; Sarstedt, M. Gain more insight from your PLS-SEM results: The importance-performance map analysis. Ind. Manag. Data Syst. 2016, 116, 1865–1886. [Google Scholar] [CrossRef] [Scilit]
- Sun, D.; Boudouaia, A.; Zhu, C.; Li, Y. Would ChatGPT-facilitated programming mode impact college students’ programming behaviors, performances, and perceptions? An empirical study. Int. J. Educ. Technol. High. Educ. 2024, 21, 14. [Google Scholar] [CrossRef] [Scilit]
- Lambovska, M.; Angelova-Stanimirova, A. Leading Tendencies in Transport Higher Education. TEM J. 2026, 15, 2589–2601. [Google Scholar] [CrossRef] [Scilit]
- European Commission. Ethical Guidelines on the Use of Artificial Intelligence (AI) and Data in Teaching and Learning for Educators; Publications Office of the European Union: Luxembourg, 2022. [Google Scholar]
- Xia, Q.; Weng, X.; Ouyang, F.; Lin, T.J.; Chiu, T.K.F. A scoping review on how generative artificial intelligence transforms assessment in higher education. Int. J. Educ. Technol. High. Educ. 2024, 21, 40. [Google Scholar] [CrossRef] [Scilit]
- UNESCO. AI Competency Framework for Students; UNESCO: Paris, France, 2024. [Google Scholar]
- UNESCO. AI Competency Framework for Teachers; UNESCO: Paris, France, 2024. [Google Scholar]
- An, Y.; Yu, J.H.; James, S. Investigating the higher education institutions’ guidelines and policies regarding the use of generative AI in teaching, learning, research, and administration. Int. J. Educ. Technol. High. Educ. 2025, 22, 10. [Google Scholar] [CrossRef] [Scilit]
- Podsakoff, P.M.; MacKenzie, S.B.; Lee, J.-Y.; Podsakoff, N.P. Common method biases in behavioral research: A critical review of the literature and recommended remedies. J. Appl. Psychol. 2003, 88, 879–903. [Google Scholar] [CrossRef] [Scilit] [PubMed]

Disclaimer/Publisher’s Note: The statements, opinions and data contained in all publications are solely those of the individual author(s) and contributor(s) and not of MDPI and/or the editor(s). MDPI and/or the editor(s) disclaim responsibility for any injury to people or property resulting from any ideas, methods, instructions or products referred to in the content. |
© 2026 by the authors. Licensee MDPI, Basel, Switzerland. This article is an open access article distributed under the terms and conditions of the Creative Commons Attribution (CC BY) license.