


Highlights
Please indicate how your work links to systems science via your contributions to systems practice, theory, and/or methodology.
- Develops a deployment-conditioned performance envelope that links predictive claims to population, information, operational context, and validation boundaries.
- Integrates this evidence boundary with a human-authorized decision boundary that separates prediction, explanation, feasibility, and action.
What are the main findings and/or the implications of the main findings?
- The full-history weighted F1 was 0.9261 chronologically and 0.913 under LOVO; performance decreased when local historical information was restricted.
- 68.4% of the evaluated red cases were scenario sensitive, supporting the feasibility of bounded human–AI decision support without implying causal service improvement.
Abstract
Predictive performance in operational AI depends on deployment conditions, whereas model explanations alone do not determine feasible actions. This study developed and evaluated a scope-aware and explainable AI decision-support system for municipal waste collection dispatch in Yonghe District, Taiwan. A retrospective evaluation included 11,934 vehicle-day observations from 17 vehicles, and a six-month prospective deployment recorded 1989 vehicle-days. Ten classifiers were benchmarked using development-period data only. The selected XGBoost model achieved full-history weighted F1 values of 0.9261 in established-unit chronological evaluation and 0.913 under leave-one-vehicle-out (LOVO) validation; reduced-history values were 0.893 and 0.861, respectively. Class-specific diagnostics showed a red-state recall of 0.9358 chronologically and 0.9144 in pooled LOVO predictions. Under the same LOVO design, GBDT, LightGBM, and Random Forest achieved weighted F1 values of 0.901, 0.896, and 0.887, respectively. During prospective use, 143 of 209 evaluated red cases (68.4%) were scenario sensitive, and 94.6% of scenario evaluations were completed within the 30–60-min decision window. Because supervisors could act after viewing model outputs, prospective records were interpreted as workflow evidence rather than independent predictive validation. The performance envelope links each performance claim to the evaluated population, information availability, operational context, and validation boundary, while operational feasibility and human authorization govern how predictions inform dispatch decisions.
1. Introduction
Artificial intelligence (AI) and data-driven analytics are increasingly embedded in smart-city systems to support monitoring, prediction, coordination, and urban resource allocation. Municipal waste management is an important application domain because collection services must be delivered repeatedly under time constraints, while accommodating variations in workload, weather, asset availability, and operating conditions. Recent studies have applied AI, machine learning, Internet of Things technologies, and data-driven architectures to waste forecasting, bin monitoring, collection planning, routing, and broader municipal waste management [1,2,3,4]. These developments reflect a broader transition from isolated digital applications to integrated, data-supported urban service systems.
Existing smart-waste research has substantially advanced collection planning and logistics. Machine-learning-supported location-routing approaches have been developed to improve municipal collection efficiency [5], while sensor-enabled and digital twin-based decision-support systems have been applied to collection planning and execution [6]. The present study addresses a different operational problem that arises immediately before dispatch: whether a scheduled vehicle-day operation is likely to remain within its required departure window given the information available before service begins.
This pre-dispatch problem differs from the route optimization problem. The immediate question is not which route a vehicle should follow but whether a scheduled operation warrants additional supervisory attention before departure. The decision must be made within a limited operational window, whereas feasible responses may be constrained by vehicle availability, qualified personnel, staffing requirements, safety conditions, route familiarity, and competing service obligations. Therefore, predictive accuracy alone is insufficient to establish the operational usefulness of an AI-enabled dispatch system.
A second challenge concerns the relationship between predictive validation and the deployment conditions to which a reported performance estimate is subsequently applied. Predictive performance is conditional on the evaluation design, population, time period, information structure, preprocessing regime, and outcome definition under which it was estimated. Later-period performance for physical units already represented during model development supports a different claim from the performance for a previously unrepresented unit. Likewise, a model evaluated when locally accumulated vehicle-health and personnel-related histories are available represents a different information environment from one deployed without those histories.
This issue is related to but distinct from dataset shift, domain shift, external validation, and transportability. Dataset- and domain-shift research concerns changes between source and target data-generating environments, whereas external validation assesses model performance in an independent population or setting. Transportability addresses whether effects or relationships can be transferred across populations under specified assumptions. The concern examined here is more fundamental to evidence use: whether the empirical evidence generated by a particular validation design supports the deployment claim being made.
We refer to a failure of this correspondence as deployment-scope mismatch. Deployment-scope mismatch is not proposed as a new statistical form of distribution shift. Rather, it is an evidence–claim mismatch that occurs when a predictive-performance estimate is interpreted beyond the population, information environment, operational context, or validation boundary represented by the evaluation that generated it. This distinction is particularly relevant to smart-city systems because deployment commonly expands incrementally across physical assets, time periods, organizational units, information infrastructures, and institutional settings.
A third challenge arises when predictive evidence is translated into operational action. Explainable AI can identify variables contributing to a model prediction, but predictive attribution does not establish operational controllability. A predictor may strongly influence a model output while remaining impossible to modify within the relevant decision window. Conversely, a mathematically favorable alternative may be operationally inadmissible because of qualification, staffing, safety, resource, or service constraints. Therefore, explanation, operational feasibility, model-based scenario sensitivity, and decision authority should be treated as analytically distinct components of operational AI decision support.
These challenges reveal a broader gap at the intersection of predictive validation and operational decision-making. Existing research provides methods for temporal validation, group-based holdout, external validation, dataset shift analysis, explainable AI, counterfactual reasoning and human–AI interaction. However, these methods typically address different stages of the deployment problem. What remains insufficiently specified is how predictive evidence generated under different deployment conditions should be bounded and how that evidence should enter an operational process in which explanation, feasibility, scenario evaluation, and human authority remain distinct.
This study addresses this gap through a scope-aware and explainable AI decision-support framework for municipal waste collection dispatch. At the system level, we evaluate the predictive performance under explicitly differentiated physical-unit and information-availability conditions and organize it within a deployment-conditioned performance envelope. At the case level, predicted states enter a supervisory workflow in which model explanation, operational feasibility assessment, scenario re-scoring, and final human authorization are deliberately separated. The framework establishes two complementary boundaries: an evidence boundary, which constrains what performance claims are supported, and a decision boundary, which constrains how model outputs may be translated into operational responses.
The empirical analysis used 11,934 retrospective vehicle-day observations from 17 physical collection vehicles in Yonghe District, New Taipei City, Taiwan, followed by 1989 vehicle-day records from a six-month prospective deployment. During development, ten candidate classifiers were compared using time-blocked cross-validation. The selected XGBoost model was subsequently evaluated under established-unit chronological and chronologically constrained leave-one-vehicle-out (LOVO) designs with both full-history and reduced-history information specifications. The aggregate performance was complemented by class-specific precision, recall, F1, macro-F1, balanced accuracy, and confusion-matrix analysis so that the performance in the operationally highest-priority red state was not obscured by the system-level weighted F1. Principal tree-based ensemble models were additionally evaluated under the same LOVO boundary to examine whether the cross-vehicle predictive structure was specific to XGBoost. The prospective phase documented how the fixed decision-support system entered municipal operations. Because supervisors could act after observing model outputs, these records were interpreted as workflow evidence rather than as an uncontaminated predictive-validation sample. Against this background, this study addresses the following three research questions:
- RQ1: How does predictive performance vary across physical-unit and information-availability boundaries, including class-specific performance, and is cross-vehicle predictive performance robust across leading ensemble classifiers?
- RQ2: How can predictive performance estimates be explicitly linked to deployment conditions represented by their underlying validation evidence?
- RQ3: How can deployment-conditioned predictive evidence enter a bounded socio-technical decision process that distinguishes model explanation, operational feasibility, scenario sensitivity and human decision authority?
This study makes three contributions. First, it conceptualizes deployment-scope mismatch as an evidence–claim mismatch and evaluates predictive performance across physical-unit and information-availability boundaries. Second, it introduces a deployment-conditioned performance envelope that links each performance claim to the population, information set, operational context, and validation boundary represented by its supporting evidence. Third, it couples this evidence boundary with a human-authorized decision boundary in which model explanations support diagnosis, only supervisor-confirmed feasible alternatives proceed to scenario re-scoring, and the final operational authority remains with the responsible supervisor. The contribution is therefore not a new classifier or explanation algorithm. Rather, it is a systems framework for keeping predictive evidence, operational feasibility, and human decision authority aligned during deployment.
The remainder of this paper reviews the relevant literature and research gap, develops the scope-aware conceptual framework, describes the municipal setting and analytical methods, presents predictive and prospective deployment results, and discusses theoretical implications, practical implications, limitations, and system lifecycle requirements.
2. Related Work and Research Gap
Research relevant to AI-enabled municipal waste-collection decision support spans several literature streams that address different stages of deployment. Smart waste research has emphasized forecasting, sensing, routing, collection planning, and operational optimization. Predictive model research has developed temporal and group-aware validation strategies, whereas dataset shift and external validation research have examined transfer across changing populations and environments. Another stream of literature addresses model explanation, actionability, and human–AI decision-making. These streams provide complementary foundations but do not specify how predictive evidence should be bounded when deployment conditions change or how such evidence should enter a constrained operational decision process.
2.1. AI and Decision Support in Smart Waste-Collection Systems
AI-enabled waste management research has applied machine learning, sensing technologies, and data-driven architectures to forecasting, monitoring, collection planning, routing, and resource allocation [1,2,3,4]. Location-routing models primarily seek to improve collection efficiency through route, distance, vehicle, or resource optimization [5,7], whereas sensor-enabled and digital-twin systems integrate real-time operational information with planning and decision support [6].
The present study addresses a different operational stage. The route and service schedule have already been established, and the immediate question is whether a scheduled vehicle-day operation exhibits sufficient pre-dispatch risk to warrant additional supervisory attention. Therefore, the problem is one of risk triage under an existing service plan, rather than route optimization.
This distinction changes both the evidentiary and operational requirements. Route-optimization studies are commonly evaluated using distance, cost, service coverage, or resource-utilization objectives. In contrast, pre-dispatch predictive triage requires evidence that is aligned with the population and information environment in which the model will operate. It must also account for operational restrictions on any subsequent response, including vehicle availability, driver qualification, staffing, safety, route familiarity, and service obligations.
Therefore, the research gap is not an absence of AI techniques for municipal waste management. It concerns how to interpret predictive evidence when an AI-supported dispatch model is used under deployment conditions that differ from those represented during development, and how a flagged case should enter an operationally feasible, human-authorized decision process.
2.2. Predictive Validation, Dataset Shift, and Deployment Transfer
The predictive performance is conditional on the population, time period, information environment, preprocessing regime, and validation structure under which it is estimated. Later-period predictions for established operational units, predictions for units excluded from the model development, and predictions made when locally accumulated histories are unavailable represent different deployment conditions.
This distinction is particularly important for structured operational data. When observations exhibit temporal, spatial, hierarchical, or group dependence, conventional random cross-validation can produce optimistic estimates because related observations may occur in both development and validation partitions [8]. Therefore, validation should reflect the intended deployment question. Chronological evaluation addresses later-period prediction among units already represented during development, whereas group- or unit-based holdout procedures assess performance for an operational unit excluded from model development.
These procedures answer different questions and should not be treated as interchangeable forms of out-of-sample validation. External validation imposes a broader boundary by evaluating a completed model in an independent population, site, or institutional setting [9]. Accordingly, an out-of-sample performance value is meaningful only when the separation between the development and evaluation data is explicit.
Dataset-shift research provides a related but distinct perspective. Covariate shift, prior-probability shift, and concept-related changes describe differences in the distributions linking predictors and outcomes between source and target environments [10]. Domain-shift research similarly examines predictive behavior across source and target settings. These concepts characterize changes in data-generating environments; however, they do not, by themselves, determine whether a particular reported performance estimate supports a specific deployment claim.
Therefore, the present study distinguishes deployment-scope mismatch from dataset or domain shift. Deployment-scope mismatch is an evidence–claim mismatch that occurs when a performance estimate is extended to a population, information structure, operational context, or validation boundary not represented by the evaluation that produced it. An estimate may remain valid for its evaluated condition, while being insufficient evidence for a broader deployment claim.
This distinction also separates the proposed framework from the causal transportability. Transportability addresses whether causal effects identified in one population can be transferred to another population under specified assumptions regarding structural similarities and differences [11]. This study did not estimate or transport the causal intervention effects. Its concern is narrower: whether the predictive performance evidence corresponds to the operational conditions for which the model is used.
A further implication is that deployment evaluation should not rely exclusively on a single aggregate metric or classifier. Where outcome classes have unequal operational consequences, class-specific diagnostics are needed to determine whether aggregate discrimination conceals poor performance in a high-priority state. Similarly, cross-model comparison helps determine whether the observed predictive structure is specific to one algorithmic implementation. These considerations motivate the combination of scope-specific validation, class-level performance assessment, and cross-model robustness evaluation used in this study.
2.3. Explainable, Actionable, and Human-Authorized AI Decision Support
A third literature stream concerns how model outputs enter operational decision-making. Explainable AI methods, such as SHAP, decompose predictions into feature-level contributions and can improve the interpretability of complex predictive models [12]. Explainability is particularly relevant in public-sector applications, where AI-supported outputs may affect organizational processes, resource allocation, accountability, and the perceived legitimacy of automated systems [13,14,15,16,17,18].
However, explanation is not equivalent to actionability. A feature may contribute strongly to a prediction while remaining impossible to modify within the relevant operational window. Conversely, a mathematically advantageous feature change may not correspond to a feasible organizational action. Research on actionable explanations and counterfactual decision support therefore emphasizes the distinction between identifying predictive contributors and identifying feasible changes [19,20].
This distinction is particularly important in municipal operations. Operational alternatives may be constrained by personnel qualifications, working hour requirements, staffing availability, route familiarity, vehicle compatibility, maintenance status, safety rules, competing service obligations, and managerial authority. Therefore, a counterfactual configuration that is mathematically available to a predictive model may be institutionally inadmissible.
Human involvement introduces an additional consideration. Research on human–AI interaction in public organizations has documented automation bias, selective adherence, and other patterns in how decision-makers respond to algorithmic advice [21]. Related evidence indicates that meaningful human participation requires more than nominal approval of model outputs [22]. The operational roles of the model and supervisor should therefore remain distinguishable.
Taken together, this literature implies at least four analytically distinct stages: prediction, explanation, feasibility assessment, and decision authority. In the present study, scenario re-scoring is inserted between feasibility assessment and final authorization. Supervisors first determine whether an alternative configuration is operationally admissible; only then is the unchanged predictive model used to evaluate the represented alternative. A change in the mapped supervisory state is interpreted as model-based scenario sensitivity, not as evidence that implementing the alternative would causally improve punctuality.
2.4. Synthesis and Research Gap
The preceding literature provides complementary foundations for smart waste planning [1,2,3,4,5,6,7], predictive validation [8,9], dataset shift [10], model documentation and auditing [23,24,25], explainable and actionable AI [12,19,20], and human–AI decision support [13,21,22]. However, three gaps remain when these perspectives are jointly considered in recurrent municipal operations.
First, an evidence–alignment gap arises when a predictive performance estimate is interpreted beyond the deployment condition represented by its validation evidence. Temporal validation, physical unit holdout, and external validation support different claims, and aggregate performance alone does not establish correspondence with the intended population, information environment, operational context, or validation boundary. Second, an information availability gap arises when locally accumulated histories available during model development are unavailable at deployment. This represents a distinct boundary from temporal transfer or physical unit holdout.
Third, a prediction-to-decision gap arises because predictive relevance does not establish operational controllability. Feature attribution may identify contributors to a predicted state, but it does not determine whether an alternative action is feasible, authorized, or effective. Operational decision support, therefore, requires prediction, explanation, feasibility assessment, scenario sensitivity, and human authority to remain analytically distinct.
The present study addresses these gaps using two coupled boundaries. A system-level evidence boundary is represented by a deployment-conditioned performance envelope that links each performance claim to its evaluated population, information availability, operational context, and validation design. A case-level decision boundary ensures that explanations support diagnosis, only supervisor-confirmed feasible alternatives proceed to scenario re-scoring, and the final authority remains with the responsible supervisor. Therefore, the contribution is not a new classifier or explanation algorithm but the integration of scope-aware predictive evidence with feasibility-bounded and human-authorized decision support. Table 1 positions this framework relative to the adjacent literature streams.
Table 1.
Positioning of the proposed framework relative to related validation and decision-support approaches.
3. Conceptual Framework for Scope-Aware AI Decision Support
The conceptual framework addresses two distinct but interdependent problems that arise when predictive AI is embedded in recurrent operational services: The first is an evidence–scope problem: Under which deployment conditions does an available predictive-performance result provide empirical support for system use? The second is a decision-scope problem: how should an individual model output enter an operational process when prediction, explanation, feasibility assessment, scenario evaluation, and final decision authority represent different functions.
The framework separates system-level evidence alignment from case-level decision support. At the system level, predictive evidence is interpreted relative to the population, information environment, operational context, and validation boundary represented by the evaluation design. At the case level, individual predictions enter a bounded workflow in which explanation, operational feasibility, scenario re-scoring, and human authorization remain analytically distinct.
This separation establishes two complementary safeguards. The evidence boundary constrains the scope of predictive-performance claims, whereas the decision boundary constrains how model outputs may influence operational actions. A model may perform well under one evaluated condition, without the result supporting all subsequent deployment settings. Similarly, an explanation of a high-risk prediction does not by itself determine whether any operational response is feasible, appropriate, or authorized.
3.1. Deployment-Scope Mismatch as an Evidence–Claim Problem
The predictive performance claims depend on the conditions under which they are generated. The performance of established physical units evaluated later, the performance of a physical unit excluded from model development, and the performance when locally accumulated operational histories are unavailable address different deployment questions, even when they share the same prediction target and modeling architecture.
This study defines deployment-scope mismatch as a lack of correspondence between the deployment claim being made and the operational conditions represented by the empirical evidence supporting that claim. Therefore, deployment-scope mismatch is an evidence–claim problem rather than a new statistical category of dataset or domain shift.
This distinction is important. Dataset and domain shifts characterize changes in data-generating distributions, external validation assesses performance in an independent population or setting, and causal transportability concerns whether the intervention effects can be transferred across populations. Scope-aware validation asks whether an evaluation directly supports a particular predictive performance claim under the intended deployment conditions.
A target population may differ statistically from the development population while still being directly represented by an appropriate validation design. Conversely, a performance estimate may be internally correct but unsupported when extended to a physical unit, information environment, institutional setting, or operational context that the evaluation did not represent. Therefore, scope-aware validation complements, rather than replaces, dataset shift analysis, external validation, and transportability by maintaining an explicit correspondence between the evaluated evidence and its intended predictive use.
3.2. Performance Envelope and Reproducible Scope-Correspondence Rule
To operationalize the evidence boundary, the study organizes predictive evidence within a deployment-conditioned performance envelope. Each validated benchmark Ej is represented as
where Pj denotes the operational population represented by benchmark j; Ij denotes the information set available to the model; Oj denotes the material operational and institutional context; Bj denotes the validation boundary explicitly represented by the evaluation design; Mj denotes the resulting performance summary; and Uj denotes any accompanying descriptive dispersion or uncertainty information, where available.
Ej = (Pj, Ij, Oj, Bj, Mj, Uj)
Importantly, Mj need not be a single scalar metric. It may contain the primary weighted F1, along with class-specific precision, recall, and F1, macro-F1, balanced accuracy, and confusion-matrix diagnostics when available. This distinction prevents a single aggregate performance measure from being treated as a complete characterization of predictive behavior.
The performance envelope is the set of validated benchmarks,
= {E1, E2, …, EJ}
In this study, the empirical envelope contains four deployment-conditioned benchmarks: full-history chronological evaluation, full-history leave-one-vehicle-out (LOVO) validation, reduced-history chronological evaluation, and reduced-history LOVO validation. Together, these benchmarks examine physical-unit representation and historical-information availability while holding the broader municipal environment constant. For a proposed target deployment condition D* = (P*, I*, O*, B*), scope correspondence is assessed across four dimensions:
- Population correspondence: whether the target physical units fall within the established or held-out-unit population boundary represented by the benchmark.
- Information correspondence: whether predictor definitions, historical information availability, preprocessing rules, and temporal availability of inputs correspond to the evaluated specification.
- Operational context correspondence: whether the outcome definition, service schedule, decision window, data infrastructure, feasibility requirements, staffing environment, and supervisory authority remain materially consistent with the evaluated context.
- Validation boundary correspondence: whether the evaluation design explicitly represents the proposed deployment change, such as later-period use for established vehicles, use for a held-out physical vehicle, or operation with restricted historical information.
Correspondence is assessed based on documented deployment and validation conditions, rather than the similarity in observed performance values. For example, the full-history specification requires the six defined predictors and their associated temporal construction rules, whereas the reduced-history specification requires the four retained predictors under the same pre-dispatch information constraints. Operational correspondence also requires consistency with the evaluated departure-punctuality definition, 30–60-min decision window, service procedures, feasibility rules, and supervisory decision structure. Material discrepancies or insufficient documentation are treated as non-correspondence, rather than presumed equivalence.
For benchmark j and correspondence dimension d, define
where d ∈ {P, I, O, B}.
A target deployment is inside the validated envelope when at least one benchmark jointly represents all four material dimensions.
A target deployment is conditionally represented when every required dimension is represented somewhere in the available evidence, but no single benchmark jointly represents the complete target condition.
The conditional representation does not justify the combination of performance estimates from different benchmarks as though they jointly validated the target condition. Instead, it identifies a partially supported deployment that requires additional validation before a numerical performance claim can be made. A target deployment is outside the validated envelope when at least one material dimension is not represented by any available benchmark.
These three states have different evidentiary implications. An inside-envelope deployment is jointly represented by an existing benchmark, and its performance can be interpreted within that scope. Conditionally represented deployment has partial evidence but lacks a benchmark to validate the combined condition. An outside-envelope deployment lacks empirical support for at least one material dimension and therefore requires new validation before existing numerical performance claims can be extended to it.
In this study, full-history chronological evaluation represents later-period prediction for established physical vehicles; full-history LOVO represents later-period prediction for a physical vehicle excluded from development but operating within the same municipal system; reduced-history chronological evaluation represents later-period use for established vehicles without the two locally accumulated historical predictors; and reduced-history LOVO jointly represents physical vehicle exclusion and restricted historical information. Deployment in another municipality remains outside the validated envelope because no cross-municipality evaluation was conducted, even if the selected operating characteristics appear to be similar.
Therefore, the performance envelope is a framework for performance-scope accountability, not a method for extrapolating performance to untested settings. It does not estimate how well the model will perform outside the evaluated conditions or establish statistical equivalence between deployments. Rather, it requires every numerical performance claim to remain linked to the population, information set, operational context, and validation boundary that generated the supporting evidence.
This distinction also separates the analytic generalization of the architecture from the predictive generalization of the fitted model. Recurrent operational services that share scheduled decision windows, repeated physical units, pre-decision information, recorded outcomes, feasible resource adjustments, and substantive human authority may adopt a similar decision-support architecture. However, the numerical performance of a fitted model requires validation appropriate to the target deployment condition.
3.3. Explainable and Feasibility-Bounded Decision Support
System-level evidence does not prescribe case-level actions. The decision-support layer therefore separates predictive attribution, operational feasibility, and model-based scenario sensitivity.
SHAP provides diagnostic information on how predictors contribute to or detract from a fitted model output [12]. Such attribution can help explain why a vehicle day receives a particular predicted state, but it does not establish causal importance, independent variable importance, or operational controllability. This distinction is particularly relevant when predictors are correlated; attribution may be redistributed across related variables without implying that their underlying operational construct is irrelevant.
Consequently, the framework distinguishes justificatory explainability from intervention-oriented explainability. Justificatory explainability supports the interpretation of why the fitted model generated a particular output. Intervention-oriented explainability requires an additional step: a potentially adjustable contributor must correspond to an alternative that is actually admissible within the organizational decision environment.
In the present application, workload history, forecast rainfall, and holiday status may contribute to the predicted risk but cannot be altered within the immediate pre-dispatch decision window. The vehicle and driver configurations are only conditionally adjustable. Their modification depends on resource availability, qualification, working hour constraints, route familiarity, maintenance and safety status, staffing requirements, and competing service obligations.
Operational feasibility is therefore assessed before scenario re-scoring. For vehicle-day (i,t), let 𝒜it denote the set of supervisor-confirmed operationally admissible alternatives. Only configurations belonging to 𝒜it are eligible for model-based scenario evaluation. The set 𝒜it is operationally generated rather than algorithmically exhaustive. The system does not search the unrestricted predictor space or enumerate every mathematically possible driver–vehicle combination. Instead, supervisors identify alternatives that can actually be implemented under contemporaneous operational constraints. In the studied workflow, these alternatives could include driver reassignment, vehicle substitution, or a combined driver–vehicle configuration when both changes were simultaneously admissible.
The unchanged predictive model then re-scores only the feasible alternatives. For an original red case, a case is classified as scenario sensitive when at least one represented alternative changes the mapped supervisory state from red to yellow, or green. A case is scenario-unresolved when all the represented alternatives retain the red state.
These labels describe the behavior of the fitted model within the represented feasible decision space. They do not estimate the causal effect of an intervention, the probability that an operational change will prevent a delay, the optimality of the evaluated alternative, or the proportion of all theoretically feasible configurations that would reduce predicted risk.
3.4. Human-Authorized Socio-Technical Decision Architecture
The case-level workflow is human-in-the-loop by design. Green, yellow, and red signals allocate supervisory attention but do not prescribe operational actions. Prediction, explanation, feasibility screening, and scenario re-scoring provide decision support only. The responsible supervisor determines whether the predicted risk is operationally meaningful, whether an admissible alternative exists, and whether the alternative should be implemented, modified, or rejected. This separation is necessary because the model cannot fully represent contemporaneous operational conditions, such as staffing changes, temporary vehicle availability, route-specific circumstances, competing service obligations, and safety concerns.
Operational logging records supervisory signals, explanation access, scenario evaluations, feasible alternatives, authorized responses, and unresolved cases. These records support traceability but do not constitute autonomous action execution, continuous online learning or uncontaminated post-deployment predictive validation.
The resulting architecture combines an evidence boundary with a human-in-the-loop decision boundary. The evidence boundary limits the deployment conditions under which predictive-performance claims are supported, whereas the decision boundary preserves supervisory responsibility for operational actions. Figure 1 summarizes these two complementary levels.
Figure 1.
Two-level framework linking deployment-conditioned predictive evidence with human-authorized operational decision support.
4. Research Setting and System Operationalization
4.1. Case Setting, Selection Rationale, and Municipal Collection Context
The empirical setting was a municipal waste collection operation in the Yonghe District, New Taipei City, Taiwan. During the study period, 17 physical collection vehicles provided recurrently scheduled afternoon and evening services under a common municipal management structure. Vehicle and driver assignments were finalized shortly before departure, typically within a 30–60-min pre-dispatch decision window.
Yonghe was selected as an information-rich operational case, rather than as a statistically representative municipality. The setting combined the characteristics required to examine scope-aware AI decision support: recurrent vehicle-level operations, scheduled service windows, repeated observations from a stable physical fleet, pre-dispatch workload and weather information, digitally recorded dispatch and GPS outcomes, vehicle-maintenance histories, personnel-related operational records, and limited opportunities for vehicle or driver reconfiguration before service commencement. These characteristics permitted physical-unit and information-availability boundaries to be examined while the broader municipal operating environment remained comparatively stable.
The institutional context also makes the timing of services operationally consequential. New Taipei City operates a “garbage does not touch the ground” collection system, under which residents retain household waste until the collection vehicle arrives and transfer it directly to sanitation personnel rather than leaving it on the curbside [26]. The municipal collection information system also provides residents with route, collection point, scheduled time, and real-time vehicle location information [27]. Yonghe is a densely populated urban residential district in the Taipei metropolitan area [28]. Together, these characteristics create a recurrent and time-sensitive public service environment in which deviations from scheduled operations can affect both internal coordination and resident-facing services.
The predictive target in this study was depot departure punctuality, not route optimization, downstream route travel time, or arrival punctuality at individual collection points. On-time departure preserves the planned service margin but does not guarantee punctuality for the subsequent routes. Consequently, the empirical claims of this study concern only pre-dispatch operational readiness and departure performance.
The findings are specific to the evaluated Yonghe environment. This case does not establish predictive transferability to another district, municipality, institutional system, or national context. Therefore, the broader relevance is limited to the analytic generalization of the decision-support architecture to recurrent service systems with comparable structural characteristics; numerical predictive-performance claims remain bounded by the performance envelope defined in Section 3.
4.2. Prediction Target and Supervisory Triage Logic
The predictive task focused on pre-dispatch departure punctuality risk rather than route travel time, route optimization, collection distance, or waste volume optimization. For each physical vehicle and operating day, the scheduled afternoon and evening service periods were evaluated separately using the prespecified punctuality definition described in Section 5.1. The two service-period outcomes were then combined into four mutually exclusive vehicle-day states: (1) both services within the punctuality tolerance; (2) afternoon-localized non-punctuality; (3) evening-localized non-punctuality; and (4) non-punctuality across both service periods.
These four states constitute the statistical multiclass outcomes used for model development and evaluation. For continuity with the municipal operational terminology used throughout the study, the latter three classes are referred to as afternoon-localized delay, evening-localized delay, and delays across both service periods. As clarified in Section 5.1, “delay” is used as an operational shorthand for departure outside the predefined ±5-min punctuality tolerance and does not, by itself, distinguish early from late departure.
For operational deployment, the four predicted vehicle-day states were translated into three supervisory signals. Let denote the predicted state for physical vehicle i on operating day t, and let Sit denote the corresponding supervisory signal. The predefined mapping was g(1) = Green, g(2) = g(3) = Yellow, and g(4) = Red, such that .
A green signal indicated that both scheduled service periods would remain within the defined punctuality criterion and, therefore, supported routine monitoring. A yellow signal indicated predicted non-punctuality localized to either the afternoon or evening service period and prompted a service-period-specific situational review. A red signal indicated predicted non-punctuality across both periods and received the highest priority for diagnostic review and feasible scenario assessment.
The statistical outcome class, supervisory signal, and final operational response were deliberately treated as separate analytical and managerial levels. Supervisory signals allocated attention intensity rather than prescribed predetermined actions. Therefore, a red signal did not automatically require driver reassignment, vehicle substitution, or another operational intervention; similarly, a green signal did not guarantee punctual realized departure. Any subsequent response remained conditional on explanation, contemporaneous feasibility, contextual information, and explicit supervisory authorization. Table 2 distinguishes the four statistical outcome states from the three supervisory signals.
Table 2.
Mapping of vehicle-day punctuality states to supervisory triage signals.
4.3. Operationalization of the Decision-Support Workflow
The system was implemented as a bounded supervisory decision-support process rather than an autonomous dispatch mechanism. For each vehicle day, the fixed predictive model first generated one of the four departure punctuality states using only information available before departure. The predicted state was then mapped to the green, yellow, or red supervisory signal defined in Section 4.2, thereby determining the initial level of supervisory attention.
Green cases generally remained under routine monitoring. Yellow and red cases were eligible for additional reviews, with red cases receiving the highest priority. For non-green cases, supervisors could access case-level SHAP explanations showing how the observed predictors contributed toward or away from the fitted red-state output. The explanation layer was intended to support diagnosis rather than prescribe intervention. This distinction was operationally important because predictive attribution and immediate controllability were not equivalent. Previous workload conditions, forecast rainfall, and calendar status could contribute to the model output but could not be changed within the current pre-dispatch decision window. Vehicle and driver configurations were potentially adjustable only when corresponding alternatives were operationally admissible.
When a potentially adjustable condition was relevant to a flagged case, the responsible supervisor assessed whether an admissible alternative existed under the feasibility criteria specified in Section 4.4. Candidate configurations failing resource, qualification, staffing, safety, service, or availability requirements were excluded before the model-based scenario evaluation. A supervisor-confirmed admissible configuration was then submitted to the unchanged predictive model for scenario re-scoring. The resulting prediction was compared with that of the original configuration at the supervisory signal level. A change in the mapped state represents model-based scenario sensitivity. It did not establish that implementing the alternative would causally improve the realized departure punctuality.
The final operational response remained under supervisory authority. The system could not autonomously reassign personnel, substitute vehicles, alter service schedules, or execute other operational actions. Supervisors retained responsibility for determining whether the flagged risk was operationally meaningful, whether an admissible alternative existed, and whether an evaluated alternative should be implemented, modified, or rejected.
Operational logging documented the supervisory signal, explanation access, represented alternatives submitted for scenario evaluation, scenario re-scoring results, supervisor-authorized responses, and unresolved cases. The logs supported traceability and subsequent offline review. They do not imply exhaustive enumeration of every feasible configuration, autonomous action execution, or continuous online model adaptation. Figure 2 summarizes the proposed workflow.
Figure 2.
Human-in-the-loop workflow for pre-dispatch prediction, explanation, feasibility assessment, scenario re-scoring and supervisor authorization.
4.4. Operational Feasibility and Human Authorization
Operational feasibility was determined before scenario re-scoring, independent of whether the predictive model was expected to assign a lower-risk state to an alternative configuration. For vehicle-day (i,t), let
denote the set of supervisor-confirmed operationally admissible alternatives. Only a ∈ 𝒜it was eligible for subsequent model-based scenario re-scoring.
𝒜it = {a:a satisfies all applicable operational eligibility conditions for vehicle − day (i,t)}
The workflow encompassed two primary forms of operational adjustment: driver reassignment and vehicle substitution. When both adjustments were permissible, an integrated driver–vehicle configuration could be assessed. A driver candidate was deemed admissible only upon confirmation by the responsible supervisor that the individual met the following criteria: availability within the pre-dispatch decision window, qualification for the required collection duty, compliance with applicable working-hour and staffing requirements, sufficient familiarity with the scheduled route, absence of any identified safety restrictions preventing reassignment, and lack of simultaneous obligations for incompatible services. Failure to satisfy any applicable requirement excluded the candidate from 𝒜it.
Vehicle substitution was subjected to an analogous feasibility assessment. A candidate replacement vehicle was admissible only when it was available within the decision window, operationally suitable for the scheduled service, free from active maintenance or safety restrictions, compatible with the applicable service requirements, and capable of being reassigned without preventing another required vehicle assignment from being fulfilled. When both an admissible driver and an admissible replacement vehicle are available, the corresponding combined configuration can also be represented.
The supervisor determined operational feasibility using contemporaneous operational information. The supervisor did not infer feasibility from SHAP values, driver-related operational-risk scores, vehicle-health levels, or predicted risk reduction. Therefore, the predictive model had no role in deciding whether an alternative was admissible.
Only alternatives in 𝒜it proceeded to scenario re-scoring. The system did not search the unrestricted predictor space for configurations that minimized predicted risk or generate hypothetical combinations that could not be implemented within actual municipal operations. The scenario space was therefore operationally bounded rather than mathematically exhaustive.
This distinction is essential for interpreting Supplementary Table S5. The workflow identifies the types of reconfiguration that can be represented: driver reassignment, vehicle substitution, and combined reconfiguration; however, the retained operational records do not exhaustively enumerate every admissible driver–vehicle combination potentially available for each vehicle-day. Accordingly, scenario evaluation concerns the represented supervisor-confirmed feasible decision space rather than a complete combinatorial optimization problem.
Predictive signals, SHAP explanations, and scenario re-scoring informed supervisory reviews but did not prescribe or execute operational changes. Human authorization remained a substantive decision function. Supervisors retained authority to determine whether a flagged case warranted intervention, whether an admissible alternative existed, and whether to implement, modify, or reject an evaluated alternative after considering current staffing, vehicle availability, service obligations, route circumstances, and safety.
4.5. Prospective Deployment and Operational Logging
Following retrospective model development and scope-specific evaluation, the completed decision support system was prospectively deployed from January to June 2025. The predictor definitions, preprocessing procedures, fitted-model specifications, supervisory-state mapping, feasibility logic, and decision-support workflow were fixed before deployment. Prospective observations were not used for retraining, recalibration, adaptive updating, or retrospective modifications of the analytical procedure.
The prospective phase evaluated operational integration and workflow use, rather than uncontaminated predictive discrimination. After receiving a supervisory signal, supervisors could review explanations, assess admissible alternatives, perform scenario re-scoring, and authorize an operational response before the realized departure occurred. Consequently, the observed outcome could reflect both the original pre-dispatch conditions and subsequent supervisory actions.
Therefore, the January–June 2025 observations were not treated as an external predictive test set. Operational logs recorded supervisory signals, explanation access, scenario re-scoring, completion within the 30–60-min decision window, authorized responses, action types, and unresolved cases. These records provide evidence of workflow utilization, timing compatibility, and preserved human decision authority, but not an uncontaminated estimate of prospective predictive performance.
The logs were interpreted accordingly. Explanation access does not establish comprehension or trust, scenario sensitivity does not establish intervention effectiveness, and an authorized response does not demonstrate that AI output alone caused the decision or improved the realized outcomes. Changes in punctuality, complaints, or other service indicators were therefore treated descriptively and were not causally attributed to the AI-supported workflow.
4.6. Authorized Use, Data Governance, and Boundary of Generalization
The deployed system operated within predefined boundaries governing data use, operational purposes, decision authority, and model maintenance. Its authorized purpose was restricted to short-term pre-dispatch risk assessment and operational resource coordination purposes.
The driver-related operational risk indicator was used only as an input to the vehicle-day prediction model for this purpose. Its predictive contribution does not justify personnel appraisal, promotion, disciplinary action, investigation, punishment, long-term employee ranking, or other personnel management uses. Any materially different use would require separate ethical, organizational and empirical justification.
Vehicle and driver identifiers were coded before analysis, and the analytical dataset contained no direct personal identifiers. Access to personnel-related operational information was restricted to authorized personnel and project members under the applicable municipal data-use arrangement. The model did not independently initiate personnel reassignment, vehicle substitution, or any other operational response. The implementation of an evaluated alternative required explicit authorization from the responsible municipal supervisor.
Operational logging supported traceability and periodic offline reviews rather than continuous automated learning. The deployed model was not retrained or adaptively updated during the prospective period.
Material changes in fleet composition, predictor availability, predictor definitions, service standards, staffing arrangements, outcome definitions, feasibility rules, or institutional context require reassessment of whether the existing validation evidence still corresponds to the intended deployment conditions. Any recalibrated or revised analytical specifications require appropriate validation before replacing the deployed model.
Therefore, the generalizability of the study should be distinguished at two levels. At the architectural level, the framework may be applicable to other recurrent service environments characterized by scheduled operating windows, repeated physical units, pre-decision information, recorded outcomes, feasible resource adjustments, and substantive human supervisory authority. This represents the analytic generalization of the system architecture.
At the predictive performance level, the numerical estimates remain bounded by the population, information availability, operational context, and validation boundary represented in the performance envelope. Therefore, the fitted Yonghe model should not be assumed to retain the same predictive performance when transferred to another district, municipality, country, institutional environment, or materially different operating conditions without corresponding validation.
5. Data and Analytical Methods
5.1. Study Design, Data Structure, and Outcome Definition
This study combined retrospective model development and scope-specific predictive evaluation with prospective analyses. The retrospective dataset covered January 2022 to December 2024 and comprised 11,934 vehicle-day observations from 17 physical municipal waste collection vehicles across 702 active collection days. The model development period spanned January 2022 to June 2024 and contained 9554 vehicle-day observations across 562 active days, whereas the independent chronological evaluation period spanned July to December 2024 and contained 2380 observations across 140 active days. All 17 vehicle-day observations associated with the same operating date were retained in each temporal partition.
The prospective deployment covered January to June 2025 and comprised 1989 vehicle-day cases across 117 active collection days. Therefore, the retrospective dataset formed a balanced vehicle-by-day panel of 17 × 702 = 11,934 observations, while the prospective period comprised 17 × 117 = 1989 vehicle-days. An active collection day was a calendar day on which all 17 vehicles operated the scheduled afternoon and evening services under the municipal service calendar. Days without scheduled collection services were not counted as active days.
A balanced panel structure does not imply statistical independence. Each physical vehicle was repeatedly observed across operating days, whereas vehicle-days on the same date shared fleet-wide environmental and organizational conditions. Therefore, the nominal vehicle day count was treated as the number of observations, rather than the number of independent experimental units. Chronological partitioning preserved complete daily panels, whereas the LOVO validation excluded the development history of the held-out physical vehicle. No scalar effective sample size was imposed, and no inferential interval was constructed by treating the individual vehicle days as independent observations.
For physical vehicle i, operating day t, and service period s, departure deviation was defined as
where denotes the scheduled departure time recorded in the municipal dispatch system and denotes the realized departure time. Realized departure was reconstructed from GPS records using the first depot-geofence exit or sustained vehicle movement immediately following the scheduled departure window. GPS information was used only to construct the realized outcome and was not included among the pre-dispatch predictors.
A service period was classified as punctual when the absolute departure deviation did not exceed the prespecified five-minute tolerance.
The ±5-min tolerance was established by the municipal operational labeling rule before model development and was not selected or optimized according to predictive performance. It therefore defines the observed outcome rather than functioning as a classifier decision threshold. A different tolerance would change the outcome labels and would require relabeling, model redevelopment, and re-evaluation. All predictive-performance results in this study are conditional on this prespecified ±5-min definition.
Because Equation (9) uses absolute deviation, a departure occurring more than five minutes before or after the scheduled time is classified as non-punctual. Accordingly, the term delay in the four-vehicle-day class labels is retained as an operational shorthand for an out-of-tolerance departure and does not, by itself, distinguish early from late departures.
A and E denote the afternoon and evening service periods, respectively. The vehicle-day outcome was defined as
Therefore, the four classes represented services performed on time, afternoon-localized delay, evening-localized delay, and delay across both service periods. These four classes constituted the statistical multiclass prediction target. Their subsequent mapping to green, yellow, and red supervisory signals was defined separately in Section 4.2 so that the observed outcome, model prediction, supervisory signal, and final operational response remained analytically distinct.
5.2. Pre-Dispatch Predictors and Data Preparation
The predictive information set comprised six variables available before the corresponding dispatch decisions. These variables represented short-term workload pressure, recurring workload conditions, anticipated weather, holiday-related operating conditions, asset readiness, and recent personnel-related operational history. Table 3 summarizes the six pre-dispatch predictors and their operational definitions.
Table 3.
Pre-dispatch predictors and operational definitions.
The previous day’s and weekly average workloads represented short-term and recurring workload conditions, respectively. Forecast rainfall rather than realized precipitation was used to preserve the pre-dispatch information boundaries. The special holiday indicator identified the designated operating periods in which service conditions could differ from those on routine days.
Vehicle health was represented using the predefined three-level ordinal indicator available before dispatch. The indicator was derived from the maintenance history and remaining safe operating mileage under an operational maintenance cycle of approximately 7000 km or one year. The values ranged from 1 to 3, with higher values indicating poorer asset readiness. This indicator was administratively defined before model development; the analytical procedure did not estimate additional data-driven vehicle-health thresholds from departure-punctuality outcomes.
The driver-related operational risk indicator was represented as a five-level ordinal composite derived from verified safety violations, at-fault accidents, and service complaints. For each vehicle day, the indicator was recalculated using a rolling 12-month period ending on the day before dispatch, and only events recorded before the corresponding prediction date were eligible. The component events were mapped to a five-level grade according to the municipality’s established recency- and severity-based administrative coding procedure.
Importantly, the predictive model consumed the resulting 1–5 administrative grades; it did not estimate the underlying event weights or category cut-points from departure-punctuality outcomes. Accordingly, reproducing the predictive model requires the archived grade, whereas independently reconstructing that administrative indicator from raw event records would also require access to the corresponding municipal coding specifications. This distinction is retained as a reproducibility boundary rather than being addressed through the post hoc reconstruction of undocumented weights.
For vehicle-day (i,t), the full predictor vector was defined as
where x1 through x6 correspond to the predictors listed in Table 3.
The full-history specification used all six predictors. The reduced-history specification retained x1 − x4 and excluded vehicle health and driver-related operational risk. The reduced-history specification was designed to represent a deployment condition in which locally accumulated vehicle- and personnel-related histories were unavailable. It was not used as a conventional feature-selection exercise and should not be interpreted as a recommendation to omit these predictors when their historical information is available.
All data-dependent preprocessing was estimated exclusively from the relevant training observations. Missing predictor values arising from sensor or communication interruptions were handled using forward-only temporal imputation, without using future observations to replace earlier missing values. Continuous workload variables were Winsorized using the training data’s 1st and 99th percentiles and subsequently normalized using parameters estimated from the corresponding training partition. Ordinal and binary predictors retained their predefined coding.
Implausible GPS speed readings exceeding 120 km/h were removed before departure time reconstruction. GPS records were used solely to reconstruct the realized outcomes and were never included in the pre-dispatch predictor vector.
The same isolation principles were maintained throughout model development and evaluation. For the chronological evaluation, preprocessing parameters were estimated exclusively from January 2022 to June 2024 and applied unchanged to the July–December 2024 evaluation set. Within LOVO validation, the held-out physical vehicle contributed no information to preprocessing, class-weight calculation, hyperparameter selection, or model fitting.
5.3. Model Development and Scope-Aware Validation
The four vehicle-day outcomes were formulated as multiclass classification problems. During model development, we considered ten prespecified candidate classifiers: XGBoost [29], Random Forest, Gradient Boosting Decision Trees (GBDT), LightGBM, Extra Trees, Logistic Regression, Ridge Classifier, Linear Discriminant Analysis (LDA), Quadratic Discriminant Analysis (QDA), and Support Vector Classifier (SVC). These candidates represent boosting, bagging, randomized trees, linear, discriminant, and kernel-based learning paradigms.
The purpose of the benchmark was to reduce dependence on an arbitrary classifier choice and identify an operationally suitable predictive engine for heterogeneous municipal data, rather than establishing universal algorithmic superiority. The complete ten-classifier development-stage comparison is presented in Supplementary Table S3.
Model comparison and hyperparameter tuning were restricted to the development period of January 2022–June 2024. All candidate classifiers were evaluated using the same five-fold time-blocked cross-validation structure, with validation observations chronologically following the corresponding training observations. Data-dependent preprocessing and training weights were estimated only from the relevant training folds. Neither the July–December 2024 independent evaluation period nor the January–June 2025 prospective deployment period contributed to the model ranking, hyperparameter selection, predictor definition, or analytical specification.
Development-stage benchmarking identified tree-based ensemble methods as the leading predictive method (Supplementary Table S3). XGBoost was retained as the operational classifier because it combined strong development-stage weighted F1, macro-F1, and balanced accuracy; low fold-level variation; suitability for heterogeneous tabular predictors; and compatibility with the case-level SHAP explanation layer used in the deployed decision support system. Therefore, its selection is interpreted as a development-stage model-selection result, rather than evidence that XGBoost is universally superior to alternative algorithms.
For XGBoost, the tuning search varied the number of boosting estimators up to 500, maximum tree depth from 3 to 7, learning rate from 0.01 to 0.30, subsample ratio from 0.60 to 1.00, and column subsampling ratio from 0.60 to 1.00. The final development model configuration was max_depth = 4, learning_rate = 0.05, subsample = 0.80, colsample_bytree = 0.80, maximum n_estimators = 500, min_child_weight = 1, gamma = 0, reg_alpha = 0, reg_lambda = 1, objective = multi:softprob, num_class = 4, eval_metric = mlogloss, early_stopping_rounds = 20, and random_state = 42.
Early stopping used multiclass log loss (mlogloss) within the development procedure. Hyperparameter configurations were compared using mean weighted F1 across the time-blocked development folds. Thus, the early-stopping and model-selection criteria served different purposes and should not be conflated. The final frozen development model was terminated at 210 effective boosting iterations. This 210-iteration model was used for the established-unit chronological evaluation and formed the fixed predictive specification subsequently used in prospective deployment.
Class imbalance was addressed using inverse-frequency weights calculated from the relevant training observations. For a training set containing N observations distributed across K = 4 outcome classes, with nk observations in class k, the class weight was defined as
The training weights were recalculated whenever the training population changed. No synthetic oversampling was used because synthetic vehicle-day records could create combinations of workload, weather, vehicle conditions, and personnel-related history that had not occurred in the municipal operation.
After the development-stage model selection, XGBoost was evaluated under two distinct validation structures.
The first was an established-unit chronological evaluation. The model was developed using January 2022–June 2024 observations and evaluated on the independent July–December 2024 observations from the same 17 physical vehicles. This design addressed later-period predictive performance among physical units already represented during model development.
Second, chronologically constrained leave-one-vehicle-out (LOVO) validation was performed. For each held-out physical vehicle v, all January 2022–June 2024 observations associated with that vehicle were excluded before analytical processing. Preprocessing parameters and inverse-frequency class weights were estimated using only the remaining 16 vehicles. The prespecified XGBoost tuning procedure was then repeated within the fold-specific development data using the same search space, time-blocked validation structure, early-stopping rule, and weighted-F1 selection criterion. Therefore, the held-out vehicle contributed no information to preprocessing, class-weight estimation, hyperparameter selection, or model fitting.
The resulting fold-specific model was evaluated only on the July–December 2024 observations from the corresponding held-out vehicle. Therefore, LOVO imposed both a physical-unit boundary and a later-period temporal boundary.
Accordingly, the 210 effective boosting iterations characterized the final development model used for established-unit chronological evaluation and prospective deployment. The LOVO models were independently re-estimated and tuned within each fold and were not constrained to 210 boosting iterations. This distinction ensured that the physical vehicle under evaluation remained excluded from the complete model-development procedure.
To assess the dependence of the observed cross-vehicle predictive structure on the selected XGBoost implementation, we evaluated five principal tree-based ensemble candidates (XGBoost, GBDT, LightGBM, Random Forest, and Extra Trees) under the same chronologically constrained LOVO boundaries. This analysis was a cross-model robustness check, not a second model-selection stage; therefore, the later-period LOVO performance did not retrospectively influence the original development stage classifier selection.
Both validation structures were evaluated under two information specifications. The full-history specification used all six pre-dispatch predictors. The reduced-history specification retained workload, forecast rainfall, and holiday information while excluding vehicle health and driver-related operational histories. Crossing the two validation structures with the two information specifications generated four deployment-conditioned settings: (1) full-history chronological; (2) full-history LOVO; (3) reduced-history chronological; and (4) reduced-history LOVO. Together, these four settings constituted the empirical performance envelope described in Section 3.
The interpretation of LOVO is deliberately narrow. It evaluates a physical vehicle that contributed no observations to the model development while retaining the same municipal service, staffing, data, and institutional environment. Because individual drivers may operate multiple vehicles, LOVO is not a leave-one-driver-out validation and does not establish performance for a previously unseen personnel population. None of the four conditions constitute external validation across districts or municipalities.
For reproducibility and model version control, the final development model configuration, effective boosting iteration, predictor specification, preprocessing rules, class-weighting procedure, supervisory-state mapping, and random seed were archived as the analytical specification associated with the reported chronological and prospective results. Fold-specific LOVO models followed the same prespecified analytical procedure without access to observations from the held-out physical vehicle.
5.4. Performance Evaluation and Model Explanation
The weighted F1 was retained as the principal system-level performance measure because the four vehicle-day outcome classes were unequally represented. For class k, precision, recall, and class-specific F1 are defined as
The overall weighted F1 is
where nk denotes the number of observations in class k, N denotes the total number of evaluated observations, and K = 4 is the number of outcome classes.
Because weighted F1 can obscure poor discrimination in a less frequent but operationally important class, the evaluation also included class frequencies, class-specific precision, recall, and F1, macro-F1, balanced accuracy, and four-class confusion matrices. Macro-F1 was calculated as the unweighted mean of the four class-specific F1 values,
whereas balanced accuracy was calculated as the unweighted mean of class-specific recalls,
Particular attention was given to red states because failure to identify vehicle-days with predicted non-punctuality across both service periods has greater supervisory relevance than errors confined to either yellow subtype. For the established-unit chronological evaluations, class-specific metrics were calculated from the pooled predictions for all 2380 July–December 2024 vehicle-day observations. For LOVO, class-specific diagnostics were constructed by concatenating the later-period out-of-fold predictions from the 17 held-out physical vehicles. Each of the 2380 July-December 2024 vehicle-days therefore contributed exactly one out-of-fold prediction to the pooled LOVO diagnostic set. These pooled predictions were used to calculate the LOVO confusion matrix, class-specific precision, recall, and F1, macro-F1, balanced accuracy, and the diagnostic pooled weighted F1 reported in Supplementary Tables S1 and S2.
This pooled diagnostic aggregation differs from the primary LOVO weighted-F1 summary used for the performance envelope. For each held-out vehicle v, a vehicle-specific weighted F1 was first calculated, and the primary LOVO result was
Consequently, the mean vehicle-specific LOVO weighted F1 and weighted F1 reconstructed from pooled out-of-fold predictions are complementary summaries with different aggregation structures and are not expected to be numerically identical. Supplementary Table S1 reports the class-specific diagnostics, and Supplementary Table S2 provides the corresponding four-class confusion matrix.
The chronological, LOVO, and reduced-history performance estimates were interpreted as deployment-conditioned evidence, rather than interchangeable estimates of a single common parameter. The chronological weighted F1 pools later-period observations, whereas the primary LOVO weighted F1 averages the vehicle-specific scores. Accordingly, the direct subtraction of these two summaries was not treated as an inferential effect estimate.
The repeated-measures structure also precluded row-level inference based on the nominal number of vehicle-days. No confidence interval or significance test was constructed by assuming that the 2380 later-period observations were statistically independent. Fold standard deviations in the cross-model LOVO analysis were used descriptively to characterize variation across held-out vehicles and were not treated as independent replicate uncertainty estimates.
Probability calibration was not used as an operational decision-making criterion. For each vehicle day, the classifier generated one of four predicted states, and the resulting class was translated through the predefined mapping into a green, yellow, or red supervisory signal. No operational response was triggered by an absolute predicted probability threshold, and supervisors were not instructed to interpret model scores as calibrated probabilities of departure delay. Therefore, the primary evaluation focused on multiclass discrimination and supervisory state differentiation. Probability calibration would require separate validation if a future implementation uses predicted probabilities directly to set intervention thresholds, allocate resources, or communicate absolute risks.
SHAP was used to provide global and case-level explanations for the selected XGBoost model [12]. Because non-punctuality across both service periods represented the highest-priority supervisory condition, the explanatory analysis was defined with respect to the fitted red-state output. The same explanatory target was retained when explanations were accessed for yellow cases during prospective deployment to ensure that the interpretation remained consistent across non-green cases.
For predictor j global attribution was summarized using the mean absolute SHAP contribution
where ϕmj denotes the SHAP contribution of predictor j for observation m, and M is the number of observations included in the attribution analysis. Normalized attribution was calculated as
These quantities characterize attribution under the fitted predictor specification. They do not represent causal effects, independent variable importance, or operational controllability.
Previous-day load and weekly average load are related temporal summaries of collection demand and may therefore redistribute shared predictive attribution. Their individual SHAP percentages were interpreted together with the workload-level summary reported in Supplementary Table S4. The arithmetic sum of their normalized mean absolute attributions was treated as a descriptive grouped workload contribution and not as a dependence-adjusted or conditional SHAP estimate. The exact allocation of attribution between correlated workload predictors therefore remains specification-dependent.
To avoid overstating the scale of the SHAP output, figures and case-level descriptions refer to the SHAP contribution to the fitted red-state model output rather than labeling the quantity as a calibrated probability effect or causal change.
5.5. Feasibility-Bounded Scenario Re-Scoring and Prospective Workflow Evaluation
Scenario re-scoring was restricted to the operationally admissible alternatives defined in Section 4.4. For vehicle-day (i,t), let 𝒜it denote the set of supervisor-confirmed feasible alternatives.
Workload, forecast rainfall, holiday status, preprocessing parameters, and fitted-model parameters remained fixed at their original pre-dispatch values. For an admissible vehicle substitution, only the vehicle health value was replaced by that associated with the candidate vehicle. For an admissible driver reassignment, only the driver-related operational-risk value was replaced by that associated with the candidate driver. When both changes were simultaneously admissible, both corresponding predictor values could be replaced.
Let xit denote the original predictor configuration and an admissible alternative associated with a ∈ 𝒜it. The unchanged fitted classifier f(⋅) generated
The predicted classes were then translated into supervisory states using the predefined mapping g(⋅):
Class 1 was mapped to green, Classes 2 and 3 to yellow, and Class 4 to red. Scenario sensitivity was evaluated at the supervisory-state level, rather than by imposing an ordinal severity ordering on the two yellow classes.
For an original red case, the case was classified as scenario sensitive when at least one represented alternative a ∈ 𝒜it changed the mapped supervisory state from red to yellow or green. A case was classified as scenario-unresolved when all represented alternatives retained a red state.
The procedure was interpreted strictly as model-based sensitivity within the represented feasible decision space. A lower mapped state indicates that the unchanged fitted model evaluated the represented admissible configuration differently from the original configuration. It does not estimate the causal effect of implementing the alternative, the probability that the operational change would prevent an observed delay, the optimality of the evaluated configuration, or the proportion of the complete feasible driver–vehicle configuration space that would reduce predicted risk.
The workflow represented driver reassignment, vehicle substitution, and combined driver–vehicle configurations when both changes were simultaneously admissible. As documented in Supplementary Table S5, the deployment logs distinguish these represented alternative types and the subsequently authorized operational responses. They do not exhaustively enumerate every admissible alternative that may have been available for every vehicle-day.
Prospective deployment was evaluated separately from retrospective predictive validation. Operational logs characterized the use of the fixed decision-support system during January–June 2025. Recorded measures included the distribution of supervisory signals, explanation access, scenario re-scoring, completion within the 30–60-min pre-dispatch window, supervisor-authorized responses, action types, and cases remaining unresolved within the immediate decision period.
The prospective observations were not treated as an untouched predictive test set. Supervisors could inspect the model output and act before realizing departure, meaning that the observed outcome could reflect both the original pre-dispatch state and a subsequent operational response. Prospective evidence was therefore interpreted as evidence of workflow implementation, system utilization, timing compatibility, and preserved human authorization, rather than as an uncontaminated estimate of predictive discrimination or causal system effectiveness.
6. Results
6.1. Development-Stage Model Comparison and Scope-Aware Predictive Performance
First, development-stage benchmarking compared all ten prespecified classifiers under the common five-fold time-blocked cross-validation procedure described in Section 5.3. XGBoost achieved the highest observed mean weighted F1 score (0.934), followed by GBDT (0.924), LightGBM (0.920), and Random Forest (0.912). The corresponding mean macro-F1 values were 0.905, 0.895, 0.889, and 0.881, respectively, whereas the balanced accuracy ranged from 0.893 to 0.914. XGBoost also exhibited low fold-level variability (SD = 0.013).
Extra Trees achieved a development-stage weighted F1 of 0.763, whereas the statistical and kernel-based baselines produced lower values: LDA, 0.673; Ridge Classifier, 0.650; Logistic Regression, 0.607; SVC, 0.584; and QDA, 0.444. Supplementary Table S3 reports the complete development-stage weighted F1, macro-F1, balanced accuracy, and fold-level variability for all ten classifiers.
These results support the selection of XGBoost as the operational classifier. The selection was based on development-stage discrimination and stability, together with its suitability for heterogeneous tabular predictors and compatibility with the deployed SHAP explanation layer. Neither the independent July–December 2024 evaluation period nor the prospective deployment period contributed to this model-selection process.
A subsequent cross-model robustness analysis examined whether the predictive performance across the physical-vehicle boundary was specific to XGBoost. Under the same chronologically constrained LOVO design, XGBoost achieved a mean weighted F1 of 0.913, followed by GBDT at 0.901, LightGBM at 0.896, Random Forest at 0.887, and Extra Trees at 0.741 (Table 4). The corresponding descriptive differences from XGBoost were −0.012, −0.017, −0.026, and −0.172.
Table 4.
Cross-model predictive performance under chronologically constrained leave-one-vehicle-out validation.
The first four ensemble results were comparatively close, whereas the Extra Trees performed substantially lower. These comparisons indicate that the principal cross-vehicle predictive structure is not confined to a single XGBoost implementation. They do not establish statistical or universal algorithmic superiority because the vehicle-fold standard deviations are descriptive, and the LOVO folds are not independent experimental replicates.
The scope-aware analysis then focused on the selected XGBoost specifications. Under the full-history specification, the weighted F1 was 0.9261 in the independent established-unit chronological evaluation and 0.913 under chronologically constrained LOVO validation. Under the reduced-history specification, the weighted F1 was 0.893 chronologically and 0.861 under LOVO. Table 5 links each estimate to the operational population, information specification, and validation boundary.
Table 5.
Deployment-conditioned predictive performance across the validated performance envelope.
Chronological and primary LOVO weighted-F1 summaries have different aggregation structures. Chronological weighted F1 is calculated from the pooled later-period observations, whereas the primary LOVO statistic is the mean of the 17 vehicle-specific weighted-F1 values. Accordingly, the numerical proximity of 0.9261 and 0.913, and likewise that of 0.893 and 0.861, are interpreted descriptively rather than as a matched performance difference between two exchangeable estimands.
However, within a common validation structure, full- and reduced-history specifications can be compared directly as descriptive information-set contrasts. Restricting vehicle-health and driver-related operational histories reduced weighted F1 by 0.0331 under chronological evaluation and by 0.052 under LOVO. These results indicate that predictive performance changed when locally accumulated historical information was removed; however, the two within-design differences were not interpreted as causal effects of the omitted variables.
Class-specific diagnostics further examined whether the aggregate weighted F1 concealed poor recognition of the operationally highest-priority red state. The 2380 later-period observations comprised 1453 both-on-time vehicle-days (61.1%), 372 afternoon-localized cases (15.6%), 368 evening-localized cases (15.5%), and 187 red-state cases (7.9%).
Under full-history chronological evaluation, red-state precision was 0.8663, recall was 0.9358, and F1 was 0.8997. The overall macro-F1 was 0.8973, and balanced accuracy was 0.9072. Thus, the high aggregate weighted F1 was accompanied by strong recognition of the less frequent red class rather than being driven solely by the majority both-on-time class.
Under full-history LOVO, the pooled out-of-fold red-state precision, recall, and F1 were 0.8636, 0.9144, and 0.8883, respectively. The macro-F1 was 0.8815, and the balanced accuracy was 0.8912. The pooled out-of-fold weighted F1 was 0.9132, numerically close to, but analytically distinct from the primary vehicle-averaged LOVO value of 0.913. Restricting historical information also affected red-state recognition. Under the reduced-history chronological evaluation, red-state recall decreased to 0.8663 and red-state F1 to 0.8526. Under reduced-history LOVO, red-state recall was 0.8021 and red-state F1 was 0.7958. The corresponding macro-F1 and balanced accuracy were 0.8553 and 0.8623 chronologically and 0.8109 and 0.8194 under LOVO. Thus, the lower aggregate performance observed under restricted historical information was also reflected in the operationally highest-priority class. This was not confined to changes in the more frequent both-on-time state.
The confusion matrices showed that errors increased across several neighboring operational states as historical information was restricted, with the greatest deterioration under a reduced-history LOVO. Direct both-on-time–red inversions remained less frequent than misclassifications involving one of the two intermediate yellow states, although such inversions were not absent. The full class-specific precision, recall, F1, macro-F1, balanced accuracy, and pooled weighted-F1 diagnostics are reported in Supplementary Table S1, and the four corresponding confusion matrices are reported in Supplementary Table S2.
Collectively, the development-stage comparison, cross-model LOVO analysis, deployment-conditioned XGBoost estimates, and class-specific diagnostics addressed RQ1. They characterize predictive behavior under the specific validation and information boundaries tested here; none establishes cross-municipality performance or predictive transfer to previously untested drivers.
6.2. Operational Risk Differentiation During Prospective Deployment
During the six-month prospective deployment, the fixed system generated pre-dispatch supervisory signals for 1989 vehicle-day cases across 117 active collection days. Green signals were generated in 1036 cases (52.1%). Yellow signals were generated for 706 cases (35.5%), comprising 363 afternoon-localized cases (18.3%) and 343 evening-localized cases (17.2%). The remaining 247 cases (12.4%) received red signals and were assigned to the highest-priority supervisory category. Table 6 summarizes the distribution of the supervisory signals during prospective deployment.
Table 6.
Distribution of pre-dispatch supervisory signals during prospective deployment.
Overall, 953 cases (47.9%) received non-green signals and were eligible for additional supervisory reviews. These frequencies characterize the distribution of model-generated supervisory states during prospective use. They are not class-specific precision, recall, predictive accuracy, or estimates of outcome prevalence from an untouched test population because supervisors can respond to the model output before realizing the departure. Therefore, prospective signal frequencies serve as operational workflow evidence rather than predictive-validation statistics.
6.3. Workflow Utilization: Explanation Access and Scenario Re-Scoring
Among the 953 non-green cases, supervisors accessed local SHAP explanations for 863 cases (90.6%). Explanation access occurred in 241 of 247 red cases (97.6%) and 622 of 706 yellow cases (88.1%), respectively.
Scenario re-scoring was performed selectively. This was performed for 389 non-green cases (40.8%), comprising 209 red cases (84.6% of red cases) and 180 yellow cases (25.5% of yellow cases). Of the 389 scenario evaluations, 368 (94.6%) were completed within the existing 30–60-min pre-dispatch decision window. Table 7 summarizes workflow utilization, scenario evaluation, and recorded operational responses.
Table 7.
Workflow utilization, scenario evaluation, and recorded operational responses.
Explanation access and scenario re-scoring represent different workflow stages. This explanation could support diagnostic reviews, even when no adjustable factors or admissible alternatives are available. Scenario re-scoring additionally requires a supervisor-confirmed feasible configuration.
The greater use of explanations and scenario evaluations for red cases than yellow cases is consistent with the intended management-by-exception structure. The 94.6% completion rate indicates that explanation review, feasibility assessment, and model re-scoring could generally be conducted within the existing operational decision window. It does not demonstrate shorter decision time, reduced supervisory workload, increased user trust, or improved decision quality.
6.4. Feasible Scenario Sensitivity and Human Authorization
Scenario re-scoring was recorded for 209 of the 247 red cases (84.6%), and the remaining 38 red cases (15.4%) had no recorded scenario re-scoring data. Among the 209 evaluated red cases, 143 (68.4%) were classified as scenario sensitive because at least one supervisor-confirmed feasible alternative changed the mapped supervisory state from red to yellow or green. The remaining 66 cases (31.6%) remained red across the represented alternatives and were classified as scenario-unresolved within the immediate decision window (Table 8).
Table 8.
Model-predicted outcomes of feasible scenario re-scoring for red cases.
The scenario space included driver reassignment, vehicle substitution, and, when both changes were simultaneously admissible, a combined driver–vehicle configuration. These scenario types should be distinguished from the subsequently authorized operational actions.
The 68.4% value is a case-level model sensitivity rate among evaluated red cases. It is not an intervention-success rate, a proportion of prevented delays, or a causal effect estimate. It does not represent the proportion of all mathematically possible or operationally feasible configurations that would reduce predicted risk.
Supplementary Table S5 summarizes the recorded scenario-evaluation coverage, represented alternative types, and authorized operational responses. The retained operational records identify represented scenario types but do not exhaustively enumerate every admissible alternative that may have been available for every vehicle day. Consequently, the scenario-sensitive result characterizes model behavior within the represented, supervisor-confirmed feasible decision space rather than exhaustive optimization of the complete personnel–vehicle configuration space.
Similarly, scenario-unresolved cases indicate that the alternatives represented in the workflow did not move the fitted model below the red supervisory state. They do not establish a structural shortage of drivers, vehicles, staffing capacity, or other municipal resources.
Supervisors authorized operational responses in 134 vehicle-day cases, generating 154 recorded actions because 20 cases involved two action categories. The actions comprised 87 driver reassignments (56.5% of recorded actions), 48 vehicle substitutions (31.2%), and 19 enhanced pre-departure or safety checks (12.3% of recorded actions).
These actions document the exercise of human authority. They are not counts of all alternatives evaluated during scenario re-scoring and should not be interpreted as independent intervention observations. The model did not execute any actions autonomously; supervisors determined whether to implement, modify, or reject the evaluated alternative.
Together, the scenario and action records provide empirical evidence for RQ3 by demonstrating the separation of feasibility assessment, model re-scoring, and human authorization during prospective use.
6.5. SHAP Attribution and Illustrative Decision Pathway
Global SHAP analysis showed that the previous-day collection load accounted for 42% of the normalized mean absolute attribution to the fitted red-state output. This was followed by the forecast rainfall intensity (28%), driver-related operational risk (18%), vehicle health (8%), weekly average workload (3%), and special holiday indicators (1%).
Previous-day load and weekly average load represent related temporal summaries of collection demand. Their individual attributions may therefore redistribute shared predictive information. Together, the two workload variables accounted for 45% of the normalized mean absolute attribution. Supplementary Table S4 distinguishes this arithmetic workload grouping from dependence-adjusted or causal interpretations.
The 45% grouped value is not a conditional or dependence-corrected SHAP estimate. More generally, SHAP attribution is conditional on the fitted predictor specification and background distribution. Therefore, the reported percentages characterize how the fitted model allocates predictive attribution; they do not establish independent variable importance, causal influence, or operational controllability.
Therefore, the principal conclusion supported by these results is at the construct level: workload information constituted a prominent component of the fitted red-state explanation, alongside forecast rainfall and driver-related operational history. The precise division of attribution between the two related workload variables is not uniquely identified.
Figure 3 illustrates the corresponding case-level decision pathway for vehicle day V01 on January 28, 2025. The case received a red supervisory signal under elevated workload and forecast rainfall conditions. The local explanation identified the previous-day collection load as the largest positive contributor to the fitted red-state output (+0.41), followed by forecast rainfall (+0.28), and driver-related operational risk (+0.19). Vehicle health, weekly average workload, and special holiday indicators contributed to the opposite direction for this individual case.
Figure 3.
Illustrative red-case pathway from model explanation to supervisor-authorized scenario re-scoring.
The positive driver-related attribution was not interpreted as an instruction to replace the assigned driver. Instead, the supervisor assessed whether an admissible replacement existed based on qualification, route familiarity, working hours, staffing, service, and safety requirements. After the feasibility conditions were satisfied, the supervisor submitted the represented alternative to the unchanged predictive model. The mapped supervisory state changed from red to yellow, after which the supervisor authorized and recorded the reassignment.
The red-to-yellow transition demonstrates model-based scenario sensitivity under one feasible configuration. This does not estimate a causal effect of driver reassignment on realized departure punctuality and should not be interpreted as a calibrated probability reduction.
6.6. Descriptive Service Context During Prospective Deployment
Table 9 reports the monthly departure punctuality and recorded complaints during the prospective deployment. These indicators were examined only to describe a broader operating context. Complaint recording began in February 2025; therefore, the complaint count for January was unavailable.
Table 9.
Monthly service indicators during prospective deployment.
All-day punctuality ranged from 41.9% to 62.0%, while recorded complaints ranged from two to eight per month from February to June.
These changes coincided with the prospective deployment but could not be attributed causally to the decision-support system. Operating conditions varied over time, supervisors could alter resource assignments after viewing model outputs, and no concurrent untreated fleet or randomized comparison condition was available. Table 9 is therefore interpreted strictly as a descriptive service context, not as evidence of intervention effectiveness.
7. Discussion
The retrospective and prospective components of this study provided complementary but non-interchangeable forms of evidence. The retrospective analyses evaluate predictive performance under explicitly differentiated physical-unit and information-availability conditions (RQ1) and link these estimates to deployment conditions supported by their validation evidence (RQ2). The prospective records demonstrate how prediction, explanation, feasibility assessment, scenario re-scoring, and human authorization entered routine municipal operations (RQ3) without being interpreted as uncontaminated predictive validation or causal intervention evidence.
7.1. Predictive Performance Across Physical-Unit and Information Boundaries
The results show that predictive performance should be interpreted together with the validation boundary that generated it. Under the full-history specification, weighted F1 was 0.9261 in the established-unit chronological evaluation and 0.913 under chronologically constrained LOVO validation. These values are numerically similar but represent different estimands: the chronological result pools later-period observations from vehicles represented during development, whereas the primary LOVO result averages vehicle-specific performance across held-out physical vehicles. Their numerical difference is therefore not interpreted as a transfer penalty or a matched effect estimate.
The cross-model results support the same general interpretation. XGBoost performed best during the development-stage model comparison, while GBDT, LightGBM, and Random Forest showed broadly comparable performance among the leading ensemble models. Their subsequent LOVO results were also relatively close (Table 4), indicating that the observed cross-vehicle predictive structure was not unique to XGBoost. These comparisons are descriptive and context-specific and do not imply universal algorithmic superiority.
Class-specific diagnostics further showed that favorable aggregate performance did not conceal poor recognition of the operationally important red state. Red-state recall was 0.9358 under full-history chronological evaluation and 0.9144 under pooled full-history LOVO evaluation. When vehicle-health and driver-related histories were removed, weighted F1 decreased from 0.9261 to 0.893 within the chronological design and from 0.913 to 0.861 within LOVO; red-state recall also declined to 0.8663 and 0.8021, respectively. Thus, restricting locally accumulated historical information affected both overall discrimination and recognition of the highest-priority class. These within-design differences describe the predictive consequences of information availability and are not interpreted as causal effects of the omitted predictors.
The confusion matrices were consistent with this pattern: misclassification increased when historical information was restricted, particularly under reduced-history LOVO, with most additional errors involving neighboring yellow states rather than direct both-on-time–red inversions (Supplementary Table S2). These results also clarify that physical unit representation and information availability define different deployment questions. LOVO evaluates a physical vehicle excluded from model development while retaining the same municipal service, staffing, data infrastructure and institutional setting. Reduced-history evaluation examines performance when locally accumulated vehicle and personnel histories are unavailable. Therefore, LOVO does not establish transfer to unseen drivers or other municipalities, and the reduced-history specification should not be interpreted as a recommendation to remove these predictors when valid histories are available.
Overall, RQ1 is answered by showing that predictive performance depends on the deployment condition represented by the validation evidence. The main result is therefore not a single universal F1 value but a set of deployment-conditioned estimates whose interpretation depends on physical-unit representation, information availability, class-specific behavior, and the validation design under which they were obtained.
7.2. The Performance Envelope as Deployment-Conditioned Evidence
The four XGBoost benchmarks in Table 5 represent different combinations of physical-unit representation and historical-information availability. Therefore, they should be interpreted as deployment-conditioned evidence rather than competing estimates of a context-free performance parameter. The relevant validation question is not simply how accurately the model performs, but under which population, information environment, operational context, and validation boundary a particular performance claim is supported.
The performance envelope formalizes this correspondence by linking each performance summary to the four deployment dimensions. The inside, conditional, and outside classifications defined in Section 3 indicate whether a proposed deployment is directly represented, partially supported, or unsupported by the available evidence. These classifications govern the scope of the performance claim but do not predict the success or failure of an untested deployment.
An important implication is that evidence from separate benchmarks cannot be recombined to validate a deployment condition that has not been evaluated. In this study, the reduced-history LOVO directly represents the joint boundary of physical-vehicle exclusion and restricted historical information, whereas deployment in another municipality remains outside the validated envelope. This extends the conventional model documentation [23,24,25] by keeping numerical performance claims explicitly attached to the conditions represented by the validation evidence.
This correspondence provides the basis for performance-scope accountability. The object of accountability is not only the model but also the claim made about the model under a specified use condition. The contribution is therefore evidentiary and systems-oriented: the performance envelope provides a reproducible rule for determining when existing predictive evidence supports a proposed deployment and when additional validation is required. This directly addresses RQ2 and helps prevent deployment-scope mismatch in recurrent operational AI systems.
7.3. From Explanation to Feasible and Human-Authorized Decision Support
The prospective phase illustrates why predictive explanation should not be equated with operational action. During deployment, SHAP explanations were accessed for 90.6% of non-green cases and 97.6% of red cases, whereas scenario re-scoring was performed for 40.8% of non-green cases and 84.6% of red cases. The difference reflects the distinct roles of these functions. Explanations can support diagnostic interpretation whenever additional understanding is required, whereas scenario re-scoring additionally requires an operationally adjustable factor and a supervisor-confirmed feasible alternative.
The global SHAP results further illustrate the distinction between predictive attribution and controllability. Previous-day workload, rainfall forecast, and driver-related operational history accounted for the largest shares of normalized red-state attribution. Workload-related variables accounted for a descriptive 45% of normalized attribution, although the exact division between previous-day and weekly workload remains sensitive to the presence of related predictors and is not interpreted as dependence-adjusted or causal importance (Supplementary Table S4).
More importantly, the largest model attribution did not necessarily identify an immediate operational lever. Previous-day workload and forecast rainfall were fixed at the time of the dispatch decision. Vehicle health and driver-related conditions could be changed only indirectly through admissible resource substitutions. Thus, explanatory relevance and operational controllability represented different properties.
The scenario layer translated this distinction into a bounded decision process. Among 209 red cases for which scenario re-scoring was conducted, 143 (68.4%) were scenario sensitive because at least one represented supervisor-confirmed feasible alternative changed the mapped supervisory state from red to yellow or green. The remaining 66 cases (31.6%) remained red under the alternatives represented in the workflow.
This 68.4% proportion should be interpreted narrowly. It measures the model sensitivity within the represented feasible decision space. It is not the proportion of delays prevented, intervention success rate, causal treatment effect, or proportion of all feasible driver–vehicle combinations that would lower the predicted risk. Supplementary Table S5 distinguishes the represented scenario types from the subsequently authorized operational responses and clarifies that the workflow does not exhaustively enumerate every admissible configuration.
Scenario-unresolved cases similarly require restrained interpretation. A case remaining red after the represented alternatives were evaluated does not establish a structural shortage of personnel or vehicles. It indicates only that the alternatives brought forward within the immediate operational workflow did not change the fitted model below the red state. Recurrent concentrations of such cases could motivate longer-term organizational reviews, but identifying structural capacity constraints would require a separate analysis.
Human authorization constituted the final decision boundary. Supervisors authorized 154 actions in 134 vehicle-day cases, and none were executed autonomously by the model. These records show that operational responsibility remained with the supervisor rather than being transferred to the predictive system.
Therefore, prospective deployment supports a complementary, rather than substitutive, view of human–AI collaboration. The model identified and explained elevated-risk cases, whereas supervisors determined whether a feasible alternative existed and whether it should be implemented. Scenario re-scoring informed managerial judgment but did not replace it. The 94.6% in-window completion rate indicates that this workflow was compatible with the existing 30–60-min decision window; it does not demonstrate lower workload, better decisions, or superiority over human-only practice.
The system contribution lies in coupling an evidence boundary with a human-in-the-loop decision boundary. Predictive evidence defines where the model performance is supported, whereas human judgment governs whether and how the model outputs enter operational action.
7.4. Limitations and Boundaries of Inference
The findings should be interpreted within the following explicit boundaries. First, the empirical study involved 17 physical collection vehicles within one municipal district operating under a common service, staffing, data, and institutional environment. Therefore, chronological and LOVO evaluations only support the deployment conditions that they directly represent. LOVO evaluates an unrepresented physical vehicle within the same municipal system; it does not constitute leave-one-driver-out validation or external validation across districts, municipalities, countries or institutional settings. Cross-municipality predictive generalization has not been tested.
Second, the 11,934 retrospective vehicle-day observations have a crossed repeated-measures structure across physical vehicles and operating days. Therefore, the observations should not be treated as statistically independent experimental units. The chronological and LOVO procedures preserve the intended separation between model development and evaluation records but do not provide uncertainty intervals adjusted for dependence across vehicles and dates. The reported performance measures are consequently interpreted as descriptive, out-of-sample diagnostics. Vehicle-fold standard deviations are also descriptive and are not used as independent replicate standard errors, confidence intervals, or hypothesis tests. Class-specific precision, recall, F1, macro-F1, balanced accuracy, and confusion matrices were reported to complement the primary weighted-F1 summaries (Supplementary Tables S1 and S2). These diagnostics remain descriptive rather than independent inferential estimates. For LOVO, the pooled out-of-fold class-specific diagnostics additionally use a different aggregation basis from the primary mean vehicle-specific weighted F1. Therefore, the two summaries answer complementary questions and should not be treated as interchangeable estimates of a single parameter.
Third, all reported predictive evidence is conditional on the prespecified ±5-min departure-punctuality definition. Alternative tolerances would define different outcome labels and would require complete relabeling, redevelopment, and evaluation of the analytical pipeline. The current analysis does not support ±3- or ±10-min sensitivity results. Therefore, the results establish performance only for the outcome definition actually evaluated. Fourth, the driver-related operational-risk indicator was an administratively predefined five-level grade based on verified operational records and calculated using a rolling 12-month history preceding the dispatch date. The predictive model used the resulting grade and did not estimate the underlying administrative event weights or cut-points from the punctuality outcome. Reconstructing the grade independently from raw events would require access to the municipal coding specification. This limits the full external reproducibility of the indicator construction, although the analytical treatment of the resulting grade is specified. Fifth, SHAP attribution remains conditional on the fitted predictor specification and background distribution. Previous-day and weekly average workload are related temporal summaries and may redistribute attribution between themselves. Supplementary Table S4 therefore reports their attribution and the grouped workload interpretation while explicitly distinguishing the descriptive 45% workload sum from a dependence-adjusted or causal importance estimate. SHAP values should not be interpreted as causal effects, independent predictor importance, or direct evidence of operational controllability. Sixth, the scenario-evaluation results describe only the represented feasible decision space. The deployment records distinguish driver reassignment, vehicle substitution, and combined configurations as represented scenario types, but they do not exhaustively enumerate every admissible alternative that may have existed for each vehicle-day. Consequently, the 68.4% scenario-sensitive proportion does not estimate complete feasible-space coverage, optimization success, or causal intervention effectiveness. Likewise, the analysis reports mapped supervisory-state changes rather than claiming calibrated probability reductions for individual interventions.
Finally, the prospective deployment was observational and interventionally exposed. Supervisors can respond after receiving the model outputs but before the departure is realized. Consequently, subsequent punctuality and complaint patterns cannot be attributed to the AI-supported workflow. Deployment logs provide evidence of system use, access to explanations, feasibility-bounded scenario evaluations, timing compatibility, and substantive human authorization. They do not establish user comprehension, trust, decision quality improvement, superiority over a human-only process, or causal service improvement.
The driver-related operational risk indicator also remains bounded to the authorized purpose evaluated here: short-term pre-dispatch operational risk assessment and resource coordination. Its predictive contribution does not establish validity for employee appraisal, promotion, disciplinary use, investigation, long-term personnel ranking, or other personnel management purposes.
8. Practical Implications for Smart-City Systems and Conclusions
8.1. Deployment and Scaling of AI-Enabled Municipal Decision Support
Scaling an AI-supported municipal decision system should be treated as an evidence-matching problem, rather than a software transfer problem. Before extending deployment, the intended use should be compared with the validated performance envelope in terms of the operational population, information availability, operational context, and validation boundary. Deployment conditions not represented by existing evidence require additional validation before the corresponding performance claims can be transferred.
Physical-unit expansion and information availability represent distinct deployment questions. LOVO provides evidence for a physical vehicle excluded from model development within the same municipal environment, whereas the reduced-history analysis addresses the absence of locally accumulated vehicle and personnel information. Neither result supports unrestricted transfer to another municipality. Accordingly, predictor definitions, preprocessing rules, outcome definitions, and required historical information should remain consistent with the validated specification or be revalidated after material changes. Operational monitoring should also extend beyond aggregate performance. Where the red state remains the highest-priority supervisory condition, class-specific measures, such as red-state recall, can reveal changes that may not be visible in weighted F1 alone.
Scaling must preserve the human-in-the-loop decision boundary. Model predictions and explanations may identify risk, and scenario re-scoring may indicate sensitivity to a feasible alternative; however, operational feasibility and final action remain the responsibility of the supervisor. The driver-related operational-risk indicator is likewise restricted to short-term dispatch support and should not be extended to personnel-management uses without separate justification, governance, and validation.
8.2. Monitoring, Revalidation, and System Lifecycle Management
Operational AI systems should be managed as evolving socio-technical systems, rather than static prediction models. Changes in fleet composition, staffing, predictor availability, operating procedures, outcome definitions, and data quality can alter the correspondence between current use and the conditions represented by the original validation evidence. Therefore, the performance envelope provides a practical reference for determining whether an existing performance claim remains applicable.
Material changes in population, information structure, operational context, or analytical specification should trigger review and, where necessary, revalidation. Monitoring indicators, such as supervisory-state distributions, class-specific error patterns, red-state recall, unresolved cases, workflow utilization, and missing-data rates, may signal the need for investigation, but they should not automatically trigger retraining or recalibration.
Lifecycle management should also preserve version-level traceability between the deployed model, predictor, preprocessing specifications, outcome definition, validation design, supervisory-state mapping, feasibility rules, and supported deployment claims. Any recalibrated, retrained, or otherwise modified analytical specification should be validated and versioned before replacing the deployed system.
Prospective operational logs can support this process by documenting the model’s use, scenario evaluation, authorized actions, unresolved cases, and data quality changes. These records provide traceability and review triggers, rather than a substitute for formal validation. Consistent with this principle, the model used in this study remained fixed throughout the January–June 2025 deployment period.
8.3. Conclusions
This study developed a scope-aware AI decision-support system for municipal waste-collection dispatch and examined how predictive evidence should be interpreted when deployment conditions change. Across chronological, LOVO, and reduced-history evaluations, performance depended on both physical-unit representation and the availability of locally accumulated operational histories. The full-history weighted F1 was 0.9261 under chronological evaluation and 0.913 under LOVO, while class-specific analysis confirmed strong recognition of the operationally important red state.
The main methodological contribution is the deployment-conditioned performance envelope, which links a performance claim to the population, information set, operational context, and validation boundary represented by its supporting evidence. This evidence boundary is paired with a human-in-the-loop decision boundary: model outputs and explanations support supervisory review, but operational feasibility is assessed by supervisors, and no reassignment or substitution is executed without human authorization.
Prospective deployment showed that 143 of 209 evaluated red cases were scenario sensitive, and that 94.6% of scenario evaluations were completed within the existing 30–60-min decision window. These observations demonstrate workflow feasibility and model sensitivity rather than causal service improvement. More broadly, operational AI should be governed not only by predictive accuracy, but also by explicit limits on where its evidence applies and by clear human responsibility for consequential decisions.
Supplementary Materials
The following supporting information can be downloaded at: https://www.mdpi.com/article/10.3390/systems14111379/s1. Table S1: Class-specific and overall predictive performance under the four deployment-conditioned evaluation settings; Table S2: Four-class confusion matrices under the four deployment-conditioned evaluation settings; Table S3: Development stage comparison of the ten candidate classifiers; Table S4: Global SHAP attribution and dependence-related robustness status of the workload explanation; Table S5: Scenario re-scoring coverage, represented alternatives, and authorized operational responses.
Author Contributions
Conceptualization, C.-C.W.; methodology, C.-C.W. and C.-H.C.; validation, C.-C.W. and C.-H.C.; formal analysis, C.-C.W. and C.-H.H.; data curation, C.-H.H.; writing—original draft preparation, C.-C.W. and C.-H.C.; writing—review and editing, C.-C.W.; supervision, C.-C.W. All authors have read and agreed to the published version of the manuscript.
Funding
This research received no external funding.
Institutional Review Board Statement
Not applicable. This study analyzed existing municipal operational records collected for routine service management and did not involve experimental interventions or direct interaction with human participants. Vehicle and driver identifiers were coded before the analysis, and the data were used with authorization from the participating municipal authority.
Informed Consent Statement
Not applicable. This study used secondary municipal operational records collected for routine service management, and no direct interaction with individual personnel was conducted for research purposes.
Data Availability Statement
Restrictions apply to the availability of these data. The data were obtained from the participating municipal authority and are not publicly available because they contain municipal operations and personnel-related information subject to confidentiality and data-use restrictions. Requests to access the datasets should be directed to the corresponding author and require permission from the participating municipal authorities.
Conflicts of Interest
The authors declare no conflicts of interest.
References
- Fang, B.; Yu, J.; Chen, Z.; Osman, A.I.; Farghali, M.; Ihara, I.; Hamza, E.H.; Rooney, D.W.; Yap, P.-S. Artificial intelligence for waste management in smart cities: A review. Environ. Chem. Lett. 2023, 21, 1959–1989. [Google Scholar] [CrossRef] [Scilit]
- Ahmed, K.; Dubey, M.K.; Kumar, A.; Dubey, S. Artificial intelligence and IoT driven system architecture for municipality waste management in smart cities: A review. Meas. Sens. 2024, 36, 101395. [Google Scholar] [CrossRef] [Scilit]
- El Jaouhari, A.; Samadhiya, A.; Kumar, A.; Mulat-Weldemeskel, E.; Luthra, S.; Kumar, R. Turning trash into treasure: Exploring the potential of AI in municipal waste management—An in-depth review and future prospects. J. Environ. Manag. 2025, 373, 123658. [Google Scholar] [CrossRef] [Scilit]
- Chin, T.; Fan, Y.; Lin, C.-L.; Lin, Y.-C.; Liao, K.-T. Artificial intelligence-related technologies for municipal solid waste management: A review and new insights from smart cities. Sustain. Cities Soc. 2026, 147, 107530. [Google Scholar] [CrossRef] [Scilit]
- Niu, Y.; Xu, C.; Liao, S.; Zhang, S.; Xiao, J. Multi-objective location-routing optimization based on machine learning for green municipal waste management. Waste Manag. 2024, 181, 157–167. [Google Scholar] [CrossRef] [Scilit]
- Barth, L.; Schweiger, L.; Benedech, R.; Ehrat, M. From data to value in smart waste management: Optimizing solid waste collection with a digital twin-based decision support system. Decis. Anal. J. 2023, 9, 100347. [Google Scholar] [CrossRef] [Scilit]
- Hess, C.; Dragomir, A.G.; Doerner, K.F.; Vigo, D. Waste collection routing: A survey on problems and methods. Cent. Eur. J. Oper. Res. 2024, 32, 399–434. [Google Scholar] [CrossRef] [Scilit]
- Roberts, D.R.; Bahn, V.; Ciuti, S.; Boyce, M.S.; Elith, J.; Guillera-Arroita, G.; Hauenstein, S.; Lahoz-Monfort, J.J.; Schröder, B.; Thuiller, W.; et al. Cross-validation strategies for data with temporal, spatial, hierarchical, or phylogenetic structure. Ecography 2017, 40, 913–929. [Google Scholar] [CrossRef] [Scilit]
- Steyerberg, E.W.; Harrell, F.E., Jr. Prediction models need appropriate internal, internal-external, and external validation. J. Clin. Epidemiol. 2016, 69, 245–247. [Google Scholar] [CrossRef] [Scilit]
- Moreno-Torres, J.G.; Raeder, T.; Alaiz-Rodríguez, R.; Chawla, N.V.; Herrera, F. A unifying view on dataset shift in classification. Pattern Recognit. 2012, 45, 521–530. [Google Scholar] [CrossRef] [Scilit]
- Pearl, J.; Bareinboim, E. External validity: From do-calculus to transportability across populations. Stat. Sci. 2014, 29, 579–595. [Google Scholar] [CrossRef] [Scilit]
- Lundberg, S.M.; Lee, S.-I. A unified approach to interpreting model predictions. In Advances in Neural Information Processing Systems; Guyon, I., von Luxburg, U., Bengio, S., Wallach, H., Fergus, R., Vishwanathan, S., Garnett, R., Eds.; Curran Associates: Red Hook, NY, USA, 2017; Volume 30, pp. 4765–4774. [Google Scholar]
- Aoki, N.; Tatsumi, T.; Naruse, G.; Maeda, K. Explainable AI for government: Does the type of explanation matter to the accuracy, fairness, and trustworthiness of an algorithmic decision as perceived by those who are affected? Gov. Inf. Q. 2024, 41, 101965. [Google Scholar] [CrossRef] [Scilit]
- Busuioc, M. Accountable artificial intelligence: Holding algorithms to account. Public Adm. Rev. 2021, 81, 825–836. [Google Scholar] [CrossRef] [Scilit]
- Grimmelikhuijsen, S. Explaining why the computer says no: Algorithmic transparency affects the perceived trustworthiness of automated decision-making. Public Adm. Rev. 2023, 83, 241–262. [Google Scholar] [CrossRef] [Scilit]
- Madan, R.; Ashok, M. AI adoption and diffusion in public administration: A systematic literature review and future research agenda. Gov. Inf. Q. 2023, 40, 101774. [Google Scholar] [CrossRef] [Scilit]
- Selten, F.; Klievink, B. Organizing public sector AI adoption: Navigating between separation and integration. Gov. Inf. Q. 2024, 41, 101885. [Google Scholar] [CrossRef] [Scilit]
- Yuan, Q.; Chen, T. Holding AI-based systems accountable in the public sector: A systematic review. Public Perform. Manag. Rev. 2025, 48, 1389–1422. [Google Scholar] [CrossRef] [Scilit]
- Singh, R.; Miller, T.; Lyons, H.; Sonenberg, L.; Velloso, E.; Vetere, F.; Howe, P.; Dourish, P. Directive explanations for actionable explainability in machine learning applications. ACM Trans. Interact. Intell. Syst. 2023, 13, 23. [Google Scholar] [CrossRef] [Scilit]
- Artelt, A.; Gregoriades, A. Supporting organizational decisions on how to improve customer repurchase using multi-instance counterfactual explanations. Decis. Support Syst. 2024, 182, 114249. [Google Scholar] [CrossRef] [Scilit]
- Alon-Barkat, S.; Busuioc, M. Human–AI interactions in public sector decision making: “Automation bias” and “selective adherence” to algorithmic advice. J. Public Adm. Res. Theory 2023, 33, 153–169. [Google Scholar] [CrossRef] [Scilit]
- Keppeler, F.; Borchert, J.; Pedersen, M.J.; Nielsen, V.L. How ensembling AI and public managers improves decision-making. J. Public Adm. Res. Theory 2025, 35, 261–276, Correction in J. Public Adm. Res. Theory 2025, 35, 519. https://doi.org/10.1093/jopart/muaf023. [Google Scholar] [CrossRef] [Scilit]
- Mitchell, M.; Wu, S.; Zaldivar, A.; Barnes, P.; Vasserman, L.; Hutchinson, B.; Spitzer, E.; Raji, I.D.; Gebru, T. Model cards for model reporting. In Proceedings of the Conference on Fairness, Accountability, and Transparency, Atlanta, GA, USA, 29–31 January 2019; pp. 220–229. [Google Scholar]
- Raji, I.D.; Smart, A.; White, R.N.; Mitchell, M.; Gebru, T.; Hutchinson, B.; Smith-Loud, J.; Theron, D.; Barnes, P. Closing the AI accountability gap: Defining an end-to-end framework for internal algorithmic auditing. In Proceedings of the 2020 Conference on Fairness, Accountability, and Transparency, Barcelona, Spain, 27–30 January 2020; pp. 33–44. [Google Scholar]
- Gebru, T.; Morgenstern, J.; Vecchione, B.; Vaughan, J.W.; Wallach, H.; Daumé, H., III; Crawford, K. Datasheets for datasets. Commun. ACM 2021, 64, 86–92. [Google Scholar] [CrossRef] [Scilit]
- New Taipei City Government Environmental Protection Department. May Residents Leave Waste on the Ground Before the Garbage Truck Arrives? Frequently Asked Questions, 8 October 2018. Available online: https://www.epd.ntpc.gov.tw/Faq/faq?PageIndex=12&PageType=1&id=cc1f1f3e-8b75-456e-b063-da675abdc1e9 (accessed on 8 October 2026).
- New Taipei City Government Environmental Protection Department. Waste Collection Information Inquiry System. Available online: https://crd-rubbish.epd.ntpc.gov.tw/dispPageBox/Ntpcepd/NtpHp.aspx?ddsPageID=HOME (accessed on 8 October 2026).
- Yonghe District Office, New Taipei City Government. Yonghe District Overview. Available online: https://www.yonghe.ntpc.gov.tw/home.jsp?id=69aaea7a71818a80 (accessed on 8 October 2026).
- Chen, T.; Guestrin, C. XGBoost: A scalable tree boosting system. In Proceedings of the 22nd ACM SIGKDD International Conference on Knowledge Discovery and Data Mining, San Francisco, CA, USA, 13–17 August 2016; pp. 785–794. [Google Scholar]
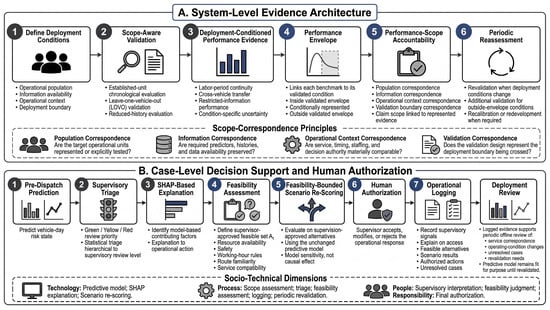
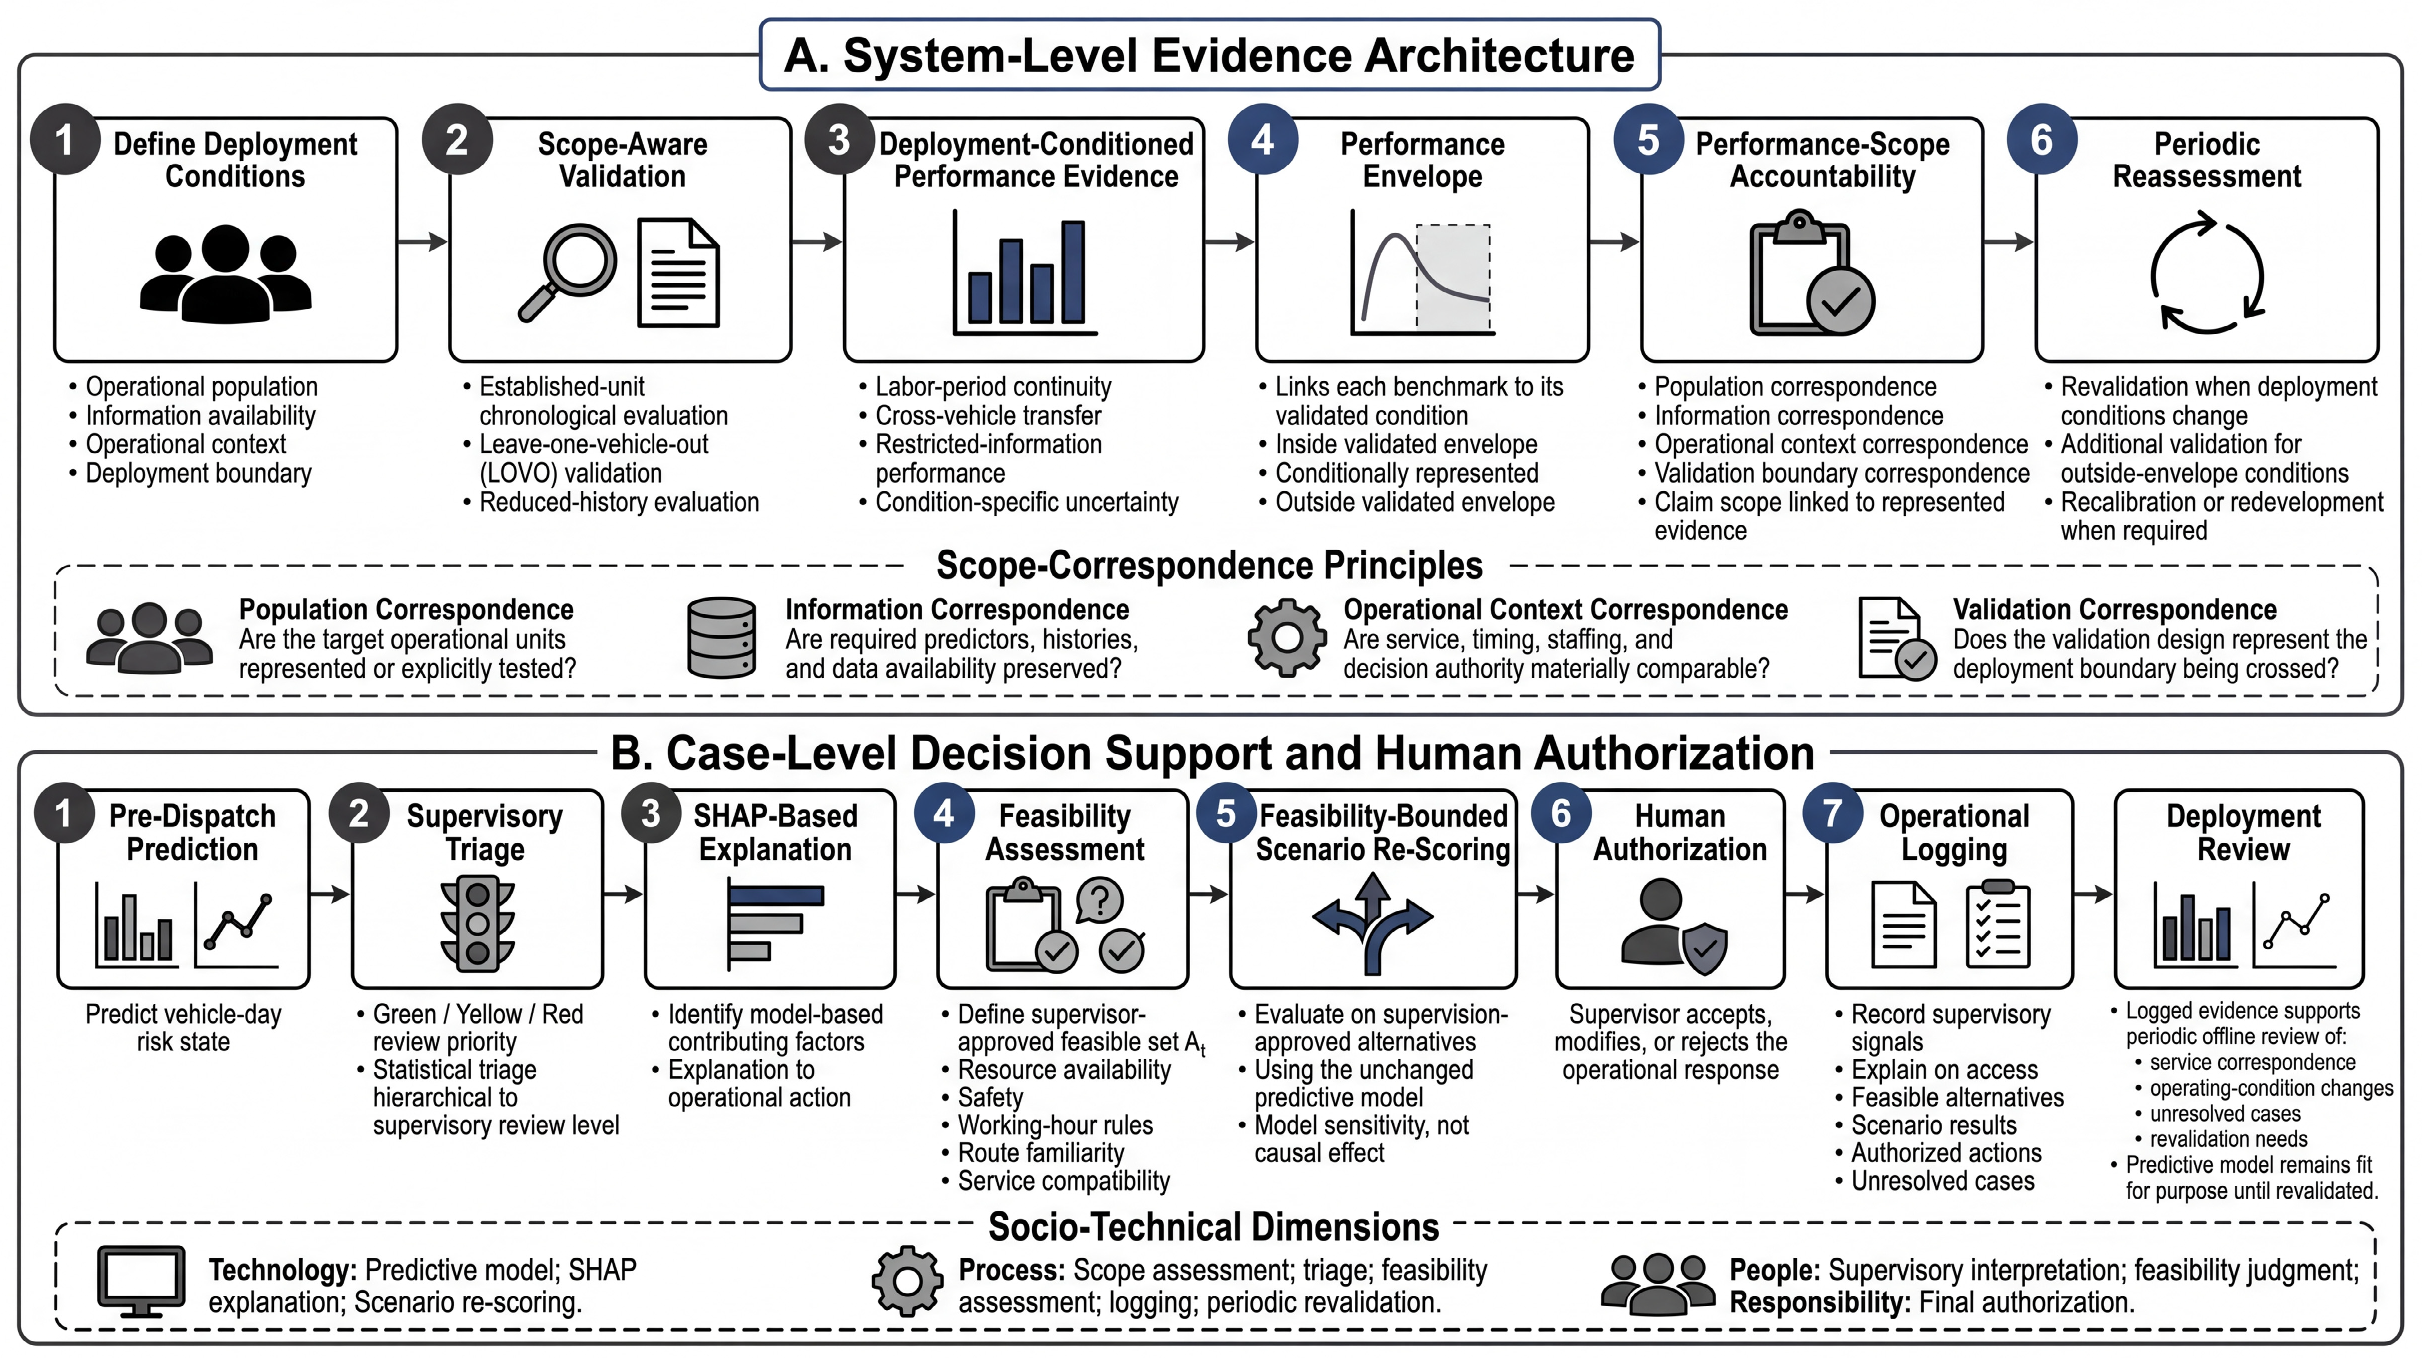
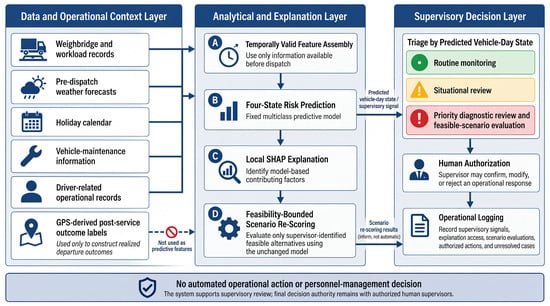
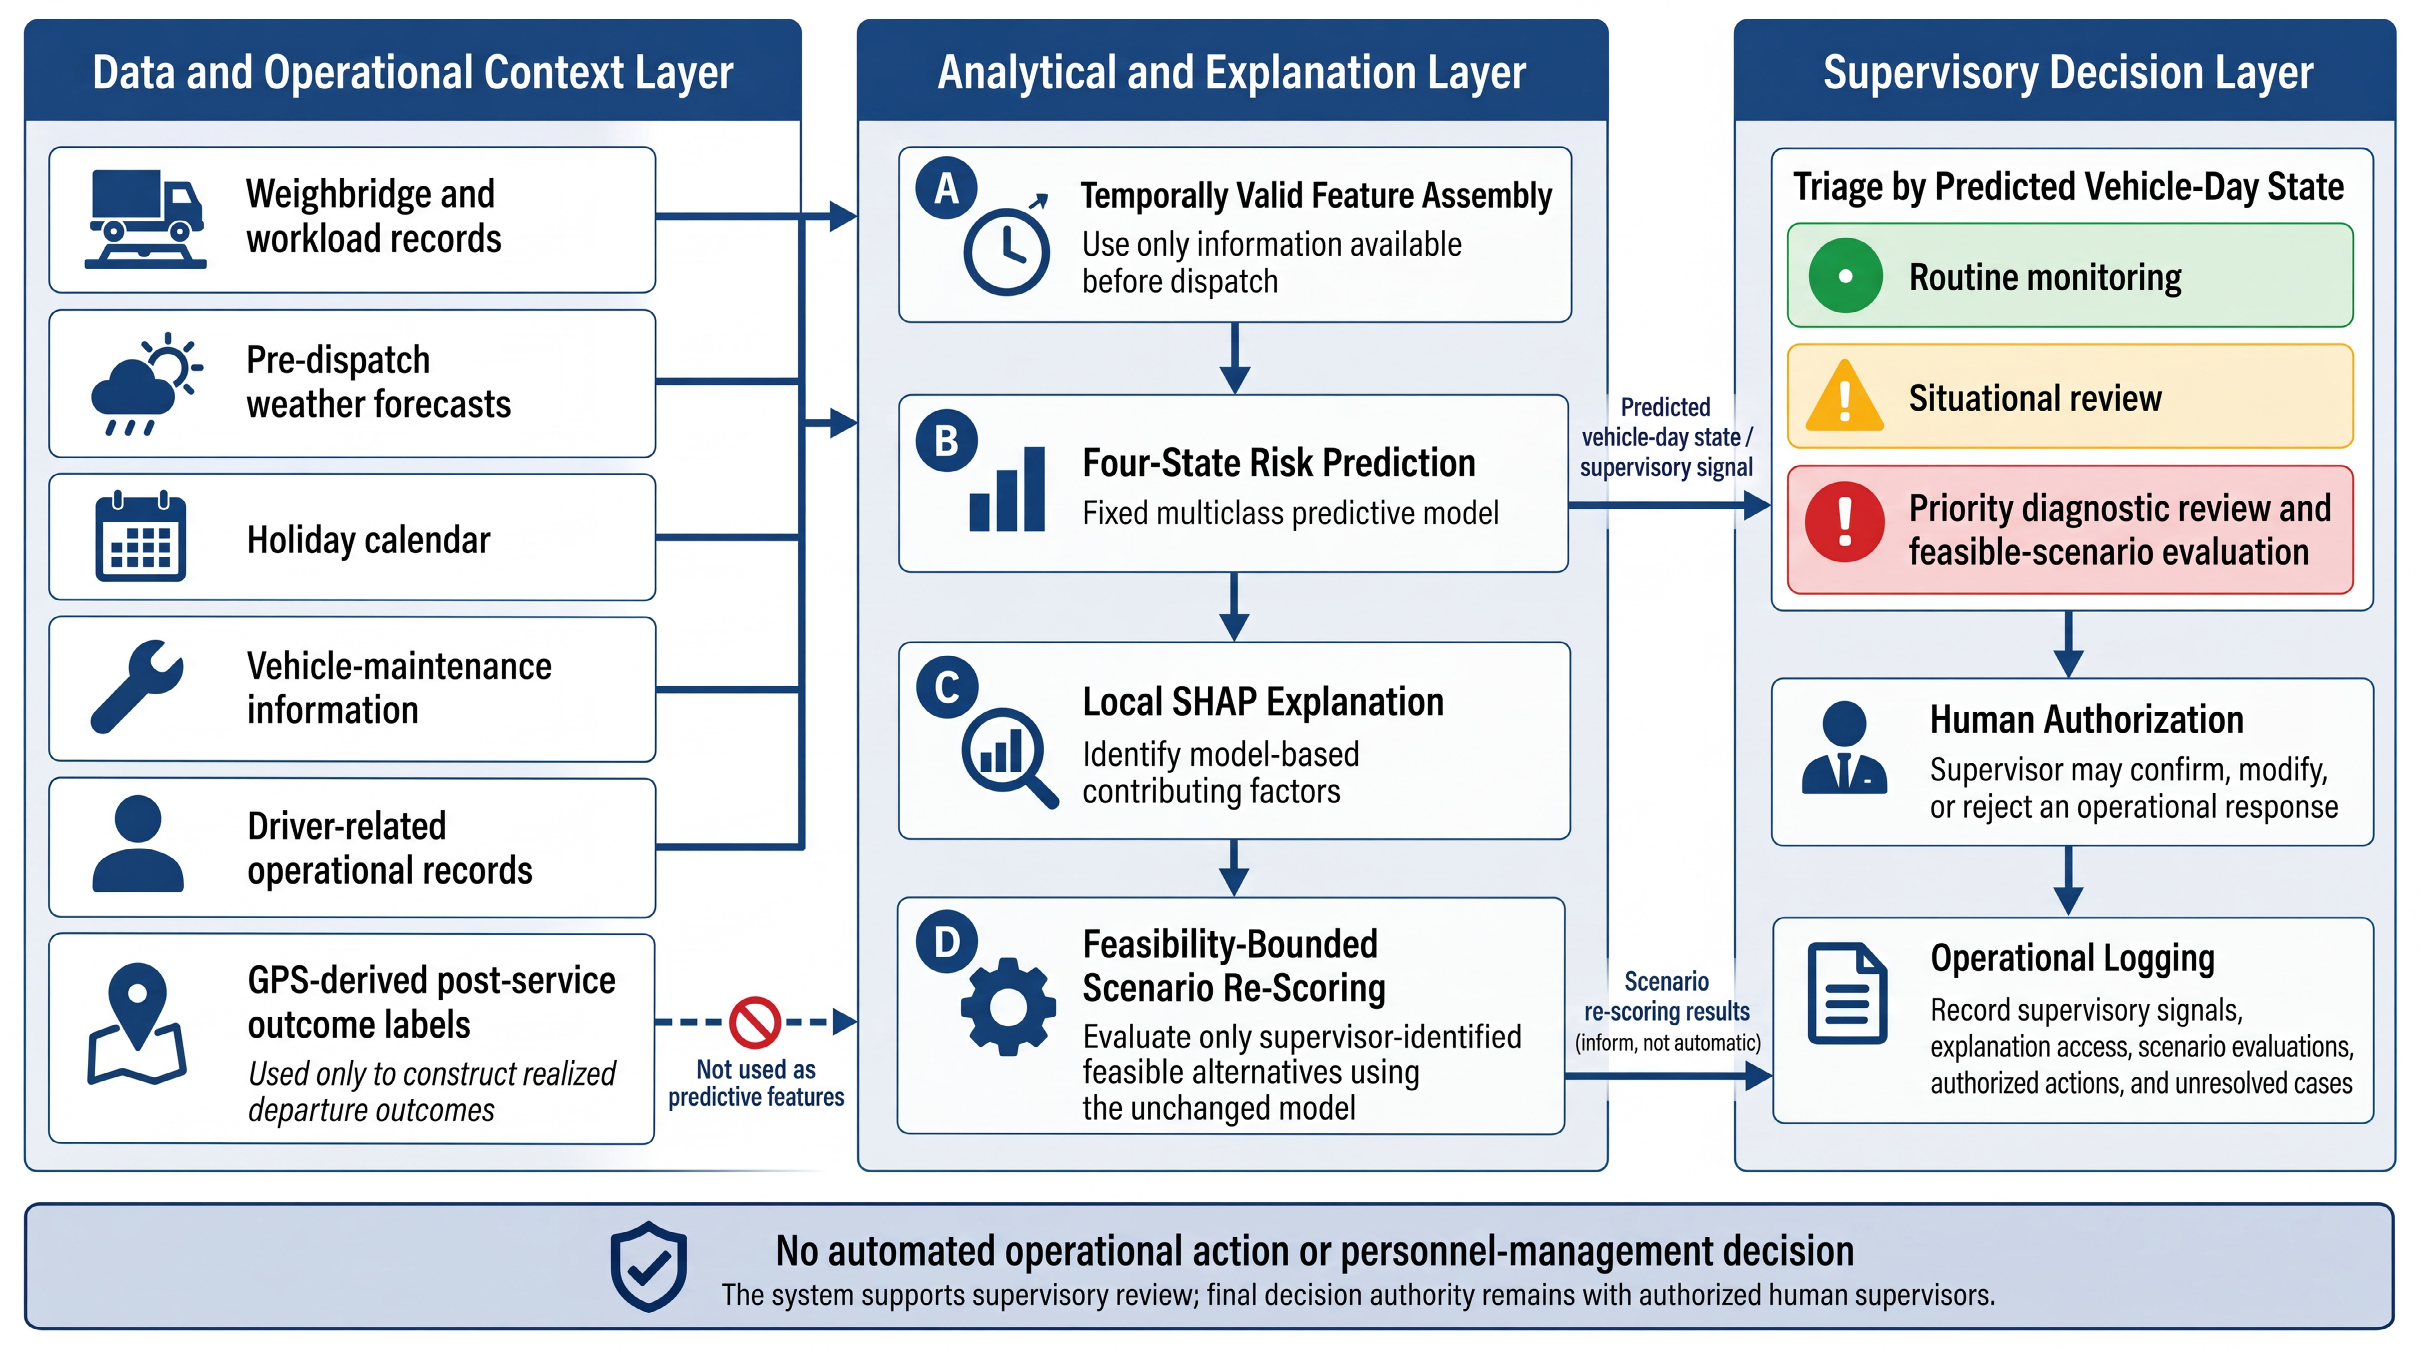
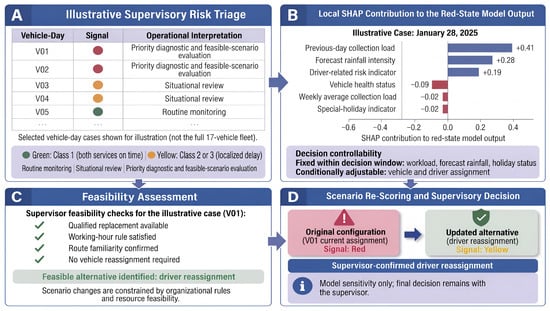
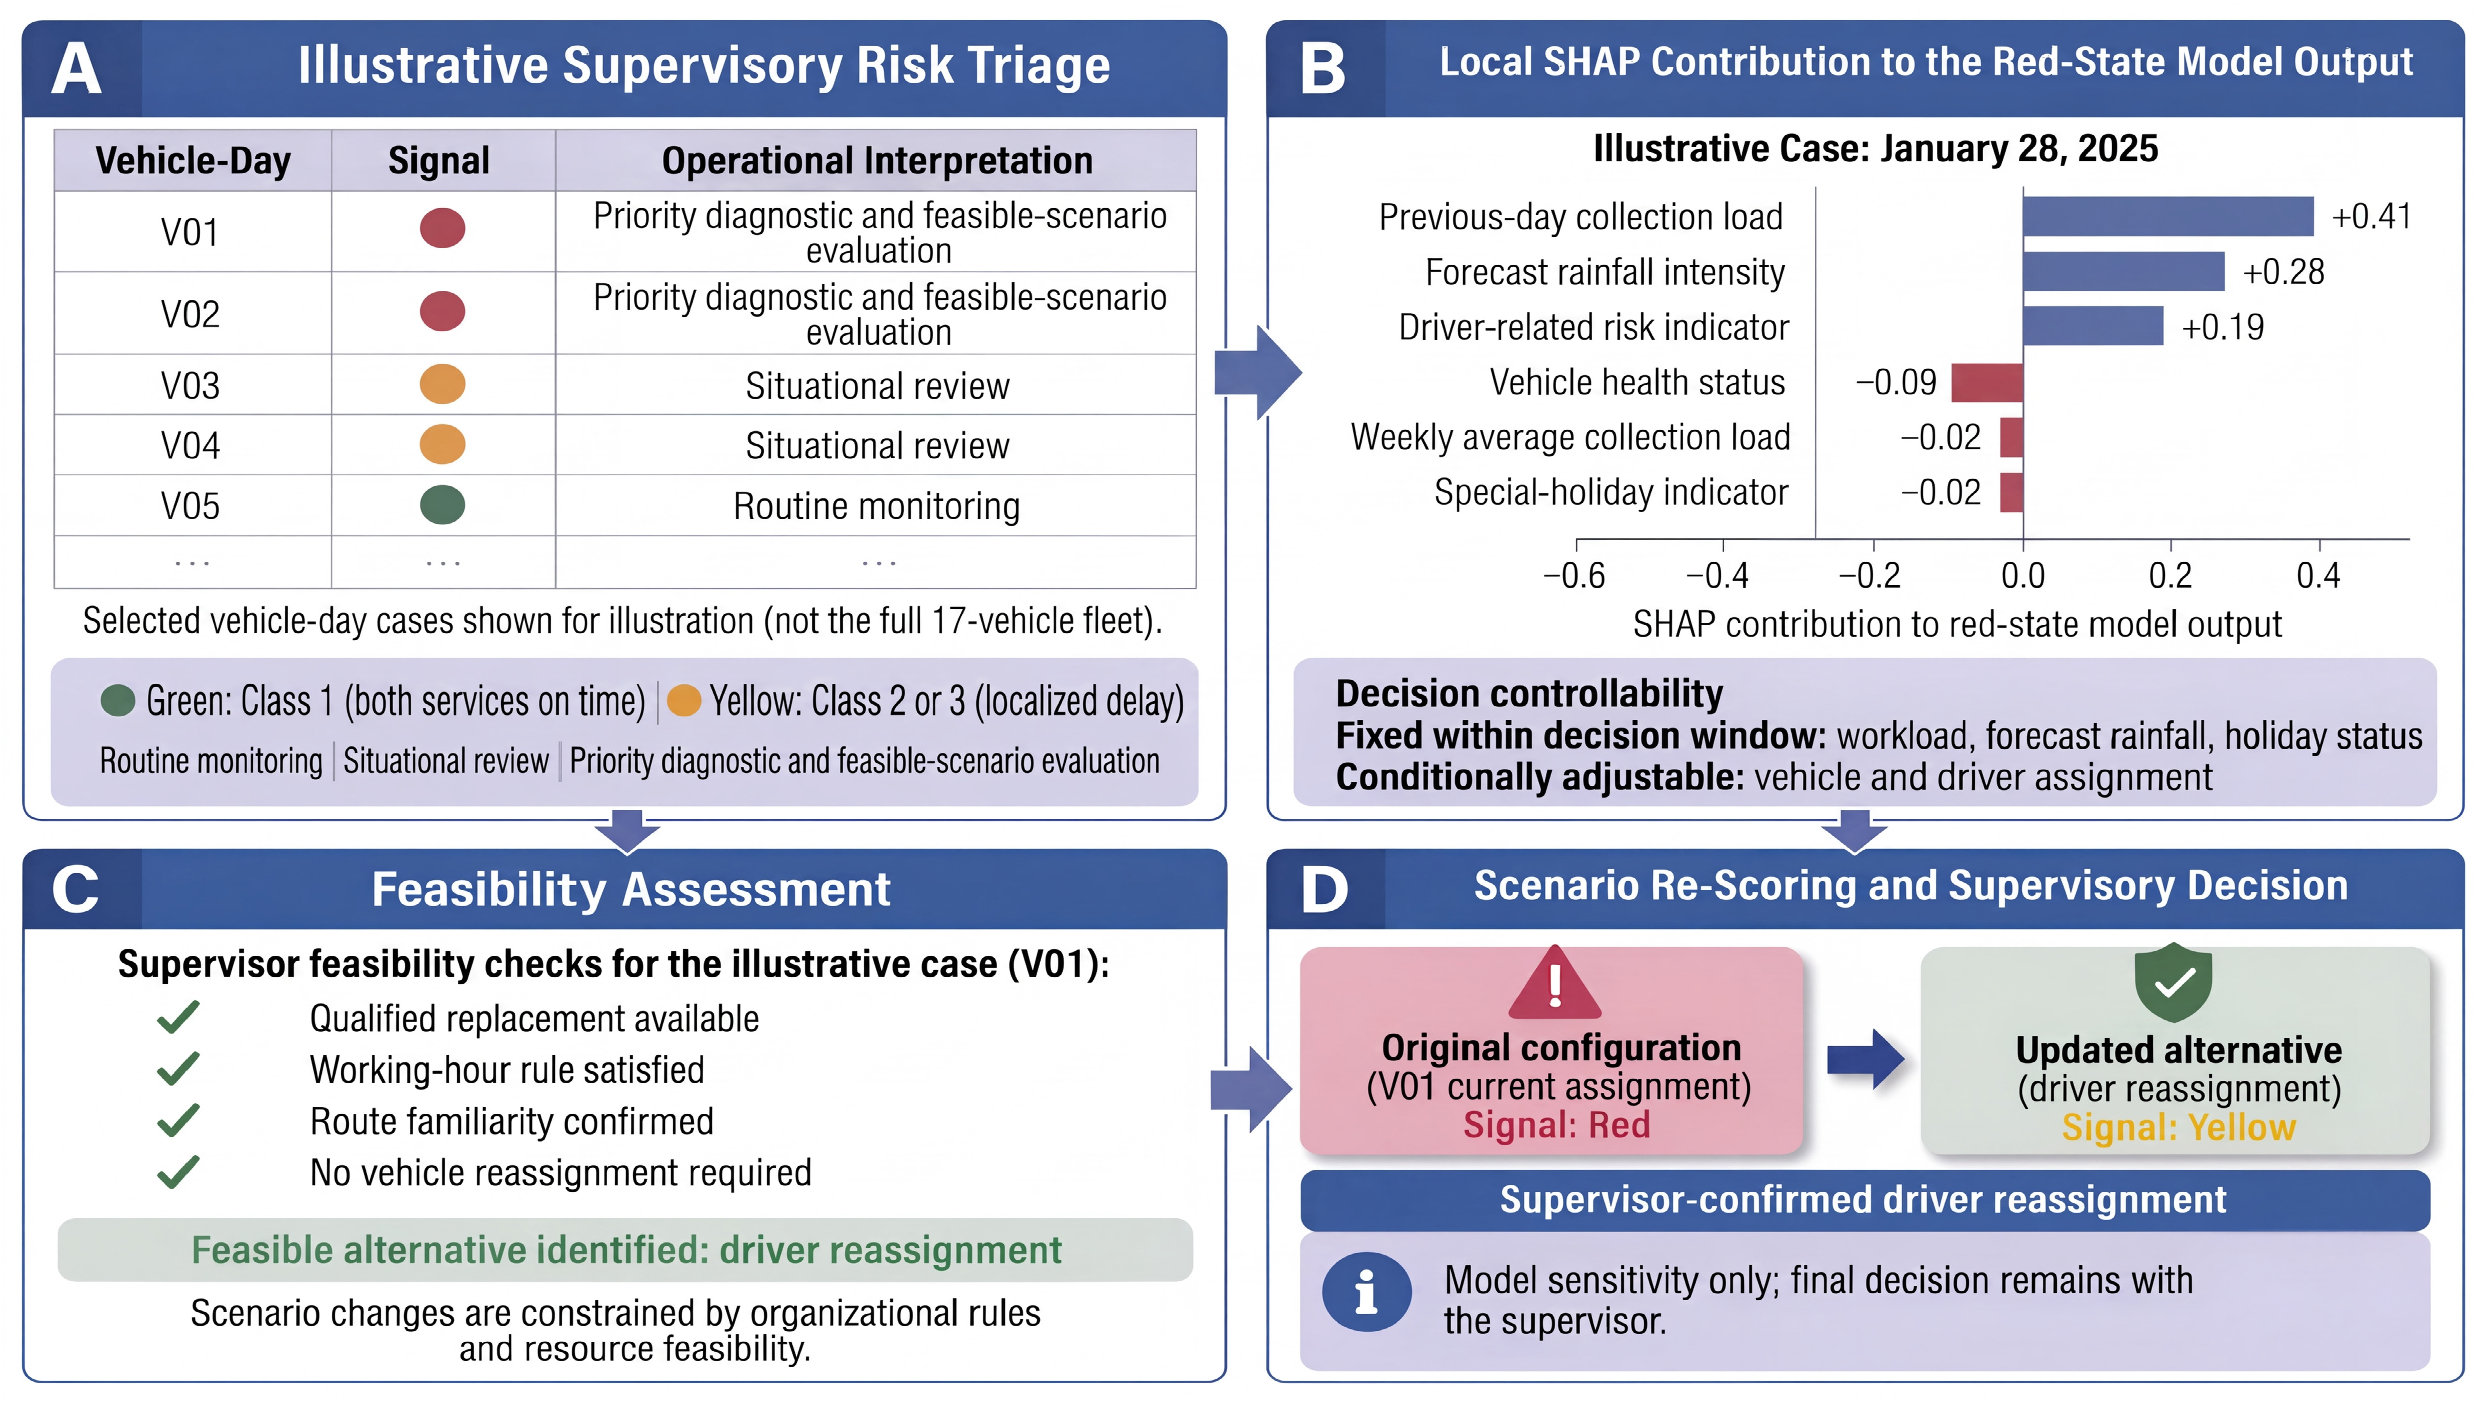

Disclaimer/Publisher’s Note: The statements, opinions and data contained in all publications are solely those of the individual author(s) and contributor(s) and not of MDPI and/or the editor(s). MDPI and/or the editor(s) disclaim responsibility for any injury to people or property resulting from any ideas, methods, instructions or products referred to in the content. |
© 2026 by the authors. Licensee MDPI, Basel, Switzerland. This article is an open access article distributed under the terms and conditions of the Creative Commons Attribution (CC BY) license.