Abstract
Promoting breakthrough innovation is a critical strategy for overcoming technological bottlenecks and addressing “chokepoint” challenges, especially for emerging economies. This paper constructs a two-tier innovation network comprising collaborative R&D and technology transaction subnetworks. Using panel data from Chinese A-share listed companies between 2008 and 2022, we empirically examine the impact of network embeddedness on firm breakthrough innovation in the artificial intelligence industry and explore the moderating effect of enterprise digitalization. The results reveal a U-shaped relationship between embeddedness breadth and breakthrough innovation, and an inverted U-shaped relationship between embeddedness depth and breakthrough innovation. The heterogeneous resource acquisition mediates these nonlinear relationships. As a firm’s digitalization intensity increases, the U-shaped and inverted U-shaped relationships between embeddedness dimensions and breakthrough innovation are significantly amplified. This study deepens our understanding of the mechanisms and boundary conditions by which network embeddedness affects firm innovation and provides new theoretical insights for fostering breakthrough innovation in emerging economies.
1. Introduction
Emerging economies, such as China, are playing an increasingly important role in the global innovation landscape. Amid shifting geopolitical dynamics and the rise of trade protectionism, these economies face growing external barriers and restrictions in critical technological sectors, which threaten the security and resilience of their industrial and supply chains. In this context, breakthrough innovation has become a strategic priority for emerging economies striving to overcome technological bottlenecks and enhance their global competitiveness.
However, breakthrough innovation is inherently uncertain, financially demanding, and requires greater creativity and risk-taking than incremental innovation. Additionally, the rapid advancement and widespread application of digital technology have triggered significant changes in the technological landscape, shifting the innovation model from a one-way linear process to an interconnected innovation framework []. More than relying on the limited information, knowledge, and technology within a single organization is required for breakthrough innovation. The “closed-door” innovation approach has become obsolete. Enterprises must transcend organizational boundaries, implement open innovation strategies, and actively embed themselves within innovation networks []. The rapid rise of Silicon Valley (US) and London’s Tech City (UK) exemplifies the global importance of innovation networks across different national and institutional settings. Thus, the central question for emerging economies is how firms leverage innovation network embeddedness to achieve breakthrough innovation in the digital era.
The literature has extensively debated the role of network embeddedness in fostering breakthrough innovation. On one hand, network embeddedness allows firms to lower transaction costs, access explicit and tacit external knowledge, and enhance learning, thereby facilitating breakthrough innovation []. On the other hand, excessive network embeddedness may lead to resource redundancy, path dependence, or even hinder innovation—a “resource curse” effect [,]. This indicates that network embeddedness can exert both positive and negative effects on innovation, and a nonlinear perspective may better reflect the complexity of this relationship. However, existing studies often oversimplify the relationship by equating network embeddedness with resource acquisition, and there is a lack of in-depth exploration of the mediating and moderating mechanisms, which is the focus of this study. In reality, embedding in a network does not guarantee the automatic flow of external knowledge or technology into the firm []. The critical factor lies in the firm’s capability to effectively access and leverage these external resources, which is pivotal in achieving breakthrough innovation. Breakthrough innovation typically depends on the recombining of diverse types of knowledge or technology [], making heterogeneous resource acquisition a potentially key mediating mechanism between network embeddedness and breakthrough innovation. Furthermore, enterprise digitalization introduces significant opportunities for breakthrough innovation by transforming traditional production, operations, and management modes. Digitalization enhances firms’ ability to access a more comprehensive array of innovative resources, which may moderate the impact of network embeddedness on breakthrough innovation.
China provides an ideal empirical context for this study, given its rapidly advancing digital transformation and proactive industrial policies that have fostered a dynamic innovation ecosystem. This study utilizes large-scale AI-related patent data from China (2008–2022) to construct a two-tier innovation network, which consists of collaborative R&D and technology transfer subnetworks. Based on this, we empirically examine the nonlinear effects and mechanisms of network embeddedness on firms’ breakthrough innovation and further explore the moderating role of enterprise digitalization. Nevertheless, the theoretical mechanisms explored in this study, which link network embeddedness, heterogeneous resource acquisition, and digitalization, are not unique to China. They can also be applied to other technology-intensive or emerging economies with similar innovation characteristics, though caution should be exercised when generalizing to more mature or less dynamic environments.
The main contributions of this study are as follows: First, most existing research approaches enterprise innovation from a single dimension and often overlooks the complexity and multidimensionality of technological innovation. We construct a two-tier innovation network comprising collaborative R&D and technology transfer subnetworks to more accurately describe the innovative relationships between entities. Second, given that breakthrough innovation often stems from challenging and surpassing existing knowledge systems, we refine network embeddedness into two dimensions from the perspective of external knowledge search and empirically examine the nonlinear effects of embeddedness breadth and depth on firms’ breakthrough innovation. Third, we introduce heterogeneous resource acquisition as a mediating variable, applying the “relationship–resource–performance” framework to investigate how network embeddedness influences breakthrough innovation, thus expanding the understanding of the mediation mechanism between these factors. Lastly, considering the rapid advancement and broad application of digital technologies, which have profoundly transformed the internal and external environments of firms, we examine the potential impact of digitalization on firms’ resource dependencies. Specifically, we analyze the moderating effect of enterprise digitalization on the U-shaped relationship between embeddedness breadth and breakthrough innovation and the inverted U-shaped relationship between embeddedness depth and breakthrough innovation.
2. Hypotheses
The resource-based view (RBV) and embeddedness theory, as two complementary paradigms, jointly provide the theoretical framework for this study. The RBV posits that firms achieve competitive advantage by developing and exploiting valuable, rare, and inimitable resources []. However, excessive reliance on firm-specific knowledge and technology often constrains the potential for breakthrough innovation. Embeddedness theory, by contrast, emphasizes that economic activities are embedded within networks of social relationships and therefore cannot be understood in isolation []. Through their embedded positions in such networks, firms gain access to diverse external resources, information, and opportunities that would otherwise be beyond their reach.
Building on these perspectives, this study conceptualizes network embeddedness along two dimensions—breadth and depth. Integrating the RBV with embeddedness theory, we argue that the network embeddedness breadth and depth shape a firm’s capability to access, absorb, and recombine heterogeneous external resources, which in turn fosters breakthrough innovation.
2.1. Network Embedding and Breakthrough Innovation
Embedding breadth refers to the extent of direct connectivity between firms and other entities within the collaborative R&D and technology transfer networks, encompassing the scope of firms’ engagement with diverse external resources. In the early stages of embedding, firms typically seek to access a wide range of external knowledge and resources. However, because organizational attention is limited, broadly searching for external knowledge increases the volume of information that firms must process. Knowledge from different sources often exhibits high heterogeneity and complexity, making it difficult for firms to effectively filter and identify the most valuable insights, which may lead to information overload []. Mishra et al. (2015) [] point out that in R&D networks involving multiple partners, differences in strategic goals, cultural clashes, and disputes over the attribution of outcomes can increase the collaborative burden. Therefore, as the embedding breadth increases, the large volume and high heterogeneity of external information can result in information overload. At this stage, the marginal benefits of information absorption and integration decline, thereby limiting the positive impact of embedding breadth on breakthrough innovation.
However, as embeddedness breadth further expands, enterprises gradually accumulate cross-disciplinary collaborative experience, develop efficient cooperative routines, and build network strategic capabilities, enabling them to better manage and integrate information from different nodes. Enhanced information processing capabilities allow enterprises to focus more effectively on R&D activities, enabling broad network embedding to facilitate breakthrough innovation in the later stages. At this stage, the positive impact of embeddedness breadth on breakthrough innovation gradually increases, with marginal benefits shifting from decreasing to increasing, exhibiting a wave-like learning curve effect. Thus, we propose the following hypothesis:
H1.
There is a U-shaped relationship between a firm’s network embeddedness breadth and breakthrough innovation.
Embeddedness depth reflects the closeness of a firm’s ties with other entities in the innovation network, particularly regarding the intensity of cooperation with specific partners in collaborative R&D and technology transfer. Greater depth indicates that firms establish more profound connections with their partners, which enhances the trust and stability of external relationships []. Such deep engagement reduces information asymmetry and opportunistic behaviors, lowers transaction costs, and fosters a stable external environment conducive to breakthrough innovations. In addition, strong ties enable firms to access more critical knowledge and technology often elusive in more superficial collaborations. Firms can efficiently absorb and integrate these resources through extensive exchanges and cooperation, accelerating innovation.
However, as embeddedness depth continues to increase, the marginal benefit of deepening ties diminishes. Firms may become reluctant to pursue new partnerships due to embedding inertia and behavioral rigidity, leading to path dependence effects []. This path dependence can hinder firms’ adaptability to external changes, negatively impacting their flexibility and innovative capacity. Moreover, when a firm relies too heavily on knowledge or technology from a single source, its knowledge system may become homogenized and lack diversity. This diminishes a firm’s sensitivity to and capacity for absorbing new external knowledge and technology and may also cause the firm to fall into the “familiarity trap” []. In such a scenario, firms may pursue incremental innovations along existing technological pathways while overlooking potentially disruptive technologies or emerging market trends. Firms entrenched in a specific technological trajectory for extended periods often struggle to leap beyond established paradigms and achieve substantial innovations. Thus, we propose the following hypothesis:
H2.
There is an inverted U-shaped relationship between a firm’s network embeddedness depth and breakthrough innovation.
To facilitate a clear comparison of the mechanisms underlying the U-shaped and inverted U-shaped relationships, a summary table is provided in Table A1 in Appendix A.
2.2. Mediating Role of Heterogeneous Resources Acquisition
Heterogeneous resource acquisition refers to the process through which enterprises obtain knowledge or technology resources that differ from their inherent resource endowment, allowing for internal and external resource allocation and integration. This process is crucial for enterprises seeking to achieve breakthrough innovation.
Network embeddedness breadth implies that enterprises establish broader connections with various innovation actors, facilitating the expansion of their external knowledge search, acquiring diverse information and knowledge, and integrating, internalizing, and applying these resources to their R&D processes []. However, in the early stages of network embedding, a firm’s absorptive capacity is limited, making it challenging to effectively convert a large volume of multi-source tacit knowledge into breakthrough innovation outcomes []. As Cohen and Levinthal (1990) [] noted, learning is cumulative, and when new knowledge sources are less related to a firm’s existing knowledge, the difficulty of absorbing new knowledge increases significantly. As the breadth of network embedding continues to increase, the efficiency of absorbing and integrating heterogeneous resources improves, and the positive effect of embeddedness breadth on breakthrough innovation gradually materializes and strengthens.
H3.
Heterogeneous resource acquisition mediates the U-shaped relationship between network embedding breadth and breakthrough innovation.
Network embeddedness depth indicates that firms build trustful and reciprocal relationships with their partners. Through these partnerships, enterprises can discover new markets, customers, and cooperation opportunities, leading to the acquisition of diverse innovation resources []. Moreover, the collaboration between firms and their partners evolves beyond mere transactional relationships based on short-term interests, transforming into long-term strategic partnerships where both parties can share sensitive information, tacit knowledge, and expertise, collectively addressing market challenges and seizing innovation opportunities. Consistent with the previous section’s logic, moderate network embeddedness enhances firms’ access to heterogeneous resources. However, enterprises in situations of excessive network embedding may fall into the resource curse dilemma due to embedding inertia and path dependence, thereby hindering their breakthrough innovation. Hence, we propose the following hypotheses:
H4.
Heterogeneous resource acquisition mediates the inverted U-shaped relationship between network embedding depth and breakthrough innovation.
2.3. Moderating Role of Enterprise Digitalization
Enterprise digitalization is the process through which a company transforms and optimizes its production processes, operational models, and organizational structures by adopting digital technologies, such as big data, cloud computing, blockchain, and the Internet of Things. This transformation aims to enhance operational efficiency, foster innovation, and improve market competitiveness [].
First, enterprise digitalization reduces external communication costs. Digital technologies, with their advantages in information processing, significantly lower communication costs both within and across innovation networks, enabling firms to overcome time and space constraints and enhance connectivity []. This improved connectivity makes the sharing and integration of heterogeneous knowledge more efficient, allowing firms to quickly access innovation information within the network and engage in cross-industry and cross-disciplinary collaborations. As a result, they can expand their access to high-quality technological knowledge and facilitate knowledge spillovers []. Second, enterprise digitalization optimizes internal R&D processes. By leveraging digital tools, firms can streamline internal communication and information transfer processes, fostering inter-departmental synergy, alleviating information asymmetry, and enhancing R&D efficiency []. Digital platforms enable firms to rapidly apply external innovative knowledge to their internal R&D efforts, creating a closed feedback loop for innovation. Furthermore, the adoption of automated systems and collaborative management software simplifies cross-functional collaboration, further accelerating the speed of innovation decision-making. Third, enterprise digitalization reshapes organizational structures. The widespread implementation of digital technologies has facilitated a more efficient division of labor and collaboration within firms. Companies can dismantle inter-departmental and inter-organizational barriers by adopting decentralized and flat structures. This efficient organizational model allows firms to respond more flexibly to external market and technological changes and maximizes the utilization of resources within the innovation network, thereby enhancing innovation capabilities.
In summary, enterprise digitalization moderates the nonlinear link between network embeddedness and breakthrough innovation via multiple mechanisms. Specifically, higher digitalization strengthens the U-shaped relation between network embeddedness breadth and breakthrough innovation by expanding external knowledge inflows, enhancing absorptive capacity, and accelerating heterogeneous knowledge recombination. Similarly, digitalization strengthens the inverted U-shaped relation between network embeddedness depth and breakthrough innovation by enabling real-time collaboration, reducing information asymmetry, and intensifying knowledge integration, allowing firms to gain more innovation benefits at moderate-depth embedding. Hence, we propose the following hypotheses:
H5.
Enterprise digitalization strengthens the U-shaped relationship between network embeddedness breadth and breakthrough innovation.
H6.
Enterprise digitalization strengthens the inverted U-shaped relationship between network embeddedness depth and breakthrough innovation.
The conceptual model of this research is shown in Figure 1.
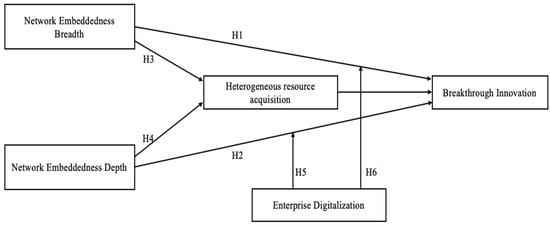
Figure 1.
Conceptual model.
3. Research Methodology
3.1. Data and Sample
To ensure the study’s validity and address potential endogeneity issues, this paper employs a five-year moving window to construct the complex network model [], namely using the patent data from period t–5 to t–1 to construct the network model for period t. Since there were relatively few patent applications in the AI industry before 2003, we constructed the network model for 2008–2022 based on patent data from 2003 to 2021.
First, basic information, operational data, and R&D data for Chinese A-share listed companies were obtained from the China Stock Market & Accounting Research (CSMAR) and Wind Database. The data were processed according to the following steps: (1) excluding companies classified under ST, ST*, and PT categories during the study period; (2) excluding companies in the financial industry; and (3) excluding companies that did not engage in R&D activities during the observation period.
Second, patent data were obtained from the IncoPat Database. We searched using both the current and former names of listed companies, and retrieved patent information by referring to the International Patent Classification (IPC) codes for the artificial intelligence industry as specified in the Reference Table for Strategic Emerging Industries Classification and International Patent Classification (2021) [] issued by the National Intellectual Property Administration of China. The collected data were then further processed by standardizing the names of companies appearing in various patent roles (such as applicants, cited applicants, assignors, assignees, licensors, and licensees) to their current official names, and excluding firms without any patent applications during the study period.
We ultimately identified 1163 listed companies as our sample firms. Geographically, the sample covers all major economic and technological regions in China. Guangdong Province contains the largest number of sample firms, totaling 299 companies (25.71%), which underscores the province’s leading role—particularly that of Shenzhen—in industrial clustering and technological innovation. Beijing ranks second, with 176 firms (15.13%), benefiting from its abundant research resources and robust innovation ecosystem. Jiangsu and Shanghai follow, reflecting the significance of the Yangtze River Delta region in fostering AI development. Zhejiang Province comprises 10.40% of the sample, representing one of China’s most advanced regions in the digital economy and manufacturing. Provinces such as Shandong and Fujian also contribute a notable number of firms to the sample, while other regions, though represented by fewer firms, reflect the broad nationwide presence of AI-related enterprises. Temporally, the sample consists of 9386 firm-year observations spanning from 2008 to 2022. The annual number of observations increased steadily from 221 in 2008 to 534 in 2015 and then accelerated markedly after 2016, reaching 1155 in 2022. This surge corresponds closely with the rapid expansion and policy-driven boom of China’s AI industry in recent years.
3.2. Innovation Network Construction
Innovation network refers to a system of relatively stable formal and informal relationships that an enterprise establishes with other entities (e.g., other enterprises, universities, research institutes, government agencies, etc.) to jointly promote technological innovation and the commercial application of new technologies. We constructed an innovation network based on two primary innovation activities: collaborative R&D and technology transfer. Figure 2 illustrates the specific steps involved in constructing the innovation network. (1) Search Patents: For the study period, retrieve the listed companies’ invention patent application records from the IncoPat Database. (2) Extract Information: Organize critical data such as co-applicant details, citation relationships, licensing information, and transfer information of the patents to determine the nodes, connecting edges, and the weights of the edges in the patent cooperation network (), patent citation network (), patent licensing network (), and patent assignment network (). (3) Coupling Nodes: Couple the patent cooperation network () and the patent citation network (), as well as the patent licensing network () and the patent assignment network (), through shared nodes. (4) Construct Networks: Build the collaborative R&D network () and the technology transfer network () and further integrate these two sub-networks to form the comprehensive collaborative innovation network (G).
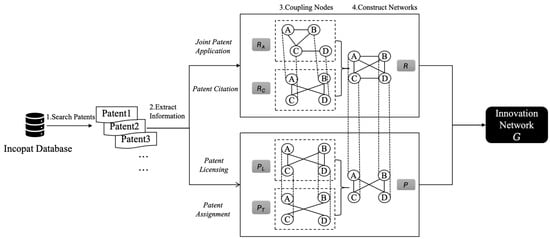
Figure 2.
Innovation network construction process.
3.3. Variables
3.3.1. Dependent Variable
Breakthrough innovation (BI) represents a fundamental departure from existing technological paradigms, introducing entirely new technological trajectories []. Such innovations often spark a series of follow-up advancements, and when subsequent innovators frequently cite these pioneering contributions, it highlights their significance and impact. A patent that receives extensive forward citations indicates that the technical ideas, methods, or designs have substantially influenced subsequent innovations. Hence, the number of forward citations is a crucial indicator of how much a patent contributes to future technological breakthroughs and is widely recognized as an essential measure of breakthrough innovation []. To account for variations in patent citation behavior across different technological fields, we controlled for the technological categories to which the patents belong. Since patents in various fields may differ in their typical citation frequencies, considering these categories enables a more precise assessment of a patent’s breakthrough potential within its specific domain. Additionally, the age of a patent must be considered, as older patents generally have a higher likelihood of being cited []. For this reason, a patent was classified as a breakthrough innovation when its number of forward citations fell within the top 5% of its respective technology category and application year. Consequently, the number of patents ranked in the top citation bracket measured firms’ breakthrough innovations.
3.3.2. Independent Variables
1. Network embeddedness breadth (): The node degree centrality represents the number of connections a node has with other nodes. The formula for calculating degree centrality is as follows:
where represents the enterprise (i.e., network node ), and represents the year. denotes the total number of nodes in the network, while is the network’s adjacency matrix, with as the element in the ith row and jth column. This element indicates whether there is a connection between node and node . If a connection exists, ; otherwise, . A higher node degree implies that the node has a broader embedding in the network, as it is connected to more nodes.
2. Network embeddedness depth (): The node clustering coefficient quantifies the proportion of connections between a node’s neighbors compared to the maximum possible connections. The formula is calculated as follows:
where represents the number of nodes directly connected to node (i.e., the node degree), and denotes the number of actual edges between the neighboring nodes of node . Neighboring nodes are all the nodes directly connected to node . Let the set of neighboring nodes of node be denoted as , then . Here, indicates whether there is a connection between node and node ; if there is a connection, ; otherwise . A high clustering coefficient suggests more interconnections between a node’s neighbors, signifying that the node is more deeply embedded and better connected within its local network.
3.3.3. Mediating Variable
Heterogeneous resource acquisition (RDT): Zhao et al. (2023) [] point out that technological diversity can, to some extent, represent a firm’s capacity to absorb heterogeneous resources. Related technological diversity mainly refers to the distribution of a firm’s patents within the same or similar technological fields, which usually reflects the depth of knowledge accumulation in a particular domain. In contrast, unrelated technological diversity indicates the distribution of a firm’s patents across different technological categories, capturing the breadth of cross-domain acquisition of various types of knowledge resources []. A high degree of unrelated technological diversity implies that a firm is able to embed itself in innovation networks through collaboration, technology introduction, and other channels, thereby incorporating heterogeneous knowledge beyond its original technological trajectory into its existing innovation system. Therefore, we adopted unrelated technological diversity as a proxy variable for heterogeneous resource acquisition.
The International Patent Classification (IPC) code has a hierarchical structure that includes “Section–Class–Subclass–Main Group–Subgroup.” The first three digits of the IPC code represent a major class, and the first four digits represent a subclass. Patents with the same first three digits in their IPC code generally share more related or similar knowledge, whereas those with different three-digit IPC codes tend to be less related. For example, G06K (automatic identification and data processing technology) and G06N (computer systems based on specific computational models) belong to the broader G06 class and share more relevant knowledge. In contrast, G08B focuses on signaling devices or technologies, which are less related to G06K as they fall under different major categories. Therefore, the entropy index of a firm’s technological categories is used to measure the diversity of unrelated technologies. The specific formula is as follows:
where represents the broad technology category (defined by the top 3 digits of the IPC code), is the total number of broad technology categories the company is involved in, and is the ratio of the number of patents held by company in the kth technology category to the total number of patents held by the company. A higher index indicates a wider distribution of the company’s technological fields, suggesting a greater degree of unrelated technological diversification and more extensive access to heterogeneous technological resources.
3.3.4. Moderating Variable
Enterprise digitalization (Digital): This paper employs a text-mining approach based on annual report disclosures, a method that has seen growing adoption in recent literature [,]. First, we systematically reviewed key national-level policy documents related to the digital economy to identify keywords associated with enterprise digitalization. The keyword set covered five major categories: Artificial Intelligence Technologies, Big Data Technologies, Cloud Computing Technologies, Blockchain Technologies, and Digital Technology Applications (see Table A2 in Appendix A). Next, annual reports of the sample firms were collected from the official websites of the Shanghai Stock Exchange and Shenzhen Stock Exchange using a Python crawler (version 3.11.4). Then, the Jieba segmentation tool (version 0.42.1) was used to perform word segmentation on these reports. After segmentation, digitalization-related keywords were selected based on their statistical frequency. Finally, we used the natural logarithm of the keyword frequency plus one as the indicator of enterprise digitalization.
3.3.5. Control Variables
Following Hu et al. (2025) [], we selected the following control variables: (1) R&D investment () was measured by the proportion of the firm’s R&D inputs in its operating revenue. (2) Return on assets () was measured by the ratio of the firm’s net profit to its average total assets. (3) Firm age () was measured by the natural logarithm of (the time of the year minus the time of establishment plus 1). (4) The ratio of cash flow () was measured by the ratio of the firm’s net cash flow from operating activities to its total assets. (5) Assest–liability ratio () was measured by the firm’s liabilities to its total assets. (6) Shareholding concentration (Share) was measured by the shareholding ratio of the largest shareholder. (7) Audit quality () was coded as 1 if the firm is audited by one of the Big Four accounting firms (including PwC, Deloitte, KPMG, or EY). Otherwise, we coded it as 0. Considering the effects of different industries (), provinces (), and years (), we controlled for them by setting dummy variables. Moreover, to minimize the impact of outliers on the regression results, we adjusted the variables by replacing values below the 1st percentile and above the 99th percentile with the respective values at the 1st and 99th percentiles.
3.4. Model Settings
To verify the impact of network embeddedness breadth and depth on breakthrough innovation, the following models were constructed. The subscripts and represent the firm and year, respectively. is the breakthrough innovation of the firm. and stand for the network embeddedness breadth and depth, respectively, and and are the corresponding quadratic terms. is a set of control variables. is the random disturbance.
Further, we tested the mediating effects of the heterogeneous resource acquisition based on the step-by-step test method.
To test the moderating effect of enterprise digitalization, the following moderating effect model was constructed by introducing and its interactive term with network embeddedness.
Referring to Haans et al. (2016) [] on testing the moderating effect in U-shaped and inverted U-shaped relationships, we evaluated the moderating role of enterprise digitalization on the relationship between network embeddedness characteristics and breakthrough innovations through the following three aspects: first, the validity of the moderating effect was tested. If the coefficient of the interaction term between the quadratic term of the independent variable and the moderating variable is significant, it indicates that the moderating effect exists. Second, the impact on the shape of the curve was examined, i.e., whether the moderating variable causes the curve to become flatter or steeper. For a U-shaped (or inverted U-shaped) relationship, the curve becomes steeper if the coefficient of the interaction term is significantly positive (or negative) and flatter if the coefficient is negative (or positive). Third, the shift in the curve’s inflection point was assessed, determining whether the inflection point shifts to the left or right as the moderating variable increases. Taking Equation (10) as an example and omitting control variables, the inflection point value was calculated.
where the inflection point value depends on the value of the moderating variable.
Therefore, when , increases with Digital, indicating that the inflection point shifts to the right. Conversely, the inflection point shifts to the left if this condition is not met.
4. Results
4.1. Descriptive Statistics
Table A3 in Appendix A shows the descriptive statistics and correlations between every two variables in our models. Overall, the correlation coefficients between variables are small, and each variable’s variance inflation factor (VIF) is less than 5, proving there is no serious multicollinearity.
4.2. Benchmark Regression Results
Table 1 reports the results of the impact of network embeddedness breadth and depth on breakthrough innovations. Models 1 and 2 do not contain the control variable, and models 3 and 4 are the benchmark models. To control for unobservable heterogeneity across regions, industries, and years that might influence firms’ innovation activities, we include province, industry, and year fixed effects in all regression models. This setting helps mitigate potential bias arising from regional policy differences, industry-specific technological characteristics, and time-varying macroeconomic shocks.

Table 1.
Results of the benchmark model.
As shown in Model 3, the coefficient for the primary term of network embeddedness breadth is significantly negative, while the coefficient for the quadratic term is significantly positive. This indicates a U-shaped relationship between firms’ network embeddedness breadth and breakthrough innovations, suggesting that H1 has been confirmed. Additionally, the inflection point of the U-shaped curve is 1.203 (inflection point = −[−0.077/(2 × 0.032)]), while the mean value of Breadth is 1.457. This suggests that the network embeddedness breadth for most firms lies on the right side of the inverted U-shaped curve. To illustrate the economic significance of the findings, we estimated the change in breakthrough innovation as network embeddedness breadth increases from the 25th percentile to the turning point. The results show that this increase is associated with a 4.53% decrease in breakthrough innovation output.
As shown in Model 4, the coefficient for the primary term of network embeddedness depth is significantly positive, while the coefficient for the quadratic term is significantly negative. This indicates an inverted U-shaped relationship between firms’ network embeddedness depth and breakthrough innovations, confirming H2. Furthermore, the inflection point of this inverted U-shaped curve is 0.241 (inflection point = −[0.368/(2 × −0.762)]), and the mean value of Depth is 0.214. Most firms are on the left side of the U-shaped curve, suggesting they need to increase their embeddedness depth further to surpass the curve’s inflection point. To illustrate the economic significance of the findings, we estimated the change in breakthrough innovation as network embeddedness depth increased from the 25th percentile to the turning point. The results show that such an increase is associated with an 8.27% rise in breakthrough innovation output.
We followed the rigorous testing procedure outlined by Lind and Mehlum (2010) [] to further validate the nonlinear relationship between network embeddedness and breakthrough innovations. Firstly, the coefficients of the linear and quadratic terms meet the conditions. Secondly, we performed the Utest test in Stata 17.0. The inflection point of the U-shaped curve is 1.269, which falls within the range of Breadth values [0.000, 6.810], satisfying the second condition. The slope on the left side of the inflection point is −0.082, and the slope on the right side is 0.356, both significant at the 1% level, meeting the third condition. Additionally, the overall test of the U-shaped relationship is significant at the 1% level. The inflection point of the inverted U-shaped curve is 0.253, falling within the range of Depth [0.000, 0.693]. The slope on the left side of the inflection point is 0.368, and the slope on the right side is −0.638, also significant at the 1% level. The overall test of the inverted U-shaped relationship is significant at the 1% level. In conclusion, the U-shaped relationship between network embeddedness breadth and breakthrough innovation and the inverted U-shaped relationship between network embeddedness depth and breakthrough innovation were further validated.
4.3. Robustness Tests
1. Alternative measure of the dependent variable: To rule out the impact of measurement error in the dependent variable on the core findings, we re-measured firms’ breakthrough innovation from the perspective of knowledge elements. The creation of new knowledge is regarded as a breakthrough process, with the emergence of new knowledge elements in patents signaling entry into new knowledge domains that can complement the firm’s existing knowledge base. In other words, when a firm files a patent in a previously unexplored technology category, it indicates that the company is experimenting with and exploring new technological areas, thereby creating new knowledge. Following Guan and Liu (2016) [], we defined a patent filed by a firm in period t as a breakthrough innovation if the technological category of the patent (determined by the first four digits of the IPC code) has not appeared in the firm’s patent portfolio from period t–5 to t–1. The breakthrough innovation variable was then aggregated at the firm-year level, with 1 added before taking the natural logarithm. The regression results are presented in Table 2, Models 1 and 2. After using this alternative measure, the coefficients of the quadratic terms for embeddedness breadth remain significantly positive, and the coefficients for embeddedness depth remain significantly negative, thereby supporting the baseline conclusions of this paper.
Table 2.
Result of robustness check.
2. Alternative measure of independent variables: We re-measured firms’ embeddedness breadth and depth by replacing the two indicators: closeness centrality and the ratio of nodes’ weighted degree to degree. Nodes with high closeness centrality have shorter average shortest paths to other nodes, indicating that the firm is positioned centrally within the network, which reflects its network embeddedness breadth. The weighted degree of a node represents the strength of its connections with other nodes, while the node degree reflects the number of connections. The depth of a firm’s network embeddedness—how closely it is connected to other nodes—can be evaluated by calculating the ratio of the weighted degree to the node degree. Models 3 and 4 in Table 2 show that the regression results support the original conclusion and are robust.
3. Excluding high-influence observations: To address concerns that our results might be driven by a small number of outliers or high-influence network nodes, we conducted influence diagnostics using DFBETAS for the nonlinear terms. Observations with DFBETAS above the conventional threshold are identified as high-influence points and excluded from the sample. The regression results, reported in Table 2 (Models 5 and 6), remain robust and consistent with our main findings after removing these high-influence observations, confirming that the identified U-shaped and inverted U-shaped relationships are not an artifact of extreme values.
4. Endogeneity test: Although this paper uses data from period t–5 to t–1 to construct the network model and period t data to measure breakthrough innovations—mitigating the endogeneity issue caused by reverse causality to some extent—there may still be potential endogeneity bias. To deal with endogeneity, we applied the instrumental variable method, propensity score matching, and controls for high-dimensional fixed effects. Table 3 shows the results of the endogeneity test.
Table 3.
Results of the endogeneity test.
Instrumental variable (IV): We used year–industry average network embeddedness characteristics as IV and obtained the results using two-stage least squares (2SLS). The year–industry average network embeddedness characteristics are expected to influence its current network embeddedness breadth and depth without directly affecting its current breakthrough innovations. Therefore, the chosen IV satisfies the critical requirements of relevance and exogeneity. The regression results in Models 1 and 2 are consistent with the baseline regression findings. Additionally, the results of the overidentification and weak instrument tests indicate that the instrumental variables selected in this study are appropriate.
Propensity score matching (PSM): Since firms’ decisions to embed themselves in innovation networks are based on their own characteristics, endogeneity issues may arise from sample self-selection bias. To address this, the paper employs PSM for endogeneity testing. First, the explanatory variables were divided into three groups in descending order, with the group having the highest value assigned a score of 1, while the remaining samples were assigned a score of 0. The covariates used in this process are consistent with the control variables from the baseline regression model. Next, the propensity scores of the sample firms were estimated using a Logit model, and the samples were matched according to a 0.1 standard deviation caliper. Finally, the regression was rerun using the matched data, with the estimation results displayed in Models 3 and 4. The sign and significance of the coefficients remain consistent with the benchmark regression results, confirming the robustness of the findings.
4.4. Mediation Test
Table 4 illustrates the mediation test results using step-by-step regression. Models 1 and 2 test the mechanism of network embeddedness breadth, and Models 3 and 4 test the mechanism of network embeddedness depth.
Table 4.
Results of the mediation effect test.
As for H3, the results in Model 1 demonstrate that the linear term of Breadth is significantly negative, and its quadratic term is significantly positive, indicating a U-shaped relationship between firms’ network embeddedness breadth and the acquisition of the heterogeneous resource. Then, we introduced both Breadth and RDT into Model 2. The result shows that heterogeneous resource acquisition positively contributes to firms’ breakthrough innovations. Furthermore, after introducing the mediating variable, the coefficients for Breadth’s primary and secondary terms retain their original signs. Accordingly, heterogeneous resource acquisition mediates the relationship between embeddedness breadth and breakthrough innovations. Hypothesis 3 is validated and aligns with the results from the benchmark regression.
Similarly, we tested H4. In Model 3, embeddedness depth has an inverted U-shaped impact on heterogeneous resource acquisition. In Model 4, the coefficient of RDT is positive and significant at the 1% level, demonstrating that heterogeneous resource acquisition positively contributes to breakthrough innovation. Moreover, after introducing the mediating variable, the coefficients for Depth’s primary and secondary terms retain their original signs, confirming the mediating effect. This suggests that heterogeneous resource acquisition is how network embeddedness depth influences firms’ breakthrough innovations. Hypothesis 4 is supported.
4.5. Moderation Test
Table 5 shows the results of the moderation test. As shown in Model 1, the coefficient for the interaction term (Breadth2 × Digital) is significantly positive, indicating that the U-shaped curve becomes steeper as enterprise digitalization increases. Additionally, is greater than 0, which suggests that the curve’s inflection point shifts to the right under the influence of enterprise digitalization. Increasing digitalization enhances a firm’s ability to process and integrate large volumes of information, thereby helping it manage and utilize extensive network resources more effectively. In Model 2, the coefficient of Depth2 × Digital is significantly negative, indicating that Digital strengthens the inverted U-shaped relationship between embeddedness breadth and breakthrough innovation. In addition, is less than 0, indicating that the curve’s inflection point shifts to the left due to the moderating effect of enterprise digitalization. The adoption of digital tools, such as real-time communication, virtual collaboration platforms, and intelligent systems, enables firms to quickly adjust their strategies and collaborative approaches, mitigating rigidity and innovation constraints associated with over-reliance on established pathways. In summary, enterprise digitalization positively moderates both the U-shaped relationship between network embedding breadth and breakthrough innovation and the inverted U-shaped relationship between network embedding depth and breakthrough innovation. Hence, H5 and H6 are supported.
Table 5.
Results of the moderation test.
In addition, we plotted the U-shaped relationship between network embeddedness breadth and breakthrough innovation (Figure 3a) and the inverted U-shaped relationship between network embeddedness depth and breakthrough innovation (Figure 3b) at different enterprise digitization levels. All variables are standardized; thus, the predicted values are based on standardized scales. Specifically, as the digitization level of enterprises increases, on the one hand, the negative effect of network embeddedness breadth on breakthrough innovation in the early stage is weakened, while the positive effect of network embeddedness breadth on breakthrough innovation in the late stage is further strengthened; on the other hand, the positive effect of network embeddedness depth on breakthrough innovation in the early stage is strengthened, while the negative effect of network embeddedness depth on breakthrough innovation in the late stage is further weakened.
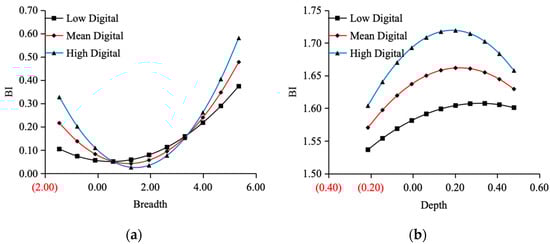
Figure 3.
Marginal effect plots of network embeddedness on breakthrough innovation at different levels of digitalization: (a) effect of network embeddedness breadth on breakthrough innovation; (b) effect of network embeddedness depth on breakthrough innovation.
5. Discussion
First, we reveal the impact of embeddedness breadth and depth on firms’ breakthrough innovations. Shukla et al. (2024) [], investigating collaborative innovation from an alliance portfolio perspective, highlight that a broader alliance portfolio enables firms to acquire non-redundant and novel knowledge, facilitating boundary-crossing and supporting breakthrough innovations. In contrast, portfolio depth may lead firms into a “familiarity trap,” limiting their capacity to process new information and hindering breakthrough innovation. Based on this study, we combined open innovation theory with an external knowledge search perspective, refining network embeddedness into two dimensions, breadth and depth, to examine their nonlinear effects on breakthrough innovation. The findings reveal that embeddedness breadth exhibits a U-shaped relationship with breakthrough innovation, and embeddedness depth demonstrates an inverted U-shaped relationship. This partially corroborates the conclusions drawn by Huang and Wang (2018) [], indicating that weak ties better support breakthrough innovation. Initially, firms embedded in innovation networks gain limited breakthrough innovation benefits from extensive ties due to constraints in management experience and absorptive capacity. However, as embedding breadth expands, the positive effect of weak ties on breakthrough innovation becomes more pronounced. Notably, we do not diminish the value of strong ties. Early in the process, network embeddedness depth is instrumental to breakthrough innovation, especially in fostering trust and reciprocity, transferring tacit knowledge, and effectively mitigating “free-rider” issues [].
Second, this study draws on resource-based theory to investigate the mediating mechanism of network embeddedness on breakthrough innovation. Following the logic of “relationship–resource–performance,” the study examines the influence pathway of “network embeddedness–resource acquisition–breakthrough innovation.” Our findings indicate that heterogeneous resource acquisition positively impacts breakthrough innovation, which means accessing and utilizing external technological knowledge facilitates firms’ breakthrough innovations. This approach, which differentiates heterogeneous from homogeneous resources, significantly expands the understanding of breakthrough innovation antecedents. Moreover, the study finds that heterogeneous resource acquisition mediates the U-shaped effect of network embedding breadth and the inverted U-shaped effect of network embedding depth on breakthrough innovation. This further clarifies why weak ties are more beneficial to breakthrough innovation. A broader network embedding gives firms new perspectives and information due to its diverse knowledge. It lowers the costs of information acquisition, reduces dependency on the network, and enhances independence and flexibility in exploring novel knowledge. Conversely, excessive network embedding depth may restrict firms’ access to heterogeneous resources within innovation networks, potentially impeding breakthrough innovation [].
Third, this study considers enterprise digitalization as a contextual factor, constructing a moderating model that examines how digitalization influences the relationship between network embeddedness characteristics and breakthrough innovation. In a digital context, the effects of network embedding may shift due to significant changes in communication, resource flow, and the R&D processes of innovation entities. However, current research has paid little attention to the impact of digitalization. We identify a positive moderating effect of enterprise digitalization on the U-shaped relationship between embeddedness breadth and breakthrough innovation and the inverted U-shaped relationship between depth and breakthrough innovation. The analysis of this moderating effect underscores the crucial role of digitalization in shaping how network embeddedness translates into breakthrough innovations, enriching the understanding of contextual mechanisms that facilitate firms’ innovation transformation.
6. Conclusions
6.1. Main Research Conclusions
Using data from China’s A-share listed companies from 2008 to 2022, we constructed an innovation network model within the field of AI and empirically investigated the nonlinear effects of network embedding on enterprise breakthrough innovations. The results indicate that embeddedness breadth has a U-shaped effect on breakthrough innovation, and embeddedness depth displays an inverted U-shaped effect on breakthrough innovation. We also confirmed the viewpoint that heterogeneous resource acquisition mediates the nonlinear relationship between network embedding and breakthrough innovation. Specifically, embeddedness breadth and resource acquisition exhibit a U-shaped relationship, while depth and resource acquisition exhibit an inverted U-shaped relationship. Additionally, heterogeneous resource acquisition has a significant impact on enterprise breakthrough innovation. In addition, enterprise digitalization positively moderates these relationships, steepening the U-shaped curve between breadth and breakthrough innovation and the inverted U-shaped curve between depth and breakthrough innovation as digitalization levels rise.
6.2. Practical Implications
Our results also provide directions for managers who wish to achieve their firms’ breakthrough innovation. First, firms should adopt an open innovation strategy, actively integrate into innovation networks, and pursue opportunities to enhance R&D collaboration with other organizations. This includes establishing joint R&D centers, knowledge-sharing platforms, and open innovation platforms. Additionally, engaging in technology trading provides firms access to other technological fields, enabling them to venture into higher value-added domains within the innovation network []. By identifying critical nodes within the technology transaction network and establishing collaborative relationships, enterprises can transform their innovative knowledge into breakthrough innovations.
Second, in the short term, managers can optimize partner portfolios and streamline internal knowledge processes to relieve information overload and accelerate resource absorption. Specifically, firms may prune or expand ties according to the thresholds (for example, adding partners if breadth is below 1.20, or reducing depth if clustering is above 0.24). While expanding network reach, firms should build an effective knowledge management system to ensure organized knowledge absorption and integration. This may reduce information overload and enhance knowledge absorption and processing efficiency within the organization, enabling effective acquisition of heterogeneous resources within the network. In addition, firms should remain mindful of the potential “resource curse” effect of excessive network embedding, even as they benefit from the reduced communication costs and stability of deep cooperative relationships [].
Third, in the medium and long term, enterprises need to develop robust digital and organizational infrastructures that sustain continuous innovation. They should actively adopt and develop big data and digital technologies, integrating these into their existing technological systems. Through digital tools and platforms, they can more accurately identify and access external resources, improving the efficiency of resource integration and utilization. Furthermore, it is crucial for enterprises to build a solid foundation of digital talent by recruiting and nurturing high-end professionals skilled in technology and practical application to support their digital transformation and foster innovative growth.
6.3. Limitations and Future Research
While this study provides valuable insights into the existing literature, several limitations remain and point to future research directions. First, this paper is grounded in the resource-based theory and adopts heterogeneous resource acquisition as a mediating variable. However, the relationship between network embeddedness characteristics and breakthrough innovation may involve multiple pathways. Future research could further explore alternative mediating variables to better capture the diverse mechanisms through which network embeddedness affects the complex innovation process. Second, this study focuses on the artificial intelligence industry. Future research could consider incorporating other industries for comparative analysis. Such an approach would help assess how network embeddedness characteristics influence breakthrough innovation across different industrial contexts. Cross-industry comparisons could not only test the generalizability of the present findings but also reveal industry-specific heterogeneity, thereby providing a theoretical basis for developing targeted innovation strategies. Finally, this study uses patent counts as a proxy for breakthrough innovation, which, although objective and operationally convenient, may not fully capture the quality and actual impact of innovation. Relying solely on patent indicators might overlook breakthroughs in intangible outcomes or non-patented innovations. Future studies could introduce more diverse innovation performance measures to enhance the comprehensiveness and robustness of research conclusions.
Author Contributions
Conceptualization, X.J. and Y.Y.; methodology, Y.Y. and M.Z.; software, Y.Y.; formal analysis, Y.Y.; data curation, Y.Y. and M.Z.; writing—original draft preparation, Y.Y.; writing—review and editing, Y.Y., M.Z., C.C. and Y.L.; supervision, X.J.; funding acquisition, X.J. All authors have read and agreed to the published version of the manuscript.
Funding
This research was funded by the National Social Science Fund of China (Grant number: 23FGLB058), the Shandong Provincial Natural Science Foundation (Grant number: ZR2025QC783), and the Beijing Social Science Fund Decision Consulting Project (Grant number: 24JCB015).
Data Availability Statement
The data are available upon reasonable request.
Conflicts of Interest
The authors declare no conflicts of interest.
Appendix A
Table A1.
Comparison of U-shaped and inverted U-shaped effects.
Table A1.
Comparison of U-shaped and inverted U-shaped effects.
| U-Shaped Effect (Embedding Breadth) | Inverted U-Shaped Effect (Embedding Depth) | |
|---|---|---|
| Positive Mechanism |
|
|
| Negative Mechanism |
|
|
| Nonlinear Mechanism |
|
|
| Practical Implication |
|
|
Table A2.
Digitalization-related keywords.
Table A2.
Digitalization-related keywords.
| Technology Category | Keywords |
|---|---|
| Artificial Intelligence Technologies | Artificial intelligence, business intelligence, image understanding, investment decision support system, intelligent data analysis, intelligent machine vision, machine learning, deep learning, semantic search, biometric technology, facial recognition, speech recognition, identity authentication, autonomous driving, natural language processing |
| Big Data Technologies | Big data, data mining, text mining, data visualization, unstructured data, credit investigation, augmented reality, mixed reality, virtual reality |
| Cloud Computing Technologies | Cloud computing, stream computing, graph computing, in-memory computing, multi-party secure computing, brain-like computing, green computing, cognitive computing, integration architecture, exascale concurrency, petascale storage, Internet of Things, cyber-physical systems |
| Blockchain Technologies | Blockchain, cryptocurrency, distributed computing, privacy-enhancing technologies, smart financial contract |
| Digital Technology Applications | Mobile Internet, Industrial Internet, mobile health, Internet healthcare, e-commerce, mobile payment, third-party payment, NFC payment, smart energy, B2B, B2C, C2B, C2C, O2O, online platform, smart wearables, smart agriculture, smart transportation, smart healthcare, smart customer service, smart home, smart investment advisory, smart decision-making, smart environment, smart grid, smart marketing, digital marketing, unmanned retail, Internet finance, digital finance, Fintech, financial technology, quantitative finance, open banking |
Table A3.
Descriptive statistics and correlations.
Table A3.
Descriptive statistics and correlations.
| Variable | Mean | SD | BI | Breadth | Depth | RDT | Digital | Rdi | Roa | Age | Cashflow | Lev | Share | Big4 |
|---|---|---|---|---|---|---|---|---|---|---|---|---|---|---|
| BI | 0.08 | 0.32 | 1 | |||||||||||
| Breadth | 1.46 | 1.77 | 0.34 *** | 1 | ||||||||||
| Depth | 0.21 | 0.26 | −0.04 *** | 0.41 *** | 1 | |||||||||
| RDT | 0.15 | 0.34 | 0.44 *** | 0.41 *** | 0.01 | 1 | ||||||||
| Digital | 2.19 | 1.60 | 0.17 *** | 0.45 *** | 0.27 *** | 0.20 *** | 1 | |||||||
| Rdi | 8.08 | 7.29 | 0.08 *** | 0.25 *** | 0.09 *** | 0.04 *** | 0.37 *** | 1 | ||||||
| Roa | 0.06 | 0.06 | 0.02 | −0.09 *** | −0.08 *** | 0.02 ** | −0.09 *** | −0.08 *** | 1 | |||||
| Age | 2.81 | 0.37 | 0.04 *** | 0.23 *** | 0.19 *** | 0.10 *** | 0.15 *** | −0.14 *** | −0.14 *** | 1 | ||||
| Cashflow | 0.05 | 0.07 | 0.03 ** | −0.03 *** | −0.02 | 0.03 *** | −0.14 *** | −0.15 *** | 0.46 *** | 0.02 | 1 | |||
| Lev | 0.390 | 0.20 | 0.05 *** | −0.04 *** | −0.08 *** | 0.04 *** | −0.18 *** | −0.40 *** | −0.36 *** | 0.18 *** | −0.06 *** | 1 | ||
| Share | 0.35 | 0.16 | −0.02 * | −0.12 *** | −0.09 *** | 0.00 | −0.29 *** | −0.27 *** | 0.09 *** | −0.08 *** | 0.12 *** | 0.17 *** | 1 | |
| Big4 | 0.09 | 0.28 | 0.10 *** | 0.06 *** | −0.05 *** | 0.11 *** | −0.12 *** | −0.11 *** | 0.02 | 0.01 | 0.12 *** | 0.20 *** | 0.19 *** | 1 |
Notes: ***, **, and * mean p < 0.1, p < 0.05, p < 0.01, respectively.
References
- An, T.; Wei, J.; Jiang, G. Complex Networks-Based Interconnected Innovation in Chinese Enterprises. Soc. Sci. China 2023, 10, 24–43+204–205. [Google Scholar]
- Lu, R.; Zhou, Y.; Ding, Y.; Zhou, D.; Feng, X. Enterprise Innovation Networks: Origin, Evolution and Research Prospects. Manag. World 2021, 37, 217–233+14. [Google Scholar] [CrossRef]
- Wang, Z.; Ling, J.; Chok, J.I. Relational Embeddedness and Disruptive Innovations: The Mediating Role of Absorptive Capacity. J. Eng. Technol. Manag. 2020, 57, 101587. [Google Scholar] [CrossRef]
- Li, D.; Fan, L.; Yang, Z. Can Enterprise Network Embedding Rest Easy: A Research Based on Listed Manufacture Enterprises in China. Nankai Bus. Rev. 2017, 20, 67–82. [Google Scholar]
- Yu, C.; Li, Z.; Lin, C.; Liao, Y. The Impact of Digital Innovation Network Embeddedness on New Product Development Performance of Manufacturing Enterprises. Manag. World 2024, 40, 154–176. [Google Scholar] [CrossRef]
- Tang, T.Y.; Fang, E.; Qualls, W.J. More Is Not Necessarily Better: An Absorptive Capacity Perspective on Network Effects in Open Source Software Development Communities. MIS Q. 2020, 44, 1651–1678. [Google Scholar] [CrossRef]
- Zhou, W.; Li, H. R&D Team Network Configurations, Knowledge Diversity and Breakthrough Innovation: A Combined Effect Framework. Eur. J. Innov. Manag. 2025, 28, 2285–2303. [Google Scholar]
- Barney, J. Firm Resources and Sustained Competitive Advantage. J. Manag. 1991, 17, 99–120. [Google Scholar] [CrossRef]
- Granovetter, M. Economic Action and Social Structure: The Problem of Embeddedness. Am. J. Sociol. 1985, 91, 481–510. [Google Scholar] [CrossRef]
- Li, J.; Li, Y.; Yu, Y.; Yuan, L. Search Broadly or Search Narrowly? Role of Knowledge Search Strategy in Innovation Performance. J. Knowl. Manag. 2019, 23, 809–835. [Google Scholar] [CrossRef]
- Mishra, A.; Chandrasekaran, A.; MacCormack, A. Collaboration in Multi-Partner R&D Projects: The Impact of Partnering Scale and Scope. J. Oper. Manag. 2015, 33–34, 1–14. [Google Scholar] [CrossRef]
- Lyu, Y.; Zhu, Y.; Han, S.; He, B.; Bao, L. Open Innovation and Innovation “Radicalness”—The Moderating Effect of Network Embeddedness. Technol. Soc. 2020, 62, 101292. [Google Scholar] [CrossRef]
- Shi, J.; Fu, H. Enterprises’ Heterogeneity Social Capital and Its Inserted Risk—Empirical Study Based on China’s Economic Transition. China Ind. Econ. 2010, 11, 109–119. [Google Scholar] [CrossRef]
- Zhao, Y.; Qi, N. Centrality, Technical Influence and Firms’ Sustainable Innovation—The Moderating Role of Environmental Responsibility and Corporate Resilience. Manag. Rev. 2023, 35, 105–117. [Google Scholar] [CrossRef]
- Terjesen, S.; Patel, P.C. In Search of Process Innovations: The Role of Search Depth, Search Breadth, and the Industry Environment. J. Manag. 2017, 43, 1421–1446. [Google Scholar] [CrossRef]
- Cohen, W.M.; Levinthal, D.A. Absorptive Capacity: A New Perspective on Learning and Innovation. Adm. Sci. Q. 1990, 35, 128. [Google Scholar] [CrossRef]
- Yang, J.; Ye, Q.; Ge, Z. Direction Matters? How Does Inventor Mobility Network Influence Firm Innovation. Syst. Eng. Theory Pract. 2023, 43, 2863–2876. [Google Scholar]
- Huang, L.; Zhu, H.; Liu, W.; Dou, Y.; Wang, Z.; Cai, L.; Chen, Y.; Liao, X.; Wu, X.; Xie, K.; et al. Enterprise Digital Transformation and Management: Research Framework and Prospect. J. Manag. Sci. 2021, 24, 26–35. [Google Scholar] [CrossRef]
- Lyytinen, K.; Yoo, Y.; Boland, R.J., Jr. Digital Product Innovation within Four Classes of Innovation Networks. Inf. Syst. J. 2016, 26, 47–75. [Google Scholar] [CrossRef]
- Li, S.; Gao, L.; Han, C.; Gupta, B.; Alhalabi, W.; Almakdi, S. Exploring the Effect of Digital Transformation on Firms’ Innovation Performance. J. Innov. Knowl. 2023, 8, 100317. [Google Scholar] [CrossRef]
- An, T.; Wen, R. The Impact Mechanism and Empirical Study of Digital Transformation of Chinese Enterprises on Innovation. Mod. Econ. Res. 2022, 5, 1–14. [Google Scholar] [CrossRef]
- Ba, Z.; Mao, J.; Ma, Y.; Liang, Z. Exploring the Effect of City-Level Collaboration and Knowledge Networks on Innovation: Evidence from Energy Conservation Field. J. Informetr. 2021, 15, 101198. [Google Scholar] [CrossRef]
- China National Intellectual Property Administration. Strategic Emerging Industries Classification and International Patent Classification Reference Table (2021, Trial Version). Available online: https://www.cnipa.gov.cn/art/2021/2/10/art_75_156716.html (accessed on 26 October 2025).
- Ahuja, G.; Lampert, C.M. Entrepreneurship in the Large Corporation: A Longitudinal Study of How Established Firms Create Breakthrough Inventions. Strateg. Manag. J. 2001, 22, 521–543. [Google Scholar] [CrossRef]
- Liu, J.; Chen, Y.; Liang, F.H. The Effects of Digital Economy on Breakthrough Innovations: Evidence from Chinese Listed Companies. Technol. Forecast. Soc. Change 2023, 196, 122866. [Google Scholar] [CrossRef]
- Boschma, R.; Miguelez, E.; Moreno, R.; Ocampo-Corrales, D.B. The Role of Relatedness and Unrelatedness for the Geography of Technological Breakthroughs in Europe. Econ. Geogr. 2023, 99, 117–139. [Google Scholar] [CrossRef]
- Zhao, Y.; Qi, N.; Yan, R.; Meng, Q.; Li, Z. Structural Embeddedness, Absorptive Capacity, and Firms′ Sustainable Innovation: Evidence from an Alliance Innovation Network of High-tech Firms. J. Ind. Eng. Eng. Manag. 2023, 37, 85–98. [Google Scholar]
- Wen, J.; Qualls, W.J.; Zeng, D. To Explore or Exploit: The Influence of Inter-firm R&D Network Diversity and Structural Holes on Innovation Outcomes. Technovation 2021, 100, 102178. [Google Scholar]
- Ning, J.; Jiang, X.; Luo, J. Relationship between Enterprise Digitalization and Green Innovation: A Mediated Moderation Model. J. Innov. Knowl. 2023, 8, 100326. [Google Scholar] [CrossRef]
- Zhuo, C.; Chen, J. Can Digital Transformation Overcome the Enterprise Innovation Dilemma: Effect, Mechanism and Effective Boundary. Technol. Forecast. Soc. Change 2023, 190, 122378. [Google Scholar] [CrossRef]
- Hu, J.; Huo, D.; Wu, D.; Yang, C. The Effect of Corporate Agglomeration Networks on Breakthrough Innovation—Evidence from China. Technol. Forecast. Soc. Change 2025, 212, 123980. [Google Scholar] [CrossRef]
- Haans, R.F.J.; Pieters, C.; He, Z. Thinking about U: Theorizing and Testing U—and Inverted U-shaped Relationships in Strategy Research. Strateg. Manag. J. 2016, 37, 1177–1195. [Google Scholar] [CrossRef]
- Lind, J.T.; Mehlum, H. With or without U? The Appropriate Test for a U-shaped Relationship. Oxf. Bull. Econ. Stat. 2010, 72, 109–118. [Google Scholar] [CrossRef]
- Guan, J.; Liu, N. Exploitative and Exploratory Innovations in Knowledge Network and Collaboration Network: A Patent Analysis in the Technological Field of Nano-Energy. Res. Policy 2016, 45, 97–112. [Google Scholar] [CrossRef]
- Shukla, D.M.; Mital, A.; Qureshi, I. Effects of alliance portfolio breadth and depth on exploratory and exploitative innovation: Evidence from Indian high-tech sectors. J. Bus. Res. 2024, 179, 114686. [Google Scholar] [CrossRef]
- Huang, C.; Wang, Y. Evolution of network relations, enterprise learning, and cluster innovation networks: The case of the Yuyao plastics industry cluster. Technol. Anal. Strateg. Manag. 2018, 30, 158–171. [Google Scholar] [CrossRef]
- Wang, J.; Feng, X. The Impact of Innovation Network Embedding on Enterprise Innovation Performance: Review and Prospect. Sci. Decis. Mak. 2023, 3, 128–140. [Google Scholar]
- Li, X.; Liu, X. The impact of the collaborative innovation network embeddedness on enterprise green innovation performance. Front. Environ. Sci. 2023, 11, 1190697. [Google Scholar] [CrossRef]
- Liu, C.; Jiang, L.; Zhang, J. The Knowledge Spillover Effect of Inter-firm Technology Transfer—Evidence from Patent Transfers. Quant. Econ. Technol. Econ. Res. 2024, 41, 155–177. [Google Scholar] [CrossRef]
Disclaimer/Publisher’s Note: The statements, opinions and data contained in all publications are solely those of the individual author(s) and contributor(s) and not of MDPI and/or the editor(s). MDPI and/or the editor(s) disclaim responsibility for any injury to people or property resulting from any ideas, methods, instructions or products referred to in the content. |
© 2025 by the authors. Licensee MDPI, Basel, Switzerland. This article is an open access article distributed under the terms and conditions of the Creative Commons Attribution (CC BY) license (https://creativecommons.org/licenses/by/4.0/).