


Abstract
Ag-Ti3SiC2 composites are promising electrical contact materials, yet the atomic-scale interfacial behaviour between Ti3SiC2 and Ag remains poorly understood. Here, first-principles calculations were performed to investigate the interfacial stability, electronic structure, and alloying effects at the Ti3SiC2(0001)/Ag(111) interface. Surface-energy calculations for six terminations of Ti3SiC2(0001) show that the TiC(TiC) termination is preferred at low carbon chemical potential, whereas the TiC(TiSi) termination becomes the most stable once ΔμC exceeds −1.50 eV. Eighteen interface models combining the six terminations with three stacking sequences (OT, MT, and HCP) were constructed, and their work of adhesion (Wad) and equilibrium spacing (d0) were determined by the Universal Binding Energy Relation and full structural relaxation. The HCP stacking is preferred for all terminations, and the C(TiC)-terminated HCP interface exhibits the highest work of adhesion among all configurations, with Wad = 9.25 J/m2 at d0 = 1.2 Å; relaxation enhances Wad by 10%–75%. Charge density, charge density difference, and partial density of states analyses reveal that the interfacial bonding is dominated by C 2p-Ag 4d hybridization accompanied by electron transfer from Ag and Ti atoms to the interfacial C atoms, which accounts for the adhesion hierarchy. Substitutional alloying with Cu, Ni, Zn, and Cr preferentially segregates into the interfacial Ag layer, where the defect formation energies, although positive, are the lowest, and Wad increases in the order Cu < Zn < Ni < Cr, reaching 11.0 J/m2 for interfacial Cr, an enhancement of 19% over the pristine interface. The strengthening correlates directly with the filling of the dopant 3d band. These results provide theoretical guidance for the interfacial design of high-performance Ag-Ti3SiC2 electrical contact composites.
1. Introduction
Silver (Ag) and silver-based alloys are widely used as electrical contact materials in switches, relays, and circuit breakers due to their excellent electrical conductivity, thermal conductivity, and oxidation resistance [1,2,3]. With the rapid development of modern electrical equipment and electronic instruments, the requirements for electrical contact materials have become increasingly stringent. In particular, high-power electrical systems require contact materials with a combination of high conductivity, excellent arc erosion resistance, good wear resistance, and stable contact resistance [4,5]. However, pure Ag suffers from low hardness, low mechanical strength, and severe arc erosion during electrical switching operations, which limits its service life and reliability [6,7]. To overcome these drawbacks, various reinforcement phases have been introduced into Ag matrix composites, including oxides (CdO, SnO2, ZnO), carbides (WC, TiC), and refractory metals (W, Mo, Ni) [8,9,10]. Nevertheless, these traditional reinforcements either degrade the electrical conductivity of the Ag matrix or exhibit poor interfacial bonding with Ag, leading to reinforcement shedding and premature failure [11,12]. Therefore, it is imperative to develop novel reinforcement phases that can simultaneously enhance the mechanical and tribological properties of Ag while maintaining its high conductivity.
Ti3SiC2, a representative member of the MAX phase ceramics, has attracted considerable attention as a potential reinforcement phase for Ag-based composites [13,14,15]. The unique layered crystal structure of Ti3SiC2 endows it with a combination of metallic and ceramic properties, such as high electrical conductivity, excellent thermal shock resistance, good machinability, low friction coefficient, and outstanding damage tolerance [16,17,18]. Moreover, the surface-termination chemistry of MAX phases, which also governs the properties of their two-dimensional MXene derivatives, has been recognized as a key factor in the design of MAX/MXene-based composite architectures [19,20]. Recent experimental studies have demonstrated that Ag-Ti3SiC2 composites fabricated by pressureless infiltration exhibit high hardness, high flexural strength, and good wear resistance with a low wear rate of 10−5 mm3/(N·m) [21]. These findings suggest that Ti3SiC2 is a promising candidate reinforcement for high-performance electrical contact materials. Despite the encouraging experimental progress, the fundamental understanding of the interfacial behaviour between Ti3SiC2 and Ag remains limited. In particular, the heterogeneous nucleation mechanism of Ag on the Ti3SiC2 substrate, which governs the solidification microstructure and bonding strength of the composite, has not been elucidated at the atomic scale [22]. The interface stability, wetting behaviour, and the effect of alloying elements on the nucleation process are crucial issues that need to be addressed to guide the rational design of Ag-Ti3SiC2 electrical contact materials [23,24].
First-principles calculations based on density functional theory (DFT) have been proven to be an effective and reliable tool for investigating the atomic-scale interfacial properties, electronic structures, and bonding mechanisms of metal-ceramic systems [25,26,27]. Unlike experimental methods, DFT calculations can provide detailed information on the interfacial atomic arrangements, charge transfer, and orbital hybridization, which are difficult to obtain experimentally [28]. Furthermore, DFT enables the systematic study of alloying element effects on interfacial properties by controlled substitution at specific atomic sites, thereby offering unique insights into the design of optimized interfaces [29,30]. In recent years, several DFT studies have been devoted to the investigation of MAX phase surfaces and interfaces. Orellana and Gutiérrez [31] studied the (0001) surfaces of Ti3SiC2 using DFT and molecular dynamics, concluding that Si- and Ti-terminated surfaces are most stable at low and high temperatures, respectively. Wang et al. [32] investigated the electronic structure and chemical bonding of Ti3SiC2, revealing strong Ti-C covalent bond chains and relatively weaker Ti-Si bonds. Zhou et al. [33] reported the distribution of charge density on the plane of Ti3SiC2, where robust directional Ti-C covalent bond chains were observed. However, these studies primarily focused on the bulk and surface properties of MAX phases, and systematic investigations of Ti3SiC2/Ag interfaces are still lacking.
The addition of trace alloying elements to metal matrix composites has been recognized as an effective strategy to improve interfacial bonding and mechanical properties [34]. Recent DFT studies have demonstrated that alloying elements such as Ti, Zn, Zr, and Al can significantly enhance the interfacial work of adhesion and reduce the contact angle at metal-ceramic interfaces [35,36]. For instance, Zr doping at the Cu/Ni2Si interface increased the work of adhesion from 2.53 J/m2 to 3.20 J/m2 and reduced the contact angle from 98.8° to 86.2°, thereby promoting wetting. Similarly, Cu and Ni additions have been found to strengthen the TiC/Al and TiC/Cu interfaces through enhanced interfacial charge transfer and orbital hybridization [37,38]. These findings suggest that alloying element doping may also be beneficial for the Ti3SiC2/Ag interface. Nevertheless, to the best of our knowledge, no systematic first-principles study has been reported on the interfacial stability and adhesion mechanism of the Ti3SiC2(0001)/Ag(111) interface, nor on the effect of alloying elements (Cu, Ni, Zn, Cr) on the interface stability. In particular, the relationship between the interfacial electronic structure and the adhesion strength remains unclear for this important system. More specifically, the knowledge gap addressed here is threefold: (1) which Ti3SiC2(0001) terminations can form stable, strongly adhering interfaces with Ag(111); (2) how the interfacial electronic structure quantitatively governs the adhesion strength of this system; and (3) whether and how common alloying elements (Cu, Ni, Zn, Cr) can be exploited to further strengthen the interface. Filling this gap requires a systematic, thermodynamically grounded first-principles description that links surface stability, interfacial adhesion, and bonding mechanisms, which is currently still missing for Ag-Ti3SiC2 composites.
In the present work, first-principles calculations were performed to systematically investigate the interfacial stability and bonding mechanism of the Ti3SiC2(0001)/Ag(111) interface. We first determined the stable surface terminations of Ti3SiC2(0001) and calculated the corresponding surface energies, and then constructed multiple interface models with different stacking sequences to identify the most stable interfacial structure based on the work of adhesion. Subsequently, the interfacial bonding mechanism was elucidated through charge density, charge density difference, and partial density of states (PDOS) analyses. In addition, the effects of alloying elements (Cu, Ni, Zn, Cr) on the interfacial stability were systematically investigated. Ultimately, this study aims to provide theoretical guidance for the design and optimization of high-performance Ag-Ti3SiC2 electrical contact materials. By closing this gap, the present study is expected to shift the design of Ag-Ti3SiC2 contact composites from empirical trial-and-error toward mechanism-guided interfacial engineering, thereby supporting the development of electrical contact materials with improved arc-erosion resistance and longer service life.
2. Calculation Method
All first-principles computations were carried out within the framework of density functional theory (DFT) as implemented in the CASTEP code [39,40] (BIOVIA Materials Studio 2020). The on-the-fly generated (OTFG) ultrasoft pseudopotentials [41] were employed to describe the interaction between valence electrons and ionic cores. The generalized gradient approximation (GGA) with the Perdew–Burke–Ernzerhof (PBE) functional [42] was adopted to treat the exchange-correlation energy. The electronic occupations were smoothed using a Gaussian smearing scheme with a width of 0.1 eV, and the self-consistent density was converged with the density-mixing algorithm. The cutoff energy for the plane-wave basis set was set to 500 eV. The Brillouin zone integration was performed using the Monkhorst–Pack k-point mesh [43], with a 9 × 9 × 1 grid for surface and interface calculations and a 9 × 9 × 9 grid for bulk calculations. Geometry optimization was considered converged when the total-energy change per atom fell below 10−5 eV, the maximum residual force below 0.02 eV/Å, the maximum atomic displacement below 5 × 10⁻⁴ Å, and the maximum residual stress below 0.05 GPa. During the relaxation of the surface and interface slabs, the atoms of the two bottom layers of the Ti3SiC2 slab were fixed at their bulk positions to mimic the underlying bulk reservoir, whereas all remaining atoms, including the entire Ag overlayer and the interfacial region, were fully relaxed. Considering the partially filled 3d shells of Cr and Ni, spin-polarized test calculations were additionally performed for the pristine interface and for the Cr- and Ni-doped interfaces: the resulting local magnetic moments were negligible, and the changes in the work of adhesion and in the defect formation energies relative to non-spin-polarized calculations were smaller than 0.1 J/m2 and 0.05 eV, respectively. The results reported below were therefore obtained without spin polarization. The valence electron configurations considered were Ti 3p63d24s2, Si 3s23p2, C 2s22p2, Ag 4d105s1, Cu 3d104s1, Ni 3d84s2, Zn 3d104s2, and Cr 3d54s1.
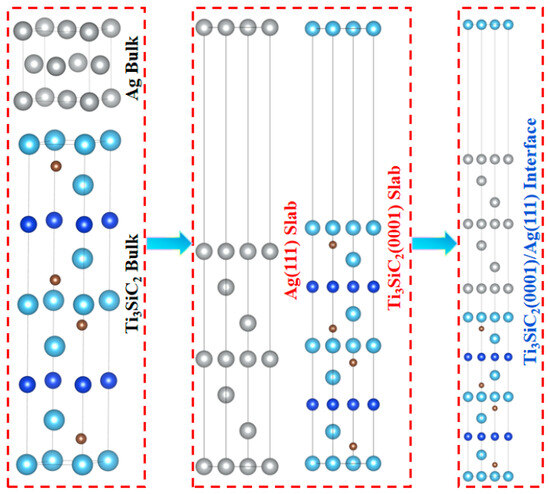
To avoid artificial electrostatic interactions between periodic images, a vacuum layer of 15 Å was inserted perpendicular to the surface and interface models, and a dipole correction was applied to cancel the artificial electric field caused by the asymmetric slab [44]. Before investigating the interfacial properties, the bulk structures of Ti3SiC2 and Ag were optimized to validate the computational parameters. The calculated lattice parameters of Ti3SiC2 and Ag bulks are in excellent agreement with experimental values and other DFT calculations [45,46,47,48], as summarized in Table 1. The bulk modulus of Ti3SiC2 was calculated to be 186.3 GPa, close to the experimental value of 184 GPa [49]. These validations confirm the reliability of the present computational approach. In addition to these geometric benchmarks, the adopted GGA-PBE level of theory has repeatedly been shown to provide reliable energetics and electronic structures for closely related noble-metal/ceramic systems: PBE calculations on the Ag(111)/TiC(111) interface [50] and on the Ti3AlC2/Ag interface yielded works of adhesion, interfacial spacings, and charge-transfer characteristics that are consistent with available experimental wetting and bonding observations. Moreover, since the adhesion hierarchies established below result from systematic comparisons among identically constructed models, the systematic errors of the function largely cancel, and the predicted trends are therefore expected to be reliable even where absolute values carry the usual GGA-level uncertainty. The crystal structures of the bulk phases, the surface slabs, and the interface models are shown in Figure 1.
Table 1.
Calculated and reported lattice constants and volume of the Ti3SiC2 and Ag bulk.
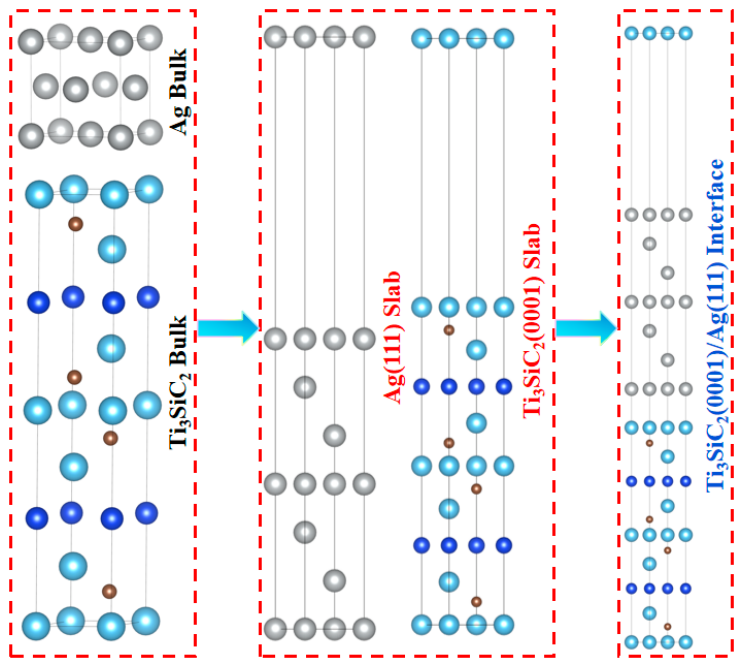
Figure 1.
The crystal structure of the bulk of Ti3SiC2 and Ag, the surface of the Ti3SiC2(0001) slab and Ag(111) slab, and the interface of the Ti3SiC2(0001)/Ag(111) interface.
As can be observed from Figure 1, the bulk MAX phase Ti3SiC2 exhibits a symmetric atomic arrangement, with the symmetry centre precisely located at the Si atomic sites. To ascertain whether the internal stacking sequence of the bulk phase introduces perturbations into the interfacial simulation, it is imperative to construct an appropriate slab model that faithfully captures the intrinsic structural characteristics of the bulk phase prior to the interfacial assembly. A larger number of atomic layers and an increased vacuum spacing would inevitably prolong the computational cost; therefore, the bulk Ti3SiC2 was cleaved along the (0001) crystallographic orientation while preserving the periodic boundary conditions, so as to identify the minimum slab thickness required for an adequate representation of the bulk properties. The truncation inevitably disrupts the stability of the original atomic configuration, necessitating a full geometry optimization of the surface model to attain a converged equilibrium structure. During the optimization process, the atomic positions undergo minor displacements and gradually relax toward their equilibrium states. By systematically increasing the number of atomic layers in the Ti3SiC2 surface model and comparing the interlayer spacings before and after structural relaxation, the optimal slab thickness can be unambiguously determined. Systematic convergence tests were performed to select the model parameters. With a seven-layer Ag(111) slab, a 15 Å vacuum layer, a 9 × 9 × 1 k-point mesh, and a 500 eV cutoff energy, the surface energies and the work of adhesion of the representative C(TiC)-HCP interface were converged to within 0.1 J/m2; further increasing the number of Ti3SiC2 atomic layers, enlarging the vacuum layer to 20 Å, refining the k-point mesh to 12 × 12 × 1, or raising the cutoff energy to 550 eV changed the work of adhesion by less than 0.1 J/m2.
3. Results and Discussion
3.1. Surface Properties
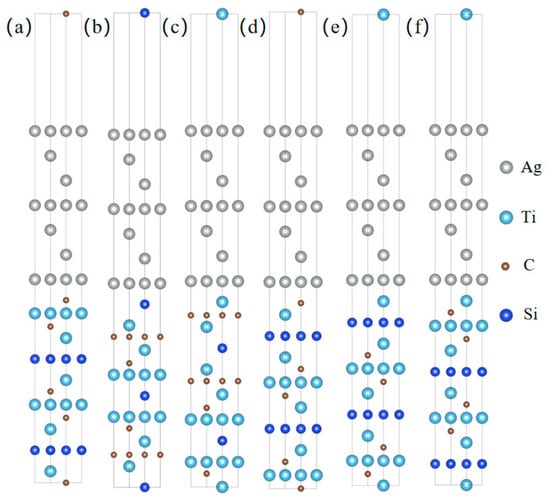
The surface energy is a critical parameter that determines the stability of different surface terminations and affects the interfacial bonding behaviour [51]. For the Ti3SiC2(0001) surface, six possible terminations were considered: TiSi-terminated slab, TiC(TiSi)-terminated slab, TiC(TiC)-terminated slab, C(TiSi)-terminated slab, C(TiC)-terminated slab, and Si-terminated slab, as shown in Figure 2.
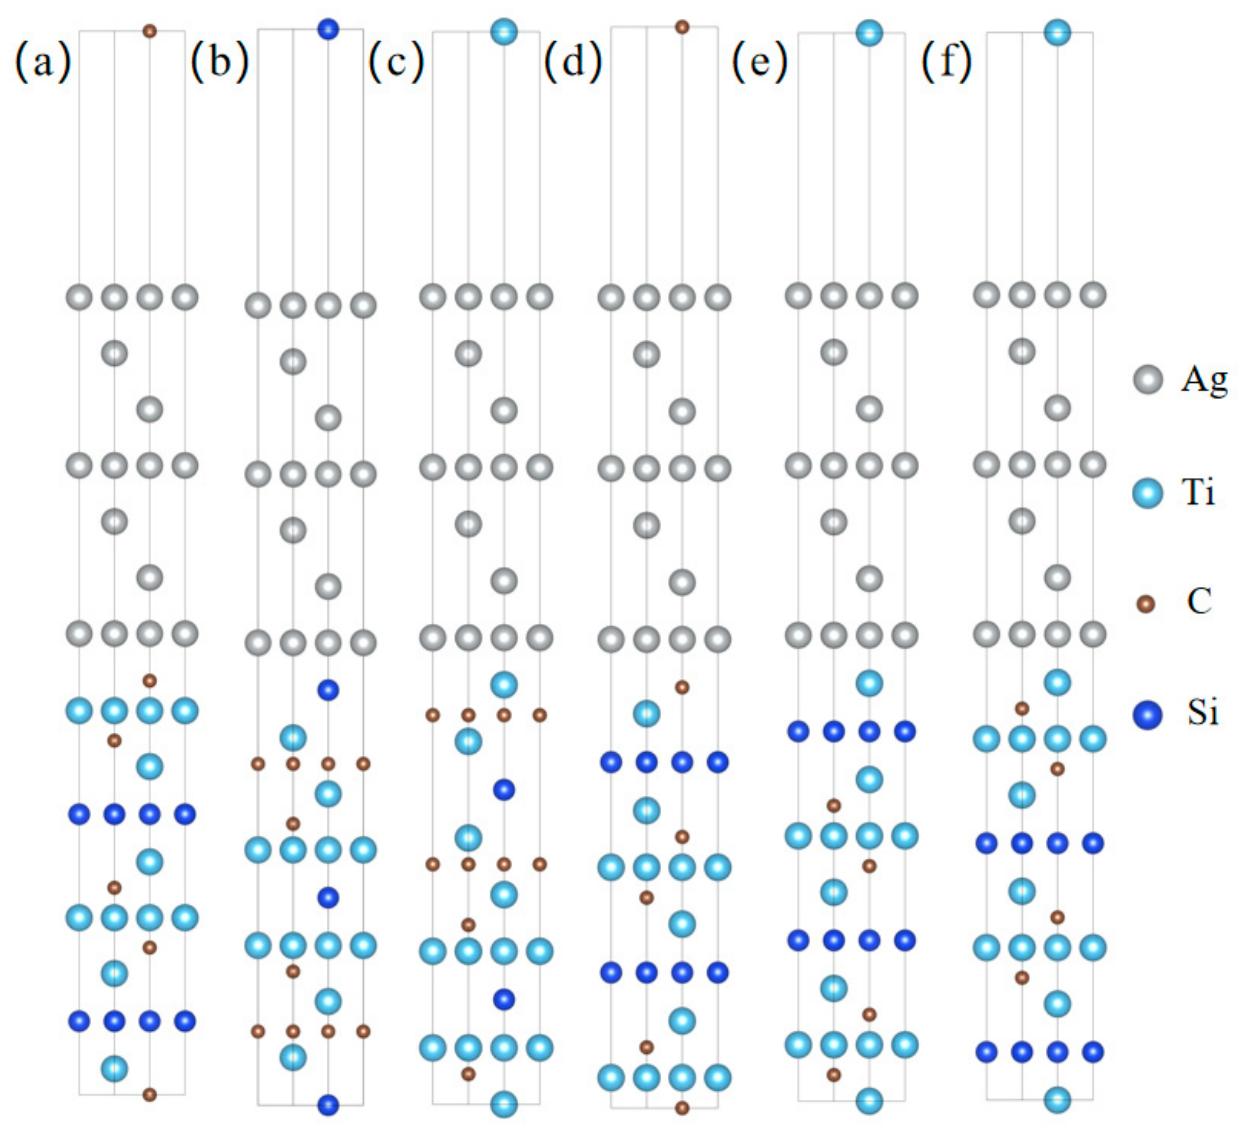
Figure 2.
Schematic diagram of Ti3SiC2(0001) surface of different terminations (a) C(TiC); (b) Si; (c) TiC(TiSi); (d) C(TiSi); (e) TiSi; (f) TiC(TiC).
To quantitatively assess how different terminal groups influence the structural stability of the Ti3SiC2(0001) surface, computations and comparative analyses must focus on its surface energy. This energetic quantity directly indicates the relative stability among distinct surface terminations: a lower value corresponds to a thermodynamically more favourable configuration. Under the symmetric slab framework adopted here, the surface energy is derived using the equation from reference [50].
For our simulations, the term Eslab represents the total energetic magnitude of a completely relaxed Ti3SiC2 surface slab. The chemical potentials for Ti, Si, and C atoms inside this slab are denoted , and , respectively. Meanwhile, NTi, NSi and NC refer to the respective atom counts of these elements in the same slab model, with A standing for the surface area. Because the simulation is performed at 0 K under ground-state conditions, contributions from the PV and TS terms are negligible. In this system, an individual atom’s chemical potential equals that of the corresponding bulk phase. Therefore, the chemical potential together with the surface energy for bulk Ti3SiC2 can be written as follows:
Therefore, the surface energy equation can be finally written as follows:
When considering a thermodynamically stable configuration of the Ti3SiC2 surface, the chemical potential of each atomic species should remain below its corresponding elemental reference value; violating this condition renders the slab unstable. Hence, the relations ≤ , ≤ , and ≤ collectively constitute the necessary criteria for achieving a stable surface.
From the preceding expressions:
Thus
The formation enthalpy of bulk Ti3SiC2 is −5.29 eV in previous first-principles research [31]. Thus,
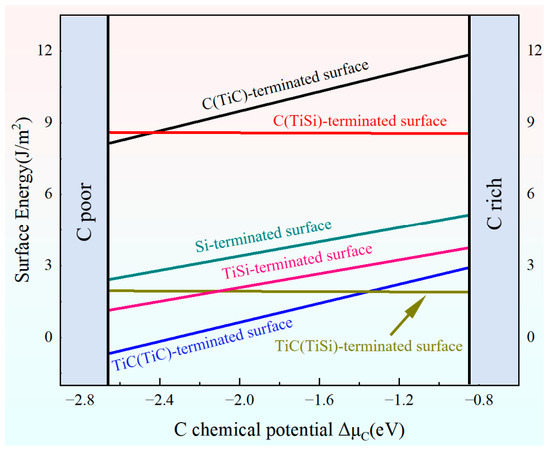
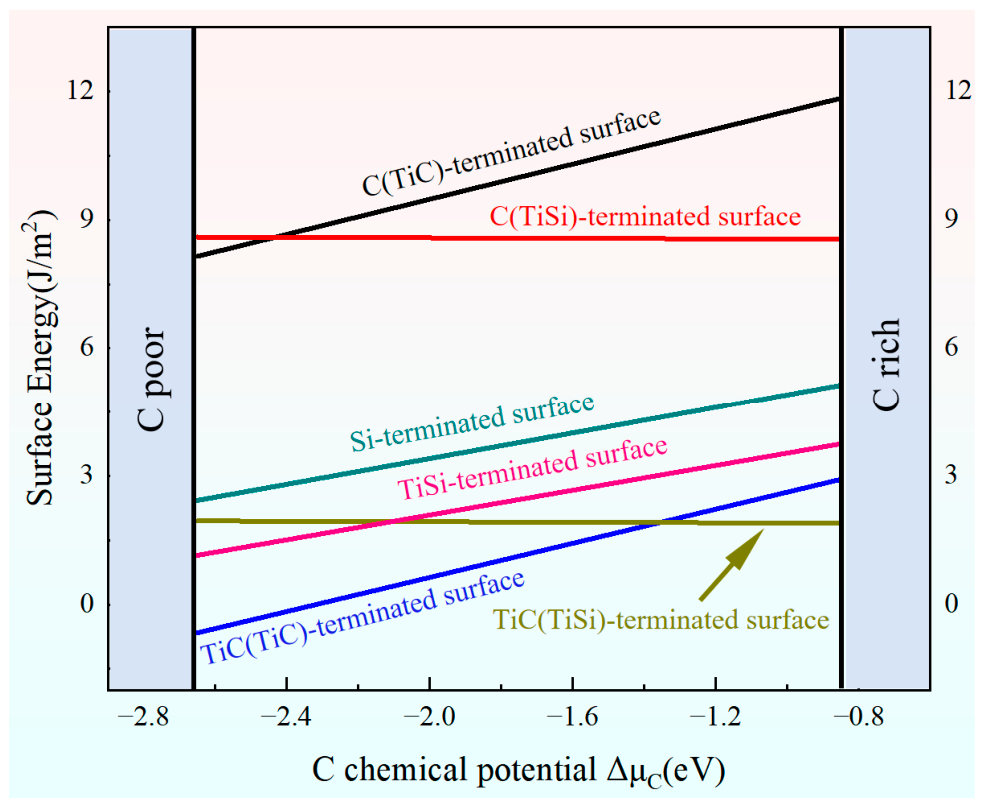
For the polar Ti3SiC2(0001) termination, the computed surface energy depends strongly on the carbon chemical potential (). Figure 3 illustrates that a high corresponds to a carbon-rich regime, whereas a low reflects a carbon-poor environment. As shown in the figure, the surface energy of this polar facet varies linearly with . To illustrate, consider the C(TiC)-, TiC(TiC)-, TiSi-, and Si-terminated slabs: their surface energies rise linearly as increases. By contrast, the C(TiSi) and TiC(TiSi) terminations exhibit almost no variation in surface energy with changing . Under carbon-rich conditions, the TiSi, Si, C(TiSi), and TiC(TiSi) terminations display comparable surface energies, suggesting that these four configurations can co-exist. At low values, the TiC(TiC) termination yields the smallest surface energy, making it the thermodynamically preferred structure. Nevertheless, as μC rises, the surface energy of this termination gradually increases; once exceeds −1.50 eV, the TiC(TiSi) termination becomes the most stable. Notably, across the entire μC range examined here, both the C(TiC) and C(TiSi) terminations consistently show higher surface energies than all other slabs, indicating that they are the least stable options. It should be noted that the chemical-potential window adopted above mainly guards against the precipitation of elemental phases. In practice, the accessible ranges of ΔμTi and ΔμC are further bounded by competing compounds in the Ti-Si-C system, such as TiC, SiC, and TiSi2; incorporating these additional constraints would narrow the accessible window but would not change the slopes of the surface-energy lines, which are fixed by the termination stoichiometry, and would therefore not alter the relative stability ordering reported here. Likewise, Figure 3 corresponds to the representative cross-section at ΔμTi = 0 of the full two-dimensional stability domain; other cross-sections exhibit the same qualitative termination preferences. A fully quantitative mapping of the stability domain including all competing phases, together with interface-energy calculations incorporating the relevant chemical potentials, will be pursued in future work.
Figure 3.
The surface energy of Ti3SiC2(0001) as a function of when [17].
3.2. Interface Models and Stability
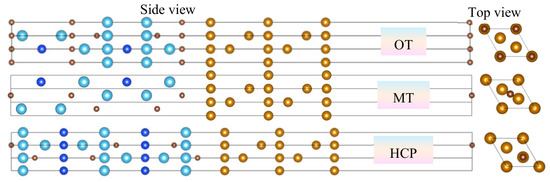
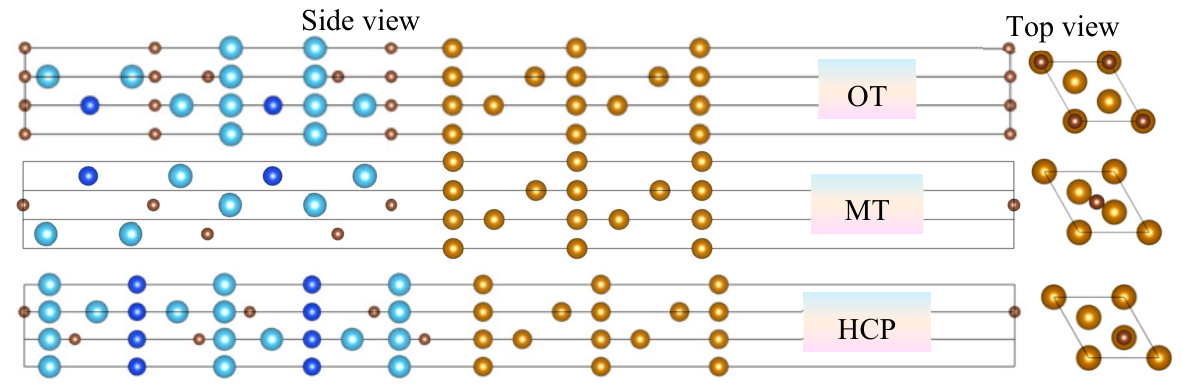
Based on the convergence tests described in Section 2, the interface models were constructed by stacking the differently terminated Ti3SiC2(0001) surfaces onto a seven-layer Ag(111) slab. A vacuum layer of 15 Å was then placed atop the resulting supercell to eliminate spurious interactions between periodic images. Three high-symmetry stacking arrangements were considered for the Ti3SiC2(0001)/Ag(111) system according to the lateral registry between the two surfaces, yielding eighteen interfacial configurations for subsequent characterization. In Figure 4, the three high-symmetry stacking sites are labelled: OT denotes the configuration in which a Ti3SiC2(0001) surface atom lies directly above an Ag atom; MT corresponds to the bridge site at the midpoint of two adjacent Ag atoms; and HCP represents the three-fold hollow site at the centre of three adjacent Ag atoms. Figure 4 shows the three typical interface stacking configurations. The Ti3SiC2(0001) and Ag(111) slabs were combined in a 1 × 1 lateral registry; using the optimized in-plane lattice parameter of Ti3SiC2(0001) (3.071 Å) and the nearest-neighbour spacing of the Ag(111) surface (2.889 Å), this construction corresponds to an in-plane lattice mismatch of approximately 6.3%. The coherent interface was built by laterally straining the Ag(111) slab to the in-plane lattice of the Ti3SiC2(0001) substrate, and the associated strain energy is consistently included in the reported work of adhesion.
Figure 4.
Schematic diagram of three classical interface stacking methods from top and side views [17].
The work of adhesion (Wad) characterizes the bonding strength of the Ti3SiC2(0001)/Ag(111) interface. Specifically, Wad is defined as the minimum work required to separate the interface into two free surfaces, and this quantity is positively related to the interfacial bond strength. The corresponding calculation formula is given as follows [52,53]:
where EAg, , and are the total energies of the Ag(111) surface, Ti3SiC2(0001) surface, and Ag(111)/Ti3SiC2(0001) interface, respectively. And A represents the interface area.
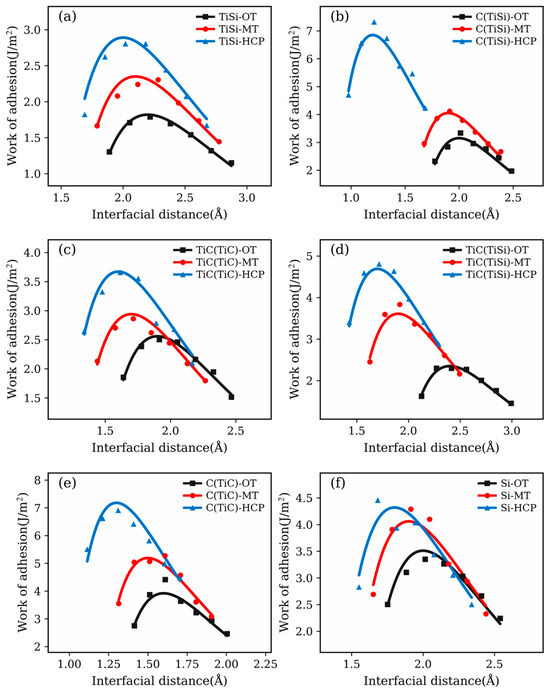
To reduce the computational cost, the equilibrium interfacial spacing was determined for all interface models using the Universal Binding Energy Relation (UBER) method prior to full structural relaxation. The workflow consisted of four steps. First, a series of atomic configurations with varying initial interface separations (d0) was constructed, and the total energy of each configuration was computed with the atomic positions fixed. Second, the work of adhesion (Wad) at every separation distance was evaluated using the adhesion-energy expression above. Third, the Wad-d0 curves were generated, as presented in Figure 5. Finally, the equilibrium distance was identified by applying the energy-minimization criterion. Specifically, the computed Wad(d) data of each configuration were least-squares fitted to the UBER expression [50,51]:
where W0 is the equilibrium work of adhesion, d0 the equilibrium separation, and λ a screening-length parameter. It is emphasized that these curves correspond to rigid, unrelaxed slabs evaluated at fixed separations, whereas the relaxed values reported in Table 2 were obtained subsequently by full structural relaxation starting from the UBER equilibrium spacing.
Figure 5.
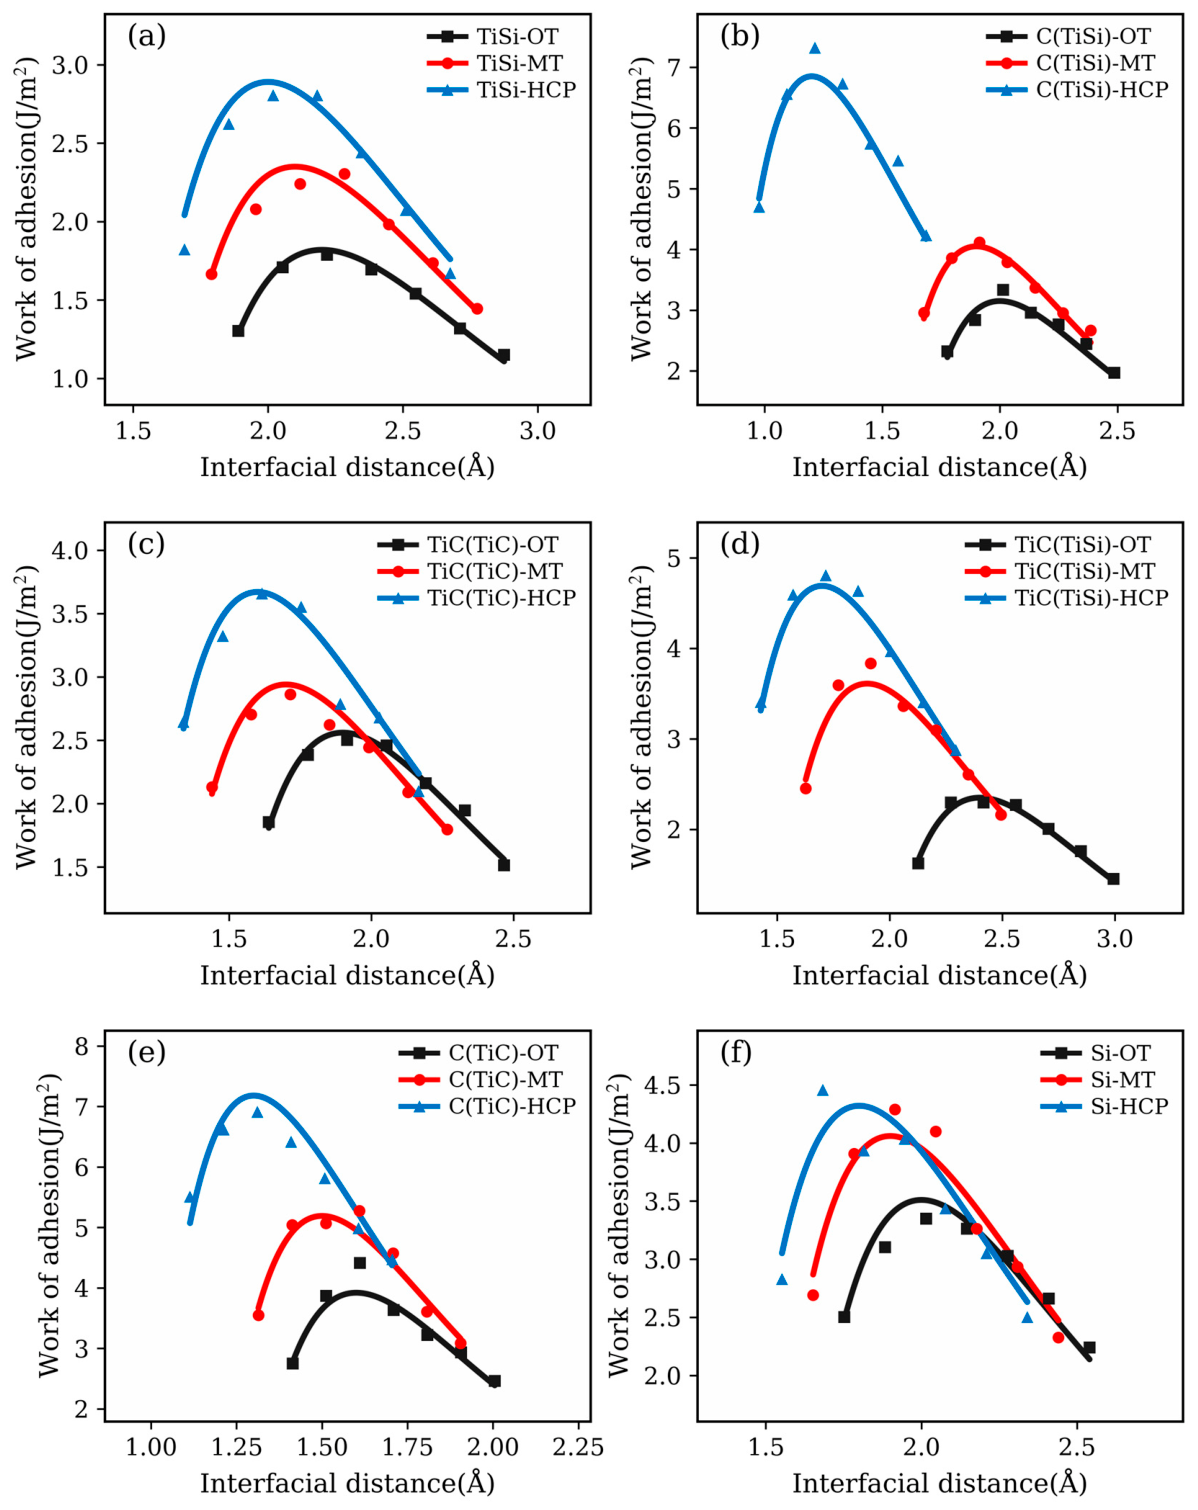
Adhesion energy as a function of interfacial separation distance for the Ag(111)/Ti3SiC2(0001) interfaces with different terminations and stacking sequences, calculated using the Universal Binding Energy Relation (UBER) approach. (a) TiSi; (b) C(TiSi); (c) TiC(TiC); (d) TiC(TiSi); (e) C(TiC); (f) Si.
Table 2.
Interface spacing and work of adhesion before and after relaxation of 18 Ti3SiC2(0001)/Ag(111) interface.
To elucidate the thermodynamic driving forces and mechanical compatibility governing metal–ceramic adhesion, we systematically evaluated the work of adhesion (Wad) and equilibrium interlayer distance (d0) for eighteen distinct Ti3SiC2(0001)/Ag(111) interface configurations, spanning six substrate terminations and three high-symmetry stacking sequences. Notably, the HCP registry universally outperformed the OT and MT arrangements, delivering the highest Wad for every termination examined, a trend that underscores the critical role of lateral atomic registry in optimizing interfacial bonding. Among the HCP-stacked interfaces, the adhesion strength varied markedly with surface chemistry: the C(TiC) termination exhibited the strongest adhesion, with Wad reaching 9.25 J/m2, followed by C(TiSi) with Wad = 8.28 J/m2 at d0 = 1.2 Å (Table 2). The C(TiC)-HCP configuration therefore exhibited the highest work of adhesion in the complete configurational landscape, a distinction attributable to the strong interfacial Ag–C bonding fostered by the TiC subsurface layer. Conversely, the TiSi termination yielded the lowest adhesion (Wad = 4.18 J/m2), as the inherently weak Ti–Si bonding within the MAX phase facilitates interfacial sliding and reconstruction. The Si-terminated interface displayed intermediate behaviour (Wad = 6.23 J/m2), reflecting the formation of directional Si–Ag bonds, whereas the TiC-terminated surfaces occupied a middle ground, with adhesion strengths descending from TiC(TiSi) (6.85 J/m2) to TiC(TiC) (5.65 J/m2). Across all configurations, the equilibrium separation was broadly anti-correlated with the adhesive strength, as shorter d0 values generally corresponded to stronger interfacial attraction. Structural relaxation proved essential, enhancing Wad by approximately 10%–75% relative to the unrelaxed geometries as the Ag overlayer reorganized toward the substrate. Microstructurally, this enhancement arises from three coupled effects: (1) a systematic reduction in the interfacial spacing, typically by 0.1–0.2 Å, which strengthens the interfacial orbital overlap; (2) a lateral registry optimization of the interfacial Ag atoms toward more favourable hollow-site positions, accompanied by a slight rumpling of the outermost Ag layer; and (3) a local rehybridization of the interfacial C and Ti atoms as they adapt their coordination to the approaching Ag slab. The largest relative enhancements occur for the more weakly bonded terminations, whose rigid UBER configurations are farthest from the optimal registry and therefore undergo the largest atomic displacements upon relaxation, whereas the strongly bonded C-terminated interfaces already lie close to their optimal geometry in the rigid state.
At first sight, the superior adhesion of the C-terminated interfaces may appear paradoxical, because the C(TiC) and C(TiSi) terminations are the least stable as free surfaces (Section 3.1). The two observations are, however, fully consistent, as they probe different energetic quantities. The high surface energy of the C terminations reflects the abundance of under-coordinated, highly reactive C atoms at the free surface; precisely these unsaturated C 2p states provide the strongest driving force for bond formation when the Ag(111) slab is brought into contact. Upon interface formation, the interfacial C atoms recover a near-bulk coordination environment by establishing strong C 2p-Ag 4d hybridized bonds with the opposing Ag atoms (Section 3.3), and the energy gained through this interfacial bonding more than compensates for the higher cost of cleaving the less stable free surface. The work of adhesion, which measures the resistance of the joined interface to separation, is therefore largest for the C(TiC) termination, even though that termination is the least stable as an isolated surface.
To efficiently estimate the equilibrium interfacial geometries prior to the computationally demanding full structural relaxations, the Universal Binding Energy Relation (UBER) was employed, which provides both the equilibrium separation distance and the corresponding work of adhesion from rigid-slab calculations. Figure 5 presents the work of adhesion (Wad) as a function of the interfacial separation (d0) for the eighteen high-symmetry configurations across the six distinct Ti3SiC2 terminations. All curves display the characteristic UBER profile: a gradual rise from large separation, a maximum at the equilibrium distance d0, and a subsequent decline stemming from Pauli repulsion at close range. In every panel, the hollow-site (HCP) stacking, denoted by blue triangles, consistently achieves the highest work of adhesion at the shortest equilibrium separation, whereas the on-top (OT) configuration, represented by black squares, invariably yields the lowest adhesion energy with the largest d0. For instance, the TiSi-terminated HCP interface (panel a) exhibits a modest peak of 2.89 J/m2 in the unrelaxed state, which increases to 4.18 J/m2 upon relaxation, reflecting the comparatively diffuse interfacial orbitals that produce a gentle repulsive wall. In marked contrast, the carbon-terminated interfaces demonstrate substantially stronger interfacial bonding: the C(TiSi)-HCP configuration (panel b) reaches 6.85 J/m2 before relaxation and 8.28 J/m2 after relaxation at an equilibrium spacing of 1.2 Å, while the C(TiC)-HCP configuration (panel e) displays the steepest repulsive branch, peaking at 7.18 J/m2 before relaxation and 9.25 J/m2 after relaxation, the highest value among all configurations. Intermediate values are obtained for TiC(TiC)-HCP at 3.67 J/m2 (5.65 J/m2 after relaxation; panel c), TiC(TiSi)-HCP at 4.69 J/m2 (6.85 J/m2 after relaxation; panel d), and Si-HCP at 4.32 J/m2 (6.23 J/m2 after relaxation; panel f). The pronounced variation in repulsive steepness, ranging from the abrupt walls of C(TiC)-HCP and C(TiSi)-HCP to the softer repulsion of TiSi-HCP, directly reflects the spatial extent of the interfacial electron density. Together, these UBER curves unambiguously identify HCP stacking as the preferred interfacial registry. It is also worth noting that all results reported here were obtained with the PBE functional without an explicit van der Waals (vdW) correction. Because the equilibrium interfacial spacings identified above (1.2–1.9 Å) fall well inside the regime of chemical bonding, where orbital hybridization and charge transfer dominate over dispersive interactions, the adhesion hierarchy is expected to be robust against the choice of dispersion scheme; spot checks using a vdW-corrected functional changed the absolute Wad values by less than 10% without altering the relative ordering of the configurations.
Finally, since Ag-based electrical contacts operate at elevated temperatures, the influence of temperature on the present predictions deserves comment. The calculations reported here correspond to ground-state (0 K) conditions. At finite temperatures, vibrational free-energy contributions and lattice thermal expansion would slightly increase the equilibrium spacing and reduce the absolute work of adhesion. However, the interfacial bond energies identified here amount to several eV per interface cell, far exceeding the thermal energy at typical service temperatures (kBT ≈ 0.07 eV at 800 K), and the adhesion hierarchy is set by the interfacial electronic structure rather than by entropic contributions. The relative stability ordering of the terminations and stacking sequences is therefore expected to be preserved at operating temperatures. A quantitative finite-temperature assessment, for example through ab initio molecular dynamics or quasiharmonic free-energy calculations, constitutes an interesting direction for future work.
3.3. Electronic Structure
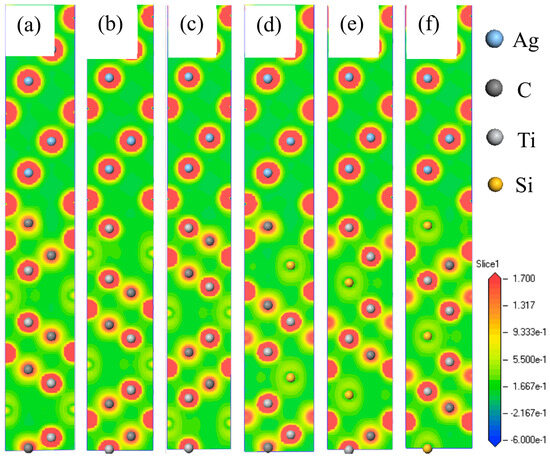
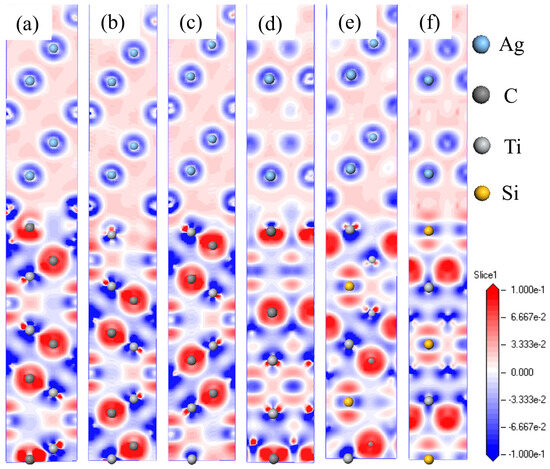
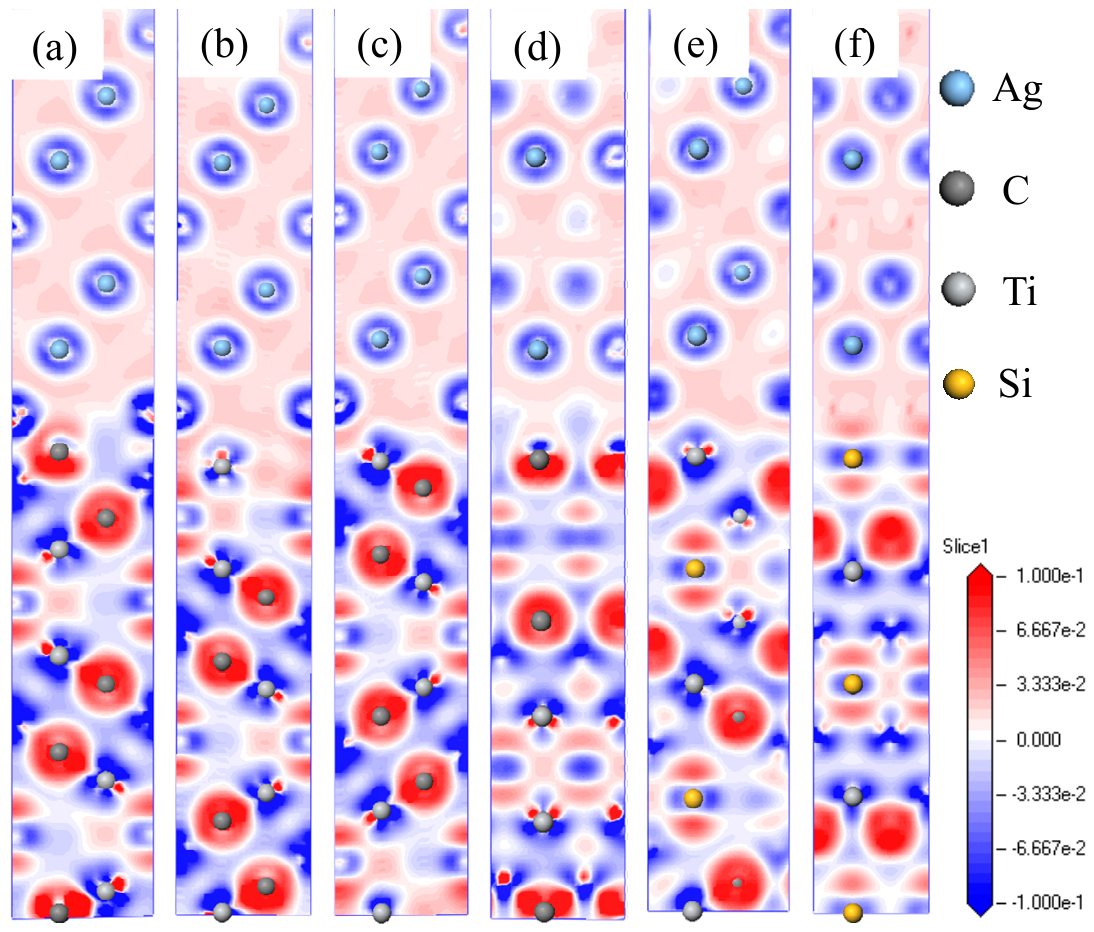
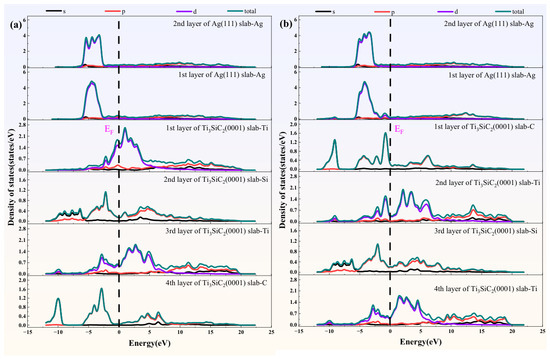
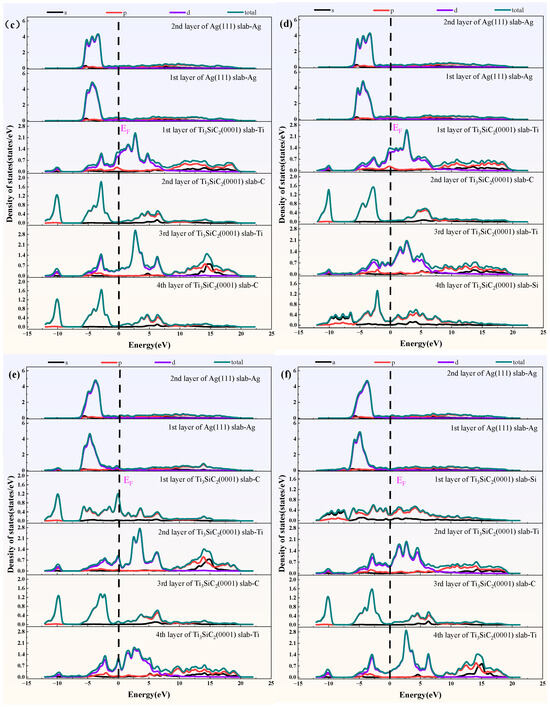
The adhesion strength and stability of the Ti3SiC2(0001)/Ag(111) interface are closely related to its electronic structure. Having established in Section 3.2 that the work of adhesion varies by more than a factor of two among the six optimal HCP-stacked configurations, from 9.25 J/m2 for the C(TiC)-terminated interface down to 4.18 J/m2 for the TiSi-terminated interface, we now examine the valence charge density (Figure 6), the charge density difference (Figure 7), and the layer-resolved partial density of states (PDOS, Figure 8). Together, these complementary probes connect the adhesion energetics to the character of the interfacial chemical bonding.
Figure 6.
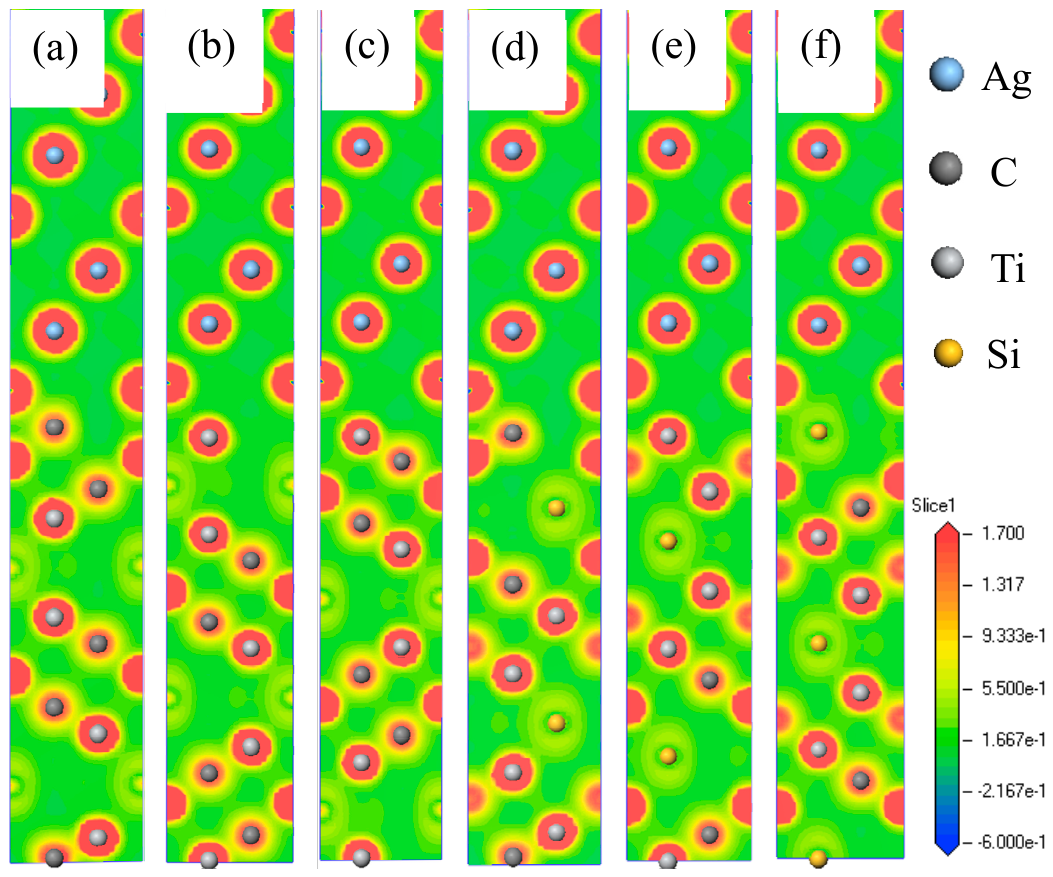
The charge density for six different interface models. (a) The HCP stacked C(TiC)-Ti3SiC2(0001)/Ag(111) interface; (b) the HCP stacked TiSi-Ti3SiC2(0001)/Ag(111) interface; (c) the HCP stacked TiC(TiC)-Ti3SiC2(0001)/Ag(111) interface; (d) the HCP stacked C(TiSi)-Ti3SiC2(0001)/Ag(111) interface; (e) the HCP stacked TiC(TiSi)-Ti3SiC2(0001)/Ag(111) interface; (f) the HCP stacked Si-Ti3SiC2(0001)/Ag(111) interface.
Figure 7.
The charge density differences for six different interface models. (a) The HCP stacked C(TiC)-Ti3SiC2(0001)/Ag(111) interface; (b) the HCP stacked TiSi-Ti3SiC2(0001)/Ag(111) interface; (c) the HCP stacked TiC(TiC)-Ti3SiC2(0001)/Ag(111) interface; (d) the HCP stacked C(TiSi)-Ti3SiC2(0001)/Ag(111) interface; (e) the HCP stacked TiC(TiSi)-Ti3SiC2(0001)/Ag(111) interface; (f) the HCP stacked Si-Ti3SiC2(0001)/Ag(111) interface.
Figure 8.
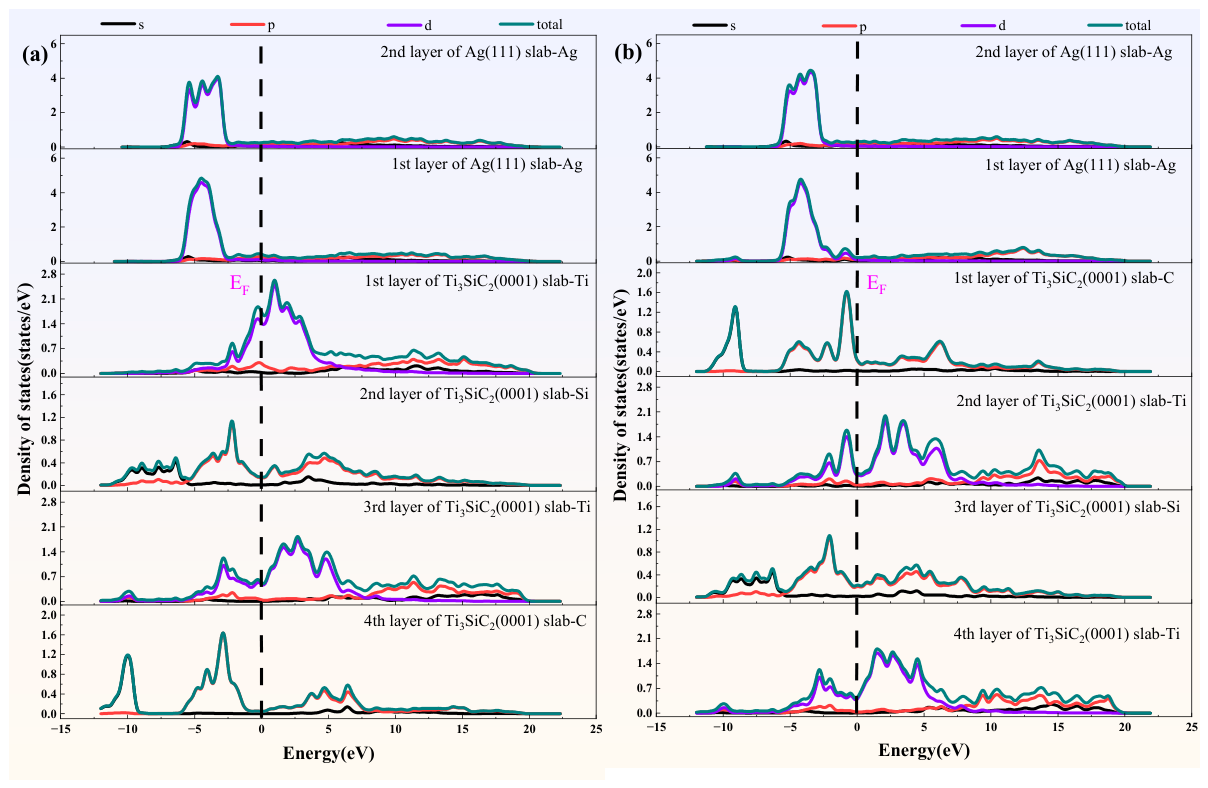
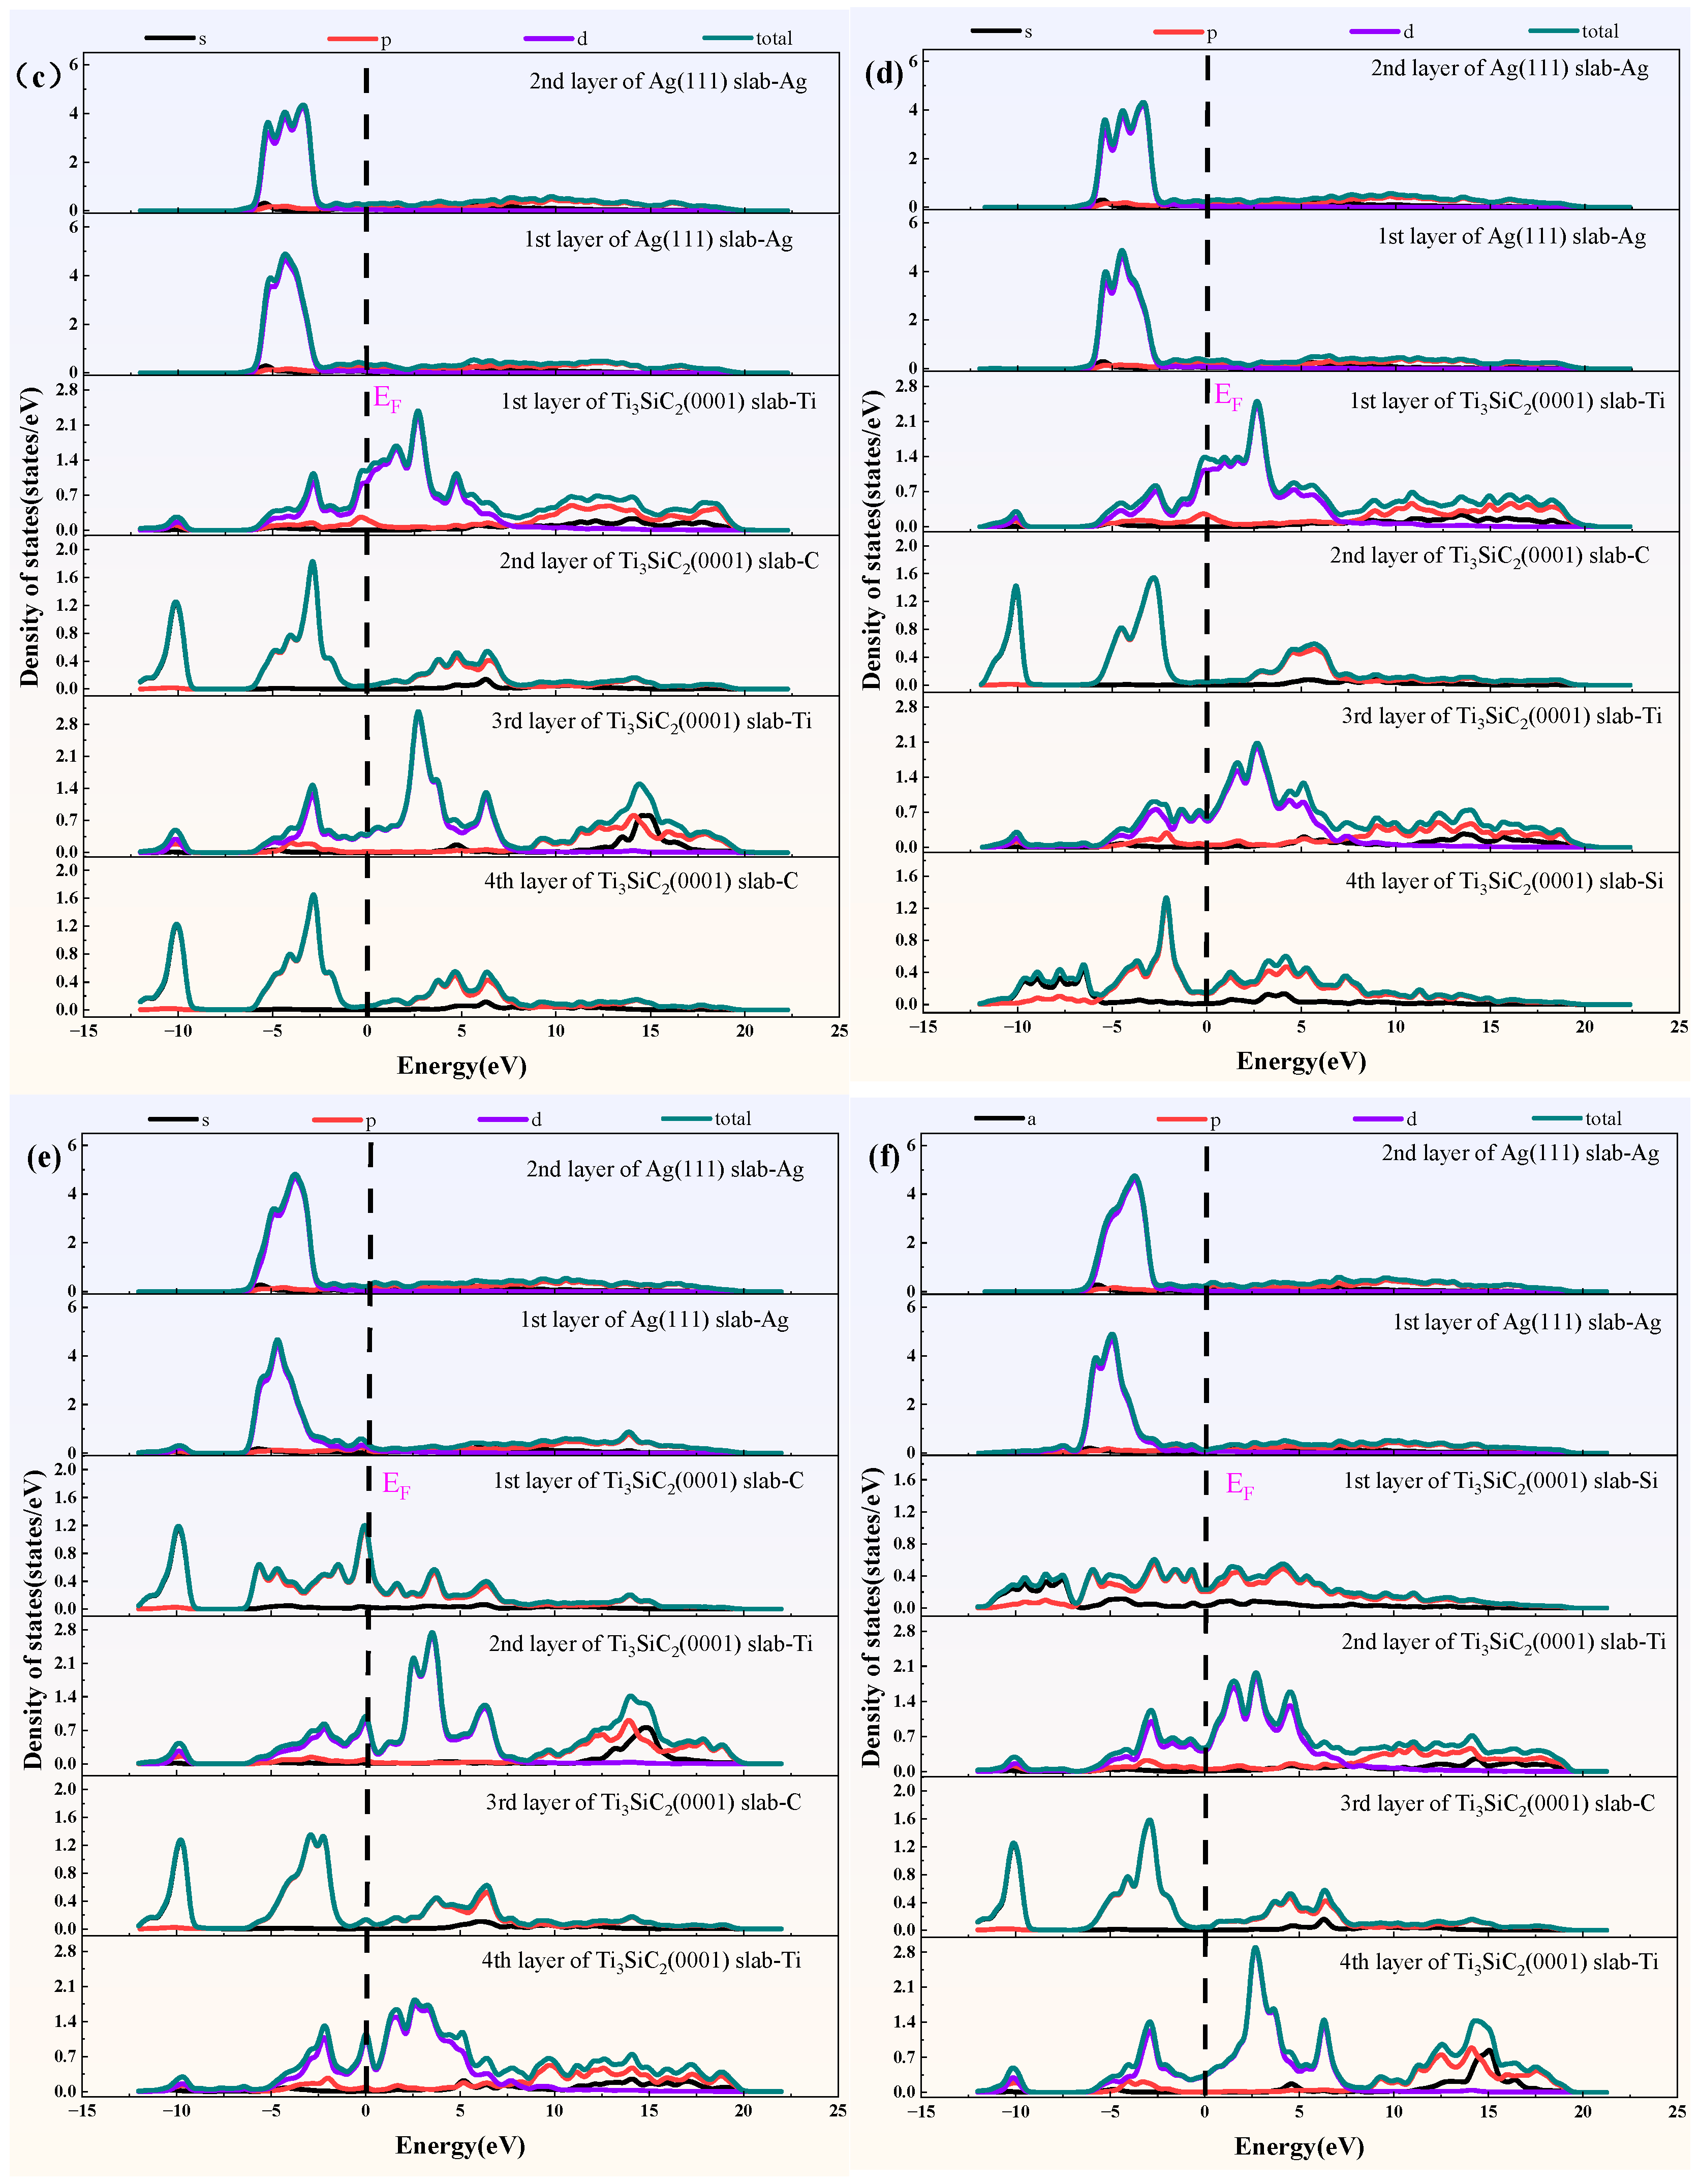
The partial density of states for six different interface models. (a) The HCP stacked TiSi-Ti3SiC2(0001)/Ag(111) interface; (b) the HCP stacked C(TiSi)-Ti3SiC2(0001)/Ag(111) interface; (c) the HCP stacked TiC(TiC)-Ti3SiC2(0001)/Ag(111) interface; (d) the HCP stacked TiC(TiSi)-Ti3SiC2(0001)/Ag(111) interface; (e) the HCP stacked C(TiC)-Ti3SiC2(0001)/Ag(111) interface; (f) the HCP stacked Si-Ti3SiC2(0001)/Ag(111) interface.
Figure 6 displays the charge density distributions across the six interfaces. Within the Ag(111) slab, the density is smoothly delocalized around and between the Ag cores, a hallmark of metallic cohesion; within the Ti3SiC2 slab it concentrates along the Ti-C framework, reflecting the covalent network of the MAX phase. The interfacial region, by comparison, discriminates sharply among terminations. For the two C-terminated interfaces (Figure 6a,d), continuous density contours bridge the interfacial C atoms and the opposing Ag atoms across a separation of only about 1.2 Å, indicating direct charge sharing and hence a sizeable covalent component of the Ag-C bond. The TiC-terminated configurations (Figure 6c,e) also exhibit connected contours across the interface, albeit mediated by the more spatially extended Ti 3d orbitals. In marked contrast, the TiSi interface (Figure 6b) retains a low-density gap between the two slabs, consistent with its largest equilibrium spacing (1.9 Å) and its weakest adhesion, whereas the Si-terminated interface (Figure 6f) shows appreciable but visibly directional charge build-up around the interfacial Si atoms. The degree of interfacial charge-density overlap thus broadly tracks the Wad and d0 trends established in Section 3.2.
The charge density difference in Figure 7, defined as the density of the joined interface minus that of the isolated Ag(111) and Ti3SiC2(0001) slabs, resolves how electrons rearrange upon bond formation; red regions denote electron accumulation and blue regions depletion. For the C-terminated interfaces (Figure 7a,d), intense accumulation centres on the interfacial C atoms, whereas pronounced depletion surrounds the neighbouring Ag and Ti atoms, indicating electron transfer from both Ag and Ti toward C. An inverted, weaker pattern characterizes the TiC-terminated interfaces (Figure 7c,e), with depletion around the interfacial Ti and accumulation toward the adjacent C layer. The Si-terminated interface (Figure 7f) likewise displays visible accumulation around the interfacial Si atoms, accompanied by depletion on the Ag side, pointing to directional charge sharing; by comparison, the TiSi interface (Figure 7b) shows the most diffuse and weakest rearrangement of all six systems. Notably, the accumulation and depletion zones in every system decay rapidly away from the interface, and the interior of the Ag slab retains only faint, nearly uniform polarization: the interfacial electron redistribution is most pronounced on the interfacial atoms and their immediate neighbours.
Figure 8 presents the layer-resolved PDOS, and several features are common to all six terminations. The total DOS remains finite at the Fermi level (EF), confirming that every interface is metallic. The Ag 4d band is fully occupied and confined to approximately −6 to −2 eV below EF, leaving only a small density of Ag s and p states at EF. Specifically, the interfacial Ag layer exhibits a slightly broadened 4d band and a modestly enhanced DOS near EF relative to the second Ag layer, indicating that the outermost Ag atoms participate directly in interfacial bonding, whereas atoms only one layer deeper already recover bulk-like character, further evidence that the interaction is short-range.
On the MAX side, the third and fourth layers progressively restore the bulk Ti3SiC2 signature of Ti 3d-C 2p hybridization around −4 to 0 eV. These interface-induced modifications of the spectra confirm that chemical bonding, rather than physical adsorption, operates at all six interfaces. The termination-dependent differences are nonetheless striking and provide a microscopic rationale for the adhesion hierarchy. For the C-terminated interfaces (Figure 8b,e), the interfacial C 2p states span roughly −10 eV up to EF and overlap the Ag 4d band in the −5 to −2 eV window, signalling C 2p-Ag 4d hybridization; distinct C 2p peaks at around −3 to −1 eV, with tails reaching EF, further indicate that the interfacial C atoms carry appreciable spectral weight up to EF and thus participate directly in the interfacial bonding. This p-d hybridization, reinforced by the Ag/Ti-to-C charge transfer resolved in Figure 7, renders the Ag-C interaction the strongest among the cases studied here, which explains why C(TiC) and C(TiSi) combine the largest Wad with the smallest d0. For the three interfaces exposing an outermost Ti layer, namely TiSi, TiC(TiC), and TiC(TiSi) (Figure 8a,c,d), the interfacial Ti 3d states straddle EF with high spectral weight at and just above it, overlapping the Ag states at around −5 to −2 eV; coupling through such partially filled d bands is characteristic of predominantly metallic bonding. Among the three, the TiSi interface exhibits the feeblest interface-induced spectral rearrangement, in line with its lowest Wad. The Si-terminated interface (Figure 8f) instead displays Si 3p states spread broadly from about −7 eV to above EF, hybridizing with the Ag 4d band near −5 to −2 eV, which is consistent with a directional, moderately covalent Si-Ag interaction and its intermediate adhesion strength.
In summary, the charge density, the charge density difference, and the PDOS mutually corroborate one another: strong p-d-hybridized Ag-C bonding with appreciable charge transfer at the C terminations; metallic Ag-Ti coupling at the TiC terminations; moderate directional Ag-Si bonding at the Si termination; and only weak, diffuse interaction at the TiSi termination. Together, these findings account, at the electronic level, for the Wad ordering established in Section 3.2. This qualitative picture is corroborated quantitatively by a Mulliken population analysis: at the C(TiC)-HCP interface, each interfacial C atom gains a net charge of approximately 0.3–0.5 eV, donated primarily by the neighbouring Ag and Ti atoms, whereas the net charge redistribution at the TiSi-terminated interface is smaller than 0.1 eV per interfacial atom, in direct correspondence with the adhesion hierarchy.
3.4. Effect of Alloying Elements
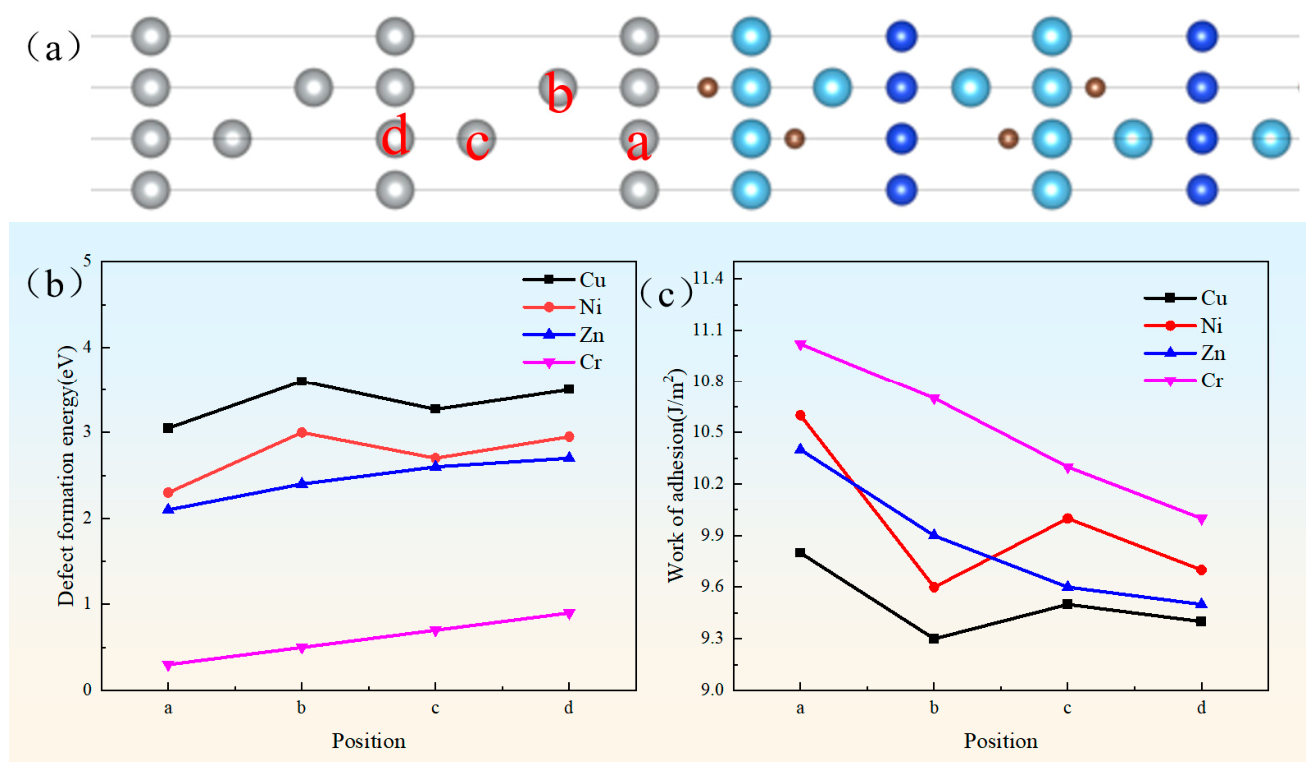
Having identified the C(TiC)-terminated, HCP-stacked Ag(111)/Ti3SiC2(0001) interface as the most strongly adhering configuration in Section 3.2, we next asked whether its adhesion can be raised further by alloying, a strategy widely exploited in Ag-based electrical-contact composites. Four common alloying elements, Cu, Ni, Zn and Cr, were introduced substitutionally on the Ag sub-lattice, and for each dopant, four substitution depths were examined, labelled sites a–d in Figure 9a: site a denotes the interfacial Ag layer, and sites b-d the second, third and fourth Ag layers beneath it. The thermodynamic preference of a dopant for each site was evaluated through the defect formation energy; the formula for calculating the formation energy of dopant defects is as follows [54]:
where and are the total energies of the doped and pristine interfaces, and Ex and Ey are the chemical potentials of the dopant atom and of the substituted Ag atom, respectively. The work of adhesion of each doped interface was then computed as follows.
Figure 9.
The defect formation energy and work of adhesion for different doped Ti3SiC2(0001)/Ag(111) interface models: (a) the doped position, (b) the defect formation energy of the doped interfaces, and (c) the work of adhesion of the doped interfaces.
In the defect formation-energy expression above, the chemical potentials of the dopants and of the substituted Ag atom were referenced to their stable bulk phases, namely fcc Cu, fcc Ni, hcp Zn, bcc Cr, and fcc Ag, respectively. Each doped supercell contains a single solute atom, corresponding to an effective concentration of one solute atom per interfacial unit cell, so that all dopants are compared at identical coverage. The precipitation of secondary phases (such as chromium carbides) is not thermodynamically favoured under the dilute, kinetically constrained conditions of interfacial alloying. On this basis, the segregation energies amount to approximately 0.55 eV for Cr, between 0.3 eV and 0.9 eV for Ni and Zn, and about 0.6 eV for Cu, confirming that interfacial segregation is thermodynamically favoured for all four dopants.
where and represent the total surface energies of surfaces A and B after relaxation, respectively, and denotes the total interfacial energy after doping. A is the area between the interfaces. Importantly, when the work of adhesion of a doped interface was evaluated, the two separated surface slabs retained exactly the same composition and dopant position as in the joined interface, i.e., the dopant atom remained on the Ag-side surface after separation. This convention ensures that the calculated Wad reflects the interfacial bond strength solely, without spurious contributions from dopant transfer or from changes in the chemical state of the solute.
The formation energies in Figure 9b discriminate sharply among the four dopants. All values are positive, meaning that substitutional alloying of the Ag slab is endothermic and must be driven by non-equilibrium processing; their magnitudes, however, span nearly an order of magnitude. Cr is by far the easiest element to incorporate, with ΔEf of only about 0.3 eV at the interfacial layer, rising monotonically to about 0.85 eV at the fourth layer. Zn and Ni occupy an intermediate range of approximately 2.1–3.0 eV, whereas Cu is the most reluctant dopant, with ΔEf between about 3.0 eV and 3.6 eV. Notably, the interfacial Ag layer offers the lowest, or nearly the lowest, formation energy for every element examined, indicating that, among the examined substitution depths, the interfacial layer is the energetically most favourable incorporation site; for Cr this depth dependence is so pronounced that interfacial Cr substitution is by far the least endothermic of all dopant-site combinations.
This energetic preference translates directly into interfacial strength. As shown in Figure 9c, the work of adhesion reaches its maximum for every dopant when the solute resides at the interfacial layer, and decays progressively as the solute moves into deeper Ag layers. Cr again stands out: it delivers the strongest interface at every substitution depth, with Wad falling from approximately 11.0 J/m2 at site a to about 10.0 J/m2 at site d. At the optimal site a, the adhesion ordering reads Cr (11.0 J/m2) > Ni (10.6 J/m2) > Zn (10.4 J/m2) > Cu (9.8 J/m2), and each of these values exceeds the 9.25 J/m2 of the undoped interface, corresponding to reinforcements of roughly 6%–19%. Equally telling is the inverse correlation between the two metrics: the element that enters the lattice most readily, Cr, also strengthens the interface most, whereas the most reluctant dopant, Cu, yields the smallest gain. It should nevertheless be emphasized that only four substitution depths are sampled for each dopant; the depth-resolved profiles in Figure 9 are therefore intended to identify the preferred substitution site and the sign of the underlying interactions rather than to establish a continuous quantitative trend, and the associated correlations are interpreted with the corresponding caution.
This hierarchy has a transparent electronic origin. Two complementary hybridization channels contribute to the strengthening: the dopant 3d states hybridize with the 2p states of the interfacial C atoms and, simultaneously, couple to the 3d states of the subsurface Ti layer; the former dopant-C channel provides the dominant contribution, as evidenced by the direct proportionality between the adhesion gain and the interfacial charge accumulation around the dopant-C bonds (Figure 10 and Figure 11), whereas the dopant-Ti coupling, visible in the PDOS overlap (Figure 12), further stabilizes the joint. Specifically, with partially filled 3d bands, Cr and Ni can hybridize with the 2p states of the interfacial C atoms, adding a covalent d-p component to the interfacial bonding. The effect is most pronounced for Cr, a strong carbide-forming element, whose affinity for carbon both lowers its effective formation energy near the interface and anchors the two slabs together. By contrast, the closed-shell 3d dopants Cu and Zn interact only weakly with carbon and contribute little beyond metallic cohesion, which accounts for their modest adhesion gains. The rapid decay of the strengthening effect with substitution depth mirrors the spatially localized interfacial bonding established in Section 3.3: only solutes residing within the interfacial layer can engage the C atoms directly. These findings identify interfacial Cr segregation as an effective route to strengthening Ag/Ti3SiC2 contacts; in view of the positive (endothermic) formation energies, its practical realization would rely on non-equilibrium processing routes, such as rapid solidification or powder metallurgy, that can kinetically trap solute atoms at the interface.
Figure 10.
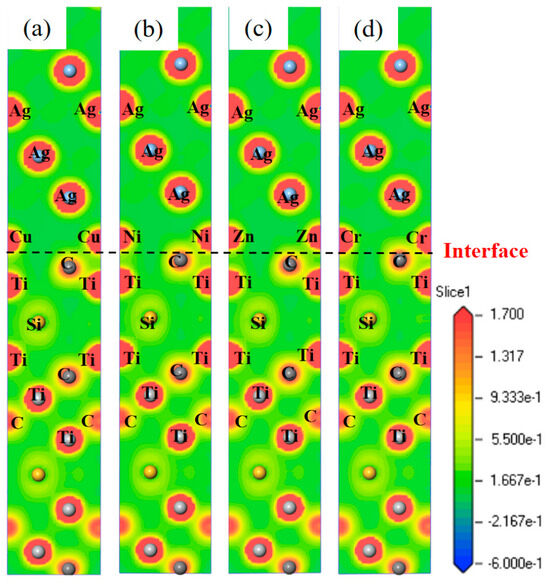
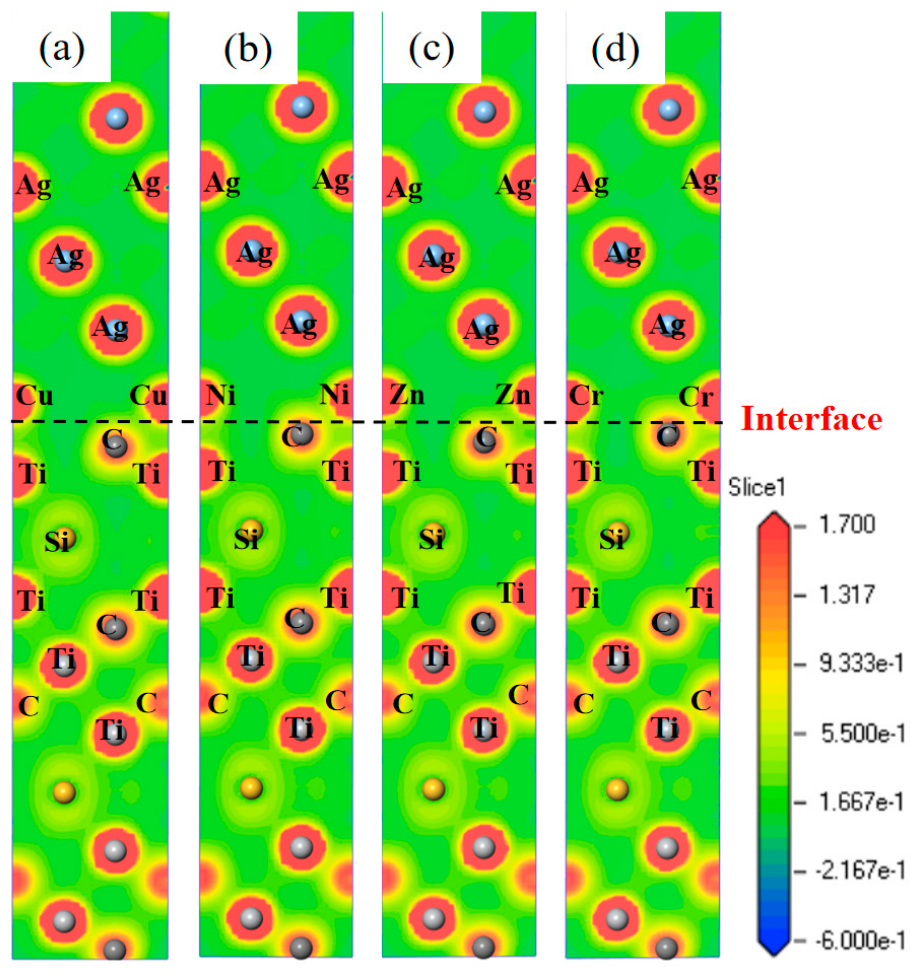
The charge density maps for different doped Ti3SiC2(0001)/Ag(111) interface models: (a) for the Cu-doped interface, (b) for the Ni-doped interface, (c) for the Zn-doped interface, and (d) for the Cr-doped interface. The charge density shown is the self-consistent valence electron density obtained from the present DFT calculations (not a Mulliken-type population analysis). All panels are plotted on the identical crystallographic plane cutting through the interface and share the same density range and colour scale, enabling direct comparison among the four dopants.
Figure 11.
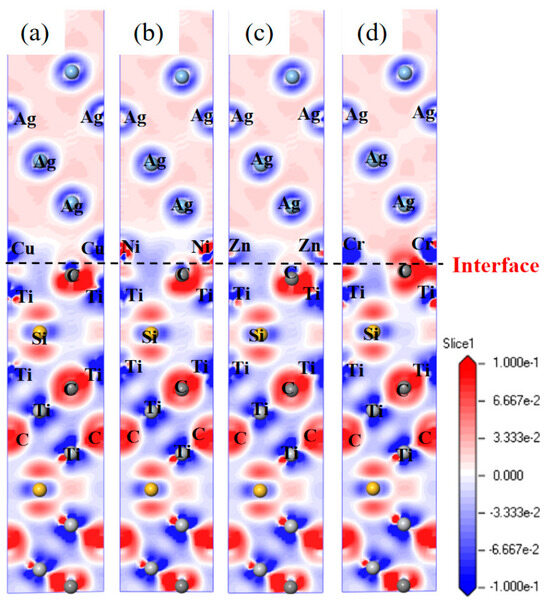
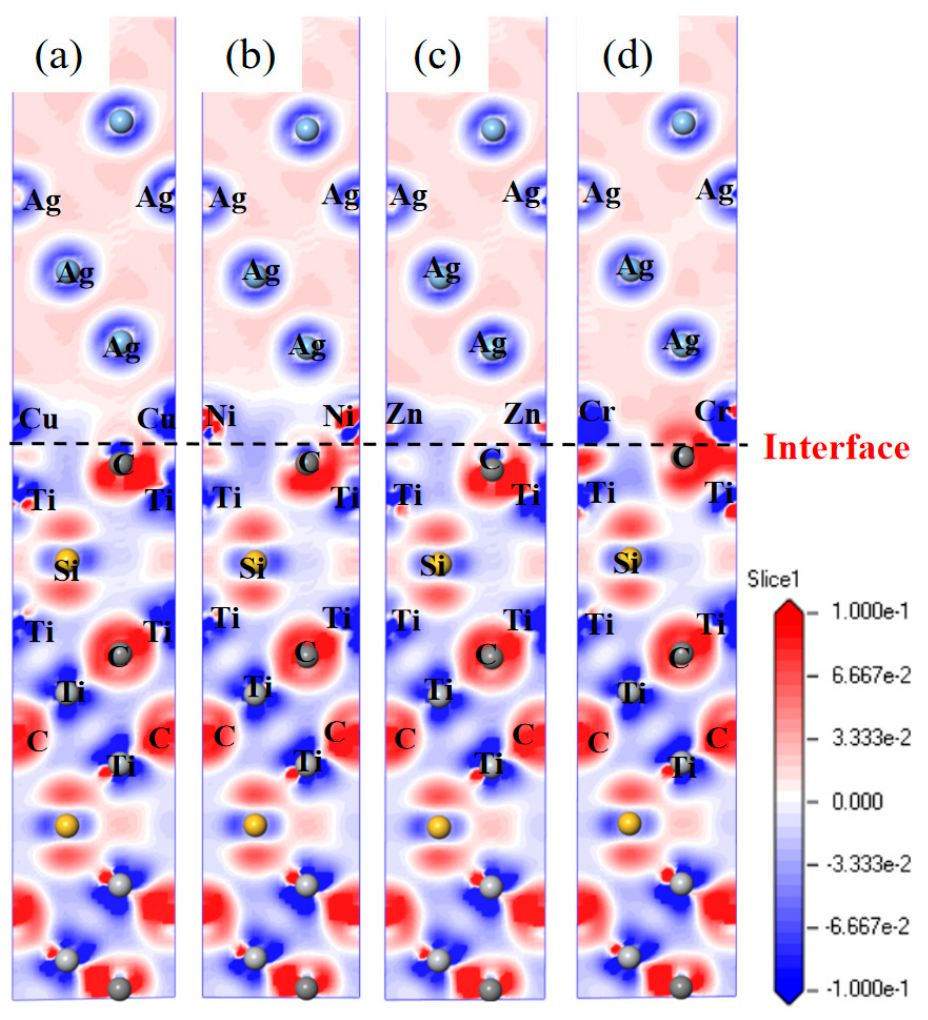
The charge density difference maps for different doped Ti3SiC2(0001)/Ag(111) interface models: (a) for the Cu-doped interface, (b) for the Ni-doped interface, (c) for the Zn-doped interface, and (d) for the Cr-doped interface. The charge density difference is defined as the self-consistent electron density of the joined interface minus the superposition of the isolated Ag(111) and Ti3SiC2(0001) slabs at identical atomic positions. All panels use the identical crystallographic plane, density limits, and colour scale.
Figure 12.
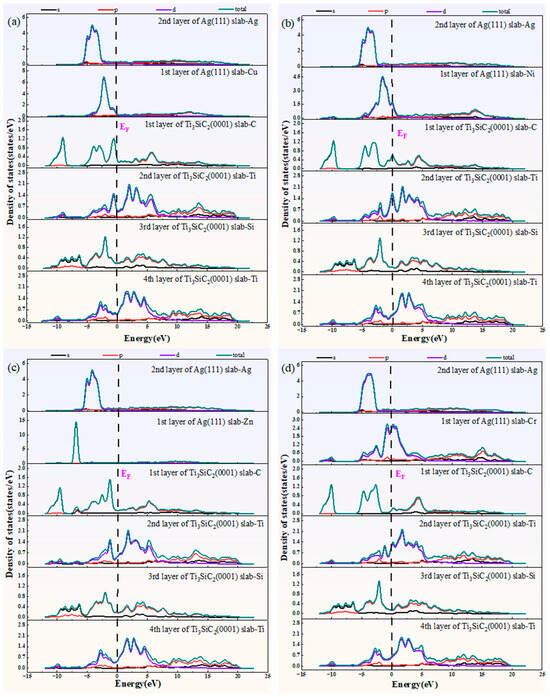
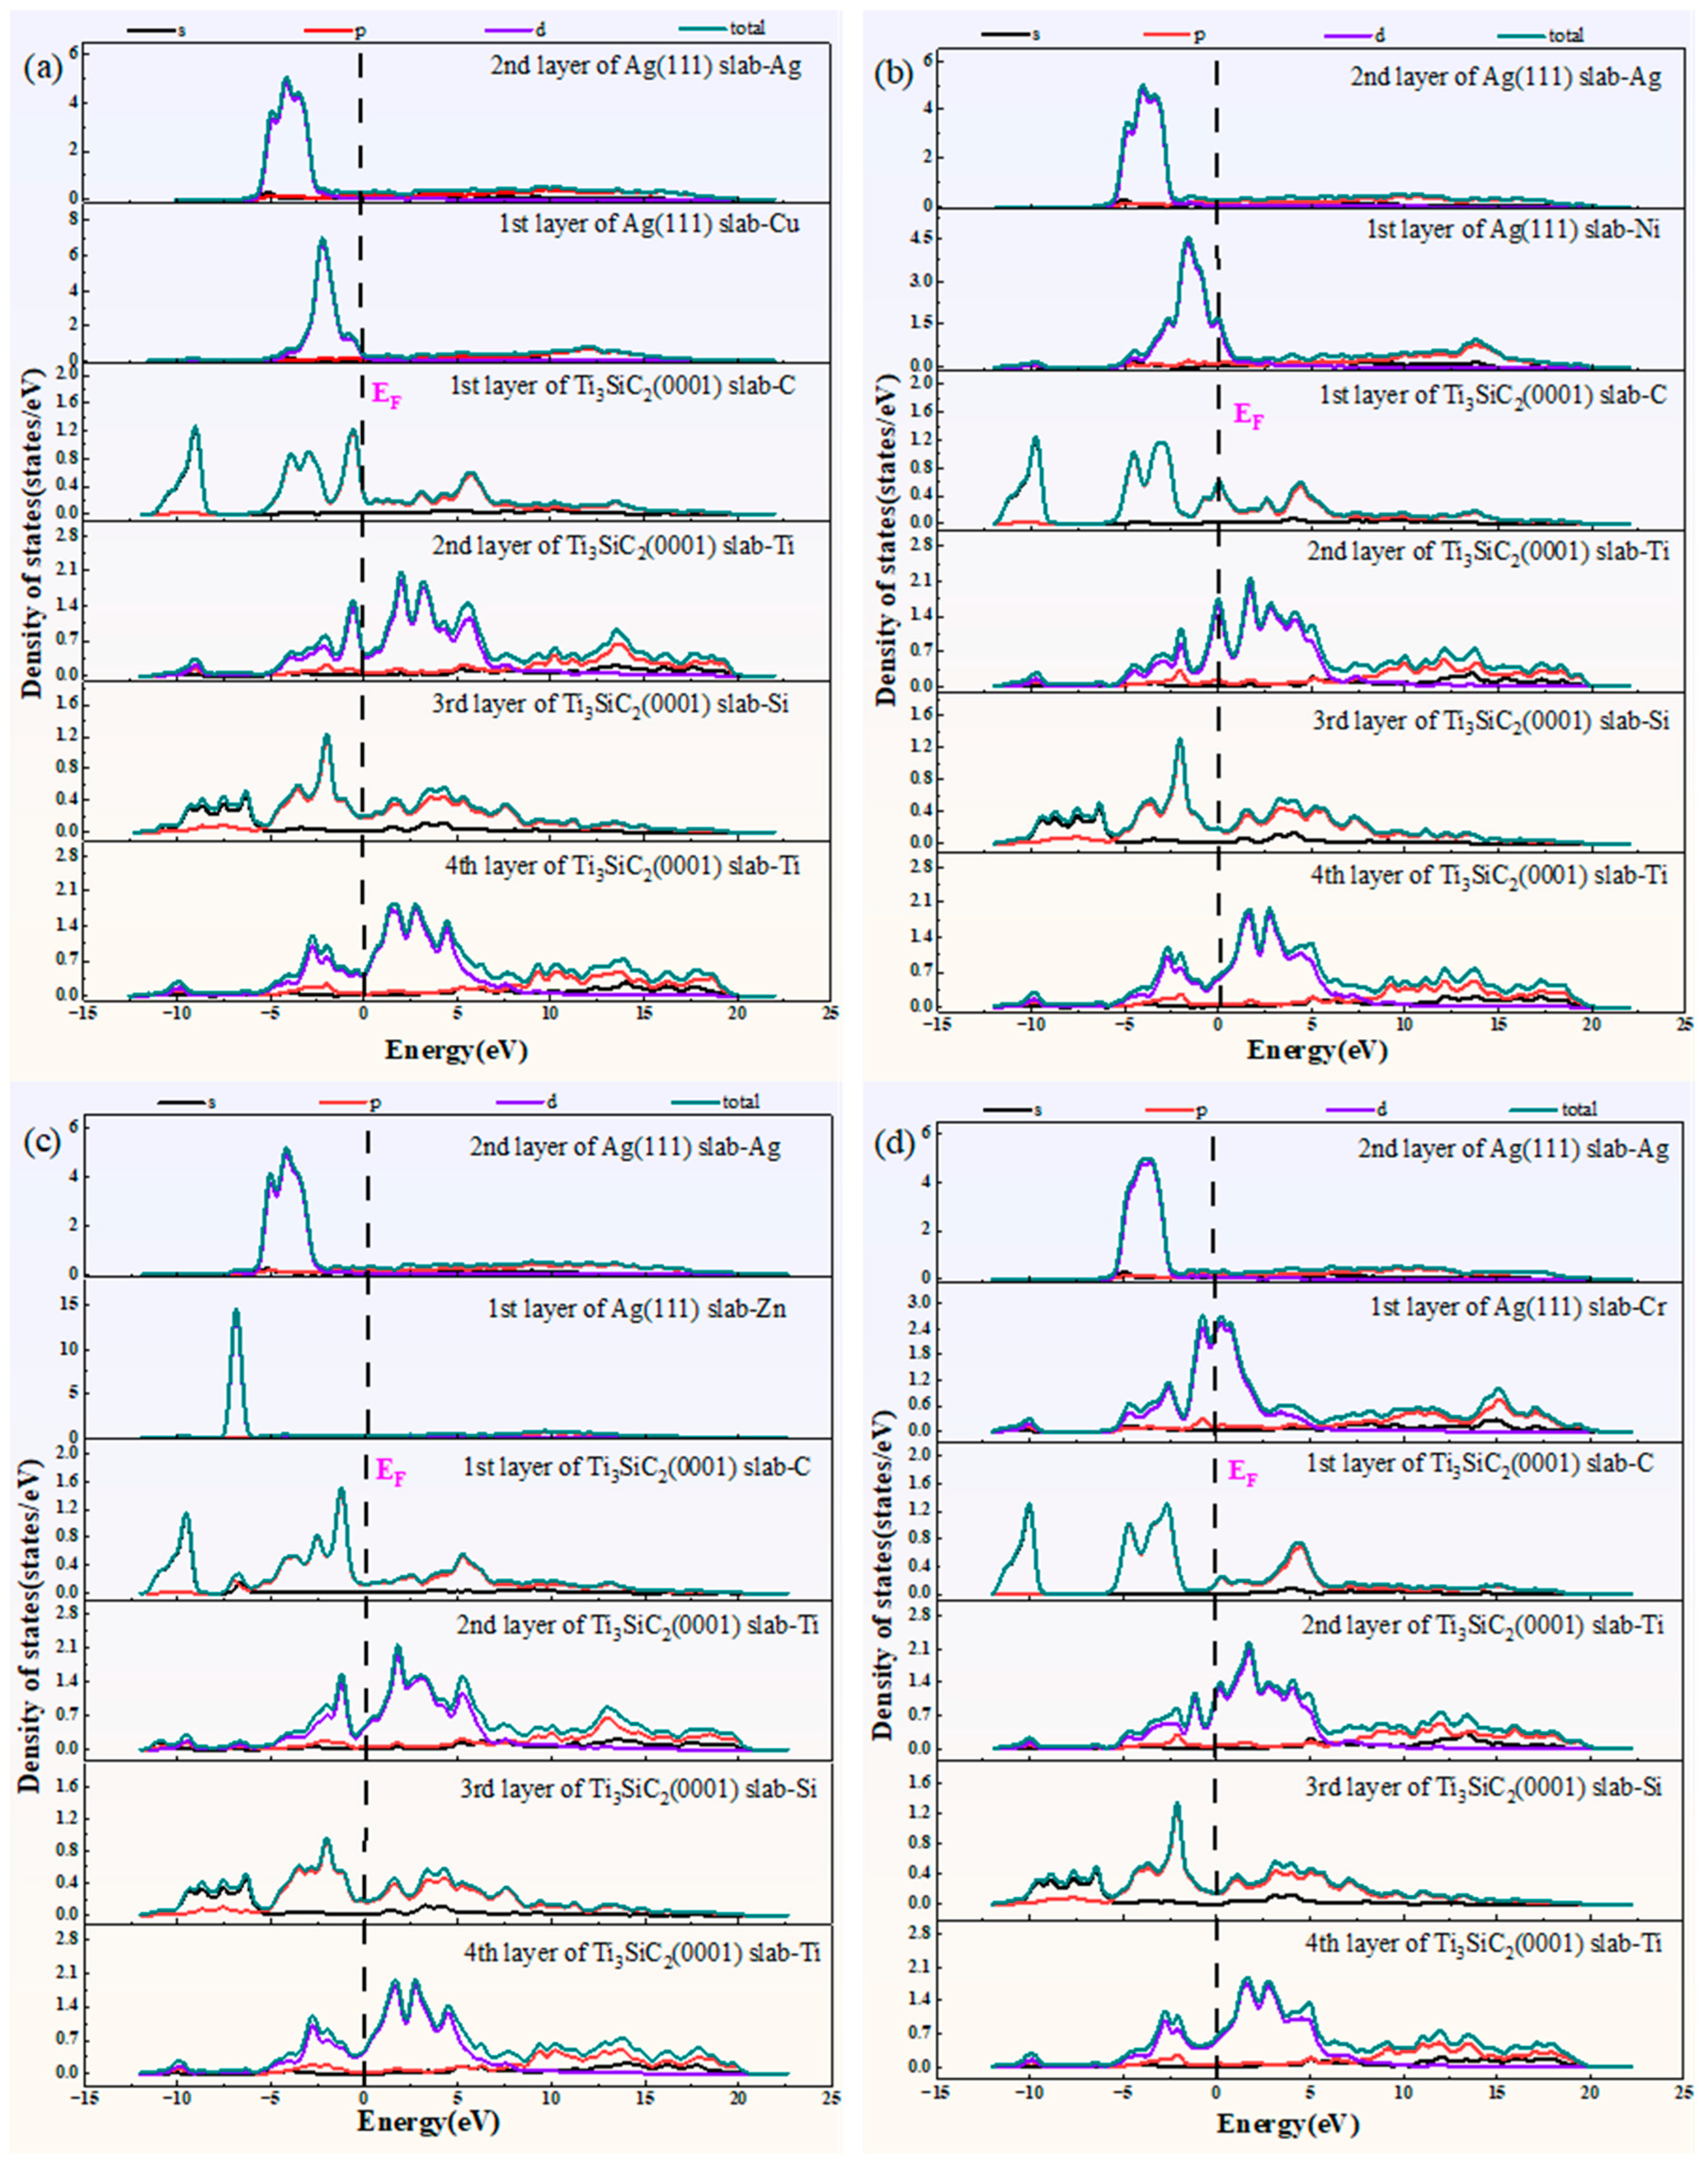
The PDOS for different doped Ti3SiC2(0001)/Ag(111) interface models: (a) for the Cu-doped interface, (b) for the Ni-doped interface, (c) for the Zn-doped interface, (d) for the Cr-doped interface. Individual high-resolution PDOS profiles of each doped interface are provided separately in Figures S1–S10 of the Supplementary Material. Spin-resolved calculations for the Ni- and Cr-doped interfaces show that the two spin channels are essentially identical owing to the negligible magnetic moments (Section 2); therefore, only the total PDOS is displayed here.
Figure 10 presents the charge density distributions of the Ti3SiC2(0001)/Ag(111) interfaces doped with Cr, Ni, Zn, and Cu, respectively, and the four panels collectively reveal distinct interfacial electronic structures that systematically follow the dopant-dependent stability trend. In each panel, the pronounced charge-density features are localized predominantly at the interface between the Ag overlayer and the Ti3SiC2 surface; the red and yellow regions correspond to high charge density, whereas the blue regions correspond to low charge density.
Among the four dopants, the Cr-doped interface (Figure 10d) exhibits the most pronounced interfacial charge density. Specifically, intense high-density lobes bridge the Cr atoms and the underlying Ti and C species, and the high-density region penetrates deepest into the Ti3SiC2 substrate. This pronounced charge-density build-up is fully consistent with the superior stability of the Cr dopant, and it further reflects maximized orbital hybridization arising from the partially filled 3d5 configuration of Cr, which enables optimal overlap with the Ti 3d states. The Ni-doped system (Figure 10b) displays a comparably strong interfacial charge density, with clearly resolved high-density regions at the interface; nevertheless, the high-density features in this system are somewhat less extensive than those in the Cr-doped case, which mirrors the intermediate stability ranking of Ni. In comparison, the Zn-doped interface (Figure 10c) exhibits a noticeably weaker interfacial charge density, and both the intensity and the spatial extent of its high-density regions are reduced relative to those of the Cr- and Ni-doped systems.
In stark contrast, the Cu-doped system (Figure 10a) presents the weakest interfacial charge density among the four interfaces, as evidenced by the markedly less intense coloration and the more confined high-density features at the interface.
Taken together, the interfacial charge density decreases systematically in the order of Cr, Ni, Zn, and Cu, which agrees well with the calculated stability sequence of Cr > Ni > Zn > Cu. This trend can be traced back to the electronic configurations of the dopant atoms. On one hand, the half-filled 3d5 shell of Cr facilitates strong directional bonding with the Ti 3d orbitals and thereby maximizes the charge density at the interface. On the other hand, the completely filled 3d10 configuration of Cu limits its capacity for additional orbital participation and consequently leads to the weakest interfacial charge density as well as the lowest adhesion energy. These observations therefore confirm that the magnitude of the interfacial charge density can serve as a reliable electronic descriptor for evaluating the relative thermodynamic stability of doped Ti3SiC2(0001)/Ag(111) interfaces.
The charge density difference maps presented in Figure 11 reveal a pronounced hierarchy of interfacial charge redistribution, which directly mirrors the dopant-dependent stability sequence of Cr > Ni > Zn > Cu. Among the four systems, the Cr-doped interface (Figure 11d) exhibits the most substantial charge redistribution, which is characterized by intense red accumulation zones spanning the interfacial gap between the Ag overlayer and the Ti3SiC2 substrate, together with considerable blue depletion regions localized around the Cr atoms. Such maximal charge transfer reflects the superior bonding capability of the half-filled 3d5 configuration of Cr, which not only facilitates efficient electron donation into interfacial states but also promotes strong d-orbital hybridization with the surface Ti atoms. Similarly, the Ni-doped interface (Figure 11b) displays robust interfacial charge redistribution, with prominent electron accumulation at the interface and well-defined depletion around the Ni atoms. Nevertheless, both the magnitude and the spatial extent of this redistribution remain visibly reduced relative to those of Cr, which is consistent with the more nearly filled 3d8 shell of Ni and its commensurately diminished orbital participation. In comparison, the Zn-doped interface (Figure 11c) exhibits only moderate charge redistribution at the interface, since the closed 3d10 configuration of Zn inherently limits charge transfer and orbital mixing. In stark contrast, the Cu-doped interface (Figure 11a) presents the weakest interfacial charge redistribution, displaying the least extensive and least intense accumulation regions among the four dopants. This behaviour can be attributed to the combined effect of the filled 3d10 subshell and the solitary 4s1 electron of Cu, which severely constrains both charge donation and covalent bonding capacity.
Taken together, the systematic decrease in the magnitude of charge redistribution from Cr to Cu establishes a direct correlation between interfacial charge transfer and thermodynamic stability. Furthermore, the coexistence of electron accumulation associated with ionic character and directional depletion patterns arising from covalent hybridization across all panels indicates a mixed ionic and covalent bonding character at the doped Ti3SiC2(0001)/Ag(111) interfaces, in which the covalent contribution scales proportionally with the stability of the doped interface.
Figure 12 presents the layer-resolved partial density of states (PDOS) of the Ti3SiC2(0001)/Ag(111) interfaces doped with Cr, Ni, Zn, and Cu, providing atomistic insight into the electronic origin of the calculated stability trend. Although the finite density of states at the Fermi level (EF = 0 eV) confirms that all four interfaces retain metallic character, the magnitude and orbital composition of the interfacial states vary markedly among the dopants and correlate directly with their adhesion strengths.
Cr, which yields the highest work of adhesion, exhibits the broadest d band in the first Ag layer, spanning approximately −5 eV to 3 eV, and accordingly yields the largest DOS at EF (2.5 states/eV) among the four dopants (Figure 12d). This wide dispersion reflects the partially filled 3d54s1 configuration of Cr, whose spatially extended bonding orbitals enable strong d-orbital hybridization with the second Ti layer throughout the −3 to 3 eV range, thereby maximizing the interfacial electronic stabilization. In comparison, Ni presents a narrower d band localized primarily between −4 eV and −1 eV, with a DOS at EF of 2.0 states/eV (Figure 12b). The 3d8 configuration affords significant yet more localized hybridization with the Ti d states between −3 eV and 2 eV, and the reduced orbital availability relative to Cr accounts for the intermediate stability of Ni.
Zn displays markedly different behaviour, since its fully occupied and contracted 3d10 shell generates an exceptionally sharp d peak centred near −6 eV with negligible weight at EF (Figure 12c). These energetically isolated, deep-bound states are electronically inert, and their large separation from EF suppresses interfacial hybridization, depriving the interface of the covalent contributions that stabilize the Cr- and Ni-doped systems. Cu, despite possessing a 4s1 valence electron, yields the weakest interface. Its d band is centred at approximately −3 eV with only a moderate tail toward EF, giving a DOS at EF that is lower than those of Cr and Ni and second only to that of the electronically inert Zn states (Figure 12a), since the filled 3d10 shell constrains both the Cu d-Ti d overlap and the back-donation from Ti.
Turning to the Ti3SiC2 substrate, the d peaks of the second Ti layer between −2 eV and 2 eV closely mirror the hybridization features of the adjacent dopant layer, confirming active interfacial d orbital mixing, whereas the p peaks of the first C layer near −10 eV and −5 eV attest to a robust Ti-C framework that is insensitive to the dopant identity. Notably, the nearly identical PDOS profiles of the second Ag layer across the four systems, together with the minimal dopant-induced variations in the deeper Si and Ti layers, demonstrate that the doping effect is highly localized to the interfacial Ag monolayer. Collectively, these results establish a direct correlation between the dopant d band structure and the interfacial stability, in which the broad EF-crossing d band of Cr drives the strongest hybridization; the more localized states of Ni provide moderate coupling; the deeply bound inert states of Zn afford limited stabilization; and the filled d shell of Cu produces the weakest interfacial bonding.
4. Conclusions
In this work, the interfacial adhesion and bonding mechanism of the Ti3SiC2(0001)/Ag(111) interface, together with the effect of substitutional alloying elements, was systematically investigated by first-principles calculations based on density functional theory. The main conclusions are summarized as follows:
- (1)
- Six terminations of the Ti3SiC2(0001) surface were evaluated by surface-energy calculations as a function of the carbon chemical potential. The TiC(TiC) termination is thermodynamically preferred under carbon-poor conditions, whereas the TiC(TiSi) termination becomes the most stable once ΔμC exceeds −1.50 eV; the C-terminated surfaces are the least stable as free surfaces across the entire ΔμC range. Eighteen Ti3SiC2(0001)/Ag(111) interface models combining the six terminations with three stacking sequences (OT, MT, and HCP) were constructed. The HCP stacking is energetically preferred for every termination, and the C(TiC)-terminated HCP interface exhibits the highest work of adhesion, 9.25 J/m2 at an equilibrium spacing of 1.2 Å; structural relaxation enhances the work of adhesion by approximately 10%–75%.
- (2)
- Charge density, charge density difference, and layer-resolved PDOS analyses consistently reveal the electronic origin of the adhesion hierarchy. The interfacial bonding is highly localized within the interfacial monolayers. At the C-terminated interfaces, strong C 2p-Ag 4d hybridization, reinforced by electron transfer from Ag and Ti atoms to the interfacial C atoms, produces the strongest Ag-C bonding with a mixed ionic-covalent character; the TiC-terminated interfaces are dominated by metallic Ag-Ti d-d coupling; the Si-terminated interface exhibits moderate directional Ag-Si bonding; and the TiSi-terminated interface shows only weak, diffuse interactions. All interfaces retain metallic character, with a finite density of states at the Fermi level.
- (3)
- Substitutional alloying with Cu, Ni, Zn, and Cr, although endothermic for all four dopants, is energetically most favourable within the interfacial Ag layer, indicating a clear thermodynamic driving force for interfacial segregation. Cr exhibits the lowest defect formation energy (about 0.3 eV at the interfacial site) and delivers the strongest interface at every substitution depth, raising the work of adhesion from 9.25 J/m2 to 11.0 J/m2 (an enhancement of about 19%), followed by Ni , Zn , and Cu . The strengthening correlates directly with the filling of the dopant 3d band and the associated d-p hybridization with the interfacial C atoms. Interfacial Cr segregation is therefore identified as an effective route to strengthening the Ti3SiC2/Ag interface, providing theoretical guidance for the interfacial design of high-performance Ag-Ti3SiC2 electrical contact composites. Finally, it should be noted that the work of adhesion quantifies the thermodynamic work of reversible interfacial separation; a complementary mechanical assessment, such as ideal tensile-strength simulations and fracture calculations along the weakest interfacial path, would provide a more complete picture of the interfacial mechanical performance and constitute an important direction for future work.
Supplementary Materials
The following supporting information can be downloaded at: https://www.mdpi.com/article/10.3390/coatings16080995/s1, Figure S1: The Partial Density of States for the HCP stacked TiSi-Ti3SiC2(0001)/Ag(111) interface. Figure S2: The Partial Density of States for the HCP stacked C(TiSi)-Ti3SiC2(0001)/Ag(111) interface. Figure S3: The Partial Density of States for the HCP stacked TiC(TiC)-Ti3SiC2(0001)/Ag(111) interface. Figure S4: The Partial Density of States for the HCP stacked TiC(TiSi)-Ti3SiC2(0001)/Ag(111) interface. Figure S5: The Partial Density of States for the HCP stacked C(TiC)-Ti3SiC2(0001)/Ag(111) interface. Figure S6: The Partial Density of States for the HCP stacked Si-Ti3SiC2(0001)/Ag(111) interface. Figure S7: The PDOS for Cu doped Ti3SiC2(0001)/Ag(111) interface model. Figure S8: The PDOS for Ni doped Ti3SiC2(0001)/Ag(111) interface model. Figure S9: The PDOS for Zn doped Ti3SiC2(0001)/Ag(111) interface model. Figure S10: The PDOS for Cr doped Ti3SiC2(0001)/Ag(111) interface model.
Author Contributions
C.Z. and M.W.: conceptualization, formal analysis, resources, writing—review and editing, visualization, software. H.H., B.C., H.X., Z.C. and D.Z.: formal analysis, writing—review and editing, supervision, funding acquisition. H.Y.: data curation, formal analysis, investigation, validation. All authors have read and agreed to the published version of the manuscript.
Funding
This research received financial support from the Opening Project of Ningbo Key Laboratory of Advanced NDT Technology and Intelligent Evaluation and the Foundation of Youth Science and Technology Innovation of Zhumadian City, China (NO.QNZX202420, NO.QNZX202423 and NO.QNZX202518); the Foundation of Key R&D and Promotion Projects of Henan Province, China (No.252102210017, NO.262102230054, No.252102230067, and NO.252102241056); and the Institutions of Higher Learning Key Scientific Research Project of Henan Province (No.25B430020, and No.25A430040).
Institutional Review Board Statement
Not applicable.
Informed Consent Statement
Not applicable.
Data Availability Statement
Some or all data, models, or code generated or used during the study are proprietary or confidential in nature and may only be provided with restrictions.
Conflicts of Interest
Author Hongyi Ye was employed by the company Henan Mingmei Magnesium Technology Co., Ltd. The remaining authors declare that the research was conducted in the absence of any commercial or financial relationships that could be construed as a potential conflict of interest.
References
- Habibi, F.; Samadi, A.; Nouri, M. Microstructural evolution during low-temperature brazing of WC-Co cemented carbide to AISI 4140 steel using a silver-based filler alloy. Int. J. Refract. Met. Hard Mater. 2023, 116, 106354. [Google Scholar] [CrossRef] [Scilit]
- Shimizu, H.; Takeuchi, Y. Bonding behavior and chemical and mechanical properties of silver-based dental alloys. Jpn. Dent. Sci. Rev. 2021, 57, 97–100. [Google Scholar] [CrossRef] [Scilit] [PubMed]
- Xu, C.H.; Yi, D.Q.; Wu, C.P.; Liu, H.; Li, W. Microstructures and properties of silver-based contact material fabricated by hot extrusion of internal oxidized Ag-Sn-Sb alloy powders. Mater. Sci. Eng. A 2012, 538, 202–209. [Google Scholar] [CrossRef] [Scilit]
- Zhang, E.; Liu, C.X.; Zhang, J.Z.; Zhao, Q.; Jiao, K.; Huai, Z.; Ma, Y.; Wu, H.; Zhang, X.; Wang, L. High-strength and wear-resistant precious metal sliding electrical contact materials. J. Mater. Res. Technol. 2026, 43, 1866–1885. [Google Scholar] [CrossRef] [Scilit]
- Zhou, Z.J.; Liu, J.S.; Liu, Z.Y.; Zhang, S.; Ye, C.; Wu, Y.; Zhang, Y.; Huang, X.; Zhao, H.; Wang, P.; et al. Rapid Joule heating fabrication and properties of LaB6 dispersion strengthened silver matrix electrical contact materials. Ceram. Int. 2026, 52, 26215–26219. [Google Scholar] [CrossRef] [Scilit]
- Kesim, M.T.; Yu, H.; Sun, Y.; Aindow, M.; Alpay, S.P. Corrosion, oxidation, erosion and performance of Ag/W-based circuit breaker contacts: A review. Corros. Sci. 2018, 135, 12–34. [Google Scholar] [CrossRef] [Scilit]
- Huang, W.; Yu, H.; Wang, L.; Wu, X.; Ouyang, C.; Zhang, Y.; He, J. State of the art and prospects in sliver- and copper-matrix composite electrical contact materials. Mater. Today Commun. 2023, 37, 107256. [Google Scholar] [CrossRef] [Scilit]
- Zhu, D.; Xu, H.; Dong, D.; He, Y.; Zhao, X.; He, Q. Brazing of Ti-48Al-2Cr-2Nb and TiC/Ti matrix composite using Ag-28Cu filler alloy. Results Phys. 2019, 14, 102436. [Google Scholar] [CrossRef] [Scilit]
- Tian, Y.; Jia, S.J.; Liu, Y.Q.; Feng, Y.; He, W.; Peng, J.; Jiang, B. Influence of brazing temperature on microstructural characteristics and interfacial bonding strength in TA15/Ag-Cu-Ti (filler metal)/WC-xCo composites. Ceram. Int. 2025, 51, 62310–62322. [Google Scholar] [CrossRef] [Scilit]
- Zheng, Z.Y.; Wang, S.H.; Han, D.; Ma, R.; Du, A.; Fan, Y.; Zhao, X.; Cao, X. Effects of Cu, Sn, and Ti doping on the interfacial properties of Ag-based filler metal/WC: First-principles study and experimental characterization. J. Mater. Res. Technol. 2023, 27, 4169–4179. [Google Scholar] [CrossRef] [Scilit]
- Xu, Y.S.; Zhou, W.W.; Yi, L.F.; Kubo, I.; Zhou, Z.; Chen, Z.-C.; Nomura, N. Severe plastic deformation promoted simultaneous enhancement in strength and ductility of multilayer MXene/Ag matrix composites. Scr. Mater. 2025, 261, 116612. [Google Scholar] [CrossRef] [Scilit]
- Hao, X.; Wang, X.H.; Zhou, S.M.; Zhang, H.; Liu, M. Microstructure and properties of silver matrix composites reinforced with Ag-doped graphene. Mater. Chem. Phys. 2018, 215, 327–331. [Google Scholar] [CrossRef] [Scilit]
- Zhou, Z.J.; Liu, D.F.; Wei, Y.J. Investigation on arc erosion characteristics of Ag/Ti3SiC2 composites in SF6 mixed with buffer gases. Vacuum 2022, 206, 111536. [Google Scholar] [CrossRef] [Scilit]
- Yang, J.S.; Ye, F.; Cheng, L.F.; Zhao, K.; Wei, Y. Effects of hydrogen-helium ions irradiation on Ti3SiC2- containing interphase or coating in SiCf/SiC. J. Eur. Ceram. Soc. 2024, 44, 6356–6366. [Google Scholar] [CrossRef] [Scilit]
- Wang, D.D.; Tian, W.B.; Lu, C.J.; Ding, J.; Zhu, Y.; Zhang, M.; Zhang, P.; Sun, Z. Comparison of the interfacial reactions and properties between Ag/Ti3AlC2 and Ag/Ti3SiC2 electrical contact materials. J. Alloys Compd. 2021, 857, 157588. [Google Scholar] [CrossRef] [Scilit]
- Lorenz, M.; Travitzky, N.; Rambo, C.R. Effect of processing parameters on in situ screen printing-assisted synthesis and electrical properties of Ti3SiC2-based structures. J. Adv. Ceram. 2021, 10, 129–138. [Google Scholar] [CrossRef] [Scilit]
- Wang, X.D.; Li, W.T.; Peng, Z.W.; Yang, X.; Wang, M. First-Principles Investigation of Interfacial Bonding, Stability, and Electronic Properties at the Fe(111)/Ti3SiC2(0001) Interface. Nanomaterials 2026, 16, 647. [Google Scholar] [CrossRef] [Scilit] [PubMed]
- Wang, D.D.; Tian, W.B.; Ding, J.X.; Bin Ma, A.; Zhu, Y.F.; Zhang, P.G.; He, W.; Sun, Z.M. Anisotropic arc erosion resistance of Ag/Ti3AlC2 composites induced by the alignment of Ti3AlC2. Corros. Sci. 2020, 171, 108633. [Google Scholar] [CrossRef] [Scilit]
- Das, P.; Ganguly, S.; Rosenkranz, A.; Wang, B.; Yu, J.; Srinivasan, S.; Rajabzadeh, A.R. MXene/0D nanocomposite architectures: Design, properties and emerging applications. Mater. Today Nano 2023, 24, 100428. [Google Scholar] [CrossRef] [Scilit]
- Thangavelu, H.H.S.; Huang, C.; Chabanais, F.; Palisaitis, J.; Persson, P.O.Å. A review on MXene terminations. Adv. Funct. Mater. 2026, 36, e15604. [Google Scholar] [CrossRef] [Scilit]
- Guo, Y.; Xie, X.; Liu, Z.Q.; Zhuo, L.; Zhang, J.; Wang, S.; Duan, Q.; Jia, Q.; Xu, D.; Xue, W.; et al. Wear-resistant Ag-MAX phase 3D interpenetrating composites with bi-continuous architectures. Nano Res. 2024, 17, 806–819. [Google Scholar] [CrossRef] [Scilit]
- Zhou, Z.J.; Feng, Y.; Zhao, H.; Qian, G.; Zhang, J.; Zhang, X.; Huang, X. Arc erosion behavior and mechanism of Ag/Ti3SiC2 cathodes in different atmospheres. Ceram. Int. 2021, 47, 2319–2328. [Google Scholar] [CrossRef] [Scilit]
- Jiang, W.L.; Henager, C.H.; Varga, T.; Jung, H.J.; Overman, N.R.; Zhang, C.; Gou, J. Diffusion of Ag, Au and Cs implants in MAX phase Ti3SiC2. J. Nucl. Mater. 2015, 462, 310–320. [Google Scholar] [CrossRef] [Scilit]
- Chen, H.Y.; Peng, J.K.; Fu, L. Effects of interfacial reaction and atomic diffusion on the mechanical property of Ti3SiC2 ceramic to Cu brazing joints. Vacuum 2016, 130, 56–62. [Google Scholar] [CrossRef] [Scilit]
- Wang, M.J.; Wei, D.; Lai, Y.Q.; Shou, H.; Liu, S.; Zheng, H.; Zhang, Y.; Yang, X.; Zhao, T.; Wang, R. Enhanced nucleation at Al(111)/Ti3AlC2(0001) interfaces: The role of doping in adhesion and interfacial stability. Vacuum 2024, 229, 113553. [Google Scholar] [CrossRef] [Scilit]
- Siegel, D.J.; Hector, L.G.; Adams, J.B. Adhesion, atomic structure, and bonding at the Al(111)/α-Al2O3(0001) interface: A first principles study. Phys. Rev. B 2002, 65, 085415. [Google Scholar] [CrossRef] [Scilit]
- Sun, T.; Wu, X.; Wang, R.; Li, W.; Liu, Q. First-principles study on the adhesive properties of Al/TiC interfaces: Revisited. Comput. Mater. Sci. 2017, 126, 108–120. [Google Scholar] [CrossRef] [Scilit]
- Wang, M.J.; Wei, D.; Wang, L.Y.; Liu, M.; Wang, B.; Zheng, H.; Zhang, Y. Insight into the heterogeneous nucleation mechanism of Ti3AlC2/Mg interface doped with alloying elements by using first-principles calculation. RSC Adv. 2025, 15, 8630–8644. [Google Scholar] [CrossRef] [Scilit] [PubMed]
- Wang, M.J.; Zhang, Y.J.; Zheng, H.X.; Ru, Z.; Yang, X. Mechanical properties and fracture behavior of Al(111)/MgAlB4(0001) interface in Al matrix composites: A first-principle calculation study. Mater. Res. Express 2023, 10, 096509. [Google Scholar] [CrossRef] [Scilit]
- Wang, M.J.; Sun, J.W.; Li, S.Y.; Meng, Y.; Zheng, H.; Yin, Z.; Fu, Y.; Zhang, Y. Heterogeneous nucleation mechanisms in Mg(0001)/Al3BC(0001) interfaces: Insights for advanced Mg-based composites. Surf. Interfaces 2024, 46, 104040. [Google Scholar] [CrossRef] [Scilit]
- Orellana, W.; Gutiérrez, G. First-principles calculations of the thermal stability of Ti3SiC2 (0001) surfaces. Surf. Sci. 2011, 605, 2087–2091. [Google Scholar] [CrossRef] [Scilit]
- Wang, Z.C.; Tsukimoto, S.; Saito, M.; Ikuhara, Y. SiC/Ti3SiC2 interface: Atomic structure, energetics, and bonding. Phys. Rev. B 2009, 79, 045318. [Google Scholar] [CrossRef] [Scilit]
- Zhou, Y.C.; Sun, Z.M. Electronic structure and bonding properties in layered ternary carbide Ti3SiC2. J. Phys.-Condens. Matter. 2000, 12, L457–L462. [Google Scholar] [CrossRef] [Scilit]
- Xiong, H.; Gu, L.; Wang, J.; Zhou, L.; Ying, T.; Wang, S.; Zhou, H.; Li, J.; Gao, Y.; Zeng, X. The interface structure and property of magnesium matrix composites: A review. J. Magnes. Alloys 2024, 12, 2595–2623. [Google Scholar] [CrossRef] [Scilit]
- Wang, Q.; Li, Y.; Chen, Z.; Wang, M.; Zhu, H.; Wang, H. Understanding alloying behaviors of Sc, Ni and Zn additions on Al/TiB2 interfaces based on interfacial characteristics and solute properties. Surf. Interfaces 2021, 26, 101427. [Google Scholar] [CrossRef] [Scilit]
- Sun, T.; Wu, X.; Li, W.; Wang, R. The mechanical and electronic properties of Al/TiC interfaces alloyed by Mg, Zn, Cu, Fe and Ti: First-principles study. Phys. Scr. 2015, 90, 035701. [Google Scholar] [CrossRef] [Scilit]
- Ravnikar, D.; Rajamure, R.S.; Trdan, U.; Dahotre, N.B.; Grum, J. Electrochemical and DFT studies of laser-alloyed TiB2/TiC/Al coatings on aluminium alloy. Corros. Sci. 2018, 136, 18–27. [Google Scholar] [CrossRef] [Scilit]
- Ding, H.M.; Jin, W.C.; Qi, F.G.; Liu, Q.; Qiu, Q. Atomic insight on the electronic structure and interfacial bonding characterization of the Cu/TiC interface. Ceram. Int. 2024, 50, 46791–46801. [Google Scholar] [CrossRef] [Scilit]
- Meng, Q.; Tan, M.; Guo, X.; Li, T.; Gu, S.; Chen, C.; Zhang, F. Investigation on the formation mechanism of composite inclusions by multi-scale characterization in high manganese steel with yttrium addition. Mater. Charact. 2024, 207, 113579. [Google Scholar] [CrossRef] [Scilit]
- Perdew, J.P.; Burke, K.; Wang, Y. Generalized gradient approximation for the exchange correlation hole of a many-electron system. Phys. Rev. B 1996, 54, 16533. [Google Scholar] [CrossRef] [Scilit] [PubMed]
- Wang, M.J.; Sun, J.W.; Meng, Y.C.; Li, S.; Shou, H.; Zhang, G.; Yin, Z.; Dong, Y.; Zheng, H.; Zhang, Y. Insights into the effects of La on the grain refinement and mechanical properties of Al-Ti-C intermediate alloy and pure Al: A first-principle study and experimental investigation. J. Alloys Compd. 2024, 1002, 175290. [Google Scholar] [CrossRef] [Scilit]
- Chen, B.; Lai, Y.Q.; Wang, M.J.; Liu, M.; Zhang, C.H. Influence of doping element segregations on the solution and diffusion properties of hydrogen in γ/γ′ interface of DZ411 superalloy. Int. J. Hydrogen Energy 2025, 121, 189–201. [Google Scholar] [CrossRef] [Scilit]
- Zhang, G.W.; Xu, C.; Wang, M.J.; Dong, Y.; Sun, F.; Ren, X.; Xu, H.; Zhao, Y. Pressure effect of the mechanical, electronics and thermodynamic properties of Mg-B compounds A first-principles investigations. Sci. Rep. 1996, 54, 11169–11186. [Google Scholar] [CrossRef] [Scilit]
- Bengtsson, L. Dipole correction for surface supercell calculations. Phys. Rev. B 1999, 59, 12301–12304. [Google Scholar] [CrossRef] [Scilit]
- Ji, J.; Zhang, L.; Yu, J.M.; Lee, W.E.; Middleburgh, S.C.; Li, D.; Wang, X.; Li, Q.; Wang, Z.; Shi, G.; et al. Interface properties of Ti3SiC2/Al2O3 ceramics: Combined experiments and first-principles calculations. Ceram. Int. 2021, 47, 6409–6417. [Google Scholar] [CrossRef] [Scilit]
- Li, Y.; Zhang, X.Z.; Zhang, S.Y.; Song, X.; Wang, Y.; Chen, Z. First principles study of stability, electronic structure and fracture toughness of Ti3SiC2/TiC interface. Vacuum 2022, 196, 110745. [Google Scholar] [CrossRef] [Scilit]
- Nian, Y.H.; Zhang, Z.Y.; Yang, S.N.; Liu, M.; Zhang, K.; Zhou, X. Interface energy, adhesion work and electronic structure of Ti3AlC2/Ag interface calculated from first principles. Vacuum 2024, 224, 113158. [Google Scholar] [CrossRef] [Scilit]
- Sun, Y.B.; Yong, X.; Zhang, D.Y.; Huang, R.S.; Wu, Z.Y.; Zhou, X.L. First-principles investigation of the Ag/BCC-NbN interface. Surf. Interfaces 2026, 94, 109488. [Google Scholar] [CrossRef] [Scilit]
- Catti, M. Kinetic mechanisms of the pressure-driven phase transitions of AgI. Phys. Rev. B 2005, 72, 064105. [Google Scholar] [CrossRef] [Scilit]
- Zhang, K.; Pang, M.; Zhan, Y. Atomic structure and electronic properties of Ag(111)/TiC(111) interface: Insights from first-principles simulations. J. Phys. Chem. Solids 2019, 124, 212–220. [Google Scholar] [CrossRef] [Scilit]
- Wang, M.J.; Han, H.M.; Zhang, G.W.; Xu, H.; Yin, Z.; Dong, Y.; Fu, Y. Effect of solute elements (Ni, Sn, P) on the adhesion and electronic properties of α-Fe/Cu heterogeneous interface: A first-principles study. Results Phys. 2022, 38, 105659. [Google Scholar] [CrossRef] [Scilit]
- Chen, B.; Liu, M.P.; Wang, M.J.; Zhang, C.-H. Theoretical study on hydrogen permeation and fault slip of γ-Ni/γ′-Ni3Al interface with alloying elements (Zr, Nb, Ru, Re, and Hf). Mater. Today Commun. 2024, 39, 109169. [Google Scholar] [CrossRef] [Scilit]
- Liu, M.P.; Lu, Y.D.; Song, J.; Ma, B.Y.; Qiu, K.; Bai, L.; Wang, Y.; Chen, Y.; Tang, Y. First-Principles Investigation on the Tunable Electronic Structures and Photocatalytic Properties of AlN/Sc2CF2 and GaN/Sc2CF2 Heterostructures. Molecules 2024, 29, 3303. [Google Scholar] [CrossRef] [Scilit] [PubMed]
- Li, X.; Hui, Q.; Shao, D.Y.; Chen, J.; Wang, P.; Jia, Z.; Li, C.; Chen, Z.; Cheng, N. First-principles study on the stability and electronic structure of Mg/ZrB2 interfaces. Sci. China Mater. 2016, 59, 28–37. [Google Scholar] [CrossRef] [Scilit]

Disclaimer/Publisher’s Note: The statements, opinions and data contained in all publications are solely those of the individual author(s) and contributor(s) and not of MDPI and/or the editor(s). MDPI and/or the editor(s) disclaim responsibility for any injury to people or property resulting from any ideas, methods, instructions or products referred to in the content. |
© 2026 by the authors. Licensee MDPI, Basel, Switzerland. This article is an open access article distributed under the terms and conditions of the Creative Commons Attribution (CC BY) license.