


Abstract
Subgrade collapse threatens coastal infrastructure under harsh environments, where deterioration accelerates deformation and failure risk. Accurate prediction is essential, yet traditional monitoring suffers from low informatization and delayed response. Thus, this paper presents a Micro-Electro-Mechanical Systems (MEMS)-based intelligent perception-driven method for subgrade collapse deformation prediction to improve the level of intelligence in subgrade collapse monitoring and prediction. Firstly, a hierarchical prediction framework is established based on subgrade deformation monitoring scenarios, consisting of an intelligent perception layer, a collapse deformation prediction layer, and a functional application layer, with the functions of each layer systematically defined. Secondly, two key technologies involved in the proposed framework, including MEMS data cleaning and time-series feature extraction, as well as the deformation prediction model, are identified and corresponding solutions are developed. Finally, a linear sliding rail experiment and a subgrade collapse model test are conducted to validate the feasibility and effectiveness of the proposed method. The results indicated that effective MEMS data cleaning was achieved through Leave-One-Out Encoding (LOOE) encoding, missing value imputation, and normalization. Accurate time-series feature representation was obtained by combining seismic parameter extraction with a sliding window strategy. The improved the improved Long Short-Term Memory–Back Propagation (LSTM-BP) model model achieved accurate prediction of collapse displacement, with an accuracy of 95.56%. The proposed MEMS-based intelligent perception method accurately captured the evolution trend and spatial heterogeneity of subgrade collapse deformation, and the results can be used to support and guide early warning of subgrade collapse, providing technical support for the safety and durability management of coastal and offshore infrastructure under harsh environmental conditions.
1. Introduction
Subgrade is a critical load-bearing structure in transportation infrastructure, particularly in coastal and offshore environments, where its operational safety is essential to the service life of these facilities [1]. However, as the service period extends, various factors, such as leakage and cavitation of underground pipelines, seepage erosion, insufficient backfill compaction, and disturbances from underground engineering, can induce subgrade collapse and deformation to varying degrees [2,3]. In coastal regions, additional environmental effects such as high humidity, salt exposure, and cyclic loading further accelerate material deterioration and structural degradation. These issues accelerate structural failure and threaten the safety of transportation facilities. Notably, subgrade collapse is highly concealed and occurs suddenly [4], making early identification of deformation critical for mitigating disaster risks [5]. Therefore, investigating monitoring and prediction methods for subgrade deformation is of great practical significance for ensuring transportation infrastructure safety.
Subgrade collapse is closely related to the continuous characterization of deformation. Subgrade collapse does not occur instantaneously but develops progressively through the continuous evolution of internal structural states [6]. Its macroscopic response is reflected in the cumulative growth of displacement [7]. Compared with discrete observations at an isolated time point, deformation time-series data not only reflect the dynamic transition of the subgrade from a stable to an unstable state [8] but also provide a basis for identifying the stage characteristics of collapse, namely slow development, accelerated growth, and stabilization or instability [9]. Notably, for engineering objects such as roadbeds, which operate in complex environments and exhibit distinct transitional characteristics during defect evolution [10], continuous acquisition and analysis of subsidence deformation data are essential to accurately reveal the key evolutionary patterns in the subsidence formation process [11].
The analytical mechanism of collapse-induced deformation time-series data is pivotal for achieving early warning of subgrade failure. As primary monitoring tools, sensors such as levels, satellite remote sensing, ground-penetrating radar (GPR), and distributed optical fibers can acquire multi-source information, including collapse displacement, spatial deformation, and vibration response [12,13,14]. These data are typically analyzed via time-domain analysis, frequency-domain analysis, and statistical feature extraction to identify and evaluate the subgrade condition. Notably, traditional analysis methods struggle to characterize the small-amplitude, slow-varying, and non-stationary deformation features during the collapse incubation stage. This limitation arises from insufficient long-term continuous monitoring capability and limited adaptability to complex environments. Recent studies have further shown that instability processes affecting infrastructures and complex slopes often require integrated investigation using multiple monitoring and characterization approaches, in order to better identify deformation mechanisms, assess risk evolution, and support engineering decision-making. Such multi-method perspectives are particularly important where slope instability and infrastructure performance are closely coupled [15].The introduction of high-frequency, intelligent continuous sensing mechanisms has become an effective approach to enhance the analytical capability for collapse and failure [16], and the high-frequency characteristics of Micro-Electro-Mechanical Systems (MEMS) align with the requirements of continuous subgrade deformation monitoring. The authors previously developed a MEMS monitoring device [17] to achieve collaborative monitoring of soil deformation in complex slopes. Unfortunately, MEMS time-series signals often suffer from strong noise, local drift, and data loss. Specifically, displacement analysis based on MEMS acceleration signals typically relies on time-domain integration, which causes integration errors to accumulate over time [18], thereby reducing the accuracy of subgrade collapse early warning. Therefore, achieving intelligent parsing of MEMS time-series data and accurate prediction of collapse deformation under complex conditions of noise, drift, and missing data is critical for realizing early warning of subgrade collapse.
In recent years, sustainable development strategies and infrastructure governance programs have placed increasing emphasis on the resilience, digitalization, and long-term durability of transportation infrastructure, particularly in coastal and offshore environments exposed to harsh service conditions. In this context, intelligent monitoring and early-warning technologies are increasingly needed to support risk prevention, condition-based maintenance, and sustainable asset management of subgrade systems. Therefore, developing a reliable deformation monitoring and prediction method based on Micro-Electro-Mechanical Systems (MEMS) sensing is not only a technical issue but also an important engineering approach to improving infrastructure safety, serviceability, and sustainability. The purpose of this paper is to propose a MEMS-based intelligent sensing method for predicting roadbed collapse deformation and to validate its effectiveness in supporting early warning of subgrade collapse. The rest of this paper is organized as follows. Section 1 presents the methodology for subgrade collapse deformation prediction. Section 2 validates and analyzes the proposed prediction model. Section 3 presents a case study of sand model box collapse. Finally, some concluding remarks are summarized in Section 4.
2. Methodology for Subgrade Collapse Deformation Prediction
The methodology adopted in this study integrates established techniques in a problem-oriented manner. Specifically, data preprocessing, missing-value imputation, sliding-window-based time-series organization, LSTM, BP neural networks, and genetic-algorithm-based optimization are all derived from existing methodological foundations. Therefore, the novelty of this study lies not in proposing a new standalone algorithm, but in developing an integrated MEMS-based intelligent sensing and deformation prediction framework for subgrade collapse and settlement monitoring, in which data cleaning, physically meaningful feature construction, and an optimized LSTM-BP model are combined into a unified engineering-oriented workflow.
2.1. Framework of the Subgrade Collapse Deformation Prediction Model
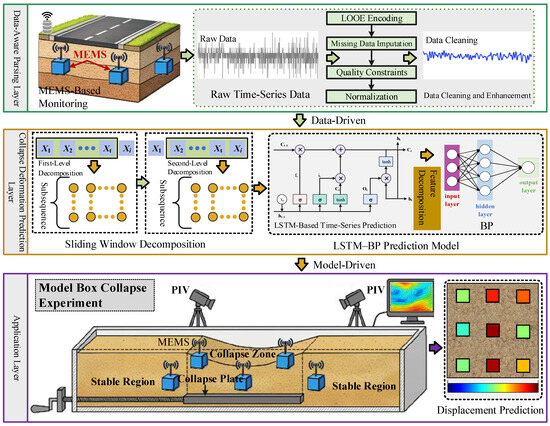
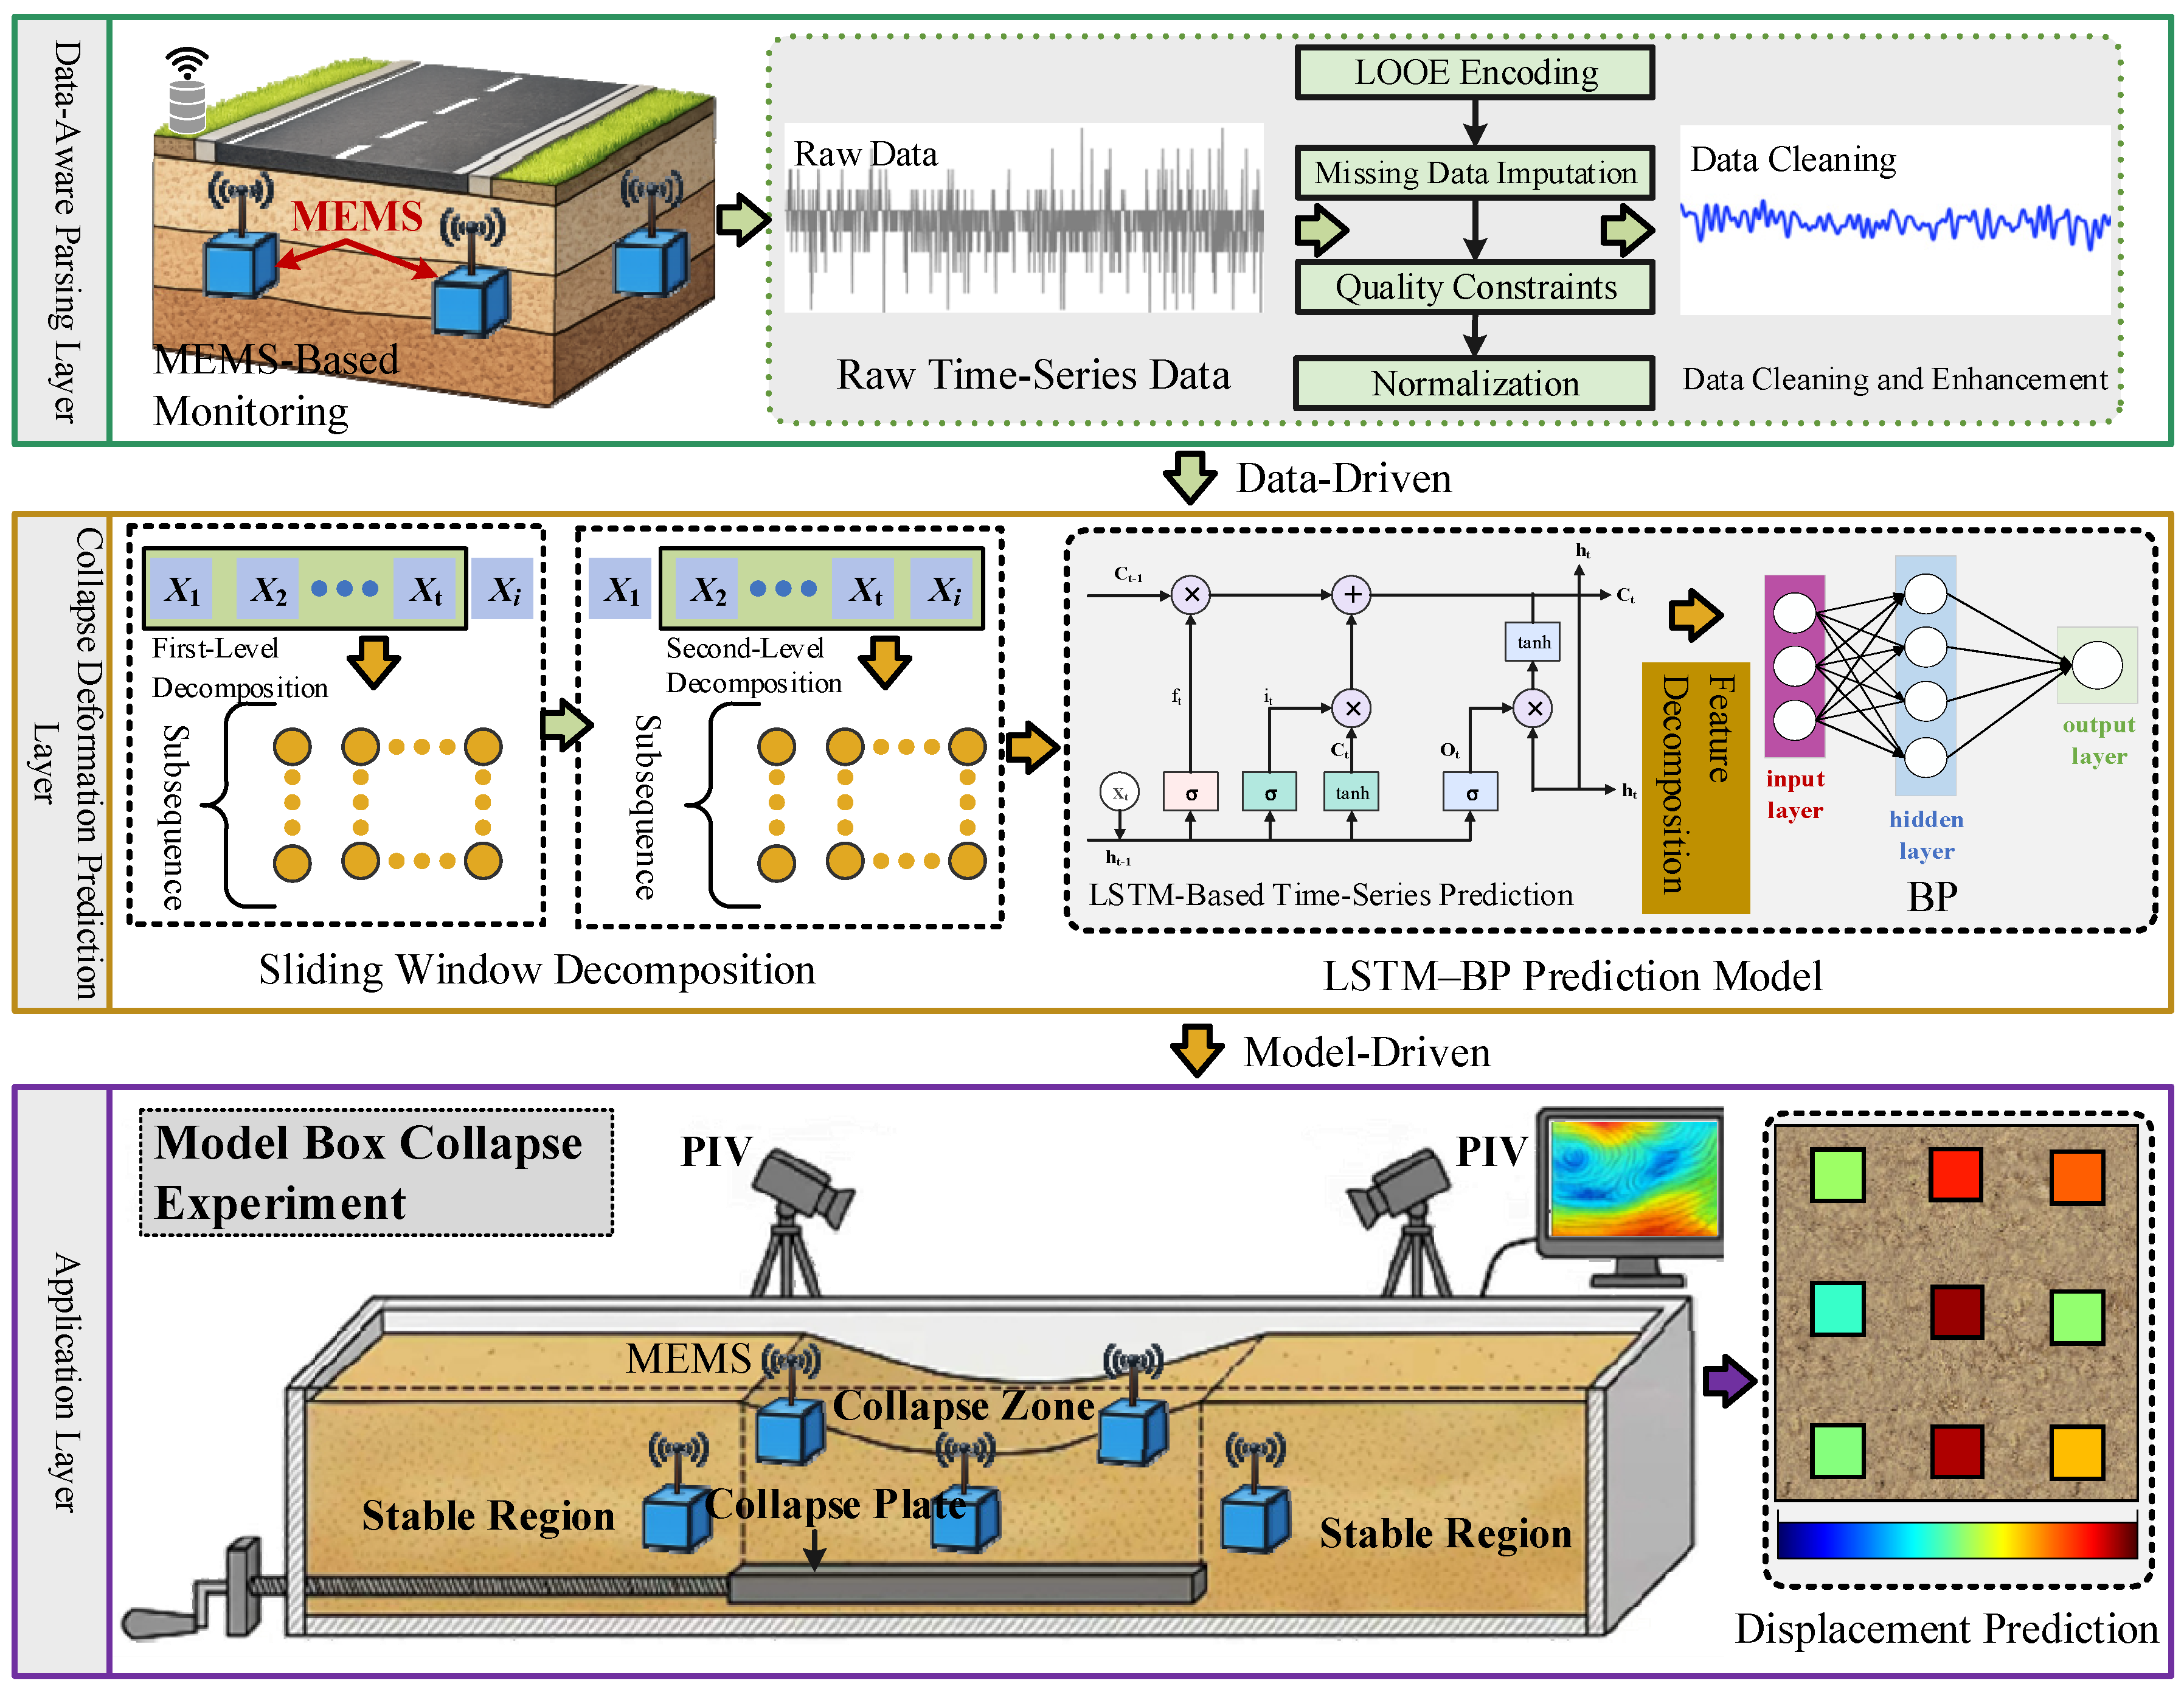
Based on the operation and maintenance context of subgrade engineering, a MEMS-based intelligent sensing framework for subgrade settlement prediction was established, as shown in Figure 1.
Figure 1.
Framework of roadbed collapse and deformation prediction model.
The framework consists of three layers: the intelligent perception layer, the settlement prediction layer, and the application layer, and is designed for subgrade systems under complex conditions, including coastal environments. It is noteworthy that the intelligent perception layer serves as the foundation for the settlement prediction layer and the application layer. It focuses on the acquisition and parsing of MEMS time-series data under complex conditions. This layer reveals the representation mechanism of settlement information under noise interference, drift error, and missing data. The settlement prediction layer and the application layer extend the intelligent perception layer. Specifically, the settlement prediction layer aims to achieve MEMS data-driven settlement prediction, while the application layer implements the proposed MEMS-based intelligent sensing method for subgrade settlement prediction. The implementation techniques of this framework are described in the following sections.
2.2. MEMS-Based Intelligent Sensing Method
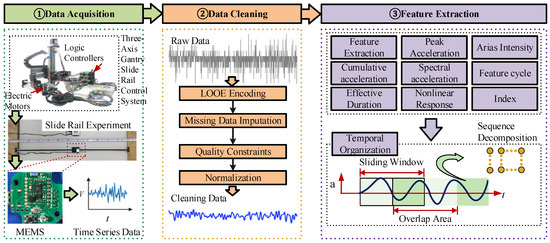
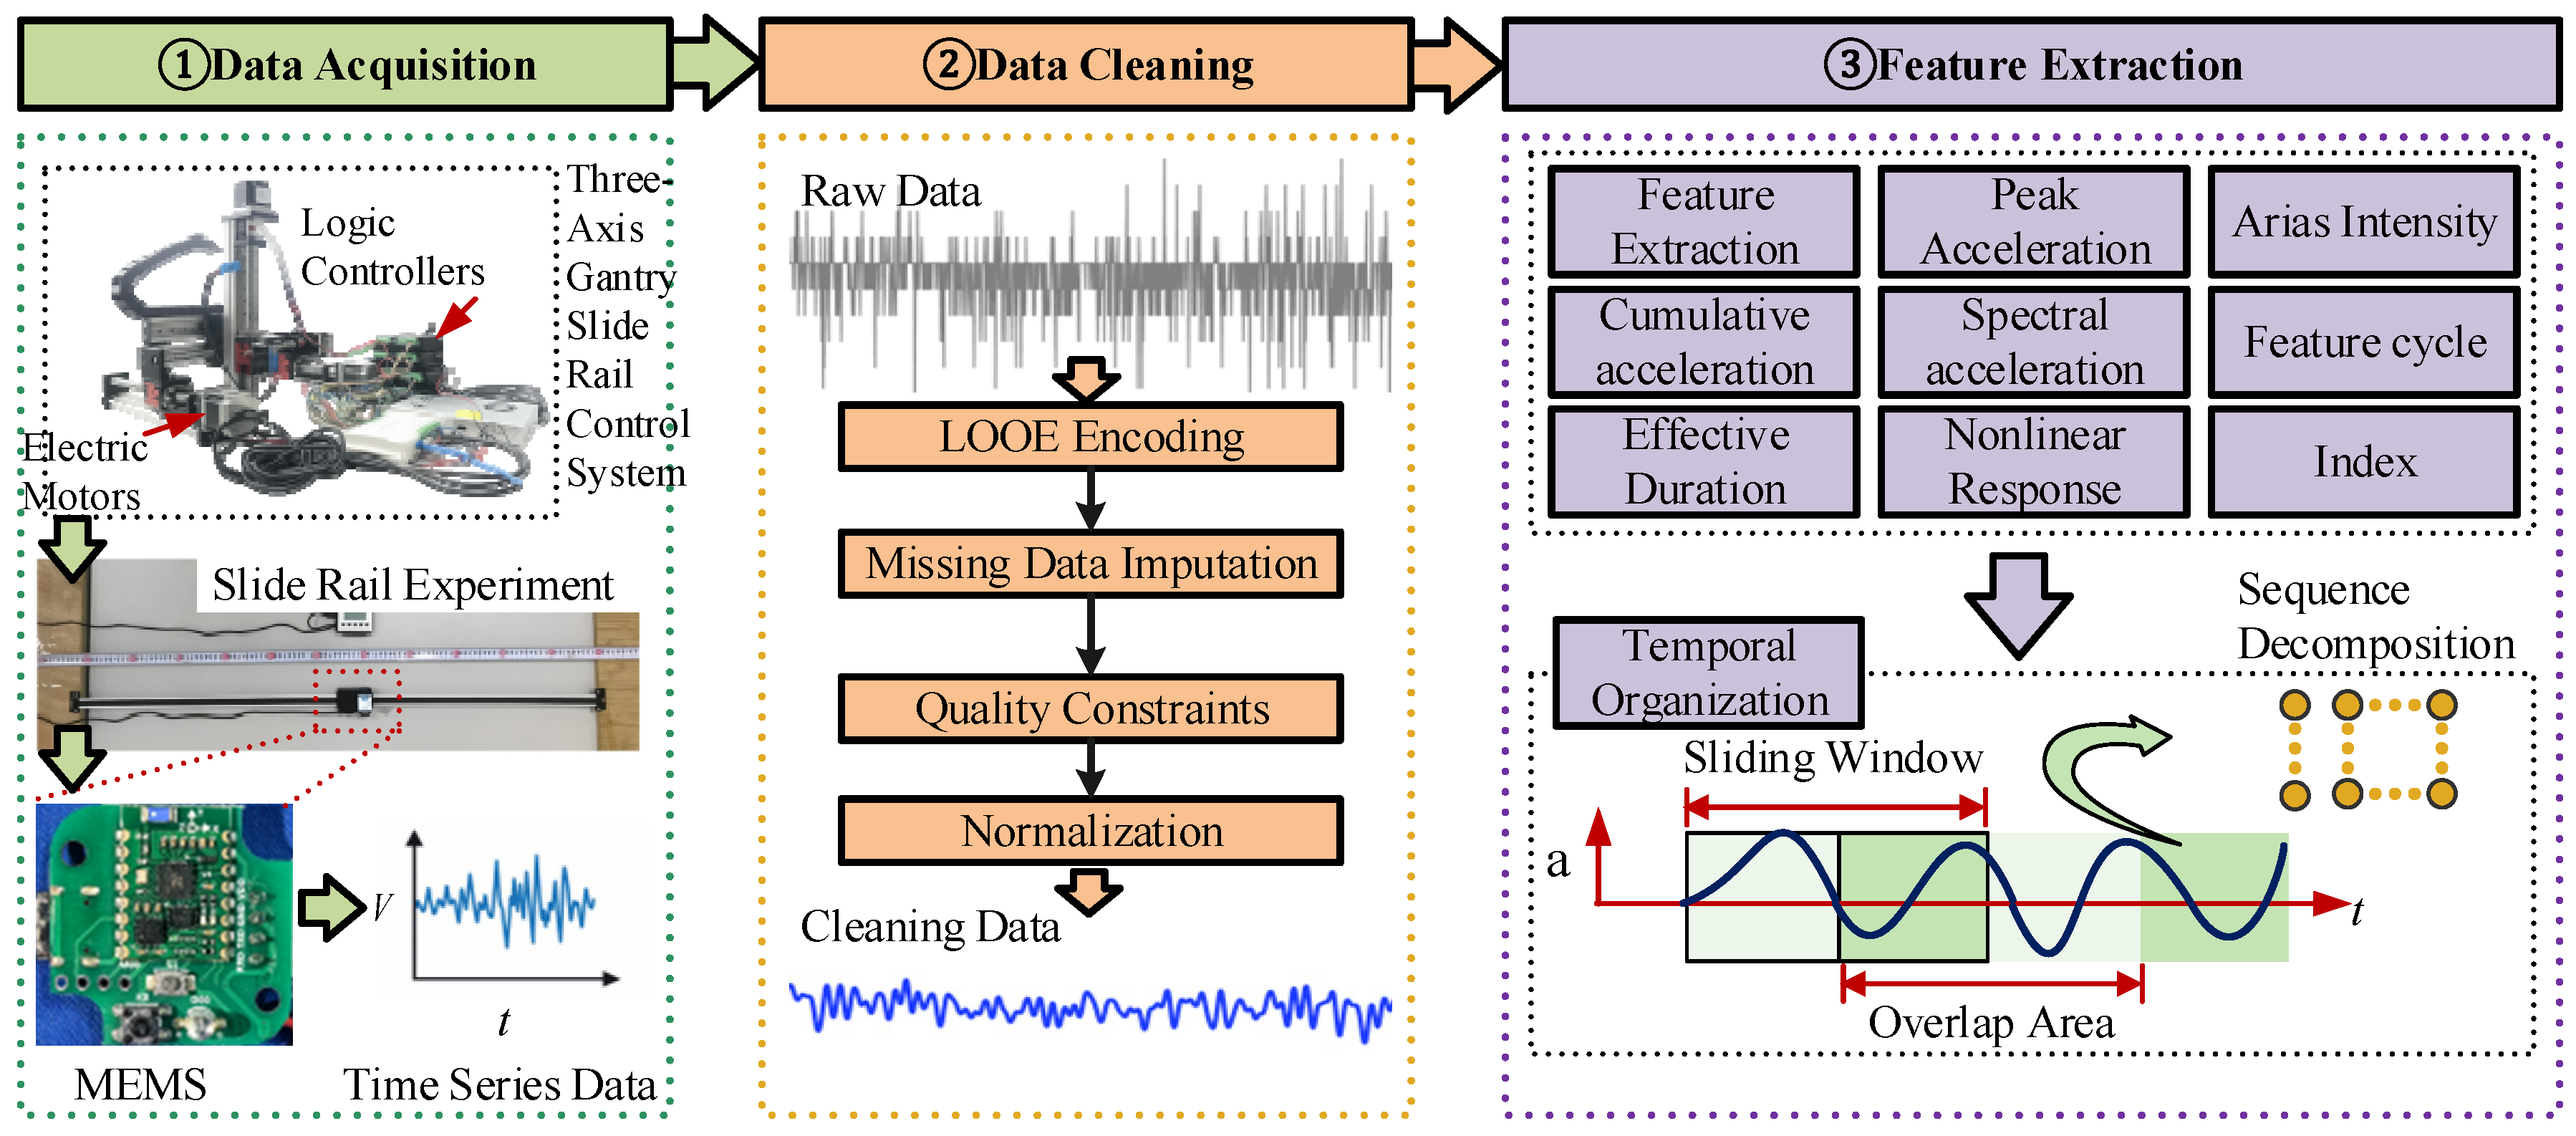
The MEMS-based intelligent sensing method serves as the foundation for subgrade collapse early warning. The key to this method lies in the continuous acquisition and reliable parsing of settlement time-series data. The intelligent sensing process consists of three parts: data acquisition, data cleaning, and time-series feature representation, as shown in Figure 2.
Figure 2.
Flowchart of the intelligent sensing process.
2.2.1. Data Acquisition
MEMS data acquisition is based on the sensing and conversion mechanism of micro-electromechanical inertial devices in response to the dynamic behavior of the target medium, converting continuous physical responses into digital time-series signals. Taking acceleration measurement as an example, the proof mass inside a MEMS accelerometer produces relative displacement under external acceleration, which leads to changes in sensing elements such as capacitance. After signal conditioning and analog-to-digital conversion, discrete acceleration sequences are obtained. Meanwhile, the MEMS can simultaneously acquire angular velocity, magnetic field, and attitude information. These data are used for installation attitude calibration and gravity component correction, thereby improving the consistency and comparability of multi-point measurements.
2.2.2. Data Cleaning
To ensure that MEMS acceleration data meet the requirements for subsequent feature construction and model training, data cleaning and normalization workflow are developed. Firstly, LOOE encoding was adopted to convert discrete identifiers into numerical representations, thereby improving the consistency and comparability of multi-point data for subsequent model training [19]. Secondly, missing values were imputed using commonly adopted machine learning-based methods, including Random Forest, K-nearest neighbors, and LightGBM, to improve data completeness and reliability [20]. The final imputation scheme was selected according to temporal trend consistency, amplitude plausibility, and its contribution to the downstream prediction performance on the validation set. The imputed results are further validated using temporal trend consistency and amplitude constraints to avoid non-physical fluctuations. Finally, the data are standardized by mean removal and variance normalization to eliminate scale differences and dimensional bias among different measurement points and features, thereby improving the convergence and generalization performance of the model. In this study, the raw MEMS records were processed in the following order: identifier encoding, missing-value imputation, mean removal and variance normalization, feature extraction, and sliding-window-based sample construction.
2.2.3. Time-Series Feature Analysis
Time-series feature parsing aims to extract features that characterize the evolution of settlement displacement from the cleaned time-series data, transforming high-dimensional, noisy, and non-stationary signals into model-learnable inputs. The process consists of feature extraction and temporal organization. For feature extraction, eight seismic parameters describing signal intensity, energy, and frequency characteristics are introduced, as depicted in Table 1. Feature importance analysis is performed to identify a set of physically meaningful features. For temporal organization, a sliding window strategy was employed to segment the MEMS acceleration sequences, which is a commonly used approach for constructing local time-series samples from continuous signals [21]. Specifically, subsequences are extracted from the original acceleration series using a fixed window length and updated with a predefined step size, where new data are introduced and old data are removed to achieve dynamic feature updating. Feature parameters are calculated within each window and aligned at the end of the window to construct a continuous feature time-series sequence. By setting the step size smaller than the window length, overlapping segmentation is achieved, which expands the sample size and enhances temporal consistency while avoiding information leakage.
Table 1.
Ground motion parameters.
2.3. MEMS Data-Driven Collapse Deformation Prediction Model
Displacement is typically obtained from MEMS acceleration signals using double integration in the time domain. However, due to the presence of DC components, bias, and baseline drift in acceleration signals, these errors are gradually amplified during the integration process. Under long-term monitoring and noise interference, traditional methods struggle to achieve reliable prediction of settlement evolution. In contrast, machine learning methods establish a nonlinear mapping between acceleration features and displacement response, enabling direct displacement prediction without explicit integration and improving the prediction capability for complex non-stationary responses. Therefore, developing machine learning models based on parsed MEMS data is critical for settlement displacement prediction.
The time-series data after MEMS processing do not represent the original acceleration at a single time point, but consist of samples composed of eight acceleration features extracted using a sliding window, namely
where denotes the eight-dimensional acceleration feature vector extracted within the window at time , and represents the length of the time window. It should be noted that the displacement at a given time is not only related to the acceleration features within the current window but also closely associated with the cumulative response, variation rate, and stage transition characteristics reflected by several preceding windows.
Long Short-Term Memory (LSTM) networks capture the temporal evolution of feature sequences through memory units that continuously update the influence of previous features on the current displacement. The updating mechanism is expressed as follows:
where represents the memory state at time , denotes the hidden state representation. The variables , and ot correspond to the forget gate, input gate, and output gate, respectively. Specifically, can be regarded as the cumulative representation of acceleration features from multiple preceding windows toward the current displacement state, thereby enhancing the model’s ability to learn historical information from diverse feature sequences. It should be noted that the mapping relationship between MEMS features and displacement, constructed based on LSTM, involves not only temporal dependencies but also complex nonlinear relationships jointly induced by sensor response, variations in motion velocity, and feature combination effects. In other words, while LSTM is proficient at extracting temporal information, its expressive capacity is limited regarding the amplitude mapping of how these variations correspond to specific displacement increments. Thus, a Back Propagation (BP) network is introduced as a nonlinear regression layer within the LSTM model. This layer further maps the hidden states extracted by the LSTM into predicted displacement values, expressed as
where st is the predicted displacement, and are the weight matrices, and denote the bias terms, (⋅) represents the activation function. Through this cascaded machine learning architecture, hierarchical mapping from MEMS feature inputs to collapse displacement outputs is achieved, as expressed as follows:
Since the hyperparameters θ are unknown, a genetic algorithm is introduced to perform global optimization of the LSTM–BP model parameters to determine their optimal values. Through a population evolution mechanism, the number of hidden layer nodes, learning rate, and network structure parameters are adaptively searched, thereby improving the prediction accuracy and stability of the model.
3. Validation and Analysis of the MEMS Data-Driven Collapse Deformation Prediction Model
To validate the feasibility and effectiveness of the proposed MEMS-based intelligent sensing method and settlement prediction model, a linear sliding rail experiment was conducted as a case study. The results of the MEMS data-driven settlement prediction method were analyzed.
3.1. Construction of the MEMS Dataset
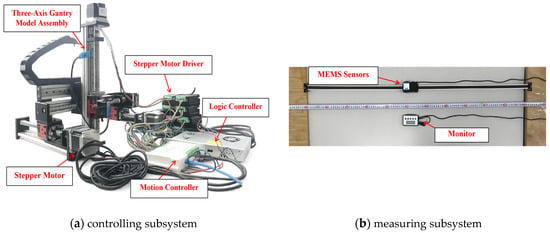
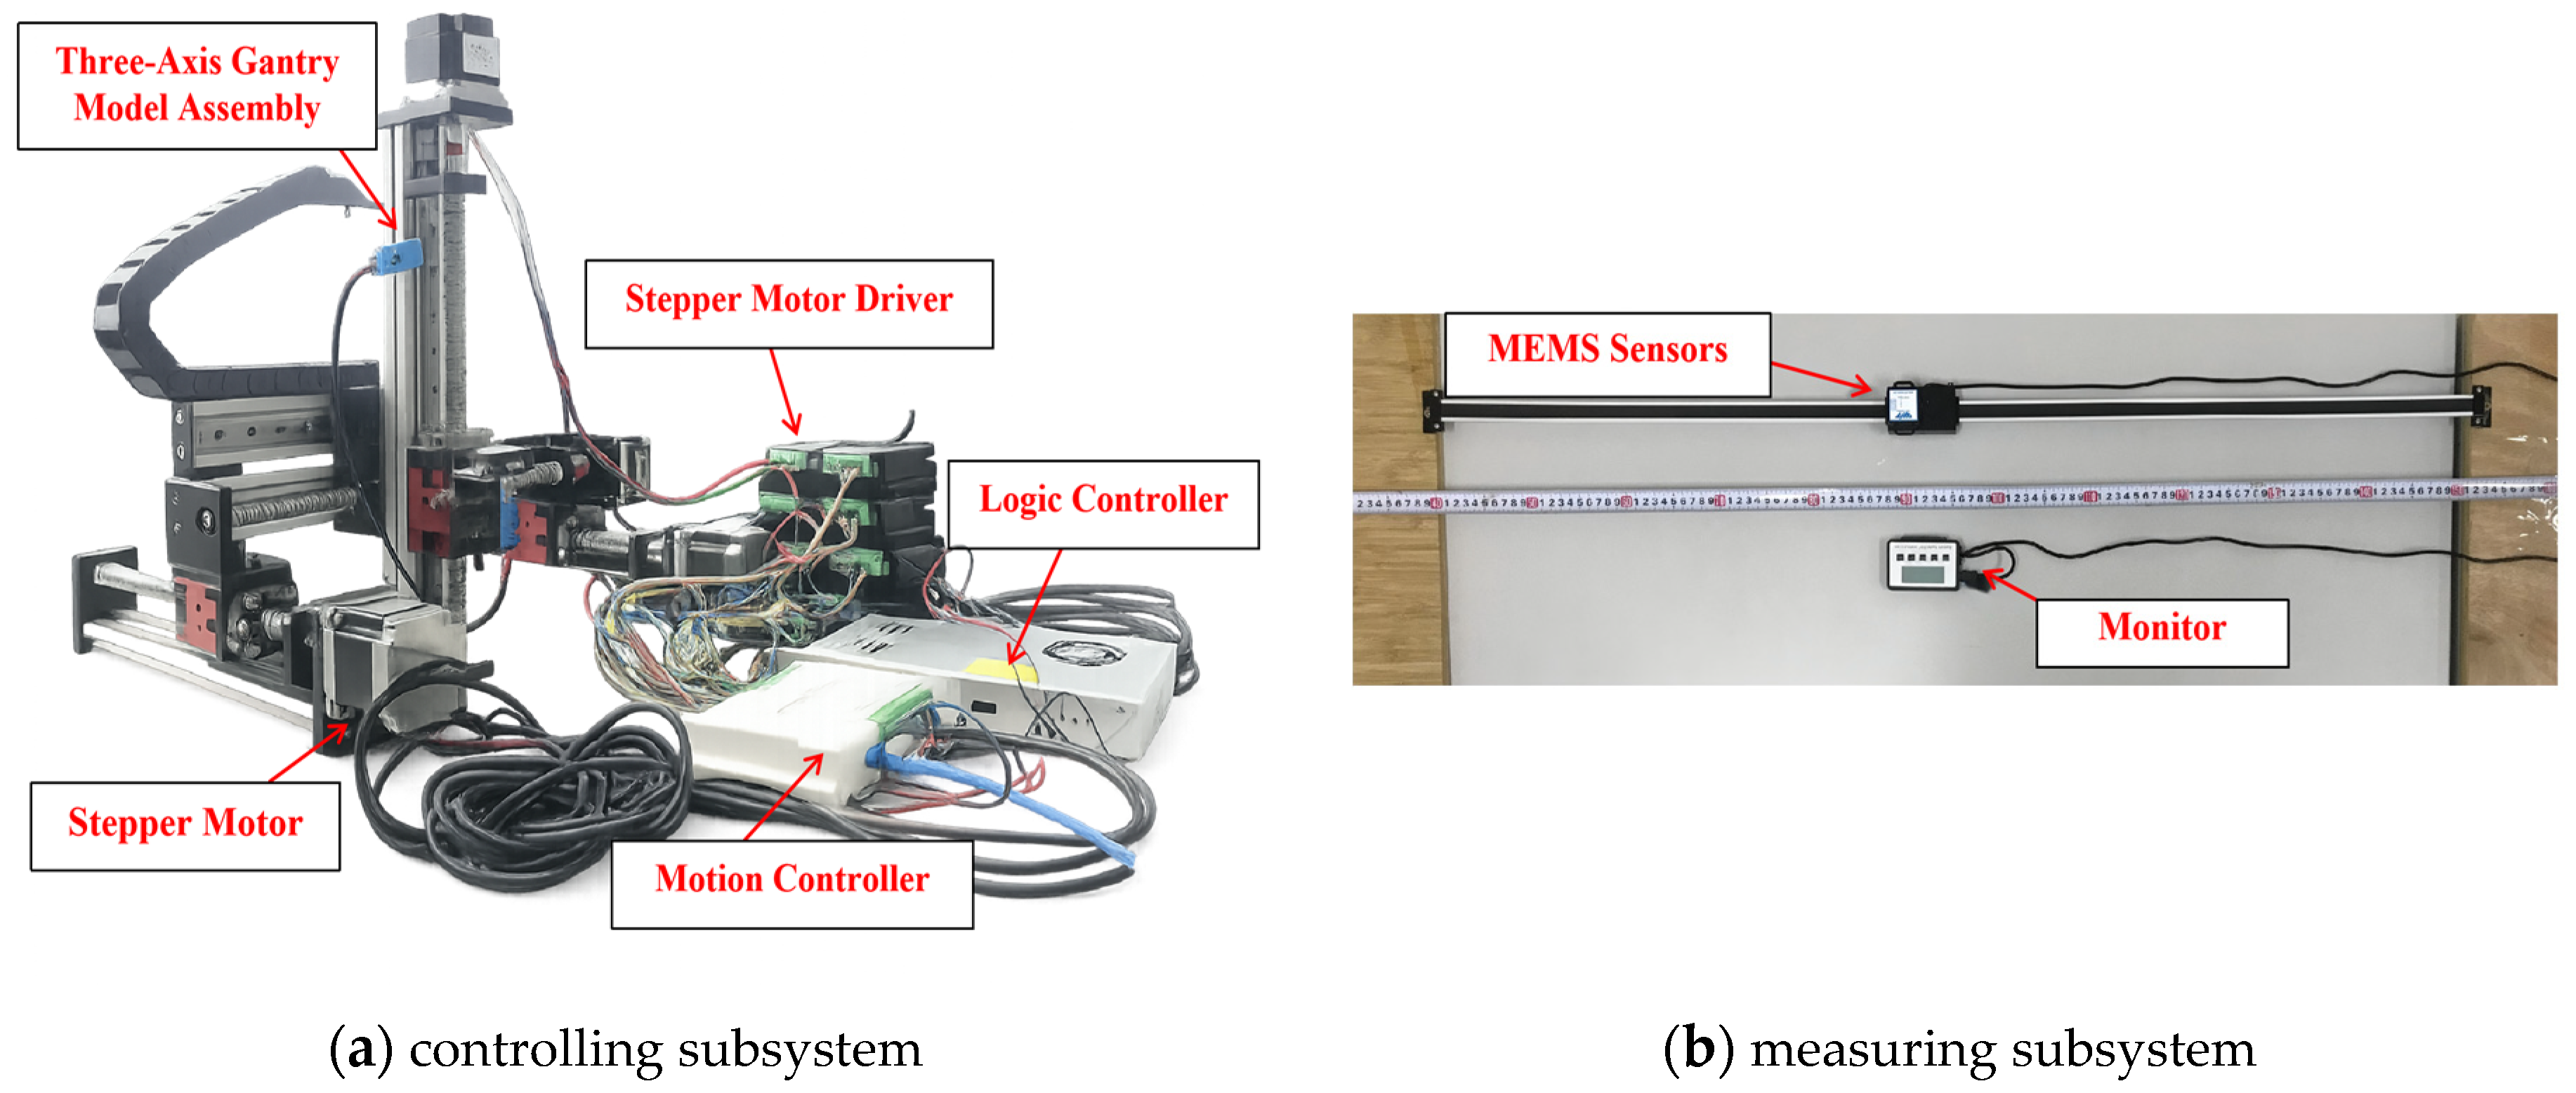
A dataset for LSTM–BP model training was constructed based on the linear sliding rail experiment. Figure 3 shows the sliding rail test platform, which consists of a motion control subsystem and a measurement subsystem. The motion control subsystem generates controllable acceleration inputs and enables precise loading under different waveform conditions. The measurement subsystem synchronously acquires acceleration time-series data from MEMS sensors, providing stable and continuous dynamic response information. During the experiment, the slider motion was precisely controlled to follow predefined acceleration waveforms. Unlike random disturbances, the acceleration input adopted in this study is a controllable waveform, whose variation can be uniquely determined by a functional form, thereby ensuring input consistency. The experimental conditions and dataset scale of the linear sliding rail test are summarized in Table 2.
Figure 3.
Linear sliding rail experimental system.
Table 2.
Experimental conditions and data scale of the linear sliding rail test.
The collected data were used to construct the dataset samples. Based on the data cleaning method described in Section 2.2.2 and the feature extraction method in Section 2.2.3, the MEMS time-series data were processed to obtain the corresponding eight-dimensional acceleration feature vectors xt. Furthermore, a sliding window method was applied to transform the continuous feature sequence into model input samples. Meanwhile, the displacement measured by the sliding rail system was used to provide the ground-truth displacement stat each time step, serving as the supervised learning label. Thus, the dataset samples xt st were constructed.
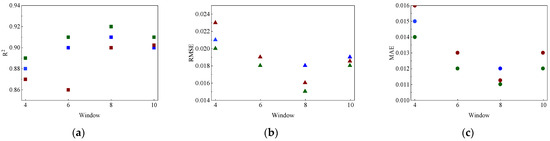
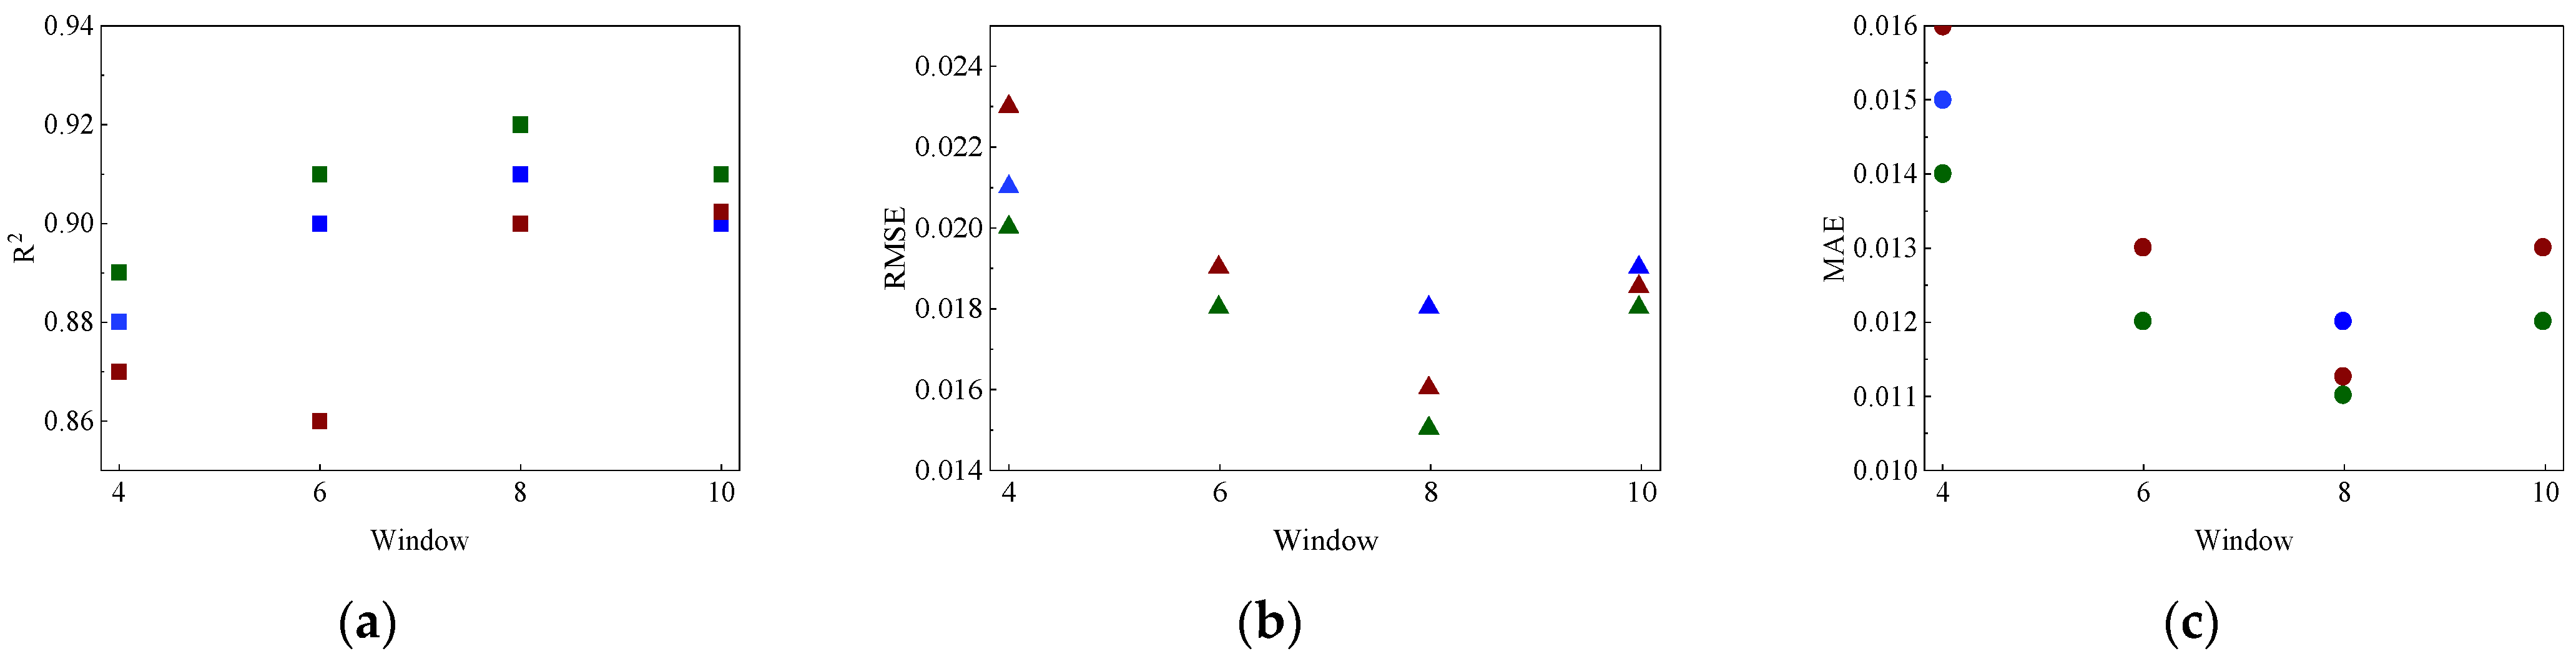
To determine appropriate sliding window parameters, a preliminary comparative analysis was conducted based on measured MEMS acceleration data. Different combinations of window lengths (4 s, 6 s, 8 s, and 10 s) and step sizes (25%, 50%, and 75% of the corresponding window length) were evaluated. The model performance was compared using R2, RMSE, and MAE. Figure 4 presents the evaluation results under different parameter combinations. As the window length increased from 4 s to 8 s, the model performance improved, with increased R2 and reduced RMSE and MAE. However, when the window length increased to 10 s, the performance reached a plateau and slightly decreased, indicating that excessively long windows introduce redundant information and reduce feature sensitivity. For the step size, the best performance was achieved under 50% overlap, which balances sample size and temporal continuity. The final window configuration was selected according to the validation performance of the prediction model. Among all candidate combinations, the configuration with the highest and the lowest RMSE and MAE on the validation set was preferred. When performance differences were small, the configuration with better temporal continuity and lower computational redundancy was selected. Therefore, a window length of 8 s and a step size of 2 s (50% overlap) were selected as the optimal parameters.
Figure 4.
Model evaluation results for different combinations of window lengths and step sizes. (a) ; (b) RMSE; (c) MAE. Different colors represent different window-length and step-size combinations.
3.2. MEMS Intelligent Sensing
Based on the dataset constructed in Section 2.1, data cleaning was first performed to control missing segments, noise disturbances, and scale differences in the MEMS acceleration sequences. Then, to identify key feature parameters that dominate the displacement response, Pearson correlation coefficients were used to analyze the relationships between the eight seismic parameters and the maximum displacement, and feature construction was completed accordingly. Finally, a sliding window was applied to segment the feature sequence, generating time-series input samples for subsequent LSTM–BP model training and prediction.
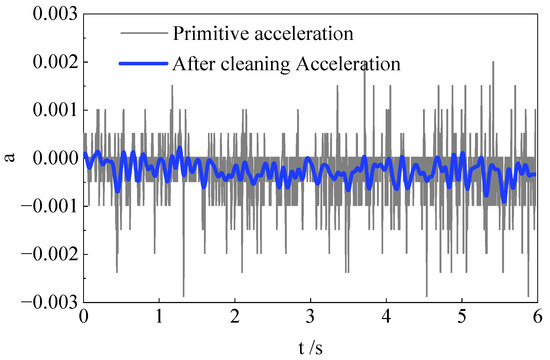
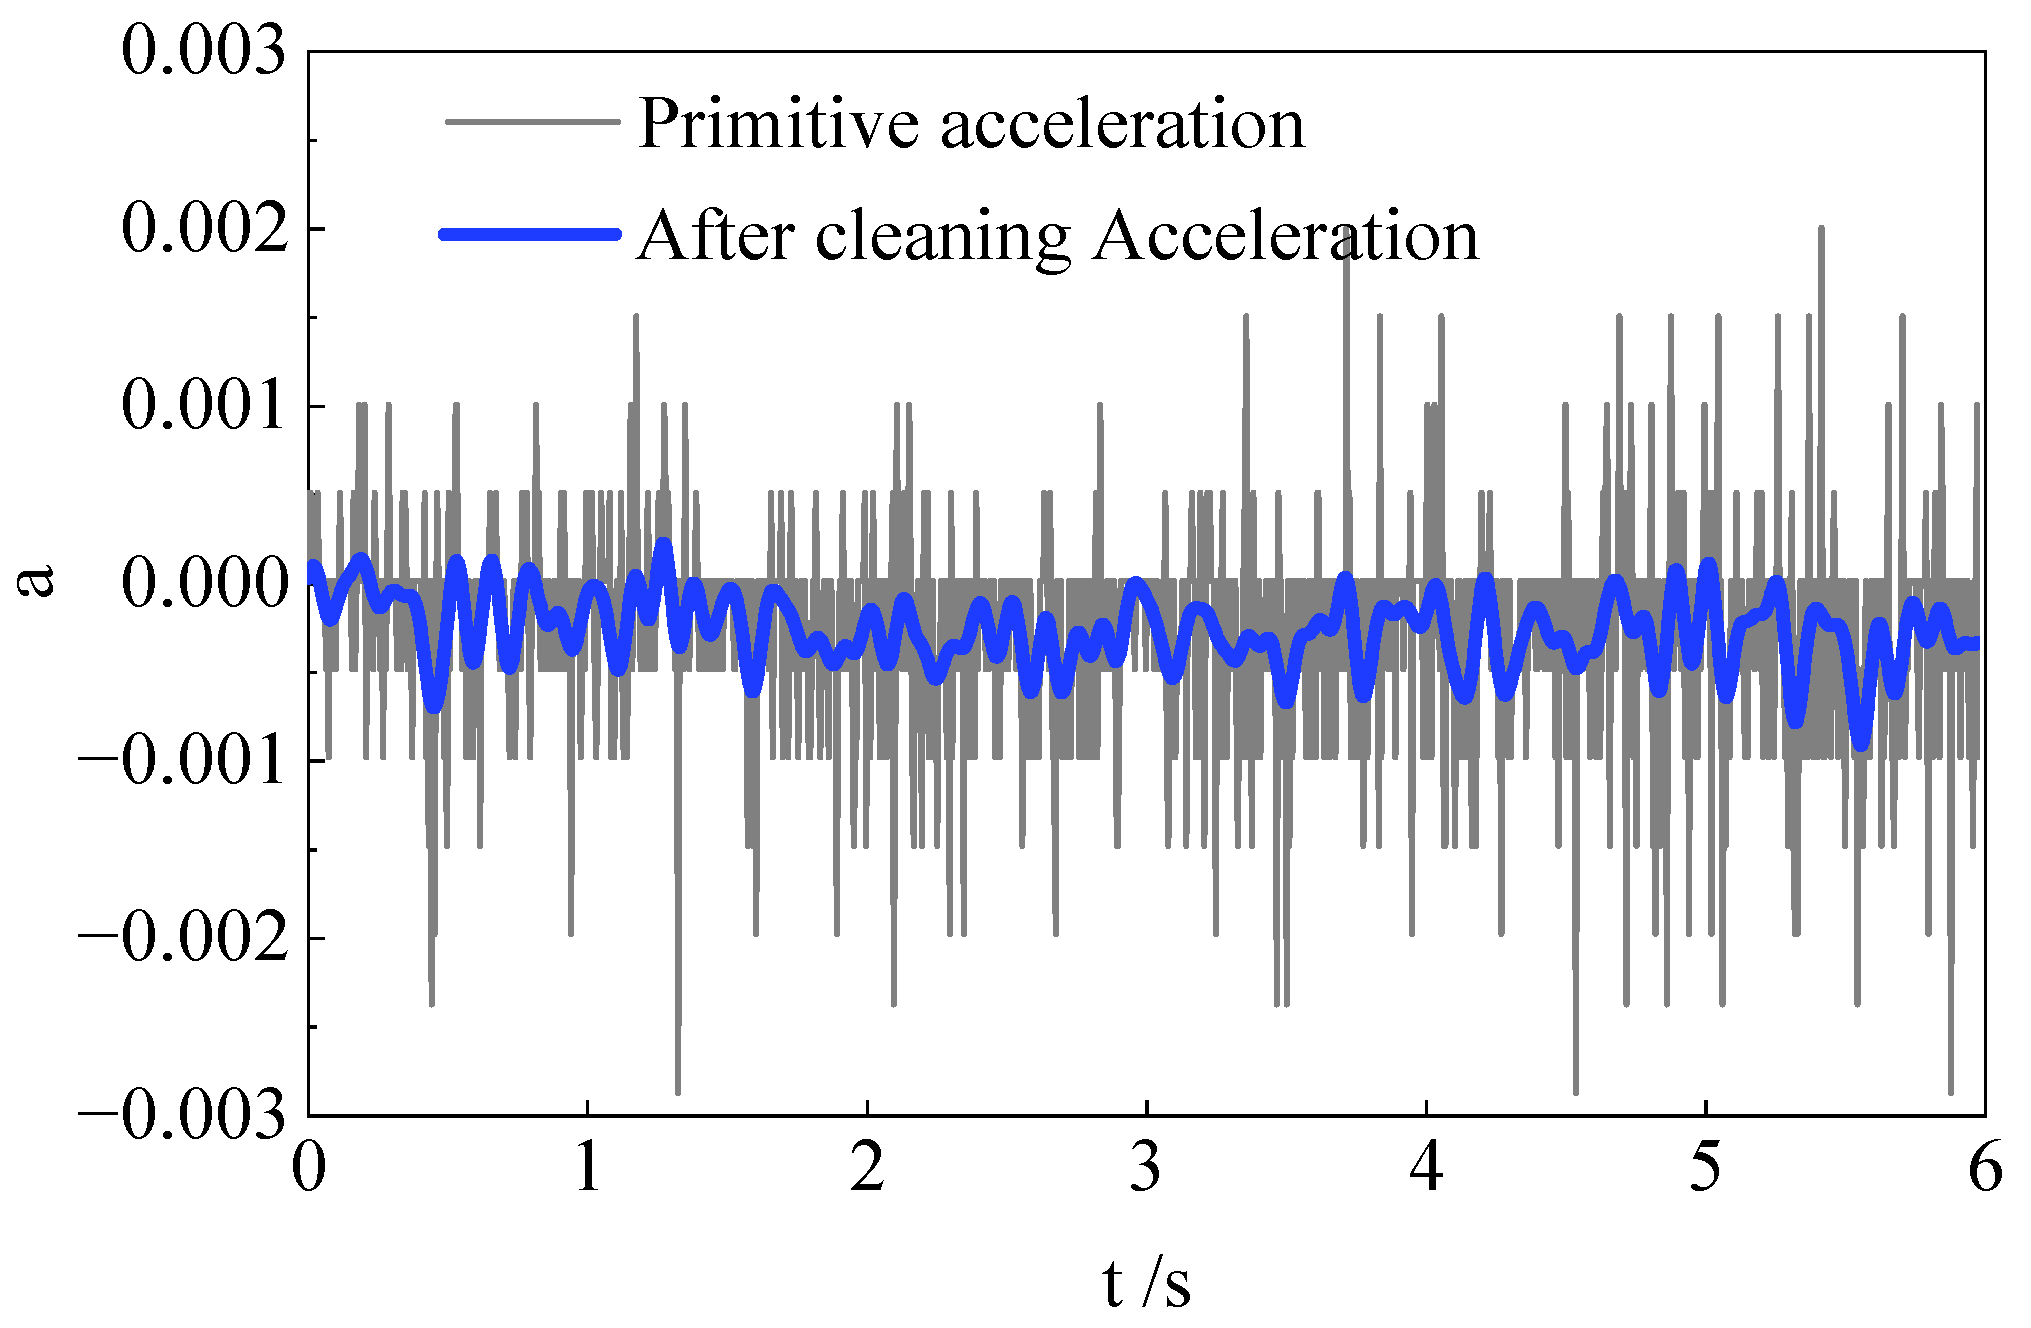
Figure 5 illustrates the comparison of MEMS data before and after data cleaning. The continuity of the MEMS acceleration sequence is significantly improved after cleaning, and no non-physical fluctuations are observed. Statistical results show that the signal standard deviation decreases from 5.94 × 10⁻⁴ to 1.90 × 10⁻⁴, representing a reduction of 68%, while the mean difference between adjacent time steps decreases by 60.1%, indicating that high-frequency noise and local abnormal fluctuations are effectively suppressed. Meanwhile, the signal mean changes by less than 2% before and after cleaning, and the overall trend remains consistent, indicating that no significant systematic bias is introduced. On this basis, the signal-to-noise ratio increases by approximately 6–10 dB, demonstrating that the proposed method achieves a good balance between noise suppression and signal fidelity.
Figure 5.
Comparison of MEMS acceleration signals before and after cleaning.
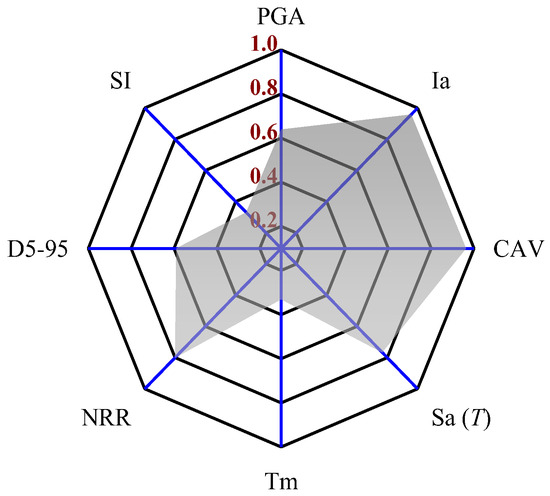
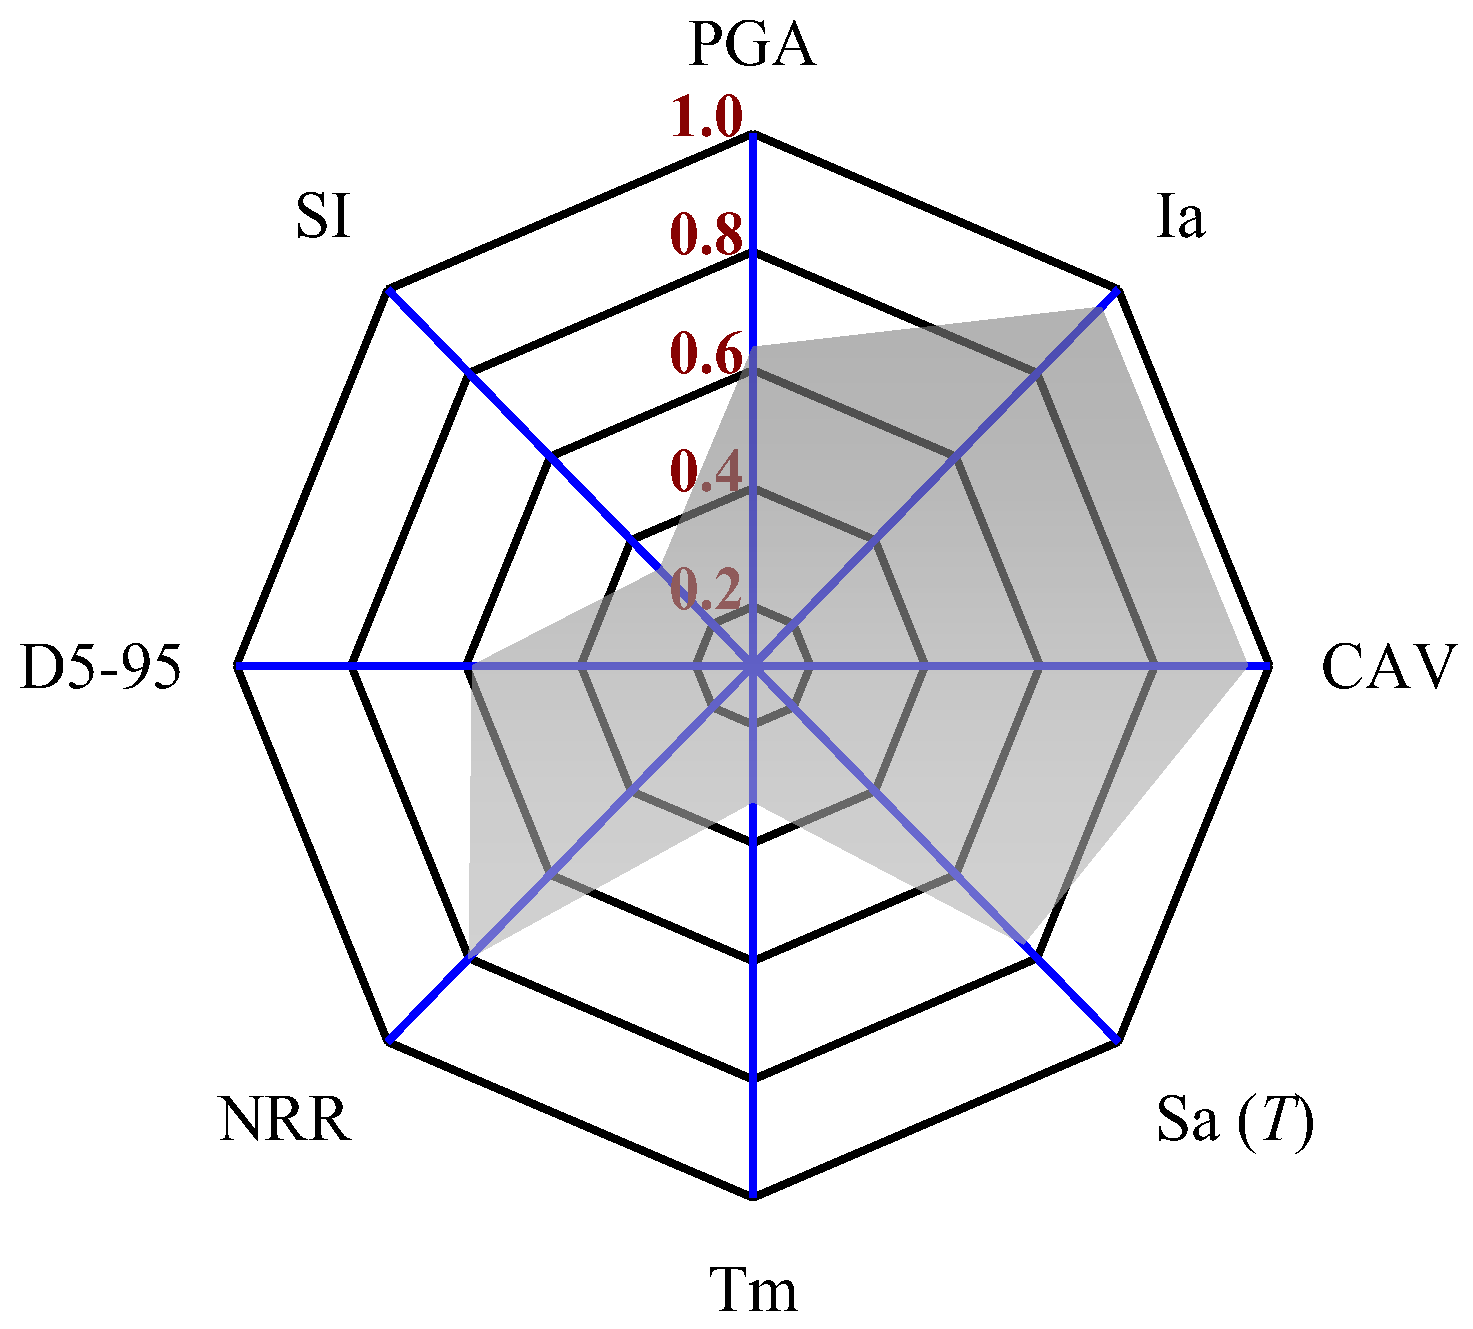
Figure 6 shows the radar chart of correlation coefficients for each parameter. CAV, Ia, and NRR exhibit strong positive correlations with the maximum displacement, indicating that cumulative effects and frequency characteristics dominate the displacement response. and PGA also show significant positive correlations, reflecting the direct influence of dynamic input intensity on displacement amplitude. In contrast, and SI show weak correlations and have limited explanatory power for displacement variation. shows a certain negative correlation, indicating that duration has an inhibitory effect on displacement response. Based on the correlation analysis and the physical meaning of the parameters, CAV, , NRR, and PGA are selected as input features for the model.
Figure 6.
Radar chart of the correlation coefficients of each parameter.
3.3. Collapse Displacement Prediction Model
3.3.1. Model Parameter Settings
To ensure stable training and high prediction accuracy, the model structure and training parameters were properly configured. Four seismic features identified by feature importance analysis were used as inputs, and the displacement at the corresponding time was taken as the output. The mean squared error (MSE) was used as the loss function, and the Adam optimizer was adopted with an initial learning rate of 0.001. The batch size was set to 32, and the maximum number of training epochs was set to 200. A dropout mechanism was introduced after the LSTM layer, and an early stopping strategy based on validation loss was applied to prevent overfitting. In terms of network structure, the LSTM subnetwork was used to extract temporal features, with an initial hidden size of 64. The BP subnetwork was used for nonlinear mapping, with an initial hidden size of 32, ReLU activation in the hidden layer, and a linear function in the output layer. Furthermore, a genetic algorithm was introduced to perform global optimization of the model hyperparameters. The genetic algorithm used real-valued encoding, with a population size of 20, a maximum of 30 iterations, a crossover probability of 0.8, and a mutation probability of 0.1. During optimization, the genetic algorithm searched for suitable combinations of network-related hyperparameters, including the hidden-layer size and learning-related parameters, with the objective of minimizing the validation loss. The final model was selected according to its overall validation performance in terms of , RMSE, and MAE, and was then evaluated on the independent test set. The dataset was divided into training set, validation set and independent testing set accounted for 70%, 15%, and 15%, respectively. The training set was used for parameter learning, the validation set was used for hyperparameter tuning and model selection, and the independent test set was used only for final performance evaluation. This separation was adopted to avoid biased model selection and to improve reproducibility.
3.3.2. Analysis of Prediction Results
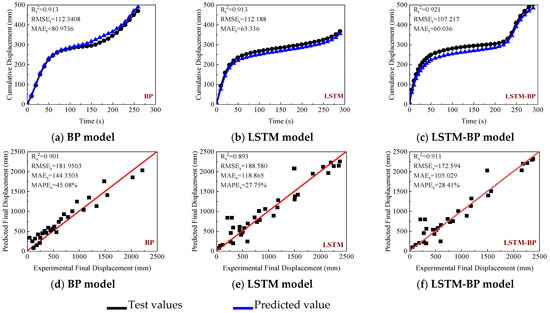
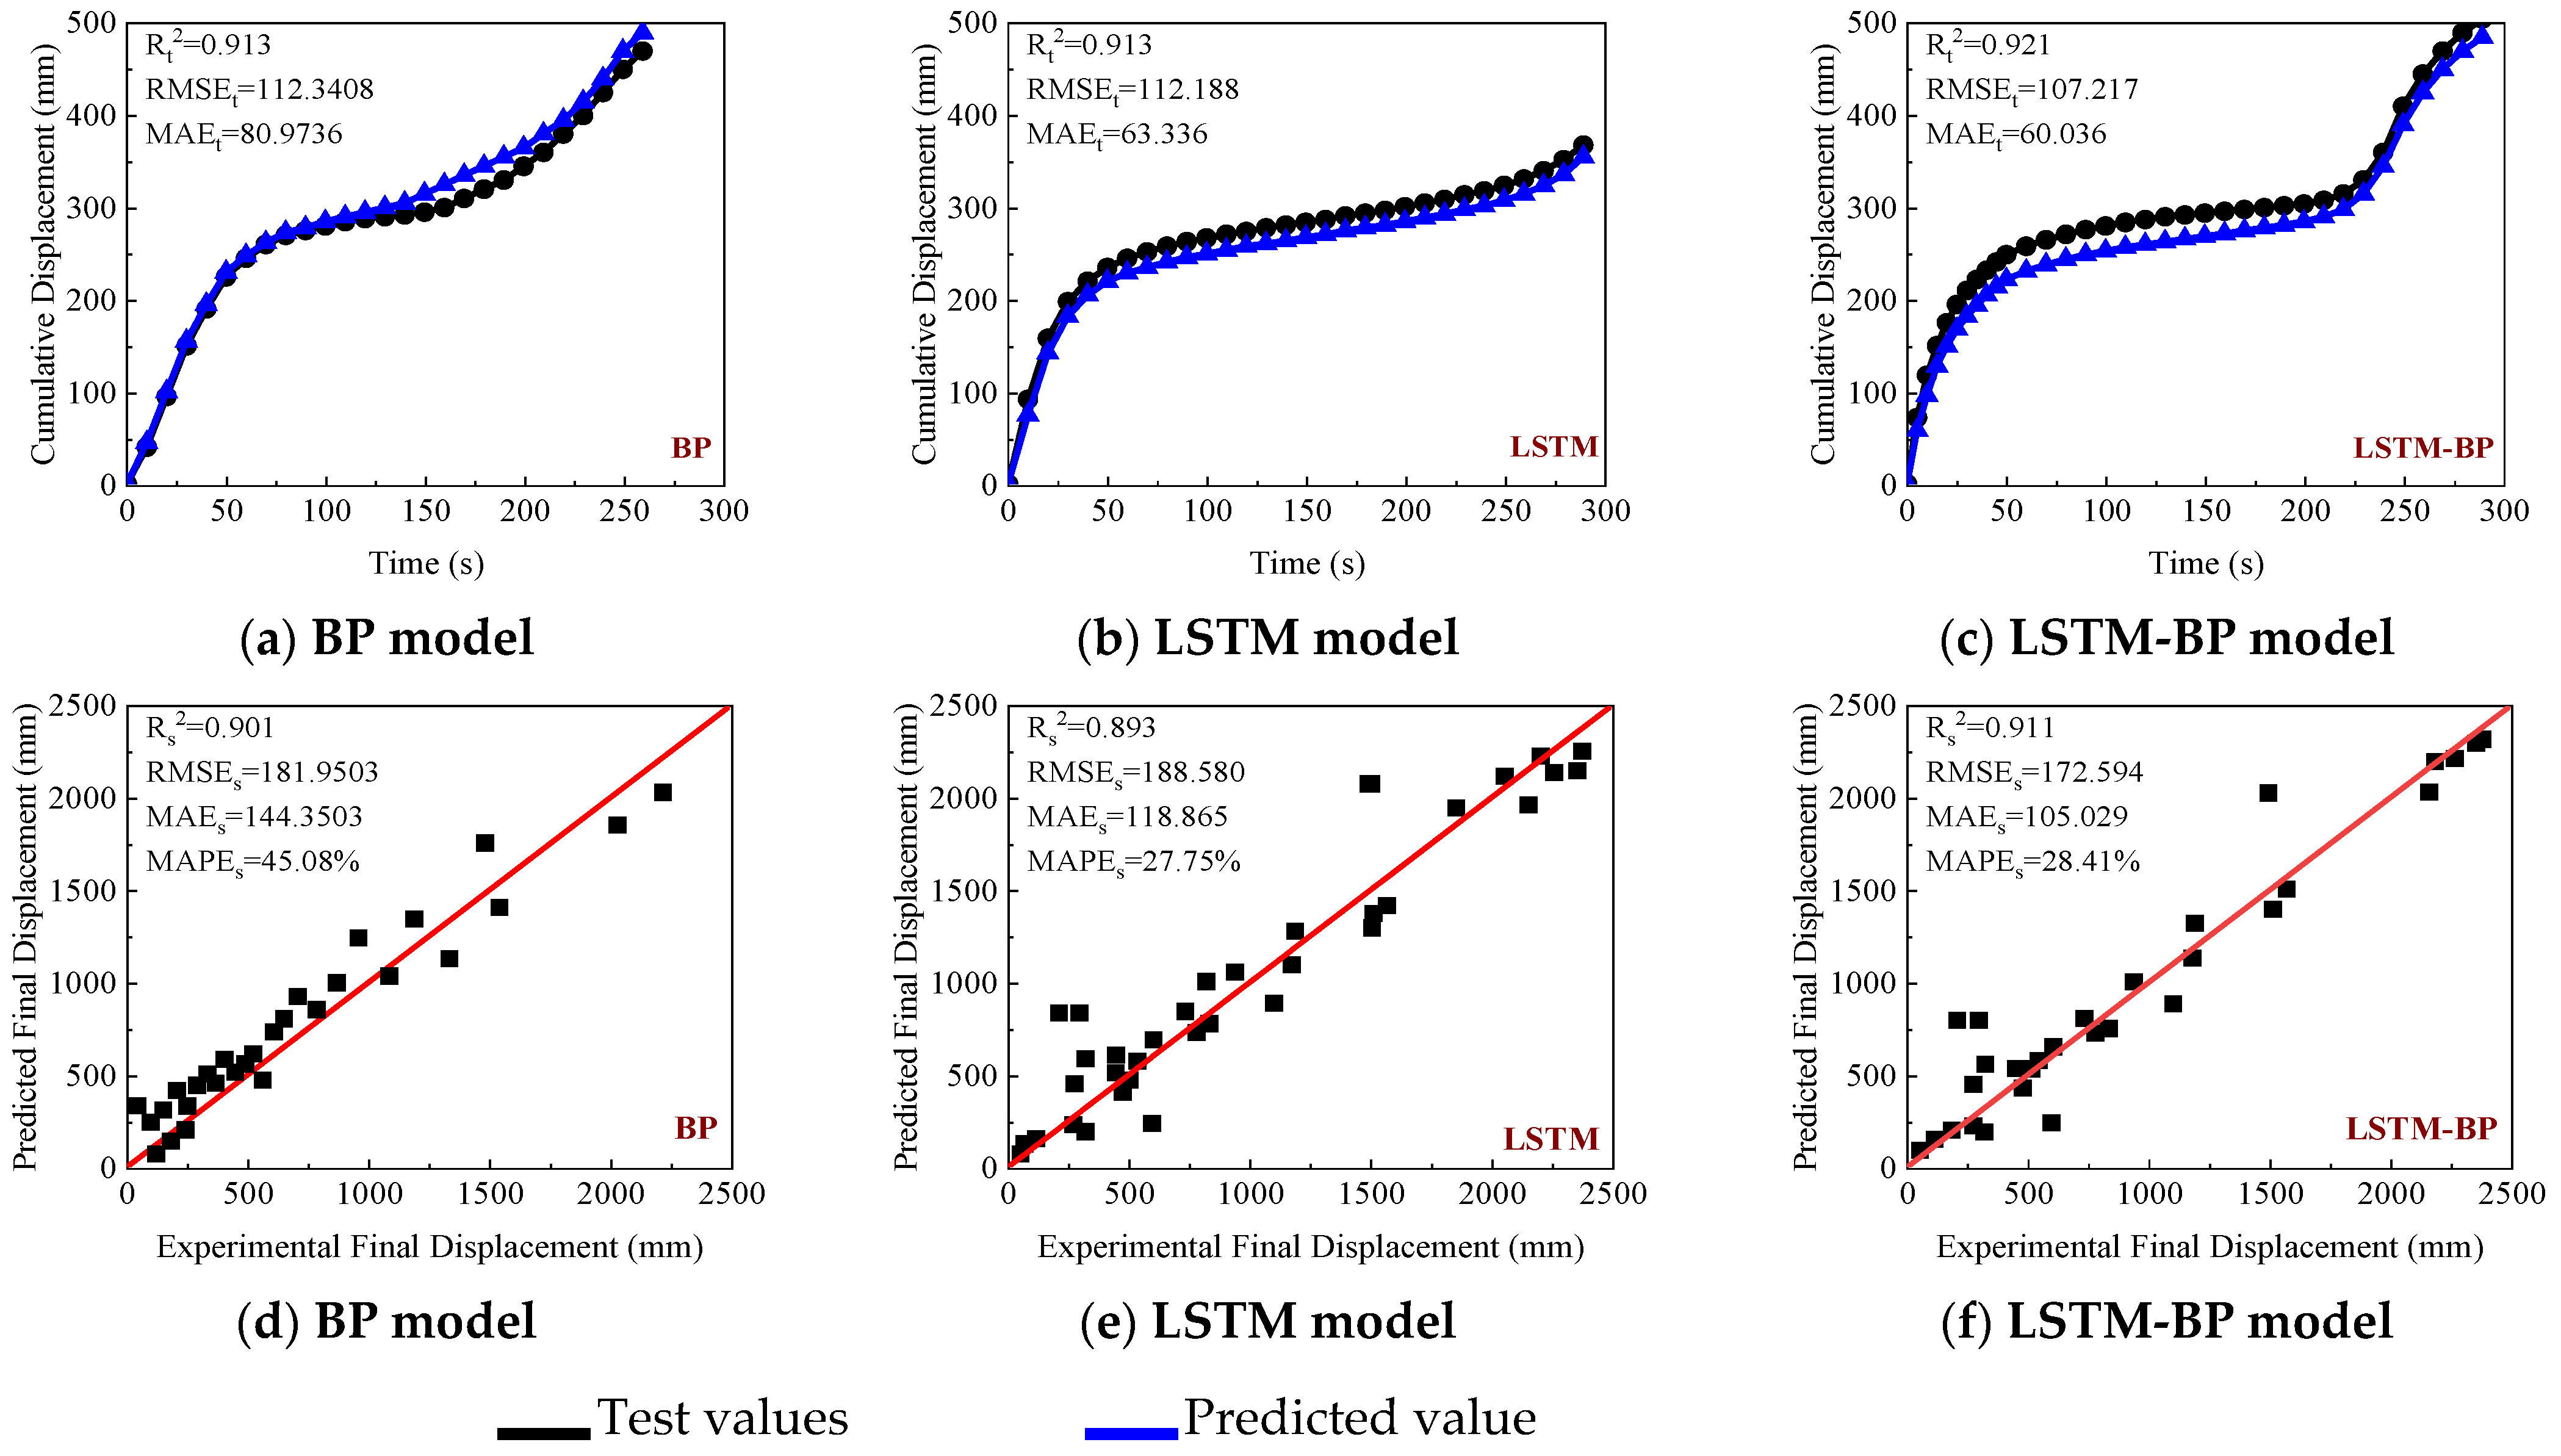
Figure 7 presents the comparison of time-history displacement and final displacement predicted by three different models. For the time-history results, the LSTM–BP model reduces RMSE and MAE by 2.80% and 2.73%, respectively, compared with the BP model. The LSTM–BP model RMSE and MAE by 4.43% and 5.21%, respectively, compared with the LSTM model. For the final displacement prediction, the LSTM–BP model reduces RMSE and MAE by 5.14% and 27.24%, respectively, compared with the BP model. The LSTM–BP model reduces RMSE and MAE by 8.48% and 11.64%, respectively, compared with the LSTM model. These results indicate that the proposed model achieves overall better performance, although the improvement is more evident in final displacement prediction than in time-history displacement prediction. This could be attributed to the following two aspects. On the one hand, LSTM effectively captures long-term dependencies and stage-wise evolution information in MEMS acceleration feature sequences through its gating mechanism, thereby enhancing the representation of displacement evolution. On the other hand, the BP network performs nonlinear mapping on the hidden states, improving the ability to model the complex relationship between acceleration features and displacement amplitude. In addition, the accumulation of historical information introduced by the sliding window and the global optimization of model hyperparameters using a genetic algorithm further enhance the model adaptability and prediction stability, enabling more accurate displacement prediction under complex non-stationary conditions. This result is generally consistent with previous studies showing that data-driven or monitoring-data-based prediction methods can effectively capture the evolution of subgrade settlement and improve prediction accuracy under complex conditions [8,14].
Figure 7.
Comparison of time-history displacement and final displacement.
3.3.3. Interpretability Analysis
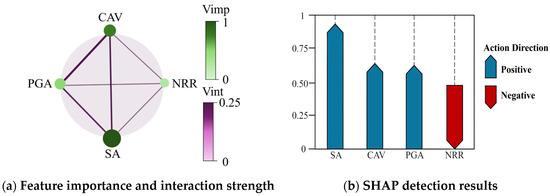
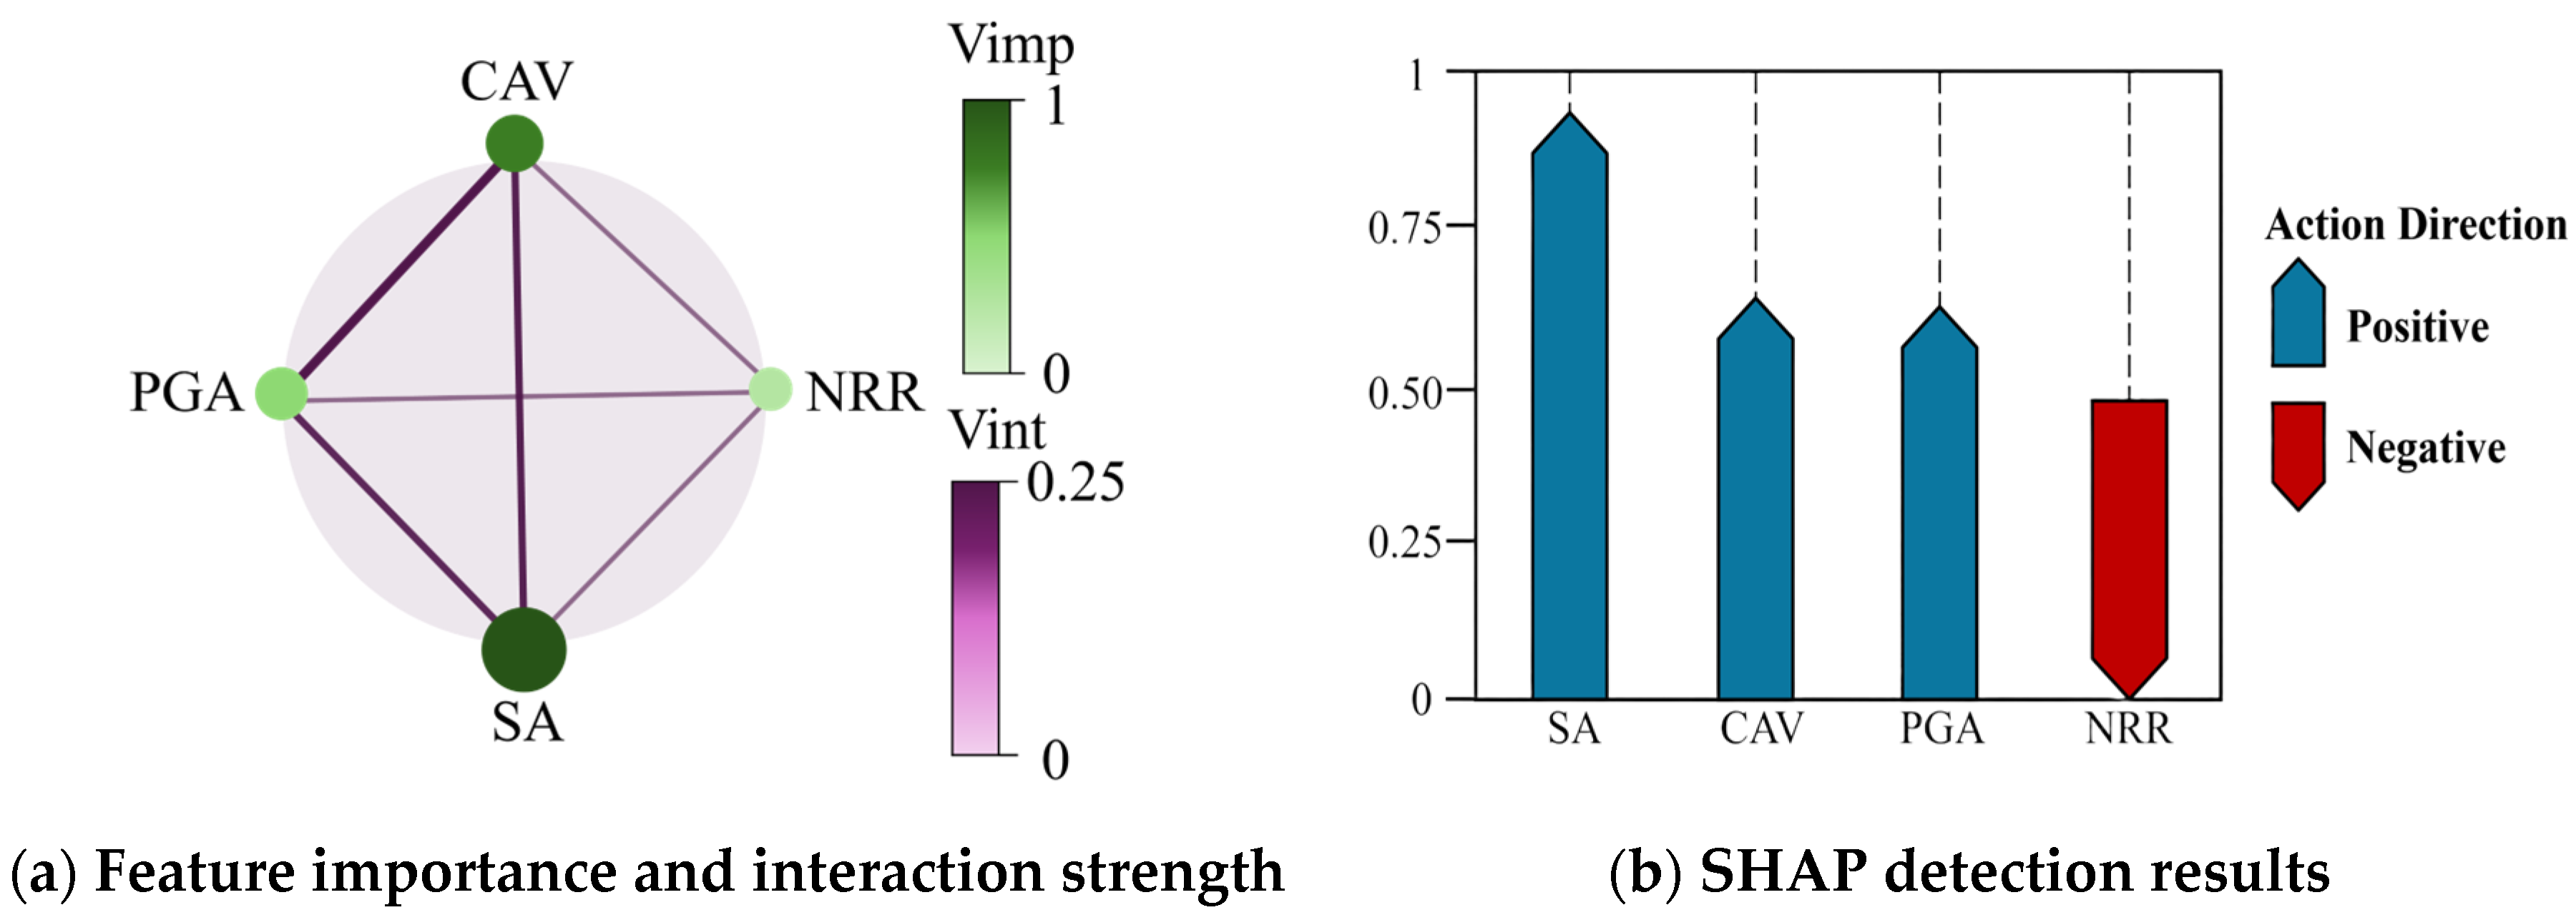
Figure 8 presents the interpretability analysis results of the model. In the circular diagram, node size and color intensity represent the importance of each factor, while the width and color of the connecting lines indicate the strength of interactions between factors. In the SHAP results, the direction and length of the arrows represent the contribution direction and magnitude of each factor to the prediction, providing an interpretable representation of the model behavior. Sa and CAV are identified as the dominant factors. Specifically, the contribution of Sa is 51.2% and 55.4% higher than that of CAV and PGA, respectively. This can be explained by the dominant role of spectral intensity in displacement evolution. At the same time, CAV exhibits a 3.2% higher contribution than PGA, indicating that cumulative energy has a sustained influence on displacement growth. In contrast, the contribution of PGA is 36.6% lower than that of Sa, indicating that it mainly affects instantaneous response and triggers displacement changes but has limited influence on overall evolution. In addition, NRR has the lowest importance, with an absolute contribution 44.7% lower than that of Sa and exhibits a negative effect. This suggests that NRR mainly modulates the prediction by reflecting the signal noise level and response complexity.
Figure 8.
Results of feature importance, interaction strength, and SHAP analysis.
4. Case Study of Sand Model Box Collapse
The experimental scenarios are designed to simulate deformation characteristics representative of roadbeds under complex environmental disturbances and to further validate the accuracy and effectiveness of the proposed method.
4.1. Overview of the Subgrade Collapse Model Test
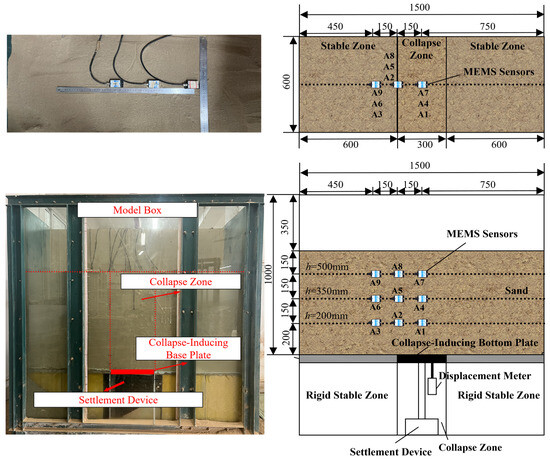
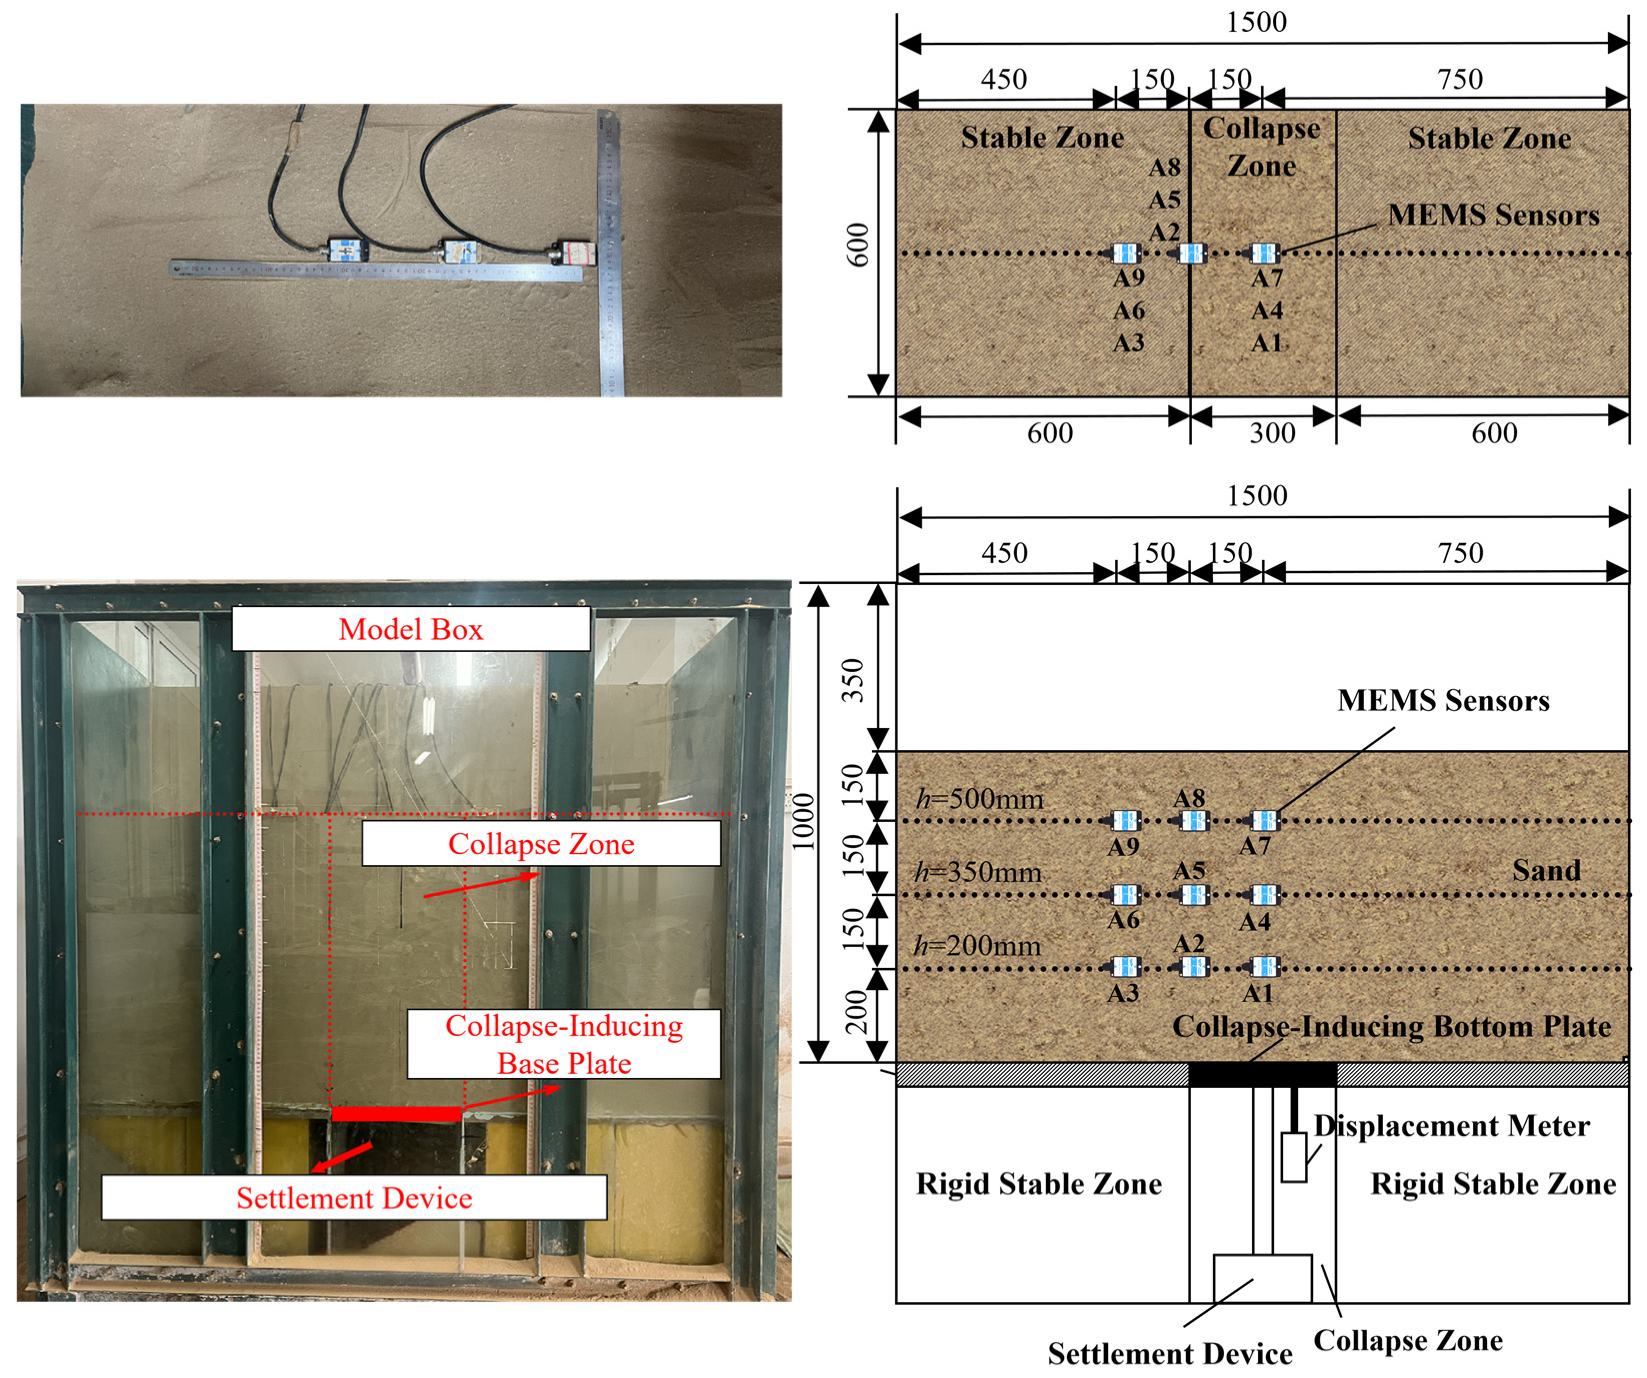
Figure 9 shows the layout of the model box. The experimental system consists of a model box, a collapse simulation mechanism, and a multi-source monitoring system. The model box is assembled using U-shaped steel channels, with dimensions of 1500 mm × 600 mm × 1500 mm. The bottom of the model box is divided into a stable zone, a collapse zone, and a stable zone, with the collapse zone having a width of approximately 300 mm. The collapse simulation mechanism consists of a screw-driven settlement plate. The plate moves only in the vertical direction and is equipped with a limiting device to prevent lateral deviation, with a maximum settlement of 80 mm. Collapse is simulated by controlling the screw to perform loading and unloading, thereby inducing progressive failure and deformation of the overlying soil. A total of nine MEMS sensors are embedded in the model box and arranged in three layers. The first layer is buried at a depth of 200 mm, with sensors placed at the center, boundary, and stable zone of the collapse region, with a spacing of 150 mm. The second and third layers are buried at depths of 350 mm and 500 mm, respectively, with the same layout as the first layer. After backfilling to 650 mm, the overall structure is completed. The test soil used in the model box was a poorly graded sand. Prior to testing, the material was naturally air-dried, further dried indoors, and sieved through a 2 mm mesh to ensure particle-size consistency. The particle-size distribution indicated a relatively uniform sandy composition with poor gradation. The main physical and mechanical properties of the soil were a dry density of 1.84 g/cm3, a moisture content of 1.04%, an internal friction angle of 33.00°, and a cohesion of 1.00 kPa. The soil is filled in layers using the sand pouring method and compacted layer by layer. After filling, the system is left undisturbed for 60 min to eliminate initial disturbance. Before formal testing, the MEMS sensors were calibrated under static conditions to correct the initial offset and to check the consistency of the three-axis outputs. After sensor installation, zero-level initialization was performed again to reduce installation-induced bias. The model-box boundaries were constrained by rigid steel sidewalls, while the bottom boundary outside the collapse zone remained fixed; only the settlement plate in the collapse zone was allowed to move vertically, with lateral deviation restricted by the guiding device. During the experiments, the MEMS sensors, displacement sensor, and PIV system were triggered in a synchronized manner using a unified acquisition procedure, so that the acceleration, displacement, and image-based deformation data could be compared on the same time scale. To ensure comparability, the loading path was kept the same across the comparative tests, and the settlement plate followed the same displacement-control procedure in each run. A high-precision displacement sensor (accuracy 0.01 mm, range 55 mm) is installed below the collapse plate to record the settlement process. A PIV monitoring system is established to obtain the displacement field using CCD imaging and cross-correlation algorithms. During loading, the screw drives the settlement plate, and the MEMS sensors, displacement sensor, and PIV system are triggered synchronously to achieve multi-source data acquisition. The test is terminated when the cumulative settlement of the base plate reaches 80 mm.
Figure 9.
Structural dimensions of the model box and sensor layout.
4.2. Analysis of Experimental Results
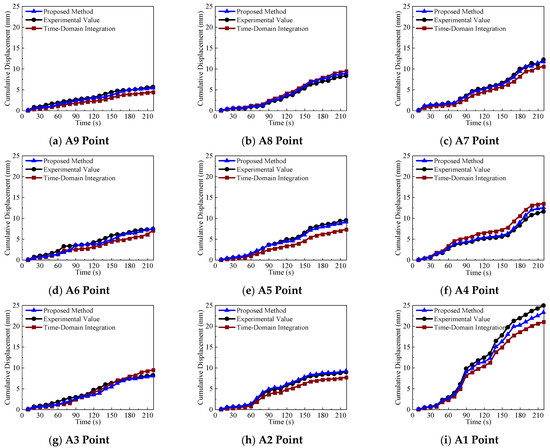
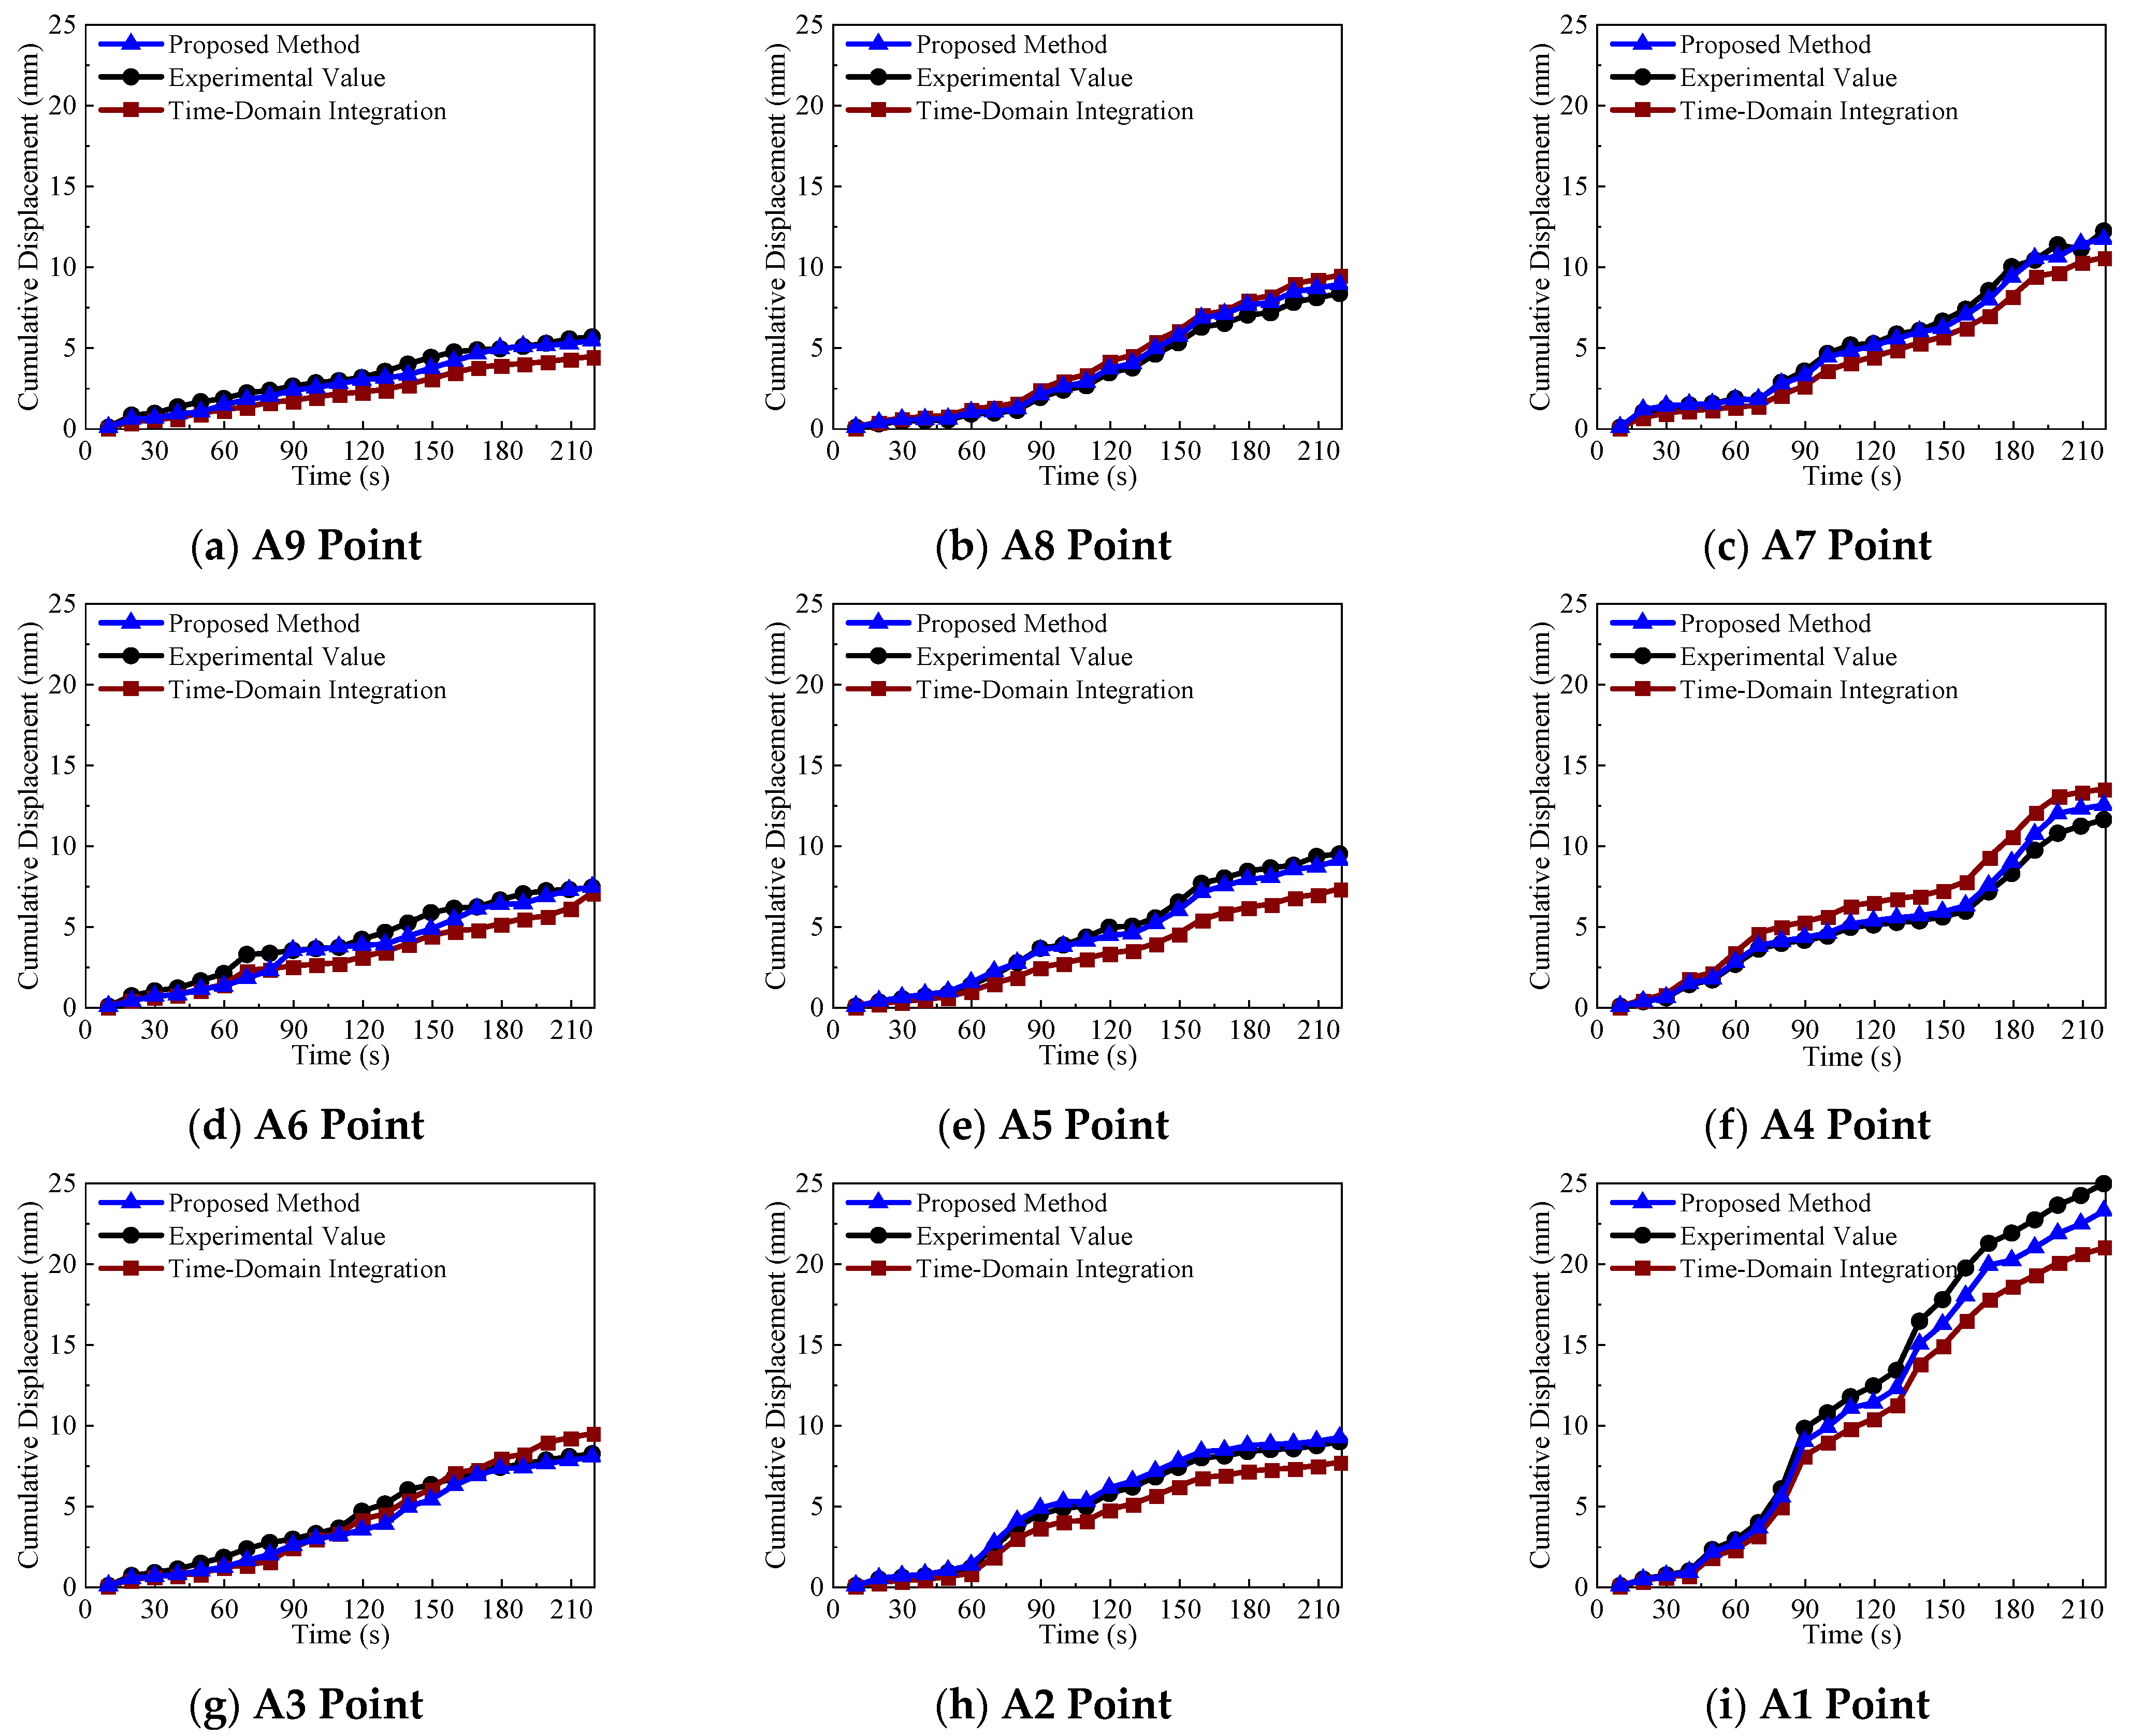
Figure 10 shows the cumulative settlement displacement predicted by the LSTM–BP model. Overall, the predicted curves are in good agreement with the experimental results at all measurement points, effectively reproducing the stage-wise evolution of settlement, namely slow development, accelerated growth, and stabilization. In particular, during the rapid growth stage in the middle and later periods, the model accurately tracks the displacement variation, indicating its capability to capture non-stationary temporal features during collapse disturbance propagation. From a spatial perspective, the model correctly reflects the response differences among measurement points in the collapse center, boundary, and stable zones. Specifically, the displacement is largest in the collapse center, followed by the boundary zone, and smallest in the stable zone. This indicates that the proposed model can effectively capture the spatial attenuation of settlement from the core region to the surrounding areas. In terms of depth, the predicted results also reveal that deeper measurement points exhibit stronger responses than shallower ones. This suggests that the model can not only describe the temporal evolution of settlement but also reflect the depth-dependent response characteristics.
Figure 10.
Comparison of cumulative vertical displacement at monitoring points.
In addition, compared with the traditional time-domain integration method [17], the proposed LSTM–BP model shows overall better performance. Specifically, nine measurement points at depths of 200, 350, and 500 mm are selected for analysis. Table 3 presents the results obtained by different methods. The LSTM–BP model achieves an average absolute error of 0.54 mm and an average relative error of 4.44% across points A1–A9. In contrast, the time-domain integration method yields an average absolute error of 1.63 mm and an average relative error of 15.21%. The LSTM–BP model therefore provides lower errors in both metrics. This can be explained by the fact that time-domain integration relies on double numerical integration of acceleration signals and is sensitive to bias, low-frequency drift, and noise accumulation, which leads to error amplification in the middle and later stages and reduces the ability to distinguish true differences among measurement points. This issue is more pronounced in the collapse center and deeper points, where displacement changes are larger and responses are stronger, leading to time-history distortion and endpoint deviation. In contrast, the proposed method combines temporal dependency learning with nonlinear mapping, avoiding drift accumulation caused by direct integration and showing better stability and applicability under complex settlement evolution conditions. Moreover, the observed stage-wise deformation evolution and spatial heterogeneity are also in line with previous studies on settlement monitoring, which have emphasized the progressive development of deformation and the existence of spatially differentiated responses in subgrade systems [5,13,14].
Table 3.
Testing conditions.
It should also be noted that experimental uncertainty may propagate through several stages of the present workflow. Errors in reference displacement measurement or multi-source synchronization may influence the alignment between input features and target responses, while uncertainty in PIV or displacement-sensor measurements may affect the comparison used for model validation. Therefore, the reported prediction accuracy should be interpreted in the context of both model performance and the uncertainty of the experimental measurements themselves. Although the adopted calibration, synchronized acquisition, and multi-source comparison procedures help improve reliability, a more systematic uncertainty quantification remains a topic for future work.
5. Discussion
The present study shows that MEMS-based intelligent sensing can serve as an effective means of transforming continuous acceleration measurements into deformation-related information for subgrade monitoring. Methodologically, the proposed framework integrates data cleaning, feature construction, and data-driven prediction into a unified workflow, thereby reducing some of the limitations of conventional time-domain integration under noisy and drift-prone conditions. These results suggest that, when combined with appropriate data processing and learning models, MEMS sensing has considerable potential for continuous internal-response monitoring in geotechnical systems.
From an application perspective, the proposed method may be useful for deformation monitoring, early warning, and condition assessment of subgrade systems operating under complex service environments. Its potential value is particularly evident in situations where continuous deployment of conventional displacement monitoring is difficult, or where internal soil responses provide more informative indicators than surface-only observations. By linking MEMS measurements with time-series feature representation and displacement prediction, the proposed approach offers a feasible route toward more intelligent and data-driven geotechnical monitoring.
At the same time, the present validation was carried out under a controlled laboratory model-box configuration, and this should be considered when evaluating the broader applicability of the method. Field-scale subgrade systems may involve more complex soil heterogeneity, environmental coupling, loading variability, and boundary effects. Therefore, while the current results support the feasibility of the proposed approach, further validation under more diverse experimental and in situ monitoring conditions is still needed before wider engineering application.
6. Conclusions
The present study aims to develop a MEMS-based intelligent sensing method for settlement prediction and investigate its key technologies to address the limitations of traditional preventive monitoring, including low levels of informatization and delayed prediction. The feasibility and effectiveness of the proposed method are validated through a linear sliding rail experiment and a sand model box case. According to the analyses, the following conclusions can be drawn:
(1) A three-layer model framework is established based on subgrade service conditions and collapse evolution scenarios, consisting of an intelligent perception layer, a settlement prediction layer, and an application layer. The intelligent perception layer enables stable acquisition and parsing of MEMS time-series data. The settlement prediction layer establishes a data-driven mapping between acceleration features and displacement response. The application layer achieves accurate prediction of soil settlement.
(2) A time-series feature parsing method based on MEMS data is proposed. Data quality is improved through encoding transformation, missing data imputation, and normalization. Time-series input features are constructed using seismic feature parameter extraction and sliding window organization. The fluctuation of adjacent acceleration differences is reduced by 60.1%, enabling the transformation of raw acceleration signals into a learnable feature space.
(3) An improved LSTM–BP settlement prediction model is developed. The LSTM extracts temporal dependency features, while the BP network performs nonlinear mapping, and a genetic algorithm is used to optimize the model parameters. Compared with the baseline model, the proposed model improves accuracy and stability by 8.7% and 27.2%, respectively, providing technical support for subgrade settlement prediction.
(4) The experimental results show that the proposed settlement prediction method has good robustness and effectiveness. It accurately captures the stage-wise evolution of settlement, namely slow development, accelerated growth, and stabilization, and reflects the spatial and depth-dependent variations in settlement. In addition, compared with the time-domain integration method, the prediction accuracy is improved by 11.69%.
It should be noted that the present conclusions are based on a limited number of controlled laboratory tests. Although the proposed MEMS-based intelligent sensing method showed promising potential for subgrade settlement prediction and early warning, its reliability and applicability under more complex conditions still require further verification. In particular, the present experimental program did not explicitly simulate environmental factors representative of real coastal settings, such as humidity, salinity, and cyclic loading. In addition, the effects of more diverse soil properties, repeated loading paths, environmental coupling, and long-term field monitoring conditions have not yet been fully examined. Therefore, future work should focus on more diverse experimental scenarios, long-term in situ validation, and broader engineering-scale applications to further improve the robustness, transferability, and generalizability of the proposed method.
Author Contributions
Conceptualization, D.W. and H.S.; methodology, D.W. and H.S.; software, D.W.; validation, D.W., C.Y. and Y.F.; formal analysis, D.W.; investigation, D.W., C.Y. and Y.F.; resources, H.S.; data curation, D.W. and C.Y.; writing—original draft preparation, D.W.; writing—review and editing, H.S. and J.W.; visualization, D.W.; supervision, H.S.; project administration, H.S.; funding acquisition, H.S. All authors have read and agreed to the published version of the manuscript.
Funding
This research was funded by National Natural Science Foundation of China, grant number [42067044], and the Guangxi Science and Technology Major Program, grant number [No. AB25069243].
Data Availability Statement
The data presented in this study are available on reasonable request from the corresponding author. The data are not publicly available because they form part of an ongoing research project.
Conflicts of Interest
The authors declare no conflict of interest.
References
- Editorial Department of China Journal of Highway and Transport. Review on China’s Subgrade Engineering Research: 2025 China. J. Highw. Transp. 2025, 38, 1–153. [Google Scholar] [CrossRef]
- Li, S.; Zhang, T.; Jiang, C.; Wang, Y.; Zhang, Z.; Liu, S. Calculation of safe roof thickness for irregular goaf underlying a subgrade based on the backward elimination method. Tunn. Undergr. Space Technol. 2026, 172, 107511. [Google Scholar] [CrossRef] [Scilit]
- Srivastava, A.; Bharat, T.V. Stabilization of compacted kaolin against wetting-induced collapse under field conditions by geopolymerization-assisted sand columns matrix. Acta Geotech. 2026, 1–26. [Google Scholar] [CrossRef] [Scilit]
- Tan, J.; Liu, W.; Wen, Z.; Cui, Y. Transverse differential settlement in lateritic subgrade of high-speed Railway under cyclic wetting. Transp. Geotech. 2026, 59, 101971. [Google Scholar] [CrossRef] [Scilit]
- Shan, H.; Hong, B.; Liu, X.; Xu, F. Study on the early detection and evaluation method of post-construction settlement of composite subgrade. Adv. Eng. Sci. 2020, 52, 194–202. [Google Scholar] [CrossRef]
- Liu, Y.; Xing, A.; Wang, Q.; Bilal, M.; Zhu, K.; Wang, W. Comprehensive investigation and kinematic assessment of a small catastrophic landslide in Shiban Valley, Leshan City, Sichuan Province, China. Landslides 2025, 22, 1937–1953. [Google Scholar] [CrossRef] [Scilit]
- Jiao, W.; Lei, B.; Liu, X.; Li, L. Settlement Mechanism and Reinforcement Analysis of Soft Soil Subgrades Based on Anisotropic Constitutive Model. J. Tongji Univ. (Nat. Sci.) 2026, 54, 355–364. [Google Scholar] [CrossRef]
- Zhu, D.; Jiang, G.; Liu, X.; Yuan, S.; Yu, T.; Shen, Y.; Luo, J. Efficient Bayesian updating based on surrogate model and monitoring data for dynamic subgrade settlement prediction. Int. J. Rail Transp. 2025, 1–29. [Google Scholar] [CrossRef] [Scilit]
- Lyu, J.; Cui, M.; Cai, Q.; Zhao, Y.; Li, Q. Inlluence of EPB canstnuction sequence and sail chamber peessure on railay subgrade settlement. China Saf. Sci. J. 2025, 35, 58–65. [Google Scholar] [CrossRef]
- Li, F.; Yang, F.; Xie, Y.; Qiao, X.; Du, C.; Li, C.; Ru, Q.; Zhang, F.; Gu, X.; Yong, Z. Research on 3D ground penetrating radar deep underground cavity identification algorithm in urban roads using multi-dimensional time-frequency features. NDT E Int. 2024, 143, 103060. [Google Scholar] [CrossRef] [Scilit]
- Wu, D.; Wang, J.; Yang, Y.; Wu, Y.; Lou, W.; Lin, W. Application of MEMS sensor in physical test monitoring of karst collapse. J. Saf. Environ. 2023, 23, 800–811. [Google Scholar] [CrossRef]
- Lin, C.; Pengsheng, P.; Yongkang, S.; Yuheng, Z.; Yang, C. A distributed fibre optic monitoring method for ground subsidence induced by water pipeline leakage. Opt. Fiber Technol. 2023, 81, 103495. [Google Scholar] [CrossRef] [Scilit]
- Varandas, J.N.; Zhang, Y.; Shi, J.; Davies, S.; Ferreira, A. Differential settlements monitoring in railway transition zones using satellite-based remote sensing techniques. Comput.-Aided Civ. Infrastruct. Eng. 2025, 40, 4824–4844. [Google Scholar] [CrossRef] [Scilit]
- Chen, K.; Zhang, B.; Jiang, H.; Lv, J.; Liu, A.; Jiang, Y.; Zhang, R. Time-series InSAR monitoring and evolution predictive analysis of filling-area subsidence in Yan’an New District. Adv. Space Res. 2026, 77, 6629–6644. [Google Scholar] [CrossRef] [Scilit]
- Mangifesta, M.; Ciampi, P.; Giannini, M.L.; Esposito, C.; Scalella, G.; Sciarra, N. Deep Gravitational Slope Deformation Numerical Modelling Supported by Integrated Geognostic Surveys: The Case of Borrano (Abruzzo Region—Central Italy). Geosciences 2025, 15, 134. [Google Scholar] [CrossRef] [Scilit]
- Xing, X.; Chang, H.C.; Chen, L.; Zhang, J.; Yuan, Z.; Shi, Z. Radar interferometry time series to investigate deformation of soft clay subgrade settlement—A case study of Lungui Highway, China. Remote Sens. 2019, 11, 429. [Google Scholar] [CrossRef] [Scilit]
- Wu, D.; Liang, T.; Jiang, F.; Yang, Y.; Pei, Q.; Wu, J. Monitoring subsurface soil displacement in karst collapse by designing a MEMS-based spherical monitoring device. Sci. Rep. 2025, 15, 16468. [Google Scholar] [CrossRef] [Scilit]
- Milad, B.; Stan, B.; Bre-Anne, S.; Wendy, T. MEMS technology and applications in geotechnical monitoring: A review. Meas. Sci. Technol. 2022, 33, 052001. [Google Scholar] [CrossRef] [Scilit]
- Bolikulov, F.; Nasimov, R.; Rashidov, A.; Akhmedov, F.; Cho, Y. Effective Methods of Categorical Data Encoding for Artificial Intelligence Algorithms. Mathematics 2024, 12, 2553. [Google Scholar] [CrossRef] [Scilit]
- Decorte, T.; Mortier, S.; Lembrechts, J.J.; Meysman, F.J.R.; Latre, S.; Mannens, E.; Verdonck, T. Missing Value Imputation of Wireless Sensor Data for Environmental Monitoring. Sensors 2024, 24, 2416. [Google Scholar] [CrossRef] [Scilit]
- Yang, X.; Li, J.; Jiang, X. Research on information leakage in time series prediction based on empirical mode decomposition. Sci. Rep. 2024, 14, 28362. [Google Scholar] [CrossRef] [Scilit] [PubMed]

Disclaimer/Publisher’s Note: The statements, opinions and data contained in all publications are solely those of the individual author(s) and contributor(s) and not of MDPI and/or the editor(s). MDPI and/or the editor(s) disclaim responsibility for any injury to people or property resulting from any ideas, methods, instructions or products referred to in the content. |
© 2026 by the authors. Licensee MDPI, Basel, Switzerland. This article is an open access article distributed under the terms and conditions of the Creative Commons Attribution (CC BY) license.