


Abstract
Second harmonic (SH) radiation can only be generated in non-centrosymmetric bulk crystals under electric dipole approximation. Nonlinear thin films made from bulk crystals are technologically challenging because of complex and high-temperature fabrication processes. In this work, heterostructures made of two distinct amorphous materials, namely SiO2 and TiO2, were prepared through plasma-enhanced atomic layer deposition (PEALD) with deposition temperature of 100 °C. By using the uniaxial dispersion model, we characterized the form birefringence of the deposited films, which can play a crucial role for the phase-matching condition in nonlinear waveguides or other nonlinear optical applications. By applying a fringe-based technique, we determined the largest diagonal component of the effective bulk second-order susceptibility, = 1.30 ± 0.13 pm/V, at a wavelength of 1032 nm. Noteworthy, we observed strong SHG signals from two-component nanolaminates, which are several orders of magnitude larger than those from single layers. The SHG signals from our samples only require the broken inversion symmetry at the interface. Here, optical properties of nanocomposites can be precisely engineered using the promising PEALD technology.
1. Introduction
Shortly after the invention of the pulsed ruby laser, second harmonic generation (SHG) was observed by Franken et al. [1]. In general, nonlinear optical phenomena are described in the framework of a power series expansion of the electric field strength [2]. SHG is a nonlinear process, where the induced polarization in the matter scales quadratically with the electric field. In this process, two incident photons at fundamental frequency are annihilated and one photon at the doubled frequency is generated [3]. In the electric dipole approximation, the SHG process is governed by a third-rank tensor [4,5]. Thus, the material symmetry can have a large influence on the SHG process. For example, SHG is forbidden in centrosymmetric bulk materials due to symmetry restrictions. When a laser beam interacts with a centrosymmetric bulk material, the bulk itself has no contributions to the SHG on the macroscopic scale under the electric dipole approximation. However, a SHG signal can arise from a very thin layer at the interface of the centrosymmetric material, as the inversion symmetry is broken in that microscopic area [6,7,8,9].
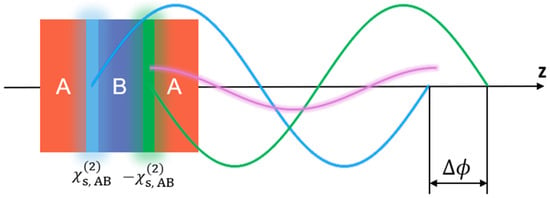
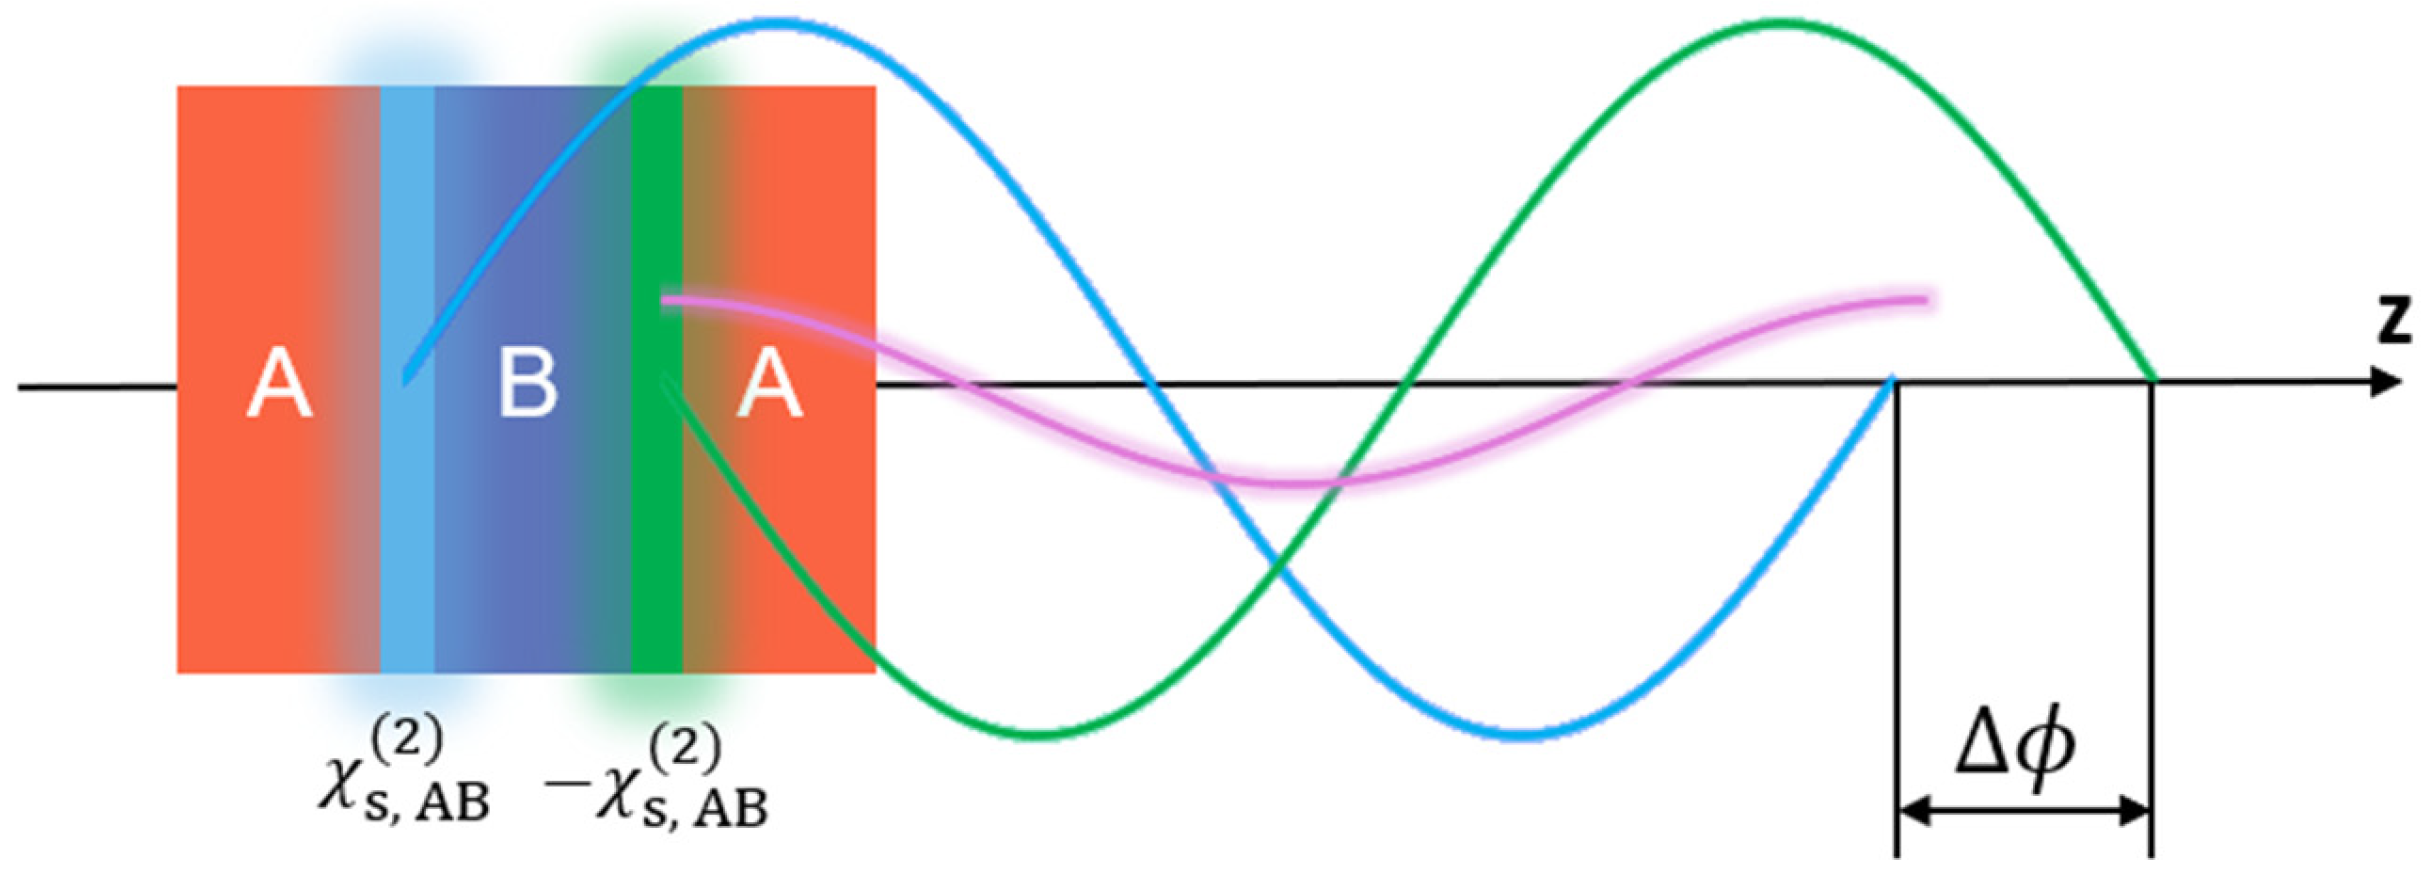
Nonlinear optical excitation can arise either from the intrinsic nonlinear response of the material or from artificially engineered nanostructures [10,11]. A general artificial method is to grow heterostructures. For example, ABC-type nanolaminates with three different amorphous materials can produce SHG signals that are not possible in the bulk version of the three constituents [12]. The strategy of the ABC-type nanolaminates is to utilize the heterostructures to integrate second-order interface nonlinearities. The integration of these interfaces can lead to an effective bulk nonlinearity for the overall structure [13]. The ABC-type nanolaminate can not only break the inversion symmetry at the interface, but it can also break the inversion symmetry globally. In comparison, the AB-type nanolaminate only breaks the inversion symmetry at the interface between two materials, the entire structure is still symmetric [14]. Thus, the SHG signal in the AB-type nanolaminates should be theoretically negligible. In this case, the surface susceptibilities of two interfaces would have the same absolute value but opposite sign (see Figure 1). However, interface roughness and intermixing can lead to a slight difference in atomic arrangement at the AB (blue) and BA (green) sequences. This slight difference and a small phase shift, Δϕ, between SH waves generated at adjacent interfaces can lead to non-negligible SH signals. F. Abtahi et al. reported that SH waves could be generated in AB-type stacks [15]. Additionally, electric quadruple components may play a significant role, as the electric field is altered at the interface between the low and high refractive index materials.
Figure 1.
The symmetry property of AB-type nanolaminates. A small phase shift, Δϕ, between the SH waves generated from adjacent interfaces (blue and green) leads to an incomplete destructive interference (purple).
In addition, the ABC-type nanolaminates also possess birefringence with amorphous isotropic layers [16]. The form birefringence originates from the difference in boundary conditions of electromagnetic waves with respect to the parallel and perpendicular directions [17,18]. The layers of the nanolaminates are much thinner than the wavelength of the light. Thus, the whole multilayer structure can be regarded as an effective medium with in-plane isotropy. With the rapid development of the nanoscale fabrication processes, form birefringence is also applied to control the optical phase in optical and photonic devices [19,20].
Atomic layer deposition (ALD) has received increasing interest for optical applications because this technology allows for precise deposition of ultra-thin films at the Ångstrom level [21]. Although there are similarities between ALD and chemical vapor deposition (CVD), the distinction lies in the self-limiting reactions for precursor adsorption, alternate and sequential introduction of the precursors and reactants. Their gases are not introduced together into the chamber in order to avoid unwanted gas phase reactions between the precursor and the co-reactant. Therefore, the deposition process is divided into two half-cycles with two different reactants. In the first sub-step, one reactant gas is introduced into the chamber and reacts with the functional groups on the substrate surface, forming a sub-monolayer and corresponding by-products. After this sub-step, the by-products and residual reactant gases are purged with an inert gas. In the second half-cycle, the co-reactant is introduced into the chamber and reacts with the sub-monolayer formed in the first step. After the second purge step, one cycle of the deposition process is done. Because both half-cycles are self-limiting, the deposited amount in one complete cycle remains well-controlled; this thickness increment is referred to as the growth per cycle (GPC). The self-limiting nature of these surface reactions also enables highly conformal coating, since film growth is governed by surface saturation, allowing uniform coverage even on complex and high-aspect-ratio surfaces. Thus, ALD has a special potential for the fabrication of nanolaminates with unique and tailored properties, opening new possibilities in various technological applications. ALD has been used to deposit oxides [22], nitrides [23], and thin metal films [24]. ALD has also been used in many applications, such as lithium batteries [25], anti-reflection coatings [26,27], and metasurfaces [28]. In conventional ALD processes, thermal energy is utilized to activate reactions on the surface. However, high temperatures can cause thermal decomposition and break the bonds of the precursor, which lead to higher growth per cycle (GPC) and more impurities [29]. In the PEALD processes, the plasma radicals can significantly reduce the deposition temperature [30]. Therefore, this process can be realized in a lower temperature range with fewer impurities than thermal ALD. In this work, PEALD is utilized to realize the deposition of alternating thin dielectric layers.
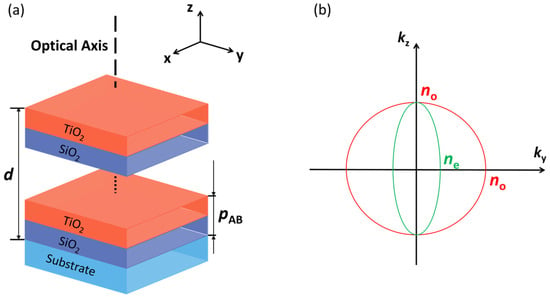
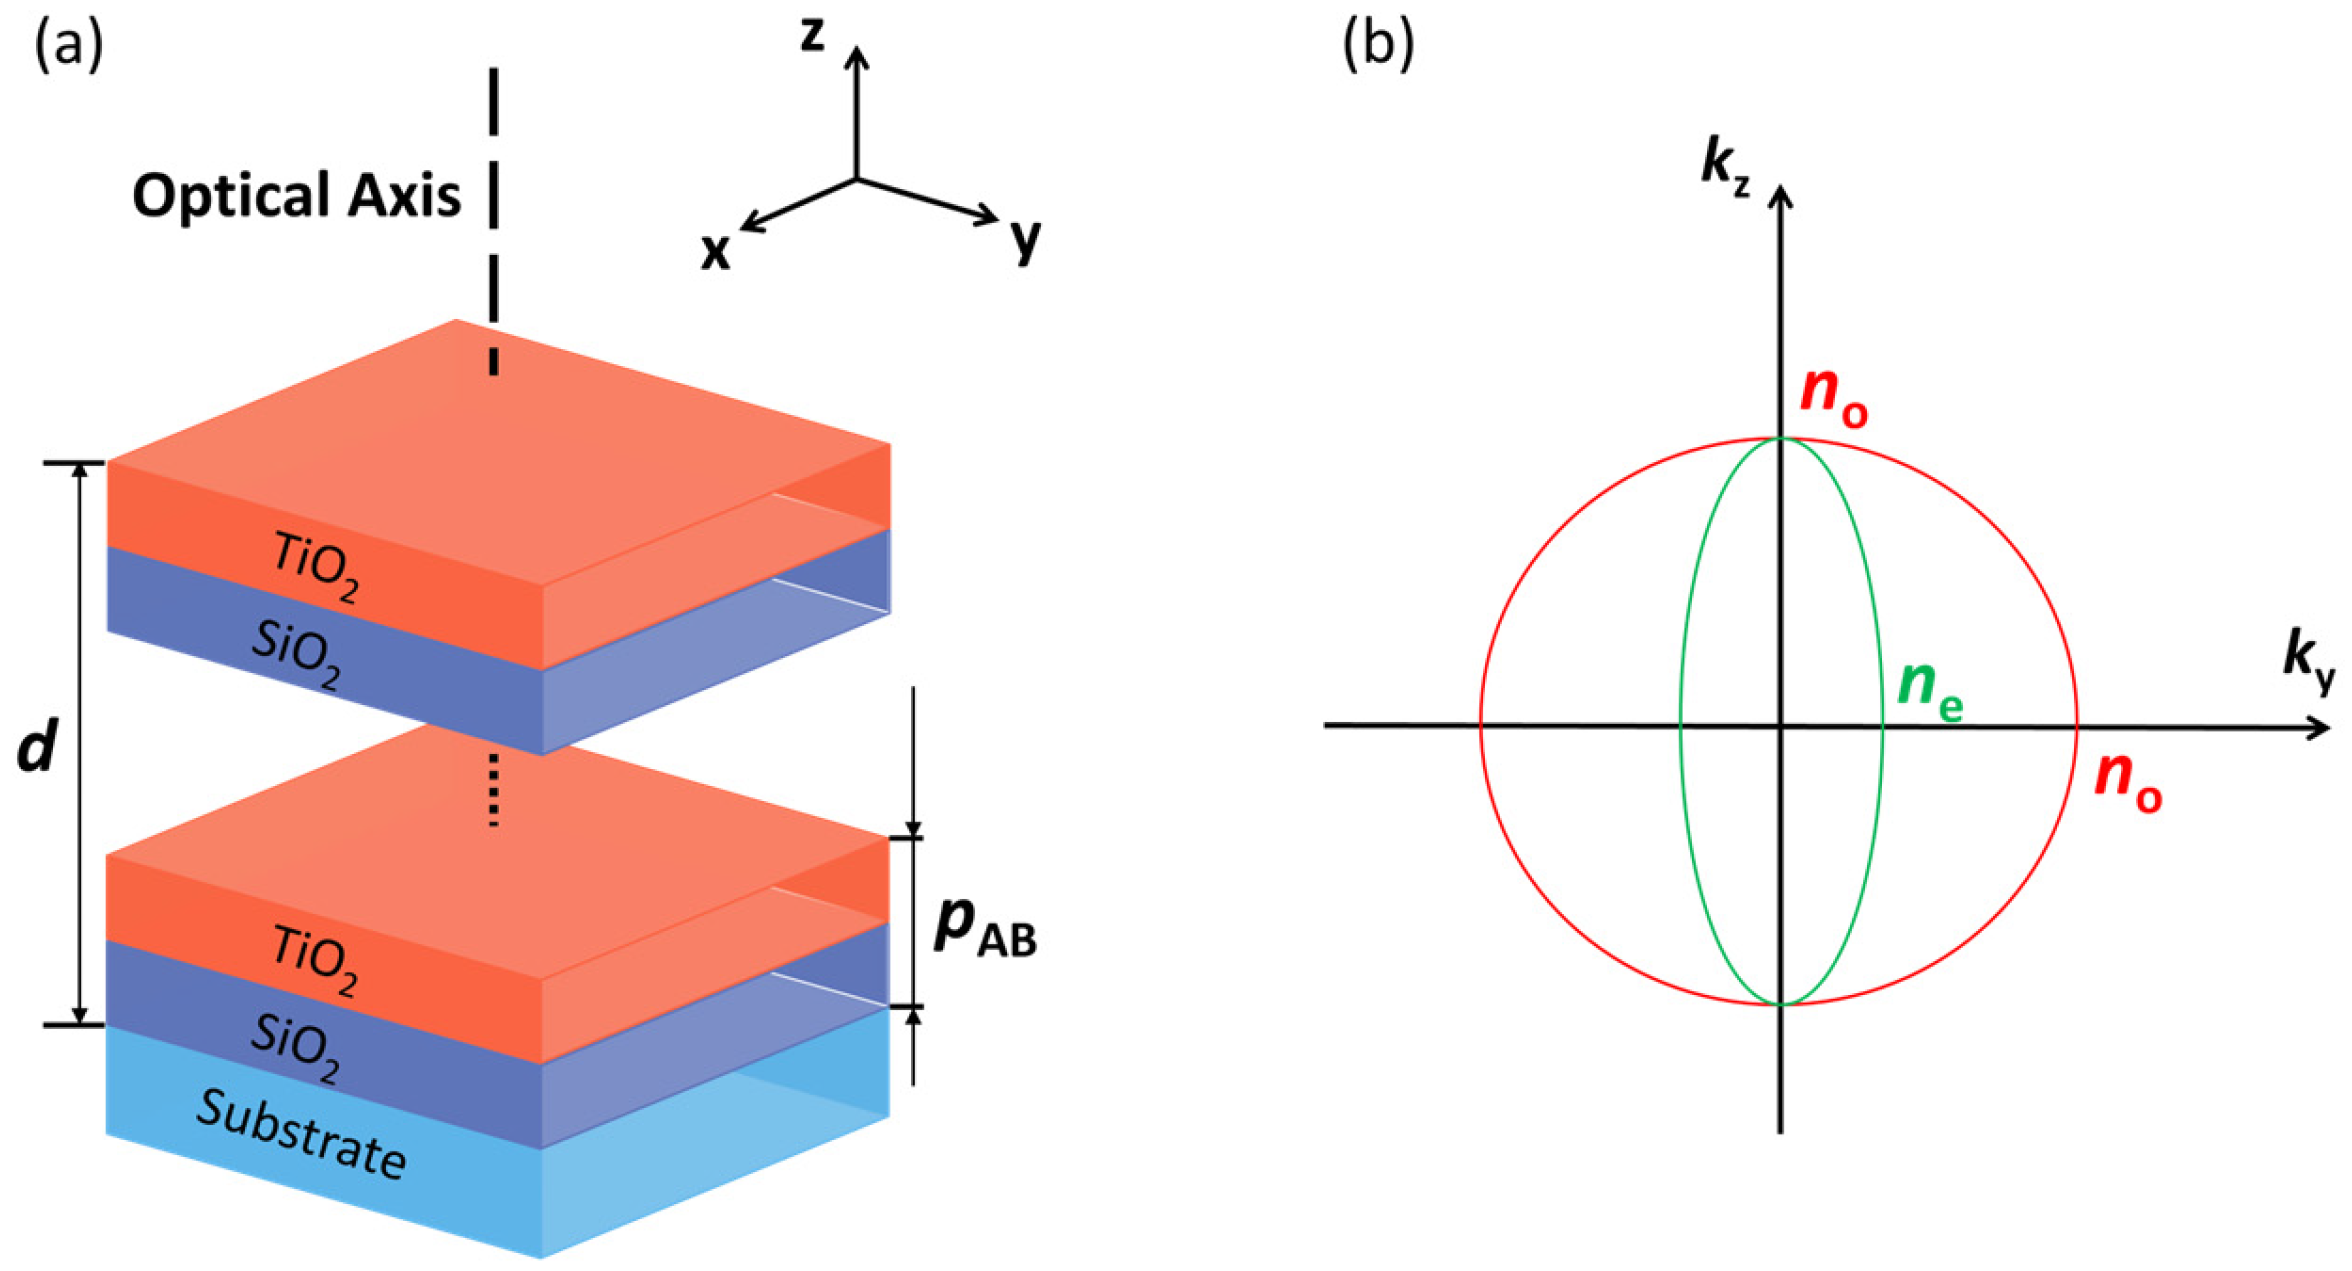
This work aims to investigate the linear and nonlinear optical properties of the AB-type nanolaminates made of the two amorphous centrosymmetric materials, SiO2 and TiO2 (see Figure 2). The two-component heterostructures were analyzed to understand the variation in their optical and structural properties as the individual thicknesses change from approximately 1 nm to 0.5 nm. The SH signal generated by a loosely focused fs-pulsed laser was measured as function of the angle of incidence. From these measurements, the parameters, and , were determined. The bulk-like SHG properties were evaluated through power-dependent measurements for films with the same composition but increasing thickness. AB heterostructures were finally compared to other nonlinear thin films and bulk nonlinear crystals.
Figure 2.
(a) The illustration of the heterostructures and the optical axis of the uniaxial effective medium; (b) normal surface of the negative uniaxial “artificial crystal”.
2. Materials and Methods
2.1. Deposition of SiO2/TiO2 Heterostructures
The SiO2/TiO2 heterostructures were deposited on silicon and fused silica (FS) substrates by using PEALD (SILAYO-ICP330, Sentech Instruments GmbH, Berlin, Germany) [31]. To prepare the heterostructures, bis[diethylamino]silane (BDEAS) and oxygen (O2) were used as precursors for SiO2; tetrakis(dimethylamino)titanium (TDMAT) and O2 were used as precursors for TiO2, respectively. The growth of individual layers of SiO2 and TiO2 depends on several parameters, such as the precursors’ pulse duration, purge duration, deposition temperature, and carrier gas flow [32,33]. The deposition temperature for all processes in this work was maintained at 100 °C. Nitrogen (N2) was used both as the precursor carrier gas and purge gas. The corresponding PEALD process parameters for the single layers are summarized in Table 1. All the parameters were previously optimized to ensure good uniformity and reproducibility.
Table 1.
PEALD process parameters for SiO2/TiO2 heterostructures.
2.2. Theoretical Model and Characterization Method of Linear Optical Properties
The AB-type heterostructures exhibit the so-called form birefringence with amorphous isotropic layers [34]. The form birefringence is an artificial property that originates from anisotropy at a scale larger than the atomic level but much smaller than the wavelength of light. For a two-component composite, and are the dielectric functions of the two constituents, respectively. With the effective medium approximation, the effective refractive index of the multilayer structure can be described by Equations (1) and (2).
where f1 and f2 are volume fractions of each component. If both dielectric functions are positive, this effective medium behaves like a negative uniaxial crystal (see Equation (3)). The illustration of the multilayer and corresponding wave vector surfaces is shown in Figure 2. If one of the dielectric functions is negative, the effective medium exhibits hyperbolic dispersion relation, as widely discussed in the context of hyperbolic metamaterials [35,36].
To extract the linear optical properties of the fabricated heterostructures, ellipsometry and spectrophotometry were applied. Refractive indices and the thickness of the heterostructures were determined through ellipsometry. The heterostructures grown on silicon substrates were measured using a SE850 DUV ellipsometer (Sentech Instruments GmbH, Berlin, Germany). A uniaxial Sellmeier dispersion model was implemented to extract physical parameters from the measured ellipsometric parameters, Psi (Ψ) and Delta (Δ).
Spectrophotometry was used to determine the transmittance (T) and reflectance (R) of the samples on the FS substrate. In this work, a commercial spectrophotometer ‘Lambda 850’ (Lambda 850, PerkinElmer Inc., Waltham, MA, USA) was used, and measurements were performed at an angle of incidence of 6°, in the wavelength range from 400 nm to 1200 nm. The optical losses (OLs) were calculated by the following expression [37]: OL = 1 − T − R.
X-ray reflectivity (XRR) was also implemented to estimate the thickness, surface/interface roughness, and layer densities. The XRR instrument (Bruker AXS, Karlsruhe, Germany) uses a monochromatic X-ray beam (Cu-K radiation at = 0.154 nm) for such measurements at a grazing incident angle from 0° to 8°. The measured spectra were analyzed by using the Bruker Leptos 7 software.
2.3. Theoretical Model and Characterization Method of Nonlinear Optical Properties
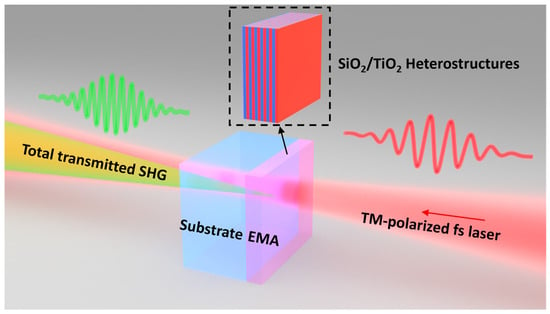
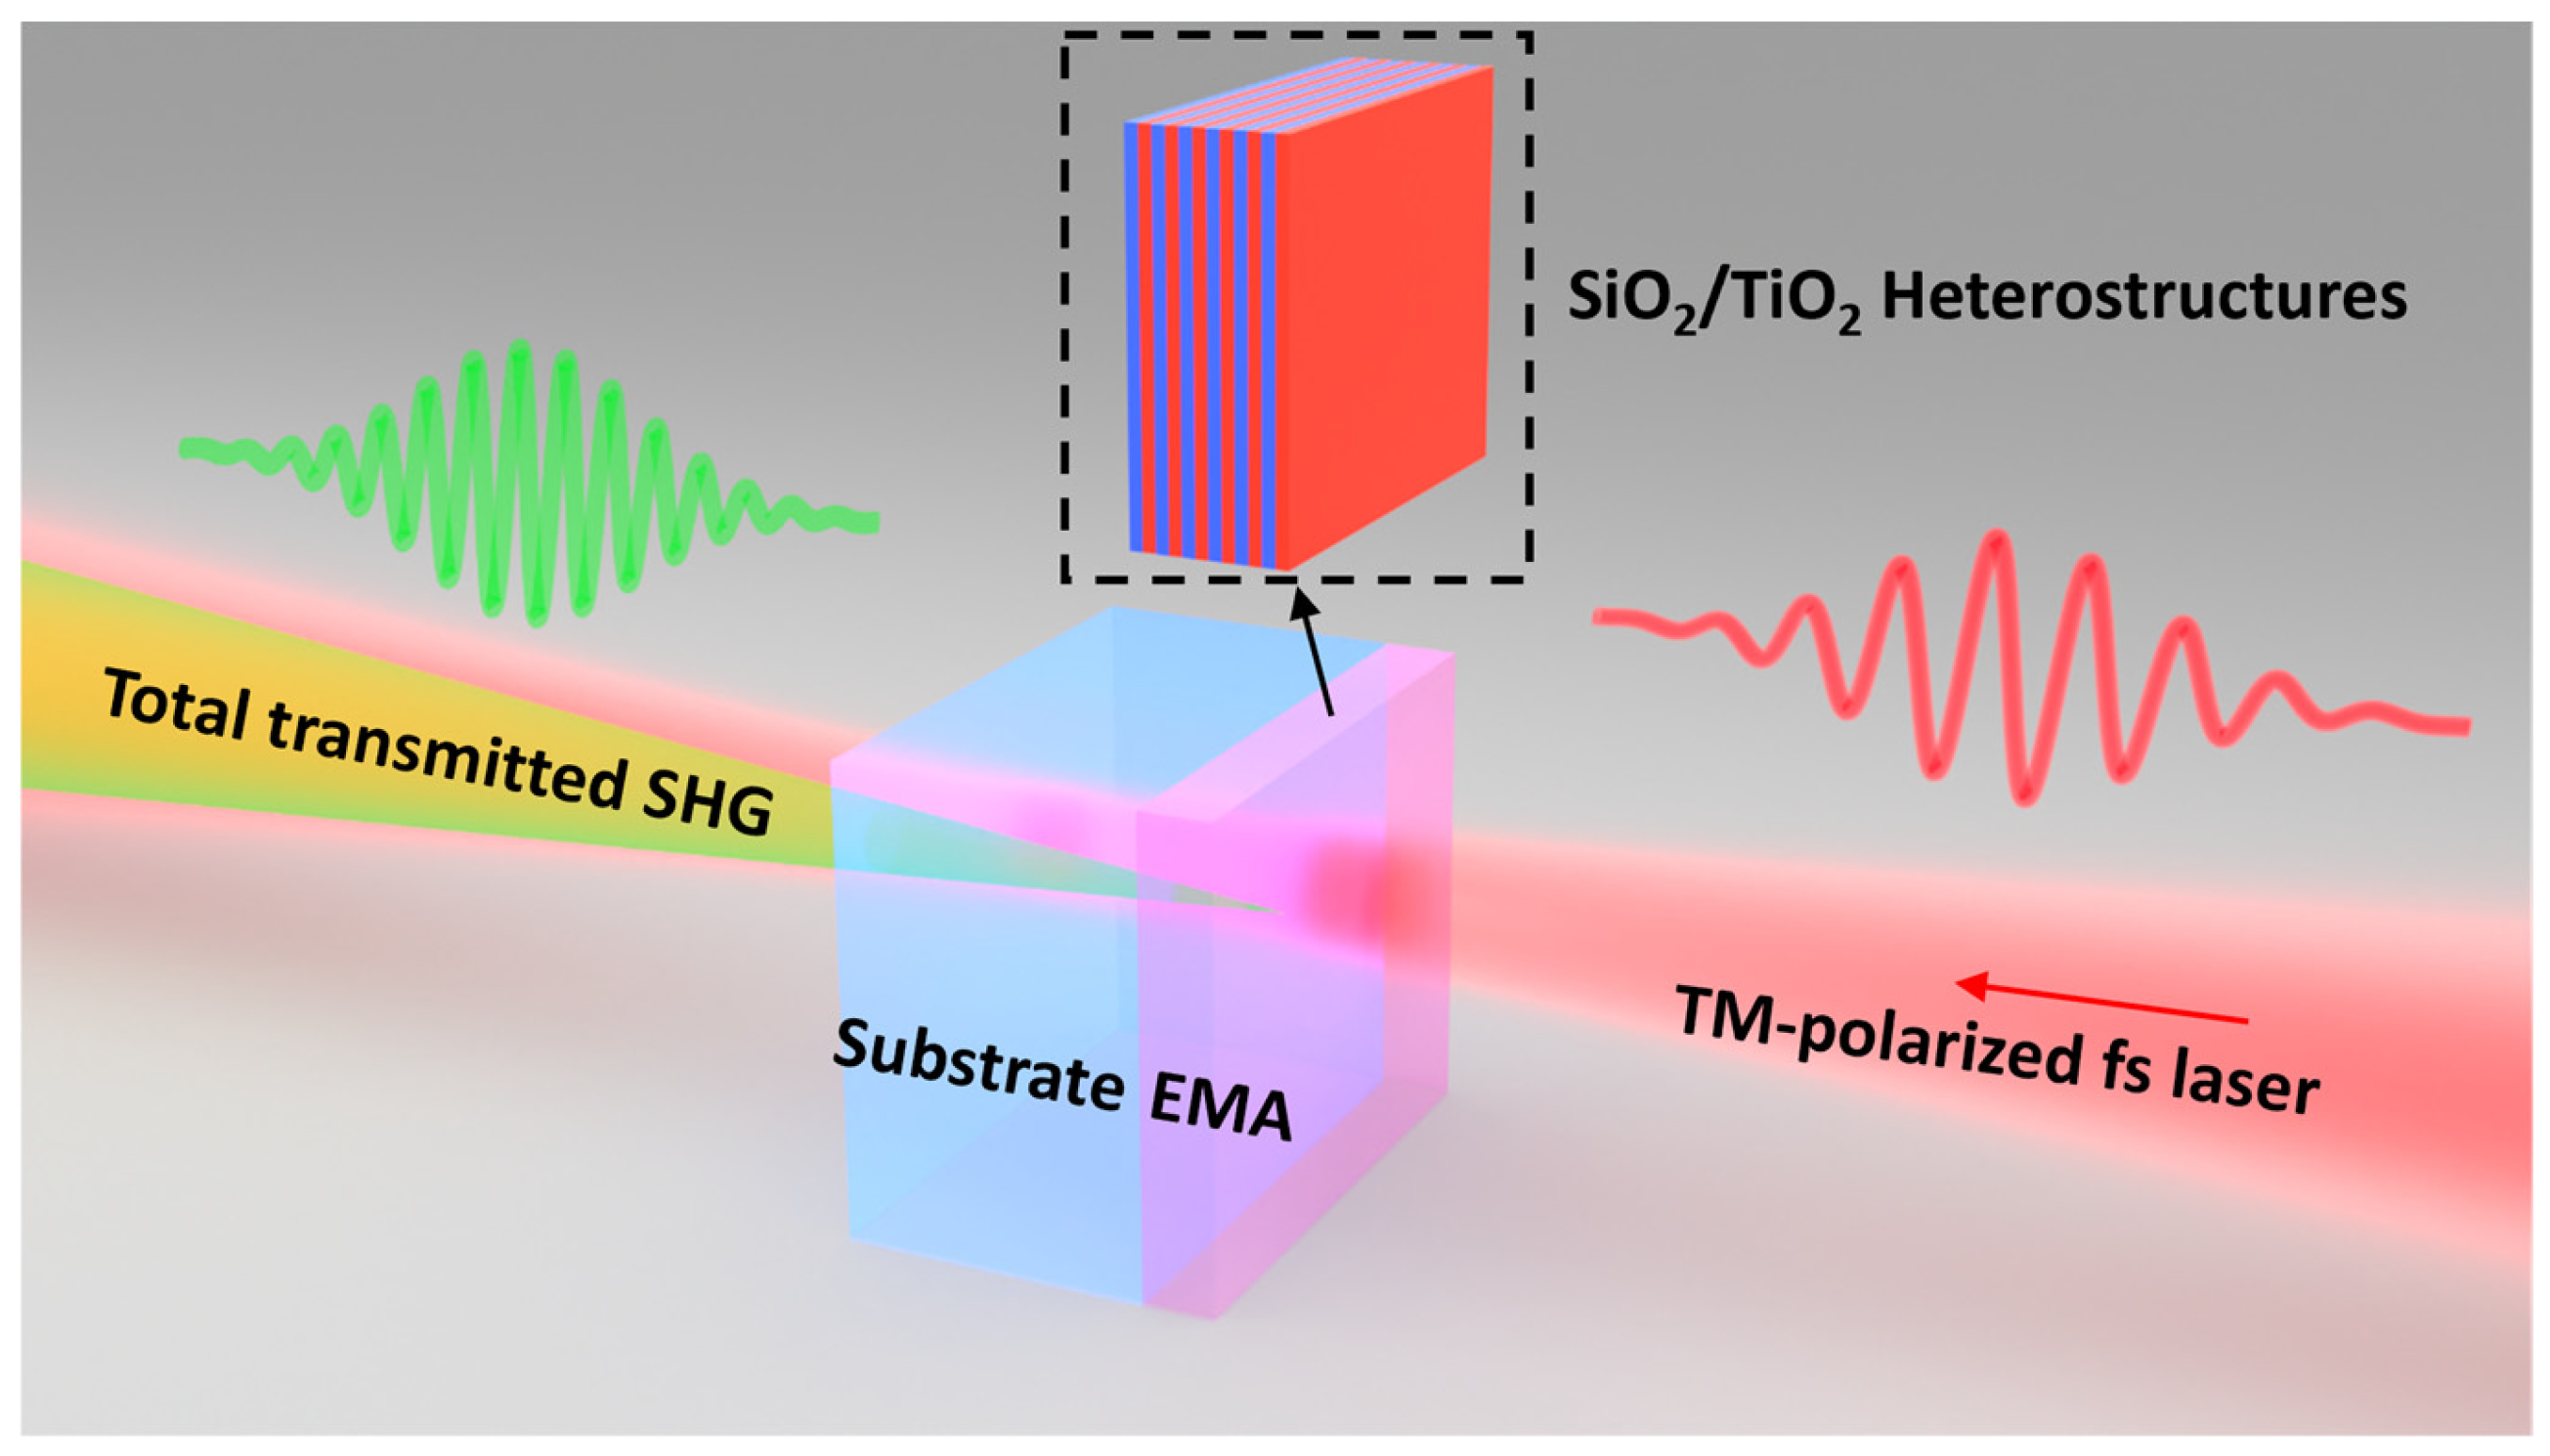
Following the discovery of SHG, the Maker fringe technique laid the foundation for determining the second-order susceptibility of nonlinear bulk crystals [38]. The fringes occur as the phase-matching condition is not satisfied in the SHG process, and the SH waves generated at different positions in the crystal interfere constructively or destructively. For traditional nonlinear materials, Maker fringes are visible only if the thickness of the nonlinear material is significantly larger than the coherent built-up length [39]. For the nanolaminates with total thickness much smaller than the coherent built-up length, the Maker fringes are invisible. A. Hermans et al. [40] developed an effective determination method that is similar to the Maker fringe technique. In this technique, a fixed polarization of the fundamental beam is utilized, and the SH power is recorded while rotating the sample. With this method, a fringe can also be observed, and this fringe can be used to extract the effective bulk, , of the heterostructures. An illustration of the SHG of the AB-type heterostructures on a fused silica (FS) substrate is shown in Figure 3. The heterostructure is represented by the effective medium approximation (EMA).
Figure 3.
Schematic diagram of SHG in the effective medium of SiO2/TiO2 heterostructures.
In the theoretical model, the heterostructure is regarded as one homogeneous effective medium on the substrate. Furthermore, the EMA layer is assumed to have zero thickness, since the total thickness is much smaller than the light wavelength and coherent built-up length. There are two contributions to the total SH signal: SH waves generated at the front interface between air and the AB film and SH waves generated at the backside between the FS substrate and air. The interference of both contributions leads to the fringe pattern. Thus, the nonlinearities are described by two effective surface second-order susceptibility tensors, (i = AB/FS). All the interface/surface nonlinearities of the heterostructures are integrated into the first effective surface susceptibility, . Then, the first effective surface susceptibility divided by the total thickness, d, of the heterostructures, resulting in a conversion to the effective bulk susceptibility for the overall AB heterostructure. The multiple reflections inside the heterostructures and the substrate are neglected since in the effective bulk determination process, we only consider an angle of incidence (AOI) smaller than 70°. The refractive index of the AB film is the average of the ordinary and extraordinary refractive indices, as the nanolaminate is assumed to be homogeneous and optically isotropic to simplify the fitting algorithm.
The AB-type nanolaminates belong to the symmetry group where the non-zero components of the second-order susceptibility tensor are and . Here, x and y are the in-plane directions, and z is along the direction perpendicular to the plate. The total transmitted TM-/TE-polarized electric field of the layered structure with in-plane isotropy can be expressed in the form: , , where p and s represent TM-polarized and TE-polarized light, respectively. The quantities f, g, and h are rigorously deduced from the theory [16]. TM-polarized light was selected as the input fundamental beam polarization state. Thus, for a monochromatic TM-polarized fundamental beam, , the total transmitted second harmonic electric field from AB type nanolaminate on the FS substrate is given by [40].
with , the effective surface second-order susceptibility, approximately expressed by
In these expressions, the parameters written in lowercase letters (capital letters) correspond to the fundamental frequency, (doubled frequency ). The Fresnel coefficients for p-polarized light propagating from medium i to medium j are and . () and () are the refractive indices and the propagation angles with respect to the surface normal of medium, i. refers to the thickness of the fused silica substrate, and c is the speed of light. When the is satisfied, the approximation in Equation (5) can be made. However, this approximation also leads to a mixed-up determination between and . Thus, a combined value, , is used as a fitting parameter in the effective bulk determination process.
To determine the effective bulk , the SH power from the sample needs to be considered. With the total transmitted second harmonic electric field in Equation (4), we can evaluate the second harmonic power by [40]:
where is a calibration factor. As we are using a femtosecond (fs) laser source, the temporal walk-off time should be included in the theoretical model of SH power. The temporal walk-off time occurs since the FS substrate delays the doubled frequency () pulse generated at the front interface relative to the fundamental frequency () pulse. Thus, there will be a time delay between SH pulses generated at front and back interfaces. With the temporal walk-off time, the theoretical SH power can be evaluated by [40]:
where is the FWHM pulse duration, is the angle-dependent walk-off time, and is also a calibration factor. The walk-off time can be expressed as with being the walk-off time for normal incidence. The can be calibrated by applying Equations (6) and (7) to the bare ~1 mm FS substrate. With the theoretical model, we can measure the SH power from the sample and implement the fitting process to determine unknown parameters. The fitting parameters for SiO2/TiO2 nanolaminates are , , , and . The surface susceptibilities of the FS substrate were found from the literature with = 59, = 7.9 and = 3.8 in units of 10−22 m2/V at 1064 nm [41]. These susceptibilities can be converted to the values at a wavelength of 1032 nm by applying the Miller’s rule [3]. The first step for the fitting process is to fit and simultaneously by using Equation (6). This step aims to check the substrate thickness and to ensure that the theoretical fringes have the same peak positions as for the measured SH power, as the peak positions are highly sensitive to the substrate thickness. Then, with the known surface susceptibility of the FS substrate, we can fit other unknown parameters by using Equation (7).
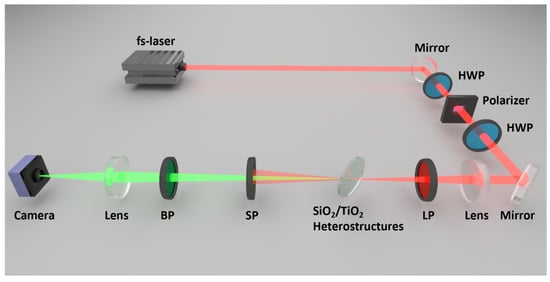
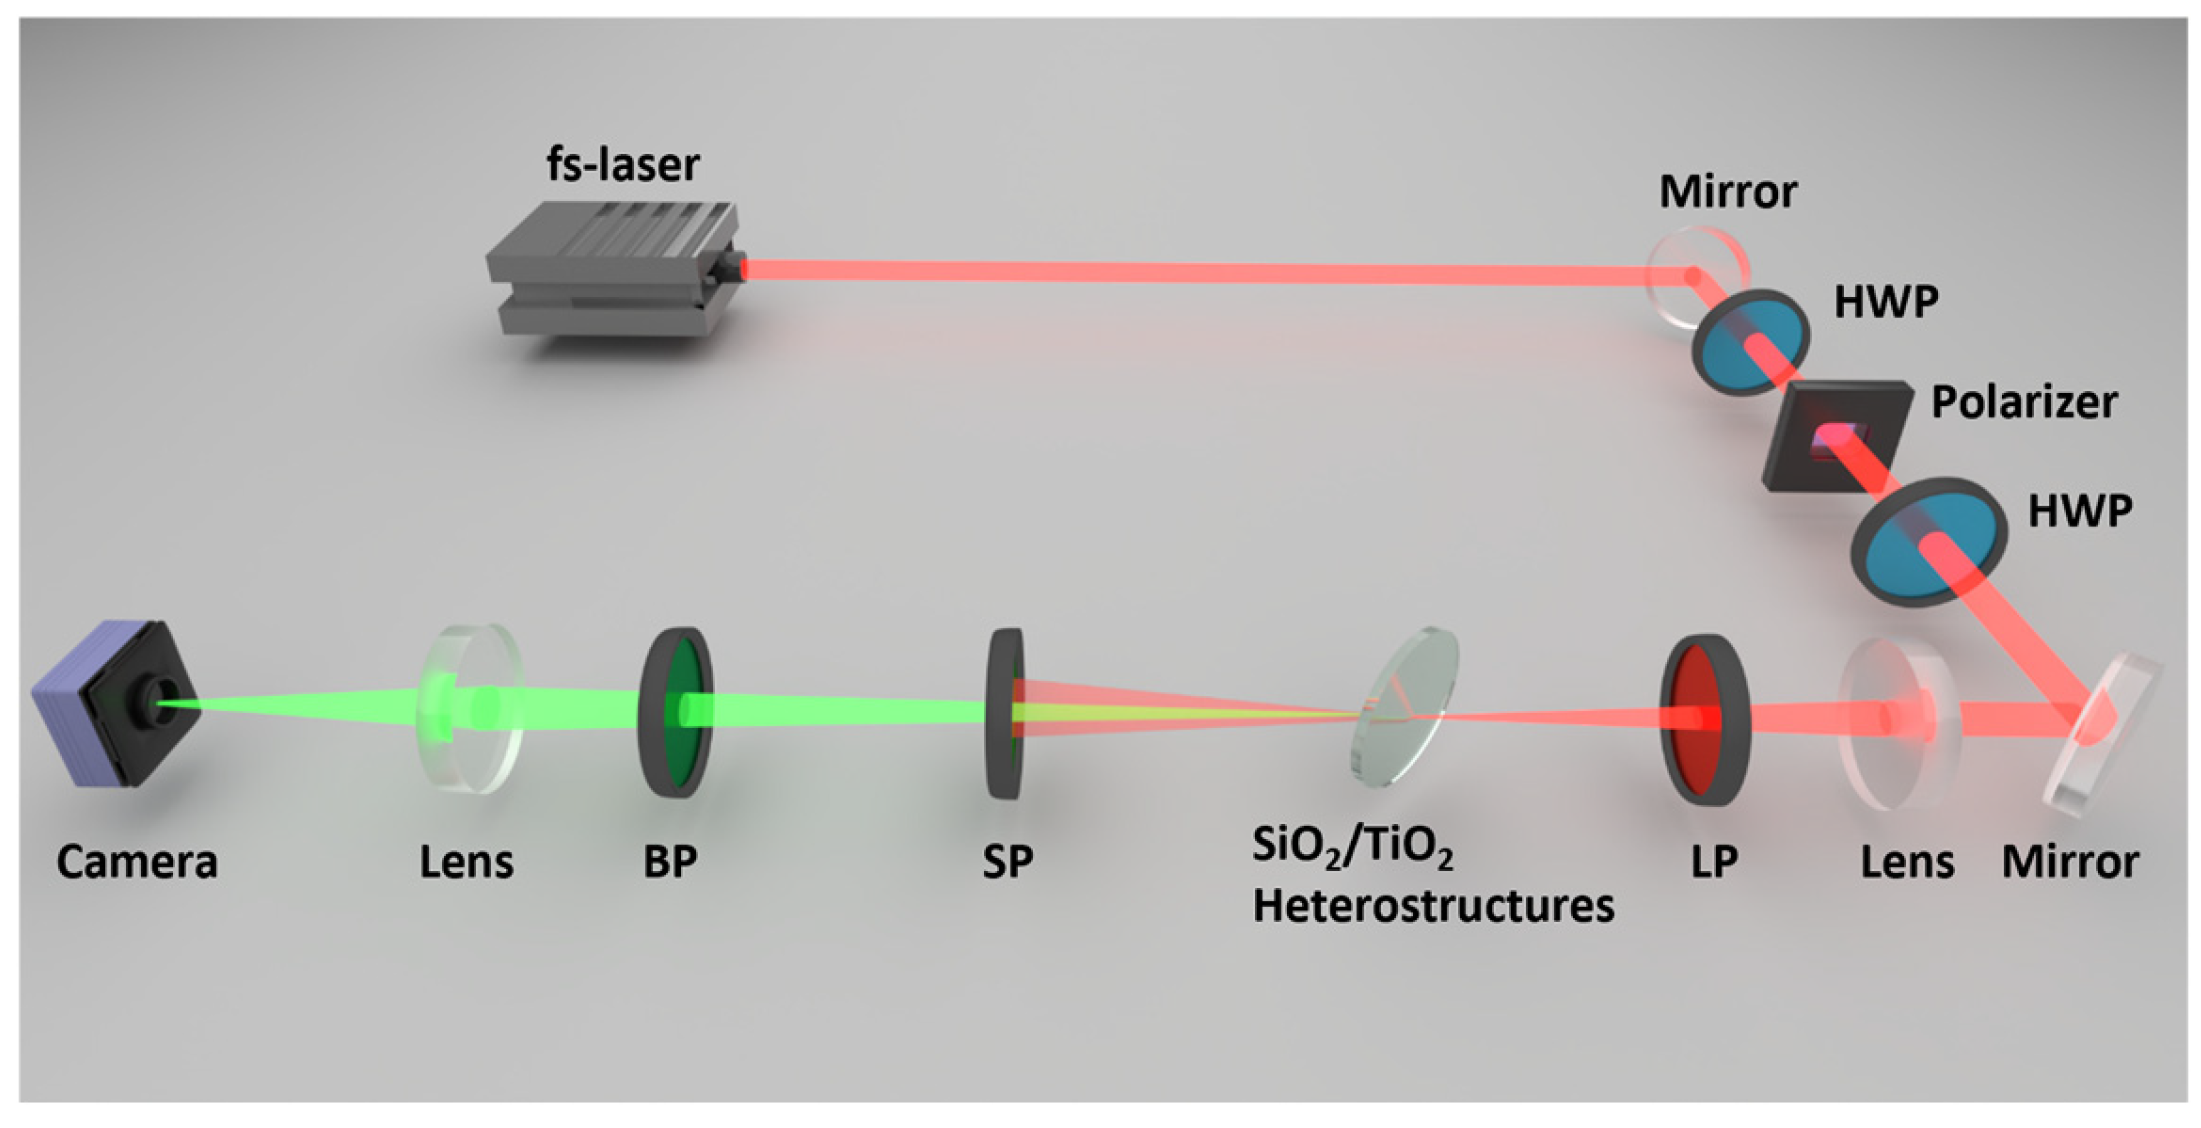
The SHG signals generated from the SiO2/TiO2 heterostructures are characterized by the setup shown in Figure 4. An ultrafast laser (Satsuma by Amplitude) with a central wavelength of 1032 nm, pulse duration of 270 fs, and a repetition rate of 200 kHz is used as the light source. The input power is adjusted via a half-wave plate (WPH05M-1030 by Thorlabs) and a polarizer (GT10-B by Thorlabs). The second half-wave plate adjusts the input polarization of the beam. The beam is focused on the sample using a plano-convex 400 mm focal length lens (LA1172-B by Thorlabs). The beam spot diameter (1/e2) on the sample is around 123 ± 3 μm. Behind the lens, a long-pass filter (FELH0900 by Thorlabs) suppresses the spuriously generated SH by the optical components preceding the sample. The short-pass filter (FESH0800 by Thorlabs) behind the sample is used to separate the transmitted fundamental light from weak SHG signal. This filter is highly transmissive from 500 nm to 789 nm. A 515 nm bandpass filter (FBH515-10 by Thorlabs) with a FWHM of 40 nm is used to remove the ambient light and higher-order harmonics. After passing through the bandpass filter, a 100 mm bi-convex lens (LA1608-A by Thorlabs) is used to image the sample onto a camera for detecting the SHG signal (CS165MU1/M by Thorlabs). The integrated pixel value over the SHG spot is calibrated to an optical power meter so that the average power of the SHG beam can be determined. The calibration factor of camera and calculation details were reported previously [42].
Figure 4.
Schematic diagram of the SHG measurement setup [42]. HWP stands for half-wave plate; LP, SP, and BP correspond to long-pass, short-pass, and bandpass filter, respectively.
The angular and power dependency of the SHG signals emitted by the sample are investigated. The straight transmitted SHG light is measured. For the angular dependency, the SHG is measured over a range of AOI with a fixed laser power. The AOI corresponding to the maximum SHG signal is determined, and this AOI was then kept fixed for the power-dependence measurements. The fundamental laser power is gradually increased from 10 mW to 858 mW while recording the SHG signal.
3. Results
3.1. Linear Optical Properties of SiO2/TiO2 Nanolaminates
3.1.1. Refractive Index and Film Thickness of SiO2/TiO2 Nanolaminates
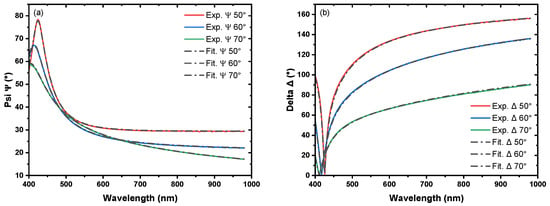
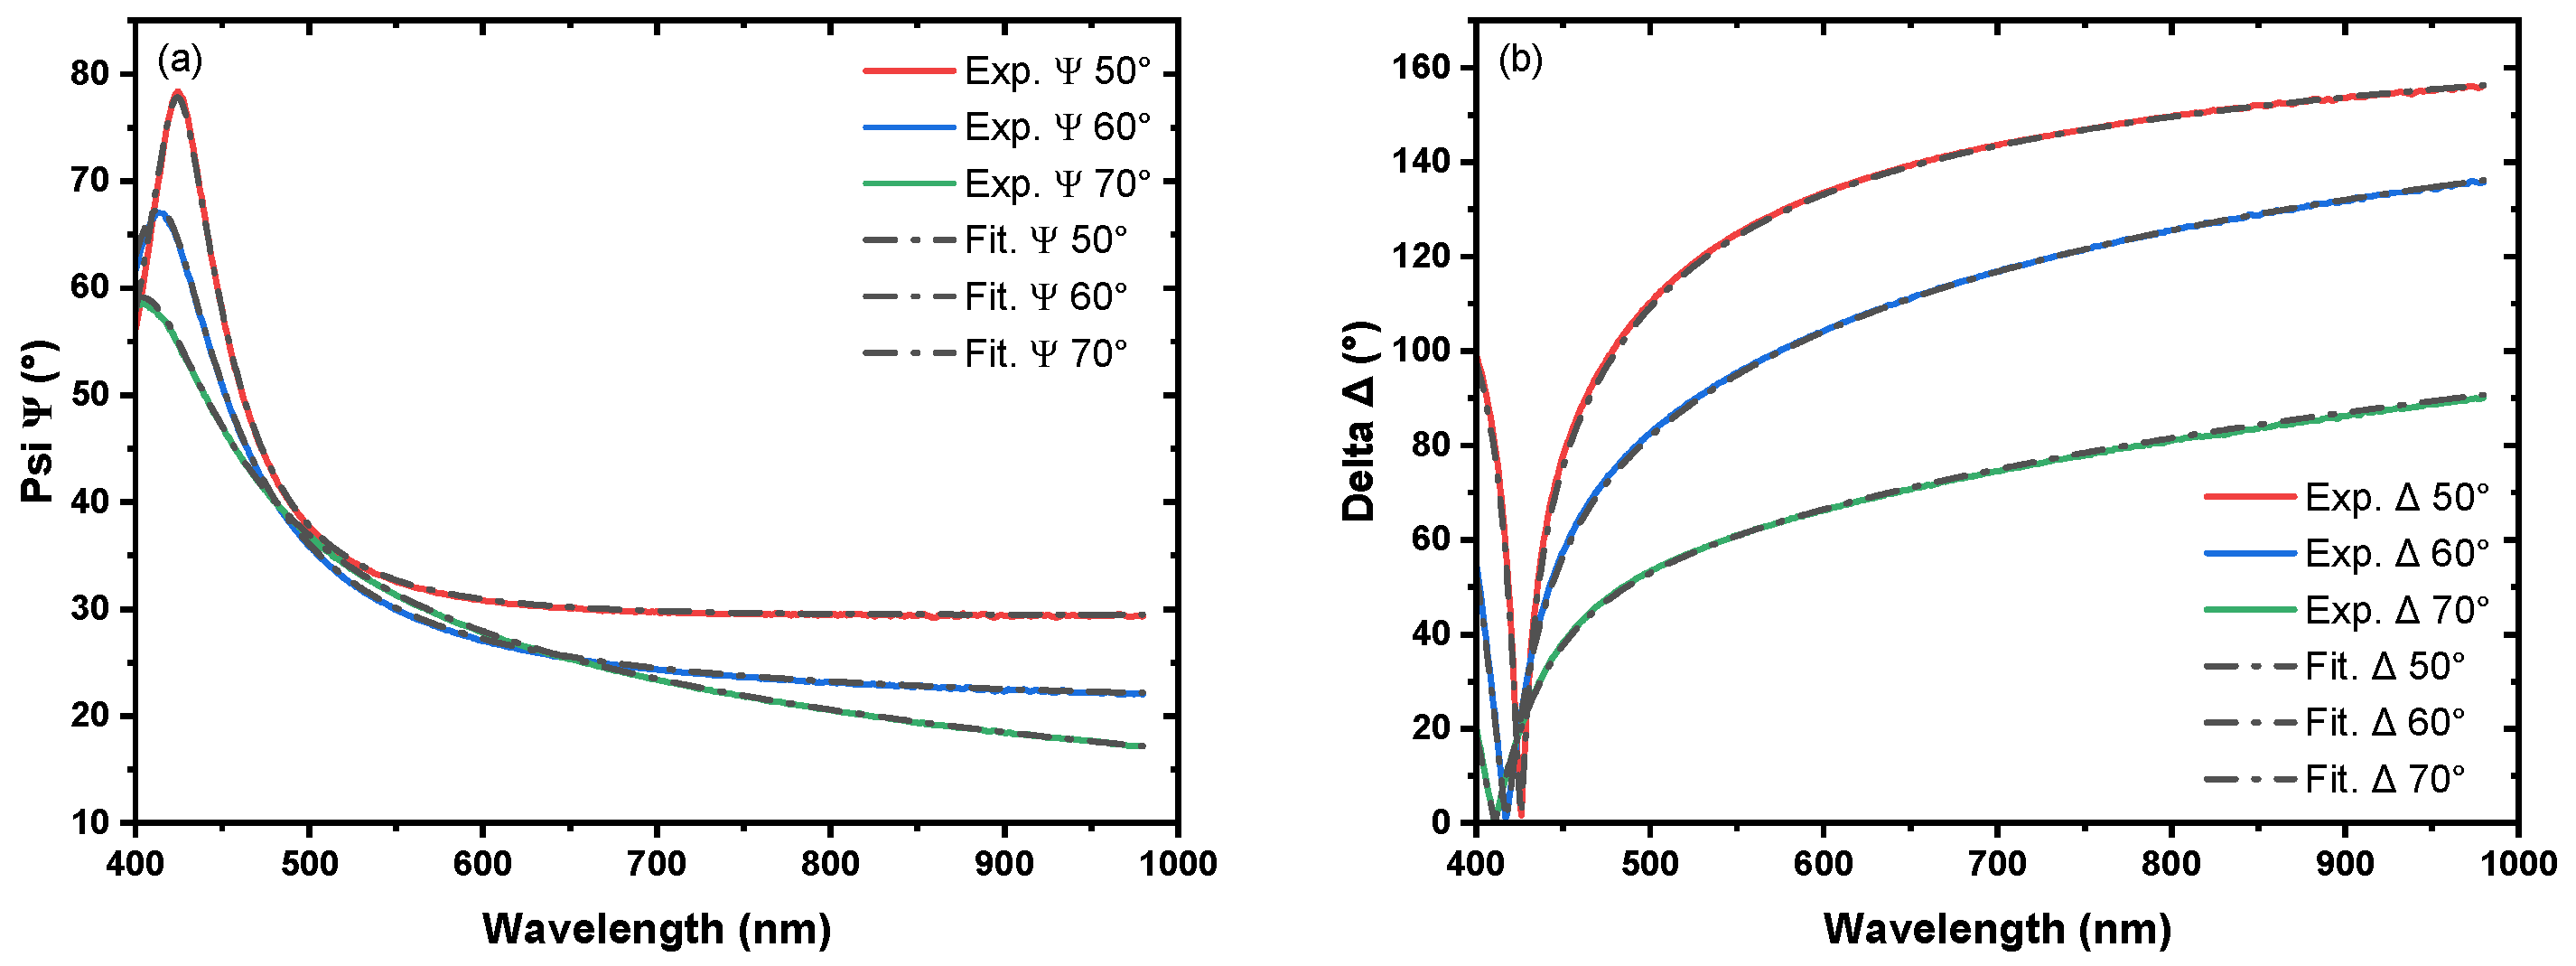
To analyze the linear optical properties of SiO2/TiO2 nanolaminates with ellipsometry, an appropriate dispersion model is applied. For the heterostructures, due to the form birefringence property, the effective medium can be regarded as a homogeneous uniaxial medium with an optical axis along the surface normal. Thus, a uniaxial Sellmeier model has been used to analyze all the heterostructures. Ψ and Δ from the ellipsometry measurement could be fitted accurately. Figure 5 shows a fitting example for the sample SiO2:TiO2 = [8:12]*30, where 8 and 12 correspond to the ALD cycles of SiO2 and TiO2, respectively, in one period, and 30 is the number of supercycles. The total thickness, d, is ~54 nm and the target period thickness pAB is 1.8 nm (see Table 2). The uniaxial dispersion model is based on the Sellmeier dispersion model, which utilizes two oscillator layers to characterize the ordinary () and extraordinary () refractive indices, respectively. During the fitting procedure, the physical parameters such as film total thickness, as well as ordinary and extraordinary refractive indices, were fitted.
Figure 5.
Measured ellipsometric parameters and fitting by uniaxial anisotropic model for the sample SiO2:TiO2 = [8:12]*30: (a) Ψ and (b) Δ.
Table 2.
Deposition information and birefringence of all the SiO2:TiO2 nanolaminates.
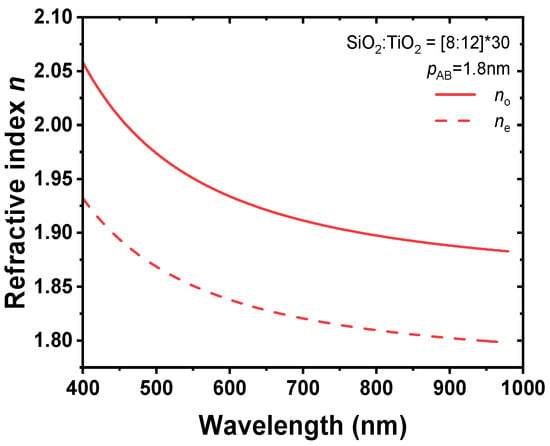
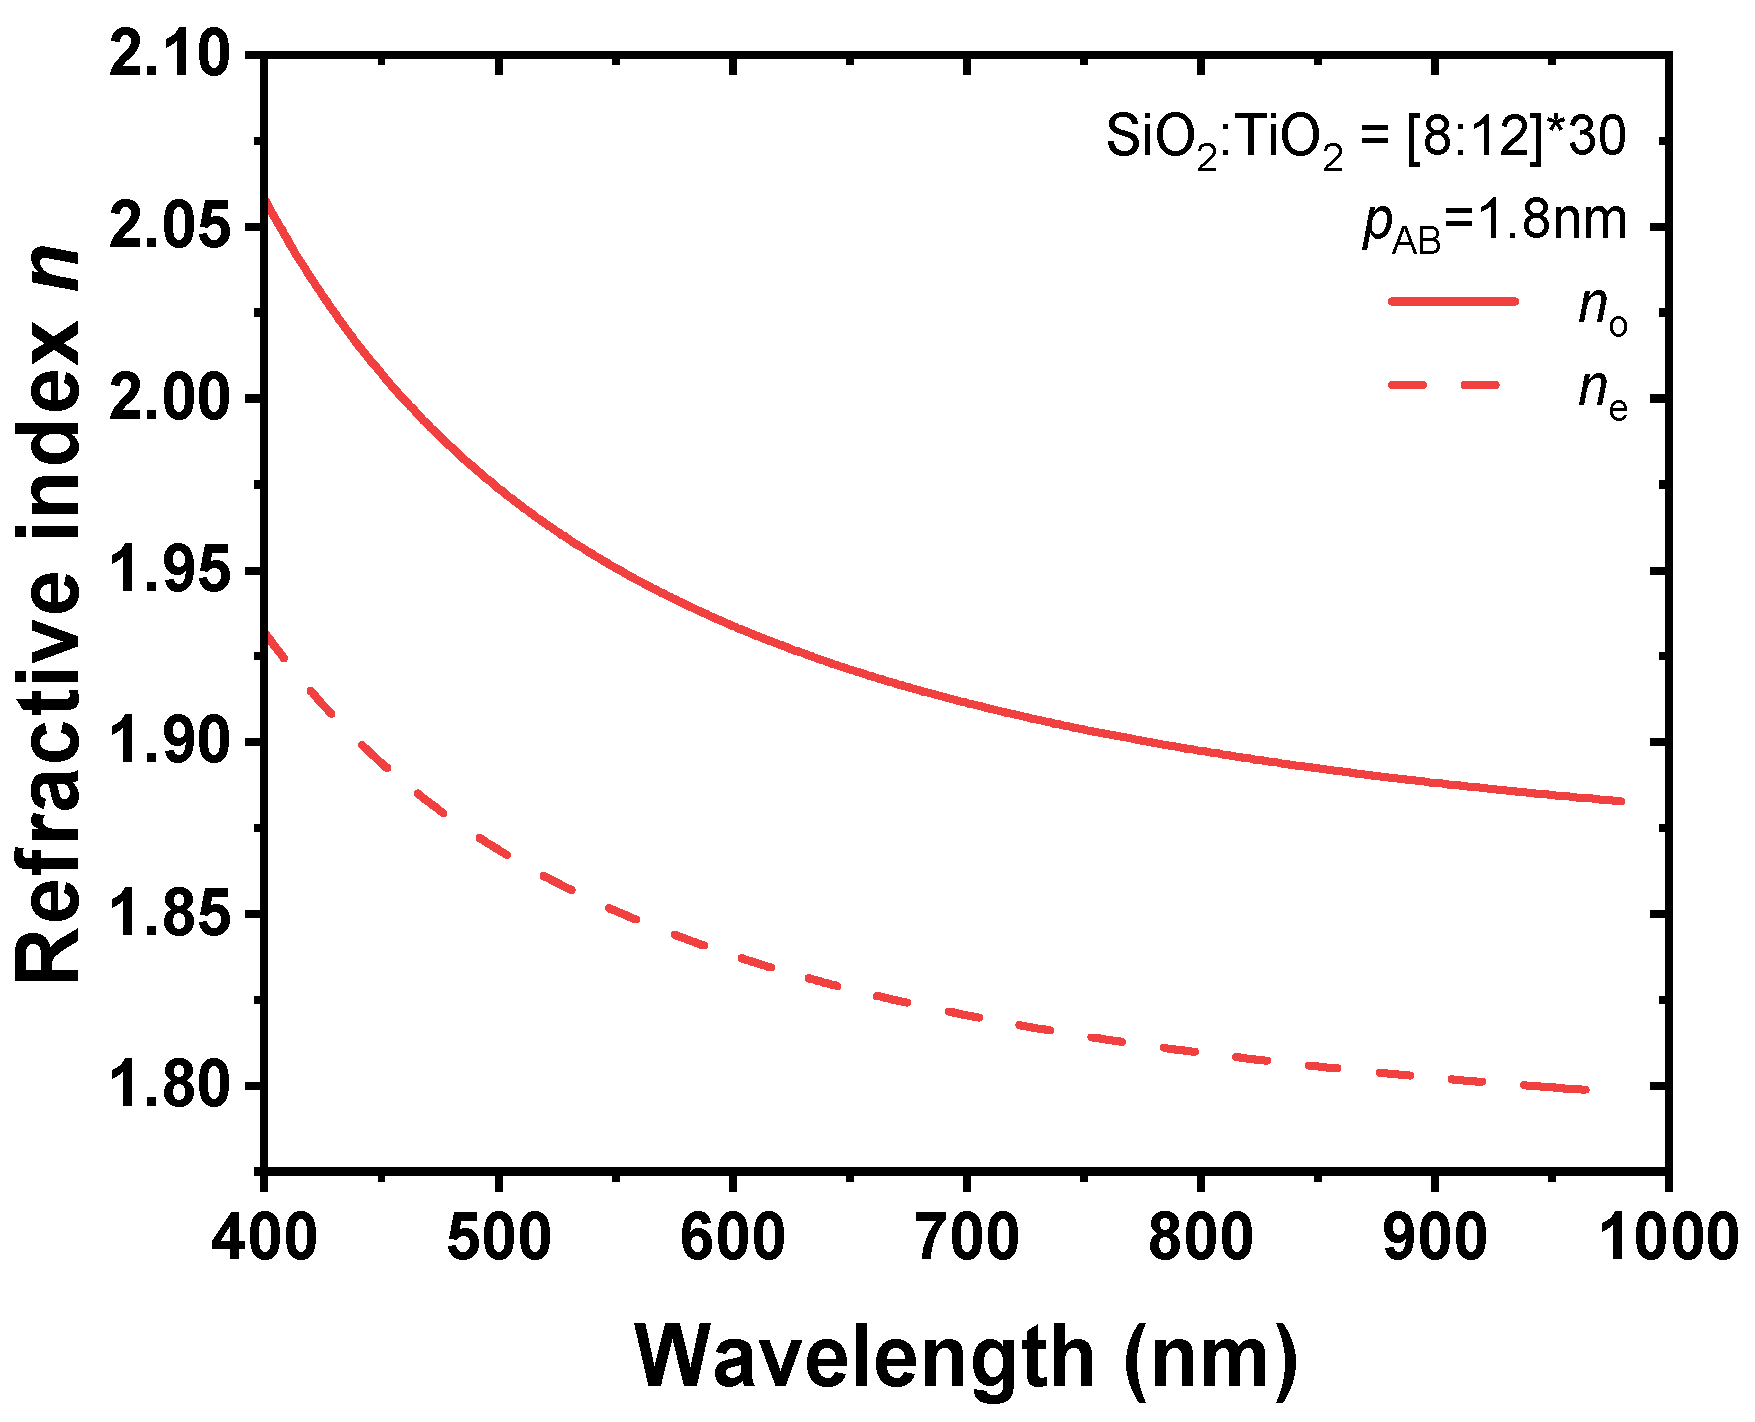
Figure 6 shows fitted curves for and . The solid line represents the ordinary refractive index, and the dashed line denotes the extraordinary refractive index. According to the above Equations (1)–(3), the effective medium should behave like a negative uniaxial crystal, and the fitted refractive indices are consistent with the theory.
Figure 6.
Fitting example for the sample SiO2:TiO2 = [8:12]*30. Solid line shows the ordinary refractive index, and dashed line shows the extraordinary refractive index.
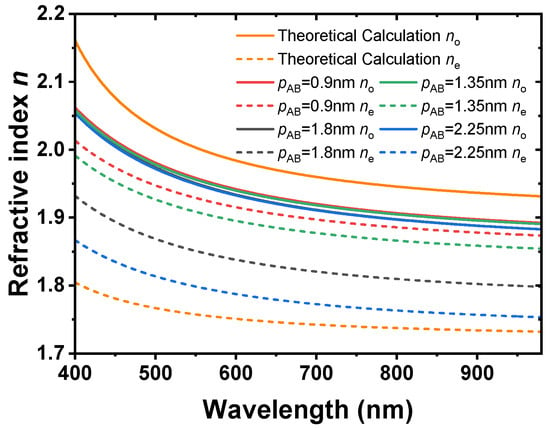
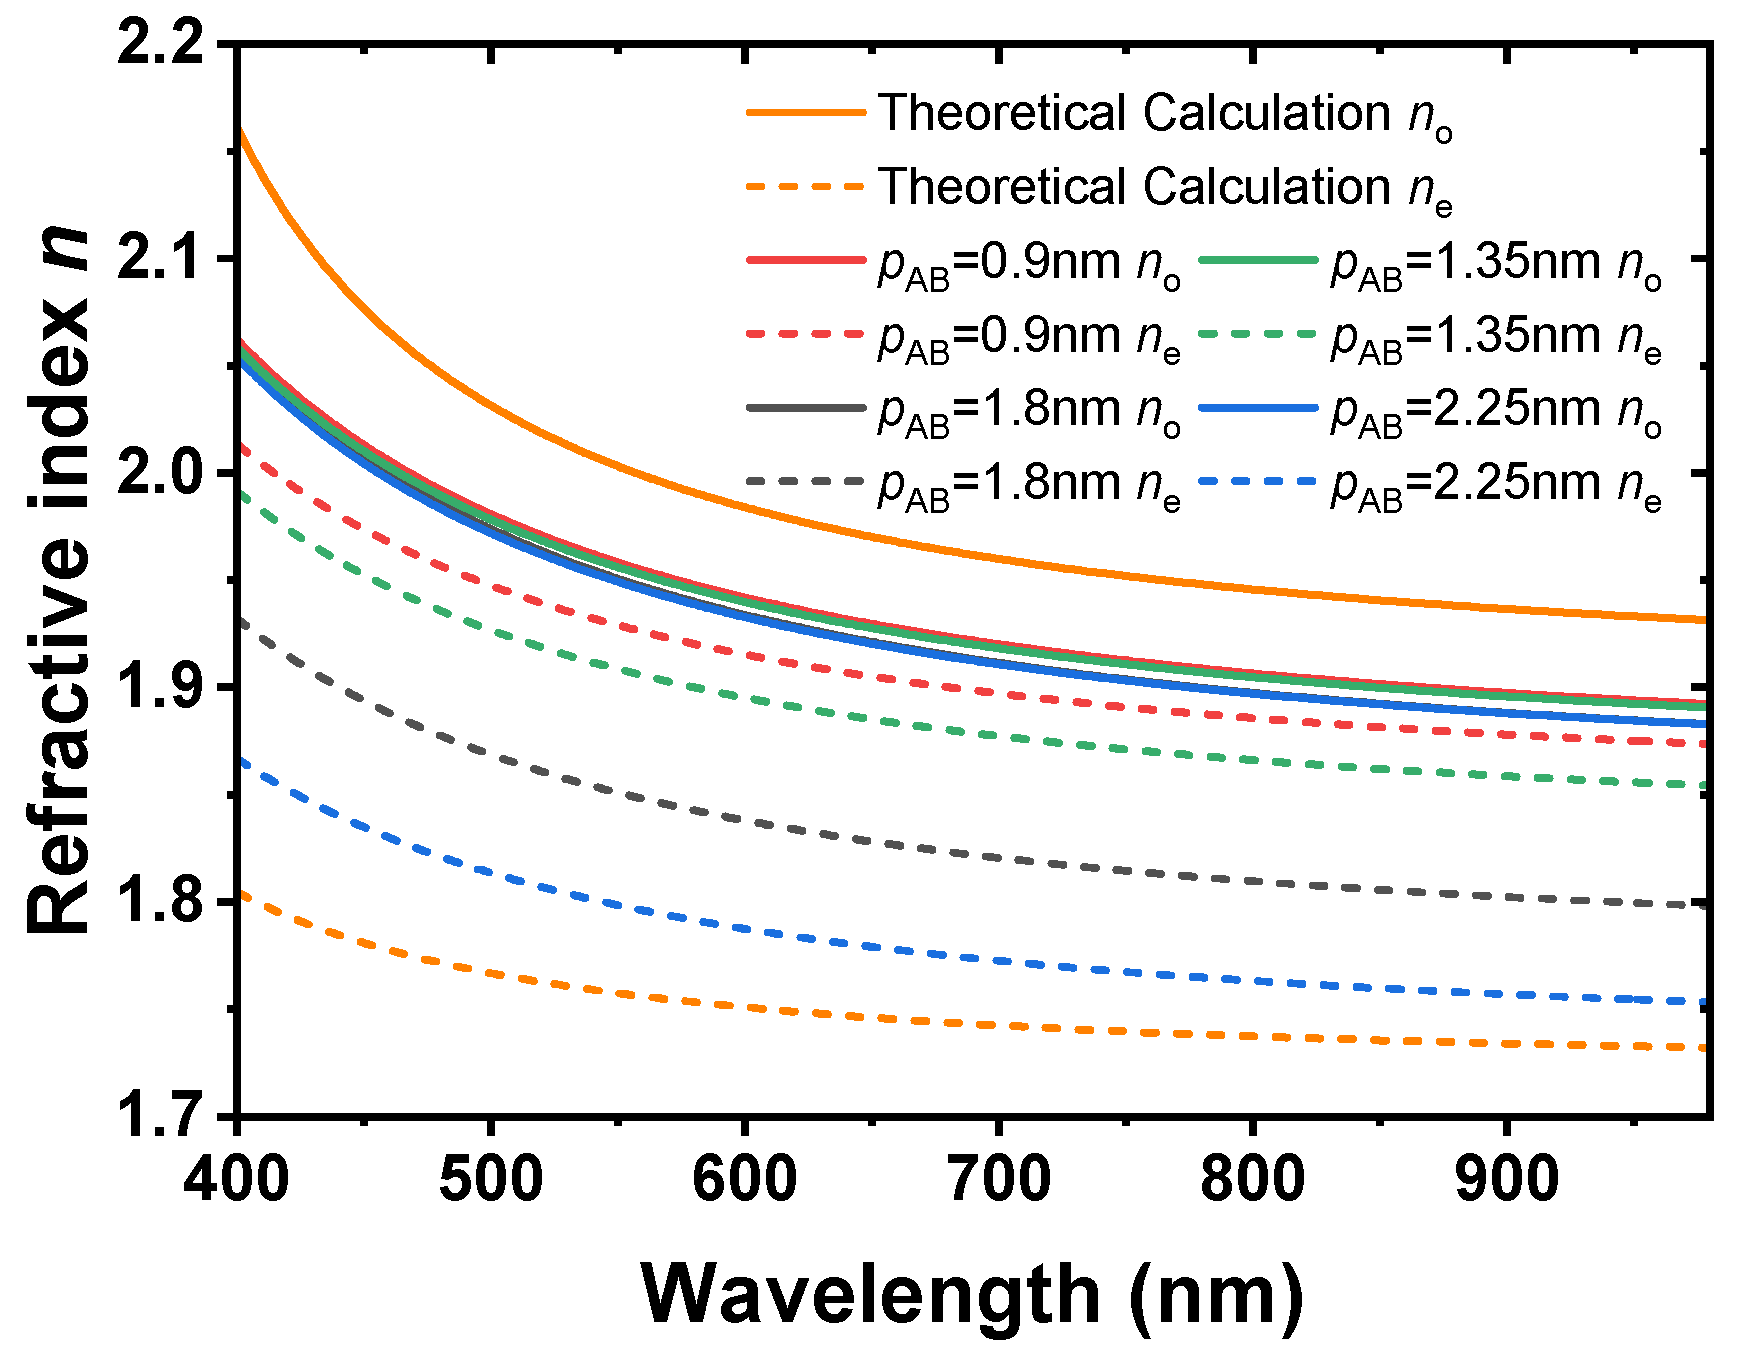
The uniaxial anisotropic dispersion model was subsequently used to fit all other SiO2:TiO2 compositions. The information of all SiO2:TiO2 samples is given in Table 2. We first analyzed all the samples that have the same target total thickness, d, varying [SiO2:TiO2]-period thicknesses, pAB, but the same volume fraction of each component. The fitted refractive indices for samples with a target thickness of 54 nm are shown in Figure 7. It should be noticed that when the period thickness changes, changes slightly, while changes more noticeably. The sample with the thinnest period exhibits the smallest difference between and . When the period thickness becomes thicker, the also becomes larger. Although these four samples have the same target total thickness, the fitted total thicknesses are different. For the deposition period [4:6], the fitted total thickness is 52 nm, which is smaller than the target thickness. The target individual layer thickness of this sample is smaller than 0.5 nm; intermixing at the interface could play an important role, since the interface roughness is comparable to the individual layer thickness as discussed in Section 3.1.3 below. There is also a change in the growth of the materials in the initial 1–2 ALD cycles. For the deposition period [10:15], the fitted total thickness is 54.8 nm. However, the difference between the total thicknesses of different periods [4:6] and [10:15], which is 2.8 nm is small. Both samples have exactly the same number of SiO2 (240) and TiO2 (360) deposition cycles. The variation in the film thickness indicates a different GPC of the oxide deposited on each other with rapid variation in the sequence than when SiO2 or TiO2 grows on itself. Intermixing might influence the available functional sites and hindrance due to the ligands. However, no direct chemical or cross-sectional structural characterization was performed in this work. Therefore, the extent of other interface quality-decreasing mechanisms cannot be excluded.
Figure 7.
Ordinary and extraordinary refractive indices of samples with the same total thickness, d, but different period thickness.
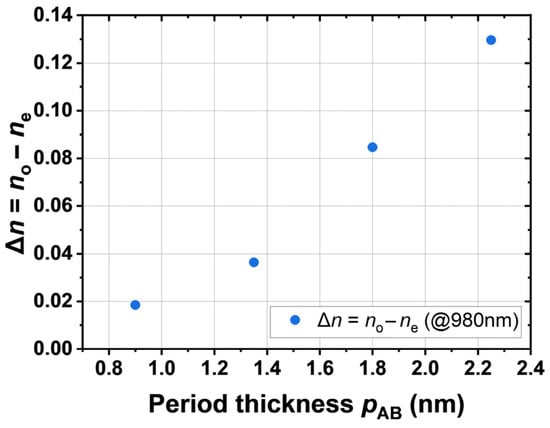
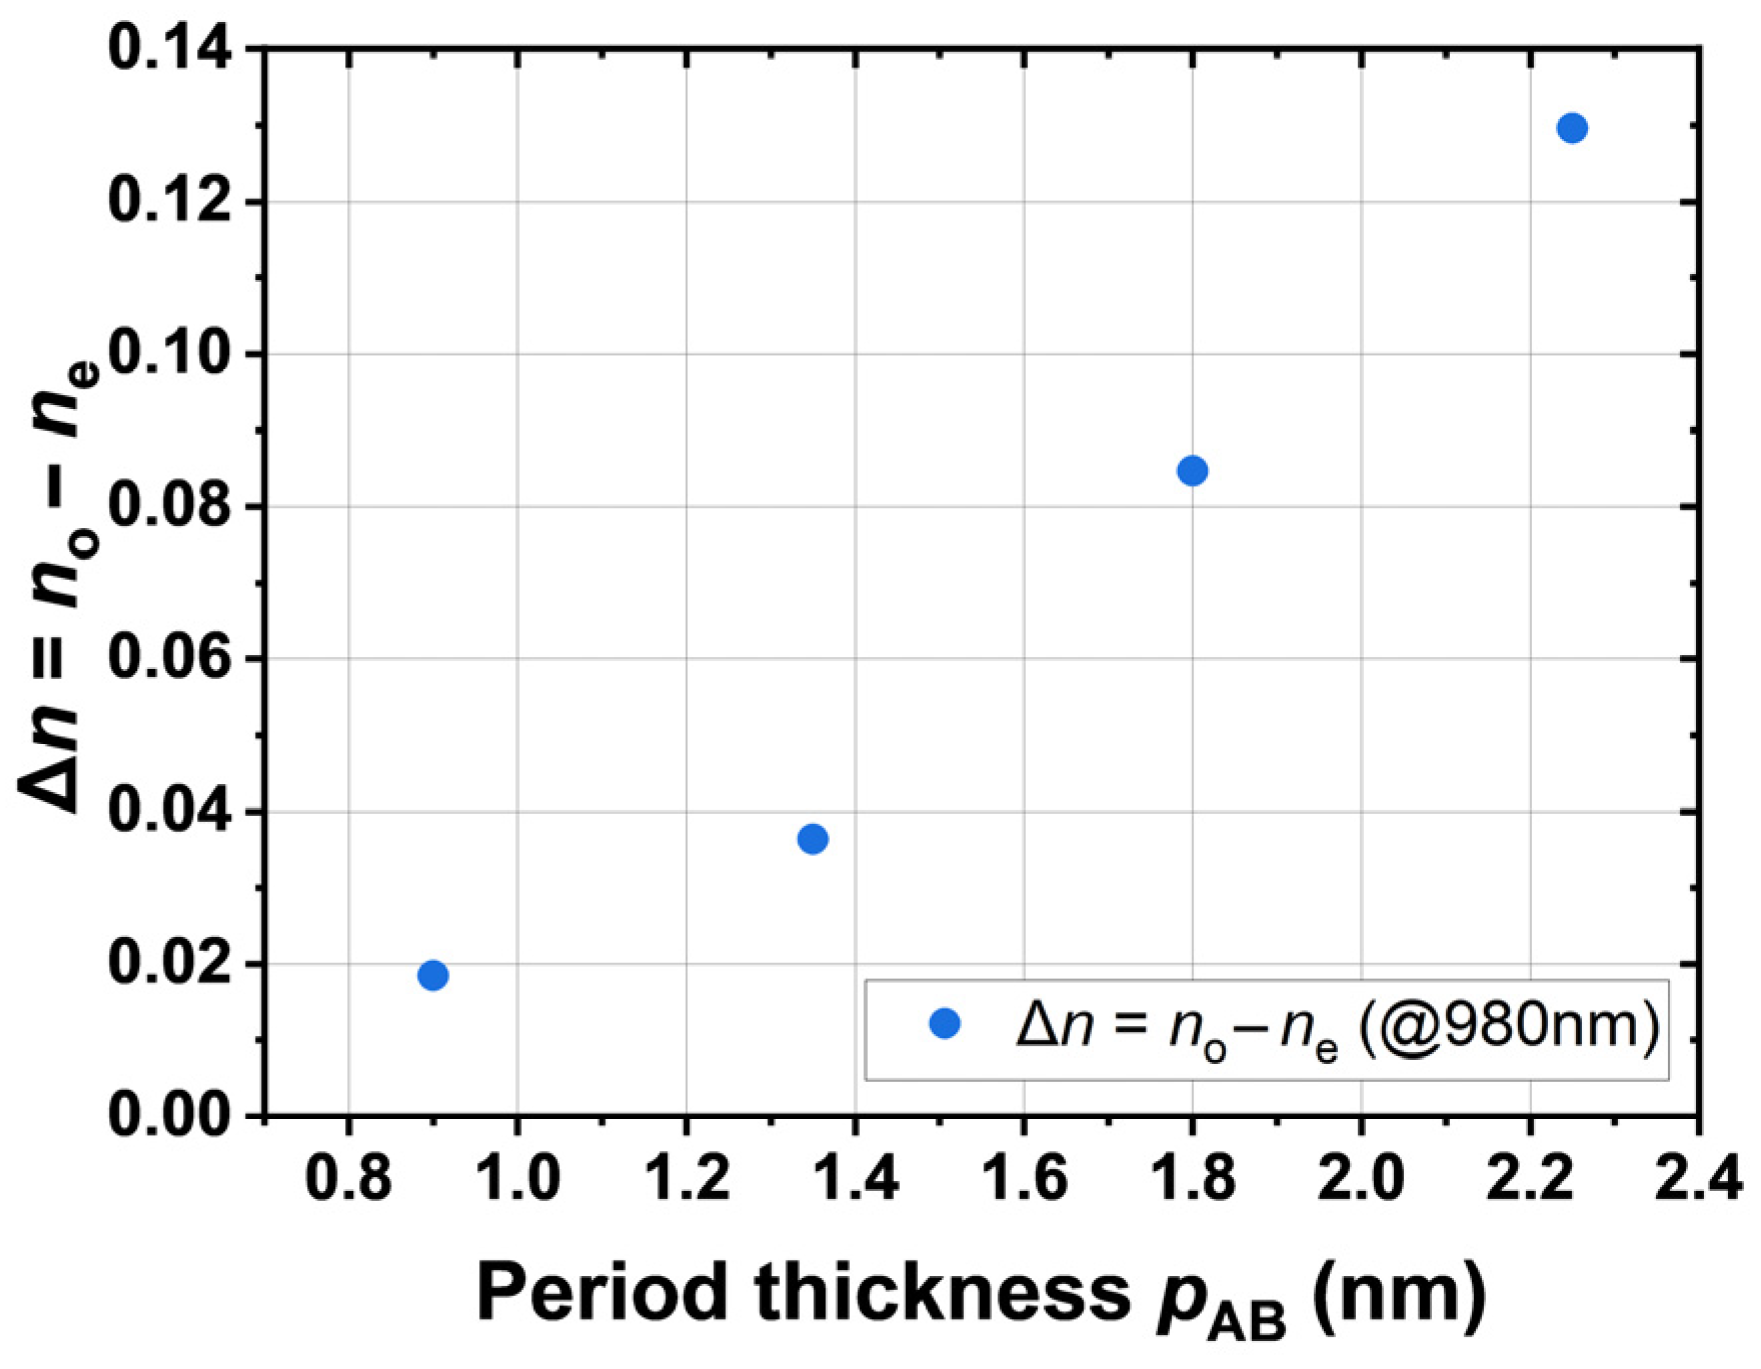
Figure 8 shows how the values change with the period thickness at the wavelength of 980 nm. The theoretical calculation of the at 980 nm is 0.20. This theoretical value is higher than the values from the ellipsometry analysis. The first group of samples have the same target total thickness, i.e., varying [SiO2:TiO2]-period thicknesses, but the same volume fraction of each component. Thus, they are expected to have the same effective refractive indices according to the theory [17]. This inconsistency may also be explained by intermixing. These four samples have very thin individual layer thicknesses, which are close to the interface roughness, as discussed in Section 3.1.3 below. Thus, intermixing can contribute to the variance on the refractive indices. The influence of other interface quality decreasing mechanisms cannot be excluded.
Figure 8.
The difference between and at 980 nm wavelength for samples with the same volume fraction.
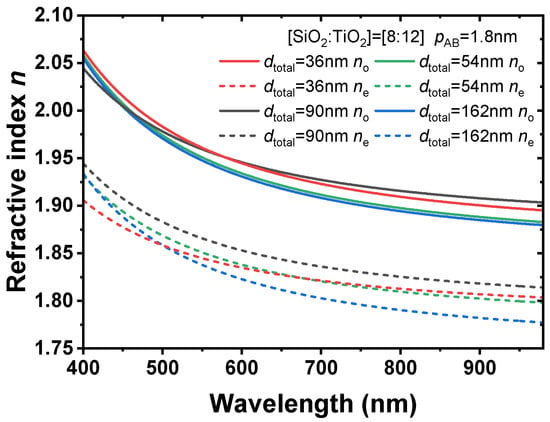
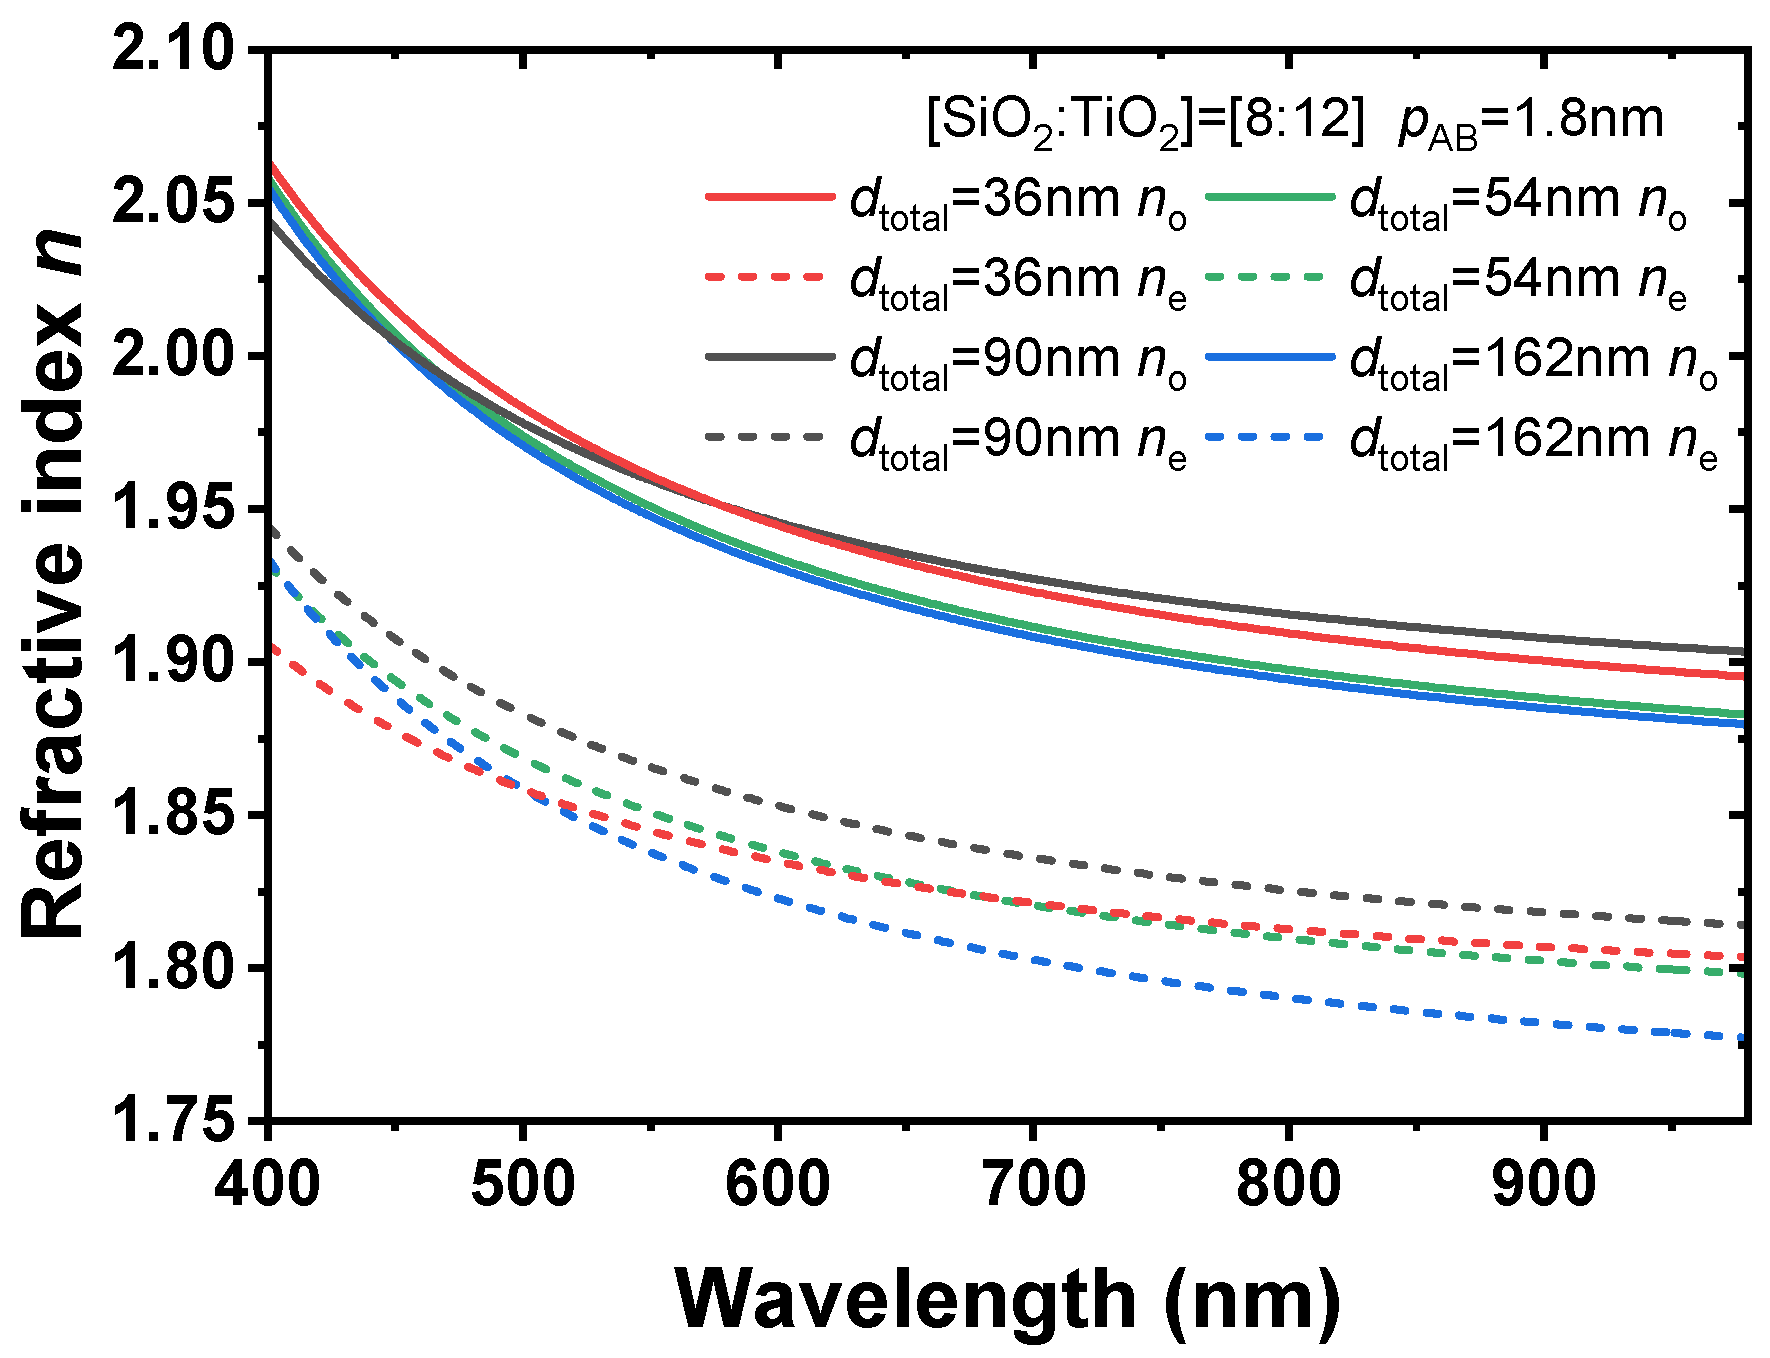
Next, the samples with the same period SiO2:TiO2 = [8:12] but different total thicknesses will be discussed. The refractive indices are largely independent of the total thickness, as shown in Figure 9. The slight differences can be attributed to fitting errors, variations in film growth conditions, different thicknesses, and surface roughness.
Figure 9.
Ordinary and extraordinary refractive indices of the second batch of samples.
To test the repeatability, we fabricated two samples using the same processes, but one of them was deposited half a year later. The difference in film thickness of 1 nm is most likely caused by the slight variations in the growth conditions and the fitted refractive indices given in supplementary material also show only slight variations.
3.1.2. Transmittance and Reflectance
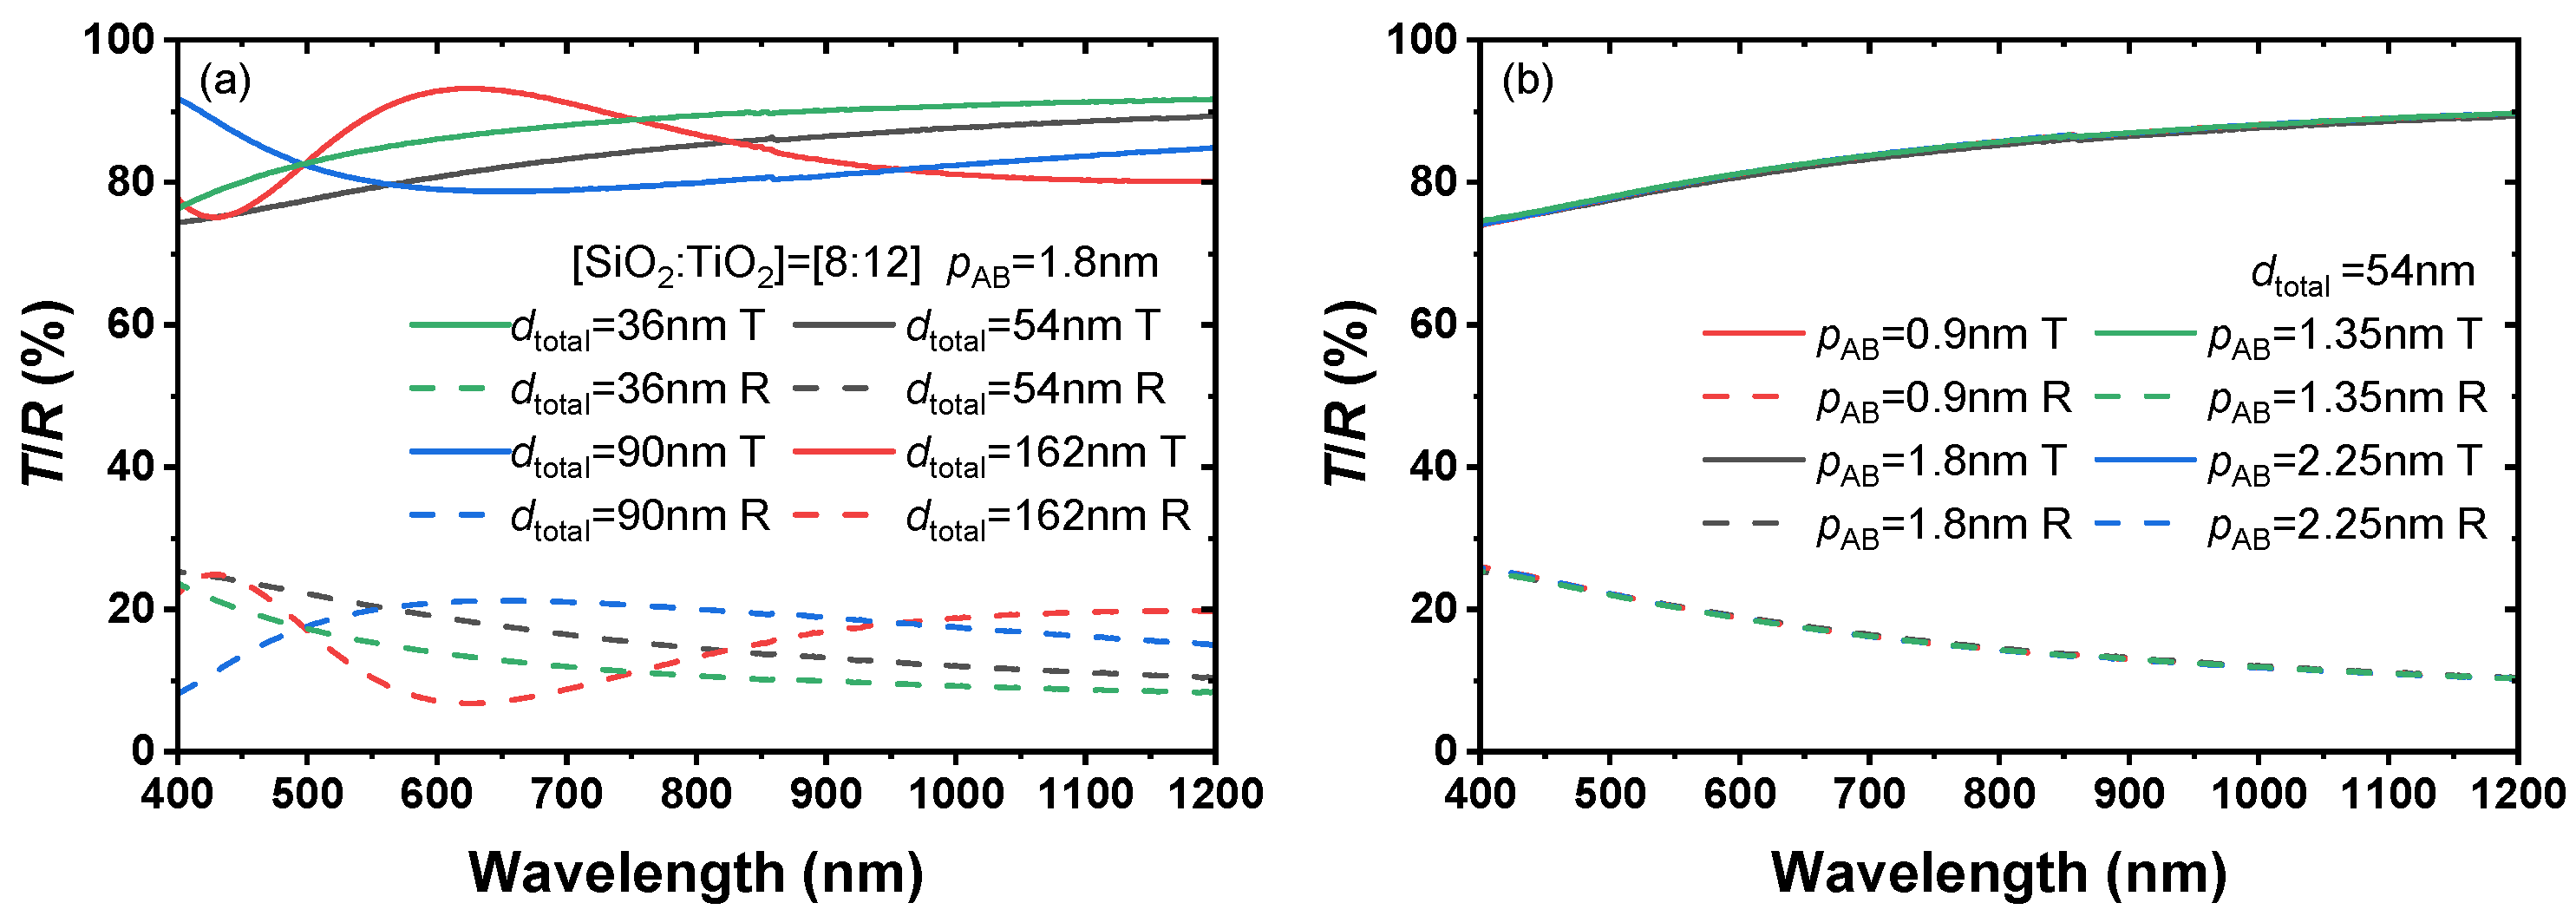
Transmittance and reflectance spectra of these heterostructures at an angle of incidence of 6° are shown in Figure 10. Figure 10a shows that the samples with the same period but different total thickness possess different T/R spectra, as expected.
Figure 10.
Transmittance and reflectance: (a) T/R data of the samples with period [8:12] but different number of supercycles; (b) T/R data of the samples with the same total thickness but different periods.
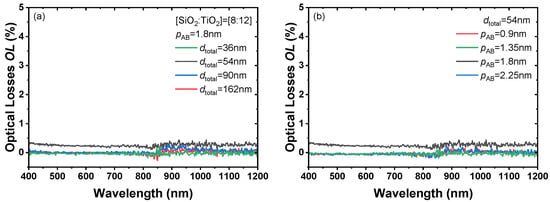
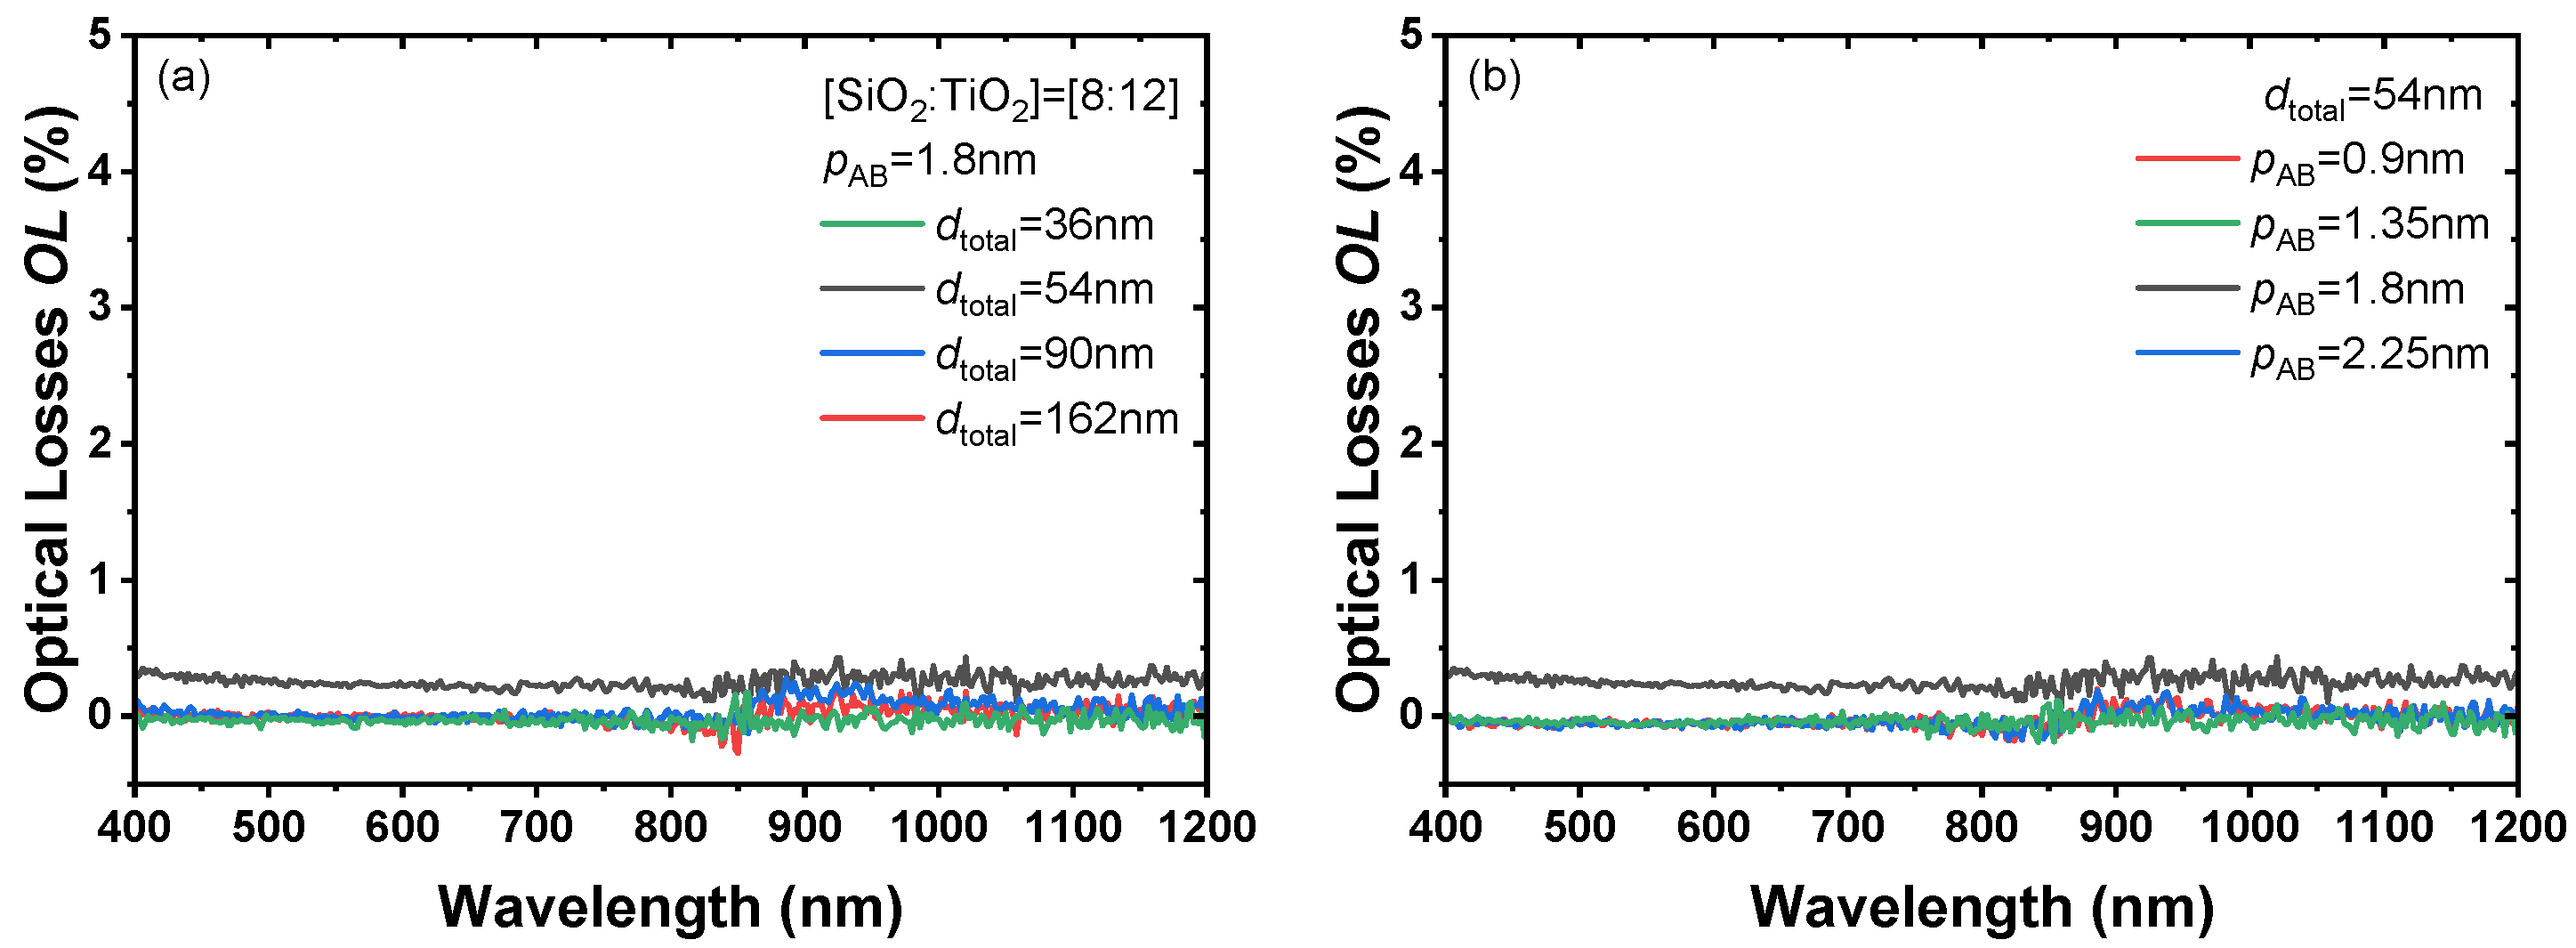
However, Figure 10b exhibits that the samples with the same total thickness but different periods have coinciding T and R spectra in the wavelength range of 400 nm–1200 nm at 6° of incidence. The incident angle of 6° is sufficiently small to be regarded as normal incidence. Thus, the transmittance and reflectance of these samples should be almost the same due to the similar values. The corresponding optical losses in the wavelength range of 400 nm–1200 nm are calculated in Figure 11, which proves that our samples have low optical losses at both fundamental wavelength (FW) and second harmonic (SH) wavelength, which is beneficial for obtaining a good laser stability and high laser-induced damage threshold.
Figure 11.
Optical losses of samples in Figure 10. (a) the samples with period [8:12] but different number of supercycles; (b) the samples with the same total thickness but different periods.
3.1.3. X-Ray Reflectivity Analysis
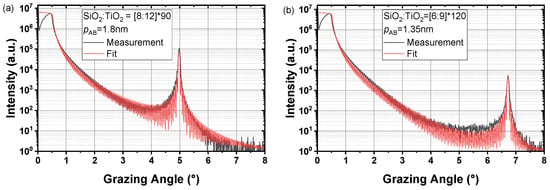
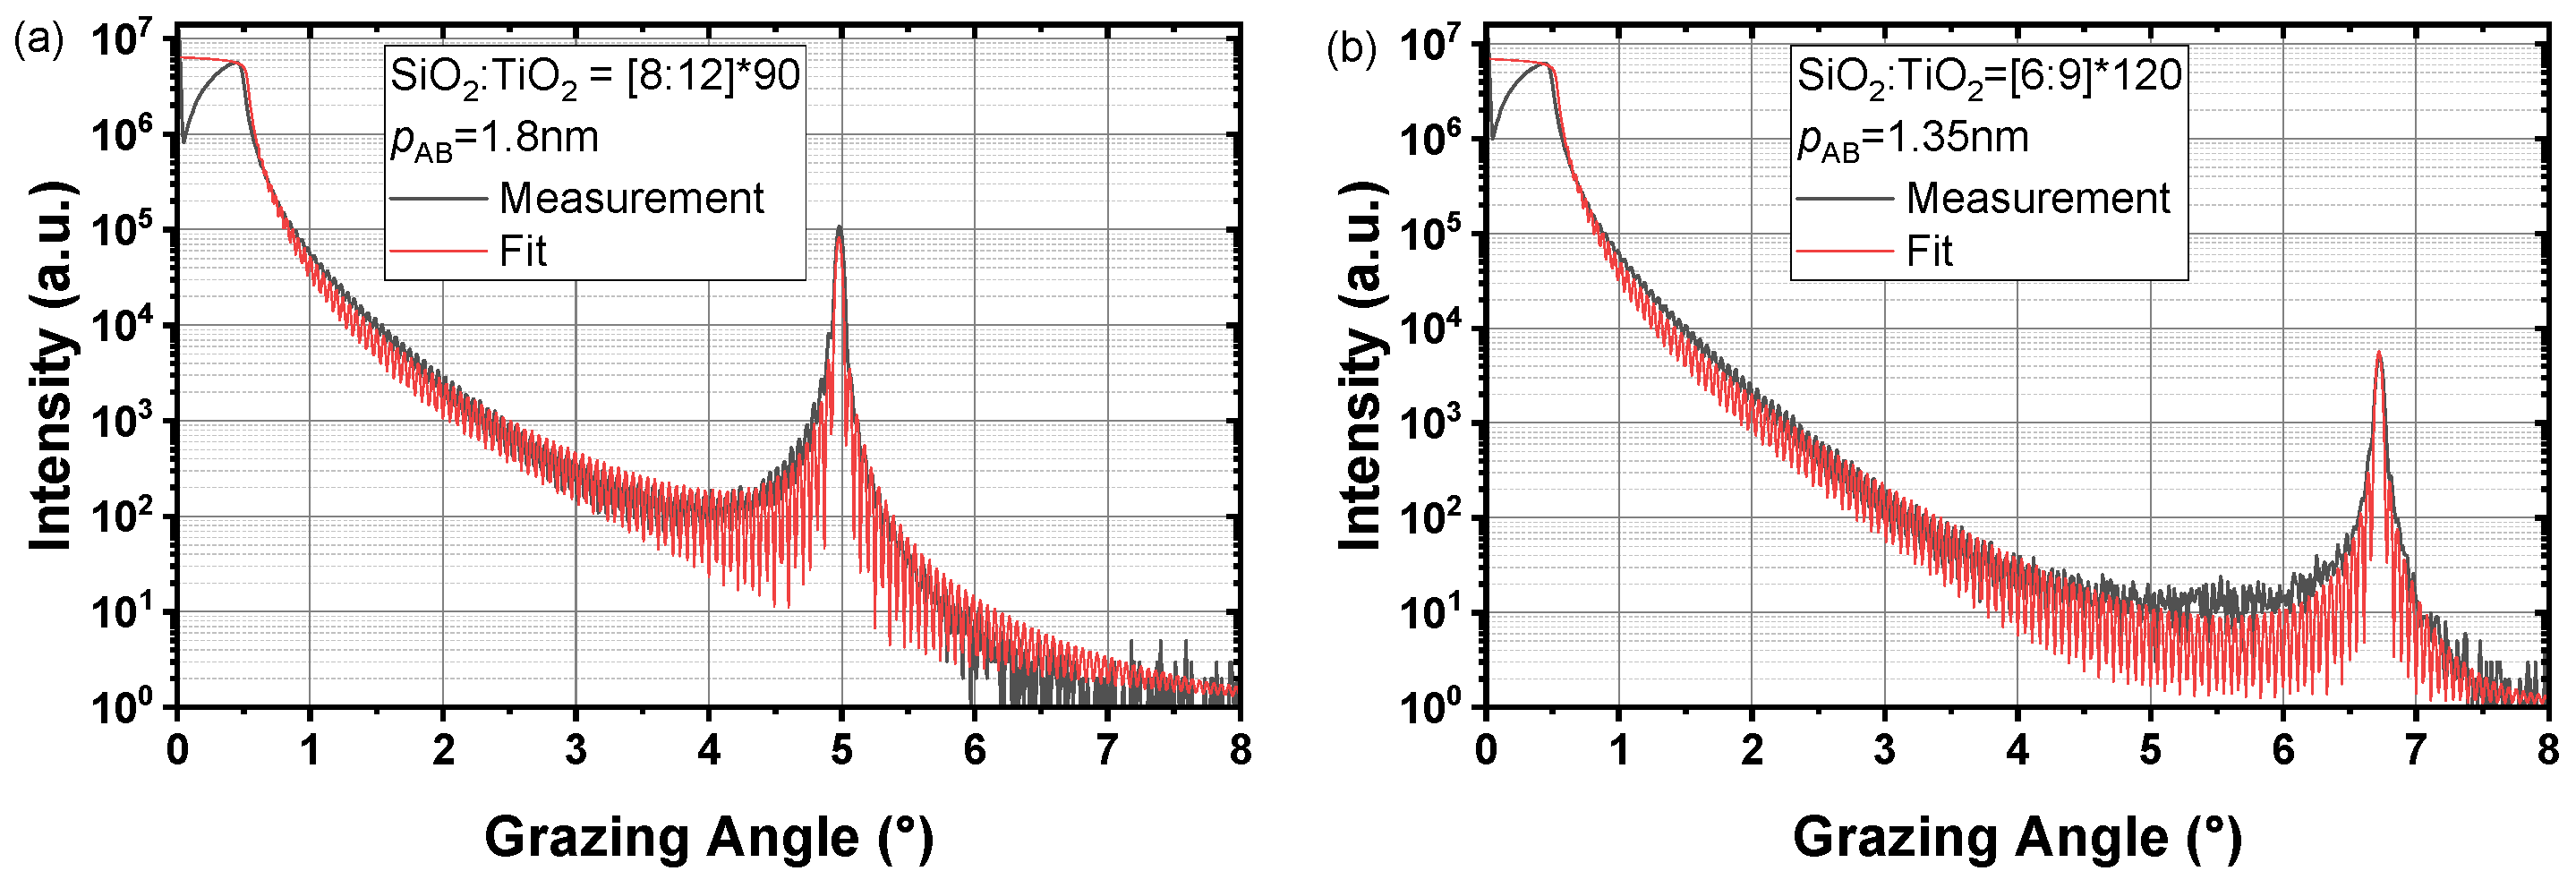
X-ray reflectivity (XRR) is a non-destructive technique that can provide information on film thickness, roughness and intermixing at interfaces, and layer density. In this work, XRR was used to analyze two thicker samples on silicon substrates at grazing angles from 0° to 8°. The measured data and fitted fringes are shown in Figure 12.
Figure 12.
XRR comparison between (a) SiO2:TiO2 = [8:12]*90 and (b) SiO2:TiO2 = [6:9]*120.
The presence of the sharp Bragg peaks indicates a strong periodic structure, as expected. The estimated layer thicknesses of SiO2 for SiO2:TiO2 = [6:9] and [8:12] heterostructures were 0.6 nm and 0.8 nm, respectively. The estimated layer thicknesses of TiO2 were 0.7 nm and 1.0 nm. Intermixing can be estimated with the interface roughness. When the individual layer thickness becomes thinner, the interface roughness becomes higher, which leads to the variations in the refractive indices in Figure 7. Table 3 summarizes the total film thicknesses and interface roughness, comparing ellipsometry and XRR results. The total thicknesses obtained from ellipsometry and XRR are almost identical.
Table 3.
XRR data and thickness comparison with ellipsometry.
3.2. Nonlinear Optical Properties of SiO2/TiO2 Nanolaminates
3.2.1. Angular and Power Dependency
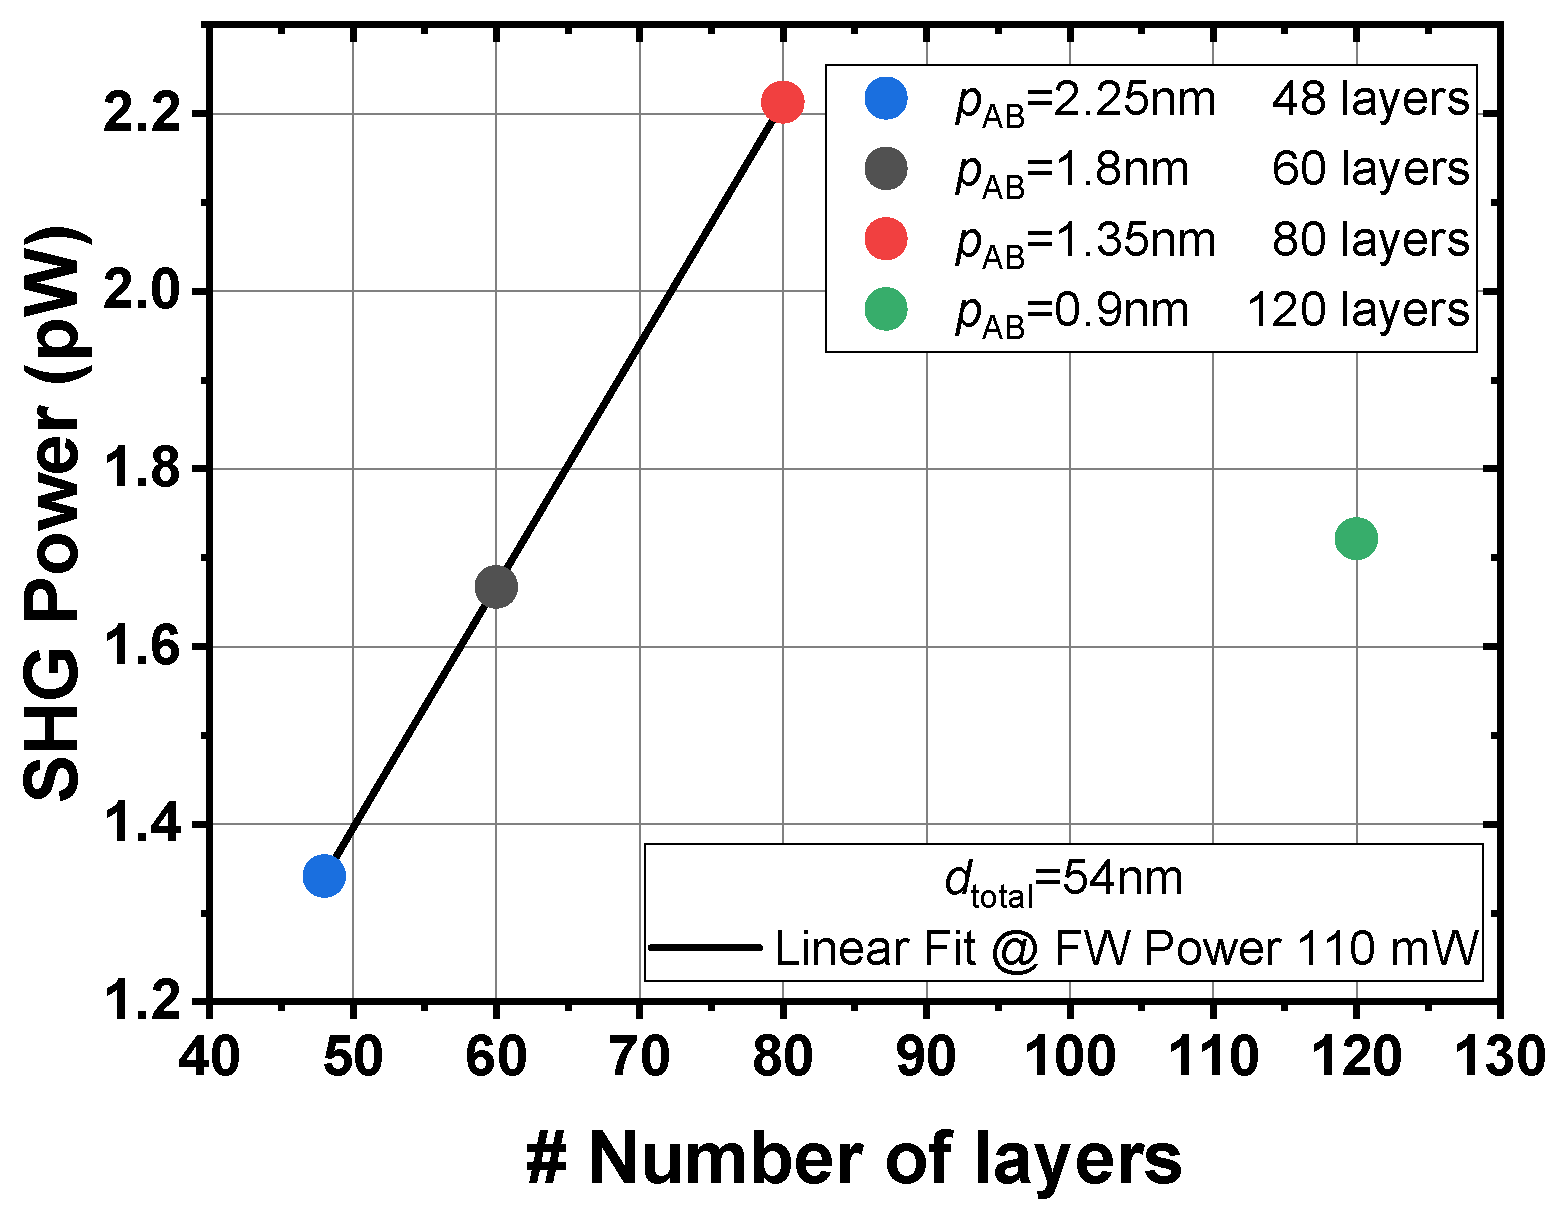
In the theoretical model, all the surface/interface nonlinearities are integrated into the first effective surface nonlinearity, , which can be converted to the effective bulk nonlinearity for the overall structure. To study the relationship between the number of interfaces and nonlinearities, the heterostructures have different [SiO2/TiO2]-period thicknesses but nominally identical volume fraction of each component. Figure 13 shows the measured angular and power dependency of the average SH power. The SHG signal is clearly dependent on the number of interfaces. With more interfaces, the peak value of the SHG signal is also higher. The power dependency is used to verify that of which we indeed obtain the SHG, with the slope of the lines in the range of 1.968(12) to 2.071(3), as shown in Figure 14. The uncertainties with the slopes are the standard errors from linear fittings. However, for the sample [4:6]*60, which has the largest number of interfaces, the SHG signal is not the highest. Due to the fact that the individual layer thickness is only about 0.5 nm, in this case, intermixing may contribute to the decrease in the quality of the interfaces, which leads to a reduced SH signal. From Figure 13, it is obvious that the measured average SH power is dependent on the number of interfaces. The dependency is expected to be linear, since the nonlinearity is proportional to the interface densities. As long as the layer thickness is larger than 0.5 nm, the measured SH power is consistent with this expected linear dependency (see Figure 15). As discussed before, this consistency is broken for the sample with thinnest layer thickness, and intermixing may reduce the SHG signals.
Figure 13.
(a) Angular dependency measured at 250 mW incident power and (b) power dependency of the SiO2/TiO2 samples with the same total thickness but different periods.
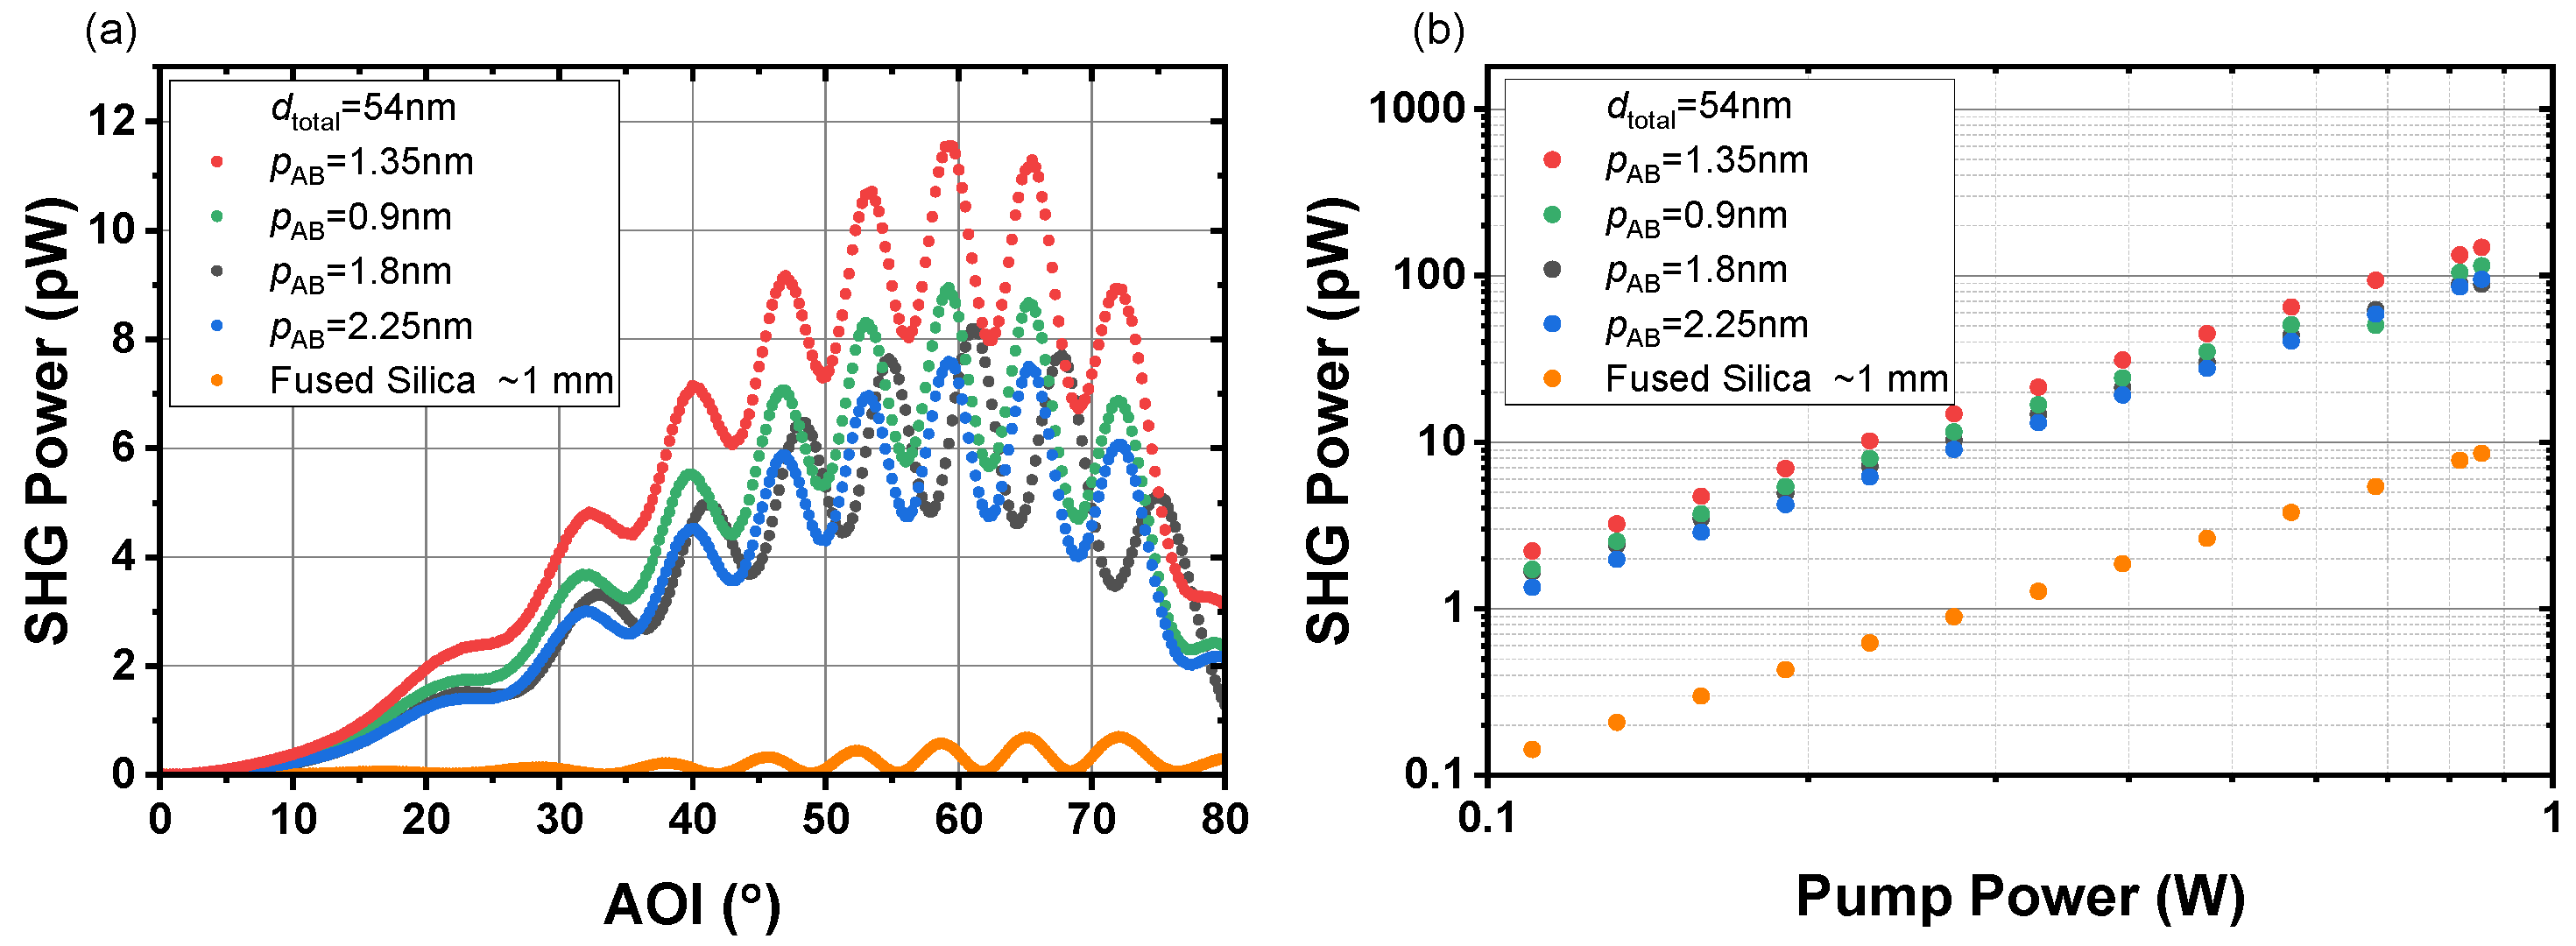
Figure 14.
SH power slopes for the heterostructures with the same total thickness but different period thicknesses.
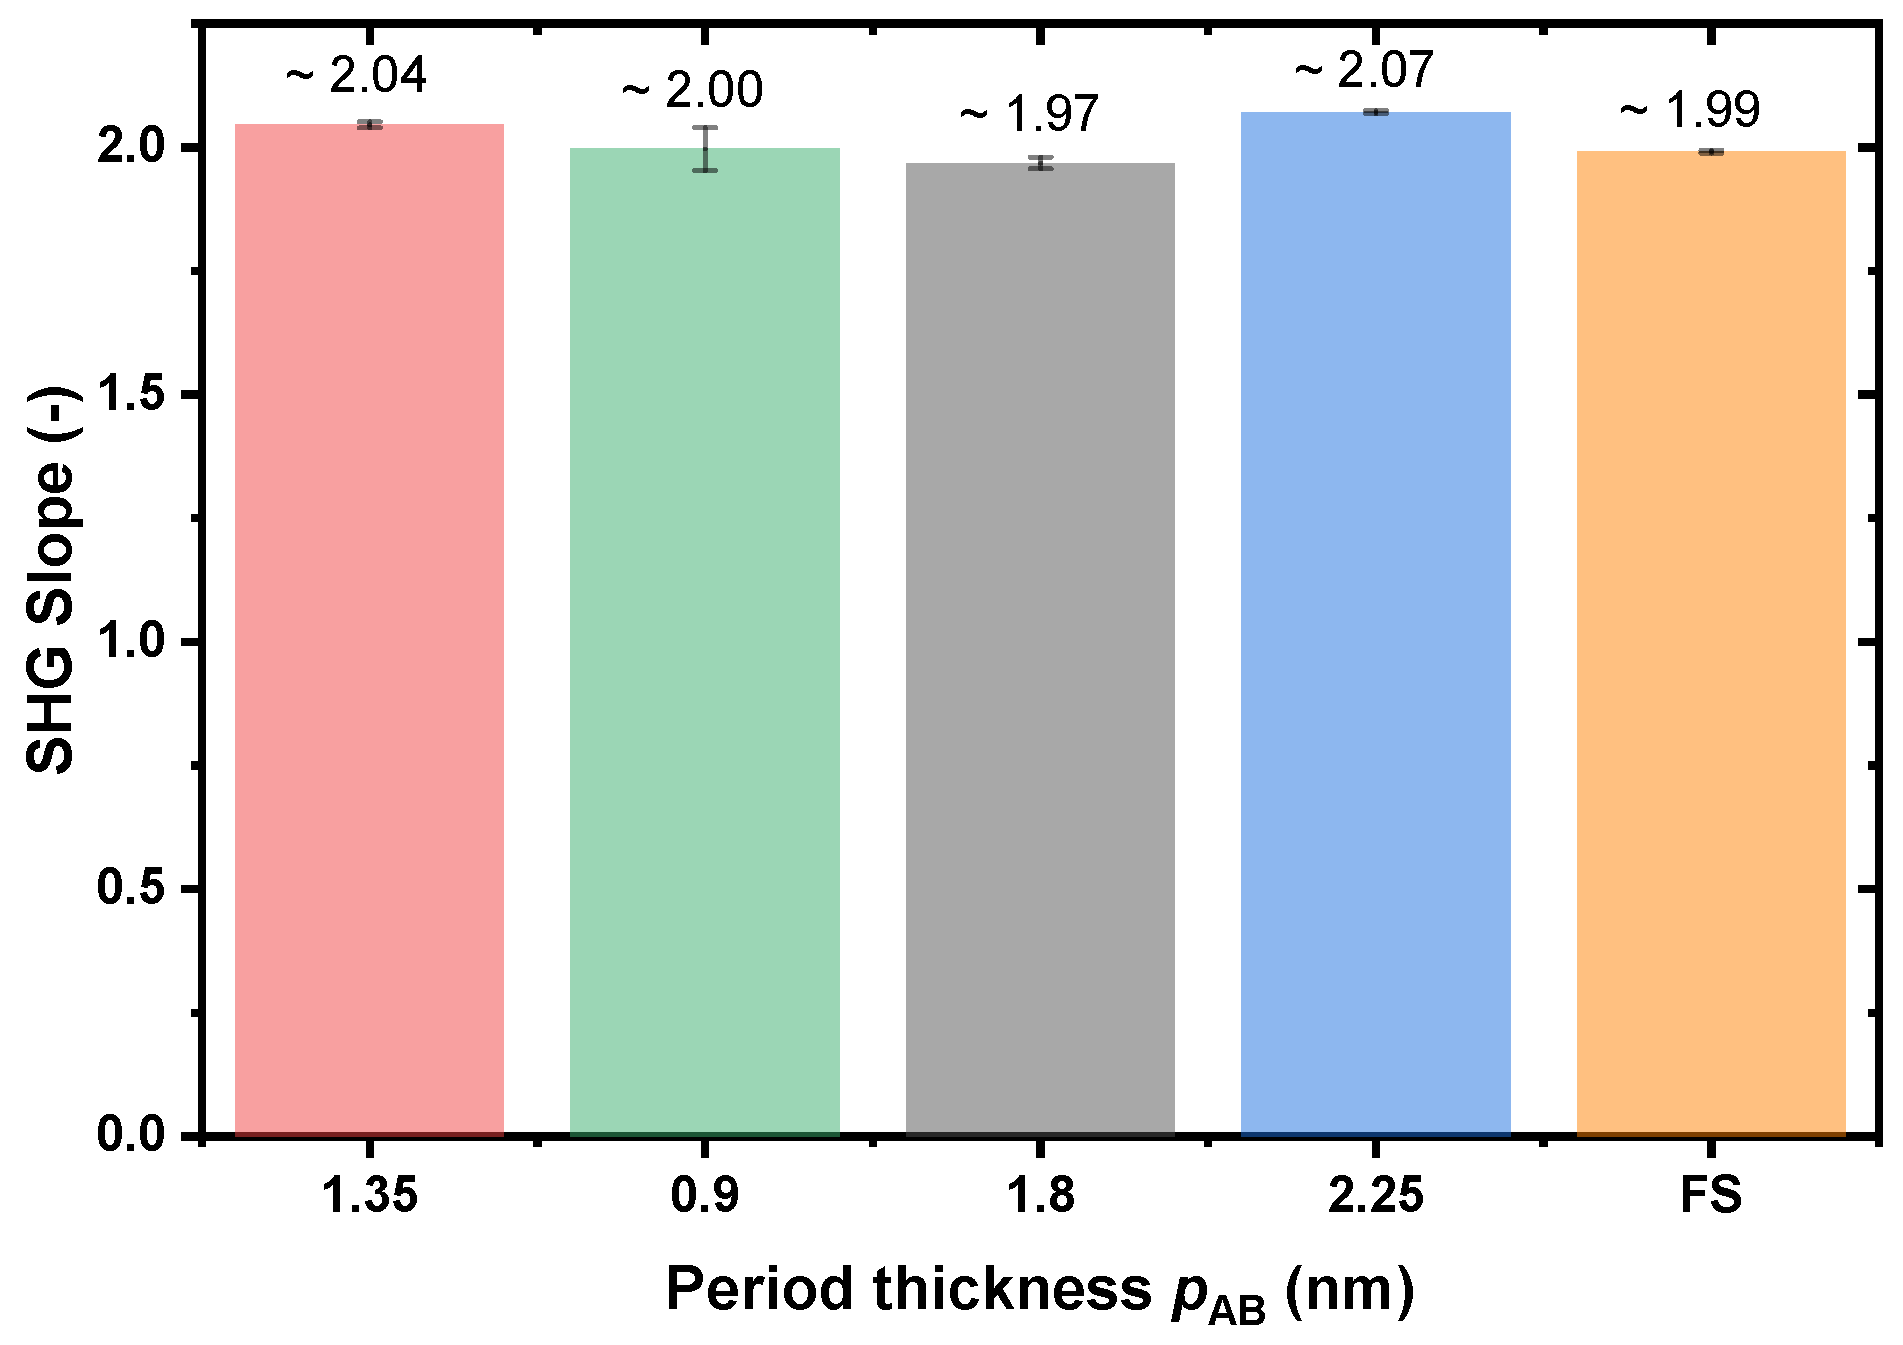
Figure 15.
Measured average SH power vs. number of layers (d ≈ 54 nm). The input power at FW is 110 mW.
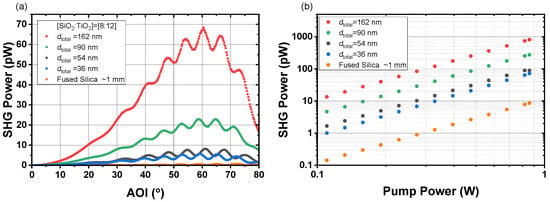
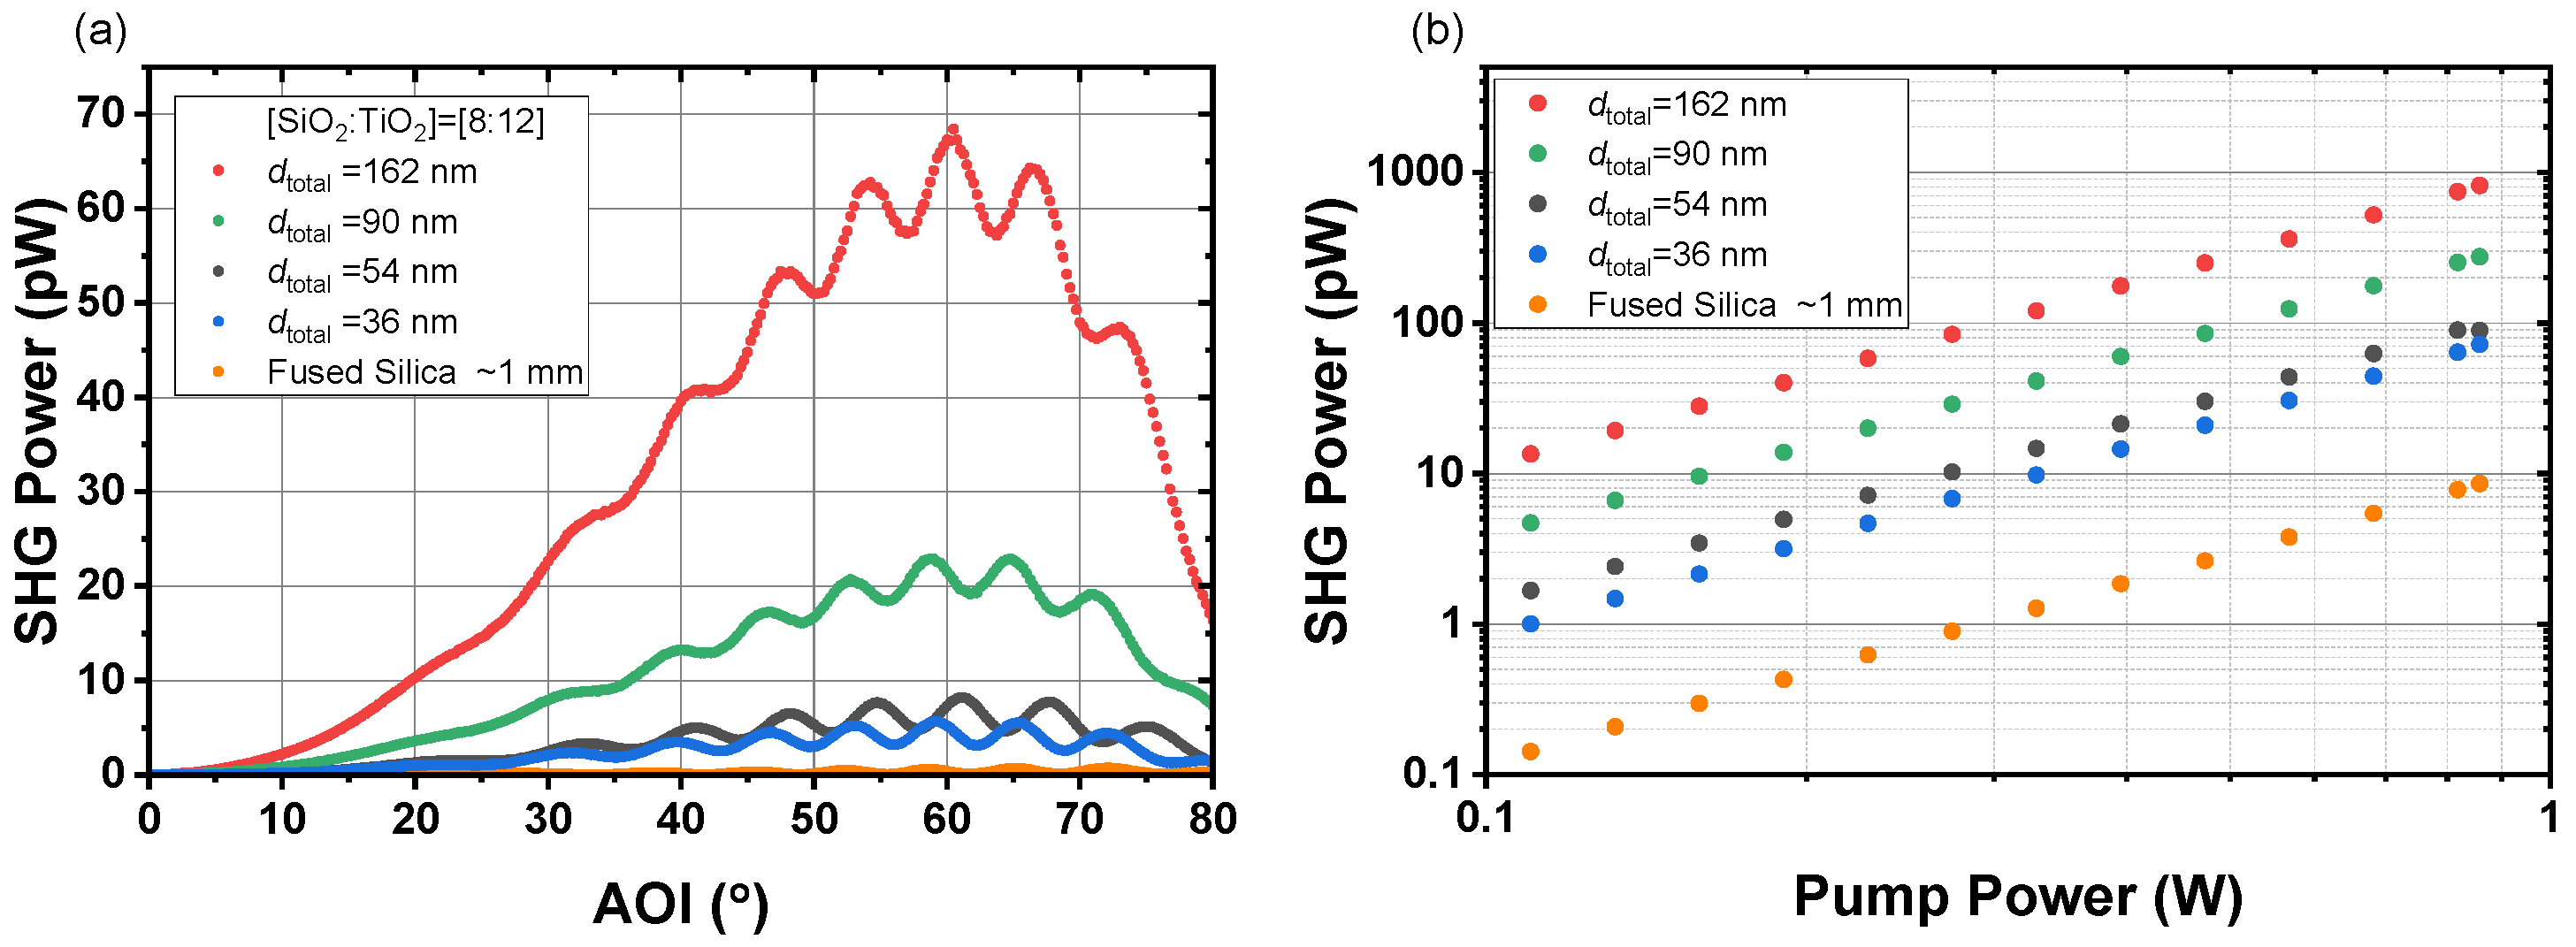
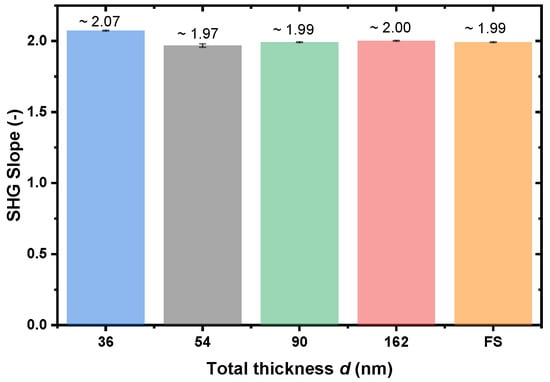
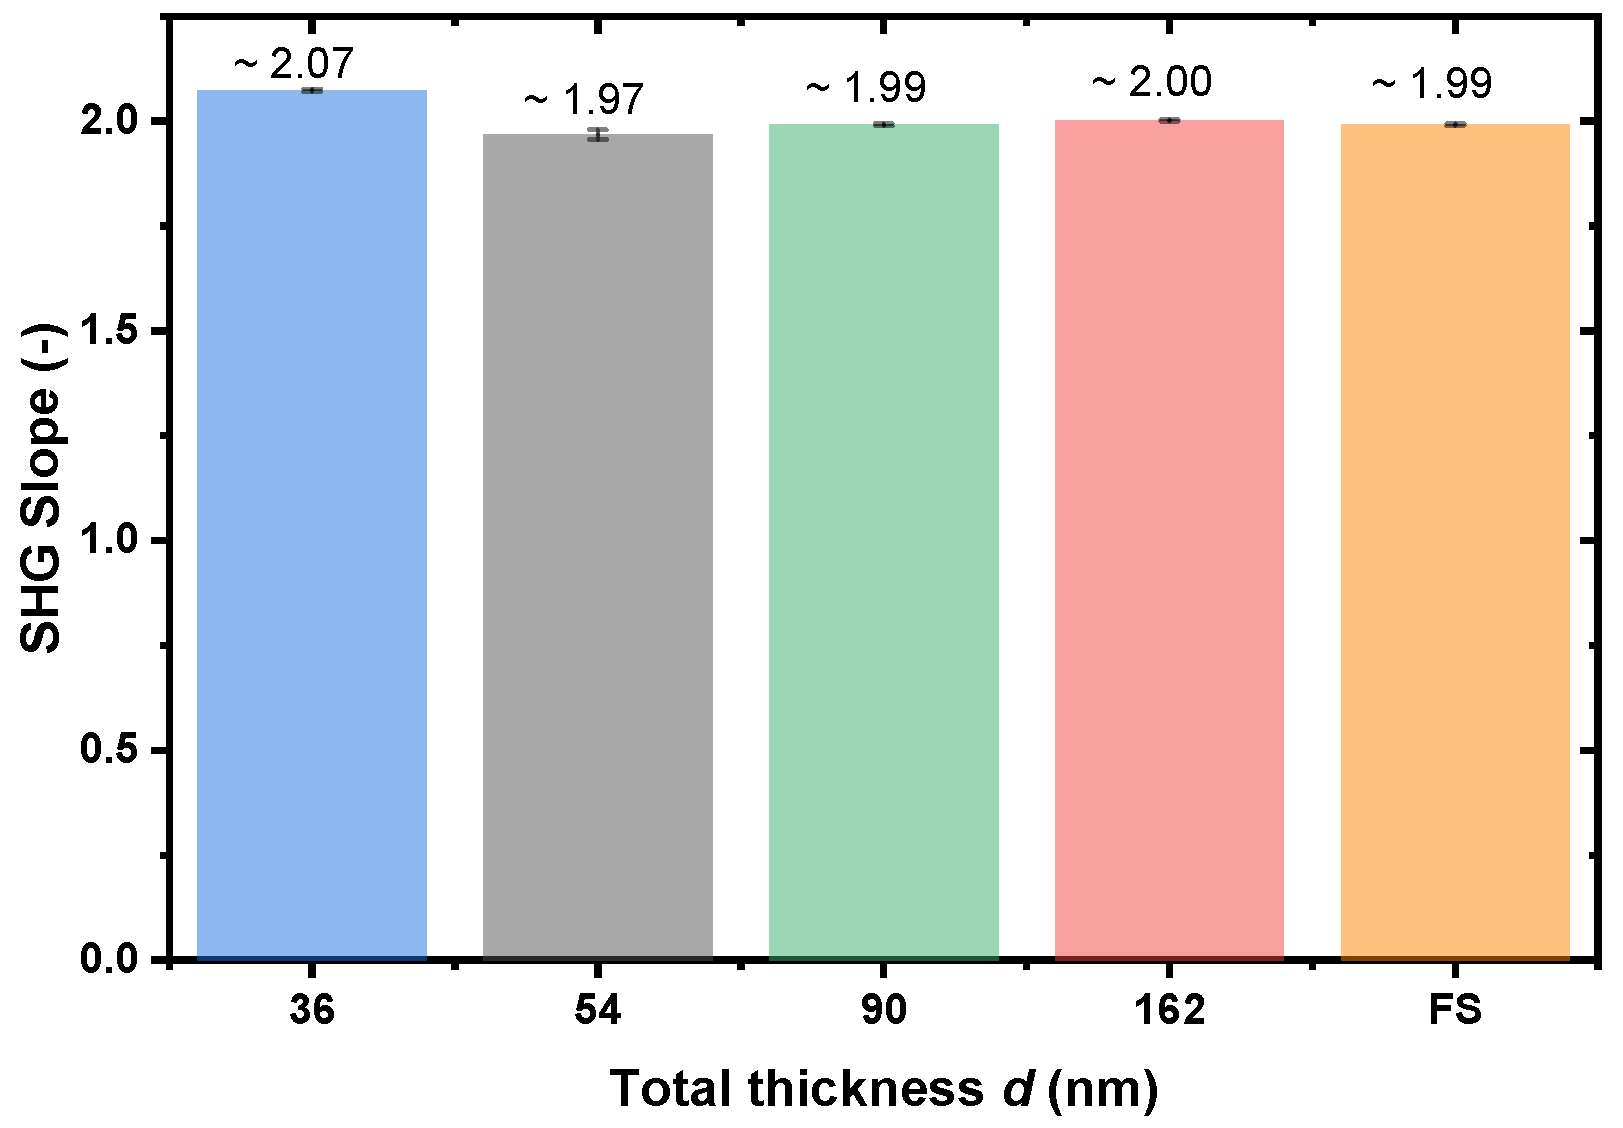
For bulk crystals, when the phase-matching condition is satisfied, the field amplitude is linearly dependent on the propagation distance. To confirm whether the nanolaminates have similar property, the samples with the same period but different number of supercycles were also measured. The angular and power dependencies of the average SH power are displayed in Figure 16. Obviously, the SHG signals from the SiO2/TiO2 nanolaminates are much stronger than those from the pure fused silica substrate. The SH power clearly increases with increasing thickness. Fitting power dependency measurements yields a slope with an exponent of 1.968(12) to 2.074(3), as shown in Figure 17, verifying the generation of the second harmonic. The uncertainties with the slopes are the standard errors from linear fittings.
Figure 16.
(a) Angular dependency measured at 250 mW incident power and (b) power dependency of the SiO2/TiO2 samples with different thicknesses.
Figure 17.
SH power slopes for the heterostructures with the same period [SiO2:TiO2] = 8:12 but with different total thicknesses.
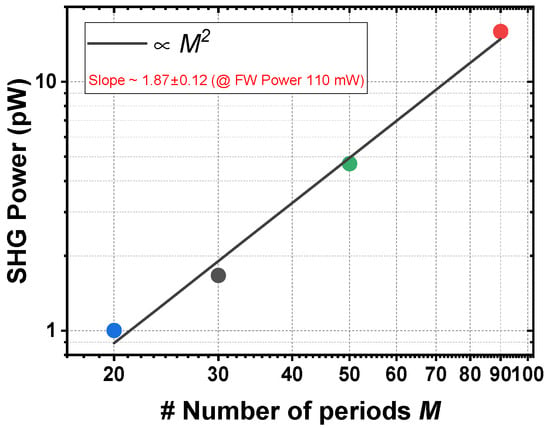
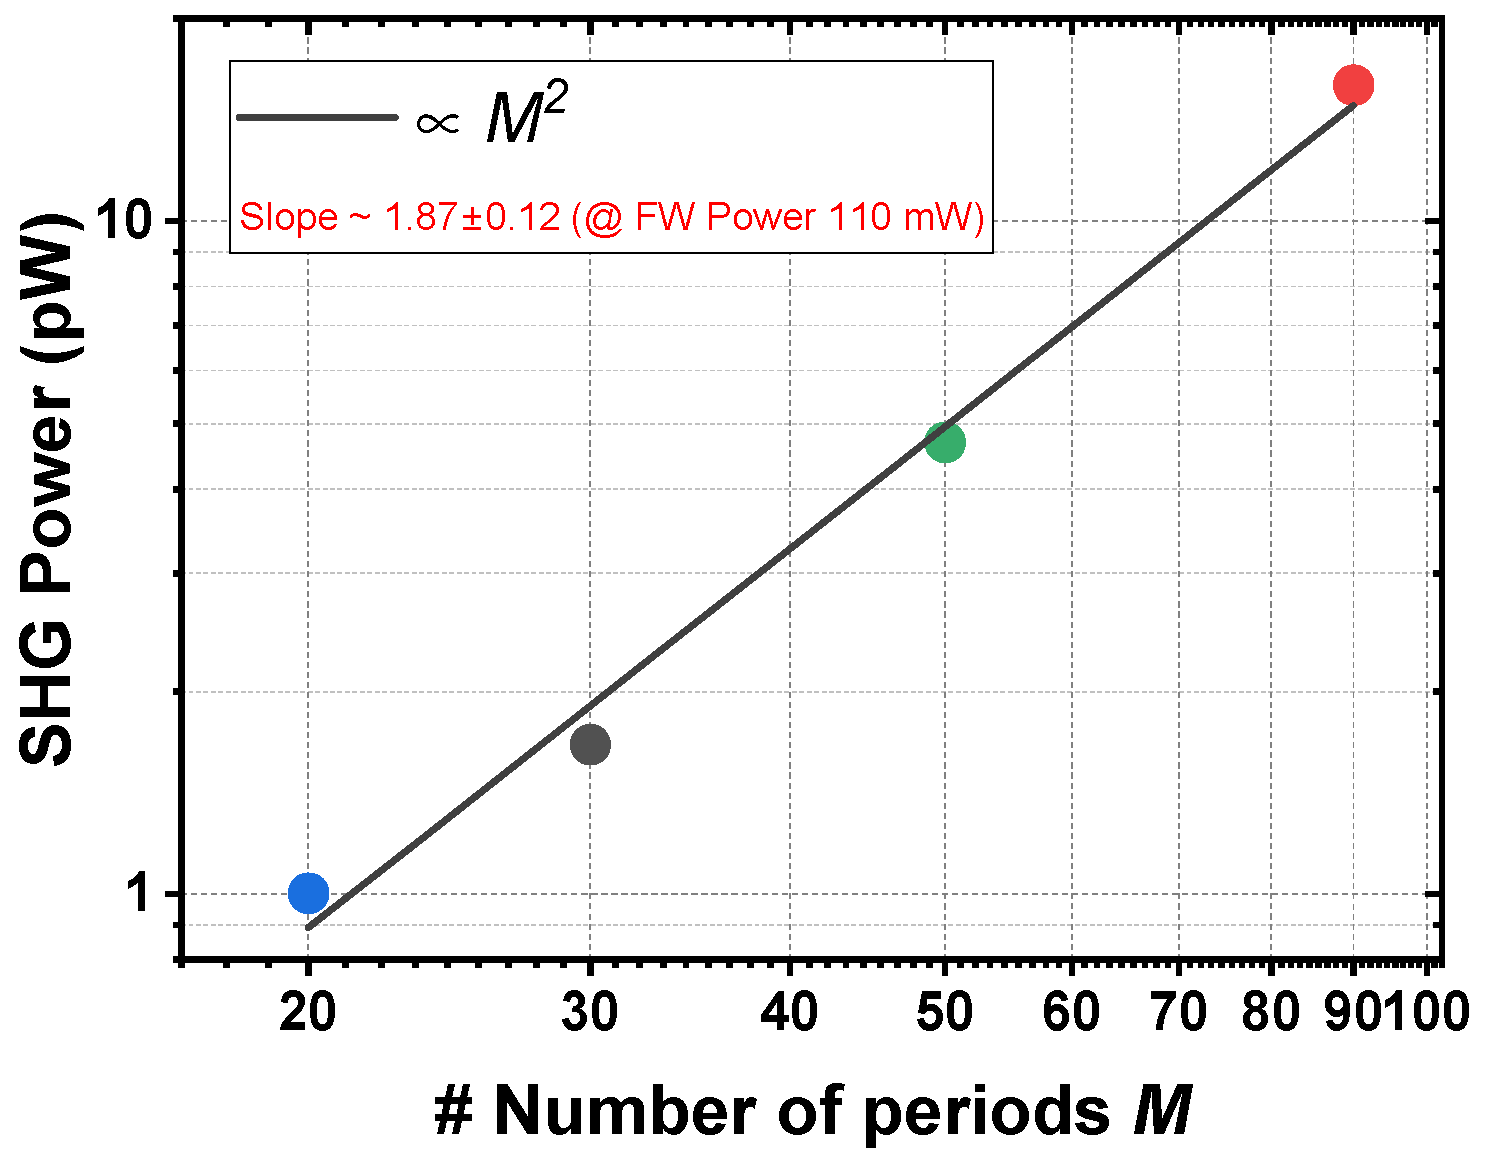
As expected, the SH power is linearly dependent on the squared total thickness, as shown in Figure 18. The total thicknesses of our samples are much smaller than the coherence built-up length and light wavelength, so the different waves can be considered to be in phase.
Figure 18.
Measured average SH power vs. number of periods, M = 20, 30, 50 and 90 (double logarithmic scale), at a FW power of 110 mW.
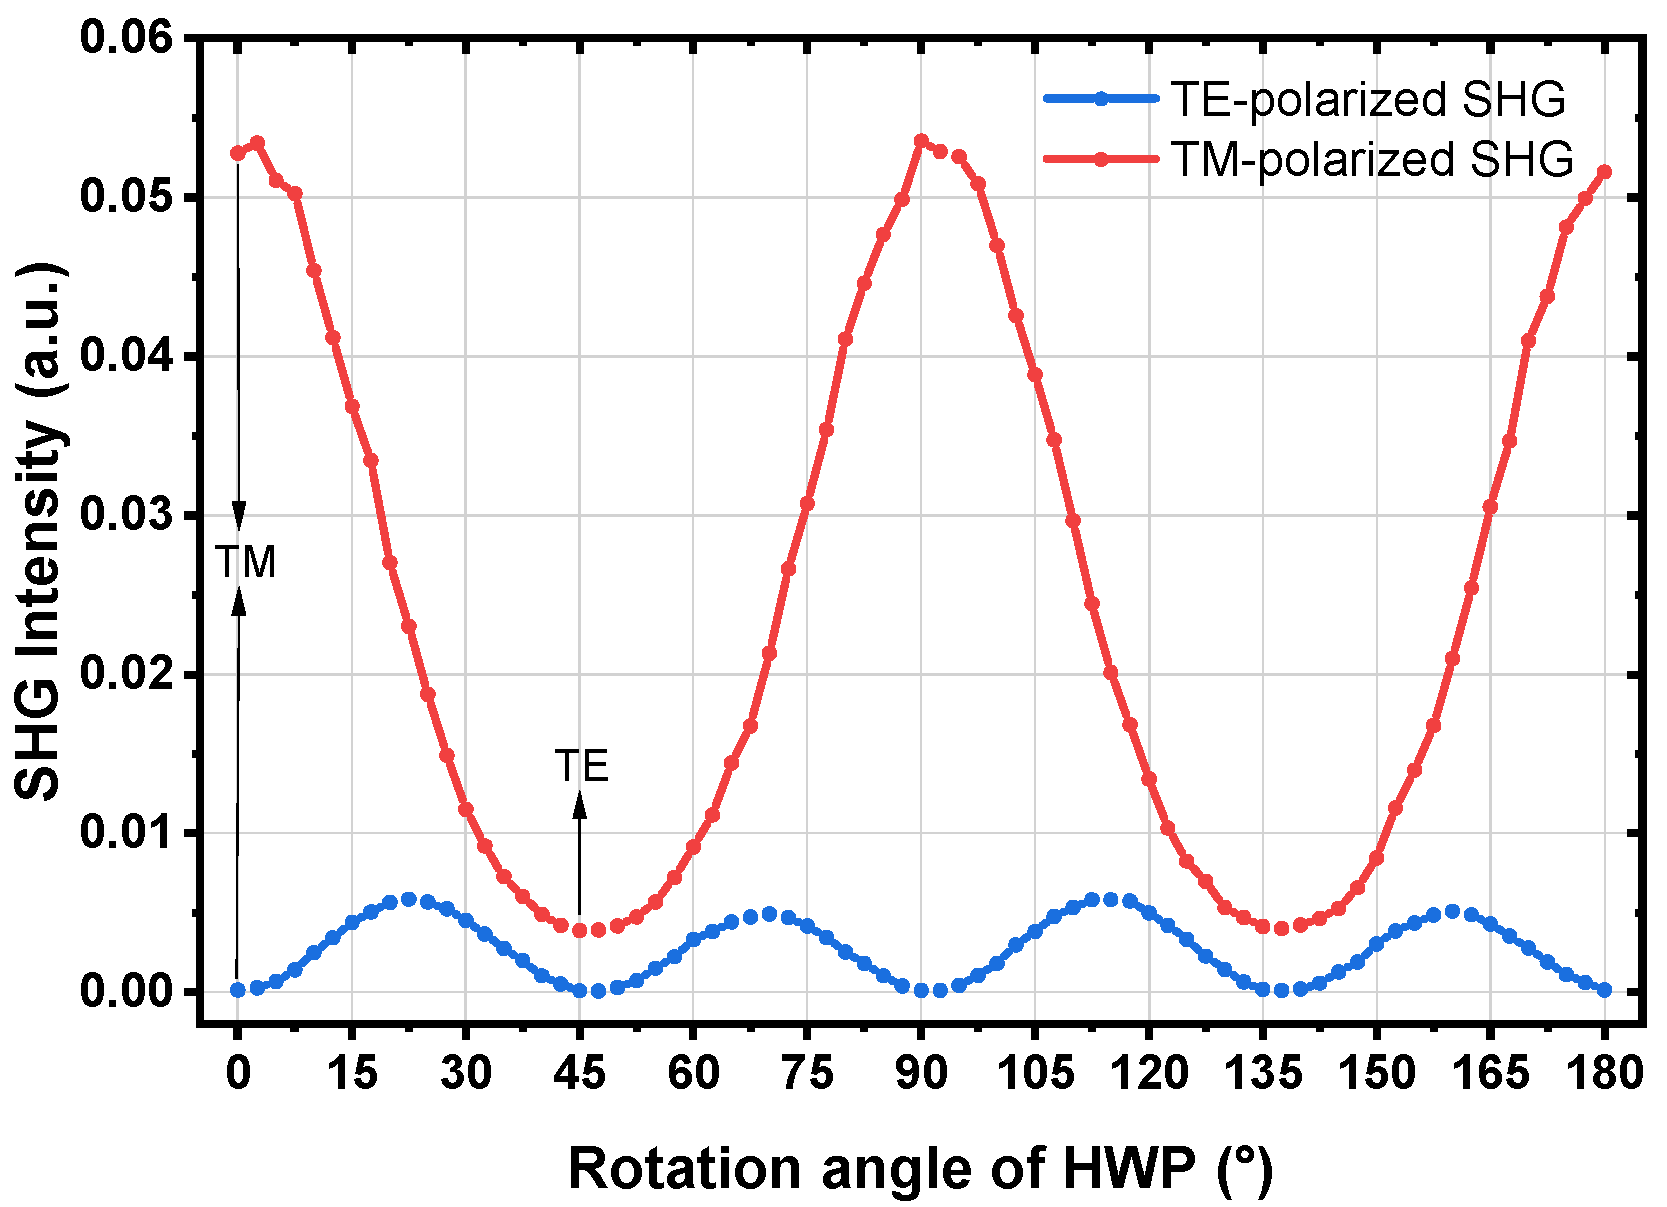
The dependency of the SHG signals on the input polarization state was also tested as shown in Figure 19 for the sample SiO2:TiO2 = [6:9]*40. For the measurements, the angle of incidence yielding the highest SH power was selected. A polarization analyzer (Rochon prism analyzer RPM10, Thorlabs) was added to analyze the polarization state of the total transmitted SHG signal. The configuration is given in Figure S2. Figure 19 exhibits the fact that no TE-polarized SHG signal can be observed for either TM- or TE-polarized input FW beams. This indicates that our two-component heterostructures belong to the symmetry group, , with in-plane isotropy. We should note that the transmitted TM-/TE-polarized electric fields with doubled frequency are expressed by , . If the input FW light beam is TM-polarized, the transmitted SH wave is TM-polarized. However, if the input FW light beam is TE-polarized, the SH wave is still TM-polarized due to the non-zero parameter, , deduced from the theory [16]. Thus, with TE-polarized input FW beams, TM-polarized SHG signals can still be observed, which correspond to the weak but non-zero values in Figure 19 when the rotation angle of HWP is 45° or 135°. The measured TE-polarized SHG signals are much weaker than TM-polarized SHG signals, as the diagonal component is much larger than other non-vanishing components [5].
Figure 19.
TE-polarized and TM-polarized SHG signals as a function of the linear polarization direction of the pump beam, controlled by the rotation angle of the second half-wave plate. At 0° and 45°, the HWP corresponds to the incident TM- and TE-polarization of the FW beam.
3.2.2. Effective Determination
In the determination process, the first step was to measure the angle-dependent SH power generated from the heterostructures. For a sufficient resolution, the angle step was set to 0.25°. The fitting of the measured SH power was implemented by a nonlinear least-squares fitting algorithm in MATLAB R2022b. With the group index of FS (see Figure S3), the fittings for the bare FS substrate with walk-off time and without walk-off time are performed in Figure S4. The determined walk-off time was 97 fs. The peak positions of the fringes are very sensitive to the substrate thickness. Neglecting the walk-off time results in higher fringe visibility, which in turn causes the nonlinearity to be overestimated. Thus, in the fitting processes for the nanolaminates on the FS substrate, the model including walk-off time was used.
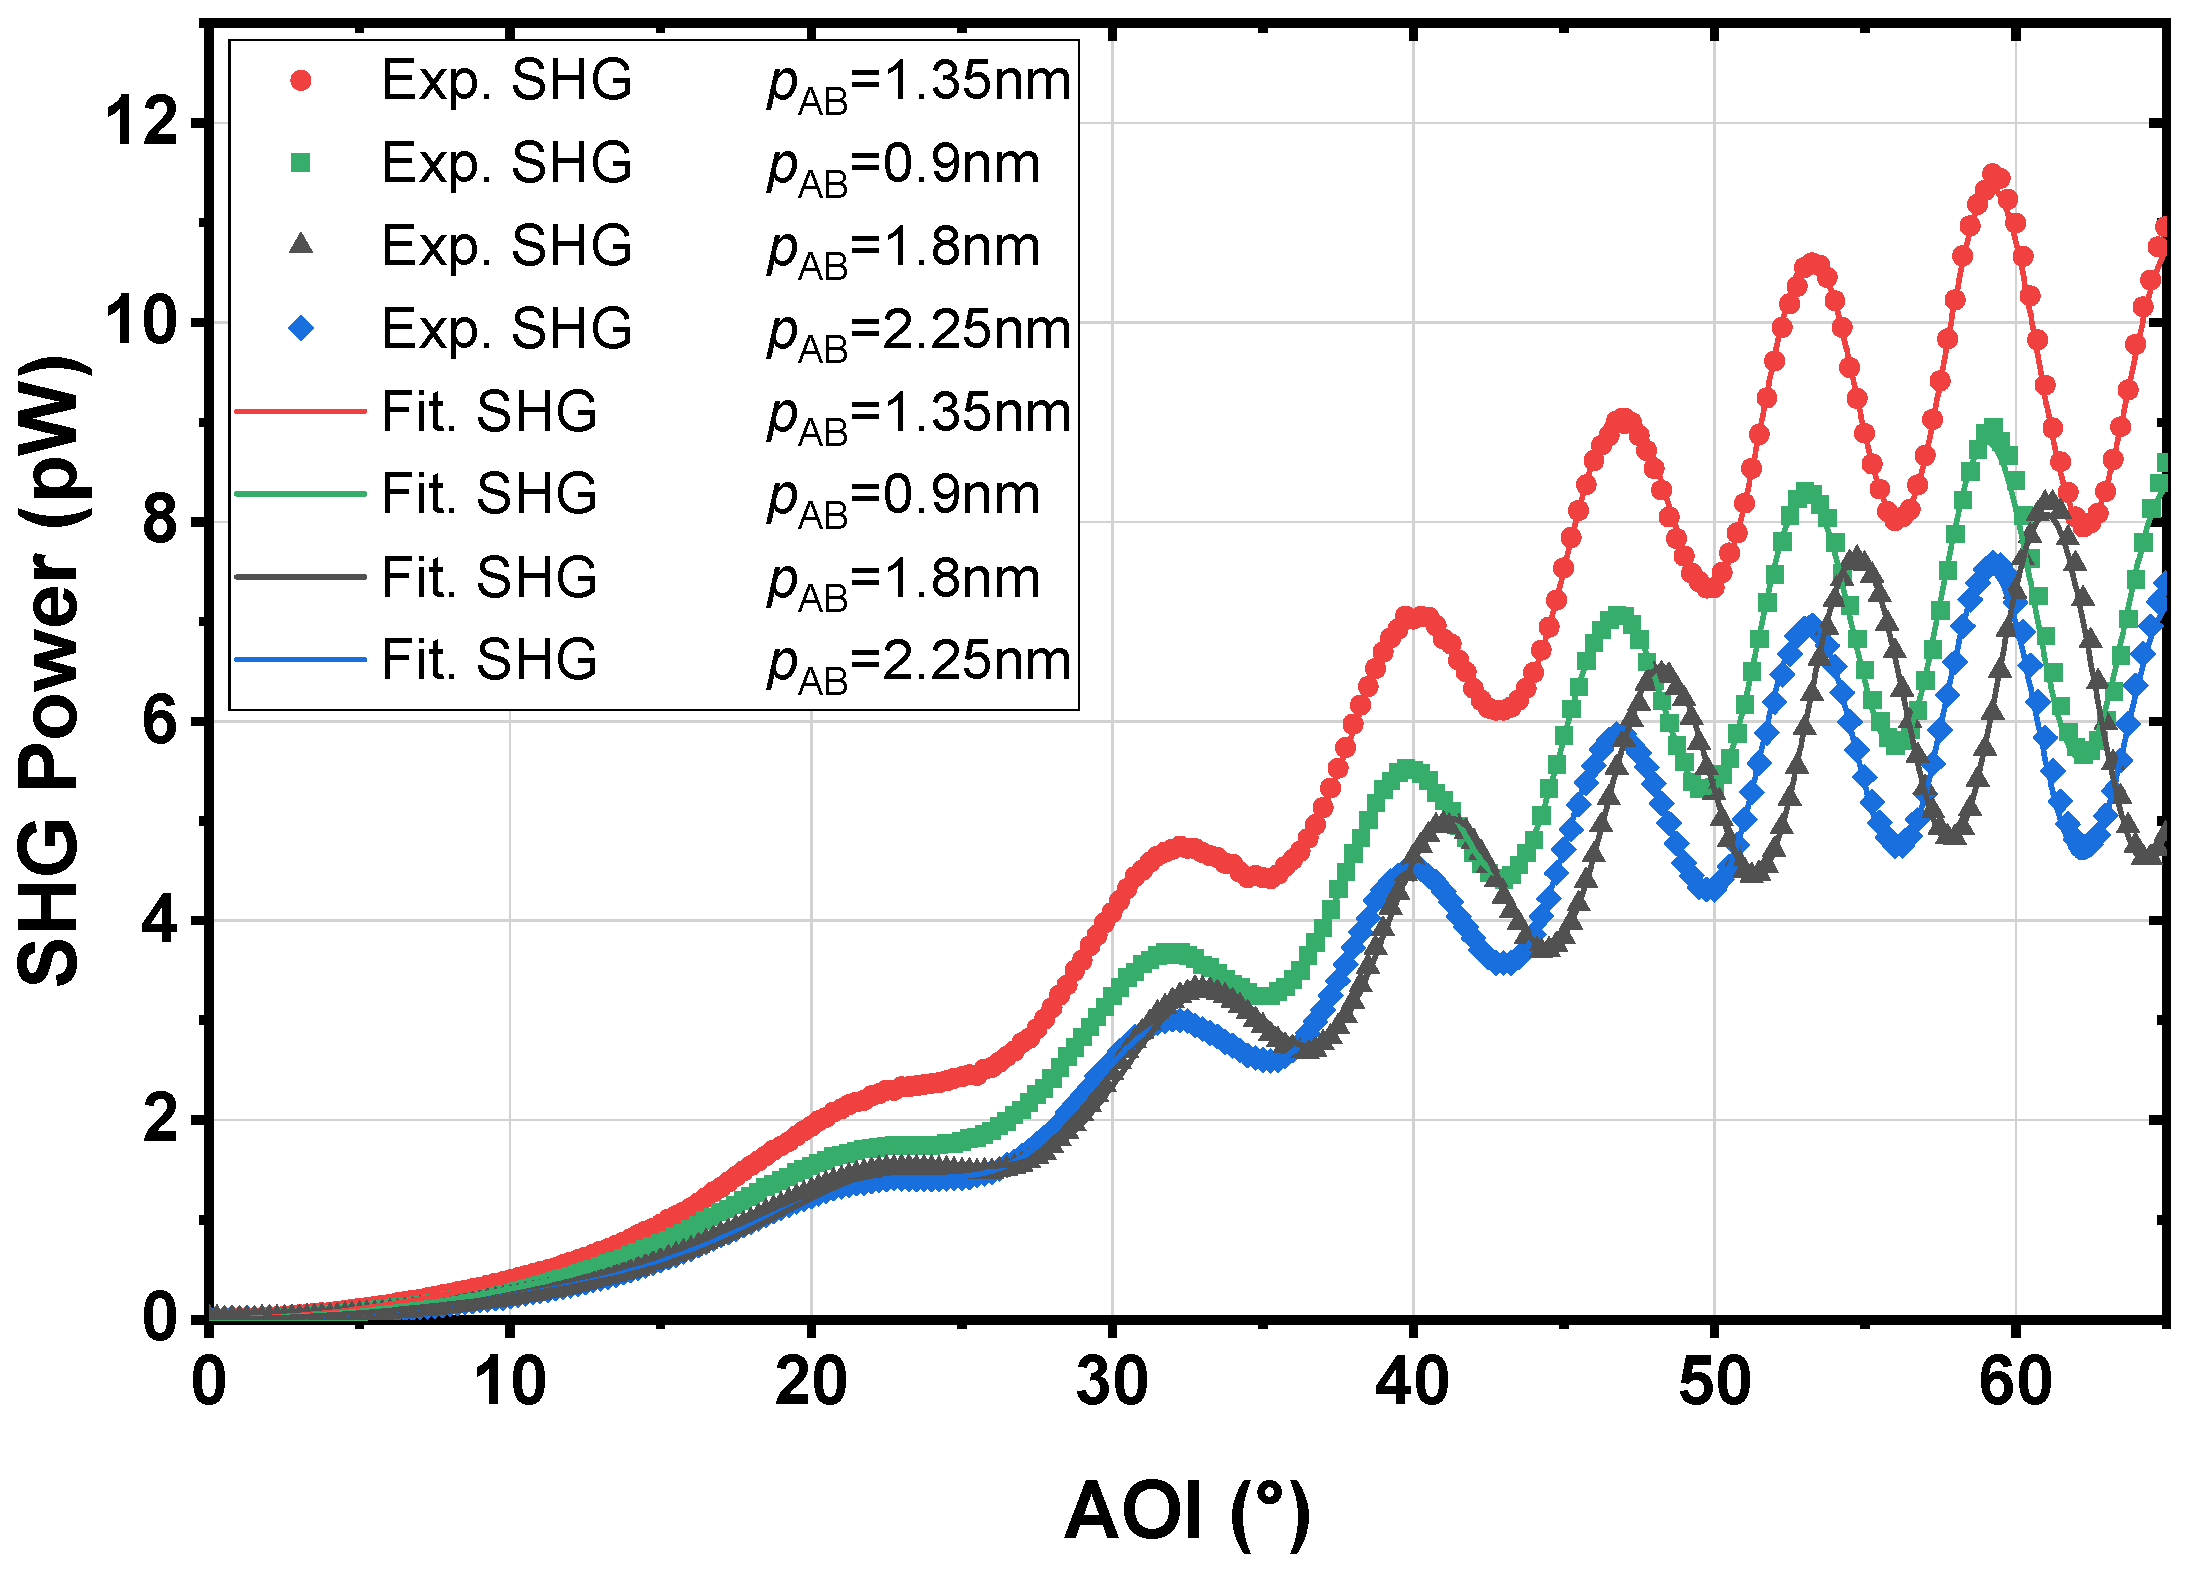
The unknown parameters, e.g., substrate thickness, , , , , and , were fitted. The fitting results for the samples that have the same total thickness are shown in Figure 20. All the theoretical fringes match the measured data very well, thus the effective second-order bulk susceptibilities can be extracted.
Figure 20.
Nonlinear fitting results for the samples with the same total thickness of ~54 nm but with different periods.
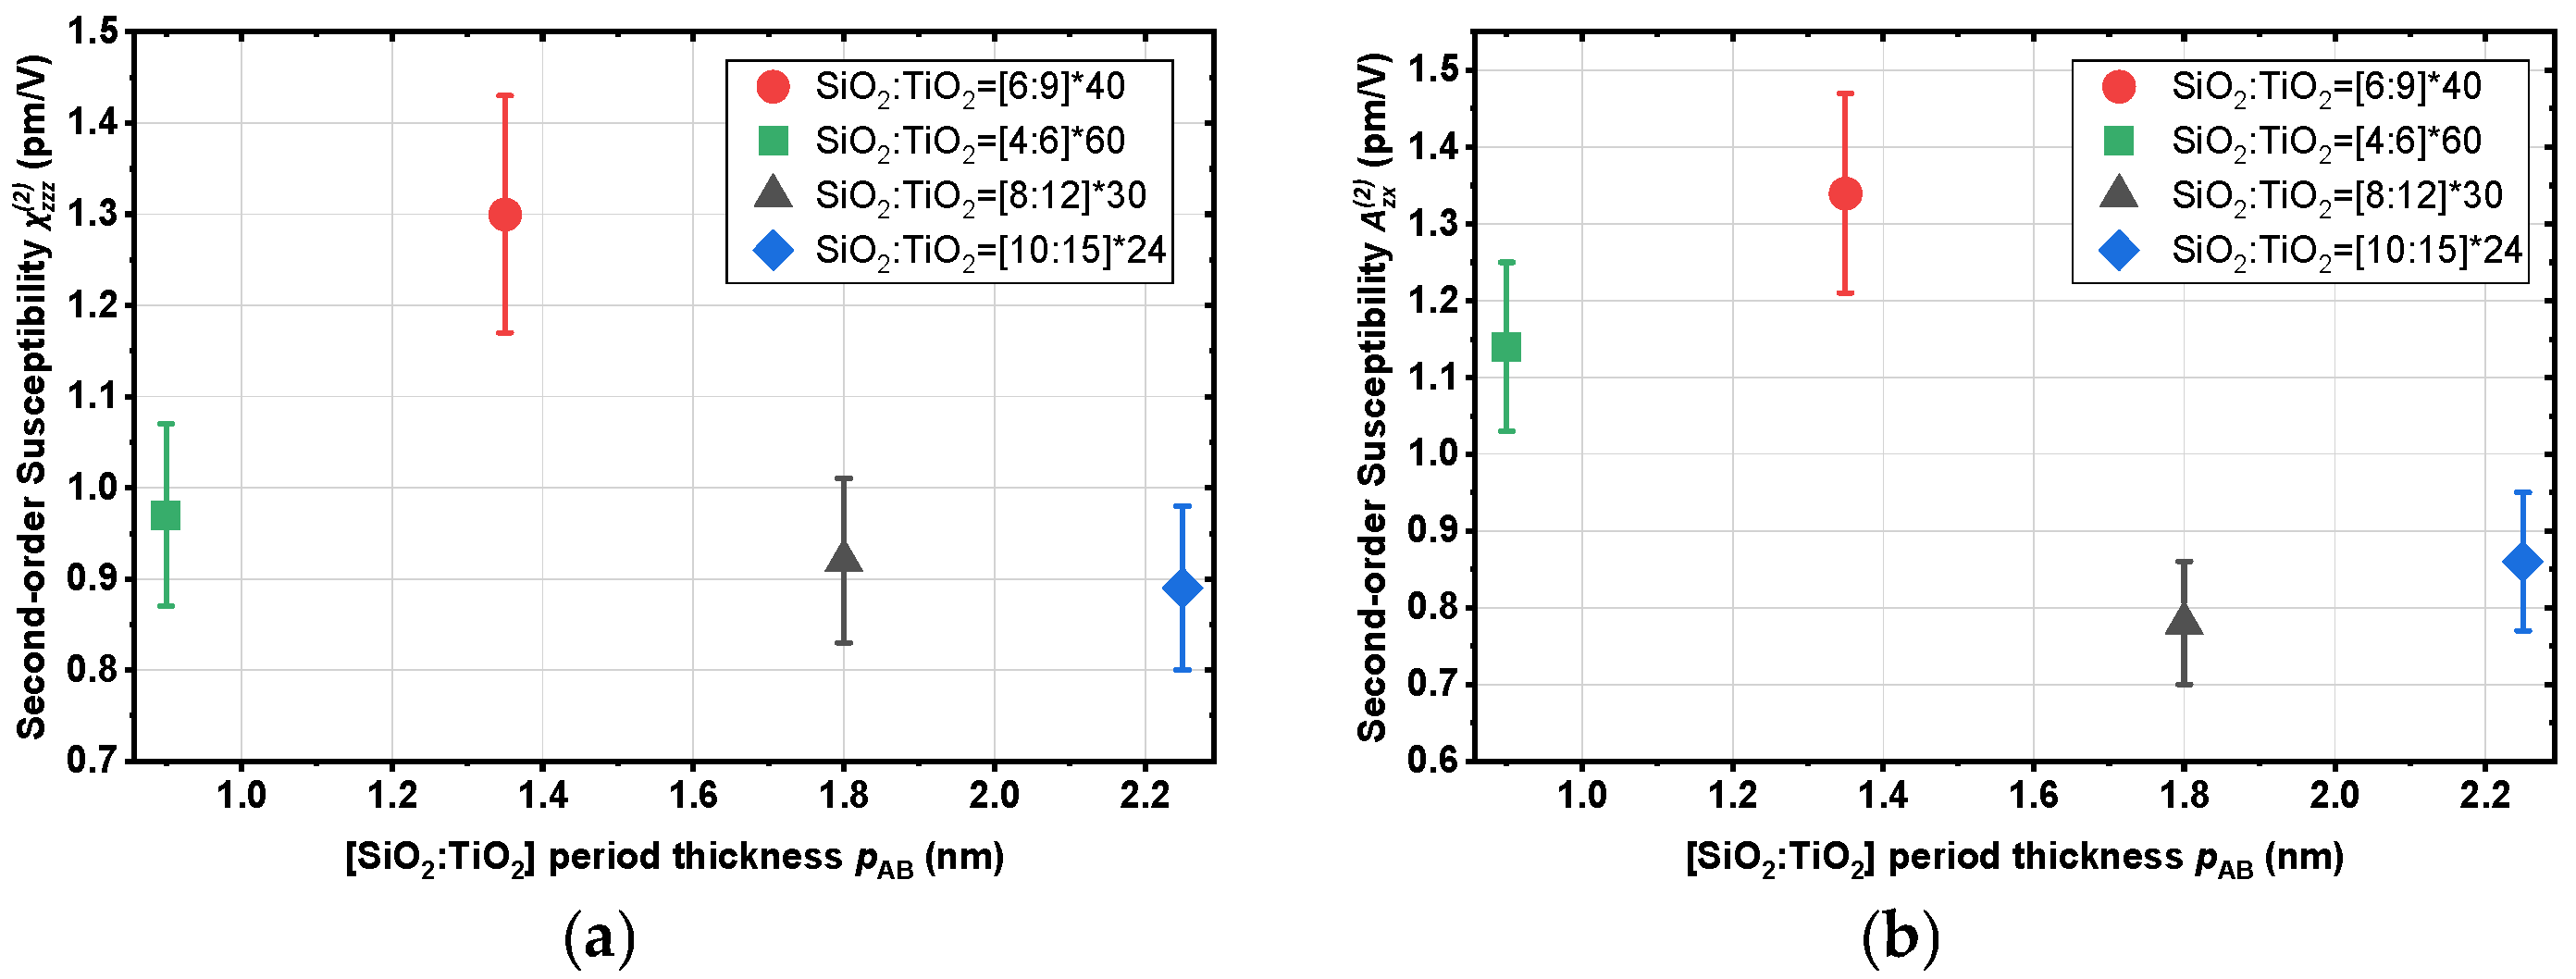
The extracted second-order susceptibility tensor components are given in Figure 21 and Table 4. The best period composition for the SHG of SiO2/TiO2 heterostructures is [6:9], with the main diagonal component = 1.30 ± 0.13 pm/V. This result is consistent with the measured SH power in Figure 13, where the composition [6:9] of the SiO2/TiO2 heterostructure indeed has the highest SHG signal. The main uncertainty originates from the alignment process, where the sample orientation corresponding to the normal incidence needs to be set precisely.
Figure 21.
(a) Diagonal components and (b) inseparable non-diagonal components of the second-order susceptibility tensor.
Table 4.
Fitted second-order susceptibilities.
The SHG repeatability was also tested for samples with the same recipe, but one of them was deposited half a year later. The measured SH power from two samples is given in Figure S5. The values for the two samples were 0.92 pm/V and 0.98 pm/V, respectively.
After the best composition of SiO2/TiO2 heterostructures for SHG was found, we could compare the SiO2/TiO2 heterostructures with other nonlinear materials. Table 5 summarizes the main component of second-order nonlinear susceptibility tensors of different nonlinear materials. “AB amorphous” and “ABC amorphous” stand for heterostructures with two or three different amorphous materials. From previous work [40], the “AB amorphous” type of heterostructures could only exhibit negligible second-order nonlinearity. Our results showed that two-component heterostructures possess non-negligible second-order nonlinearity. The origin of these effects in such “simple” compositions needs to be further investigated.
Table 5.
Comparison of second-order nonlinear coefficients reported for representative materials.
In addition, H. Zhao et al. [14] studied the second harmonic generation in superlattice structures made of two centrosymmetric crystalline materials, LaTiO3/SrTiO3, grown by pulsed laser deposition (PLD). The point group of the overall structure was identified quantitatively, by calculating the SHG signal intensity according to the assumed symmetry group and comparing with the measured SHG signal. The point group was determined to be . The effective second-order nonlinearity was determined by comparing the SHG signals from the superlattice with SHG signals from a Y-cut quartz sample. The very high effective second-order nonlinearity implied that SHG can be improved by heterostructures made of crystalline materials with high quality of the interface. For our ST heterostructures, one possible SHG enhancement method is to use an annealing process to increase the crystallinity. In our first try, the samples were annealed at 600 °C. The SHG and XRR measurements are shown in Figures S6–S8 and Table S1. For the sample SiO2:TiO2 = [8:12]*90, the Bragg peak shifted from 5° to 6°, and its intensity decreased significantly after the annealing process. This indicates severe structural changes by the annealing process. The interface quality might be decreased by intermixing, and only a very weak SHG signal after the annealing process was measured. For the sample SiO2:TiO2 = [6:9]*120, since it has no Bragg peak around 6° and the interface roughness becomes as large as the individual layers, we can conclude that the layered character is lost. Thus, the SHG signal is also very weak after the annealing process. Next steps are to heat up to a lower annealing temperature and try to use other materials to further enhance the interface quality.
4. Conclusions
In this work, we have studied the linear and nonlinear optical properties of SiO2/TiO2 heterostructures. The heterostructures can integrate a large number of very thin layers at the atomic scale. Under the effective medium approximation, the form birefringence in these films leads to a negative uniaxial crystal behavior. The refractive index is independent of the total thickness; however, it is variable by combining two materials with different composition periods. When the individual layer thickness is only a few nm, intermixing may have a large influence on the refractive indices. The total thickness, as well as ordinary and extraordinary refractive indices were determined using a uniaxial anisotropic dispersion model. The total thickness was also determined through XRR. Both characterization methods yielded reliable results.
The nonlinear optical properties of SiO2/TiO2 nanolaminates were analyzed in detail. Unlike the symmetry-breaking mechanism in traditional nonlinear bulk crystals, the SiO2/TiO2 heterostructures break the symmetry only at the interface between two amorphous centrosymmetric media. In general, one should expect that the SiO2/TiO2 nanolaminates are still symmetric under inversion operations along the surface normal. Thus, a negligible SHG signal from this type of nanolaminates should be observed. Nevertheless, the global inversion symmetry is valid only when the SiO2/TiO2 and TiO2/SiO2 interfaces have the same functional and optical properties. In the real samples, they are different interfaces, and the SH waves of adjacent interfaces do not cancel. The nanolaminates consisting of very thin layers can integrate a large number of interfaces, resulting in an effective bulk nonlinearity for the overall structure. By measuring the average SH power from the samples with the same total thickness but different periods, we could verify that the SHG signal is dependent on the number of interfaces. However, when the individual layers are thinner than 0.5 nm, the SHG signal is reduced because the interface quality might be decreased by intermixing. In this work, no direct chemical or cross-sectional structural characterization was performed. Therefore, the possibility of other interface quality-decreasing mechanisms cannot be excluded. By measuring the average SH power from the samples with the same period but different supercycles, we could verify that the SHG signal is linearly dependent on the squared total thickness. The SHG measurements should be implemented under TM-polarized light since the main component of the second-order susceptibility tensors is the diagonal component, . While the value is lower than for typical crystals used for SHG, we obtained values comparable to more complex ABC-type structures.
Overall, this work shows that the linear and nonlinear optical properties of the engineered heterostructures made by PEALD can be precisely controlled. Based on a low temperature (100 °C) and conformal deposition, these artificial nonlinear materials can be integrated into CMOS-compatible processes to design metamaterials and photonic integrated circuits (PICs). A more comprehensive understanding of the effects of interface strain and impurity incorporation on the linear and nonlinear optical response of these nanolaminate structures will be pursued in future studies.
Supplementary Materials
The supporting information can be downloaded at: https://www.mdpi.com/article/10.3390/coatings16040424/s1 ([47,48]).
Author Contributions
Conceptualization, A.S.; methodology, J.L., M.M., R.R., S.B., S.N., and A.S.; software, J.L., M.M., and S.B.; validation, J.L., M.M., and R.R.; formal analysis, J.L., M.M., R.R., S.B., and D.S.; investigation, J.L., M.M., and R.R.; resources, S.S.; data curation, J.L., M.M., and R.R.; writing—original draft preparation, J.L.; writing—review and editing, J.L., M.M., S.B., R.R., S.N., S.S., I.S., and A.S.; visualization, J.L.; supervision, A.T., I.S., and A.S.; project administration, S.S., A.T., I.S., and A.S.; funding acquisition, A.T., I.S., and A.S. All authors have read and agreed to the published version of the manuscript.
Funding
This work was supported by the Deutsche Forschungsgemeinschaft (DFG, German Research Foundation) through the International Research Training Group (IRTG) 2675 “Meta-ACTIVE” (project number 437527638) and the Collaborative Research Center (CRC) 1375, (project number 398816777) “NOA”. Funding by the Federal Ministry of Research, Technology and Space, Project ID 13N16897 (GRADIENT) and 13F1000A (PriFusio) are highly acknowledged. Additional support was provided by the Fraunhofer Internal Programs under Grant No. SME 431 40-04871.
Institutional Review Board Statement
Not applicable.
Informed Consent Statement
Not applicable.
Data Availability Statement
The original contributions presented in this study are included in the article/Supplementary Material. Further inquiries can be directed to the corresponding author.
Acknowledgments
The authors gratefully acknowledge Kristin Gerold for her technical support.
Conflicts of Interest
The authors declare no conflicts of interest.
Abbreviations
The following abbreviations are used in this manuscript:
| PEALD | plasma-enhanced atomic layer deposition |
| ALD | atomic layer deposition |
| CVD | chemical vapor deposition |
| SHG | second harmonic generation |
| FS | fused silica |
| SiO2 | silicon dioxide |
| TiO2 | titanium dioxide |
| O2 | Oxygen |
| N2 | nitrogen |
| SH | second harmonic |
| XRR | X-ray reflectivity |
| AOI | angle of incidence |
| T | transmittance |
| R | reflectance |
| OL | optical losses |
| FW | fundamental wavelength |
| ST | SiO2/TiO2 |
| HWP | Half-Wave Plate |
| LP | long pass |
| SP | short pass |
| BP | bandpass |
| GPC | growth per cycle |
| PLD | pulsed laser deposition |
| PICs | photonic integrated circuits |
References
- Franken, P.A.; Hill, A.E.; Peters, C.W.; Weinreich, G. Generation of Optical Harmonics. Phys. Rev. Lett. 1961, 7, 118. [Google Scholar] [CrossRef] [Scilit]
- Stenzel, O. Light–Matter Interaction; Springer Nature: Cham, Switzerland, 2022. [Google Scholar]
- Boyd, R.W. Nonlinear Optics, 4th ed.; Academic Press: Amsterdam, The Netherlands, 2020. [Google Scholar]
- Armstrong, J.A.; Bloembergen, N.; Ducuing, J.; Pershan, P.S. Interactions between Light Waves in a Nonlinear Dielectric. Phys. Rev. 1962, 127, 1918. [Google Scholar] [CrossRef] [Scilit]
- Koskinen, K. Novel Aspects of Second-Harmonic Generation from Thin Films and Surfaces. Ph.D. Dissertation, Tampere University of Technology, Tampere, Finland, 2018. [Google Scholar]
- Guyot-Sionnest, P.; Chen, W.; Shen, Y. General Considerations on Optical Second-Harmonic Generation from Surfaces and Interfaces. Phys. Rev. B 1986, 33, 8254. [Google Scholar] [CrossRef] [Scilit] [PubMed]
- Wang, F. Multipolar Nonlinear Optics of Surfaces and Bulk Materials. Ph.D. Dissertation, Tampere University of Technology, Tampere, Finland, 2010. [Google Scholar]
- Cattaneo, S.; Kauranen, M. Bulk versus Surface Contributions in Nonlinear Optics of Isotropic Centrosymmetric Media. Phys. Status Solidi B 2005, 242, 3007–3011. [Google Scholar] [CrossRef] [Scilit]
- Ponath, H.-E.; Stegeman, G.I. Nonlinear Surface Electromagnetic Phenomena; Elsevier: Amsterdam, The Netherlands, 2012. [Google Scholar]
- Lin, R.; Yao, J.; Wang, Z.; Chan, C.T.; Tsai, D.P. Nonlinear Meta-Devices: From Plasmonic to Dielectric. Engineering 2024, 45, 15–24. [Google Scholar] [CrossRef] [Scilit]
- Lapine, M.; Shadrivov, I.V.; Kivshar, Y.S. Colloquium: Nonlinear Metamaterials. Rev. Mod. Phys. 2014, 86, 1093–1123. [Google Scholar] [CrossRef] [Scilit]
- Alloatti, L.; Kieninger, C.; Froelich, A.; Lauermann, M.; Frenzel, T.; Köhnle, K.; Freude, W.; Leuthold, J.; Wegener, M.; Koos, C. Second-Order Nonlinear Optical Metamaterials: ABC-Type Nanolaminates. Appl. Phys. Lett. 2015, 107, 121903. [Google Scholar] [CrossRef] [Scilit]
- Clemmen, S.; Hermans, A.; Solano, E.; Dendooven, J.; Koskinen, K.; Kauranen, M.; Brainis, E.; Detavernier, C.; Baets, R. Atomic Layer Deposited Second-Order Nonlinear Optical Metamaterial for Back-End Integration with CMOS-Compatible Nanophotonic Circuitry. Opt. Lett. 2015, 40, 5371–5374. [Google Scholar] [CrossRef] [Scilit]
- Zhao, H.; An, Q.; Ye, X.; Yu, B.; Zhang, Q.; Sun, F.; Zhang, Q.; Yang, F.; Guo, J.; Zhao, J. Second Harmonic Generation in AB-Type LaTiO3/SrTiO3 Superlattices. Nano Energy 2021, 82, 105752. [Google Scholar] [CrossRef] [Scilit]
- Abtahi, F.; Paul, P.; Beer, S.; Kuppadakkath, A.; Pakhomov, A.; Szeghalmi, A.; Nolte, S.; Setzpfandt, F.; Eilenberger, F. Enhanced Surface Second Harmonic Generation in Nanolaminates. Opt. Express 2023, 31, 11354–11362. [Google Scholar] [CrossRef] [Scilit]
- Hermans, A. Low-Temperature Processed Thin Films of Second-Order Nonlinear Optical Materials for Silicon Nitride Photonic Integrated Circuits. Ph.D. Dissertation, Ghent University, Ghent, Belgium, 2019. [Google Scholar]
- Born, M.; Wolf, E. Principles of Optics: Electromagnetic Theory of Propagation, Interference and Diffraction of Light; Elsevier: Amsterdam, The Netherlands, 2013. [Google Scholar]
- Yeh, P.; Hendry, M. Optical Waves in Layered Media; American Institute of Physics: New York, NY, USA, 1990. [Google Scholar]
- Lopez, A.G.; Craighead, H.G. Subwavelength Surface-Relief Gratings Fabricated by Microcontact Printing of Self-Assembled Monolayers. Appl. Opt. 2001, 40, 2068–2075. [Google Scholar] [CrossRef] [Scilit]
- Emoto, A.; Nishi, M.; Okada, M.; Manabe, S.; Matsui, S.; Kawatsuki, N.; Ono, H. Form Birefringence in Intrinsic Birefringent Media Possessing a Subwavelength Structure. Appl. Opt. 2010, 49, 4355–4361. [Google Scholar] [CrossRef] [Scilit]
- Oviroh, P.O.; Akbarzadeh, R.; Pan, D.; Coetzee, R.A.M.; Jen, T.-C. New Development of Atomic Layer Deposition: Processes, Methods and Applications. Sci. Technol. Adv. Mater. 2019, 20, 465–496. [Google Scholar] [CrossRef] [Scilit] [PubMed]
- Paul, P.; Hafiz, M.G.; Schmitt, P.; Patzig, C.; Otto, F.; Fritz, T.; Tünnermann, A.; Szeghalmi, A. Optical Bandgap Control in Al2O3/TiO2 Heterostructures by Plasma Enhanced Atomic Layer Deposition: Toward Quantizing Structures and Tailored Binary Oxides. Spectrochim. Acta A. Mol. Biomol. Spectrosc. 2021, 252, 119508. [Google Scholar] [CrossRef] [Scilit] [PubMed]
- Becker, J.S.; Suh, S.; Wang, S.; Gordon, R.G. Highly Conformal Thin Films of Tungsten Nitride Prepared by Atomic Layer Deposition from a Novel Precursor. Chem. Mater. 2003, 15, 2969–2976. [Google Scholar] [CrossRef] [Scilit]
- Müller, R.; Ghazaryan, L.; Schenk, P.; Wolleb, S.; Beladiya, V.; Otto, F.; Kaiser, N.; Tünnermann, A.; Fritz, T.; Szeghalmi, A. Growth of Atomic Layer Deposited Ruthenium and Its Optical Properties at Short Wavelengths Using Ru(EtCp)2 and Oxygen. Coatings 2018, 8, 413. [Google Scholar] [CrossRef] [Scilit]
- Nilsen, O.; Miikkulainen, V.; Gandrud, K.B.; Østreng, E.; Ruud, A.; Fjellvåg, H. Atomic Layer Deposition of Functional Films for Li-Ion Microbatteries. Phys. Status Solidi A 2014, 211, 357–367. [Google Scholar] [CrossRef] [Scilit]
- Yin, C.; Zhu, M.; Zeng, T.; Song, C.; Chai, Y.; Shao, Y.; Zhang, R.; Zhao, J.; Li, D.; Shao, J. HfO2/SiO2 Anti-Reflection Films for UV Lasers via Plasma-Enhanced Atomic Layer Deposition. J. Alloys Compd. 2021, 859, 157875. [Google Scholar] [CrossRef] [Scilit]
- Huang, Z.; Messina, D.C.; Eller, B.S.; Koeck, F.A.; Scowen, P.A.; Nemanich, R.J. Multilayer Ultraviolet Reflective Coating Based on Atomic Layer Deposited Aluminum Oxide and Fluoride. J. Vac. Sci. Technol. A 2021, 39, 042402. [Google Scholar] [CrossRef] [Scilit]
- Devlin, R.C.; Khorasaninejad, M.; Chen, W.T.; Oh, J.; Capasso, F. Broadband High-Efficiency Dielectric Metasurfaces for the Visible Spectrum. Proc. Natl. Acad. Sci. USA 2016, 113, 10473–10478. [Google Scholar] [CrossRef] [Scilit]
- Miikkulainen, V.; Leskelä, M.; Ritala, M.; Puurunen, R.L. Crystallinity of Inorganic Films Grown by Atomic Layer Deposition: Overview and General Trends. J. Appl. Phys. 2013, 113, 021301. [Google Scholar] [CrossRef] [Scilit]
- Lapteva, M.; Beladiya, V.; Riese, S.; Hanke, P.; Otto, F.; Fritz, T.; Schmitt, P.; Stenzel, O.; Tünnermann, A.; Szeghalmi, A. Influence of Temperature and Plasma Parameters on the Properties of PEALD HfO2. Opt. Mater. Express 2021, 11, 1918–1942. [Google Scholar] [CrossRef] [Scilit]
- Nigro, R.L.; Schilirò, E.; Mannino, G.; Di Franco, S.; Roccaforte, F. Comparison between Thermal and Plasma Enhanced Atomic Layer Deposition Processes for the Growth of HfO2 Dielectric Layers. J. Cryst. Growth 2020, 539, 125624. [Google Scholar] [CrossRef] [Scilit]
- Chiappim, W.; Testoni, G.; Doria, A.; Pessoa, R.; Fraga, M.; Galvão, N.; Grigorov, K.; Vieira, L.; Maciel, H. Relationships among Growth Mechanism, Structure and Morphology of PEALD TiO2 Films: The Influence of O2 Plasma Power, Precursor Chemistry and Plasma Exposure Mode. Nanotechnology 2016, 27, 305701. [Google Scholar] [CrossRef] [Scilit]
- Mitchell, D.; Triani, G.; Attard, D.; Finnie, K.; Evans, P.; Barbé, C.; Bartlett, J.R. Atomic Layer Deposition of TiO2 and Al2O3 Thin Films and Nanolaminates. Smart Mater. Struct. 2005, 15, S57. [Google Scholar] [CrossRef] [Scilit]
- Gu, C.; Yeh, P. Form Birefringence Dispersion in Periodic Layered Media. Opt. Lett. 1996, 21, 504–506. [Google Scholar] [CrossRef] [Scilit]
- Ferrari, L.; Wu, C.; Lepage, D.; Zhang, X.; Liu, Z. Hyperbolic Metamaterials and Their Applications. Prog. Quantum Electron. 2015, 40, 1–40. [Google Scholar] [CrossRef] [Scilit]
- Guo, Z.; Jiang, H.; Chen, H. Hyperbolic Metamaterials: From Dispersion Manipulation to Applications. J. Appl. Phys. 2020, 127, 071101. [Google Scholar] [CrossRef] [Scilit]
- Stenzel, O. Optical Coatings: Material Aspects in Theory and Practice; Springer: Berlin/Heidelberg, Germany, 2014. [Google Scholar]
- Maker, P.; Terhune, R.; Nisenoff, M.; Savage, C. Effects of Dispersion and Focusing on the Production of Optical Harmonics. Phys. Rev. Lett. 1962, 8, 21. [Google Scholar] [CrossRef] [Scilit]
- Herman, W.N.; Hayden, L.M. Maker Fringes Revisited: Second-Harmonic Generation from Birefringent or Absorbing Materials. J. Opt. Soc. Am. B 1995, 12, 416–427. [Google Scholar] [CrossRef] [Scilit]
- Hermans, A.; Kieninger, C.; Koskinen, K.; Wickberg, A.; Solano, E.; Dendooven, J.; Kauranen, M.; Clemmen, S.; Wegener, M.; Koos, C.; et al. On the Determination of χ(2) in Thin Films: A Comparison of One-Beam Second-Harmonic Generation Measurement Methodologies. Sci. Rep. 2017, 7, 44581. [Google Scholar] [CrossRef] [Scilit]
- Rodriguez, F.J.; Wang, F.X.; Kauranen, M. Calibration of the Second-Order Nonlinear Optical Susceptibility of Surface and Bulk of Glass. Opt. Express 2008, 16, 8704–8710. [Google Scholar] [CrossRef] [Scilit]
- Beer, S.; Gour, J.; Alberucci, A.; David, C.; Nolte, S.; Zeitner, U.D. Second Harmonic Generation under Doubly Resonant Lattice Plasmon Excitation. Opt. Express 2022, 30, 40884–40896. [Google Scholar] [CrossRef] [Scilit]
- Fleming, J.W.; Weber, M.J.; Day, G.W.; Feldman, A.; Chai, B.H.; Kuzyk, M.G.; Holland, W.R.; Rapp, C.F.; Minden, M.; Moore, D.T.; et al. Handbook of Optical Materials; CRC Press: Boca Raton, FL, USA, 2018. [Google Scholar]
- Karvounis, A.; Timpu, F.; Vogler-Neuling, V.V.; Savo, R.; Grange, R. Barium Titanate Nanostructures and Thin Films for Photonics. Adv. Opt. Mater. 2020, 8, 2001249. [Google Scholar] [CrossRef] [Scilit]
- Roberts, D.A. Simplified Characterization of Uniaxial and Biaxial Nonlinear Optical Crystals: A Plea for Standardization of Nomenclature and Conventions. IEEE J. Quantum Electron. 1992, 28, 2057–2074. [Google Scholar] [CrossRef]
- Mičulka, M.; Liu, J.; Beer, S.; Rafi, R.; Sevriukov, D.; Yulin, S.; Roddatis, V.; Nolte, S.; Staude, I.; Tünnermann, A.; et al. Systematic Study of Amorphous ABC Heterostructures at the Atomic Scale as a Nonlinear Optical Metamaterial. arXiv 2025, arXiv:2509.21583. [Google Scholar] [CrossRef] [Scilit]
- Malitson, I.H. Interspecimen Comparison of the Refractive Index of Fused Silica. J. Opt. Soc. Am. 1965, 55, 1205–1209. [Google Scholar] [CrossRef] [Scilit]
- Agrawal, G.P. Nonlinear Fiber Optics; Springer: Berlin/Heidelberg, Germany, 2000; pp. 195–211. [Google Scholar]

Disclaimer/Publisher’s Note: The statements, opinions and data contained in all publications are solely those of the individual author(s) and contributor(s) and not of MDPI and/or the editor(s). MDPI and/or the editor(s) disclaim responsibility for any injury to people or property resulting from any ideas, methods, instructions or products referred to in the content. |
© 2026 by the authors. Licensee MDPI, Basel, Switzerland. This article is an open access article distributed under the terms and conditions of the Creative Commons Attribution (CC BY) license.