


Abstract
Surface cracks in integral structures of aircraft pose a significant threat to structural integrity. This paper investigates the three-dimensional propagation behavior and crack-arrest characteristics of surface-initiated cracks in the web of an integral wing spar manufactured from 7050-T7451 aluminum alloy. A three-dimensional finite element model is developed in ANSYS 2024R2 to evaluate the stress intensity factors (SIFs) along the crack front under representative displacement-controlled loading conditions. This paper focuses on comparing the crack-arrest effectiveness of different tear strap configurations by varying their height-to-thickness (H/T) ratios while maintaining a constant mass. The results indicate that surface crack propagation in the spar web is dominated by Mode I (opening mode). Among the investigated designs (H/T = 0.5, 2.0, and 8.0), the configuration with the smallest ratio (H/T = 0.5) exhibits the most effective crack-arrest capability, yielding the lowest crack-driving force as the crack approaches the strap. Furthermore, fatigue life estimates based on Paris’ law illustrate the dependence of remaining service life on the evaluated stress intensity factor evolution. These findings provide a comparative basis for the damage-tolerant design of integral metallic aircraft structures, suggesting that selecting appropriate geometric proportions for crack-arrest features can enhance resistance to surface crack propagation.
1. Introduction
Integral wing spars are widely adopted as primary load-carrying components in modern aircraft structures because of their high load-bearing efficiency and lightweight advantages. Nevertheless, surface-initiated cracks may develop at critical locations during manufacturing processes and subsequent service under complex operating environments, such as cyclic loading and exposure to corrosive media. The propagation of these surface defects is strongly affected by local geometric features and applied load, leading to complex damage mechanisms. As a result, such cracks pose potential risks to flight safety and create significant challenges for both structural design and maintenance.
Damage-tolerant design, as a core philosophy for ensuring the safety of aircraft structures, aims to guarantee that structures containing defects retain sufficient residual strength within prescribed inspection intervals. This approach relies heavily on accurate prediction of the entire process of surface crack initiation, propagation, and eventual fracture. Among the governing parameters, the stress intensity factor (SIF) at the crack front serves as a key mechanical quantity for characterizing the crack-front stress field, determining crack propagation onset, and predicting crack growth rates. In engineering practice, structural features such as tear straps are commonly introduced to effectively retard crack propagation and extend the safe service life of structural components.
1.1. Literature Review
In recent years, extensive research efforts have been devoted to understanding crack behavior in aerospace structures. In the area of surface crack modeling and propagation simulation, Bergara et al. investigated fatigue crack growth in thin-walled structures of aircraft engine guide vanes by combining experimental testing with ANSYS-based XFEM numerical simulations within the framework of linear elastic fracture mechanics (LEFM). Crack propagation in geometrically discontinuous regions and thin cylindrical skins was modeled and validated, and the numerical predictions showed excellent agreement with experimental results in terms of crack morphology and failure cycles, demonstrating the effectiveness of the XFEM approach for fatigue crack growth analysis with complex crack fronts [1]. Kundu et al. addressed the durability and damage tolerance certification requirements of additively manufactured (AM) aircraft structures and repairs for the U.S. Air Force by introducing a Hartman–Schijve form of the NASGRO crack growth model based on fracture mechanics. Their study systematically investigated crack growth behavior under the combined effects of residual stresses and multiple collinear surface cracks, showing that the model can accurately predict the propagation of coexisting cracks in cold-sprayed repairs and rough-surfaced AM components [2]. Many related studies have also been reported in the literature [3,4,5,6,7,8,9,10]
Cracks typically initiate at or near the surface due to machining marks, corrosion pits, fretting damage, or localized surface degradation during service. Consequently, surface protection strategies, including anodizing, laser shock peening, shot peening, are commonly employed to delay crack initiation and reduce early-stage crack growth rates [11,12,13,14,15,16]. For example, inspired by the crack-resistant mechanisms of plant leaves, Wu et al. introduced biomimetic residual stresses ahead of the crack front through laser shock peening, significantly reducing the crack-front stress intensity factor and extending fatigue life [12]. In addition, alternative approaches based on active control, intelligent optimization, and advanced modeling techniques have been proposed to further enhance crack repair or suppression performance [17,18,19]. However, once a crack has penetrated into the structural substrate, structural-level crack-arrest mechanisms become critical.
1.2. Study Objective
The objective of this paper is to investigate the crack-arrest characteristics of tear strap geometries in an integral wing spar containing surface-initiated cracks. The primary research involves establishing a finite element model of an integral wing spar to simulate the three-dimensional propagation behavior of surface cracks in the spar web and to evaluate the corresponding crack-front stress intensity factors. Subsequently, a comparative study is conducted on the crack suppression performance of three tear strap configurations, from which the parameter set exhibiting the strongest crack-arrest capability is identified. Finally, based on fracture mechanics theory, the fatigue crack growth life of the integral wing spar containing surface cracks is predicted.
1.3. Research Procedure
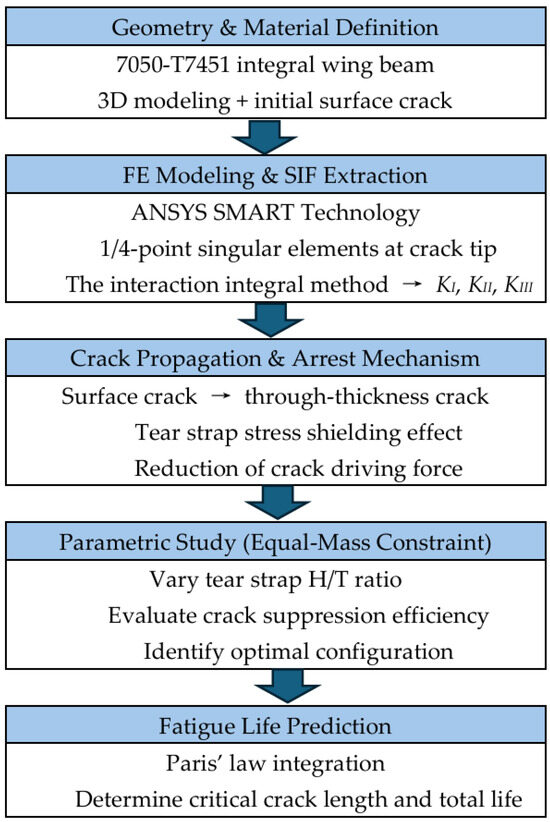
The research methodology and step-by-step procedure of this paper are clearly presented in the flowchart shown in Figure 1. This flowchart systematically illustrates the logical sequence of the investigation, beginning with the definition of geometry and material properties for the 7050-T7451 integral wing beam, including 3D modeling with an initial surface crack. It then proceeds to finite element (FE) modeling using ANSYS, crack-front singularity meshing, and stress intensity factor (SIF) extraction via the interaction integral method (yielding KI, KII, and KIII components). Subsequent stages focus on crack propagation behavior and arrest mechanisms, particularly the transition from surface to through-thickness cracks and the stress-shielding effect induced by the tear strap, which reduces the crack driving force. Under an equal-mass constraint, a parametric study is conducted by varying the tear strap height-to-thickness (H/T) ratio to evaluate crack suppression efficiency and determine the optimal configuration. Finally, fatigue life prediction is performed through integration of the Paris’ law to estimate the critical crack length and total fatigue life. The flowchart thus provides a concise structural roadmap that guides the detailed technical discussions in the following sections.
Figure 1.
Research flowchart of this paper.
2. Materials and Methods
2.1. Geometry Model and Material Properties
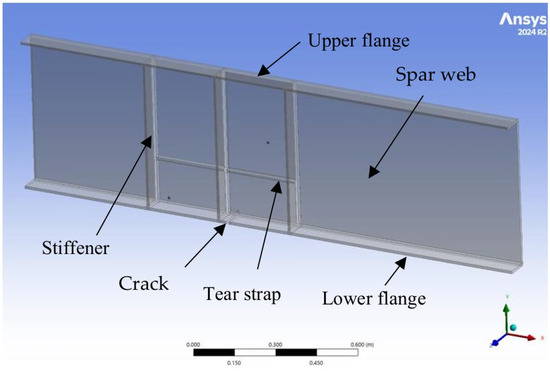
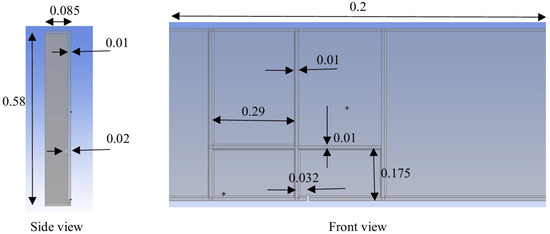
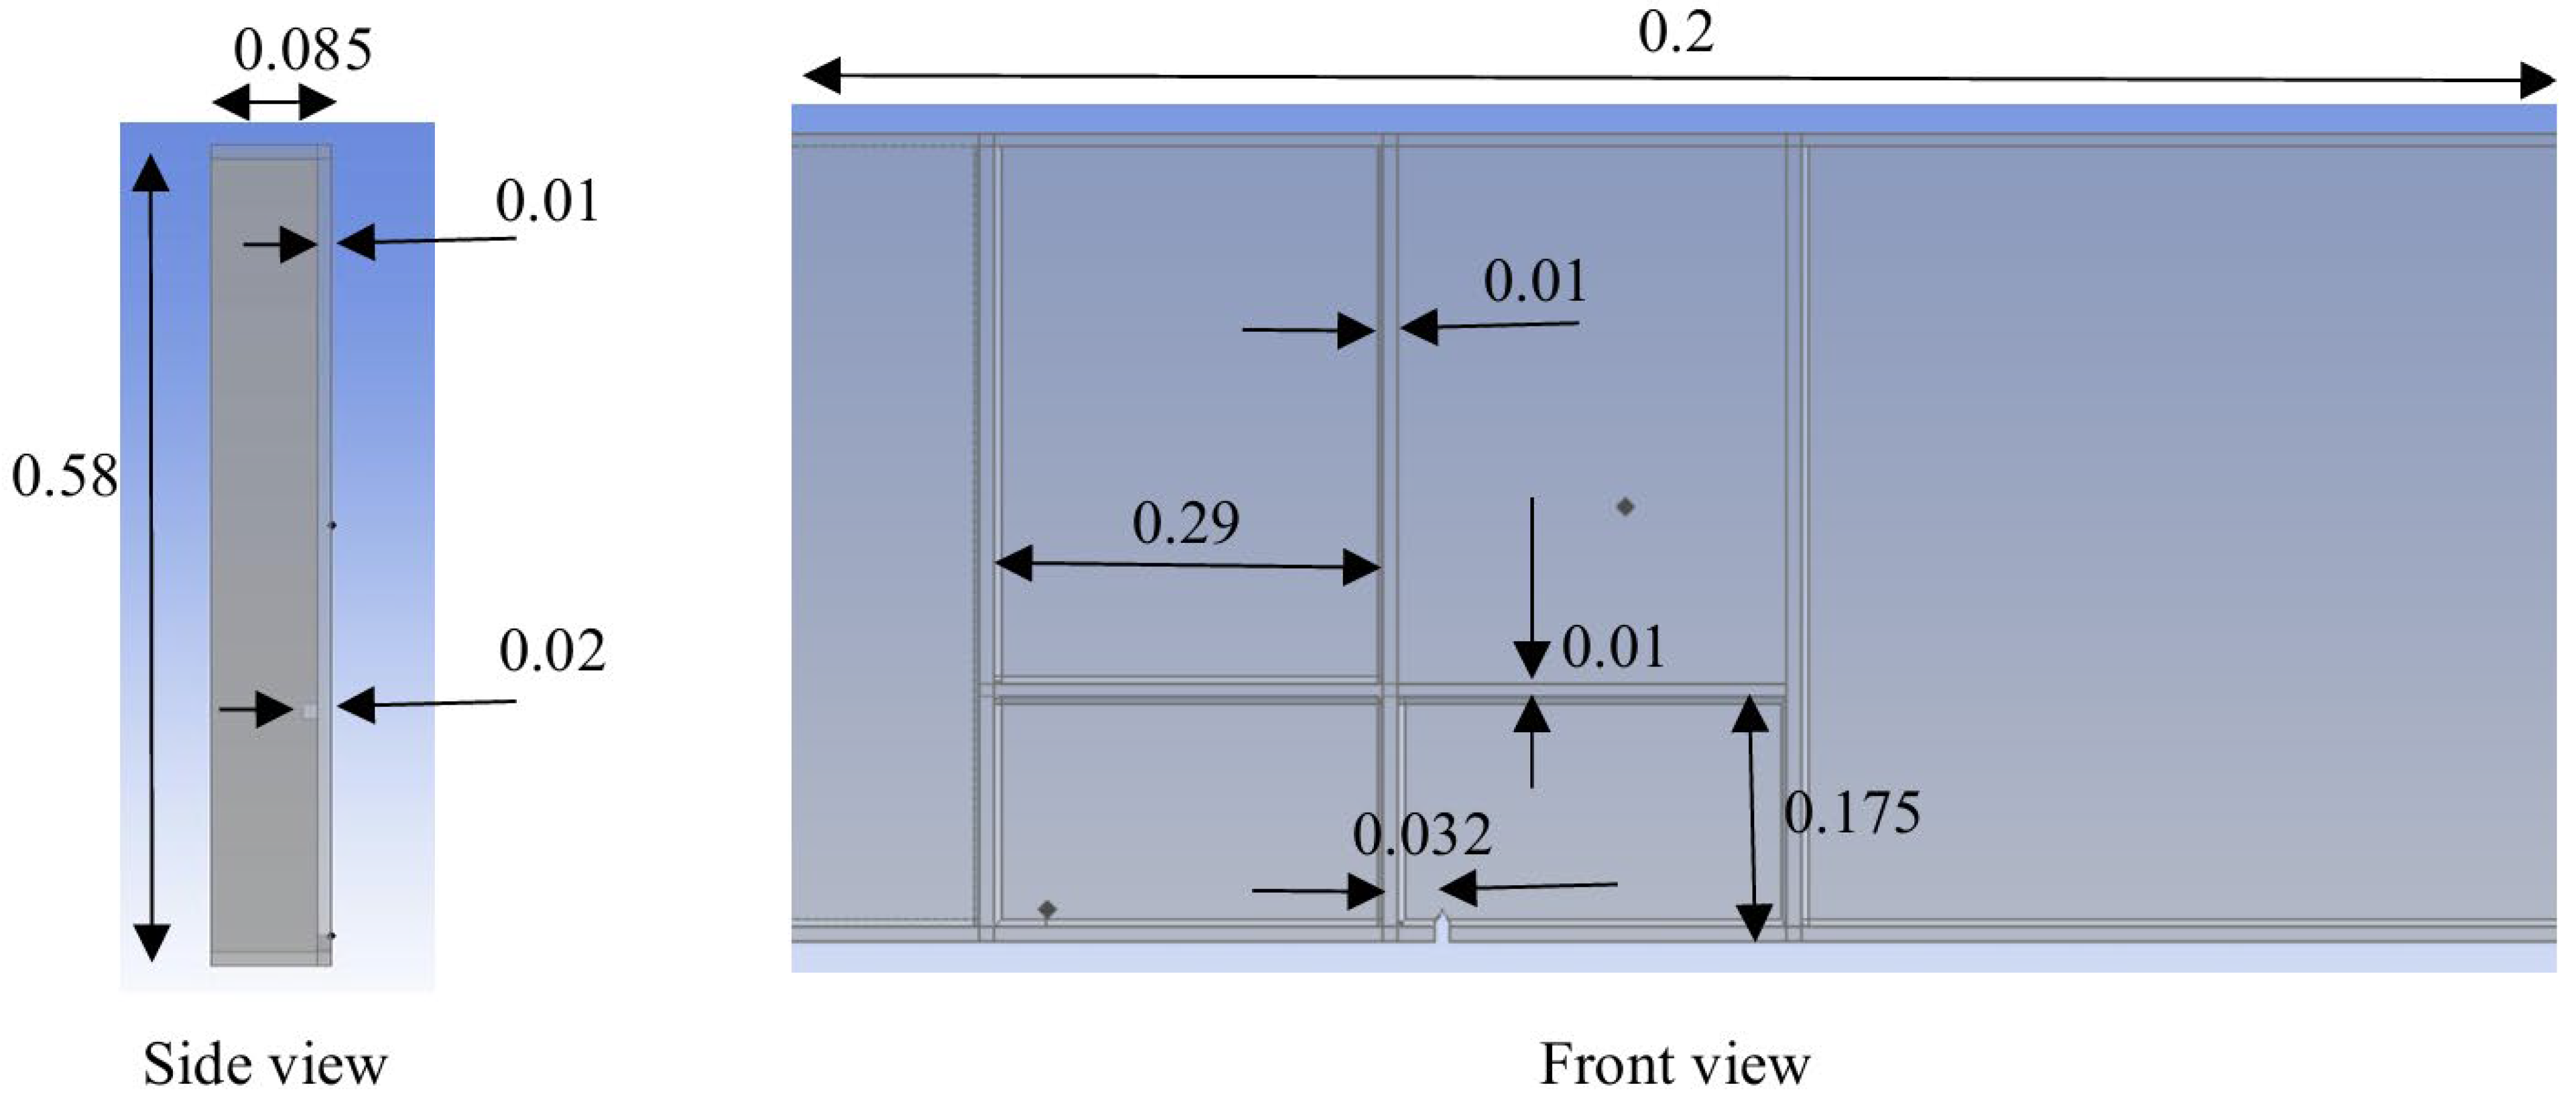
In this paper, a representative aircraft integral wing spar is selected as the analysis object. The spar consists of upper and lower flanges, a spar web, and integrated tear straps, with the tear straps located at 1/3 of the web height. The structure is manufactured using an integral machining process. The spar material is high-strength 7050-T7451 aluminum alloy. To simplify the analysis and focus on crack behavior within the spar itself, the details of the bolts and skin are not included in the present model, as shown in Figure 2 and Figure 3. The primary mechanical properties of the materials are summarized in Table 1.
Figure 2.
Integral wing spar.
Figure 3.
The parameters of integral wing spar (length unit: m).
Table 1.
The mechanical properties of the integral wing spar.
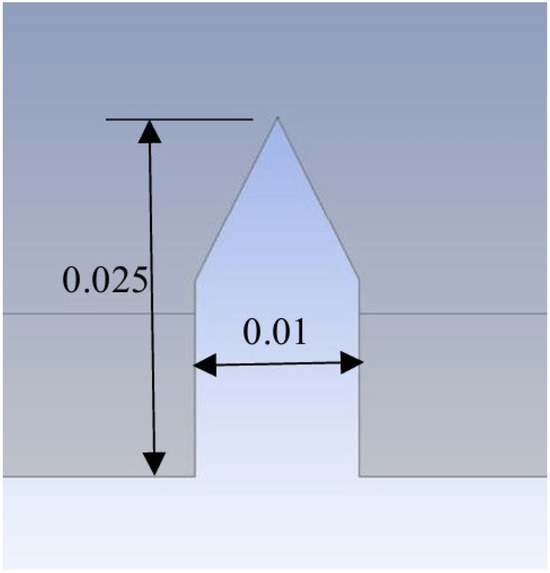
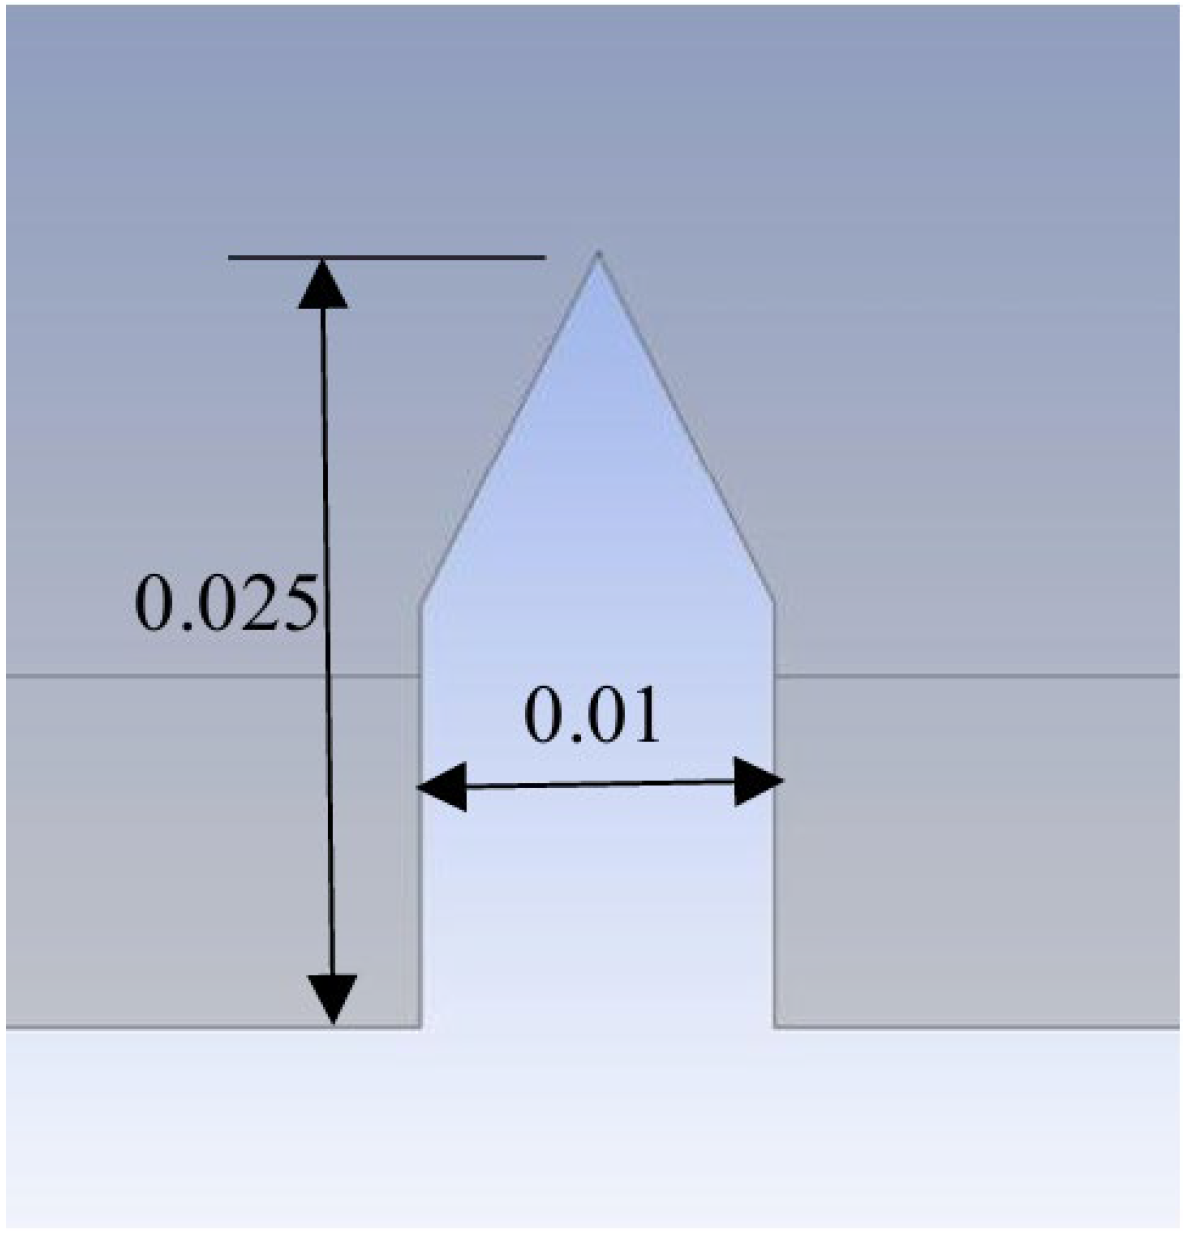
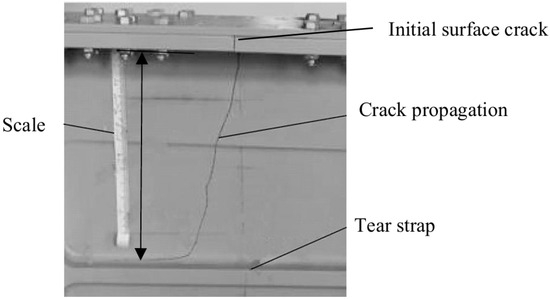
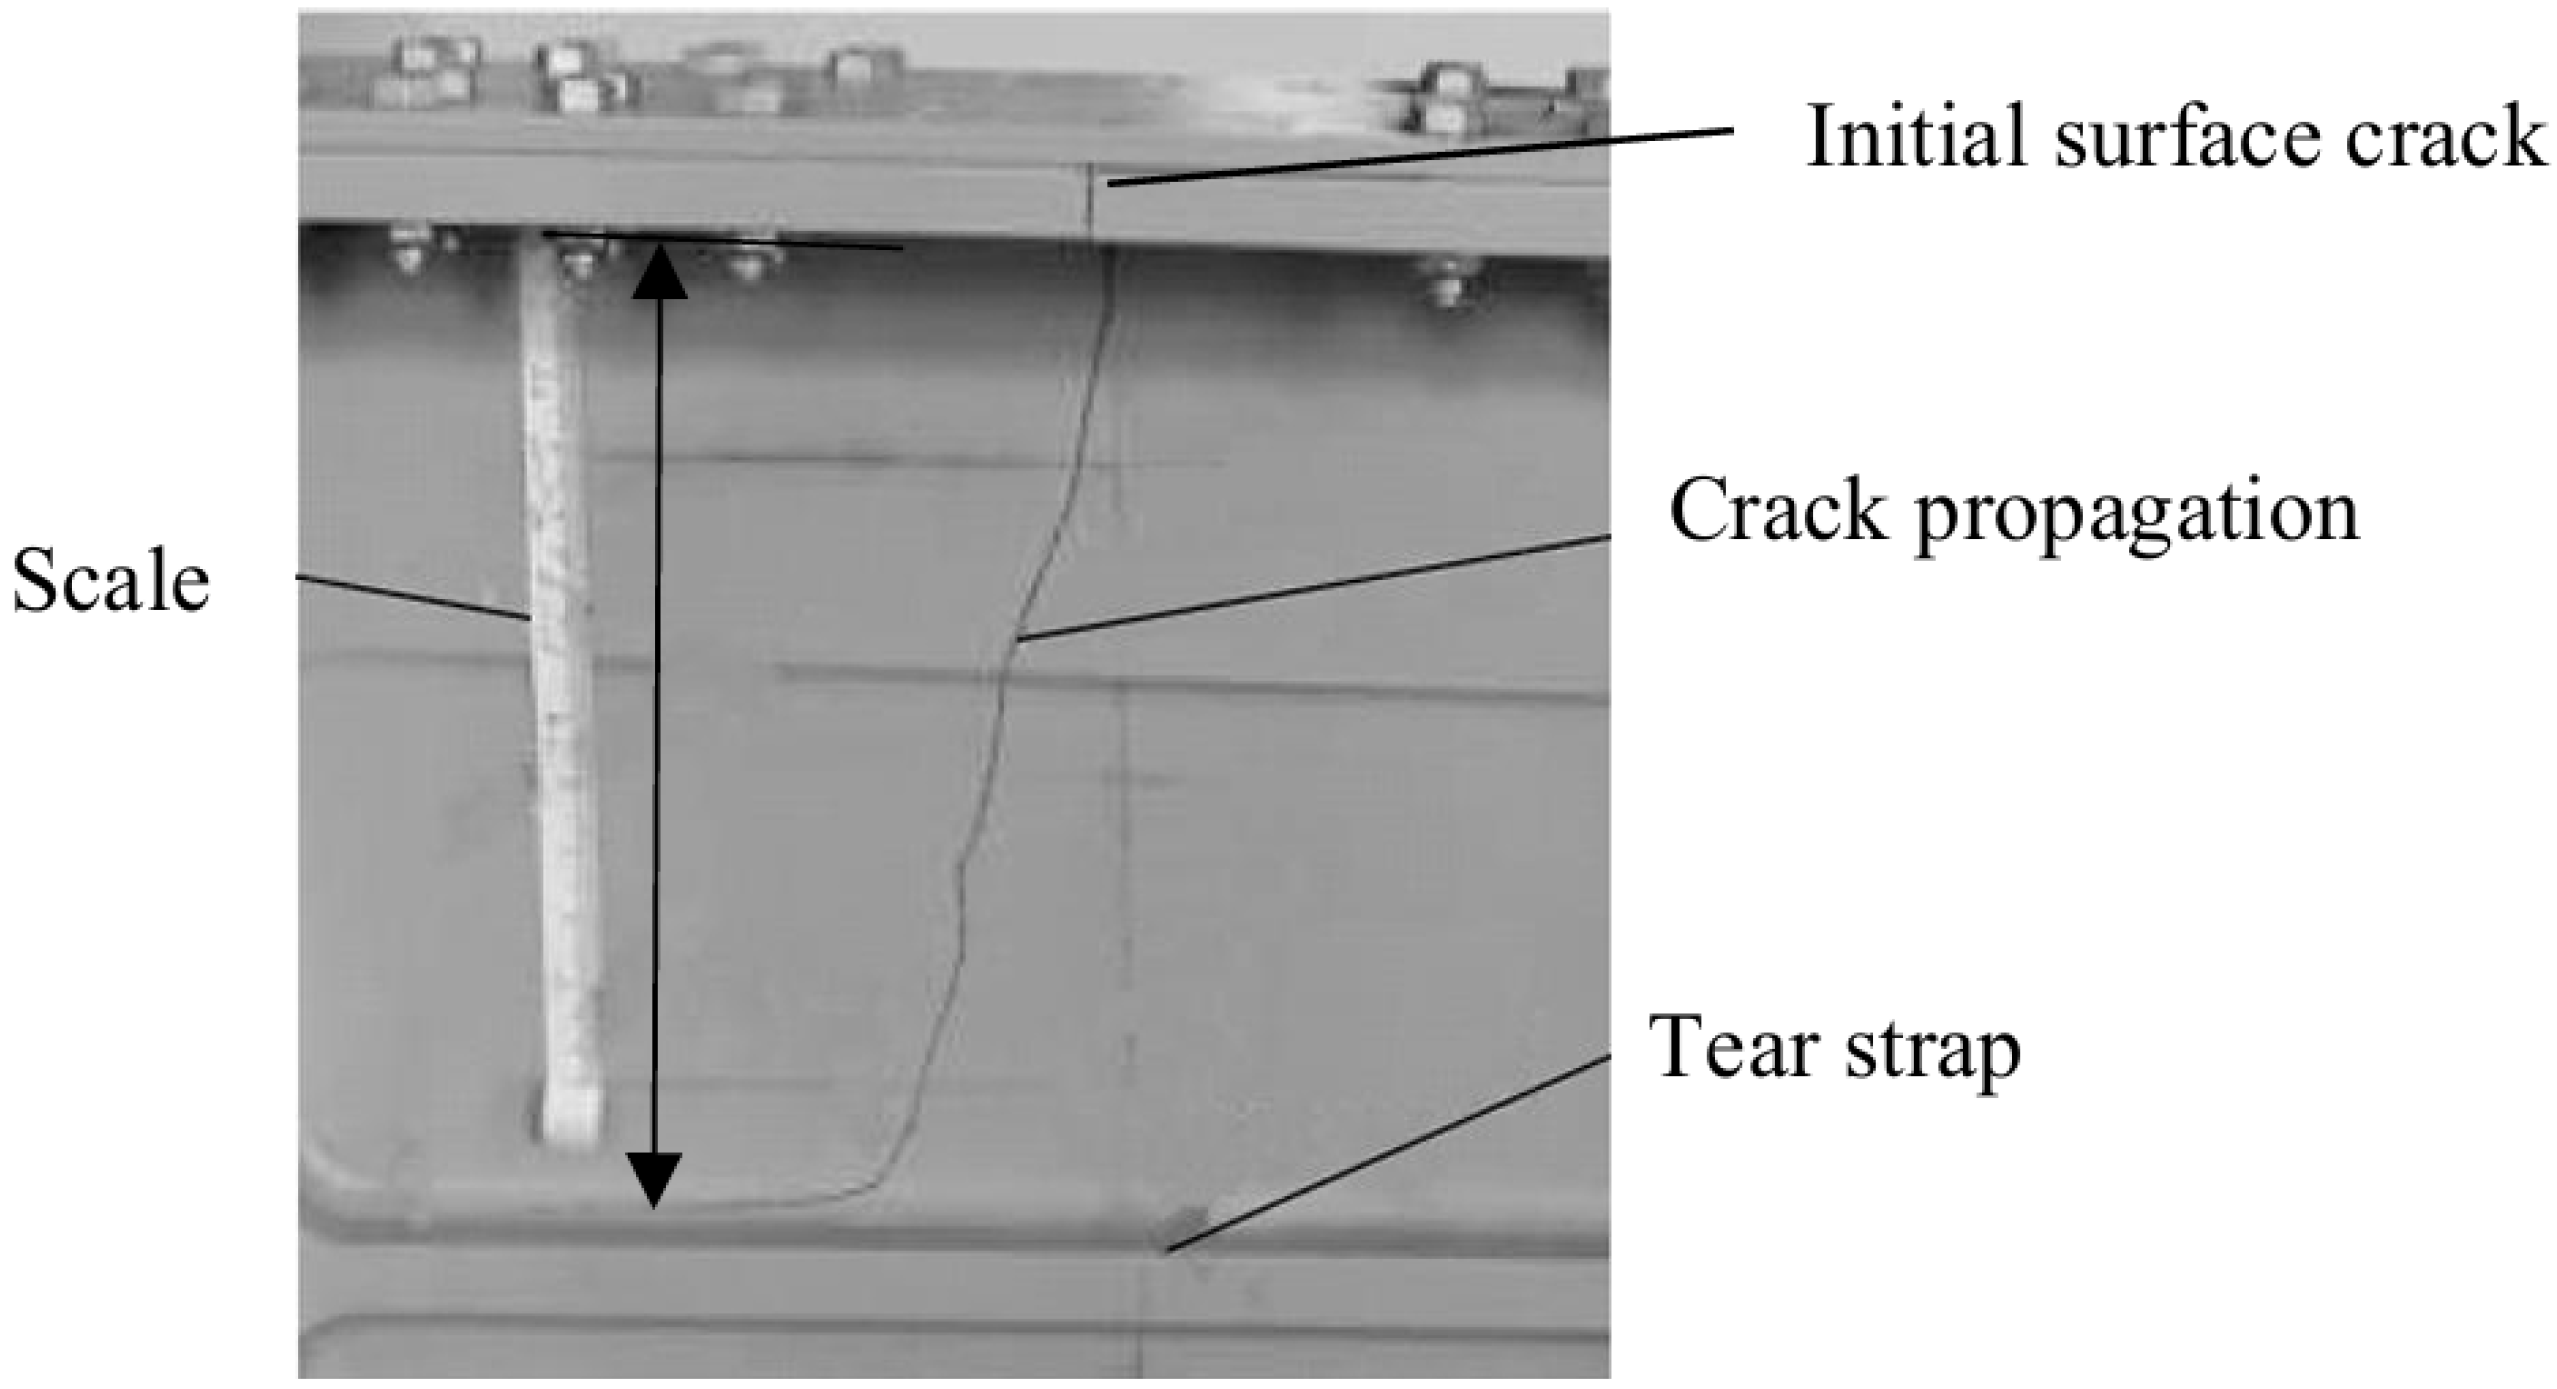
An initial surface crack is preset in the high-stress region of the spar web. The crack is located 0.032 m away from the nearest Stiffener, with an initial width of 0.01 m and length of 0.025 m, as illustrated in Figure 4. The selection of the initial surface crack size and location in this paper is based on experimentally observed crack configurations in integral wing beam crack propagation specimens [19,20]. As shown in Figure 5, surface cracks are typically initiated in the web region, particularly in areas experiencing high tensile stress under bending-dominated loading conditions. These regions are also prone to stress concentration due to geometric transitions and manufacturing-induced surface imperfections. In integral wing beams manufactured by integral machining, residual machining marks, local surface roughness, and micro-defects may act as crack initiation sources.
Figure 4.
The geometrical parameters of initial surface crack (length unit: m).
Figure 5.
Crack propagation specimen of the integral wing beam [20].
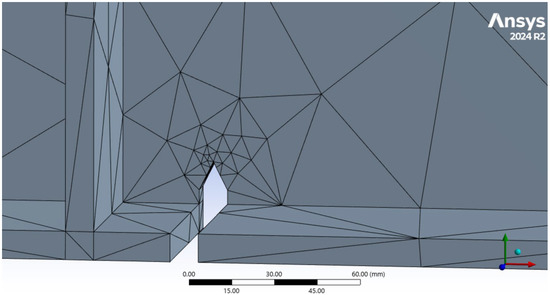
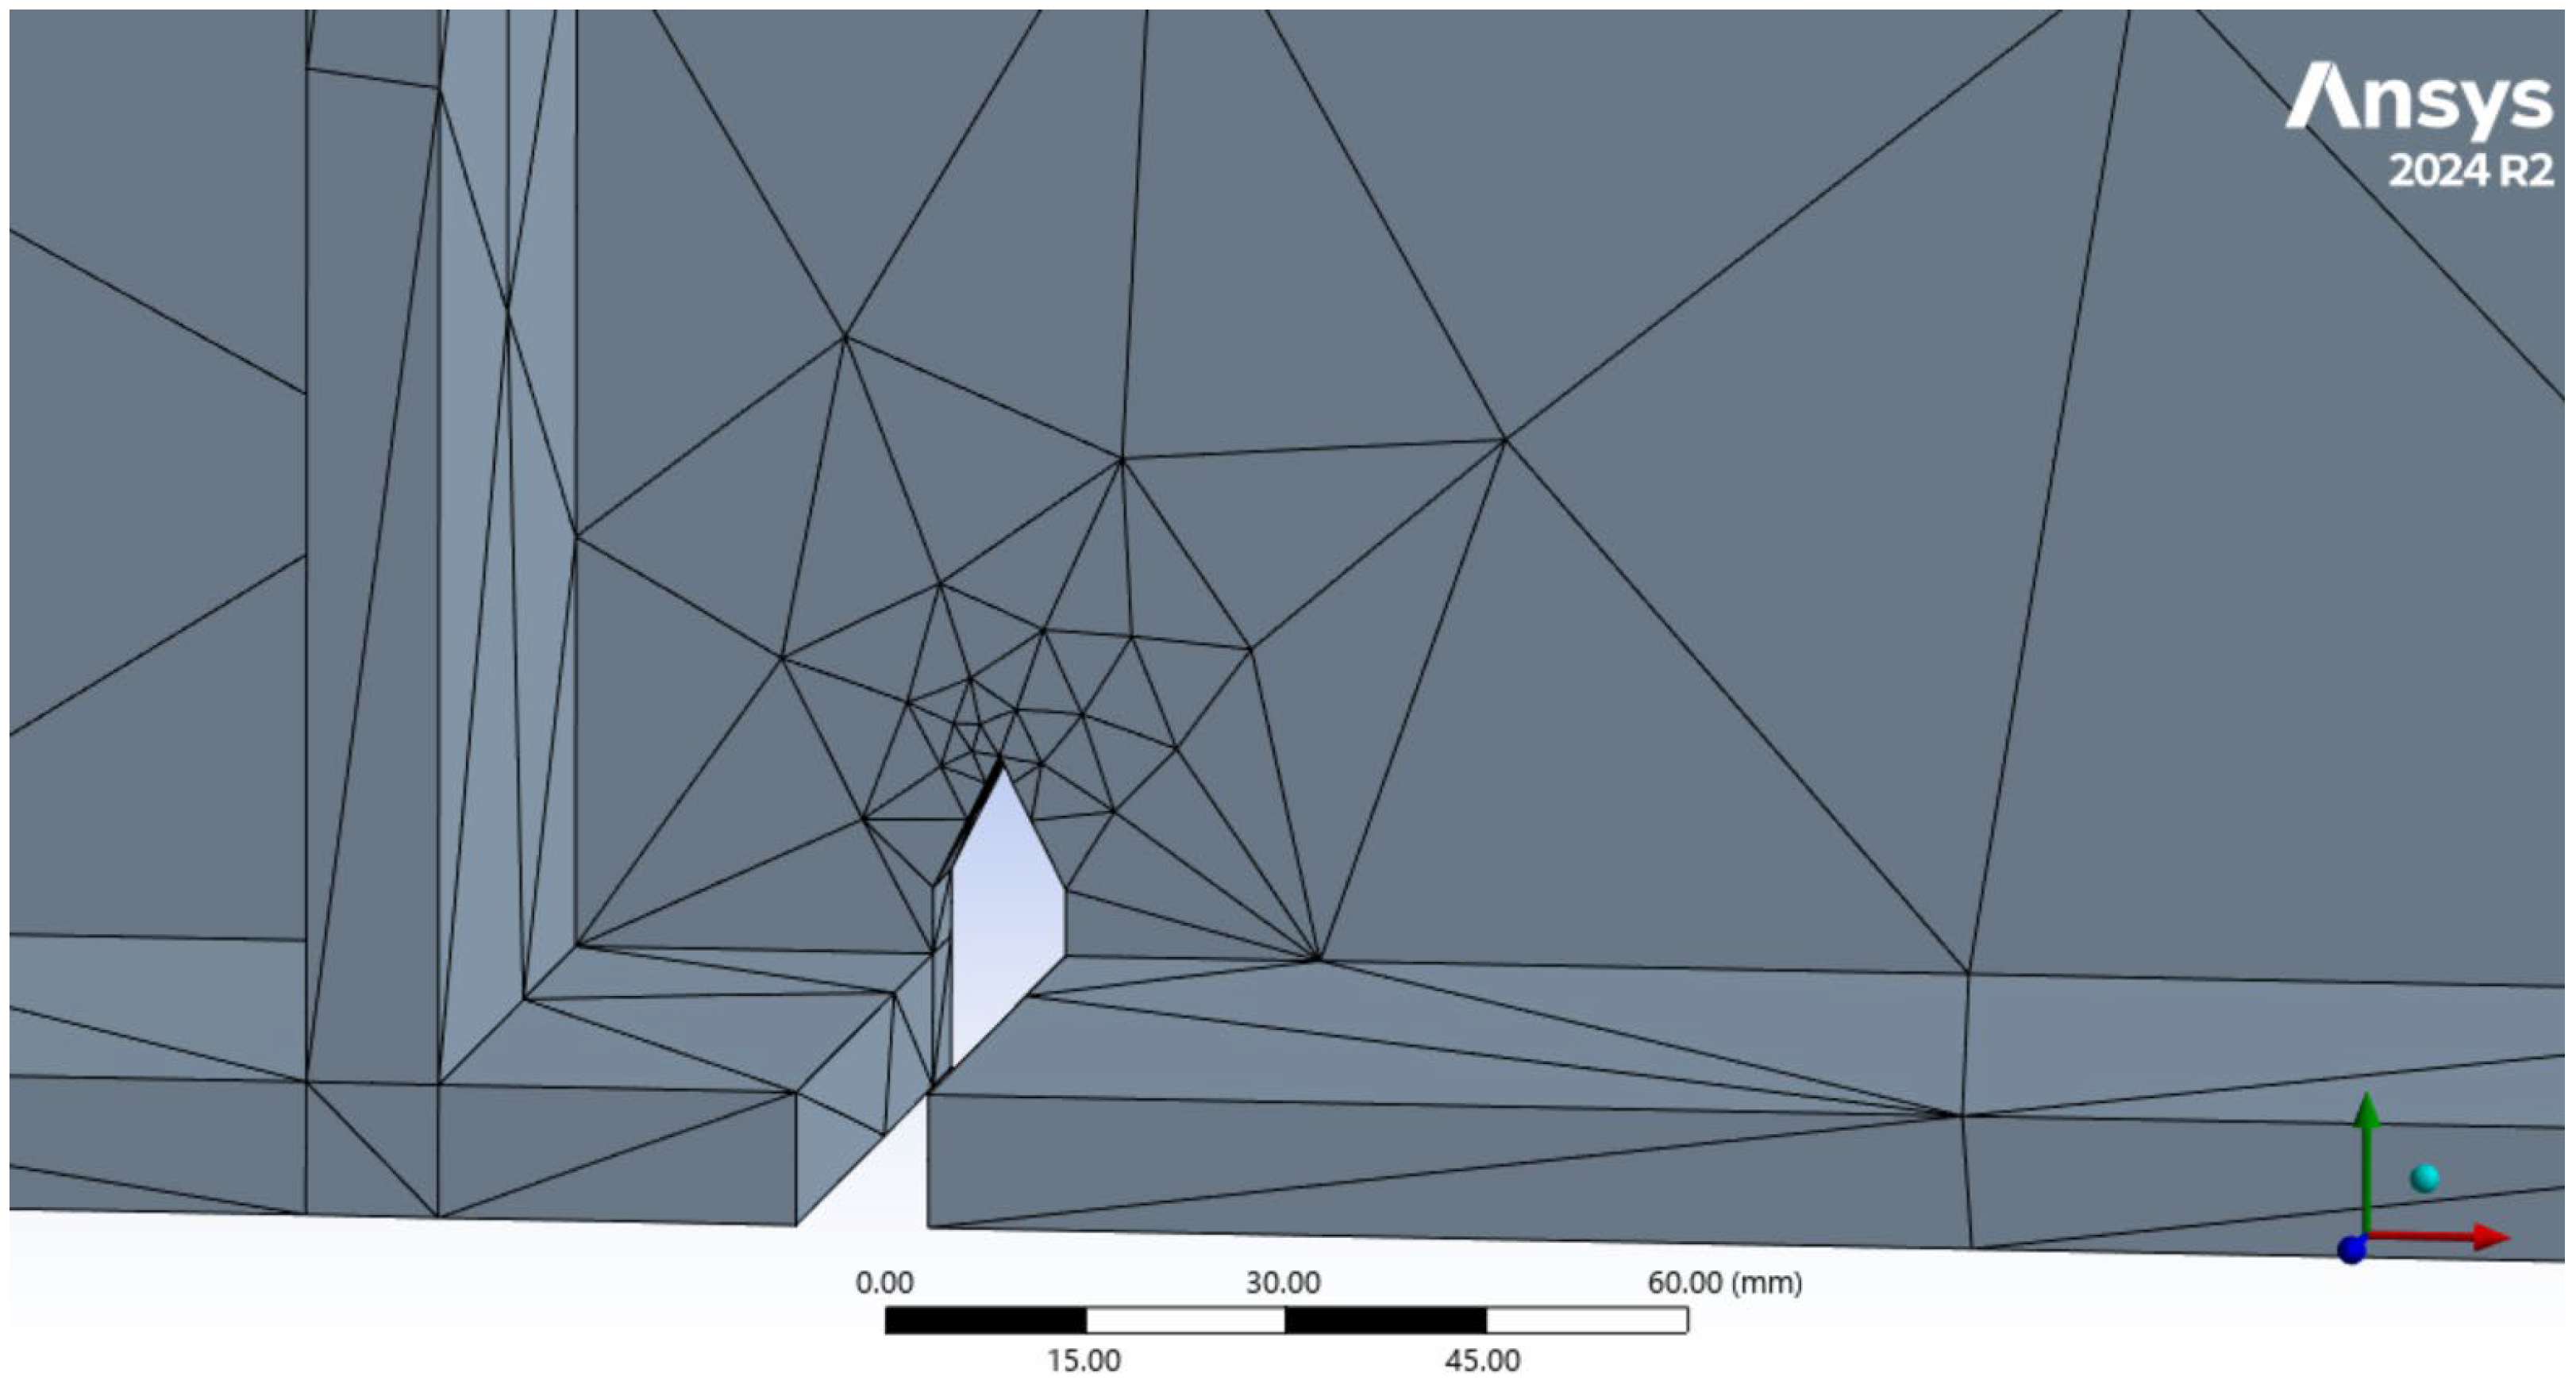
A three-dimensional solid finite element model is established using the commercial software ANSYS (Version 2024R2). Considering the strong stress singularity at the crack front, local mesh refinement is applied in the crack region. Tetrahedral elements with a characteristic size of 0.5 × 10⁻⁴ m are used along the crack front, and a spherical refinement zone with a radius of 2.5 × 10⁻³ m is generated around the crack front to ensure the accuracy of stress intensity factor (SIF) calculations, as shown in Figure 6. Boundary conditions are defined by applying a normal displacement load at one end of the spar, while the opposite end is fully constrained. Displacement-controlled loading was adopted to ensure numerical stability and realistic representation of structural boundary constraints. For integral wing beams subjected to bending-dominated loading, global deformation is typically restricted by adjacent structural components rather than governed purely by force-controlled conditions. Consequently, displacement control more accurately reflects the stiffness-controlled behavior of wing box structures in service. From a computational perspective, displacement control improves convergence robustness during crack propagation analysis, particularly when stress redistribution occurs near the crack front or as the crack approaches the tear strap. Under force-controlled loading, unstable crack growth may trigger abrupt stiffness degradation and convergence difficulties. In contrast, displacement control facilitates gradual energy release and enables stable crack growth tracking. Moreover, since the stress intensity factor is extracted via the interaction integral method, the fracture response is governed by the local crack-front stress field, which is determined by the overall structural response rather than solely by the loading mode. Therefore, displacement-controlled loading ensures both computational reliability and physically consistent fracture parameter evaluation.
Figure 6.
SMART crack growth around the crack front.
The interaction integral method values at nodes along the crack front are extracted and subsequently converted into stress intensity factors corresponding to the three basic fracture modes—Mode I (opening mode), Mode II (sliding mode), and Mode III (tearing mode), denoted as KI, KII and KIII respectively. These parameters are used to quantitatively characterize the crack-front stress state and crack driving force.
2.2. Finite Element Model Validation
2.2.1. Finite Element Model Description
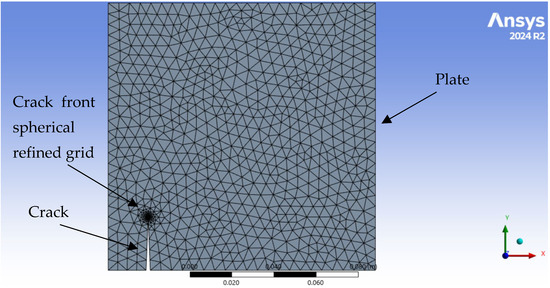
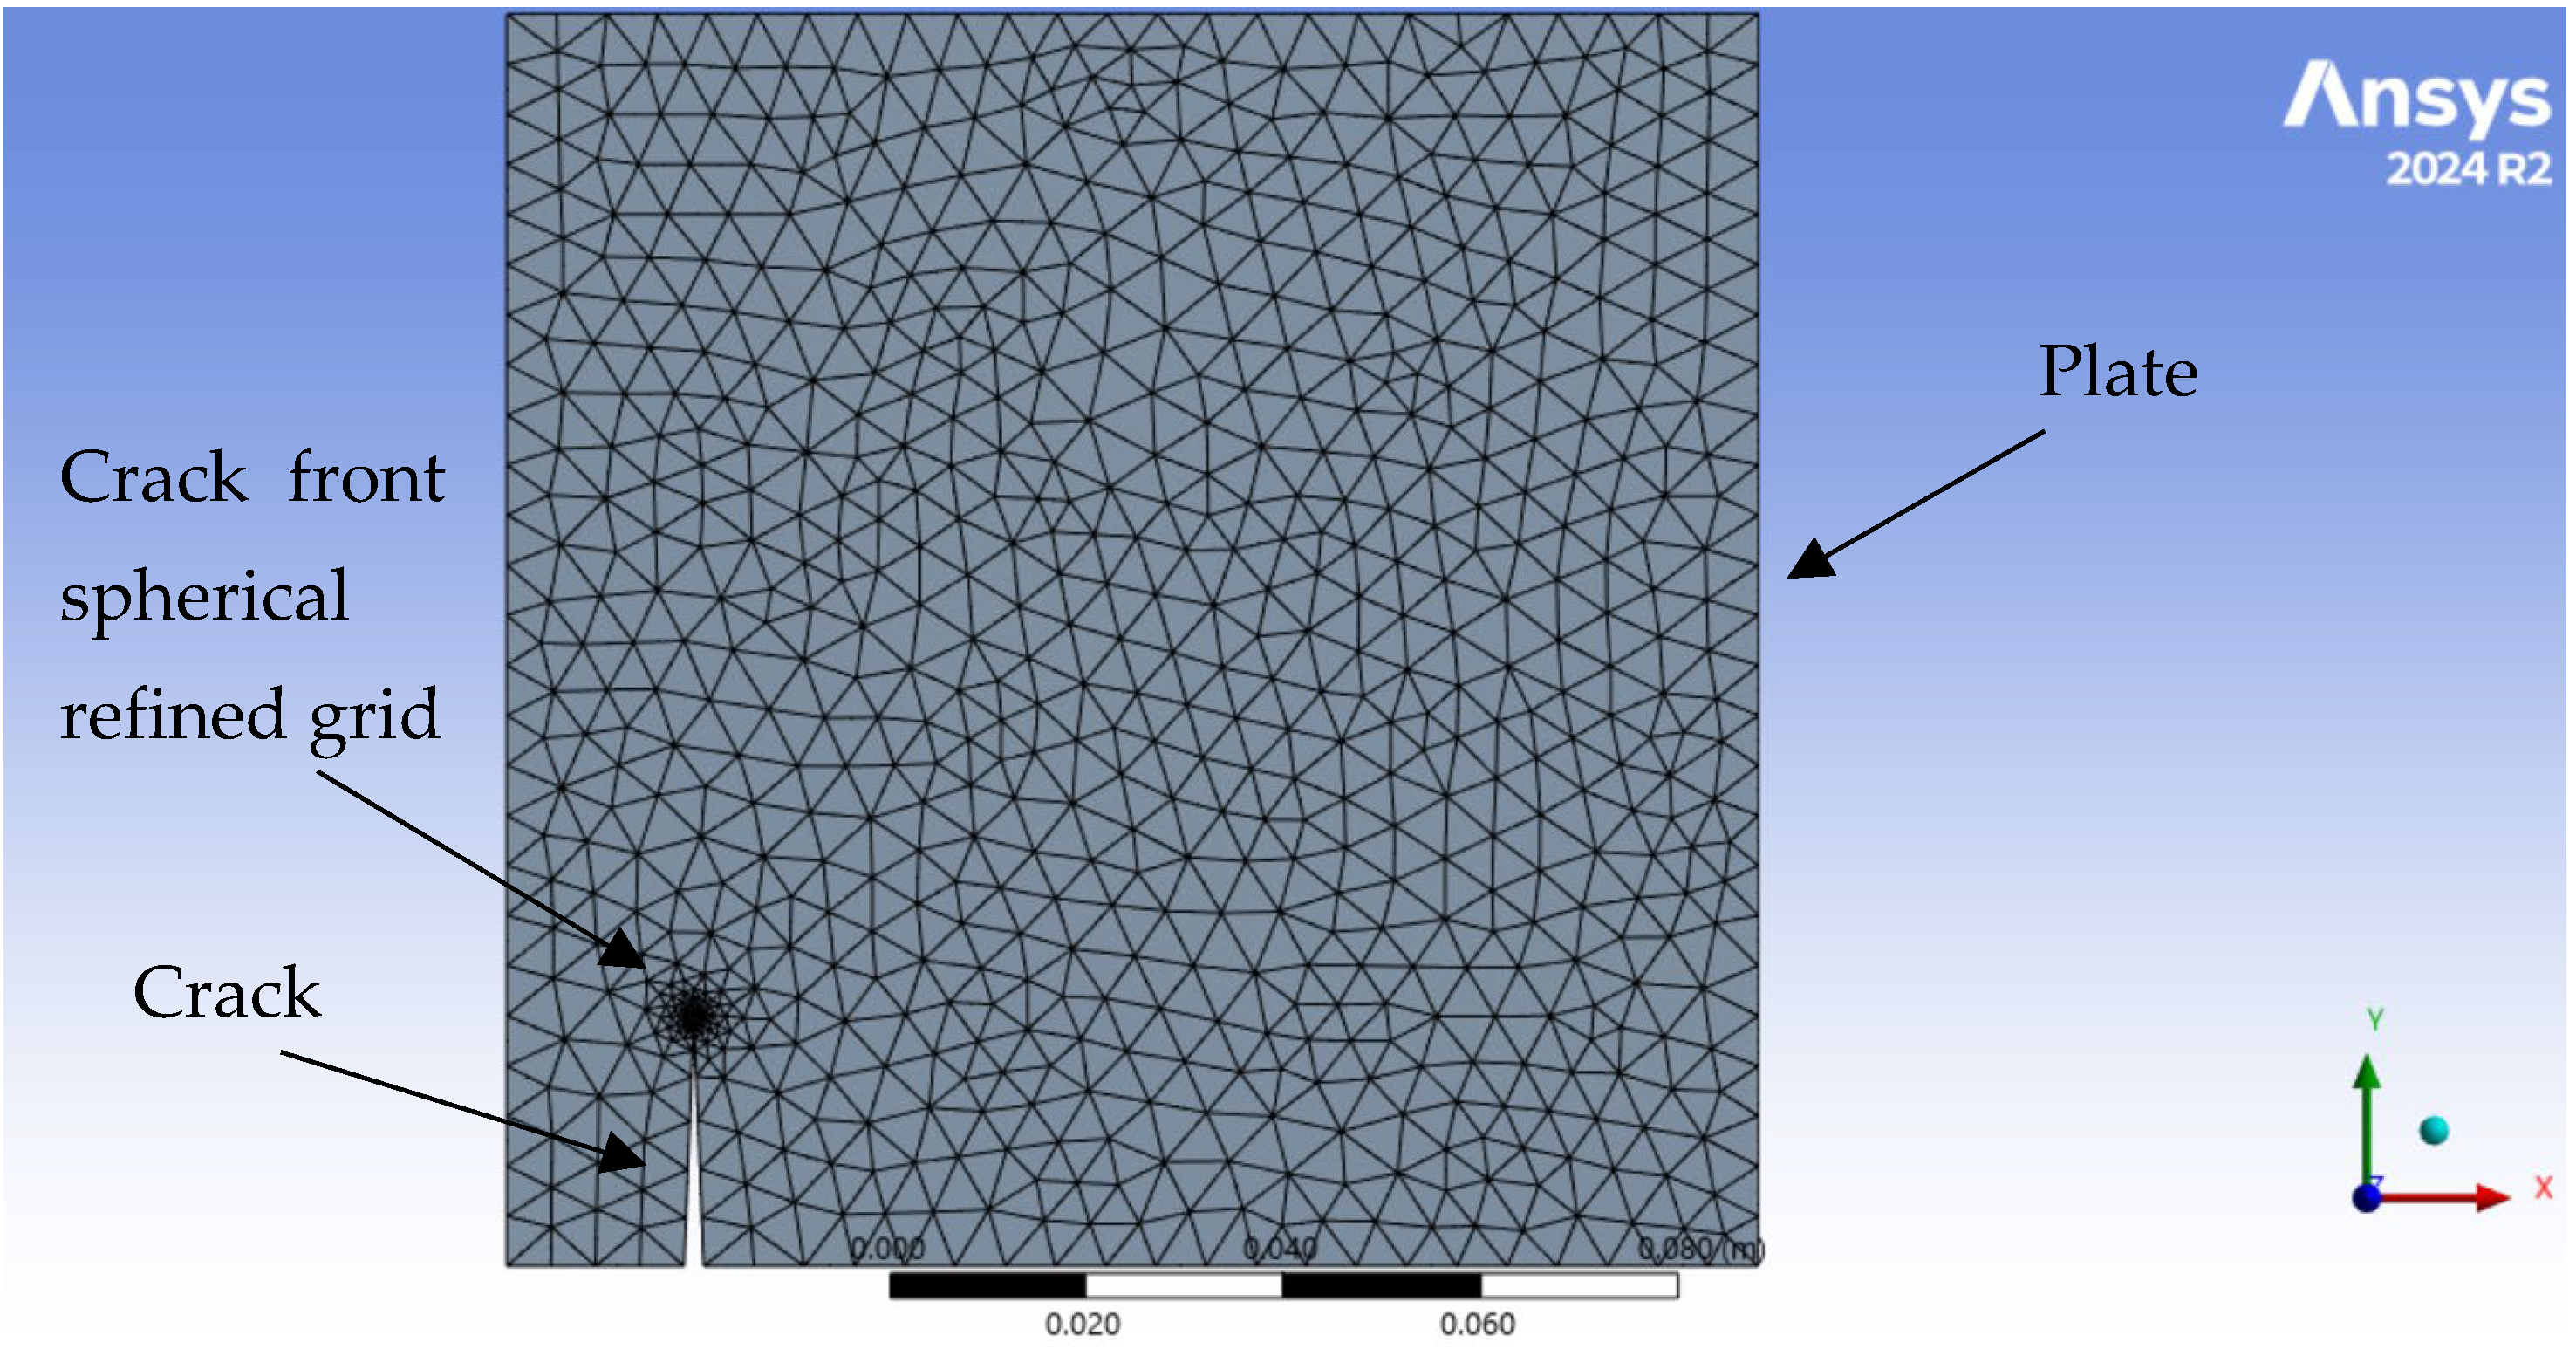
To verify the accuracy of the finite element modeling approach adopted in this paper, a numerical model was established in ANSYS Workbench based on the tensile test of a single-edge cracked plate specimen reported in Reference [21]. The model employed the same geometric dimensions and material properties as those described in the reference, and identical boundary conditions and loading were applied, as shown in Figure 7. The material properties, geometric parameters and loading condition are listed in Table 2. The calculated mode I stress intensity factor (KI) was compared with the corresponding theoretical value.
Figure 7.
Validation model.
Table 2.
The boundary conditions of validation model.
2.2.2. Mesh Independence Study
In this paper, the SMART (Separative, Morphing, Adaptive, and Remeshing Technology) crack growth method in ANSYS Workbench 2024 R2 was employed to simulate the crack propagation. To accurately capture the stress singularity near the crack front, a spherical mesh refinement region was automatically generated at the crack front. Within this region, quadratic tetrahedral elements were utilized, with their mid-side nodes automatically shifted to the quarter-point positions relative to the crack front. This numerical treatment, combined with the interaction integral method, ensures that the square-root singularity of the linear elastic stress field is properly represented and the SIFs are accurately evaluated. The maximum circumferential stress criterion was adopted as the growth law to determine the crack propagation trajectory in discrete increments, ensuring a high-fidelity assessment of the crack-arresting effect. To ensure the accuracy of the SIF extraction, 6 concentric integration contours were defined around the crack front. A path-independence check was performed by comparing the KI values across different contours. It was observed that the calculation stabilized from the 3rd contour onwards, with the maximum deviation between the last five contours being less than 1%, thereby confirming the reliability of the fracture post-processing, as shown in Table 3.
Table 3.
The results of path-independence check.
Within the spherical refinement zone, three different combinations of sphere radius and element size were adopted to perform a mesh-independence verification. The Mode I stress intensity factor (KI) was selected as the evaluation parameter, and the results are presented in Table 4. The results show that as the mesh is refined while maintaining a constant R/h ratio, the calculated KI values exhibit a convergent trend with decreasing oscillation amplitude. The maximum deviation from the theoretical solution is less than 4%, and the difference between the two finest meshes is only 1.34%, indicating that mesh independence has been achieved. Scheme 2 provides an optimal balance between computational cost and accuracy. Therefore, it was adopted for the crack-front mesh refinement in the subsequent integral wing spar crack propagation models.
Table 4.
The result of mesh independence study.
The crack growth direction at each increment is automatically determined by the maximum circumferential stress criterion within the SMART adaptive remeshing framework. Therefore, crack deflection and mixed-mode effects arise naturally from the evolving stress field rather than from any prescribed geometric constraint.
2.3. Parametric Study of Tear Strap Geometry
To evaluate the influence of tear strap geometry on surface crack propagation, a parametric study is conducted by varying the height-to-thickness ratio (H/T) of the tear strap while maintaining constant structural mass. Crack length and corresponding crack-front stress intensity factors are extracted, and SIF values at identical crack lengths are compared among different configurations.
Three tear strap designs with different H/T ratios are considered:
Scheme A: H = 0.01 m, T = 0.02 m (H/T = 0.5)
Scheme B: H = 0.02 m, T = 0.01 m (H/T = 2.0)
Scheme C: H = 0.04 m, T = 0.005 m (H/T = 8.0).
2.4. Fatigue Crack Growth Life Estimation
Fatigue crack growth life was estimated using the Paris’s law formulation under constant-amplitude cyclic loading conditions. The crack growth rate is expressed as:
where a is the characteristic crack length, N is the number of loading cycles, ΔK is the stress intensity factor range at the crack front, and C and m are material-dependent constants.
In this paper, the stress intensity factor range ΔK was obtained directly from the 3D finite element simulations described in the previous sections. The interaction integral method implemented in ANSYS was used to extract the Mode I stress intensity factor along the evolving surface crack front at each propagation increment. No analytical geometric correction factor was employed; instead, the numerically evaluated ΔK corresponding to the actual three-dimensional crack geometry was used for fatigue life integration.
Fatigue crack growth life was calculated by numerically integrating the Paris’s law from the initial crack length a0 to the critical crack length ac. The critical condition was defined by:
where KI,MAX is the maximum Mode I stress intensity factor extracted from the finite element analysis and KI,C is the plane-strain fracture toughness of the material. For 7050-T7451 aluminum alloy, the Paris’ law parameters were adopted from literature data obtained in accordance with [22] standards. The values used in this paper are:
with ΔK expressed in MPa·m1/2.
The fracture toughness KI,C was taken as 72 MPa·m1/2, consistent with published data measured following ASTM E399 [23] procedures. This procedure ensures full consistency between the three-dimensional crack geometry, numerically evaluated fracture parameters, and the fatigue crack growth life prediction framework.
3. Results and Discussion
3.1. Crack Propagation Path and Evolution of Stress Intensity Factors
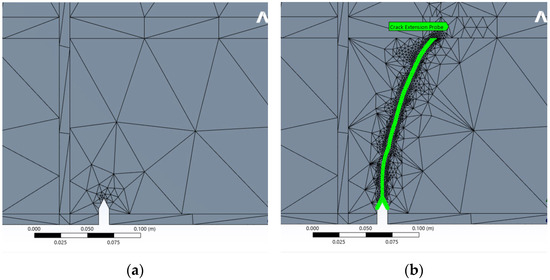
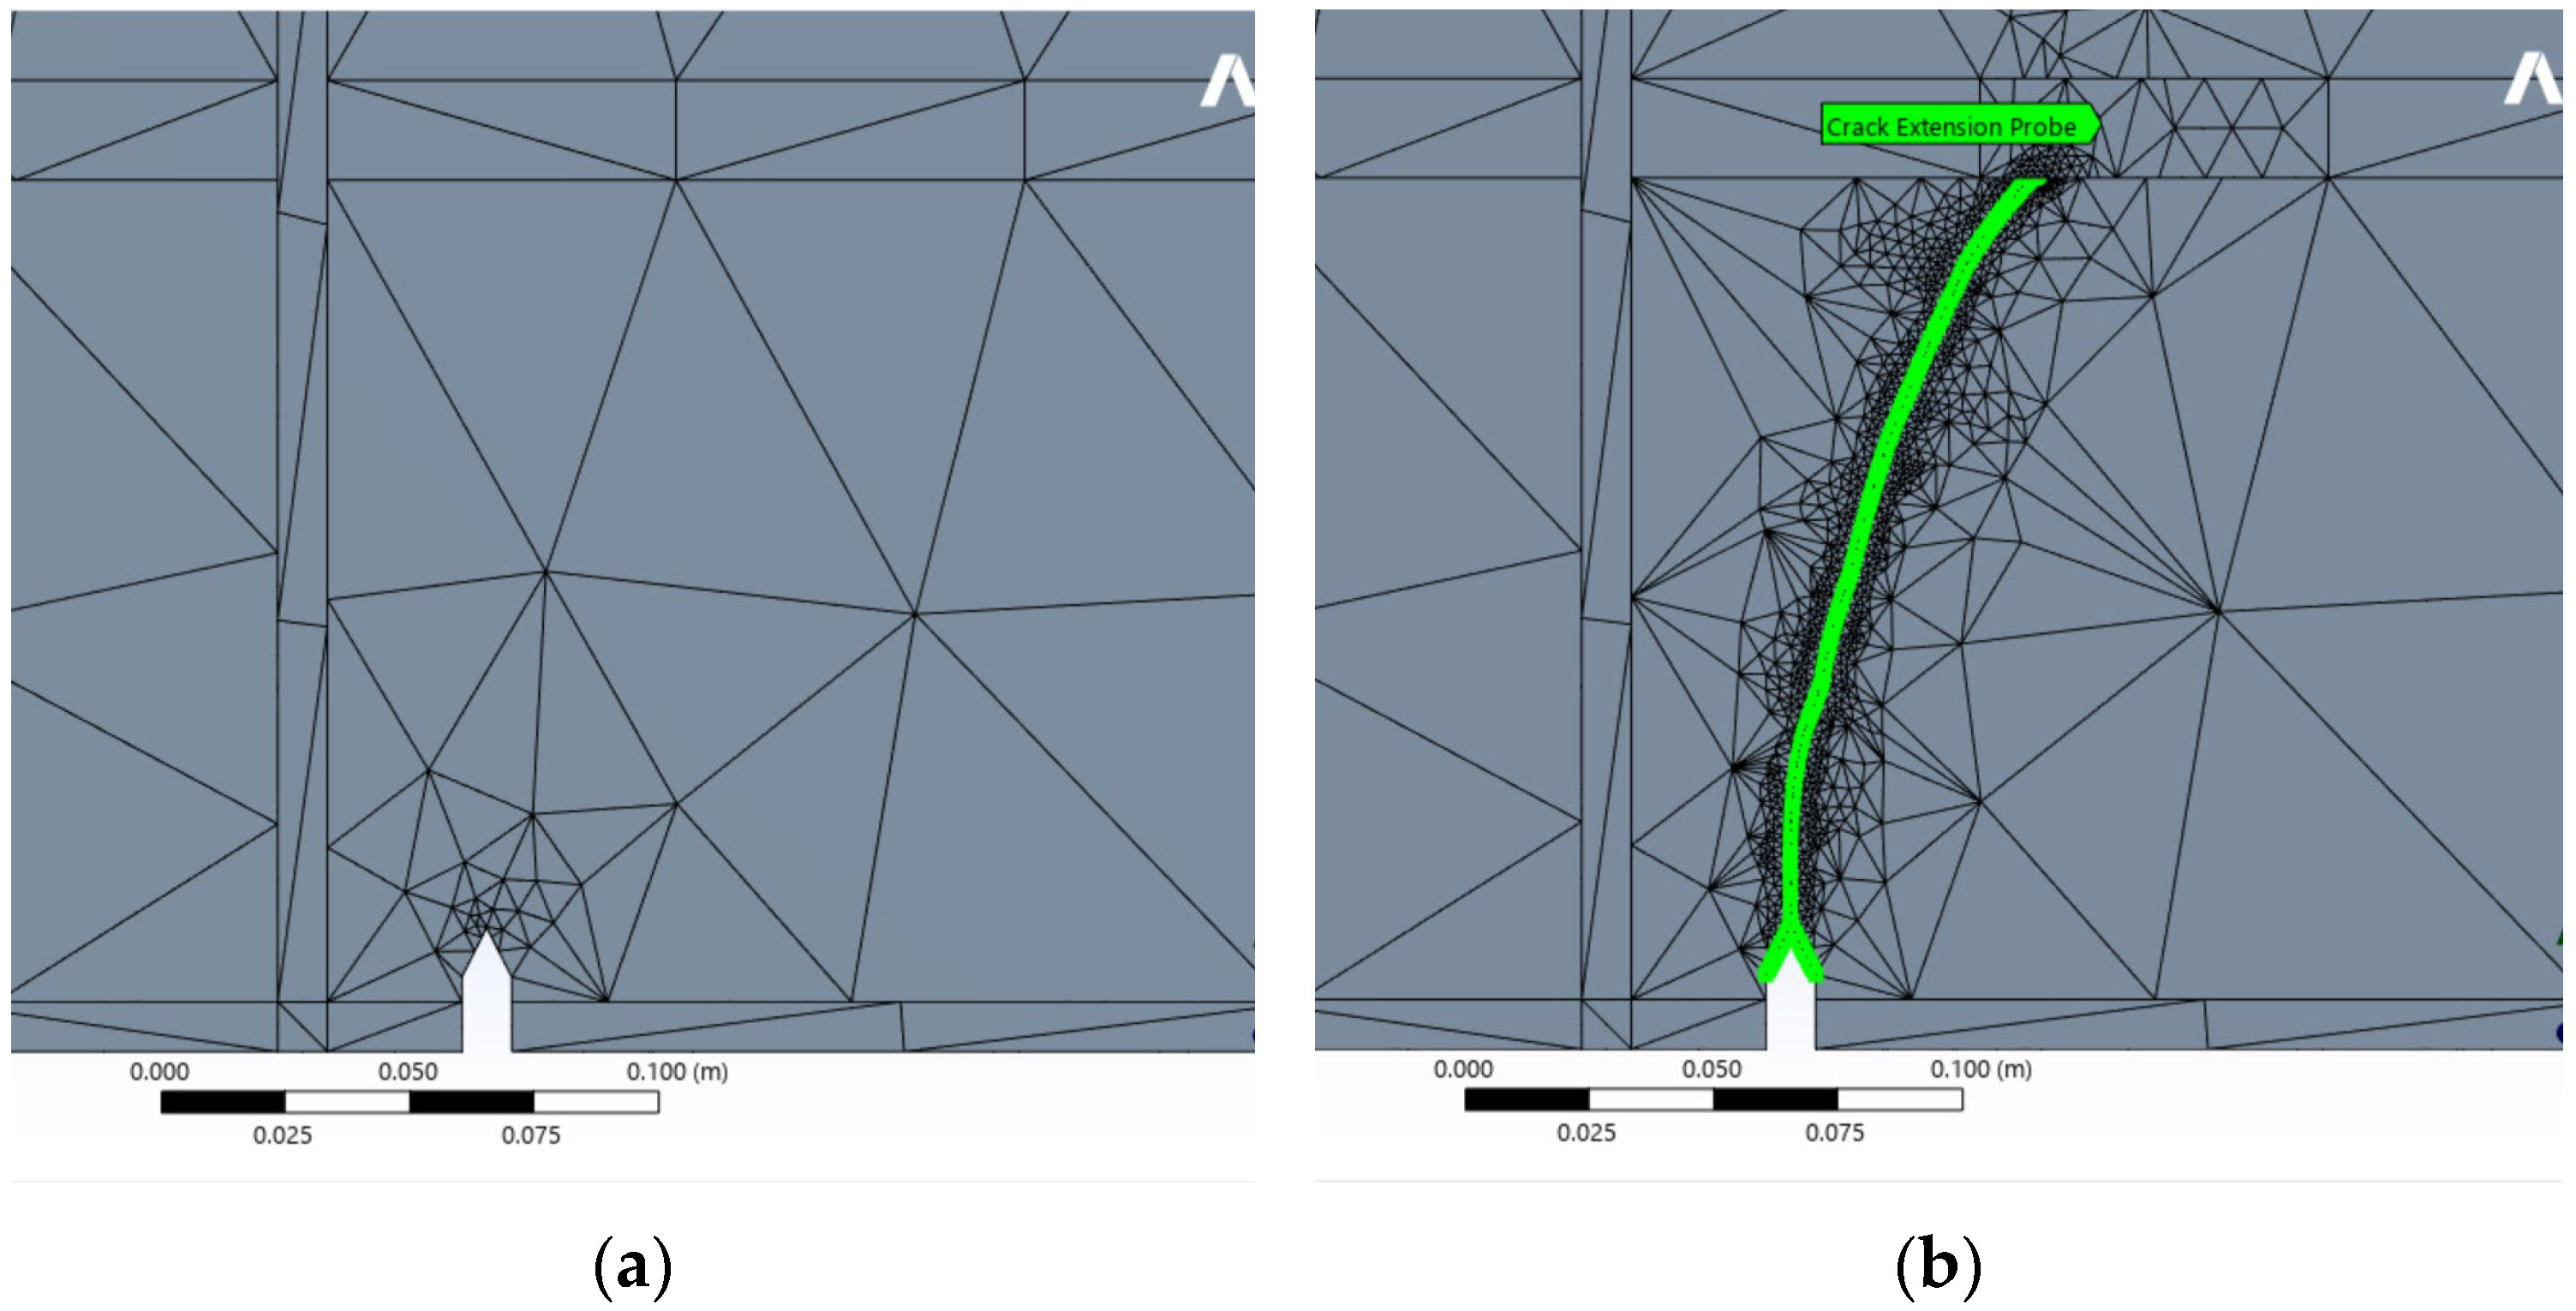
A displacement of 1 × 10⁻⁹ m is applied to the right end of the integral wing spar, and the resulting crack extension are obtained, as shown in Figure 8. The simulation results indicate that the surface crack propagates within the spar web domain under a locally determined growth direction governed by the maximum circumferential stress criterion.
Figure 8.
Crack propagation modeling: (a) initial crack geometry; (b) final crack propagation path.
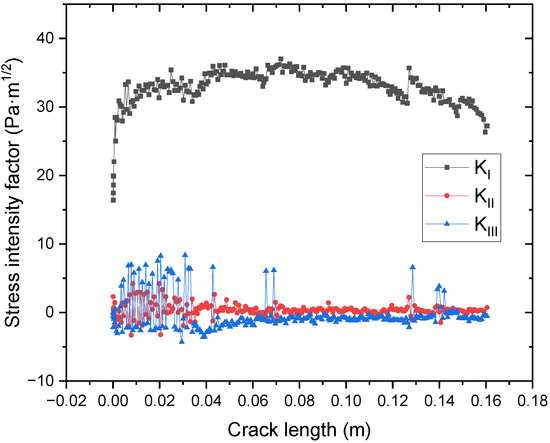
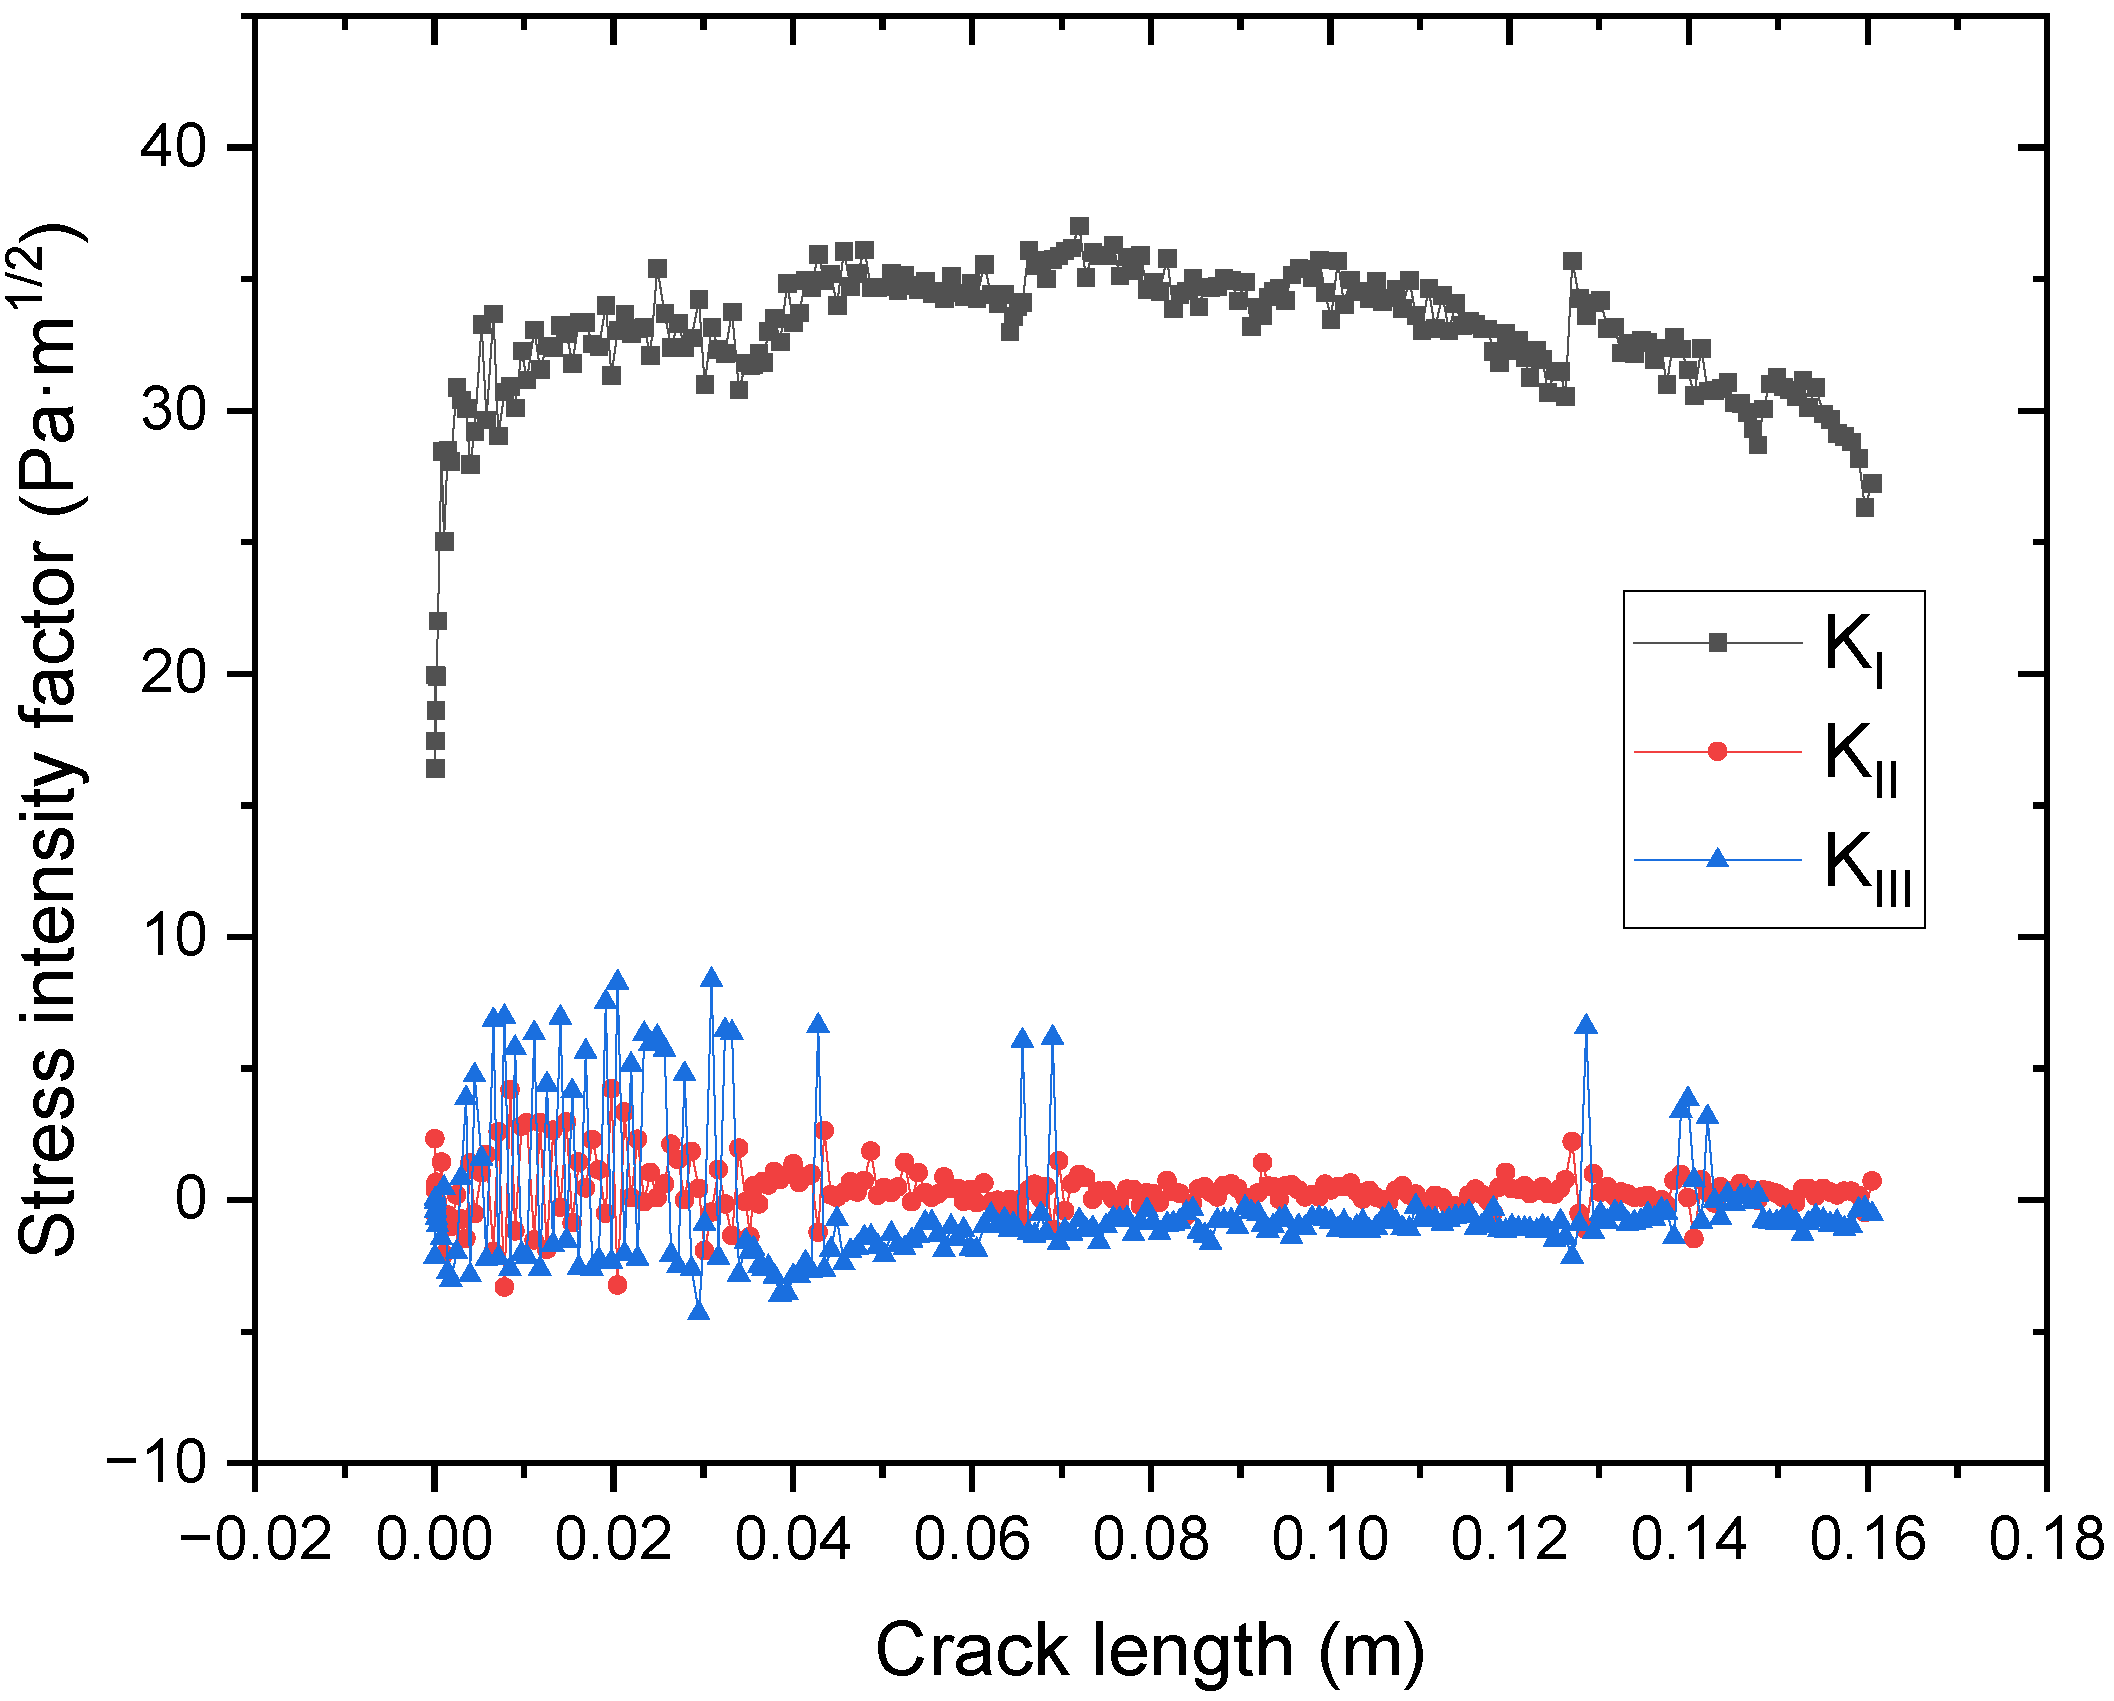
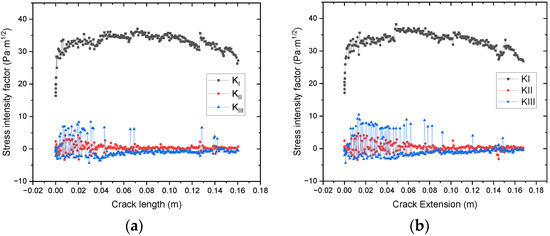
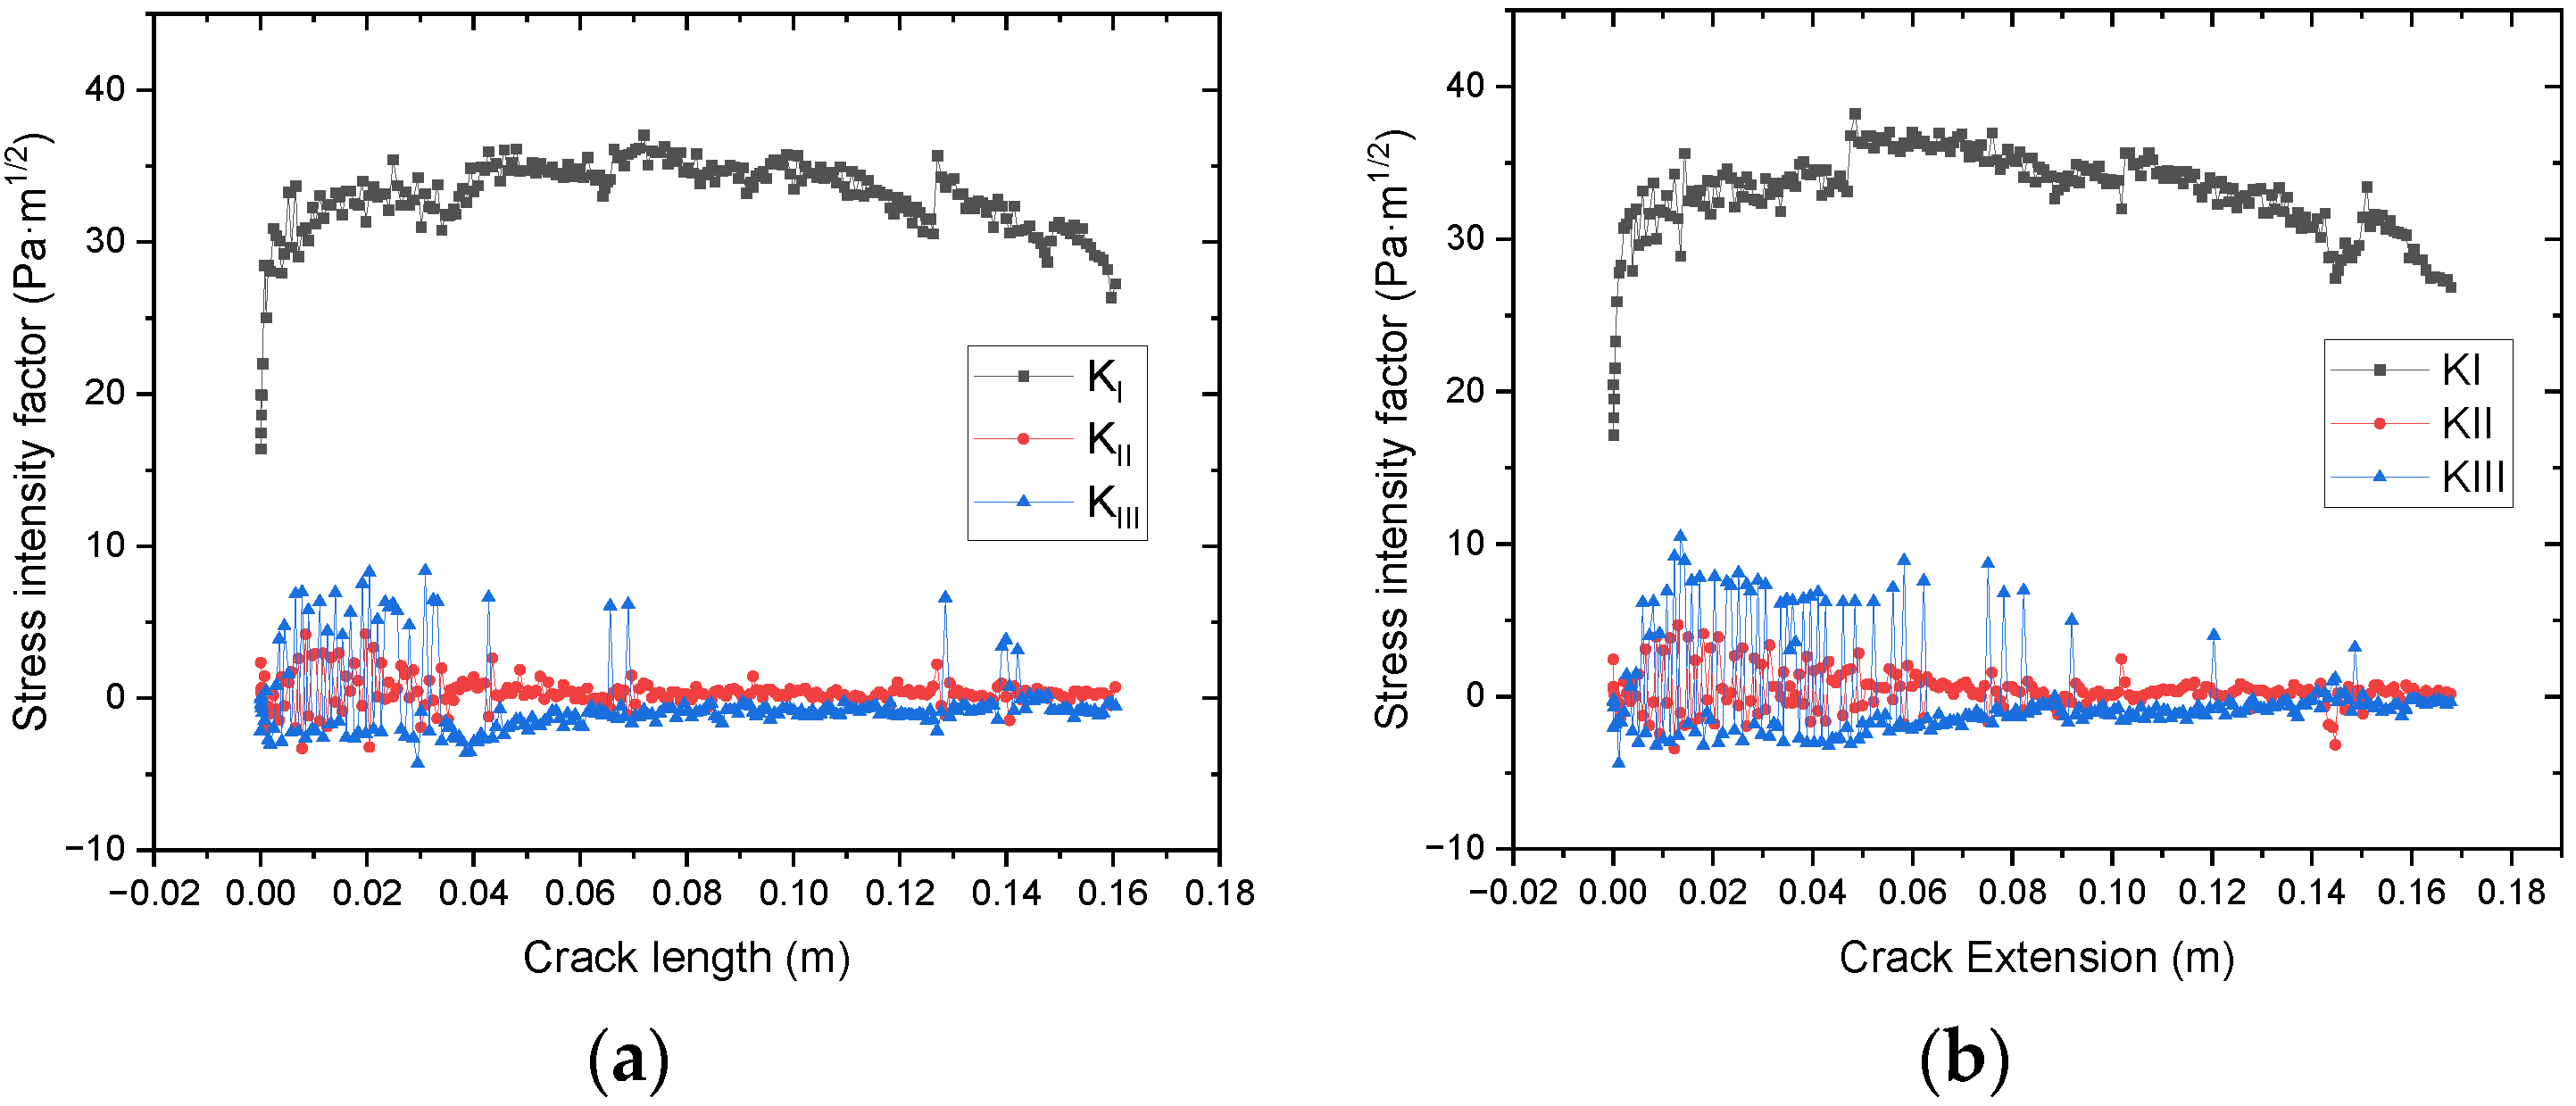
Extracting the SIF, the evolution of Mode I (KI), Mode II (KII), and Mode III (KIII) stress intensity factors during crack growth are established, as illustrated in Figure 9. The results reveal that the fracture process is overwhelmingly dominated by Mode I (Opening Mode) behavior. The Mode I stress intensity factor (KI) maintains a magnitude significantly higher than those of KII and KIII throughout the entire crack growth history. This confirms that the structural failure is primarily driven by tensile stresses normal to the crack plane. Three distinct phases can be identified in the KI evolution curve. Initially, at small crack lengths (a < 0.02 m), KI increases sharply from approximately 16 Pa·m1/2 to about 30 Pa·m1/2. This behavior corresponds to the release of local stress concentration near the initial crack front. Subsequently, between approximately 0.02 m and 0.12 m crack length, KI fluctuates within a relatively narrow band (≈32–36 Pa·m1/2). This indicates a quasi-stable crack-driving force regime, suggesting that the tear strap redistributes stresses and limits excessive amplification of the stress intensity factor during intermediate crack growth. Finally, beyond approximately 0.12 m, a gradual decrease in KI is observed. This reduction implies that structural stiffness redistribution and load transfer mechanisms associated with the tear strap reduce the crack-driving force, contributing to crack arrest capability. Additionally, KII and KIII remain close to zero for most crack lengths, with small oscillations near the early stage and around 0.14 m. These fluctuations are attributed to local mesh adjustment during SMART crack growth and do not significantly influence overall fracture behavior.
Figure 9.
Variation in SIF with crack length for tear strap scheme A.
3.2. Comparative Study of the Tear Strap Height-to-Thickness Ratio
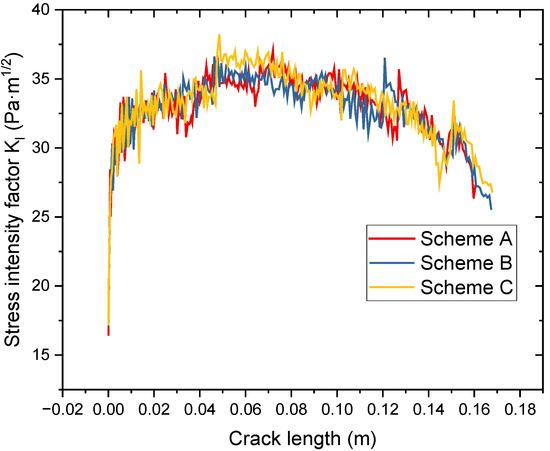
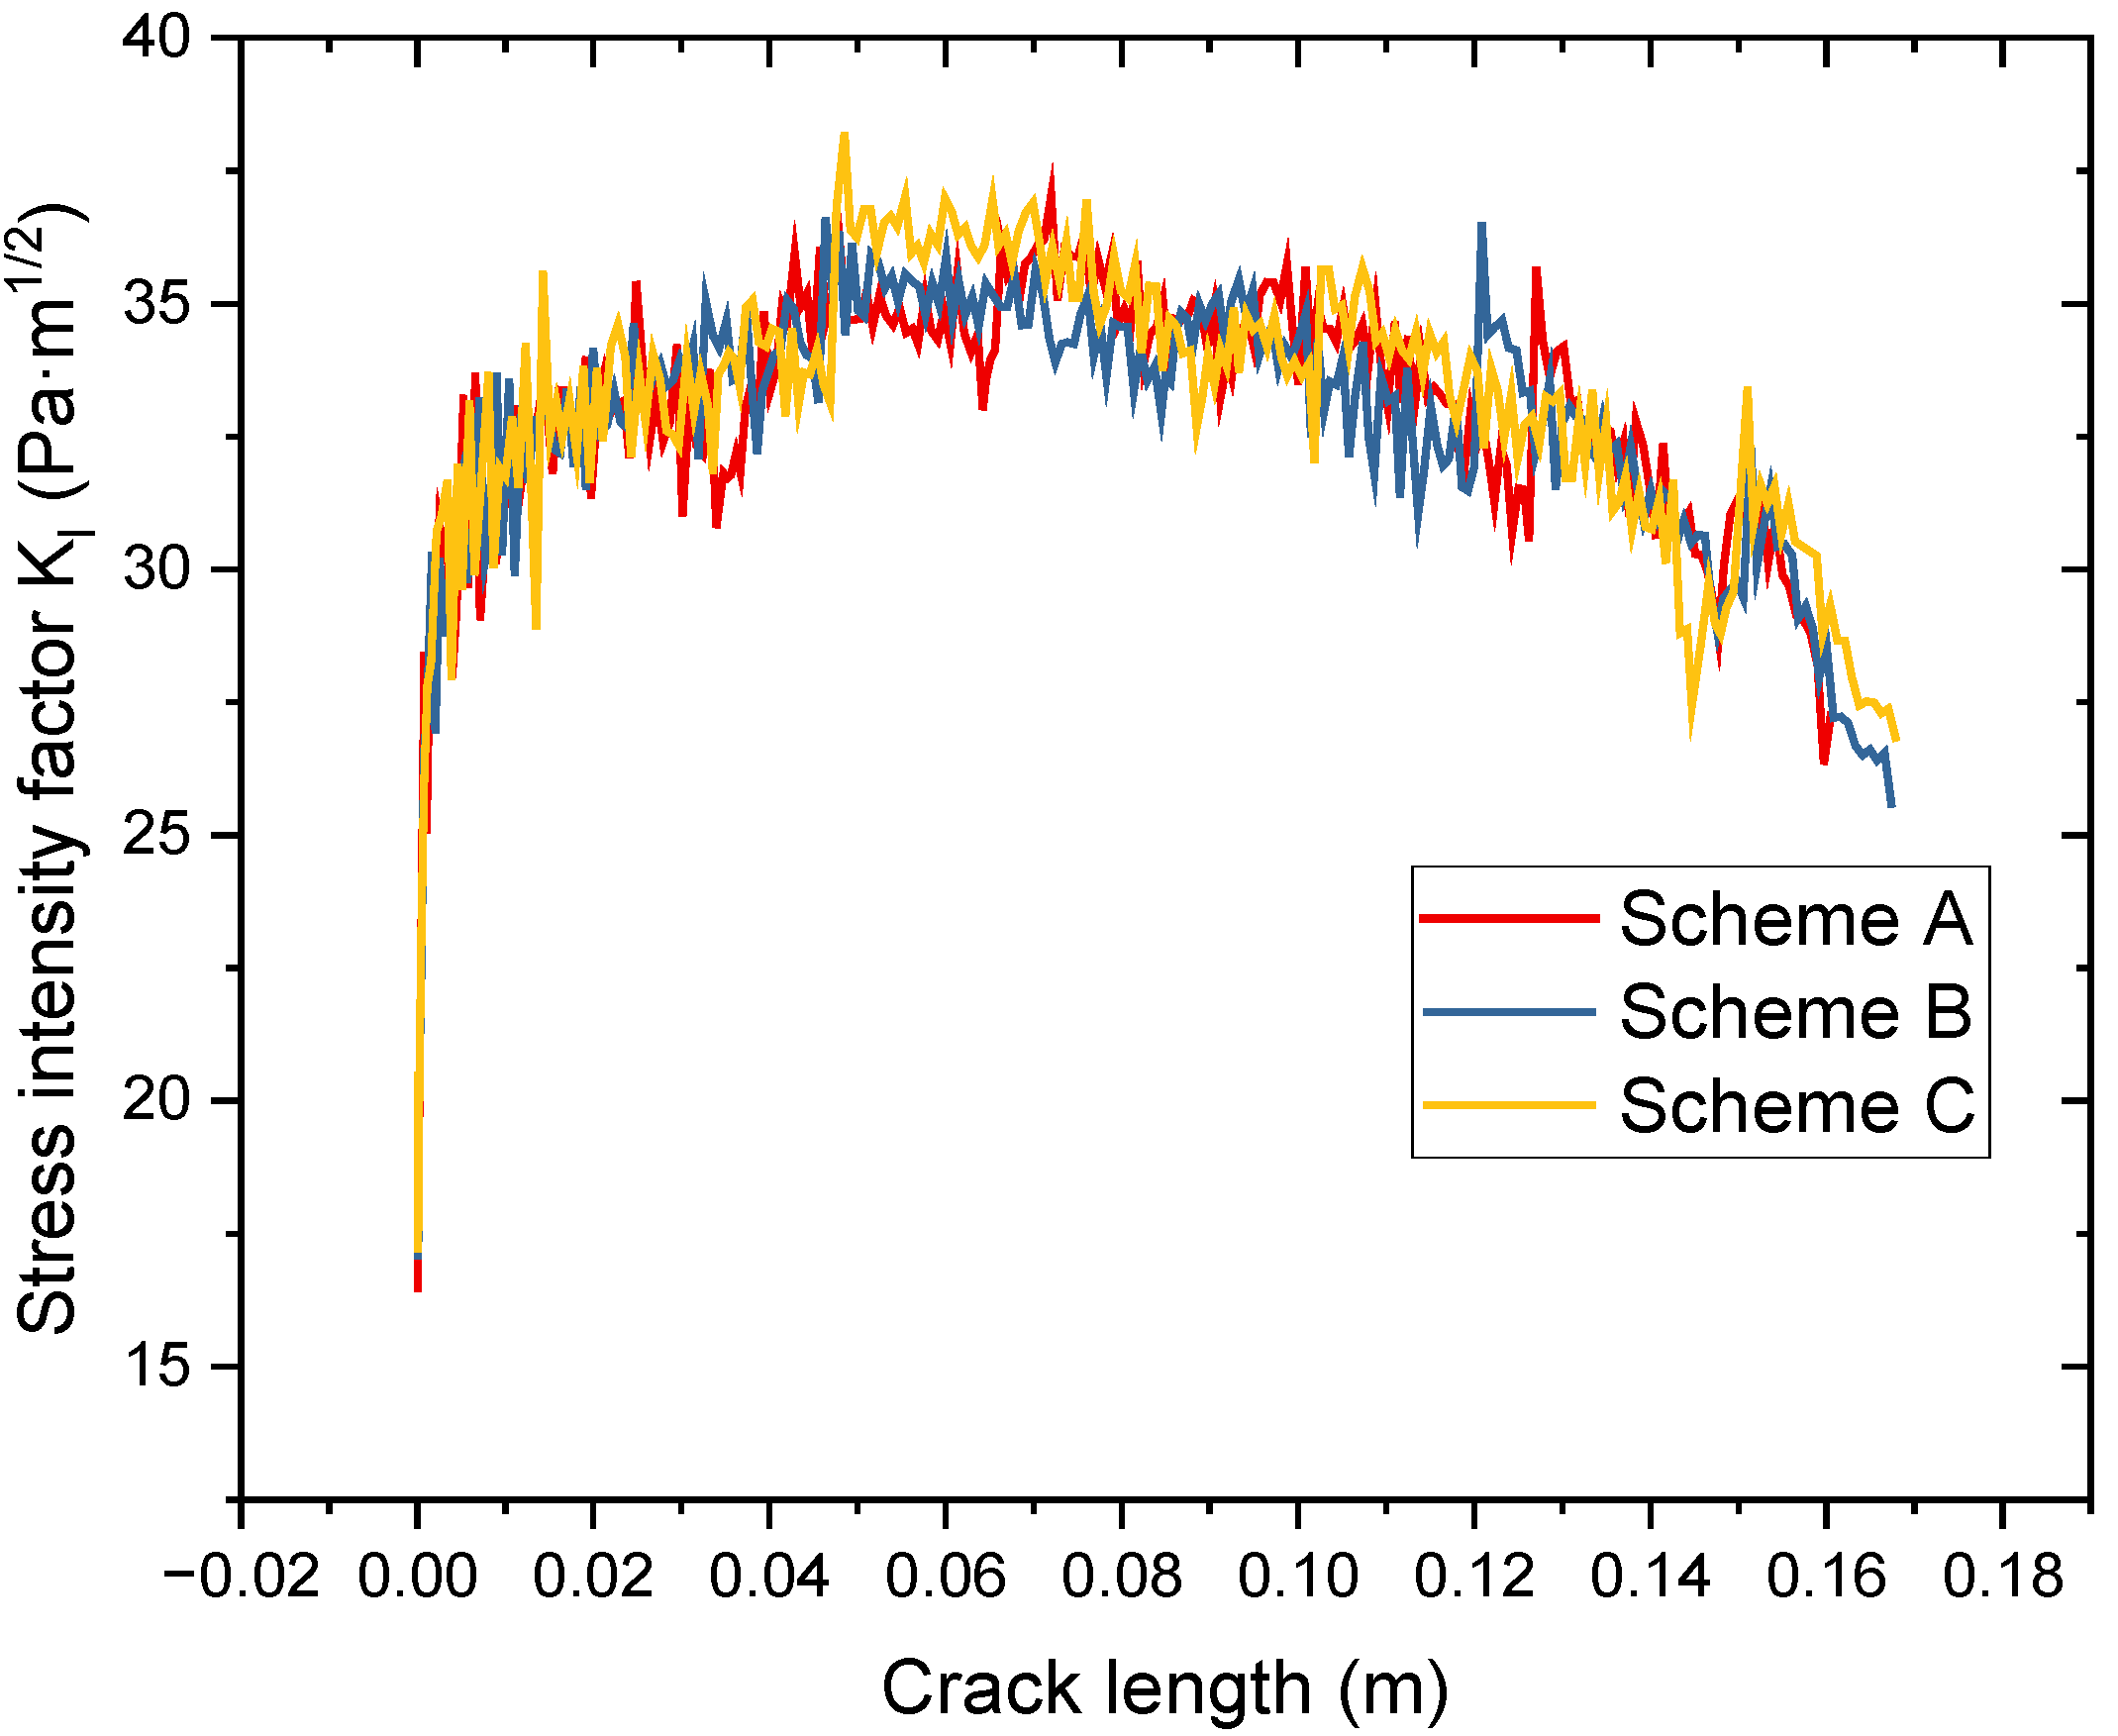
As shown in Figure 10, the three tear strap configurations with different height-to-thickness ratios (H/T) exhibit generally similar evolutionary trends of the Mode I stress intensity factor KI during crack propagation under equal-mass conditions.
Figure 10.
Effect of height-to-thickness ratio on KI.
In the early propagation stage (crack length m), all three schemes show a sharp increase in KI from the initial value to approximately 30 Pa·m1/2, accompanied by noticeable fluctuations. These oscillations are mainly associated with local stress redistribution and crack-front stabilization at the onset of crack growth. In this region, no consistent or systematic superiority among the three configurations can be identified.
During the intermediate propagation stage (approximately m < < m), the KI values of all schemes remain within a relatively narrow band of about 33–36 Pa·m1/2. Scheme C generally maintains slightly higher peak values in the range of 0.04–0.07 m, whereas Scheme A exhibits marginally lower KI values around 0.04–0.07 m. Nevertheless, the differences remain moderate, indicating that under the equal-mass constraint, modifying the H/T ratio alone does not significantly alter the global crack-driving force in the mid-propagation regime.
More distinguishable differences emerge in the later stage of crack growth ( m). Scheme A demonstrates a comparatively more pronounced reduction in KI beyond approximately 0.16 m, reaching lower terminal values than Schemes B and C. Scheme C, although exhibiting relatively higher KI in the earlier stages, shows a gradual decline with less abrupt fluctuation near the final propagation phase. Scheme A presents a sharper local drop followed by short-range oscillations before the final decrease.
These observations suggest that while the overall crack-driving force remains comparable across configurations under equal-mass conditions, the redistribution of structural stiffness and load-transfer efficiency in the tear strap region becomes increasingly influential as the crack fully interacts with the strap. In particular, the enhanced reduction of in Scheme A at larger crack lengths implies a more effective suppression of crack-driving force in the late propagation stage.
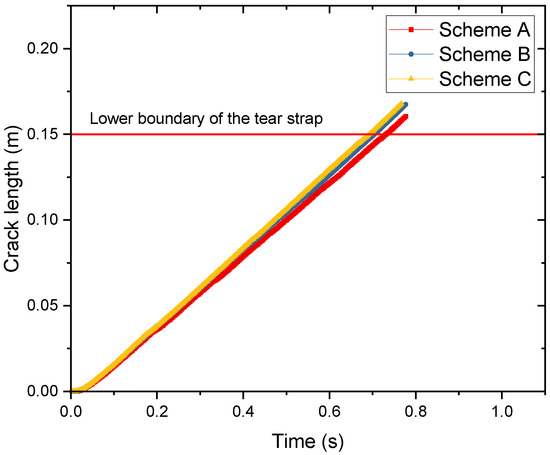
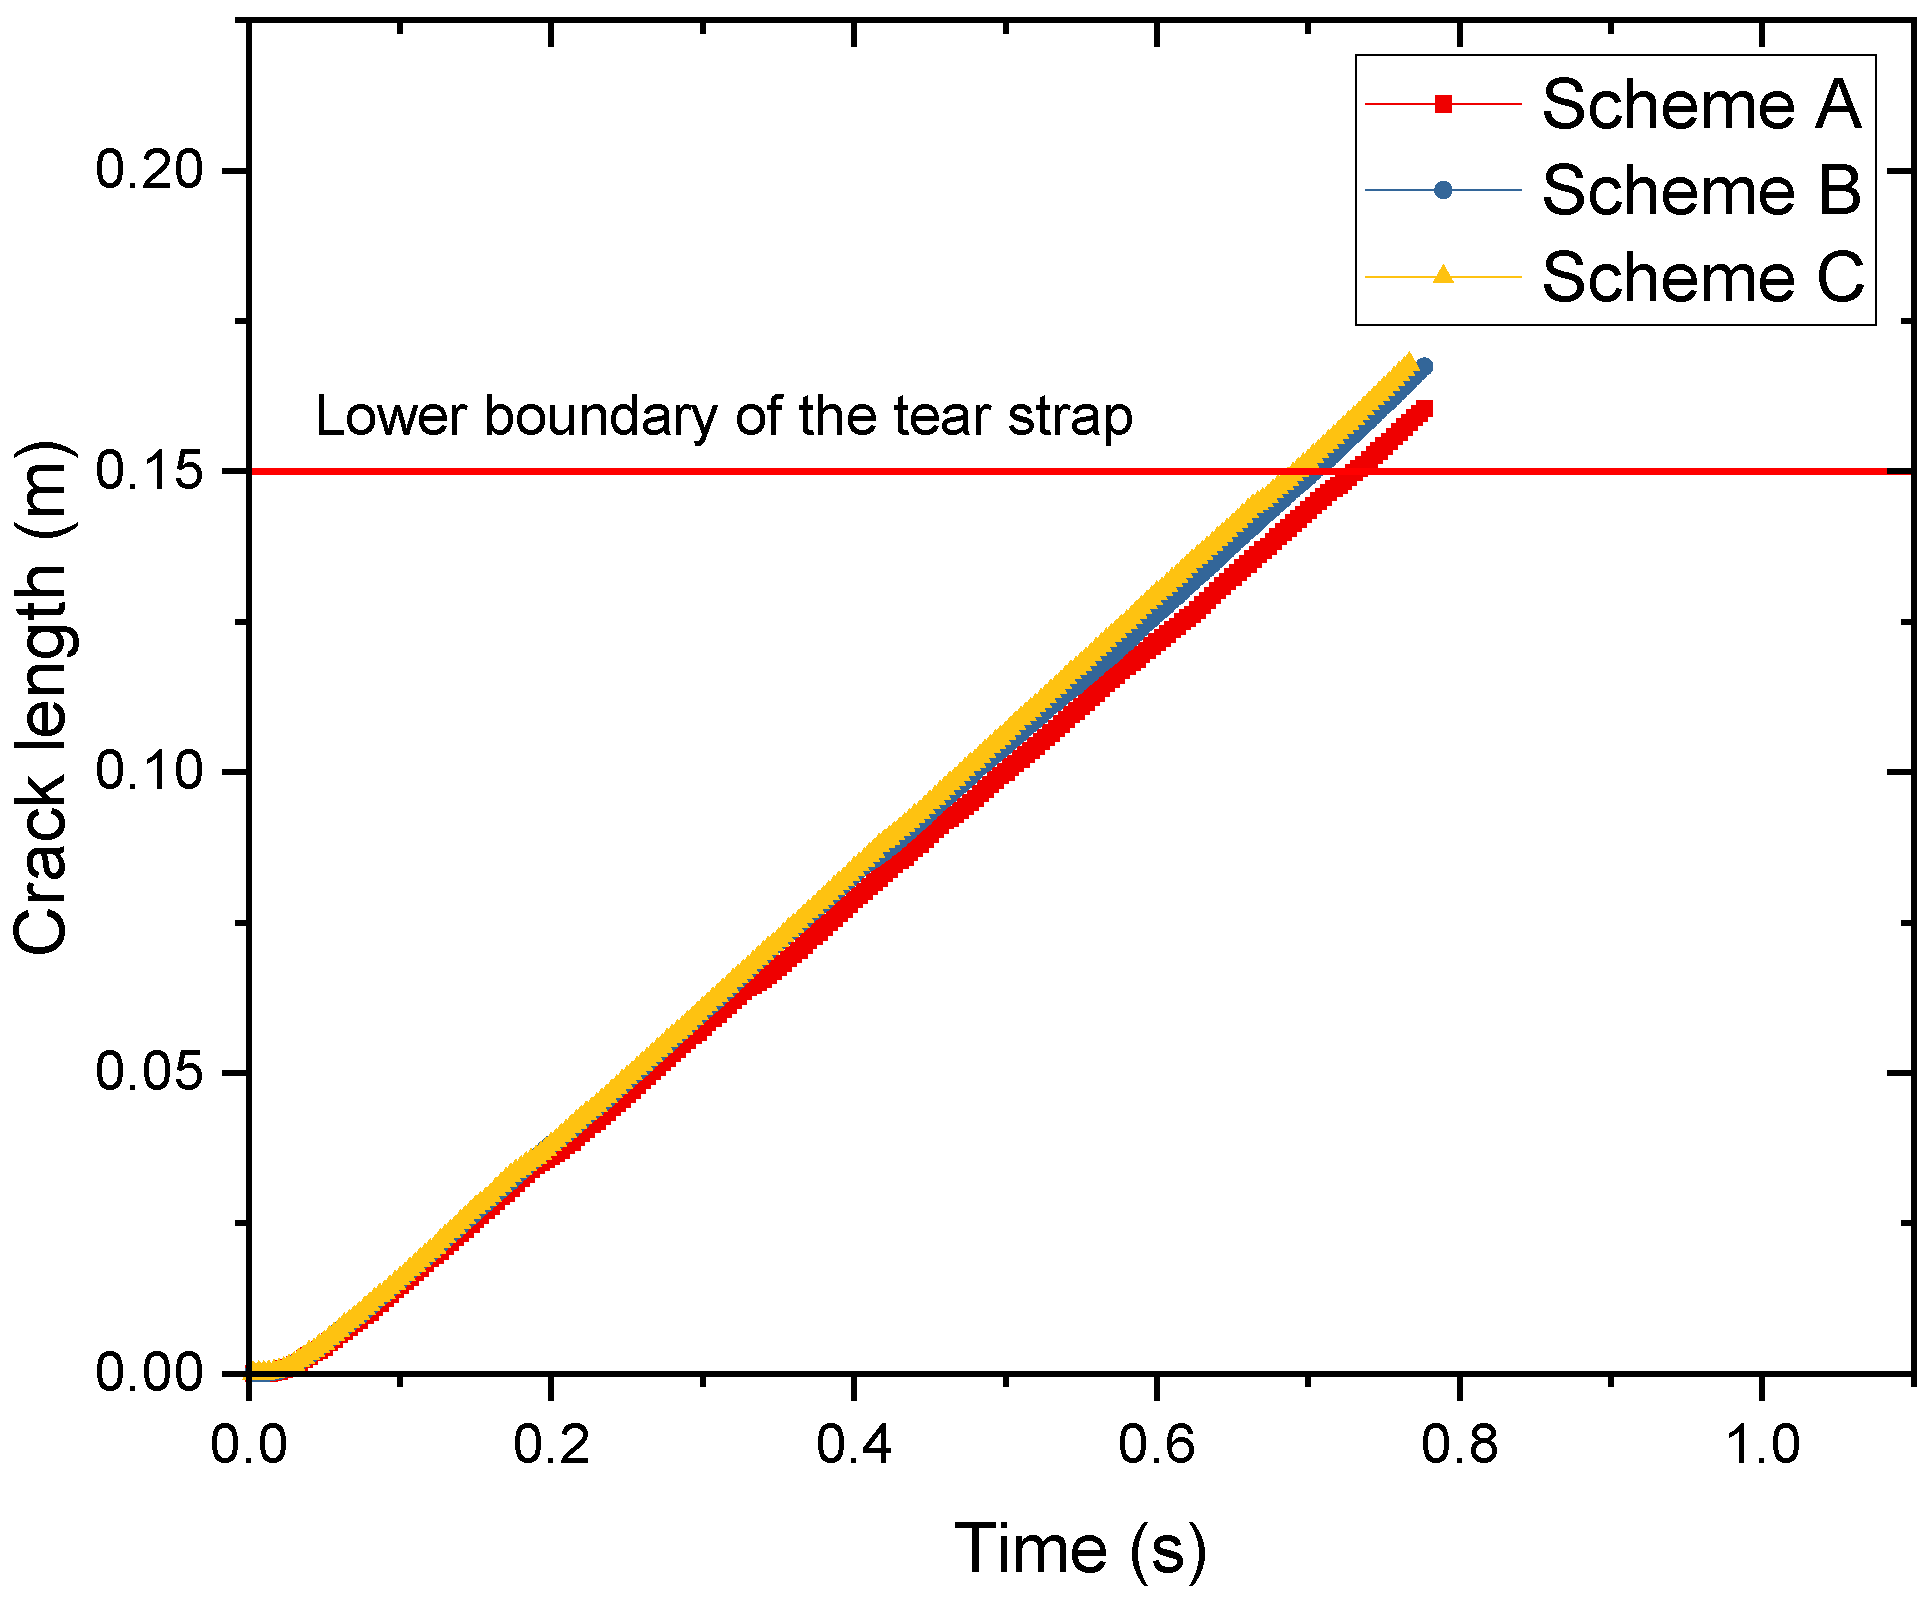
As shown in Figure 11, the crack length–time histories of the three tear strap configurations under equal-mass conditions exhibit similar overall trends but with clearly distinguishable propagation rates. The horizontal red line indicates the lower boundary of the tear strap at m, which serves as a reference position for evaluating the crack-arrest capability.
Figure 11.
Crack length–time histories of the three tear strap configurations.
In the initial stage (approximately s), the three curves nearly coincide, indicating that the onset of crack propagation is not significantly influenced by the variation in the height-to-thickness ratio (H/T). This suggests that the global stiffness distribution and the initial crack-driving force remain comparable among the three configurations at the early stage.
As crack growth proceeds, differences in propagation rate gradually emerge. Over the intermediate time range (approximately 0.2–0.7 s), Scheme C consistently exhibits the largest crack length at a given time, followed by Scheme B, while Scheme A maintains the smallest crack length throughout most of the propagation process. This ordering indicates that the average crack growth rate satisfies:
More importantly, the time required for the crack to reach the lower boundary of the tear strap (0.15 m) differs among the configurations. Scheme C reaches this boundary first, Scheme B follows, and Scheme A reaches it last. Therefore, Scheme A provides the most pronounced retardation effect on crack propagation, whereas Scheme C demonstrates the weakest crack-arrest performance under the equal-mass constraint.
These results indicate that although the overall magnitude of the stress intensity factor may remain within a comparable range (as shown previously), the geometric configuration of the tear strap significantly influences the temporal evolution of crack growth. In particular, Scheme A achieves a more effective redistribution of structural stiffness and load transfer during crack advance, thereby reducing the effective crack propagation rate and enhancing the crack-arrest capability.
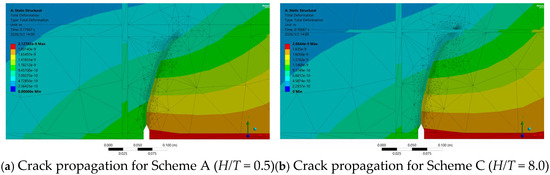
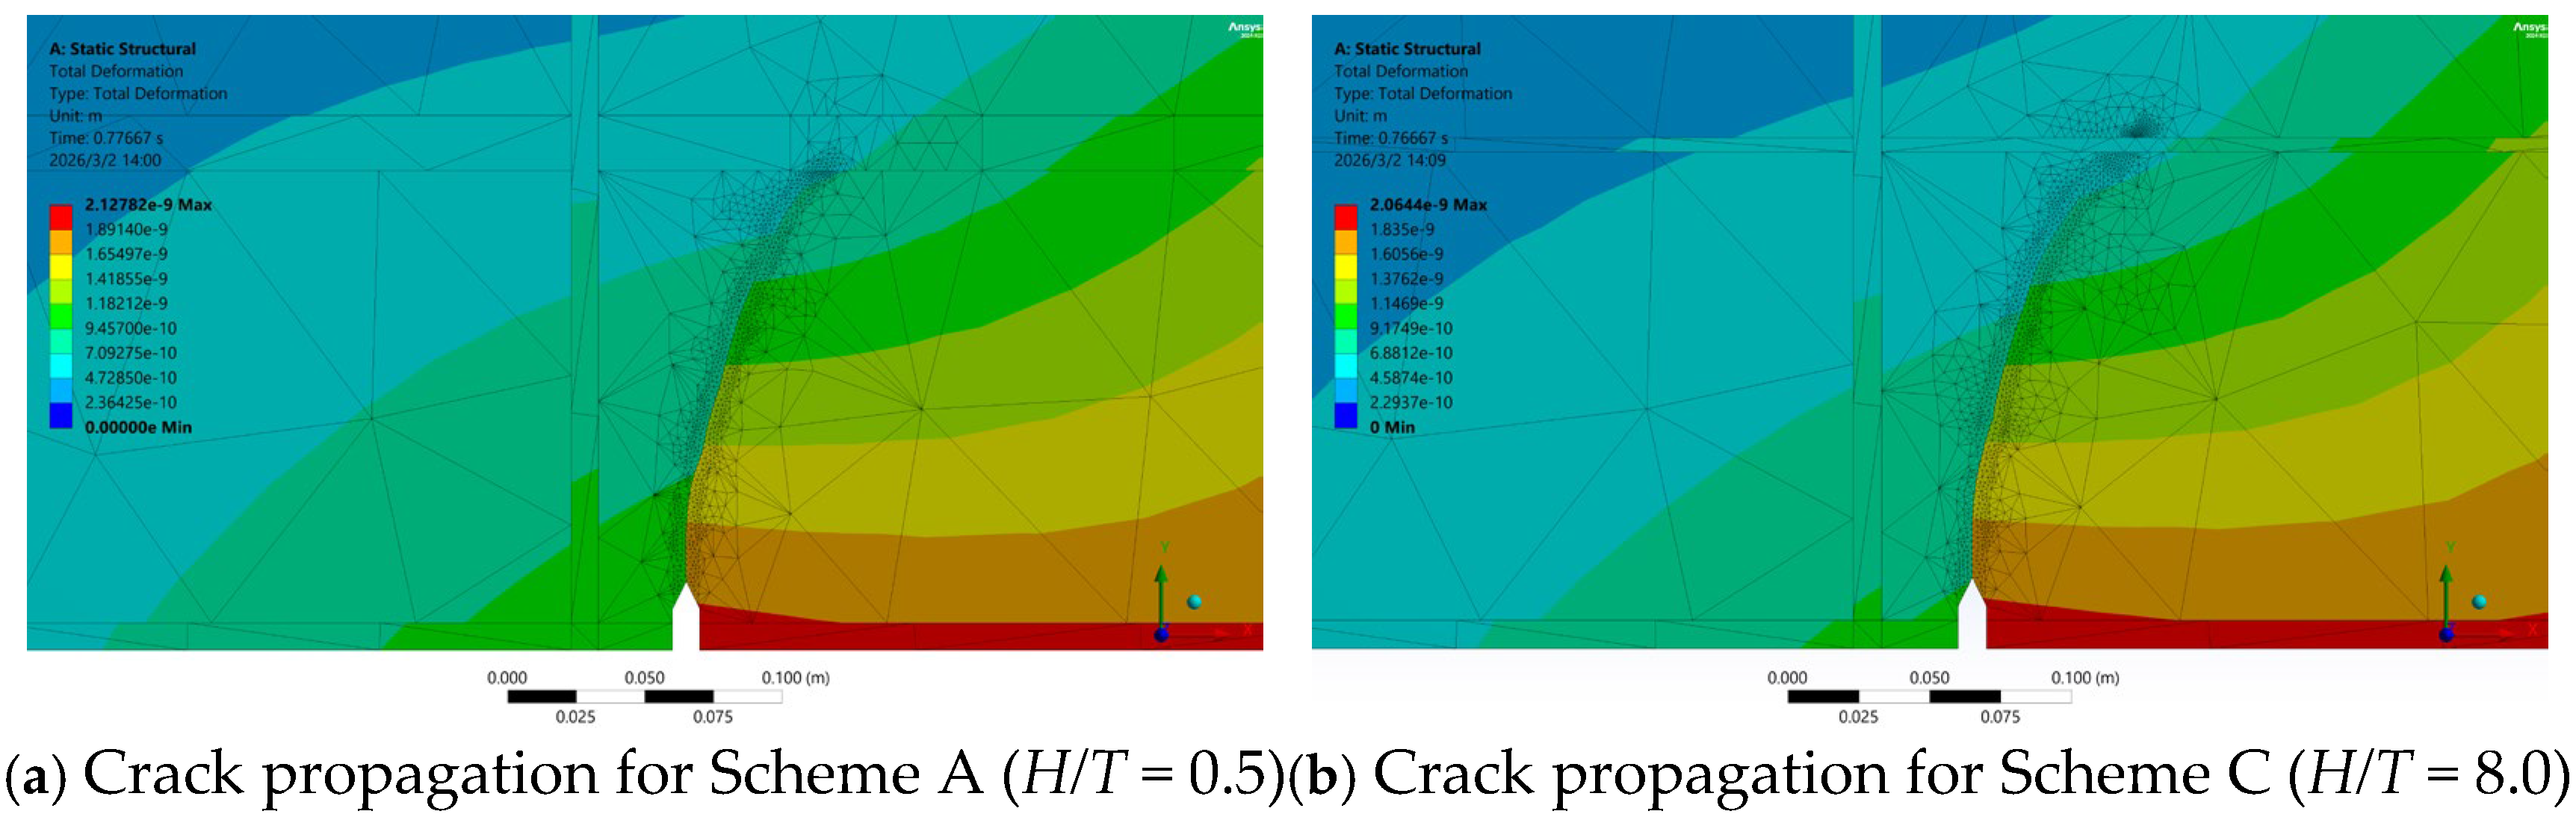
As illustrated in Figure 12, the total deformation contours of Schemes A and C are compared under identical loading conditions. The overall crack trajectories appear similar in both configurations, exhibiting comparable curvature as the crack approaches the tear strap. However, a notable difference is observed in the propagation stage corresponding to the presented time instants. For Scheme A, the deformation contour corresponds to s, at which the crack has just reached the tear strap. In contrast, the contour for Scheme C is shown at an earlier time s, yet the crack has already propagated beyond the tear strap. This indicates that crack penetration through the tear strap occurs earlier in Scheme C, whereas Scheme A delays the crack progression.
Figure 12.
Comparison of crack propagation behavior between tear strap Schemes A and C.
Overall, although the macroscopic crack paths appear visually similar, the temporal difference in crack penetration suggests that Scheme A provides a stronger resistance to crack advance across the tear strap.
The evolution of stress intensity factors (SIFs) along the crack front was analyzed for tear strap Scheme A and C in Figure 13. The evolution of KII and KIII offers further insight into crack deflection and mixed-mode fracture characteristics. Although KI remains the dominant driving force, in Scheme A, KII and KIII exhibited significant fluctuations with peaks reaching nearly 10 Pa·m1/2 as the crack front advanced. The increase in these secondary SIFs indicates local shear lag effects and a shift in the principal stress direction caused by the stiffened reinforcement, providing the mechanical impetus for observed crack deflection. In contrast, in Scheme C, while KII and KIII still fluctuate, their impact is less pronounced relative to the higher KI levels. The complex three-dimensional stress state along the crack front in Scheme A causes slight out-of-plane twisting of the crack surface, further dissipating energy and slowing crack growth. These results indicate that the tear strap geometry with a lower H/T ratio not only reduces the opening-mode (KI) magnitude but also actively promotes a mixed-mode stress state, thereby enhancing the crack-arrest capability of the structure.
Figure 13.
Comparison of SIFS behavior between tear strap Schemes A and C: (a) SIFS vs. crack length of tear strap Schemes A; (b) SIFS vs. crack length of tear strap Schemes C.
3.3. Fatigue Life Prediction
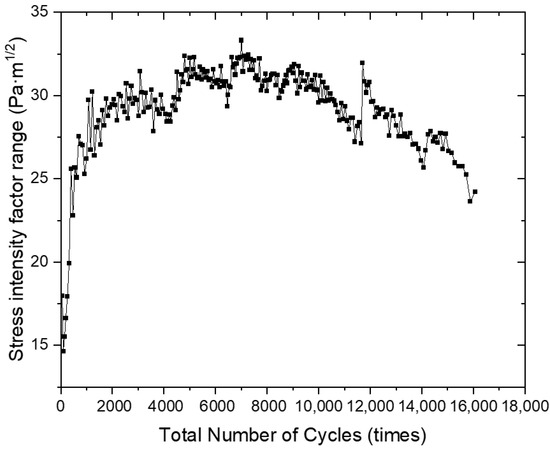
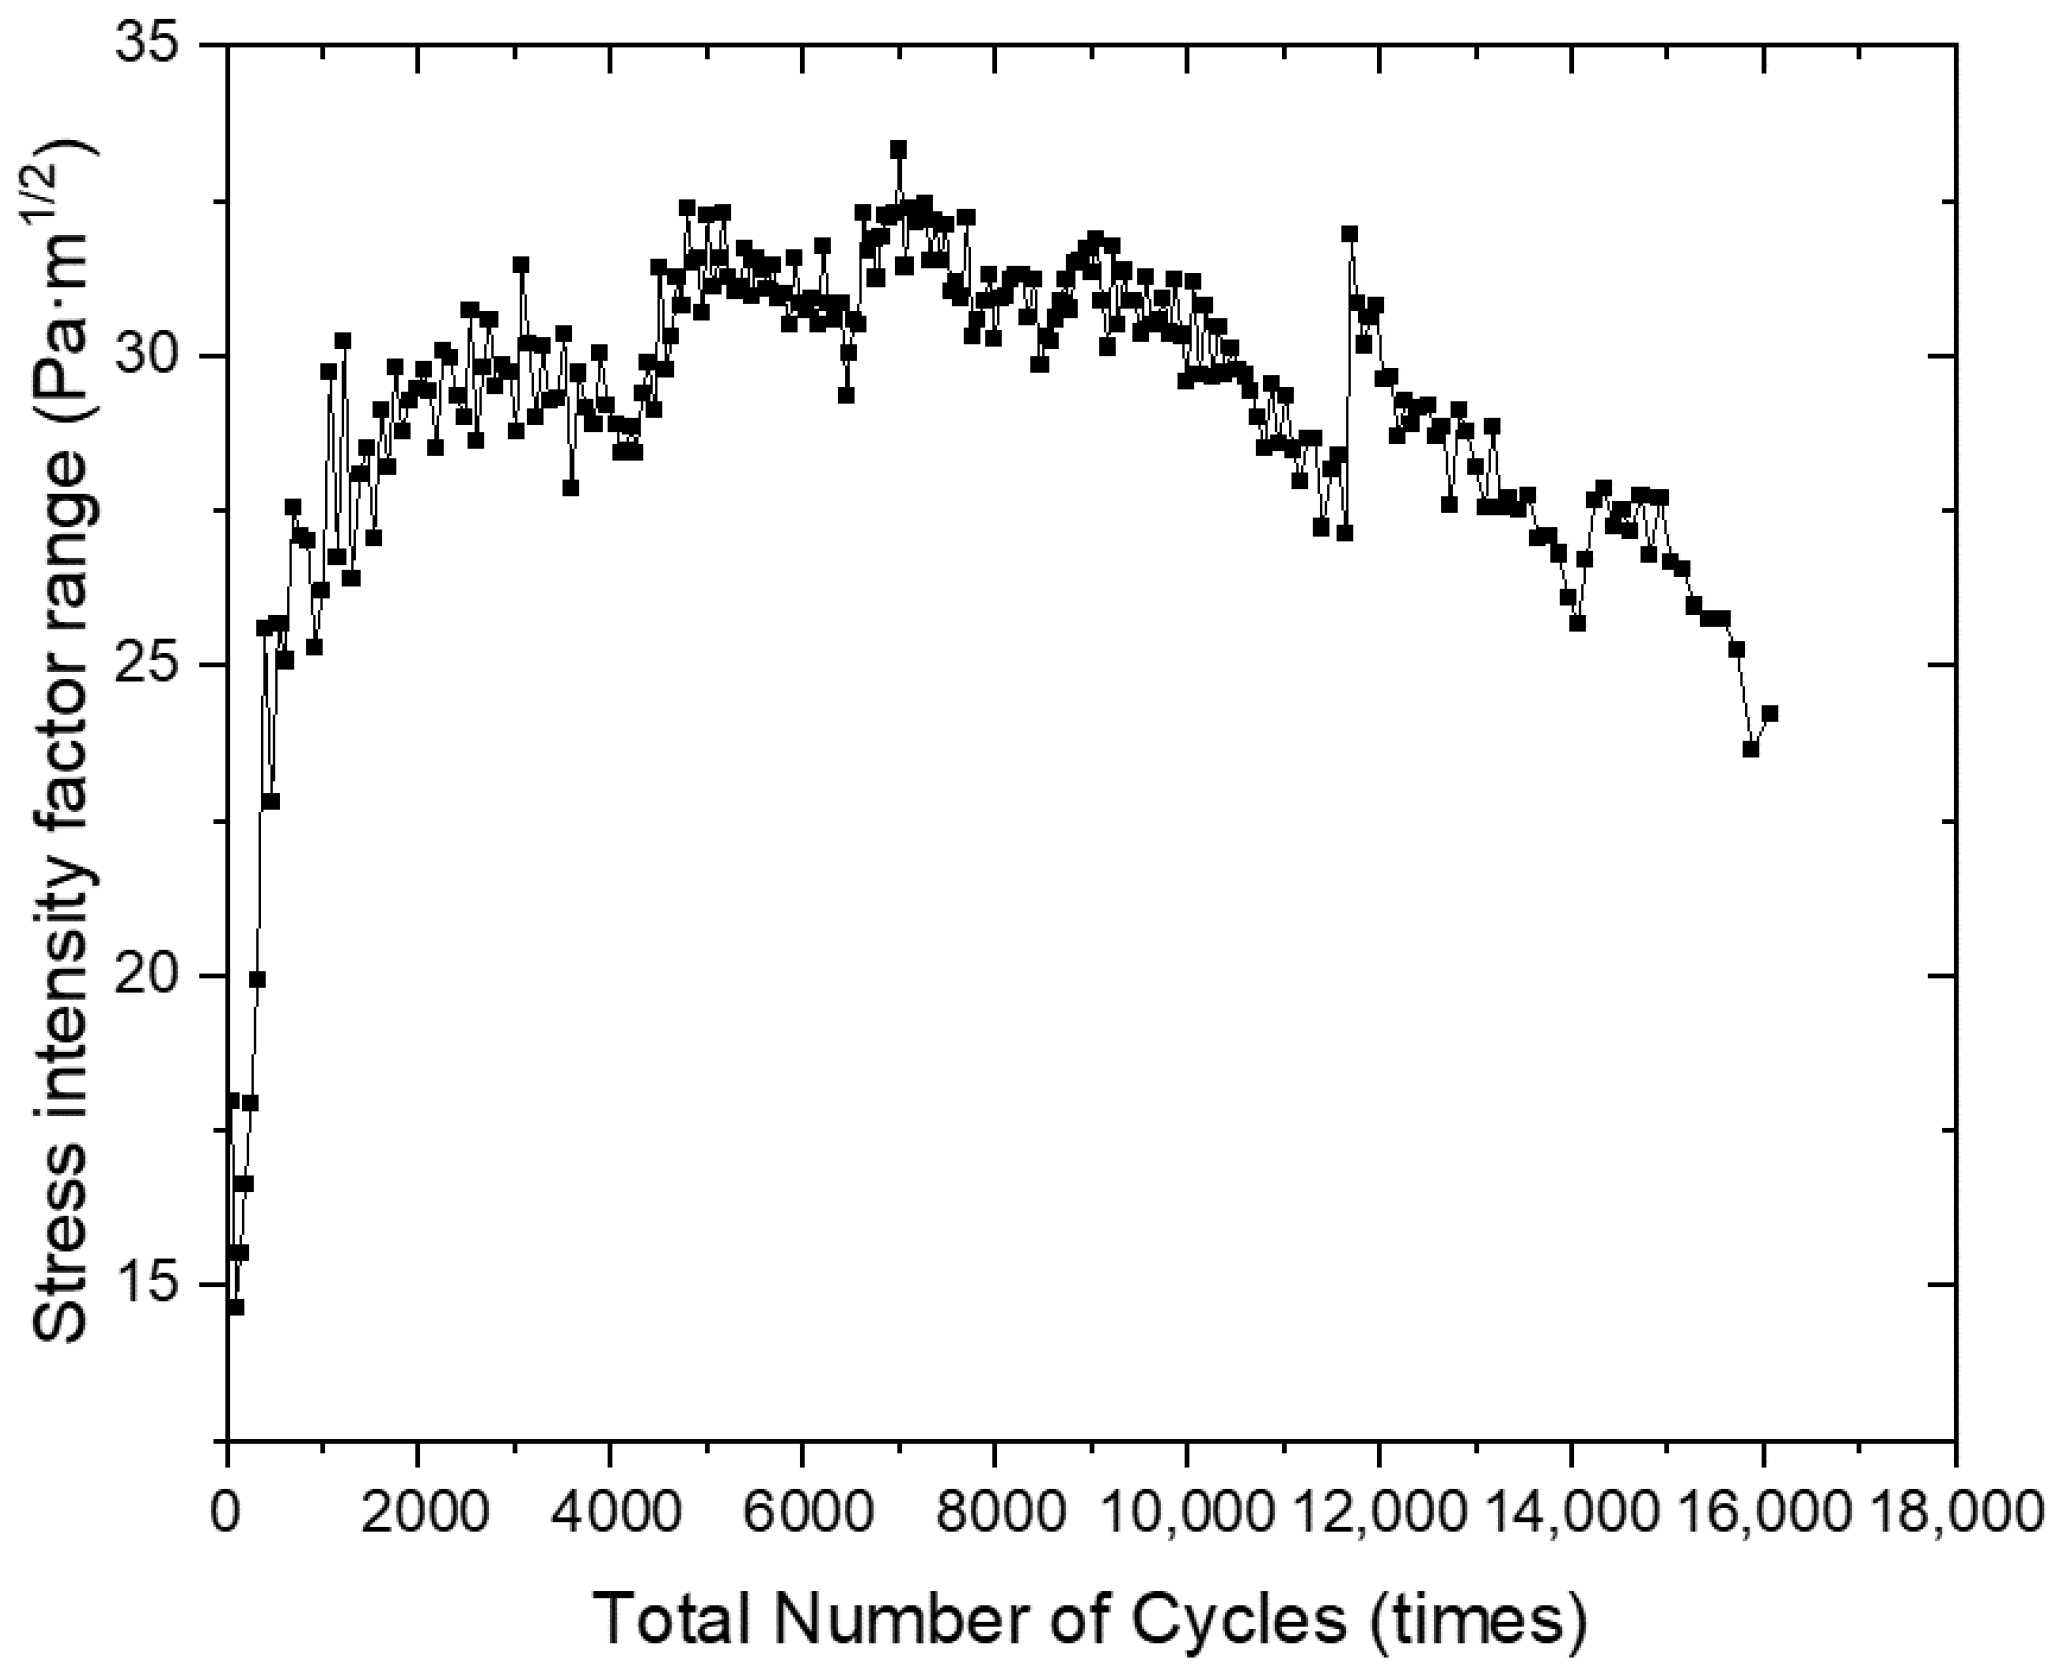
To evaluate the long-term structural integrity of the component under cyclic loading, a fatigue crack growth simulation was performed using the SMART adaptive remeshing technology. The analysis aims to quantify the relationship between the stress intensity factor (SIF) range, the crack length, and the total number of service cycles, providing a numerical basis for fatigue life prediction. The stress intensity factor range (ΔK) is the primary driver for fatigue crack propagation. As shown in Figure 14, initial acceleration phase is the first 500 cycles, the ΔK increases sharply from approximately 15 Pa·m1/2 to over 25 Pa·m1/2. This represents the crack’s rapid transition from its initial notch state into a stable propagation regime. Beyond 1000 cycles is stable fluctuation plateau. The ΔK value maintains a relatively stable level within the range of 27–33 Pa·m1/2.
Figure 14.
Stress intensity factor range vs. total number of cycles.
The high-frequency oscillations observed in the SIF curve are attributed to the continuous updates of the crack-front mesh topology required by the SMART algorithm to maintain element quality during propagation. Similar to the static analysis, the Mode I component (KI) remains the dominant contributor to the total energy release rate, as its magnitude (peaking near 35 Pa·m1/2) significantly exceeds the negligible values of KII and KIII shown in the propagation history. This confirms that the fatigue failure is primarily driven by opening-mode tensile stresses.
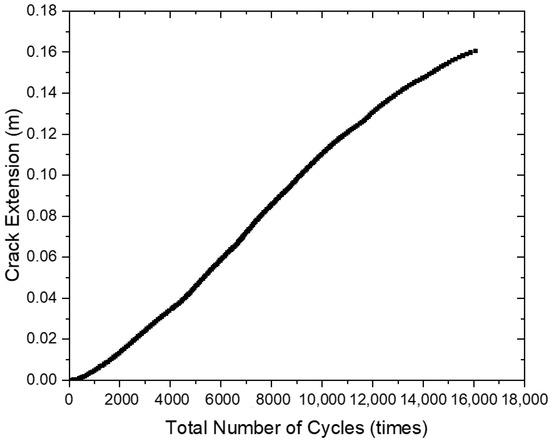
The crack length (a) versus the number of cycles (N) is shown in Figure 15. This a-N curve provides a direct visualization of fatigue life: The curve exhibits a remarkably linear progression, indicating a constant crack growth rate (da/dN) throughout the majority of the simulation. The absence of an exponential “upward curl” (which would signify imminent catastrophic failure) suggests that the current structural design—including the crack arrester—successfully prevents the crack from entering a runaway state. Under the prescribed cyclic displacement, the crack extends from 0 m to 0.140 m over a total of approximately 5800 cycles. This value serves as the predicted fatigue life threshold for the component under these specific loading conditions.
Figure 15.
Crack extension vs. total number of cycles.
3.4. Discussion of Damage-Tolerance Behavior of Integral Wing Spars
The numerical and theoretical results indicate that the incorporation of tear straps markedly modifies the crack propagation of integral wing spars under displacement-controlled loading. Once a crack initiates in the spar structure, the presence of tear straps alters the local stress redistribution around the crack front, effectively reducing the crack driving force and preventing rapid unstable crack growth. This behavior enables the structure to sustain prescribed loading conditions without immediate failure, highlighting the role of tear straps in enhancing residual strength and delaying damage evolution. From a damage-tolerance perspective, the results suggest that integral crack-arrest features provide an effective structural safeguard against catastrophic crack propagation, thereby contributing to improved safety and service life of integral wing spars.
Analysis of the stress intensity factors further reveals that crack propagation in the spar web region is predominantly governed by Mode I. When the crack front is located within the web, the crack plane remains nearly perpendicular to the principal tensile stress direction, leading to the dominance of the Mode I stress intensity factor. As the crack approaches the interface between the spar web and the tear strap, variations in the relative contributions of different fracture modes are observed, reflecting changes in the local stress state induced by geometric discontinuities. These trends indicate that the interaction between the crack and the tear strap significantly influences the crack-front loading conditions, which may be exploited in structural design to achieve targeted stress redistribution and local strength enhancement.
Parametric investigation demonstrates that the geometric configuration of tear straps, particularly the height-to-thickness ratio, exerts a discernible but limited influence on crack-arrest performance under equal-mass conditions. Tear straps with smaller height-to-thickness ratios, corresponding to increased thickness, exhibit a slightly improved capability to reduce the Mode I stress intensity factor in the spar web, thereby providing a marginal enhancement in crack propagation resistance. Conversely, as the height-to-thickness ratio increases and the straps become thinner, a minor reduction in crack-arrest effectiveness is observed. These findings suggest that, while the overall impact is not dominant, a lower H/T ratio aligns with a more favorable design trend for optimizing the crack-arrest capability of integral wing spars under fixed mass constraints.
4. Conclusions
All simulations and fatigue life assessments in this paper were conducted under displacement-controlled loading conditions to ensure numerical stability and consistent boundary constraints. The results demonstrate that the geometric configuration of the tear strap influences crack propagation behavior. Among the investigated cases, the configuration with a low H/T ratio (H/T = 0.5) exhibited the most effective crack-arrest capability by reducing the opening-mode stress intensity factor and promoting mixed-mode stress redistribution. This design was therefore identified as the most optimal configuration within the investigated parameter range.
Fatigue life predictions were performed using Paris’ law parameters obtained from published literature. Since the material constants C and m directly govern crack growth rates, uncertainties in these parameters may affect the quantitative fatigue life estimation. Although a detailed sensitivity analysis was beyond the scope of the present study, accurate experimental characterization of fatigue crack growth properties is essential to further improve prediction reliability.
Overall, the findings provide quantitative guidance for the damage-tolerant design of stiffened integral wing beams. Future work will extend the present framework to stress-controlled and variable-amplitude fatigue loading conditions, as well as to broader material systems and full-scale aircraft structural components, thereby enhancing the engineering applicability of the proposed crack-arrest strategy.
Author Contributions
Conceptualization, methodology, and validation, W.L.; H.H.; formal analysis, investigation, data curation, and writing—original draft preparation, H.H.; writing—review and editing, H.H.; supervision, W.L. All authors have read and agreed to the published version of the manuscript.
Funding
This research received no external funding.
Institutional Review Board Statement
Not applicable.
Informed Consent Statement
Not applicable.
Data Availability Statement
Data will be made available on request.
Conflicts of Interest
The authors declare no conflicts of interest.
Abbreviations
The following abbreviations are used in this manuscript:
| SIF | Stress Intensity Factor |
| LEFM | Linear Elastic Fracture Mechanics |
| XFEM | Extended Finite Element Method |
| AM | Additively Manufactured |
| FE | Finite Element |
| SMART | Separating, Morphing, and Adaptive Remeshing Technology |
| H/T | Height-to-Thickness ratio |
| KI, KII, KIII | Mode I, Mode II, Mode III Stress Intensity Factors |
| CTOD | Crack Tip Opening Displacement |
References
- Bergara, A.; Dorado, J.I.; Martín-Meizoso, A.; Martínez-Esnaola, J.M. Fatigue crack propagation at aeronautic engine vane guides using the extended finite element method (XFEM). Mech. Adv. Mater. Struct. 2019, 28, 861–873. [Google Scholar] [CrossRef] [Scilit]
- Kundu, S.; Jones, R.; Peng, D.; Matthews, N.; Alankar, A.; Raman, S.R.K.; Huang, P. Review of Requirements for the Durability and Damage Tolerance Certification of Additively Manufactured Aircraft Structural Parts and AM Repairs. Materials 2020, 13, 1341. [Google Scholar] [CrossRef] [Scilit] [PubMed]
- Liu, H.; Yang, X.; Li, S.; Shi, D. A numerical approach to simulate 3D crack propagation in turbine blades. Int. J. Mech. Sci. 2020, 171, 105408. [Google Scholar] [CrossRef] [Scilit]
- Main, B.; Jones, M.; Barter, S. The practical need for short fatigue crack growth rate models. Int. J. Fatigue 2021, 142, 105980. [Google Scholar] [CrossRef] [Scilit]
- Shlyannikov, V.; Yarullin, R.; Yakovlev, M.; Giannella, V.; Citarella, R. Mixed-mode crack growth simulation in aviation engine compressor disk. Eng. Fract. Mech. 2021, 246, 107617. [Google Scholar] [CrossRef] [Scilit]
- Ilie, P.; Ince, A. Three-dimensional fatigue crack growth simulation and fatigue life assessment based on finite element analysis. Fatigue Fract. Eng. Mater. Struct. 2022, 45, 3251–3266. [Google Scholar] [CrossRef] [Scilit]
- Ilie, P.C.; Ince, A.; Loghin, A. Assessment of fatigue crack growth based on 3D finite element modeling approach. Procedia Struct. Integr. 2022, 38, 271–282. [Google Scholar] [CrossRef] [Scilit]
- Peng, D.; Jones, R.; Ang, A.S.; Michelson, A.; Champagne, V.; Birt, A.; Pinches, S.; Kundu, S.; Alankar, A.; Singh, R.R.J.F.; et al. Computing the durability of WAAM 18Ni 250 maraging steel specimens. Fatigue Fract. Eng. Mater. Struct. 2022, 45, 3535–3545. [Google Scholar] [CrossRef] [Scilit]
- Wang, W.; Ni, K.; Ma, H.; Xiong, Q.; Wu, Z.; Wang, H.; Fan, C. Fatigue crack propagation simulation of airfoil section blade under aerodynamic and centrifugal loads. Eng. Fract. Mech. 2023, 293, 109702. [Google Scholar] [CrossRef] [Scilit]
- Alshoaibi, A.M.; Fageehi, Y.A. Advances in Finite Element Modeling of Fatigue Crack Propagation. Appl. Sci. 2024, 14, 9297. [Google Scholar] [CrossRef] [Scilit]
- Busse, D.; Ganguly, S.; Furfari, D.; Irving, P.E. Optimised laser peening strategies for damage tolerant aircraft structures. Int. J. Fatigue 2020, 141, 105890. [Google Scholar] [CrossRef] [Scilit]
- Wu, L.; Wang, T.; Hu, Y.; Liu, J.; Song, M. A method for improving the crack resistance of aluminum alloy aircraft skin inspired by plant leaf. Theor. Appl. Fract. Mech. 2020, 106, 102444. [Google Scholar] [CrossRef] [Scilit]
- van Aswegen, D.C.; Polese, C. Experimental and analytical investigation of the effects of laser shock peening processing strategy on fatigue crack growth in thin 2024 aluminium alloy panels. Int. J. Fatigue 2021, 142, 105969. [Google Scholar] [CrossRef] [Scilit]
- Li, S.; Liang, W.; Yan, H.; Wang, Y.; Gu, C. Prediction of fatigue crack propagation behavior of AA2524 after laser shot peening. Eng. Fract. Mech. 2022, 268, 108477. [Google Scholar] [CrossRef] [Scilit]
- Psihoyos, H.O.; Fotopoulos, K.T.; Lampeas, G.N. Development and validation of a simulation methodology for composite joints with delamination arresting features. Eng. Fail. Anal. 2022, 137, 106418. [Google Scholar] [CrossRef] [Scilit]
- Li, S.; Lu, Z.; Wang, Y.; Yan, H.; Zhu, Q.; Zhu, C. Numerical simulation of laser shot peening and fatigue performance test of AA2524 thin plate. Opt. Laser Technol. 2025, 181, 111680. [Google Scholar] [CrossRef] [Scilit]
- Sun, R.; Che, Z.; Cao, Z.; Zhang, H.; Zou, S.; Wu, J.; Guo, W. Effect of laser shock peening on high cycle fatigue failure of bolt connected AA2024-T351 hole structures. Eng. Fail. Anal. 2022, 141, 106625. [Google Scholar] [CrossRef] [Scilit]
- Aabid, A.; Hrairi, M.; Raheman, M.A.; Ibrahim, Y.E. Enhancing aircraft crack repair efficiency through novel optimization of piezoelectric actuator parameters: A design of experiments and adaptive neuro-fuzzy inference system approach. Heliyon 2024, 10, e32166. [Google Scholar] [CrossRef] [Scilit]
- Aabid, A.; Baig, M.; Malik, M.A. Enhancing piezoelectric control of cracks in thin solid aluminum plates using finite element data and a neural networks approach. AIP Adv. 2025, 15, 035302. [Google Scholar] [CrossRef] [Scilit]
- Zhiping, Y.; An, C.; Qiqing, H.; Wei, X. Analyzing Effects of Crack-arresting Stringer of Integrated Wing Beam Structure on Crack Turning Characteristics. Mech. Sci. Technol. Aerosp. Eng. 2012, 31, 59–62. [Google Scholar] [CrossRef]
- Brown, W.F.; Srawley, J.E. Plane Strain Crack Toughness Testing of High Strength Metallic Materials; ASTM International: West Conshohocken, PA, USA, 1966. [Google Scholar]
- Przystupa, M.A.; Bucci, R.J.; Magnusen, P.E.; Hinkle, A.J. Microstructure based fatigue life predictions for thick plate 7050-T7451 airframe alloys. Int. J. Fatigue 1997, 19, 285–288. [Google Scholar] [CrossRef] [Scilit]
- ASTM E399-22; Standard Test Method for Linear-Elastic Plane-Strain Fracture Toughness of Metallic Materials. ASTM International: West Conshohocken, PA, USA, 2023. [CrossRef] [Scilit]

Disclaimer/Publisher’s Note: The statements, opinions and data contained in all publications are solely those of the individual author(s) and contributor(s) and not of MDPI and/or the editor(s). MDPI and/or the editor(s) disclaim responsibility for any injury to people or property resulting from any ideas, methods, instructions or products referred to in the content. |
© 2026 by the authors. Licensee MDPI, Basel, Switzerland. This article is an open access article distributed under the terms and conditions of the Creative Commons Attribution (CC BY) license.