


Abstract
Offshore wind turbine blades operating in cold climates are frequently affected by surface icing, which compromises aerodynamic performance and reduces power output. To address this challenge, the present study conducted controlled icing wind tunnel experiments to investigate how salinity and liquid water content (LWC) influence ice formation on the S809 airfoil surface. Results indicate that increased salinity substantially inhibits ice accretion: as salinity rises from 0‰ to 35‰, the total icing area rate drops by approximately 20.5% within 6 min, and the maximum ice thickness declines from 17.21 mm to 6.03 mm. Conversely, LWC emerges as a dominant factor intensifying icing severity: raising LWC from 0.5 g/m3 to 1.5 g/m3 leads to a 135% increase in icing area and an increase in maximum ice thickness from 7.69 mm to 18.17 mm. A notable synergistic interaction is observed—higher LWC enhances the inhibitory effect of salinity on ice formation. These findings offer valuable insights into the icing dynamics under marine atmospheric conditions and provide a theoretical foundation for the development of anti-icing strategies for offshore wind turbine blades.
1. Introduction
Wind energy stands as one of the most extensively utilized renewable energy sources worldwide, with its installed capacity increasing exponentially each year [1,2,3]. Wind turbines, typically operating at low altitudes, are often subjected to icing on blade surfaces during winter and early spring due to low ambient temperatures combined with precipitation such as rain and snow [4,5]. As the global wind industry moves toward deep offshore deployment [6], icing issues are expected to become more pronounced, driven by the harsher and more complex marine environments. Ice accretion on blade surfaces alters the aerodynamic profile, reducing aerodynamic efficiency [7]. Furthermore, the accumulation of ice changes the blades’ natural frequencies, posing safety concerns for turbine operation. Once the turbine is activated, ice chunks may detach due to centrifugal forces, leading to ice throw, which can endanger maintenance personnel and damage nearby equipment [8].
Despite its practical importance, the study of icing-related performance degradation in wind turbines remains challenging. The scarcity of real-world data from full-scale outdoor turbines has led researchers to rely heavily on numerical simulations and controlled icing wind tunnel experiments. Simulation-based approaches can model different icing types, their spatial distributions, and the aerodynamic implications under various climatic conditions [9,10,11]. For example, Qian et al. [12] employed numerical simulation methods and utilized the icing calculation software FENSAP (version 2022R1) to investigate the influence of environmental temperature, inflow flow rate, liquid water content, and droplet diameter on the icing patterns on wind turbine blades. However, the limitations of current modeling frameworks and the inherent complexity of icing physics often result in discrepancies between simulated and actual behavior. In contrast, icing wind tunnel tests offer the advantage of reproducing physical icing phenomena under controlled conditions [13]. A number of experimental and computational studies have been conducted in this field. Lian et al. [14] investigated ice distribution on NACA63-412 airfoils under various wind speeds and ambient temperatures, concluding that temperature had a more significant influence on ice mass than wind speed. Liang et al. [15] studied icing on the DU25 airfoil—commonly used in offshore wind turbines—and reported that both the icing area and net accumulation increased with different conditions. Jin et al. [16] explored ice accretion on S826 and S832 airfoils under differing environmental settings, capturing both rime and glaze ice morphologies. Their findings suggested that rime ice was generally thicker, while glaze ice featured more complex surface textures. In all cases, post-icing aerodynamic performance showed marked degradation compared to clean airfoils. Falacios et al. [17] designed and constructed the AERTS facility to simulate natural icing conditions, and developed a method for calculating liquid water content. The research focus is on helicopter rotor blades. Hann et al. [18] analyzed icing on the S826 airfoil at low Reynolds numbers and validated experimental results with LEWICE-generated profiles and FENSAP-based aerodynamic assessments, confirming increased drag and diminished lift in the presence of surface ice.
While a substantial body of work exists on icing in onshore turbines [19], the literature addressing offshore icing phenomena remains relatively limited. Icing on wind turbines is a key challenge for offshore wind power, as emphasized in the review by Esmeryan et al. [20]. It summarizes the limitations of existing anti-icing methods (such as high energy consumption of electrothermal systems) and the need for passive strategies. Liu et al. [21] observed that saltwater droplets significantly alter the ice formation process on aluminum NACA0018 airfoils compared to freshwater. Mu et al. [22] demonstrated that icing under marine atmospheric conditions considerably reduced lift and lift-to-drag ratios while increasing aerodynamic drag, with rime ice formed from freshwater causing the greatest performance degradation. Given the presence of salt in coastal air, wind turbines in such environments may experience fundamentally different icing mechanisms [23]. Furthermore, exposure to seawater spray and salt-laden mist affects local liquid water content (LWC), a factor often overlooked in models that rely solely on freshwater conditions [24,25,26]. This oversight hinders accurate replication of real offshore environments. Ren et al. [27] studied salt-containing droplets in marine environments and found that higher inflow velocities and liquid water content have a more significant impact on the icing characteristics of blades. The research subject is the inertial separator blade. Adding to the challenge, many experimental studies still employ aluminum alloy blade models, which differ mechanically and thermally from the glass fiber-reinforced plastic (GFRP) composites widely used in modern horizontal-axis turbines [28,29].
Existing onshore/freshwater studies focused on temperature, wind speed, or airfoil geometry—excluding offshore-specific salinity. Prior offshore work only qualitatively noted salinity altered ice morphology but did not quantify its effects on core metrics (icing area, ice thickness) or test salinity–LWC coupling. To bridge this gap, the present study investigates the surface icing behavior of wind turbine blades under varying salinity levels and LWC, using S809 airfoil sections constructed from GFRP to ensure material fidelity. By quantifying icing area, total icing area rate, and ice thickness, the study provides insights into the complex icing mechanisms relevant to offshore conditions.
2. Experimental Methods
2.1. Experimental System
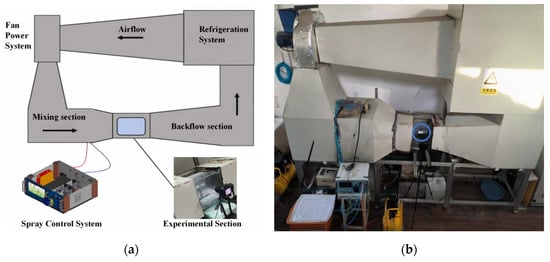
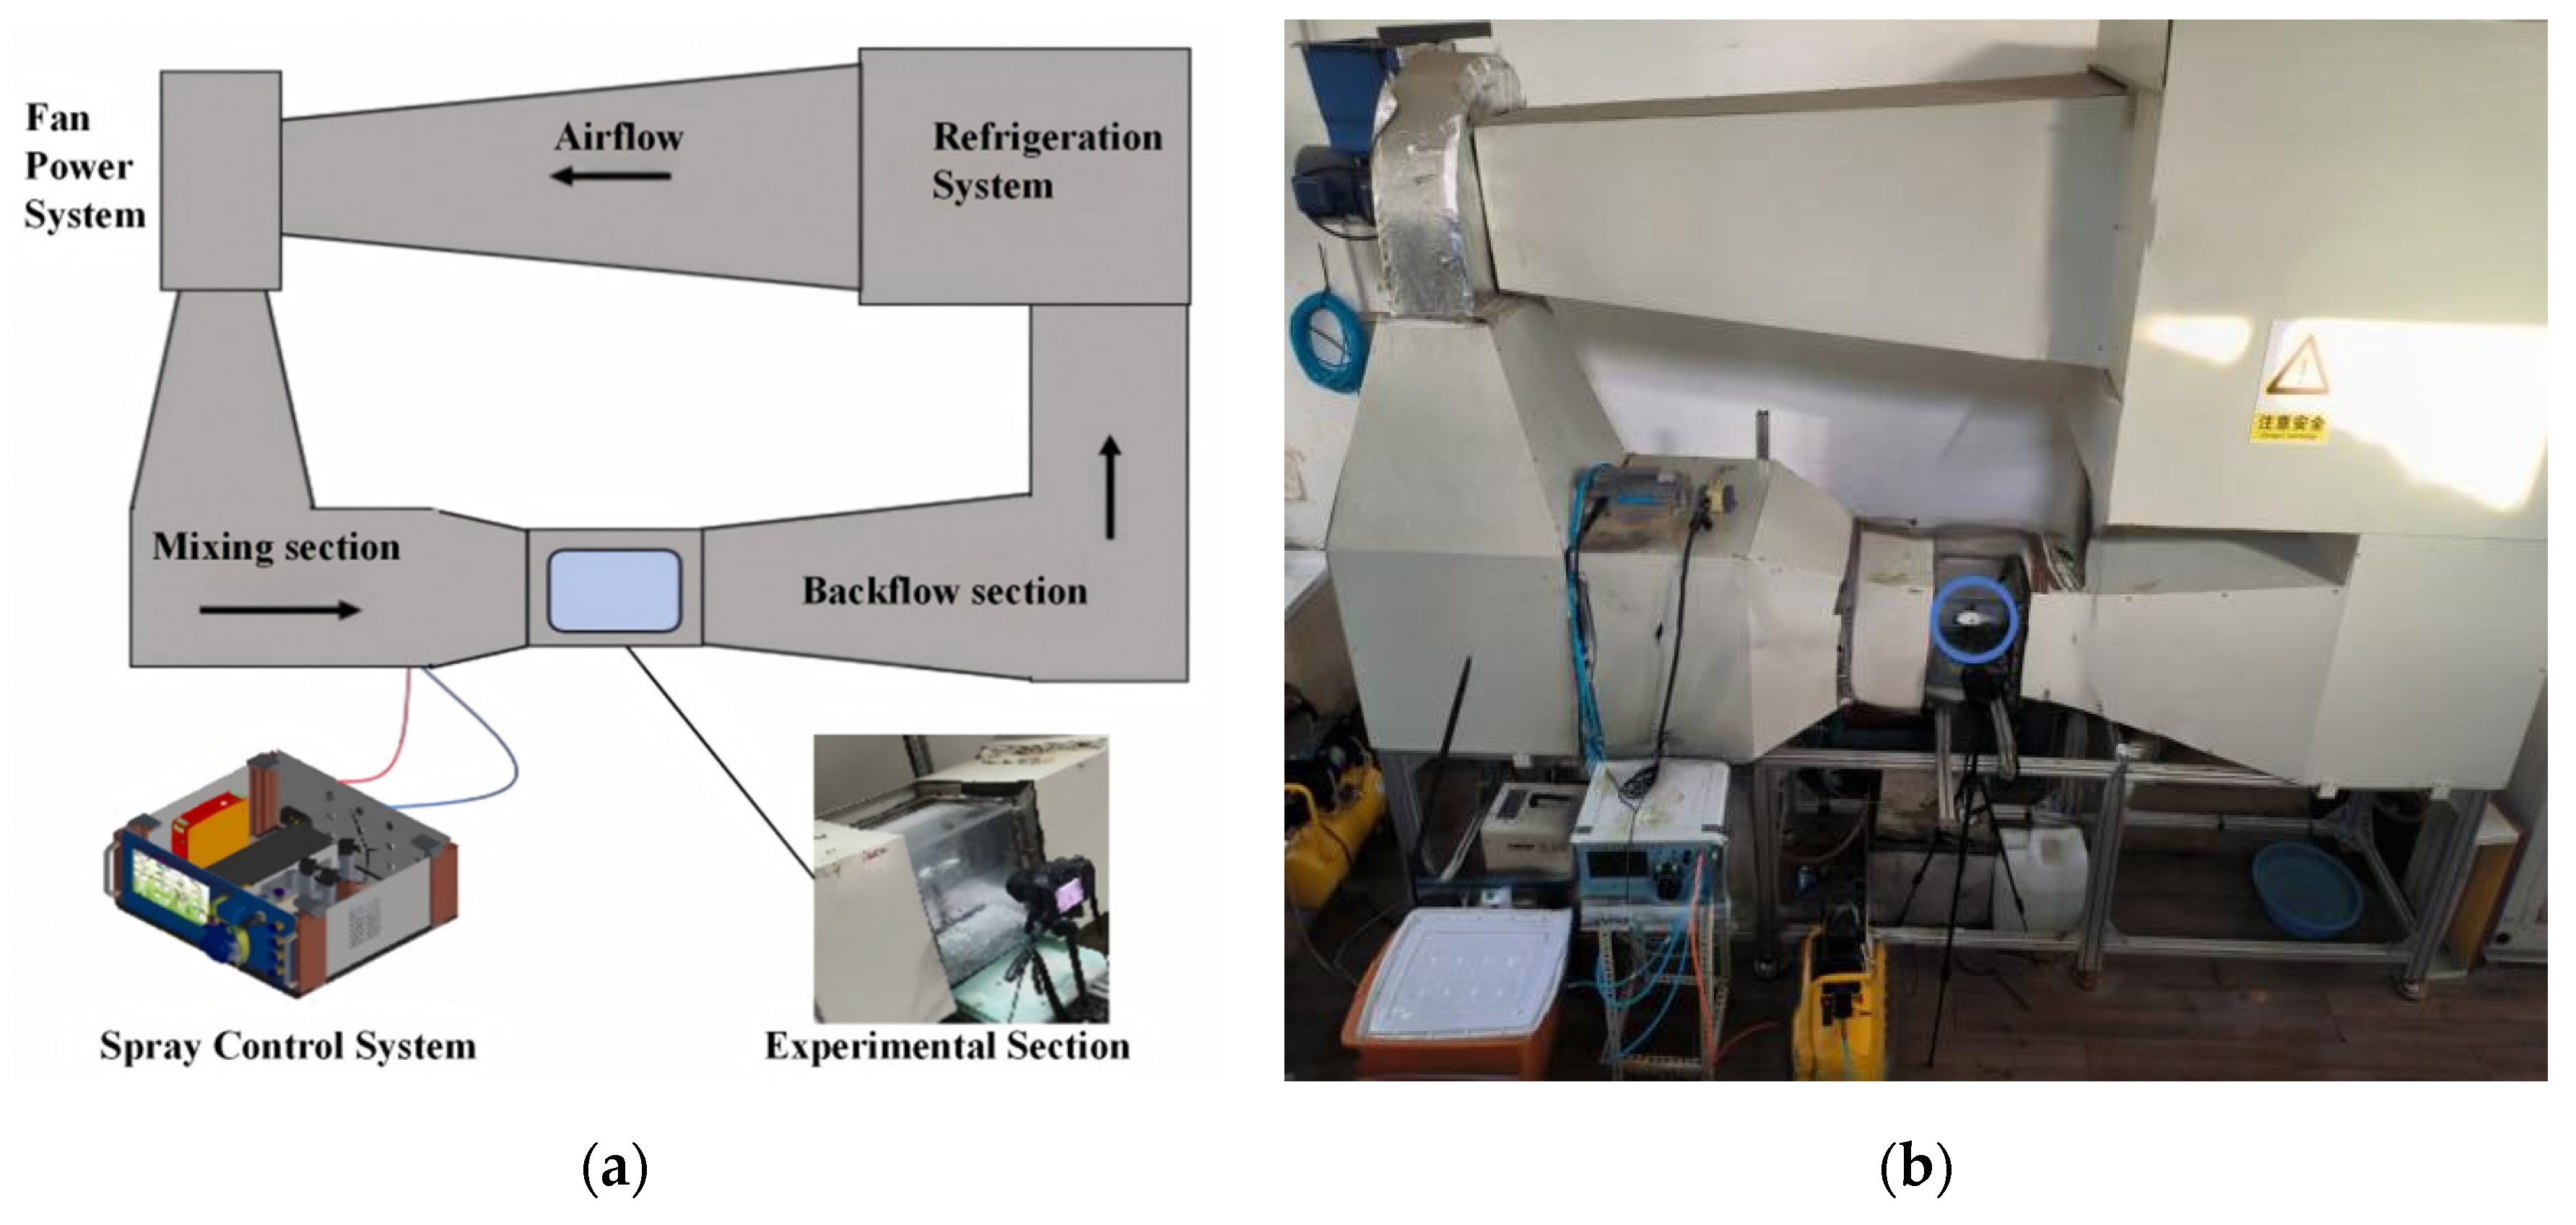
The actual process of atmospheric icing can be effectively replicated using a controlled wind tunnel environment. In this study, all experiments were performed within a small-scale icing wind tunnel system, specifically designed and constructed by the Wind Energy Research Team at Northeast Agricultural University. A schematic and physical layout of this reflux-type system is illustrated in Figure 1.
Figure 1.
Small-scale reflux icing wind tunnel system: (a) Schematic diagram; (b) Photograph of actual setup.
The small-scale reflux icing wind tunnel system comprises a refrigeration system, a fan power system, a spray control system, and an experimental section, together forming a closed-loop system capable of simulating realistic atmospheric icing conditions with high precision. The refrigeration system utilizes a compressor to cool the airflow to target temperatures ranging from −20 to 0 °C, maintaining a control accuracy of ±0.5 °C. The airflow is then accelerated to the desired velocity (0–20 m/s, with ±0.1 m/s precision) by fan power system. In mixing section, supercooled water droplets produced by an atomizing nozzle are uniformly entrained in the airflow. By regulating both water and air pressures, the system can precisely adjust the LWC and humidity, resulting in a stable, homogeneous droplet-laden airstream. Within the test section, a blade model is mounted to intercept the supercooled droplets, initiating ice accretion on its surface. Simultaneous monitoring and data collection are conducted during the process. A recirculation segment, equipped with guide vanes and a flow-straightening grid, stabilizes the airflow before returning it to the refrigeration unit, thus completing the aerodynamic cycle.
The experimental section has a square cross-section of 250 mm × 250 mm and includes a blade fixation mechanism along with an observation window. The fixation system ensures that the test model remains securely positioned throughout extended experimental runs, while the observation window enables real-time visual inspection via a high-definition camera. The calculated blockage area ratio of the model and fixture is approximately 1.8%, which is well within the acceptable threshold (≤2%) for wind tunnel experiments. Prior to each test, the blade surface is cleaned and thoroughly dried to eliminate contaminants. The model is then installed on the fixture and pre-cooled to the target temperature, thereby minimizing thermal inertia effects and ensuring repeatability and accuracy.
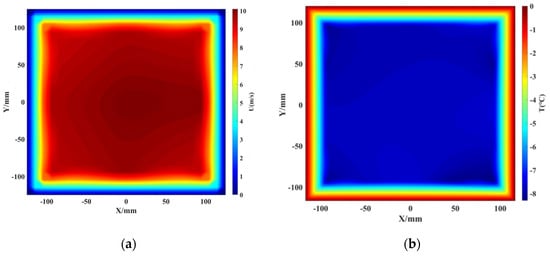
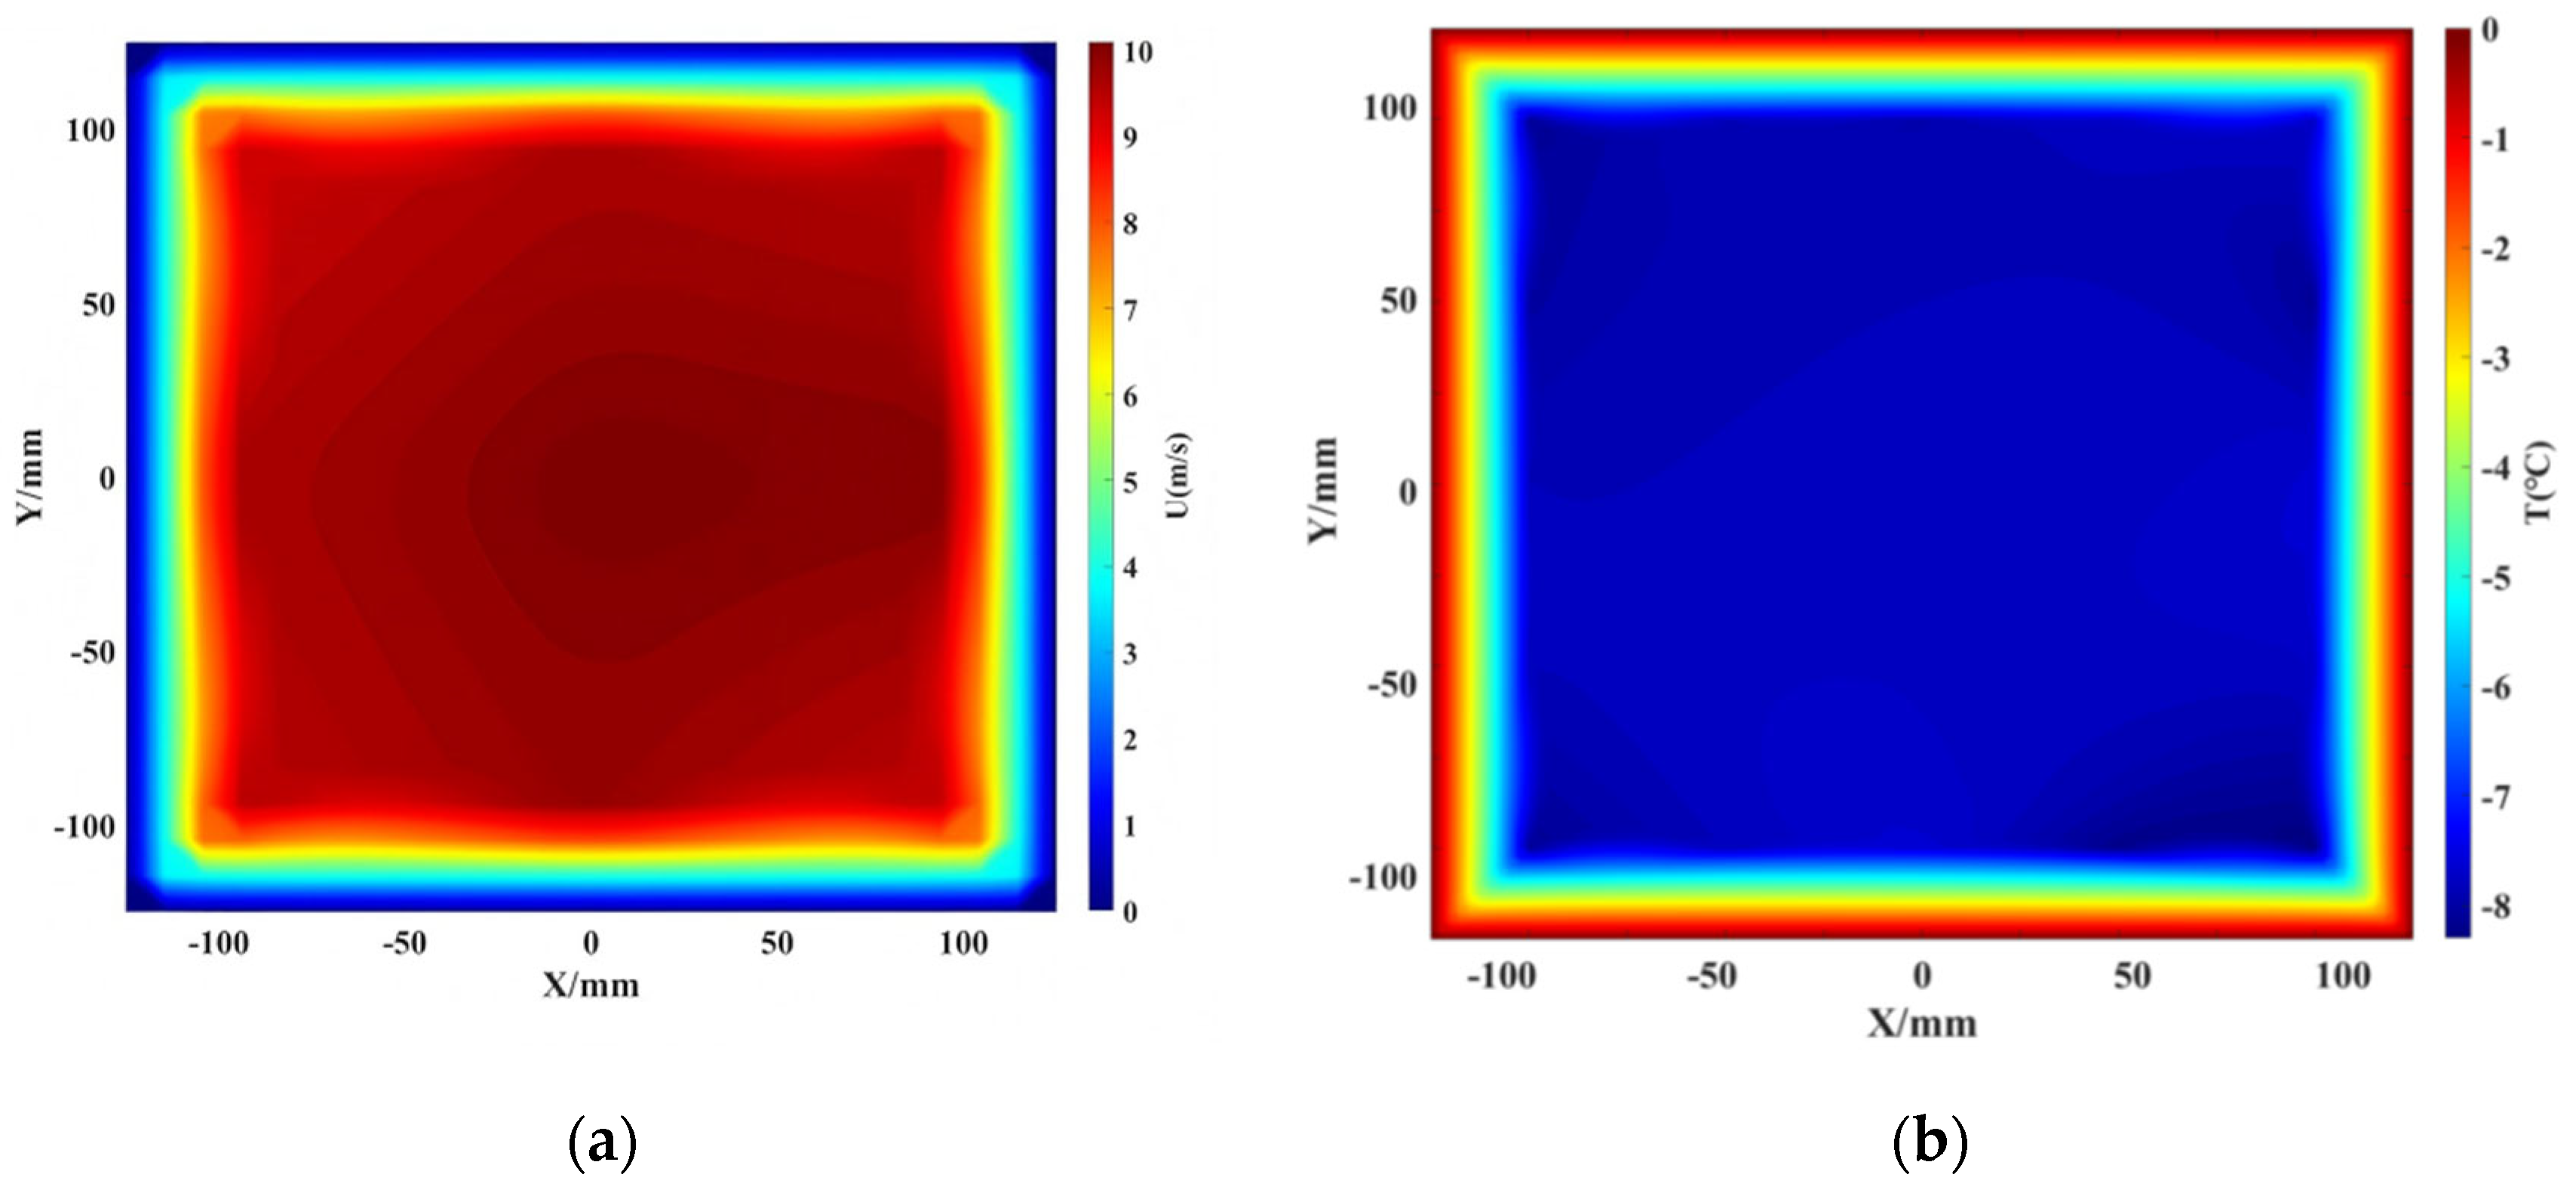
To validate the consistency of experimental conditions, the wind tunnel must be calibrated for both velocity and temperature before initiating icing distribution tests. Calibration is performed using a handheld hot-wire anemometer (testo 405i), measuring flow parameters at various locations within the test section. A reference velocity of 10 m/s and a temperature of −8 °C are adopted. The experimental section is uniformly marked, and pointwise measurements are taken to generate flow and temperature distribution profiles. In Figure 2a, airflow velocity is well centered around 10 m/s, particularly in the central zone where the blade is located, and the uniformity exceeds the spatial dimensions of the test model. Figure 2b shows the corresponding temperature distribution, revealing stable conditions in the core region at approximately −8 °C. Although peripheral regions near the walls exhibit a slight temperature gradient due to thermal exchange with the ambient surroundings, this boundary effect is negligible since the model is positioned in the thermally stable center, ensuring valid aerodynamic and thermodynamic behavior.
Figure 2.
Experimental calibration results: (a) Wind speed distribution map; (b) Temperature distribution map.
2.2. Experimental Model
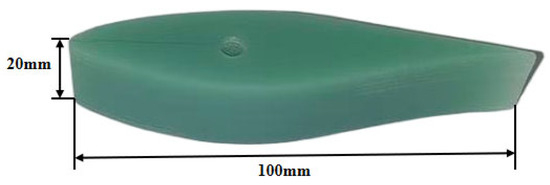
In this study, the test model is based on the National Renewable Energy Laboratory (NREL) S809 straight airfoil section, specifically designed for wind turbine applications (Figure 3). The S809 airfoil [30] is a laminar flow profile developed by the U.S. NREL for use in horizontal-axis wind turbine blades. It features a maximum thickness of 21% relative to the chord length, and was designed to enhance aerodynamic performance while accommodating the operational characteristics of utility-scale wind turbines, essential for offshore blades, which require long spans and resistance to cyclic saltwater/wind loads. It is used in main load-bearing sections of modern offshore turbines, making it representative. The chord length (c) of the airfoil model used in the experiments is 100 mm, with a maximum thickness (h) of 20 mm.
Figure 3.
Blade segment with S809 airfoil.
The airfoil segment used in this study is fabricated from GFRP, a material extensively employed in the construction of large-scale wind turbine blades. GFRP is favored for its high specific strength, excellent fatigue resistance, and flexibility in structural design. These characteristics make it particularly suitable for long-span, load-bearing components subject to cyclic aerodynamic forces.
2.3. Experimental Parameters
The climatic conditions used to simulate wind turbine icing in this study are informed by Drage and Hauge [31], who investigated meteorological icing parameters based on atmospheric measurements conducted at Brosviksåta Mountain, located on Norway’s western coastline. The representative range of icing-related meteorological conditions derived from their study is outlined in Table 1.
Table 1.
Meteorological conditions.
Based on Table 1, this study adopts an experimental wind speed of 10 m/s, a median volume diameter (MVD) of 30 μm, a temperature of −8 °C, and an icing duration of 6 min. The selected temperature falls within the mid-range of typical meteorological icing conditions and encompasses the requirements for generating various icing types, thereby enhancing the applicability of the results to cold-region scenarios. In addition, to account for the unique characteristics of offshore wind turbine environments, salinity (C) is introduced as a key environmental variable. Defined as the mass fraction of dissolved salts in seawater, salinity is expressed in ‰, indicating the number of grams of salt per kilogram of seawater. Three representative salinity levels are selected for their physical relevance and engineering significance: 0‰, 17.5‰, and 35‰. A salinity of 0‰ represents freshwater conditions and is used as the experimental control group, simulating an ideal icing process unaffected by salt. The 17.5‰ level corresponds to approximately half the salinity of typical seawater and serves as a proxy for nearshore zones, estuarine regions, or areas such as the Baltic Sea, where freshwater dilution is significant. These areas are of strategic importance for offshore wind energy deployment, and this intermediate salinity allows exploration of potential nonlinear threshold effects in icing response. The 35‰ salinity level reflects the average salinity of global oceans and is used to replicate severe marine conditions involving strong oceanic influences or direct seawater spray. This upper bound helps identify the physical limits of salinity’s influence on icing behavior. To simulate these saline conditions, solution preparation was carried out using the gravimetric method, in which deionized water served as the solvent and sea salt—whose chemical composition is detailed in Table 2—served as the solute. The target salinity values were precisely calculated, weighed, and fully dissolved through controlled mixing. Each solution was verified using a high-precision salinity meter to ensure deviations remained within an acceptable margin. During the experiment, solutions with different salinities are introduced into the atomizing nozzle through the water pumping device in the spray control system. In mixing section, supercooled water droplets produced by an atomizing nozzle are uniformly entrained in the airflow, resulting in a stable, homogeneous droplet-laden airstream. Thus, the control of salinity is achieved. All prepared solutions were stored separately in sealed containers. The spray system was rigorously flushed before and after each test to eliminate cross-contamination and ensure that salinity remained the sole experimental variable throughout the icing trials.
Table 2.
Sea salt composition.
In conjunction with the capabilities of the test system and the environmental conditions typical of offshore wind turbine operations, this study further incorporates LWC as a key environmental variable. LWC is defined as the mass of suspended water droplets per unit volume of air and is expressed in g/m3. To assess the influence of varying icing intensities under saline conditions, three representative LWC levels are selected: 0.5 g/m3, 1.0 g/m3, and 1.5 g/m3. These levels correspond to low, moderate, and severe icing scenarios, respectively. By systematically varying the LWC alongside salinity, the experiment aims to capture the combined effects of moisture content and salt concentration on the surface icing distribution of wind turbine blades. During the experiment, the water pressure and air pressure can be adjusted through the spray control system to regulate the liquid water content, ensuring the reproducibility of the experiments. The complete experimental scheme, including all test conditions, is presented in Table 3.
Table 3.
Experimental scheme.
2.4. Characteristics
In this study, during the wind tunnel tests investigating icing on wind turbine blade airfoils, a high-definition video camera was employed to capture the experimental procedure. The camera’s resolution limited the minimum detectable thickness to ~0.01 mm. This is negligible compared to our experimental data. The recorded image data were subsequently processed using image recognition software ImageJ (version 1.54). By mapping the icing contours at different time intervals, the evolution of icing morphology could be clearly visualized. A standard gauge block set (Mitutoyo, accuracy ±0.001 mm) was used to calibrate the pixel-to-length ratio. To quantitatively analyze the morphological characteristics of the iced airfoil, three evaluation parameters were defined based on Wang et al. [32]: icing area (A), total icing area rate (ηi), and ice thickness (Hi), which can be expressed as follows:
As a fundamental evaluation metric, it is commonly used to quantify the extent of ice accretion. The calculation is shown through Formula (1):
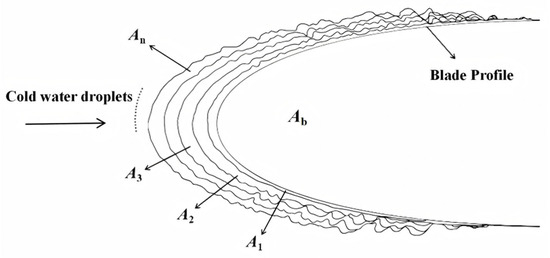
where A denotes the Icing area, which refers to the surface area covered by ice on the blade (mm2); Ai denotes the increase in the icing area on the blade during the i-th time interval of each icing test (Figure 4).
Figure 4.
Schematic of icing area [32].
ηi represents the ratio of the icing area on the blade surface to the total cross-sectional area of the blade, and is typically expressed as a percentage. This parameter serves as an indicator of the overall severity of surface icing and is useful for evaluating the extent to which ice accumulation affects blade geometry. The definition is provided in Formula (2):
where Ai denotes the increase in the icing area on the blade during the i-th time interval of each icing test and Ab denotes Blade cross-sectional area (Figure 4).
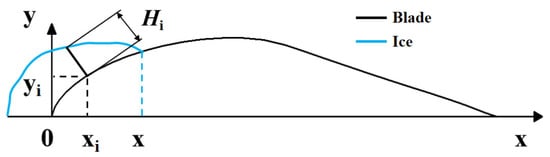
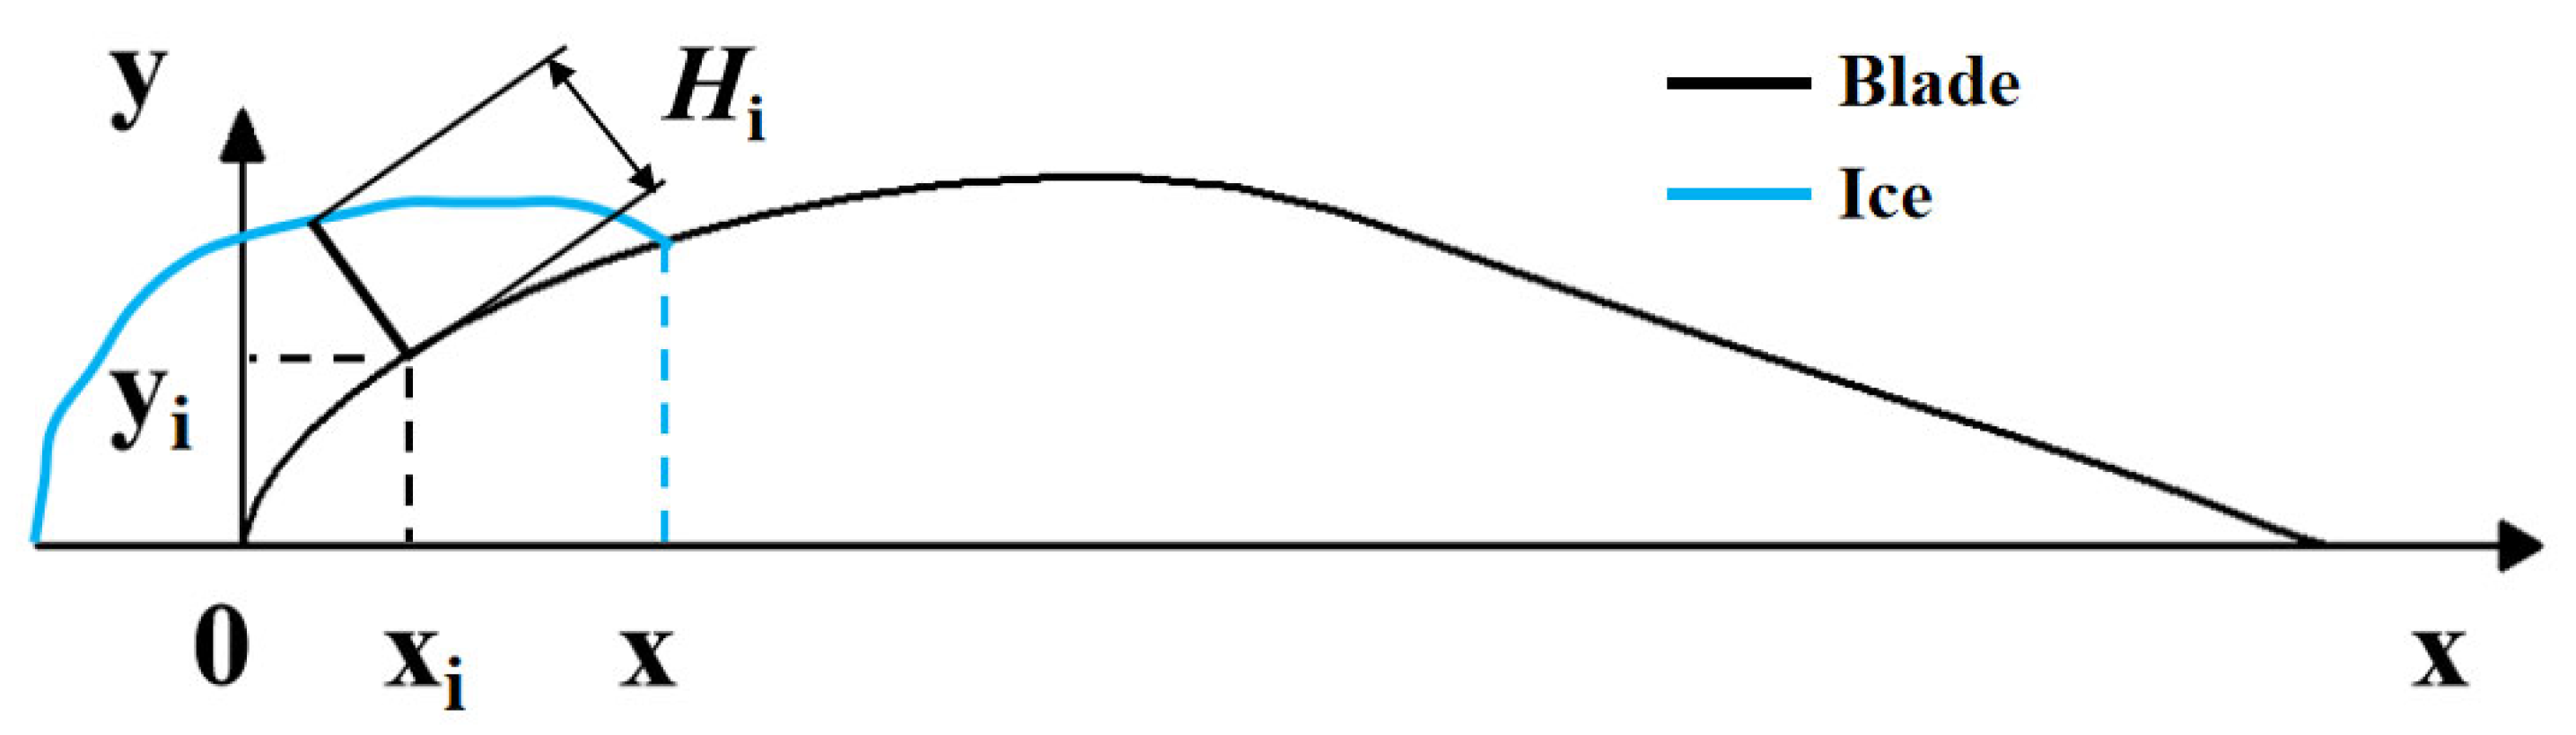
Hi refers to the thickness of the ice layer measured in the direction normal to the airfoil surface at the chordwise position xi (i = 0, 1, 2, …) along the blade section with a unit of mm. As a key geometric parameter, ice thickness provides an intuitive representation of how ice is distributed across the blade surface and is critical for evaluating the severity of ice accretion. The specific method used to measure ice thickness is depicted in Figure 5.
Figure 5.
Schematic of ice thickness [32].
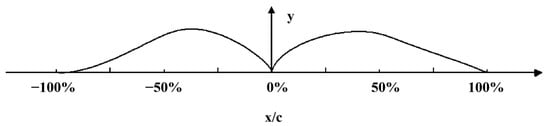
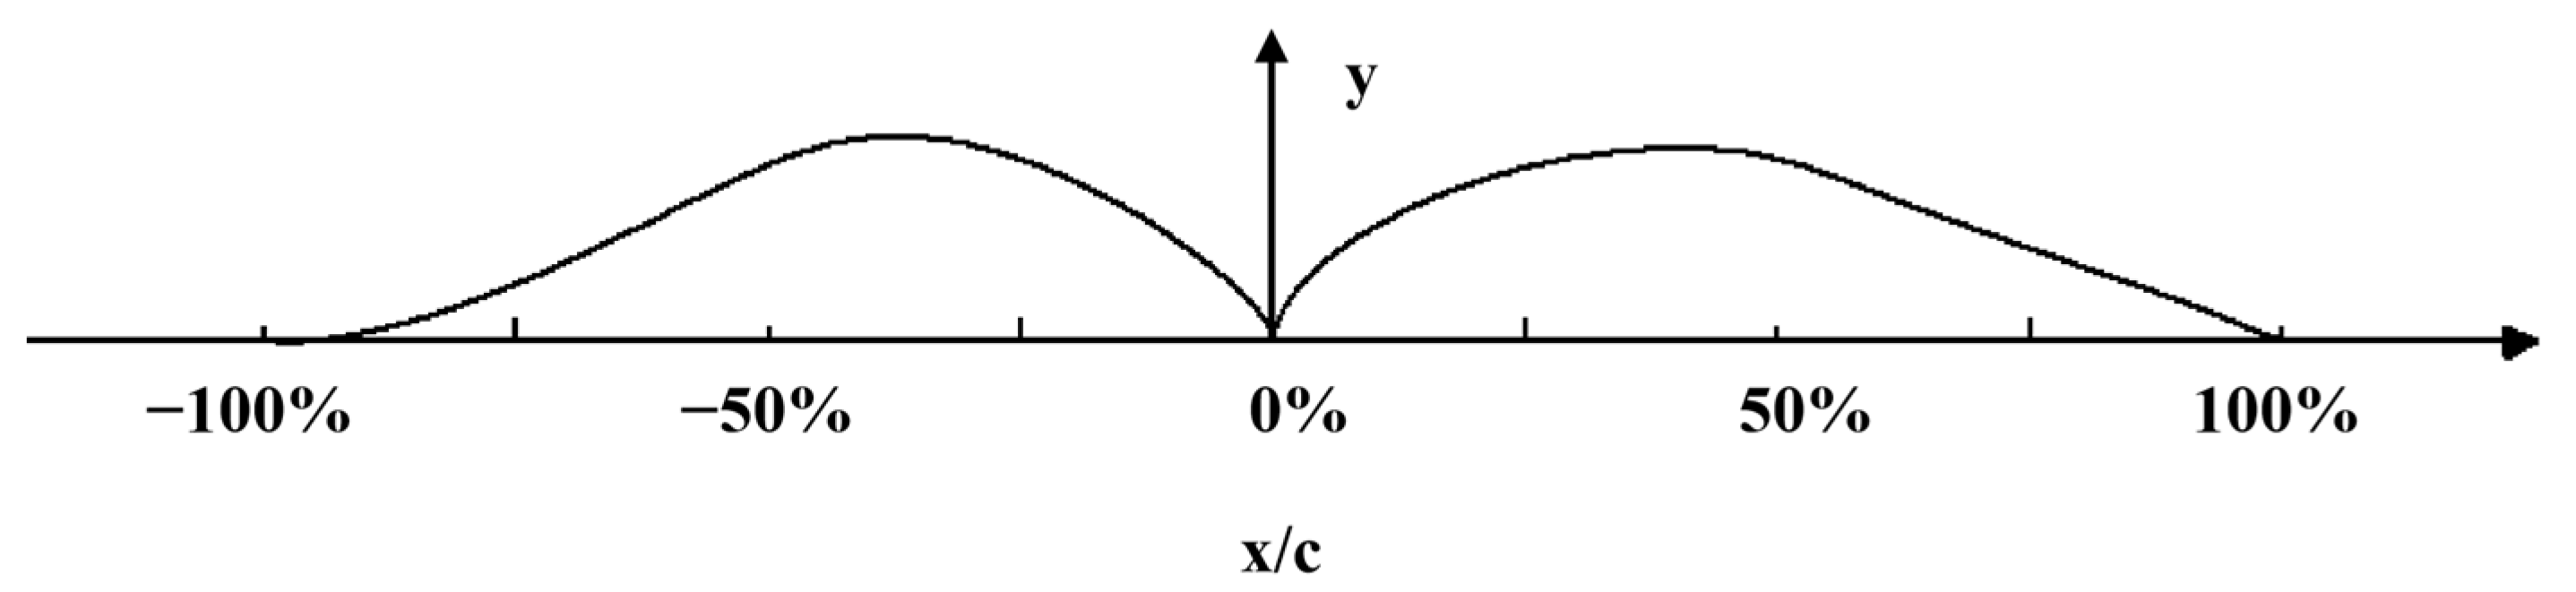
In this study, a dimensionless approach was firstly applied to the offshore wind turbine blade chord length to facilitate standardized positional analysis. Based on this treatment, positional annotations were assigned accordingly. Figure 6 presents a schematic diagram illustrating the relative chordwise positions along the S809 airfoil blade. In this coordinate system, the positive direction of the horizontal axis corresponds to the upper surface of the blade, while the negative direction corresponds to the lower surface. In Figure 6, c denotes the chord length of the blade and x/c denotes the dimensionless chordwise location along the airfoil.
Figure 6.
Schematic of relative chord length on S809 airfoil blade.
3. Results and Discussion
3.1. Effect of Salinity
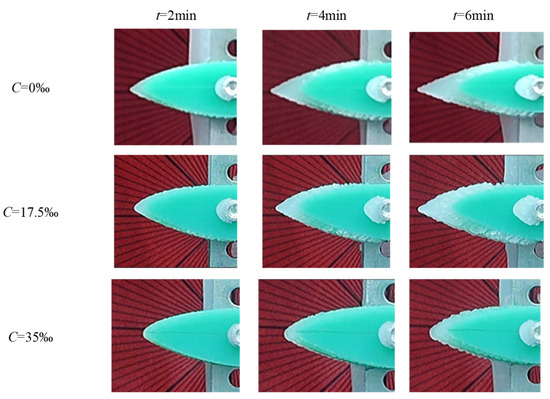
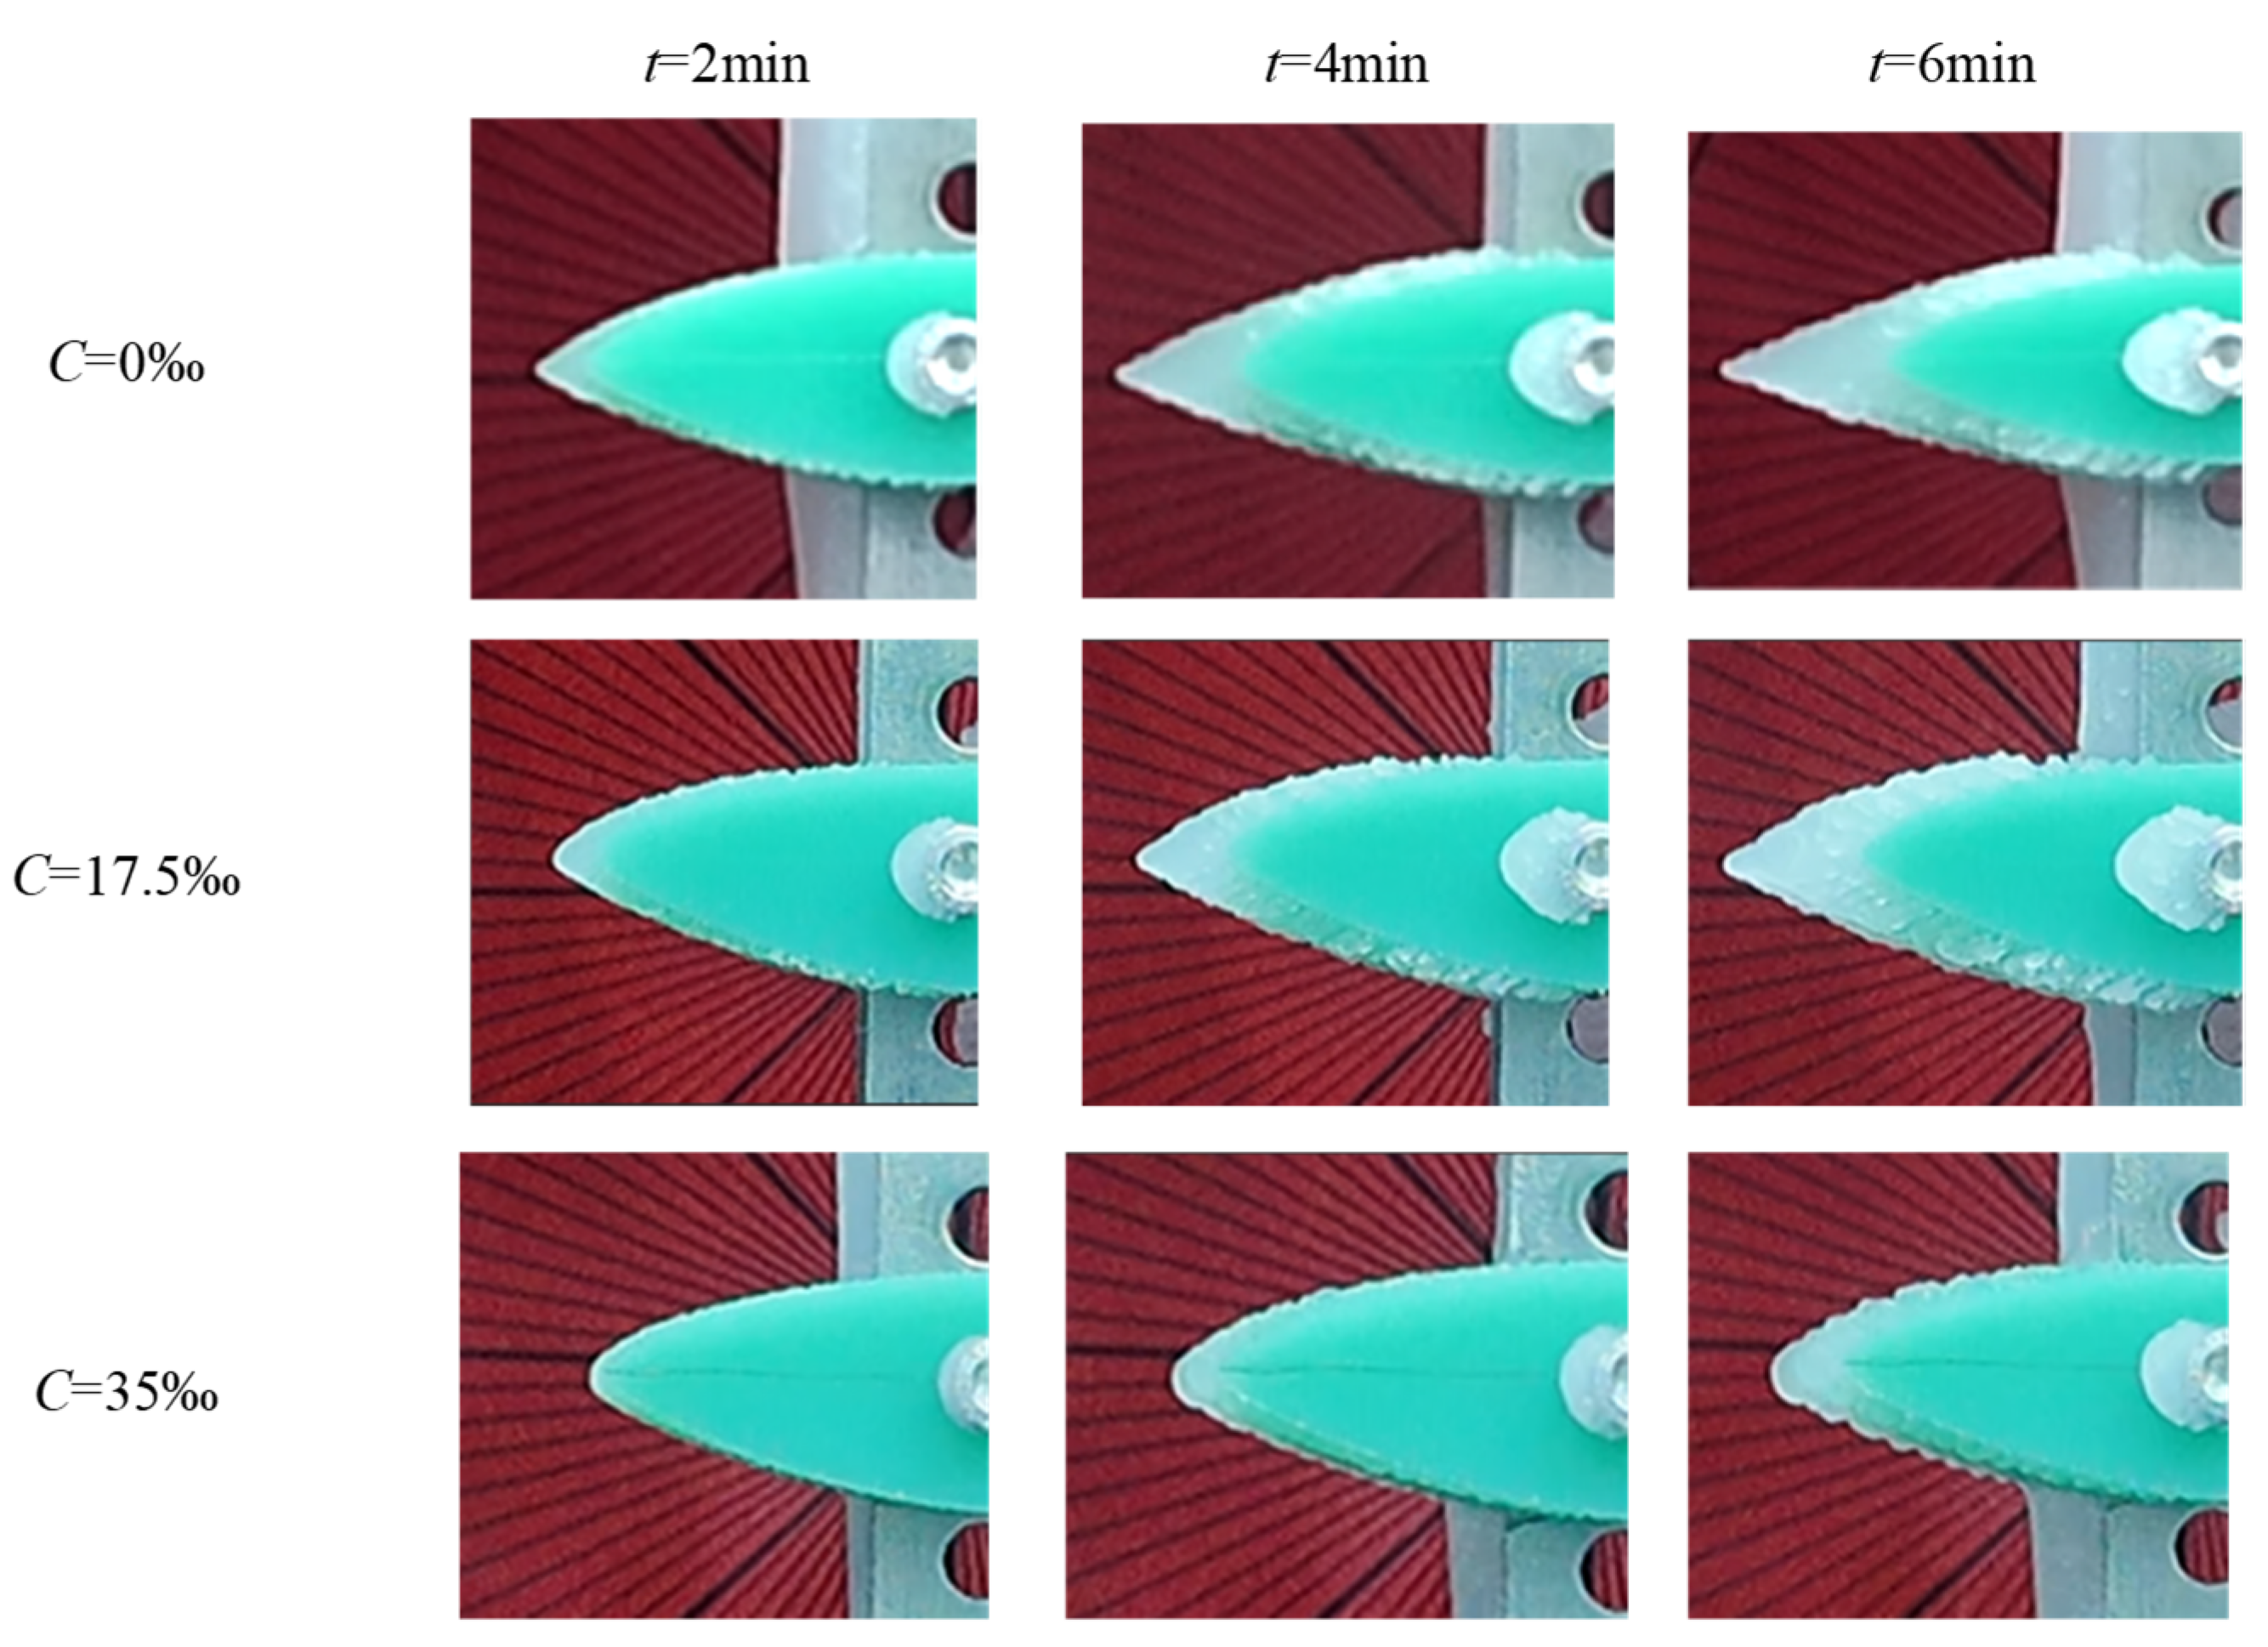
Under an LWC of 1.0 g/m3, experiments were conducted at salinity levels of 0‰, 17.5‰, and 35‰, with a wind speed of 10 m/s, a temperature of −8 °C, and icing durations of 2, 4, and 6 min. These tests were designed to investigate the influence of salinity on the surface icing distribution of wind turbine blades. The resulting icing morphologies are illustrated in Figure 7. Salinity has a pronounced effect on both the type and quantity of ice formation. Under freshwater conditions (0‰), the leading edge of the blade exhibits relatively thick ice accumulation, comprising a mixture of ice types: glaze ice appears near the stagnation point and is characterized by its transparent appearance, while rime ice—whiter and more opaque—forms toward the periphery of the layer. As salinity increases, the morphology of the ice changes significantly. The leading-edge ice becomes more rounded, the overall amount of ice accretion decreases, and the proportion of glaze ice increases. These observations suggest that salinity not only alters the type of ice formed but also reshapes the geometric profile of the accreted ice. This phenomenon can be attributed to the freezing point depression and suppression of ice crystal nucleation caused by the presence of dissolved salts. Therefore, supercooled droplets impacting the blade surface remain in a liquid state for a longer duration, allowing for smoother, more rounded ice growth. Furthermore, the thermal conductivity of saline ice is lower than that of pure ice, leading to slower and more uniform heat release during the freezing process. Although the total ice mass is reduced, the resulting ice shapes may still severely impair aerodynamic performance in more subtle and complex ways. Furthermore, while Falacios et al. [17] emphasized the importance of controlled LWC measurement in icing experiments, our work demonstrates that in saline environments, even with constant LWC (1.0 g/m3), salinity alone can significantly suppress ice accretion, highlighting the need to incorporate salinity as a key parameter in offshore icing models.
Figure 7.
Effect of salinity on blade ice morphology.
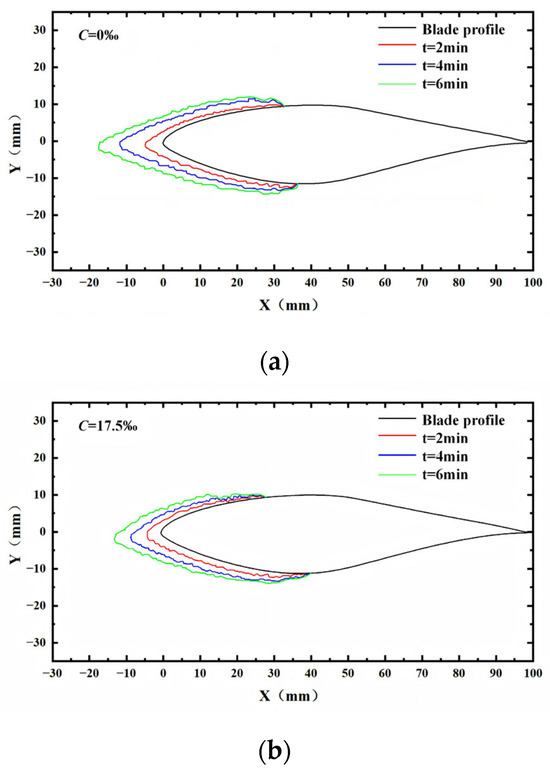
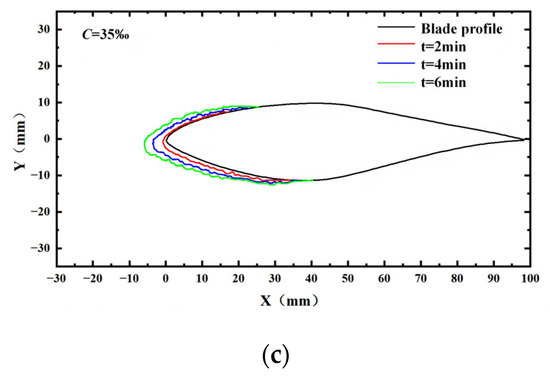
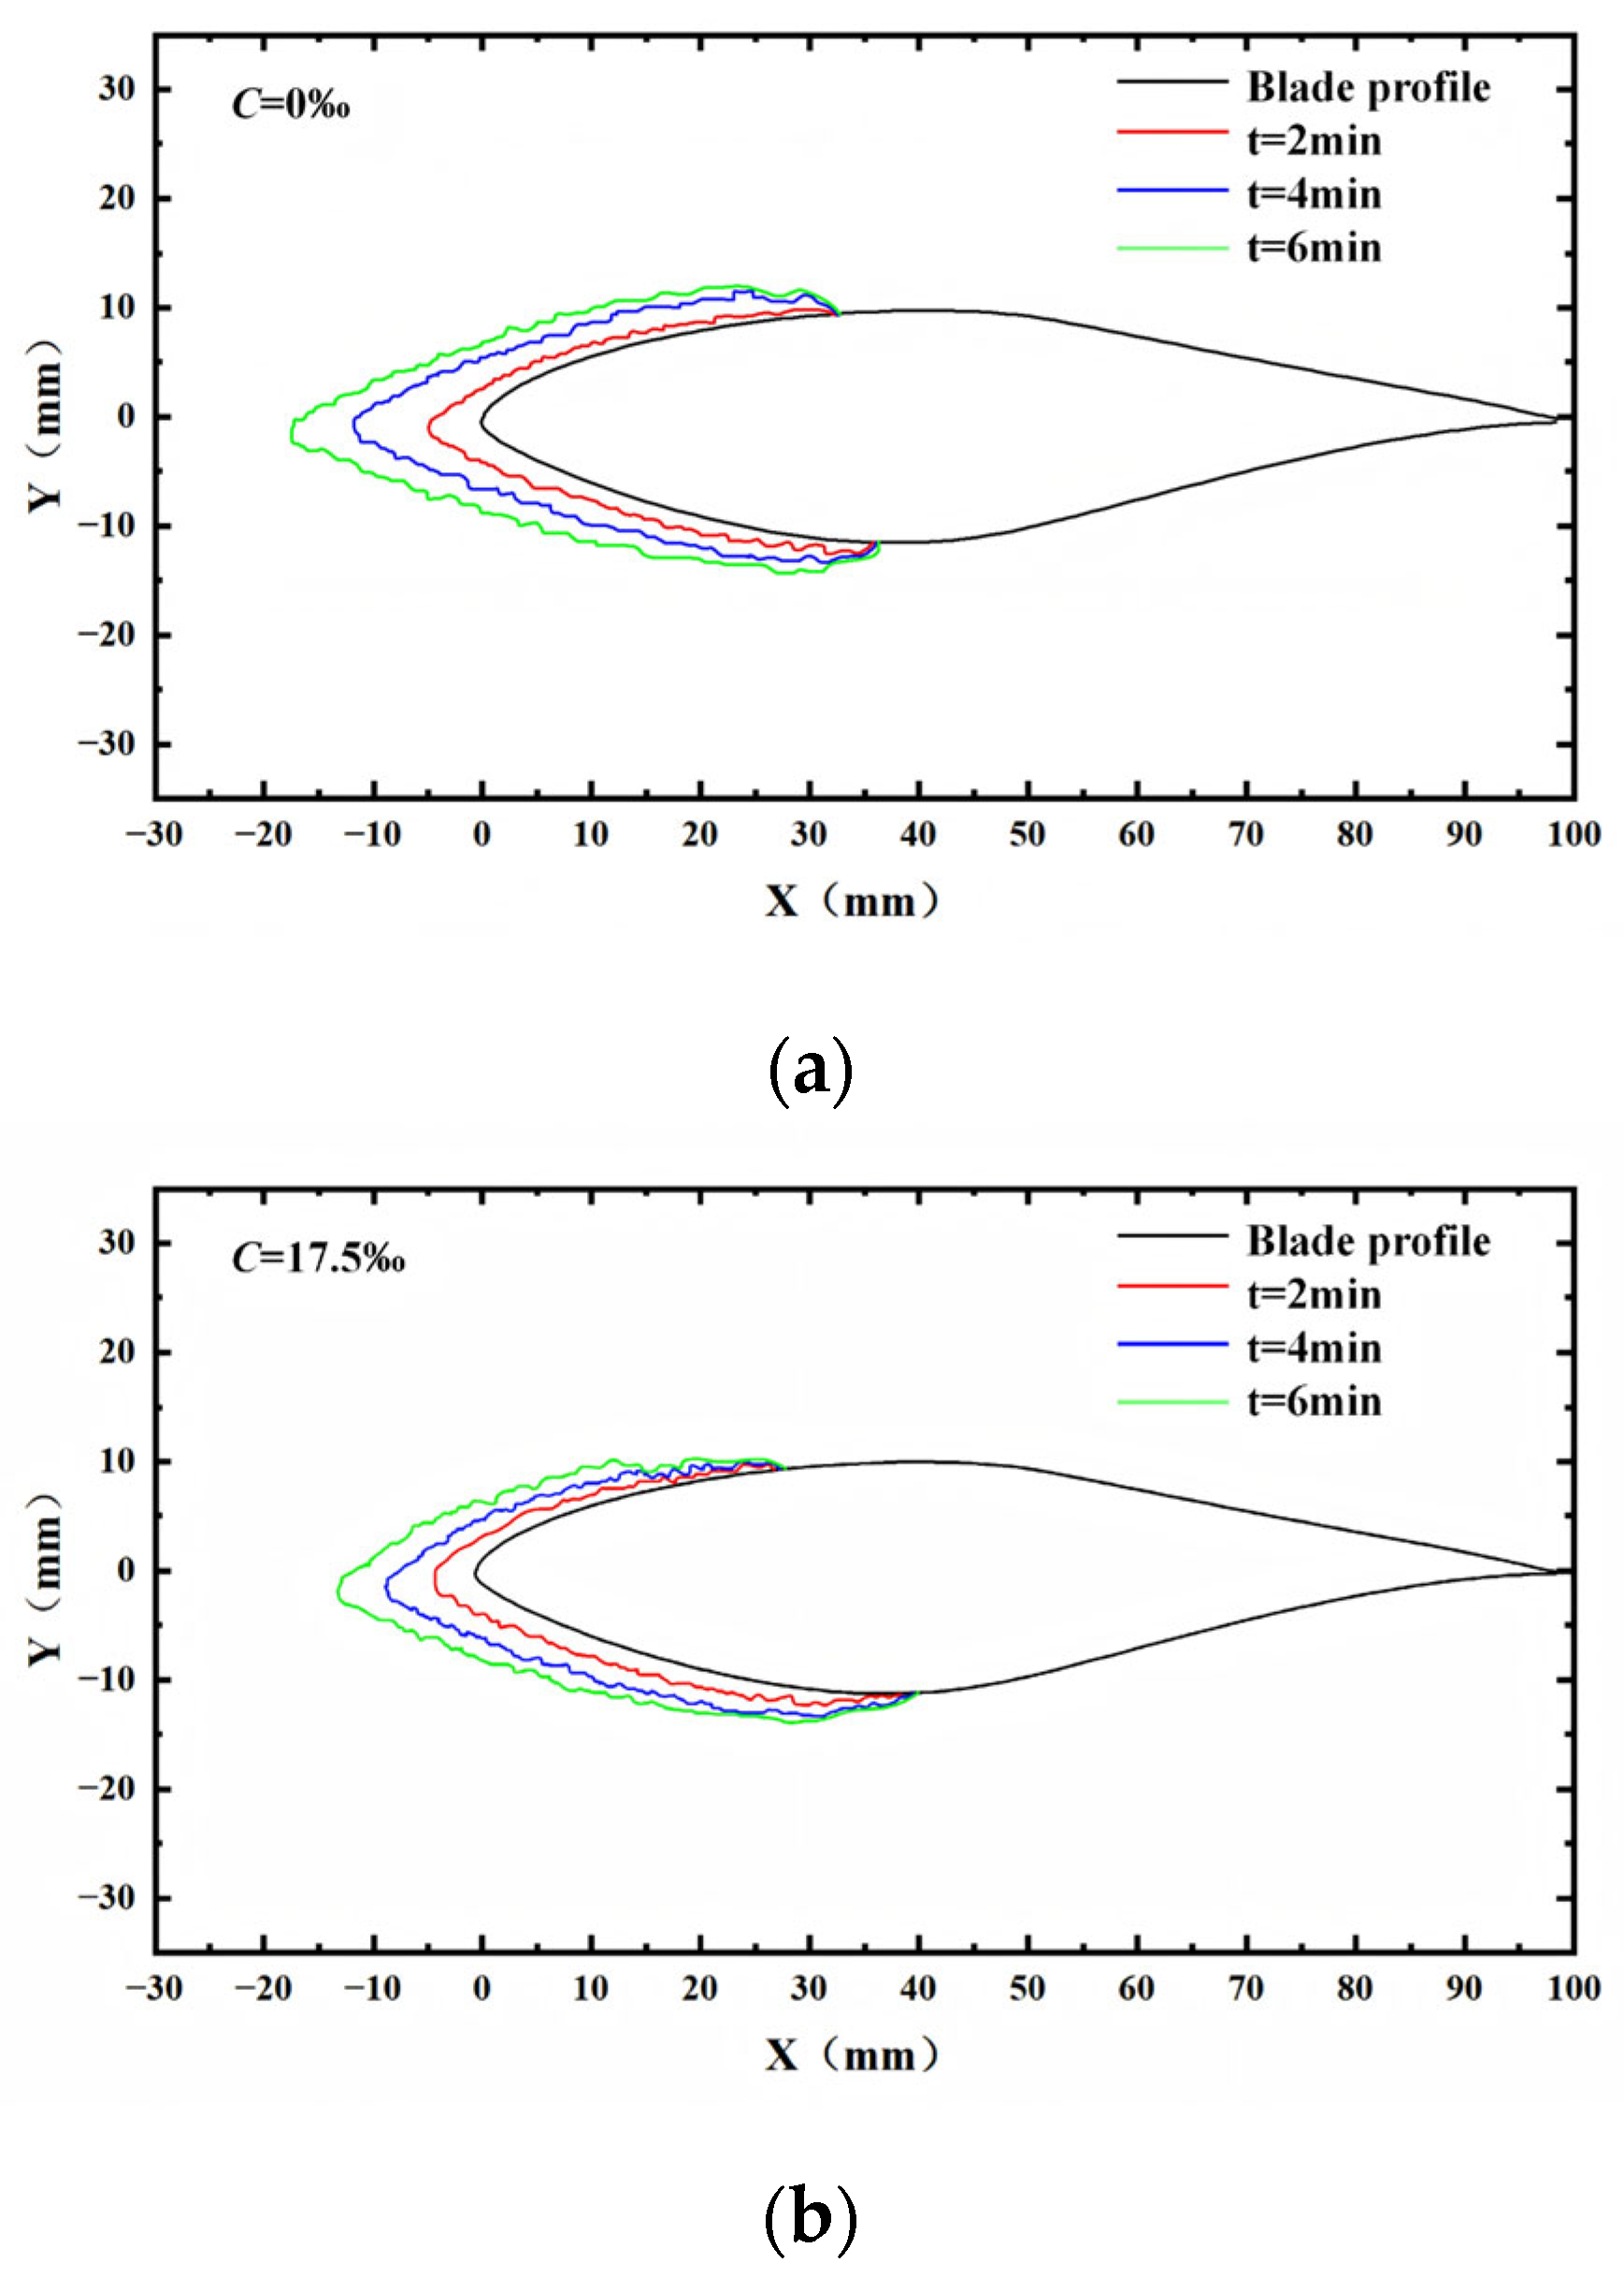
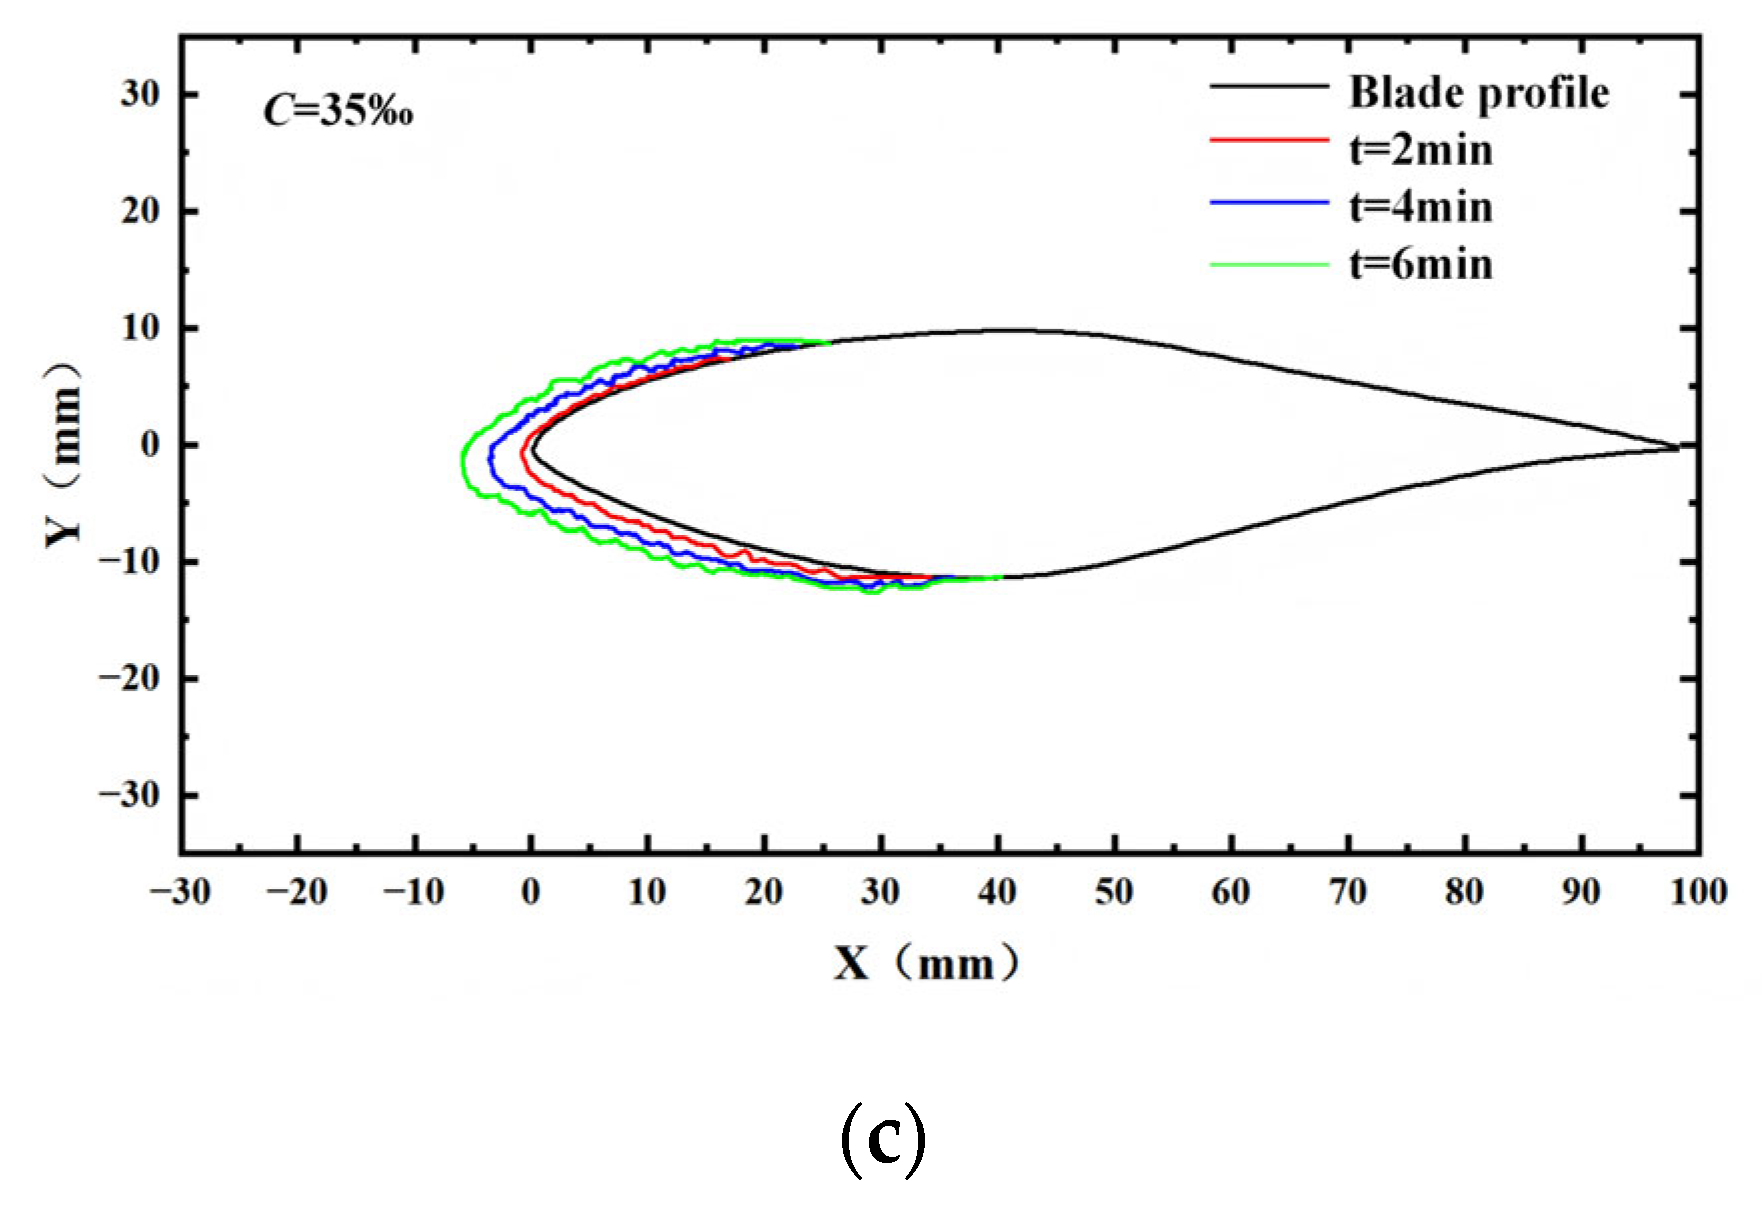
A high-definition camera was used to capture images of the iced blade throughout the experiment, and the image data were digitally transferred to a computer for post-processing. Image analysis software was employed to extract the blade’s surface contours and identify the boundaries of the accreted ice layer. By calculating the overlapping region between the airfoil profile and the ice boundary, the ice-covered area on the blade surface was quantitatively determined. Figure 8 depicts the evolution of the blade’s icing profiles over time under different salinity. Dimensional calibration based on the actual physical model was performed to ensure measurement accuracy, thereby providing reliable data for the analysis of ice morphology.
Figure 8.
Profiles of icing on blade surface: (a) C = 0‰; (b) C = 17.5‰; (c) C = 35‰.
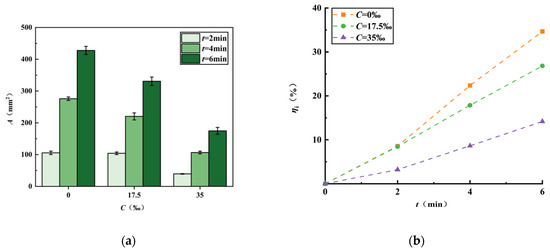
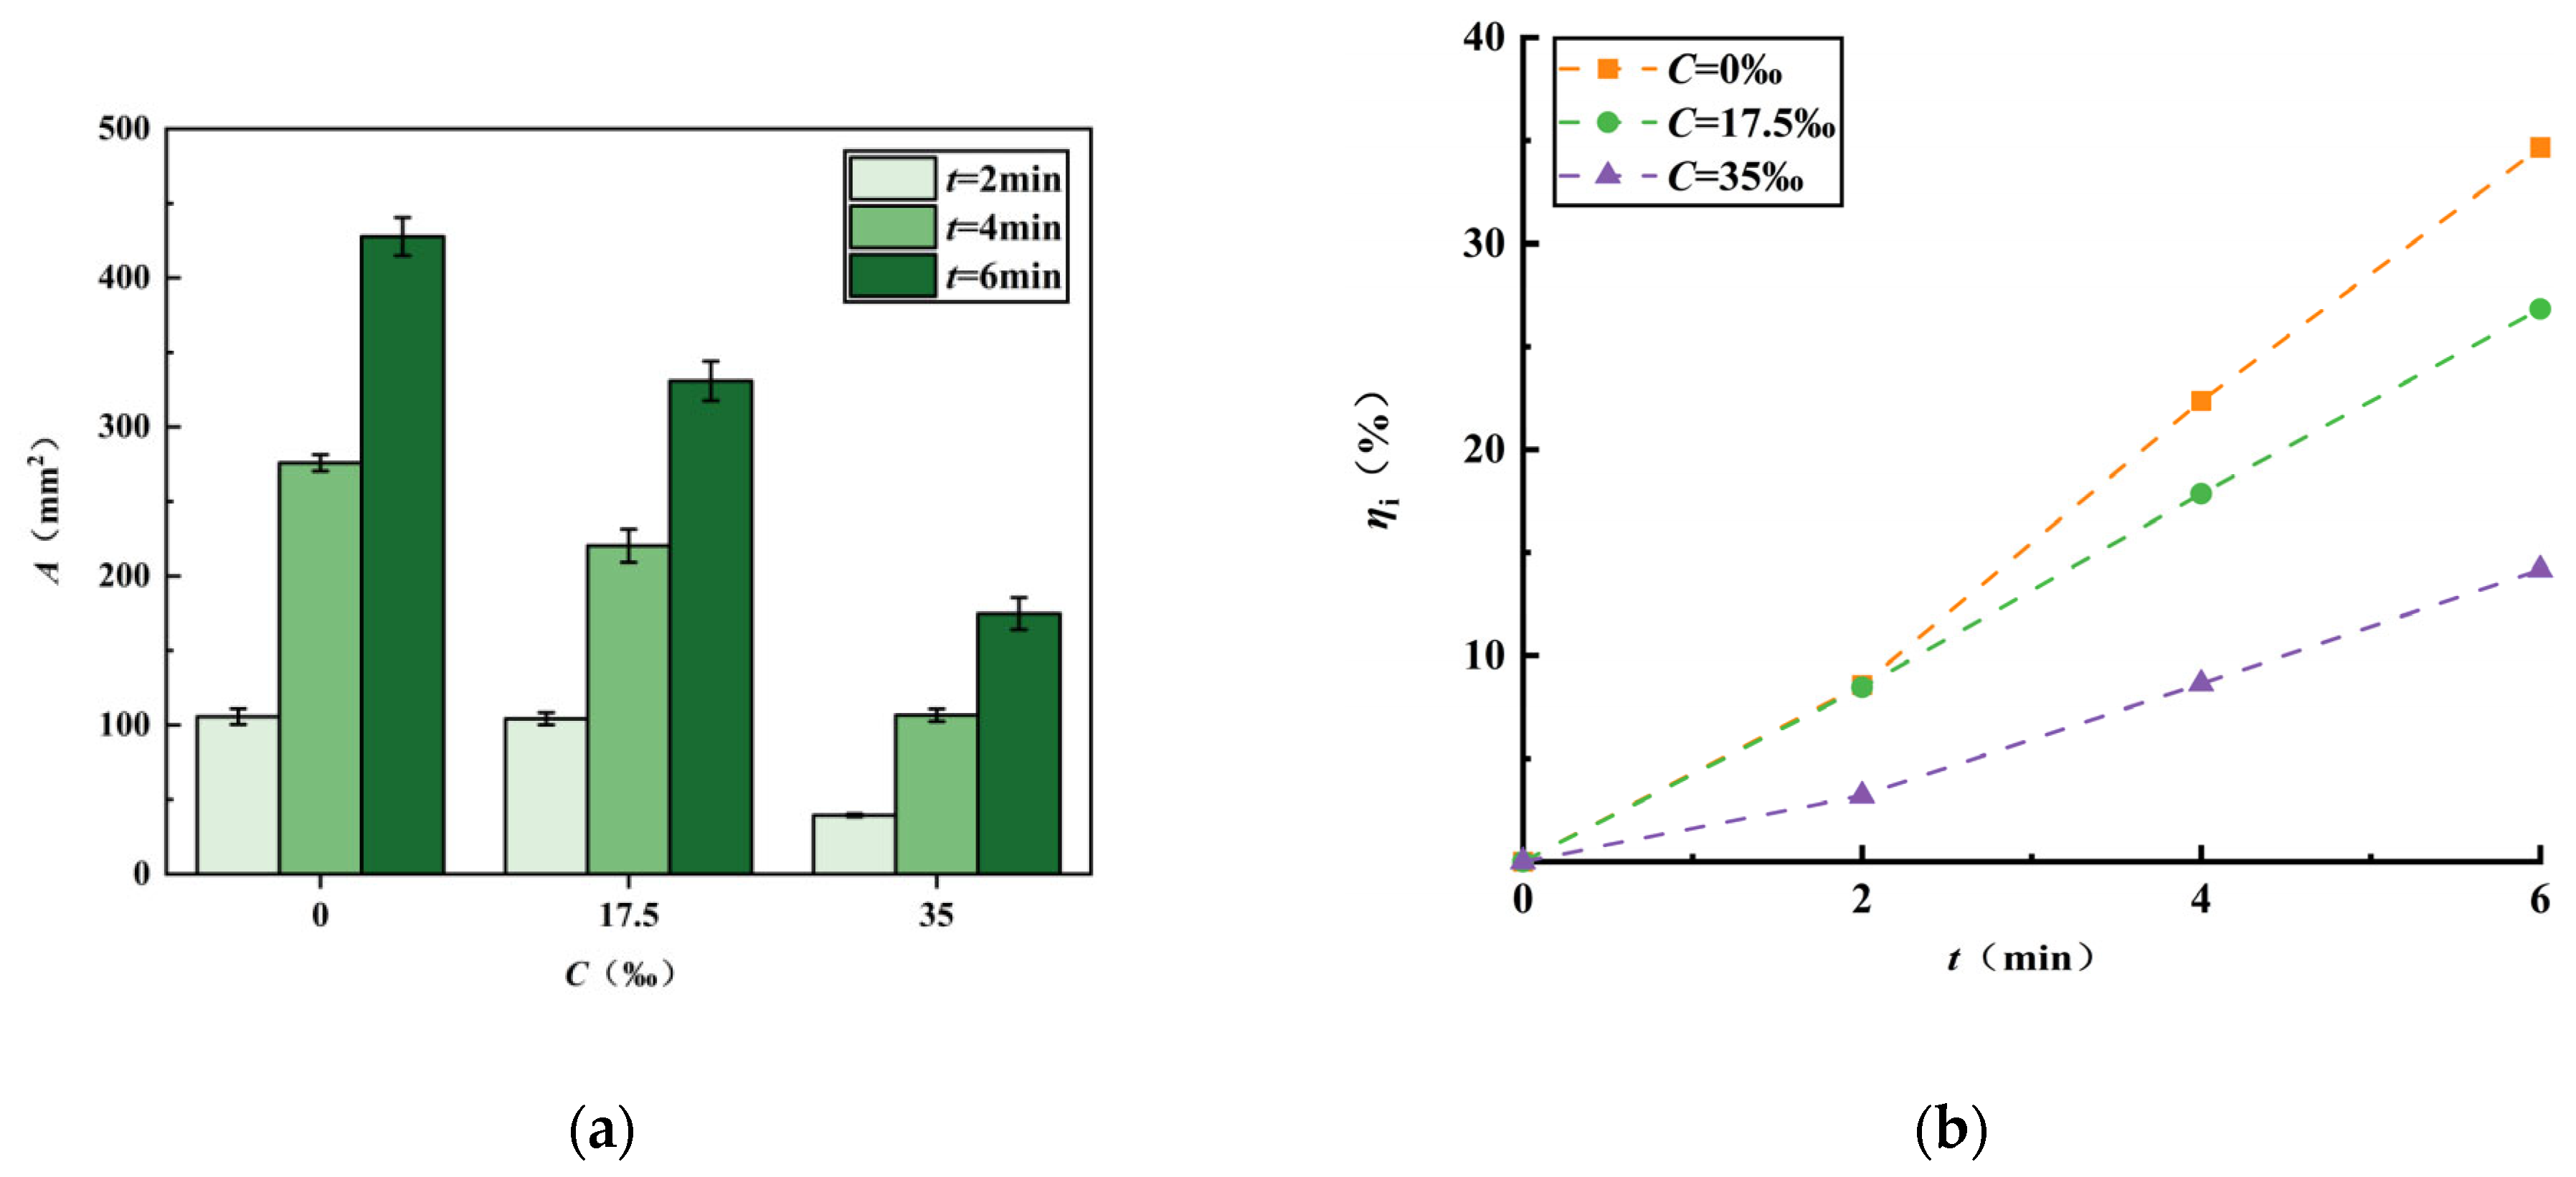
Figure 9a presents the icing area measurements under different salinity conditions. At an icing time of 2 min, the icing area is 105.68 mm2 for C = 0‰, 104.22 mm2 for C = 17.5‰, and significantly lower at 39.48 mm2 for C = 35‰, indicating that higher salinity markedly reduces initial ice accumulation. At 4 min, the corresponding icing areas increase to 275.93 mm2, 220.26 mm2, and 106.58 mm2, respectively. While all three cases show a continued growth in icing area, the differences among them become more pronounced as salinity increases. By the 6 min mark, the areas reach 427.67 mm2 for C = 0‰, 330.83 mm2 for C = 17.5‰, and 174.76 mm2 for C = 35‰. These results indicate that, within the same time period, higher salinity consistently leads to smaller icing areas and a slower rate of ice accumulation. Overall, the data reveal a clear trend: as salinity increases, both the extent and the rate of ice coverage growth decrease. The condition with no salinity (C = 0‰) produces the largest icing area, while the condition with high salinity (C = 35‰) results in the smallest. Figure 9b shows the corresponding trends in total icing area rate for the same conditions. All three curves exhibit approximately linear growth with time, but the slope decreases significantly with increasing salinity. This demonstrates that elevated salinity levels suppress the rate at which the icing area expands. At 6 min, the total icing area rates are 34.67% for C = 0‰, 26.82% for C = 17.5‰, and 14.17% for C = 35‰. Compared to the pure water condition, the high salinity environment results in a 20.5% reduction in total icing area rate. These findings suggest that although the LWC remains constant, the presence of salt lowers the freezing point and delays the onset of solidification, thereby slowing ice growth and reducing the extent of surface coverage over a given time interval.
Figure 9.
Icing area at different salinity: (a) Icing area; (b) Total icing area rate.
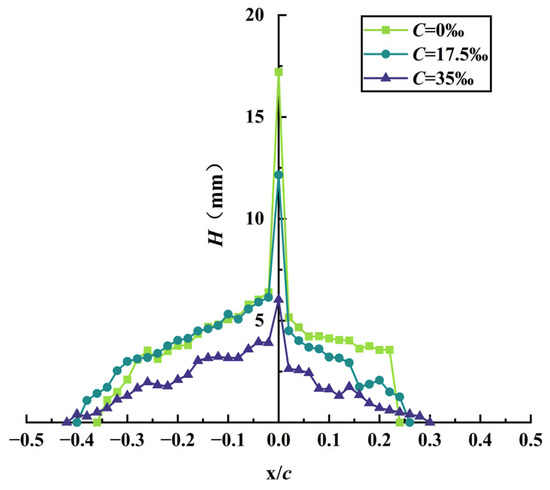
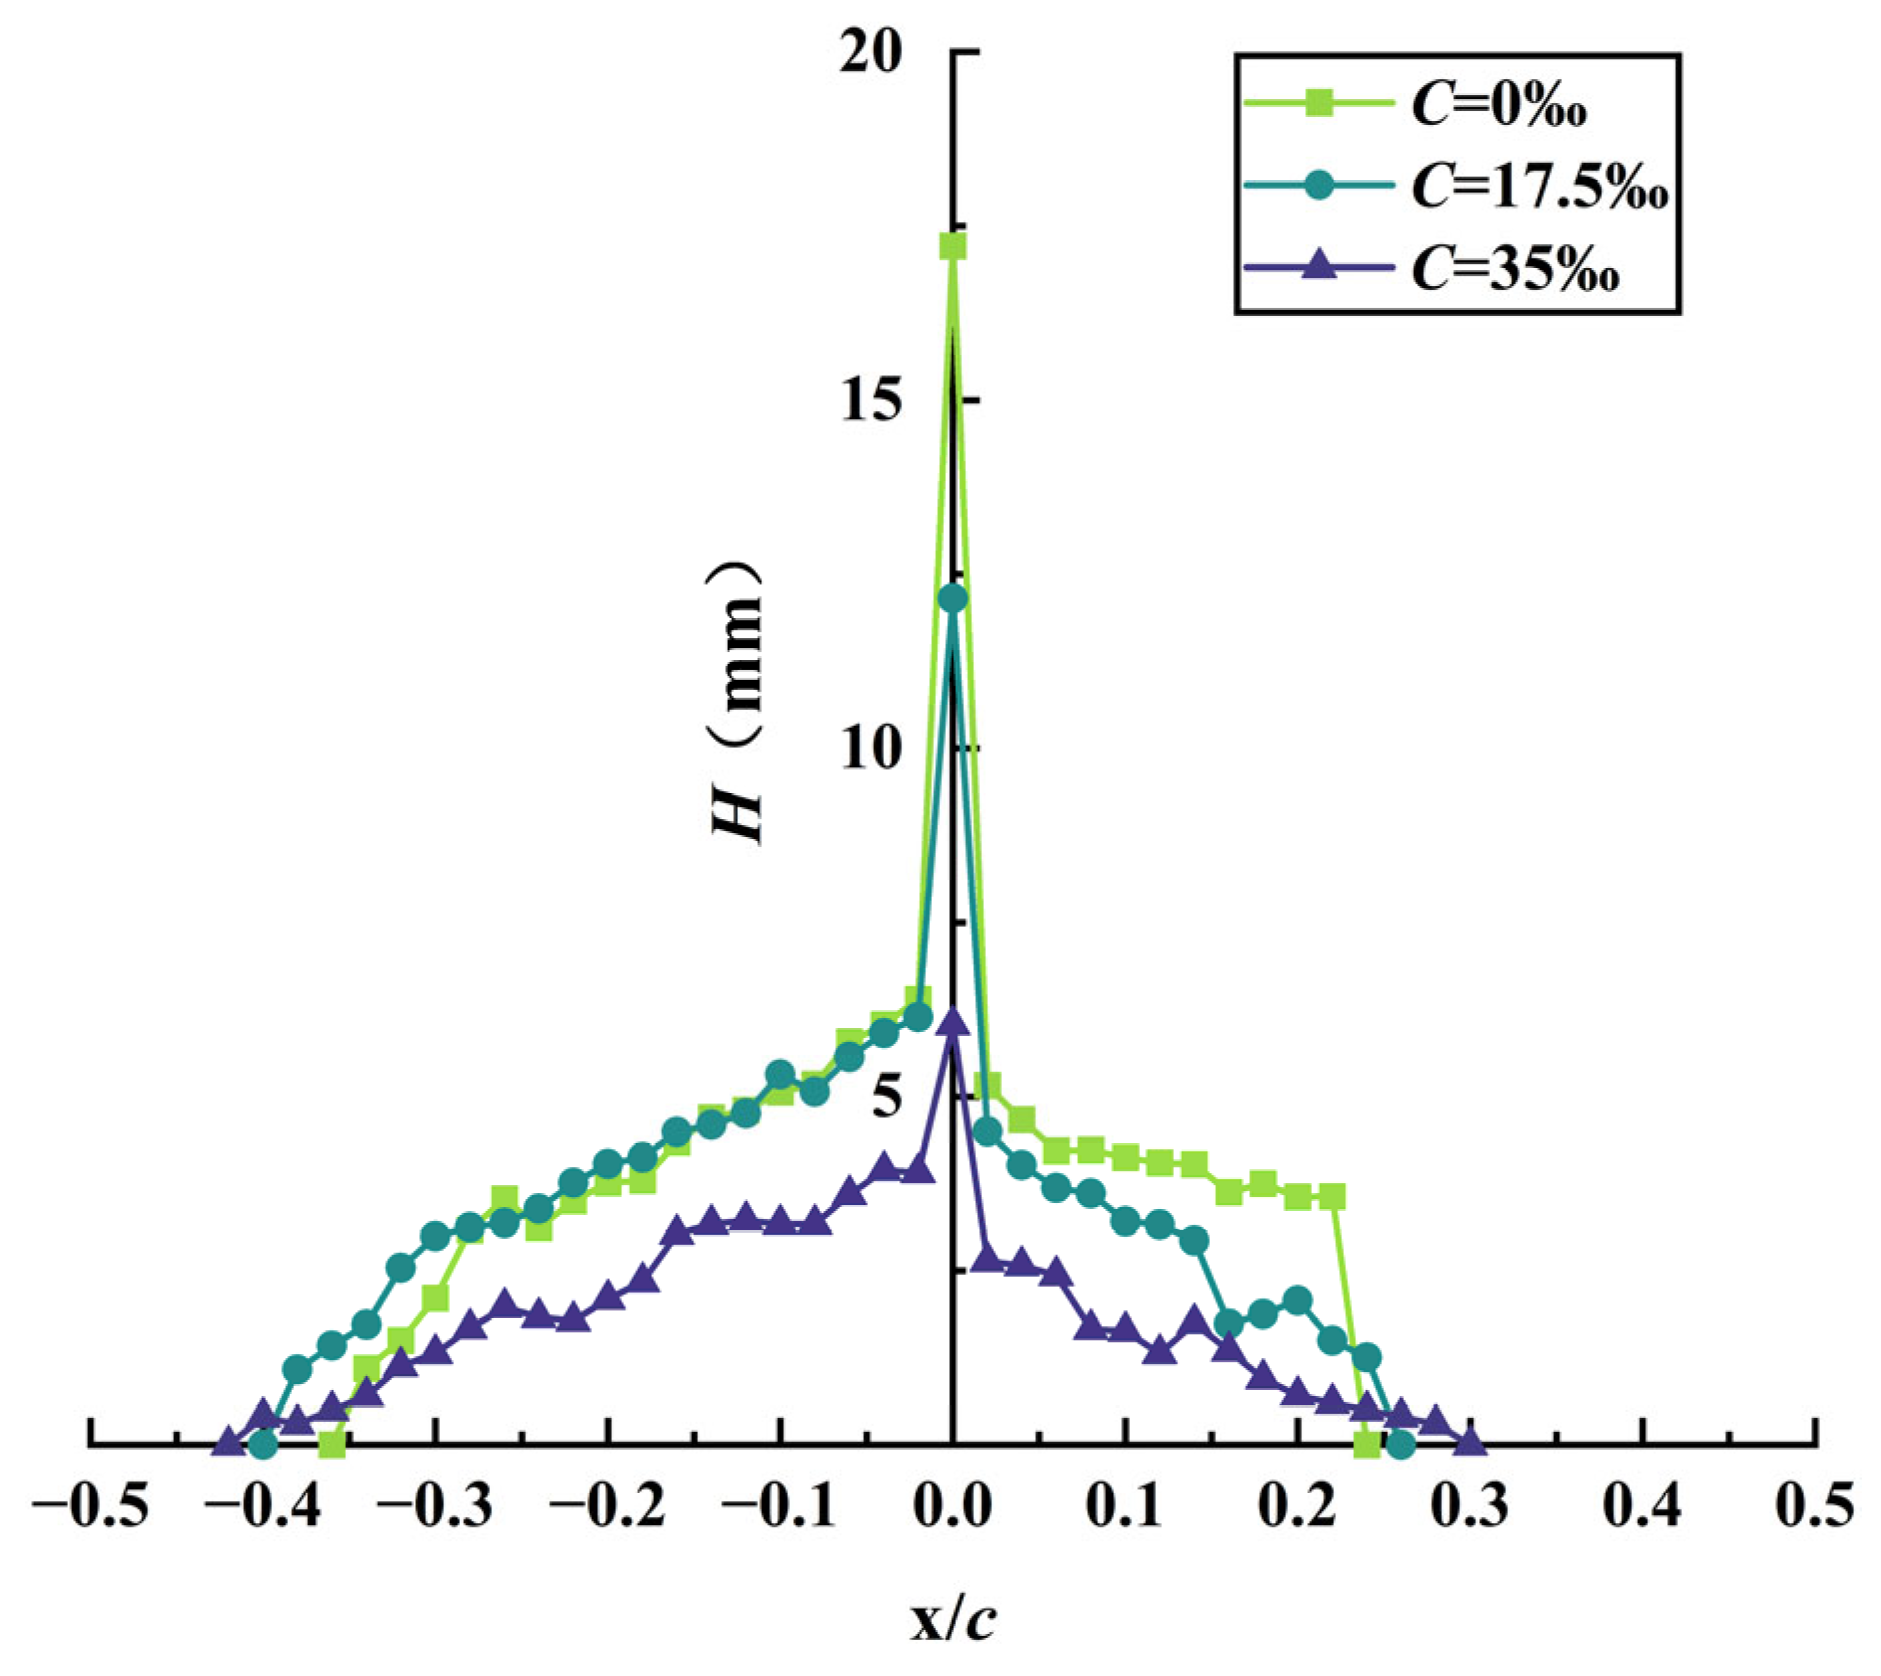
Figure 10 shows the variation in ice thickness on the blade surface after 6 min of exposure under different salinity conditions. The positive direction along the horizontal axis corresponds to the upper surface of the blade, ranging from the leading edge toward the trailing edge, while the negative direction represents the lower surface. As shown, the icing range expands progressively with increasing salinity: −36%–24% at C = 0‰, −40%–26% at C = 17.5‰, and −42%–30% at C = 35‰. This indicates that higher salinity levels lead to a broader spatial distribution of ice accretion on the blade surface. The observed increase in icing range can be attributed to the freezing point depression caused by salinity, which prolongs the time required for water droplets to solidify. During this delay, droplets are influenced by gravity and aerodynamic forces, allowing them to migrate further downstream from the leading edge toward the trailing edge before freezing. As they move, latent heat is gradually released, resulting in an extended icing footprint. Under all salinity conditions, the ice thickness on the lower surface of the blade is consistently greater than that on the upper surface. Moreover, with increasing salinity, the maximum ice thickness near the leading edge decreases significantly. The observed reduction in ice thickness with increasing salinity aligns qualitatively with Ren et al. [27], who noted smoother ice surfaces under saline conditions. However, our quantitative results go significantly further: the peak ice thickness at the leading edge is 17.21 mm for C = 0‰, 12.15 mm for C = 17.5‰, and 6.03 mm for C = 35‰. These results further confirm that the presence of dissolved salts in a marine atmospheric environment exerts a clear inhibitory effect on the ice accretion process of offshore wind turbine blades. Compared to freshwater icing, saline offshore icing forms rounder, glaze-dominated ice. Freshwater icing is localized to the leading edge, while saline icing spreads further downstream due to delayed freezing of droplets.
Figure 10.
Ice thickness of blade with different salinity.
3.2. Effect of LWC
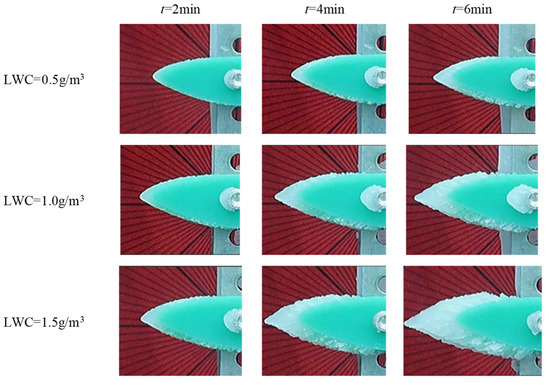
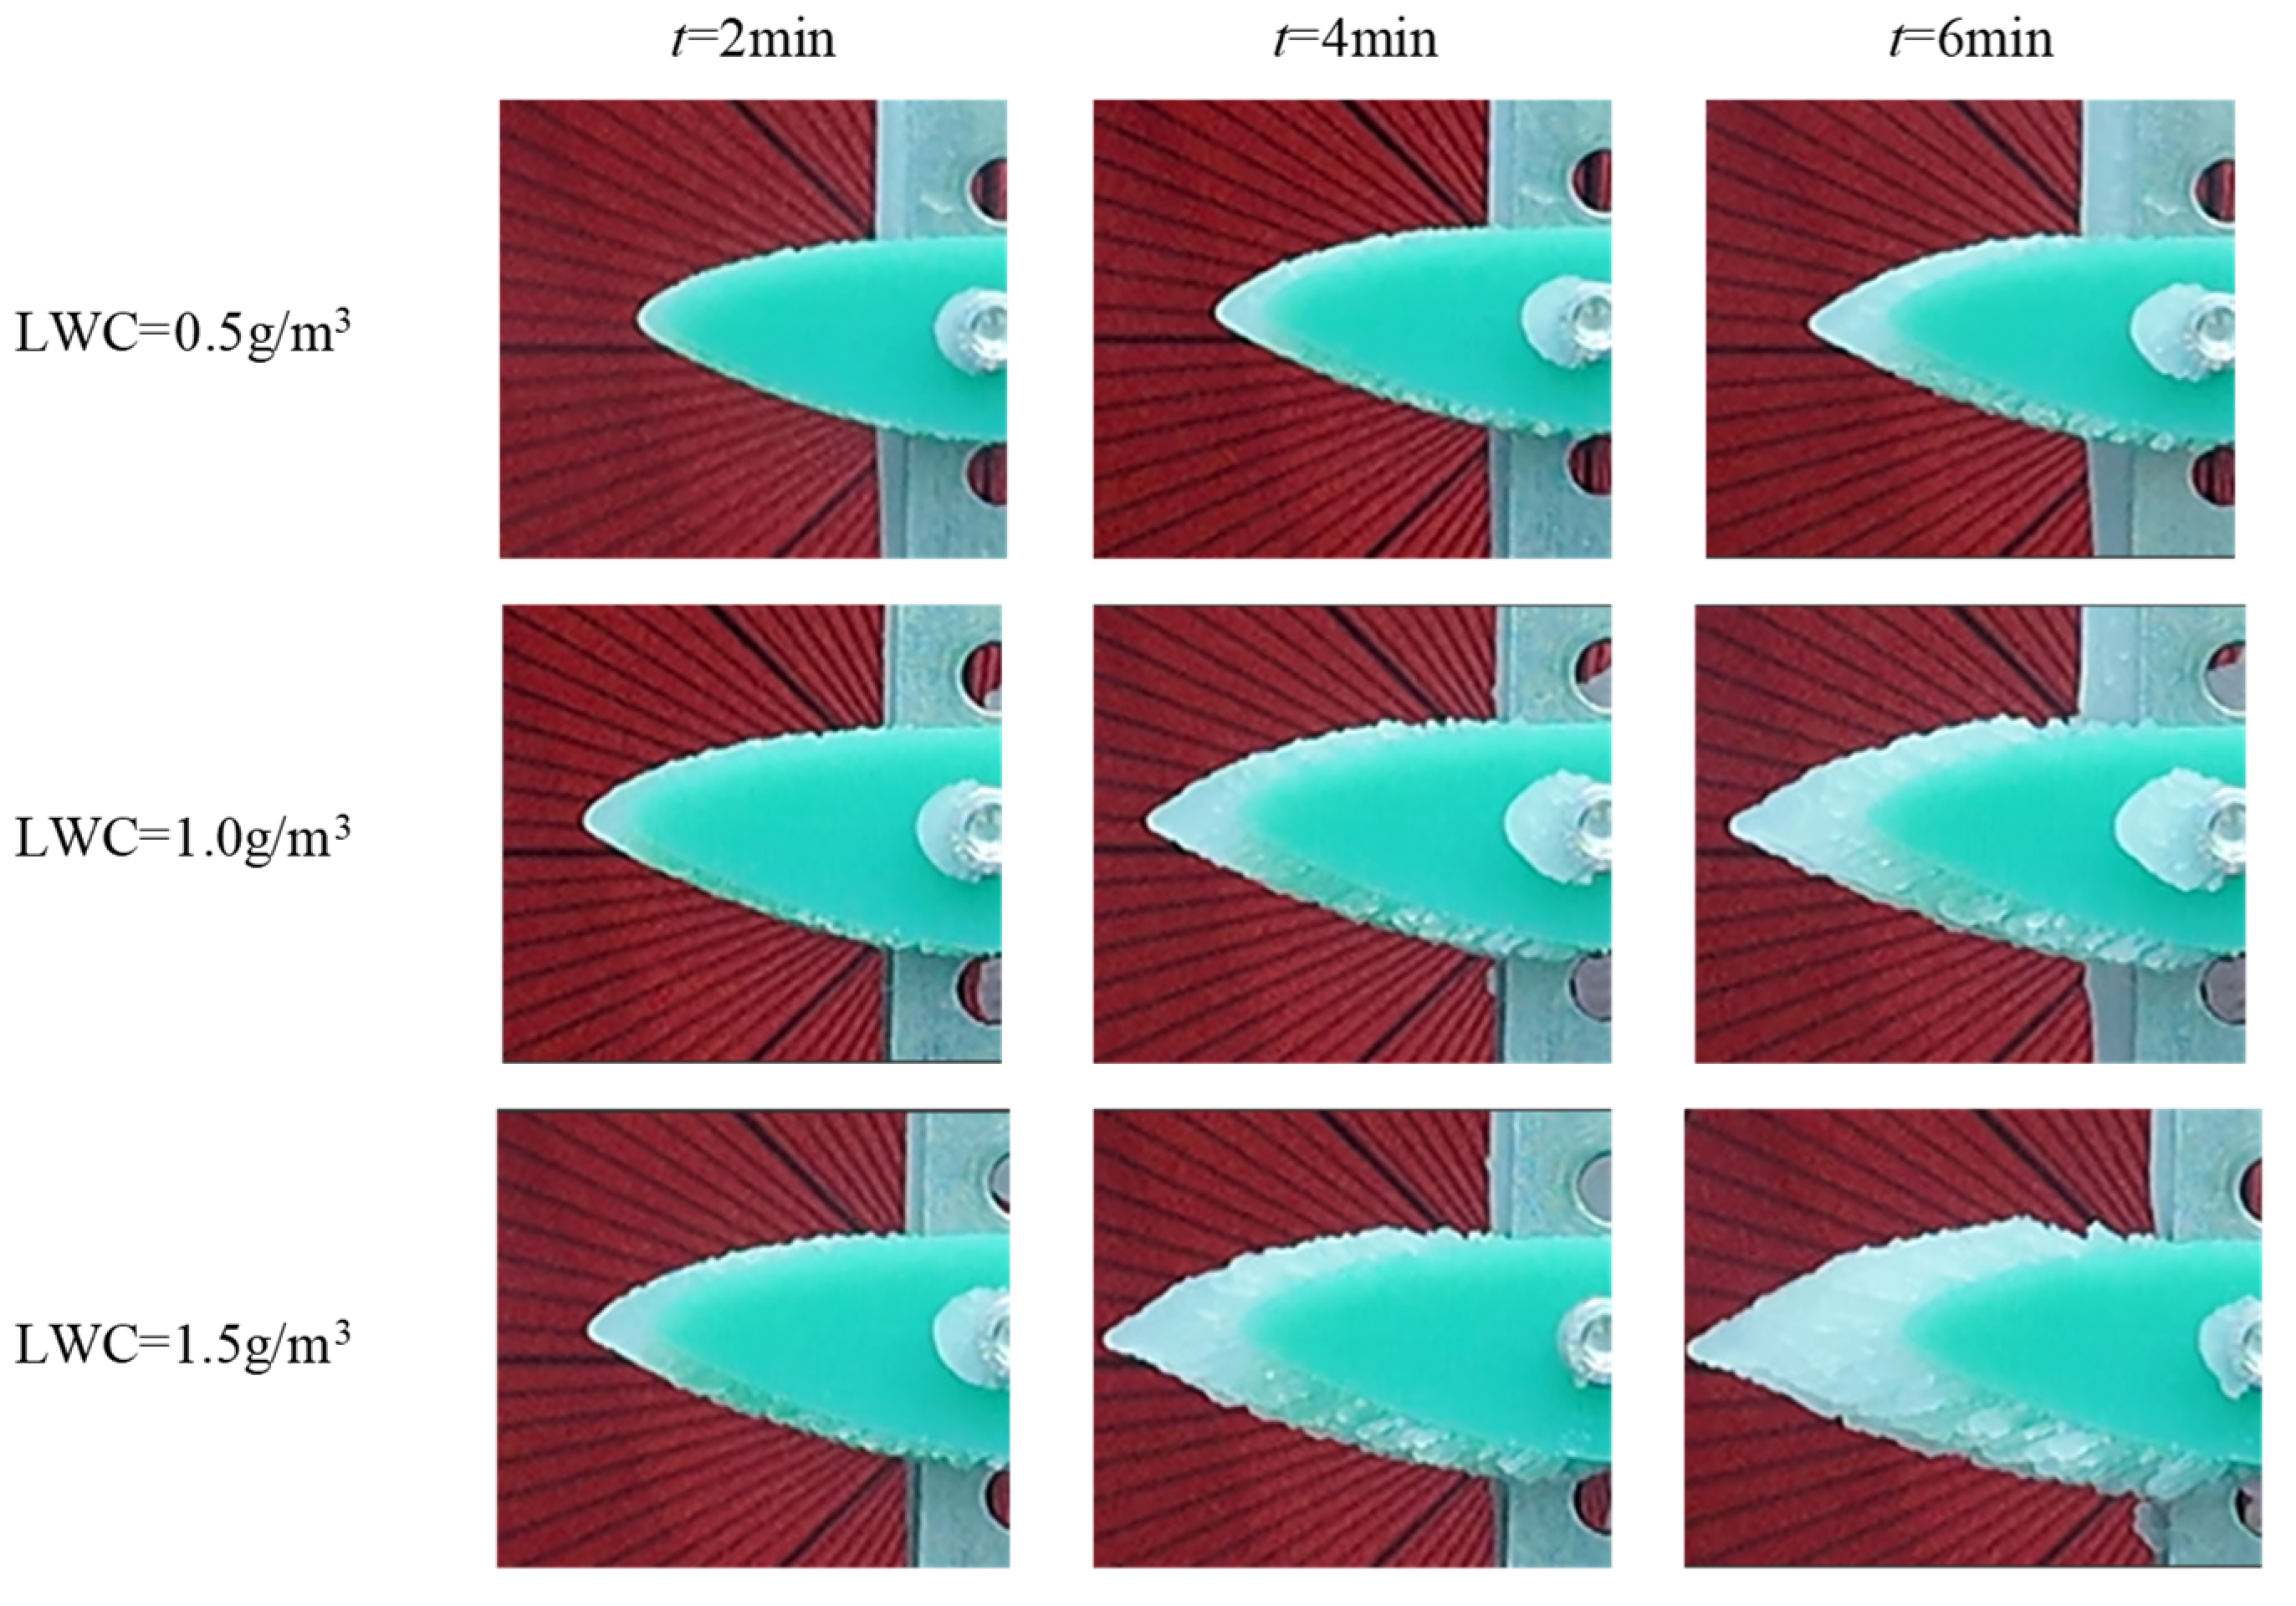
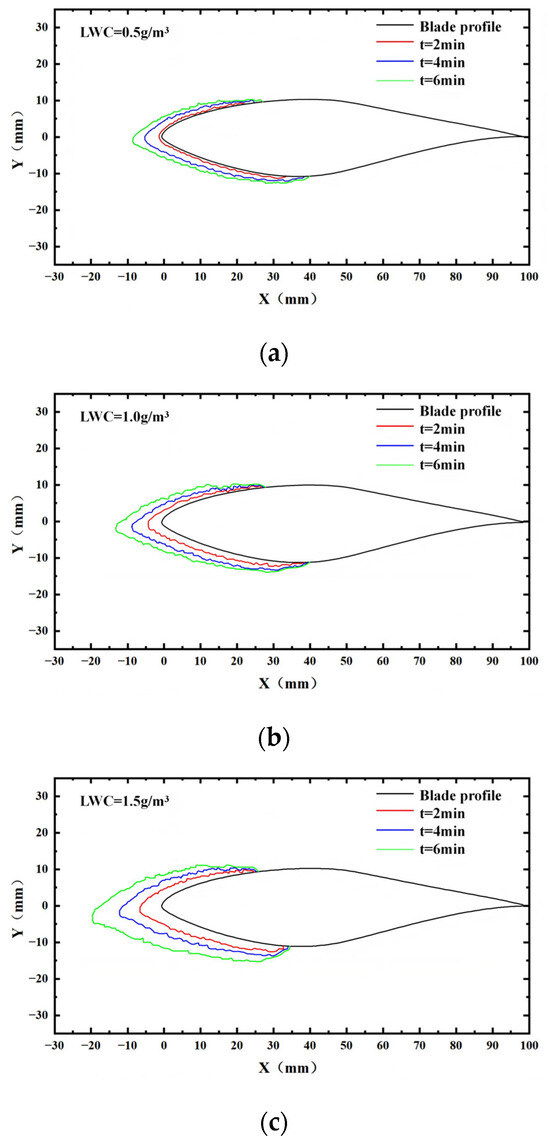
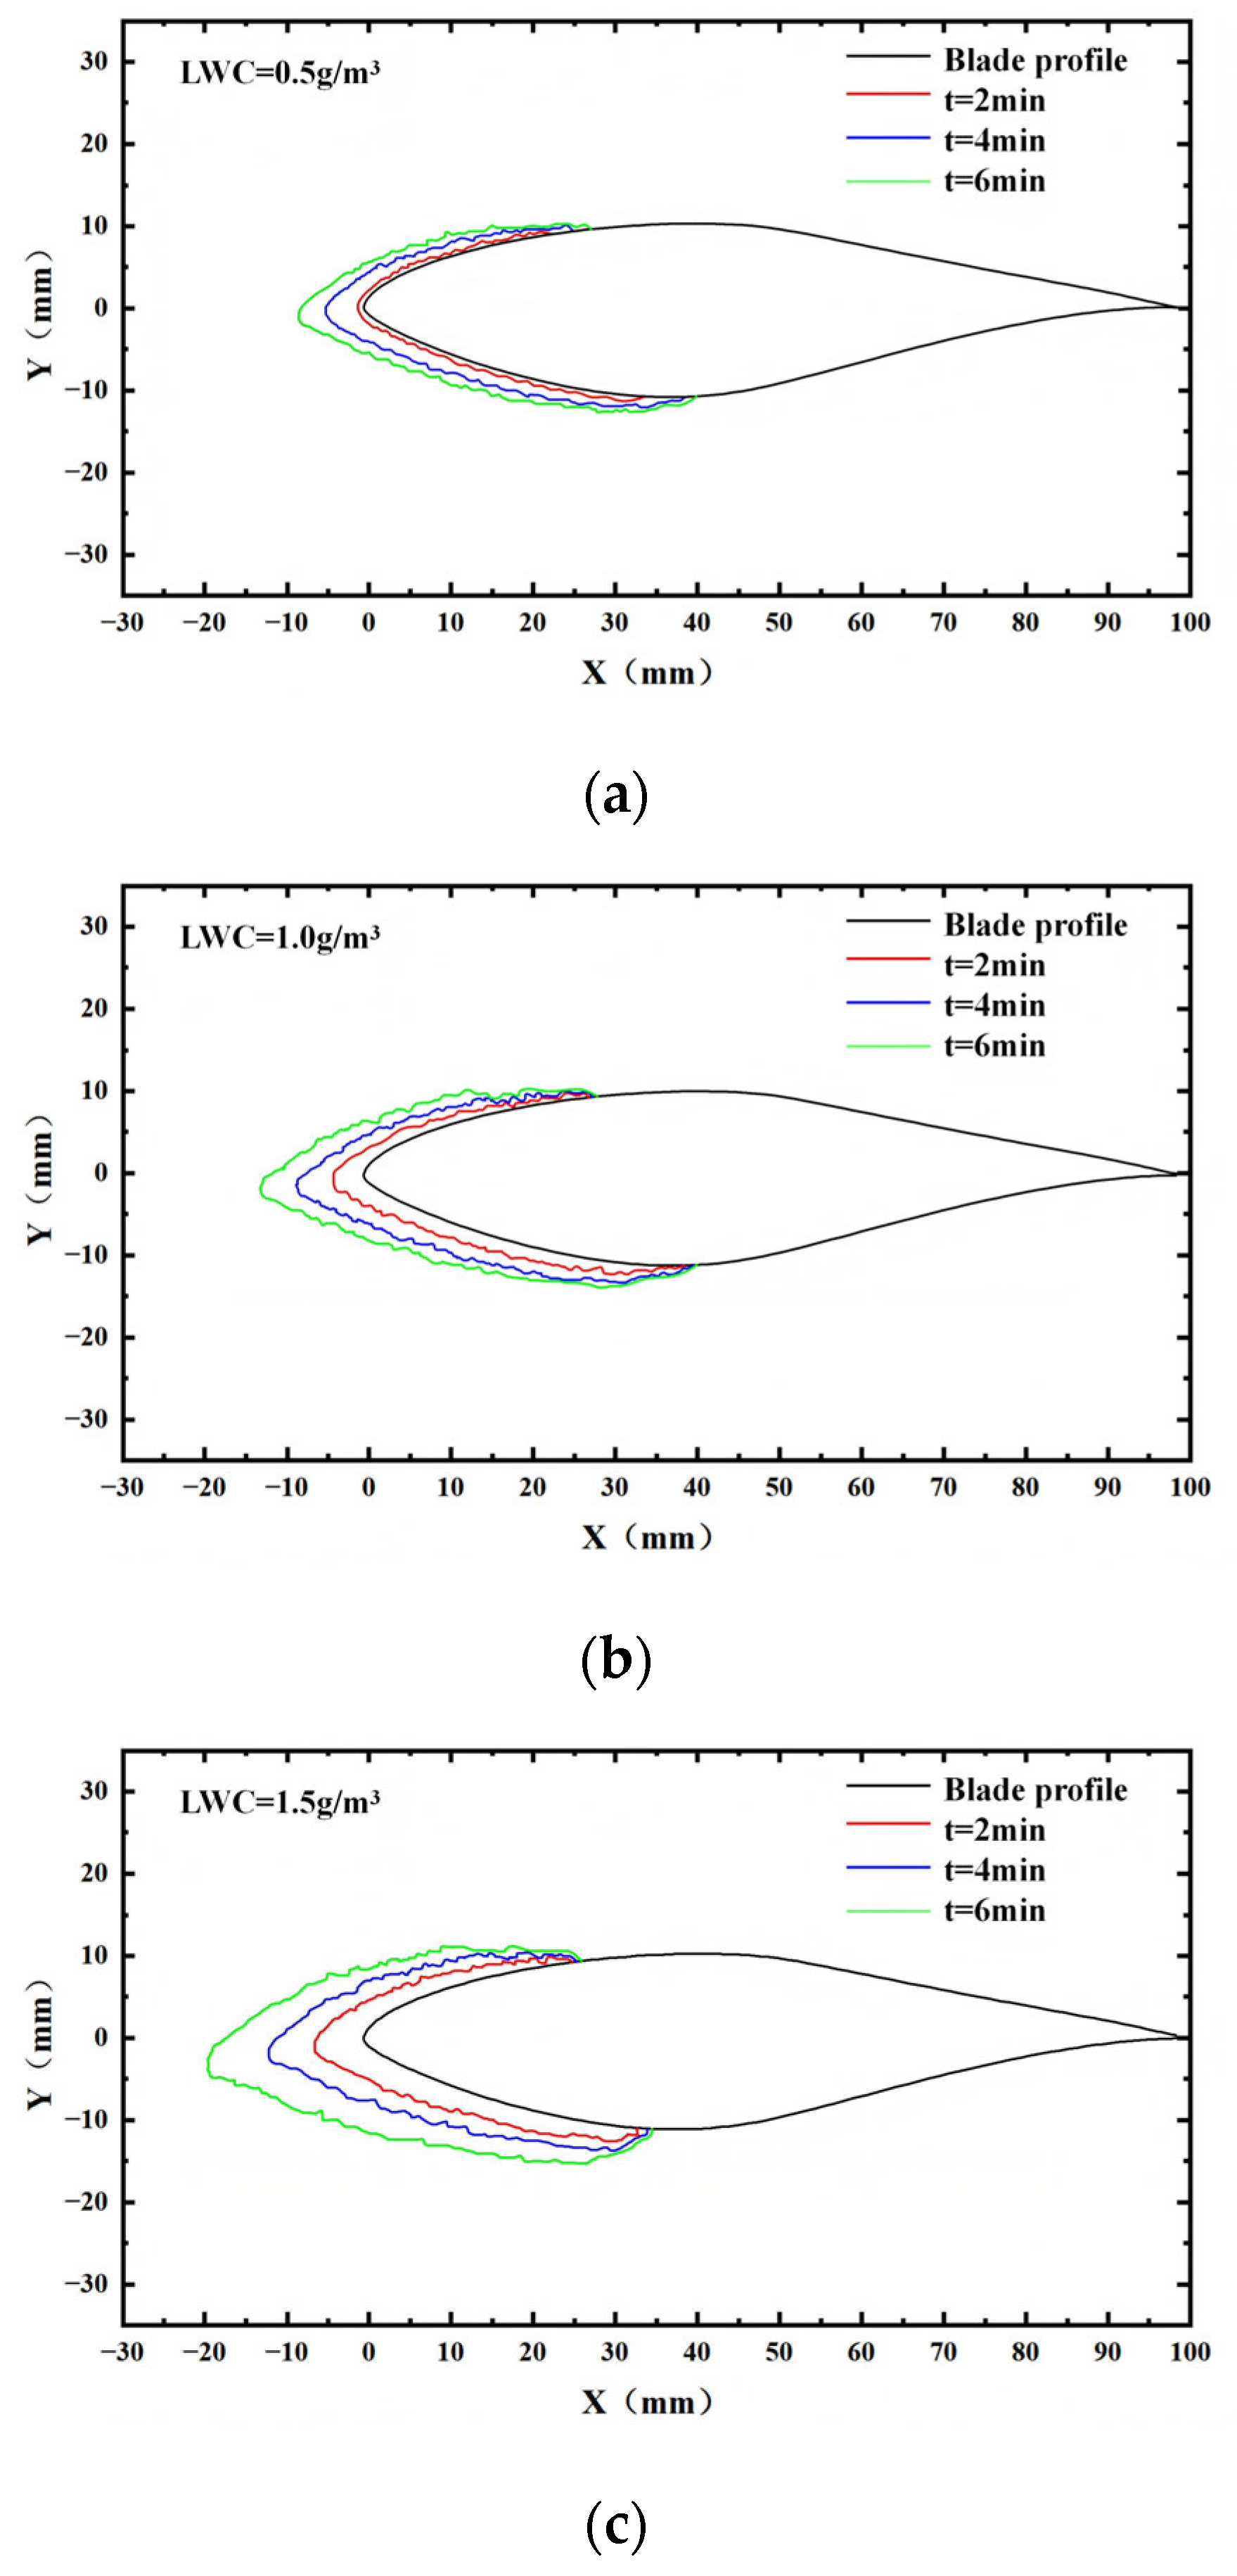
Under a salinity condition of 17.5‰, experiments were conducted with LWC of 0.5 g/m3, 1.0 g/m3, and 1.5 g/m3, at a wind speed of 10 m/s, a temperature of −8 °C, and icing durations of 2, 4, and 6 min. The objective was to investigate the influence of LWC on icing distribution under saline water conditions. The resulting icing morphologies are illustrated in Figure 11. Notable differences were observed in the icing characteristics on the blade surface across varying LWC levels. In the initial stages of icing, the ice layer remains thin; however, with continued exposure, supercooled droplets progressively accumulate, increasing ice thickness over time. As the ice layer thickens, its contour becomes increasingly irregular, which may disrupt the blade’s original aerodynamic design. In terms of ice type, all conditions exhibit typical features of mixed ice, but a pronounced dominance of glaze ice is evident. The surface of the ice layer appears smooth, compact, highly transparent, and glossy—features characteristic of rapid surface freezing without complete crystallization. This is consistent with icing behavior under high degrees of supercooling and efficient heat transfer. The presence of saline water further influences ice formation. Due to its lower freezing point compared to pure water, saline water slows down the growth of ice crystals, resulting in a finer and more homogeneous ice microstructure that promotes the formation of glaze ice. As LWC increases, the severity of icing intensifies considerably. At LWC = 0.5 g/m3, the ice layer is relatively thin and localized, primarily forming on the upper surface of the leading edge, with minimal aerodynamic interference. At LWC = 1.0 g/m3, ice thickness increases significantly, extending along the chord and beginning to encroach on the lower surface, accompanied by slight edge curling. When LWC reaches 1.5 g/m3, the leading edge is fully enveloped in a thick ice layer, and prominent “corner-like” or “serrated” protrusions emerge. These indicate a heightened frequency of droplet impact and enhanced accumulation effects. In addition, due to the delayed nucleation effect of salinity, some unfrozen droplets may flow under gravity and subsequently refreeze, contributing to the formation of irregular surface protrusions. Over time, the ice layer continues to grow under all LWC conditions. However, the growth rate clearly accelerates as LWC increases, this is consistent with the results of numerical simulation [33], verifying the accuracy of the experiment, confirming that LWC is a critical factor in determining the rate and extent of icing on wind turbine blades.
Figure 11.
Effect of LWC on blade ice morphology.
Figure 12 depicts the evolution of the blade’s icing profiles over time under different LWC.
Figure 12.
Profiles of icing on blade surface: (a) LWC = 0.5 g/m3; (b) LWC = 1.0 g/m3; (c) LWC = 1.5 g/m3.
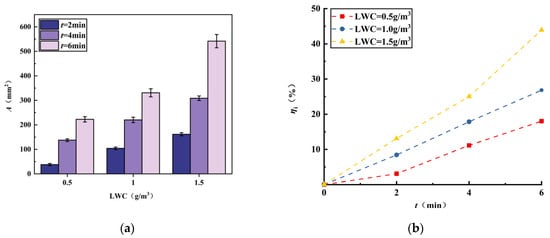
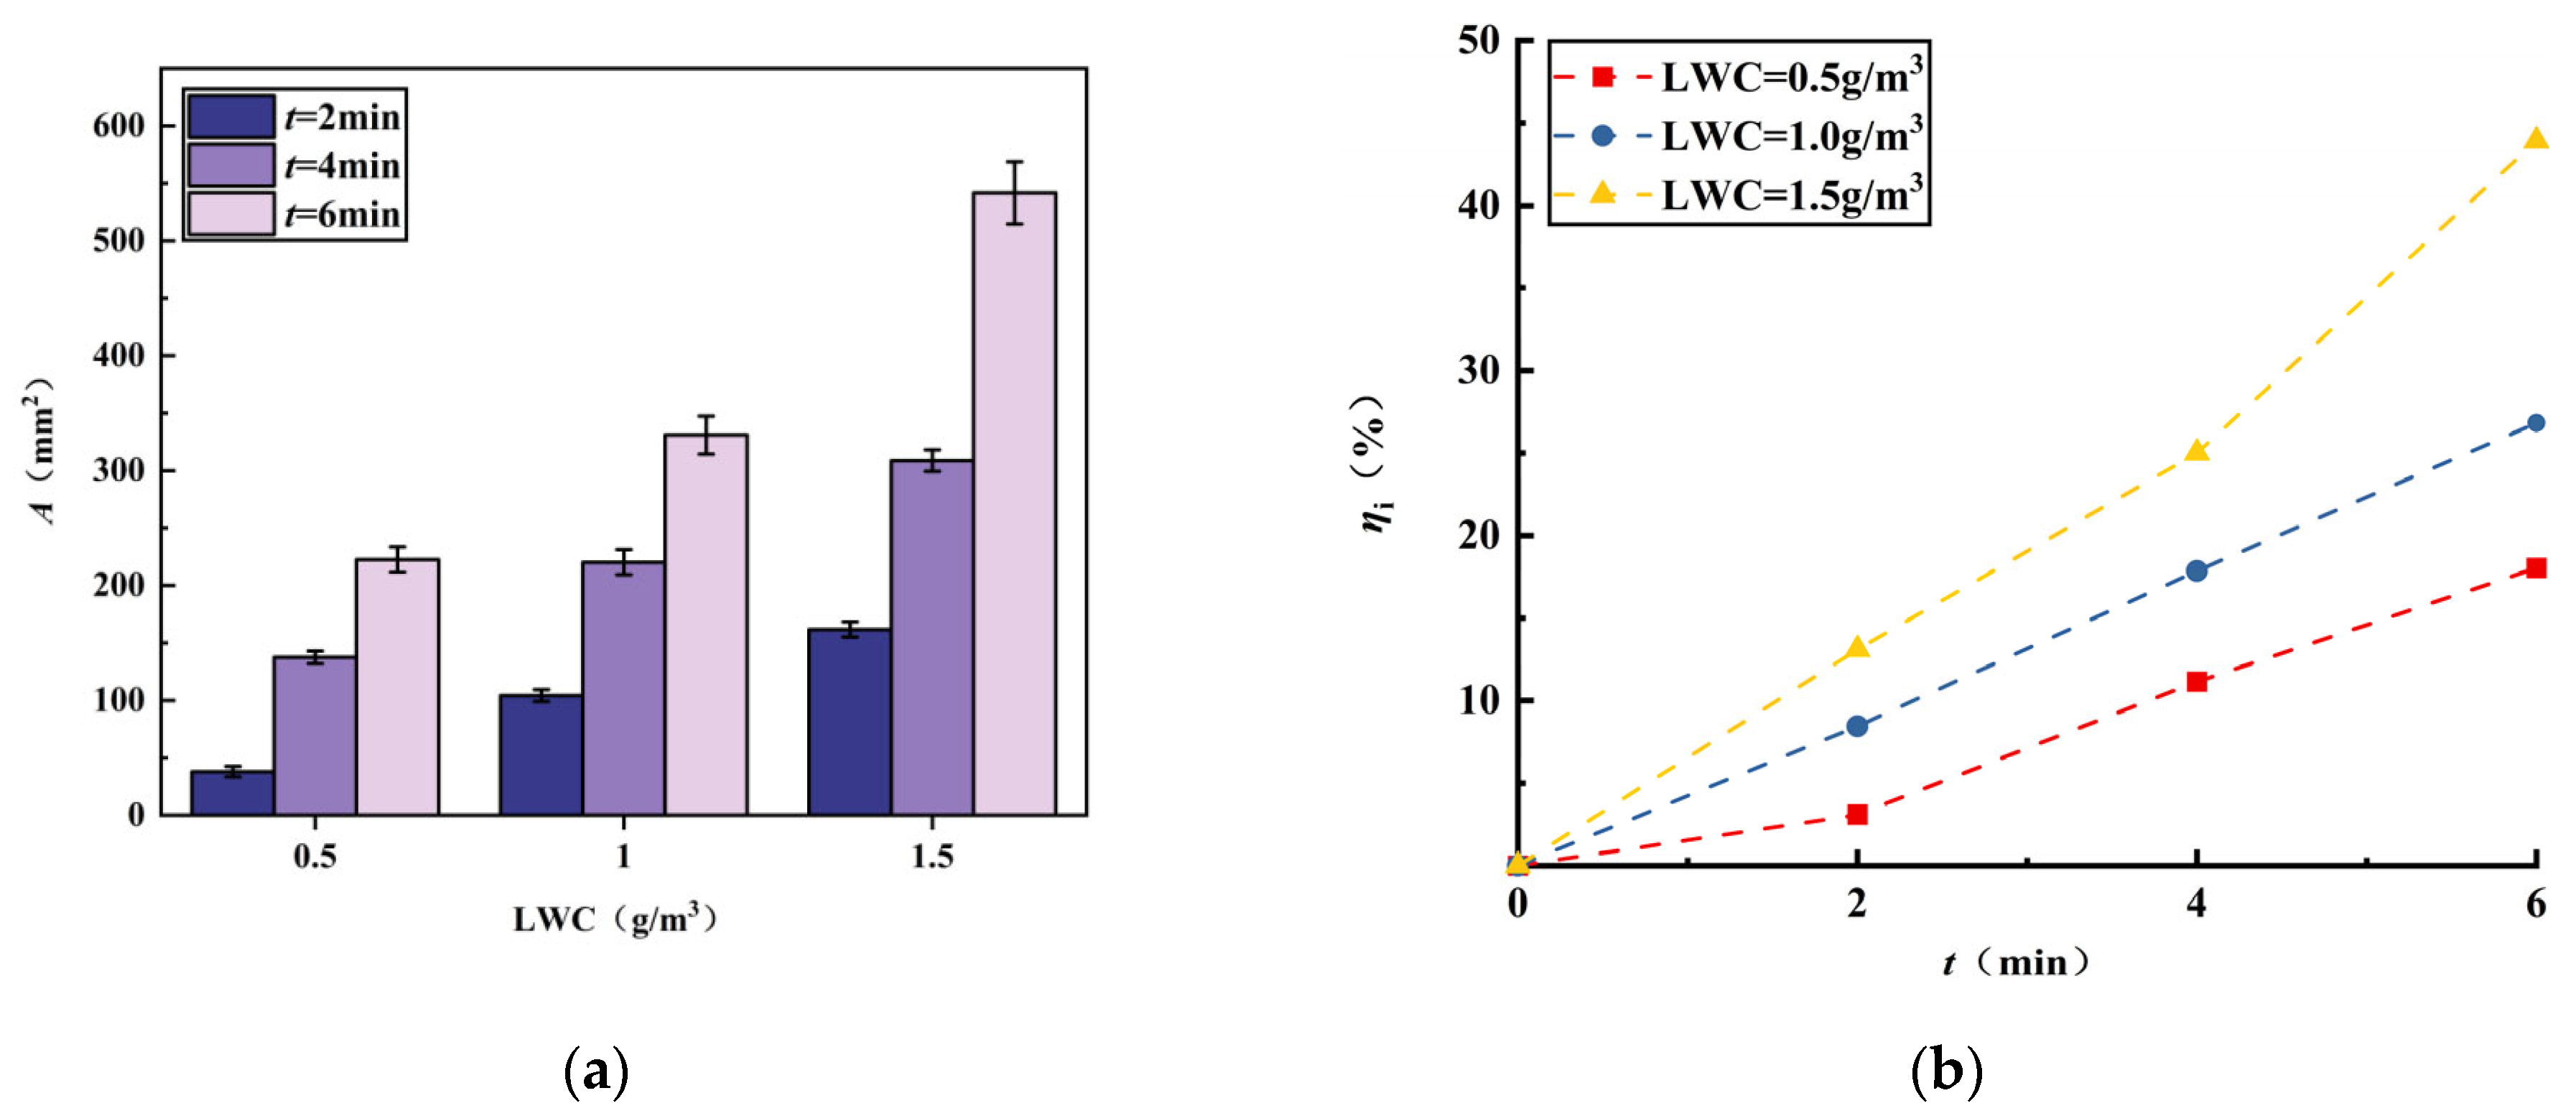
The icing area under different LWC conditions is presented in Figure 13a. Overall, the icing area increases with both LWC and icing time; however, the growth trend is clearly nonlinear. When LWC rises from 0.5 g/m3 to 1.5 g/m3, the icing area after 6 min increases from approximately 222.58 mm2 ~ 541.67 mm2, representing a 135% increase. This highlights the high sensitivity of the icing process to changes in LWC. From an aerodynamic standpoint, such a rapid expansion in icing area alters the effective windward surface of the blade, especially near the leading edge, where large, non-streamlined ice formations tend to develop. According to boundary layer theory, the presence of such irregular ice structures significantly increases surface frictional drag and disrupts the pressure distribution over the airfoil. Figure 13b depicts the effect of LWC on the total icing area rate of the airfoil cross-section. Results show that total icing area rate increases approximately linearly with time under all LWC conditions. However, the slope of this increase becomes steeper as LWC rises. After 6 min of icing, the total icing area rates are 13.01% for LWC = 0.5 g/m3, 25.01% for LWC = 1.0 g/m3, and 43.91% for LWC = 1.5 g/m3. These results indicate that higher LWC significantly enhances the efficiency of ice coverage. Additionally, the growth of total icing area rate shows a slight increase over time. This suggests that as the ice-covered region expands, the presence of rough ice edges facilitates the attachment of subsequent droplets, thereby promoting marginal acceleration in the extension of the icing boundary. Higher LWC increases the number of droplets impinging on the airfoil, leading to more ice growth—consistent with mass conservation.
Figure 13.
Icing area at different LWC: (a) Icing area; (b) Total icing area rate.
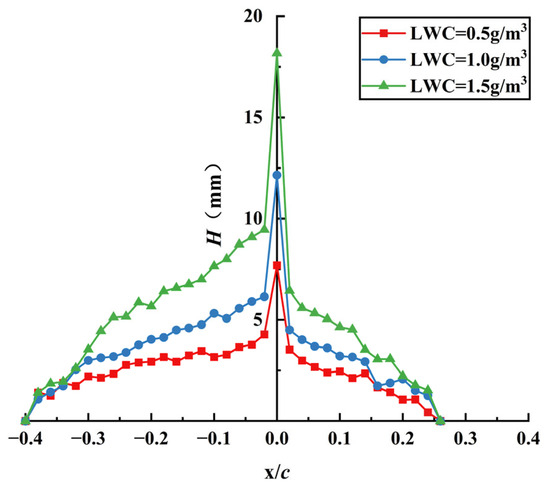
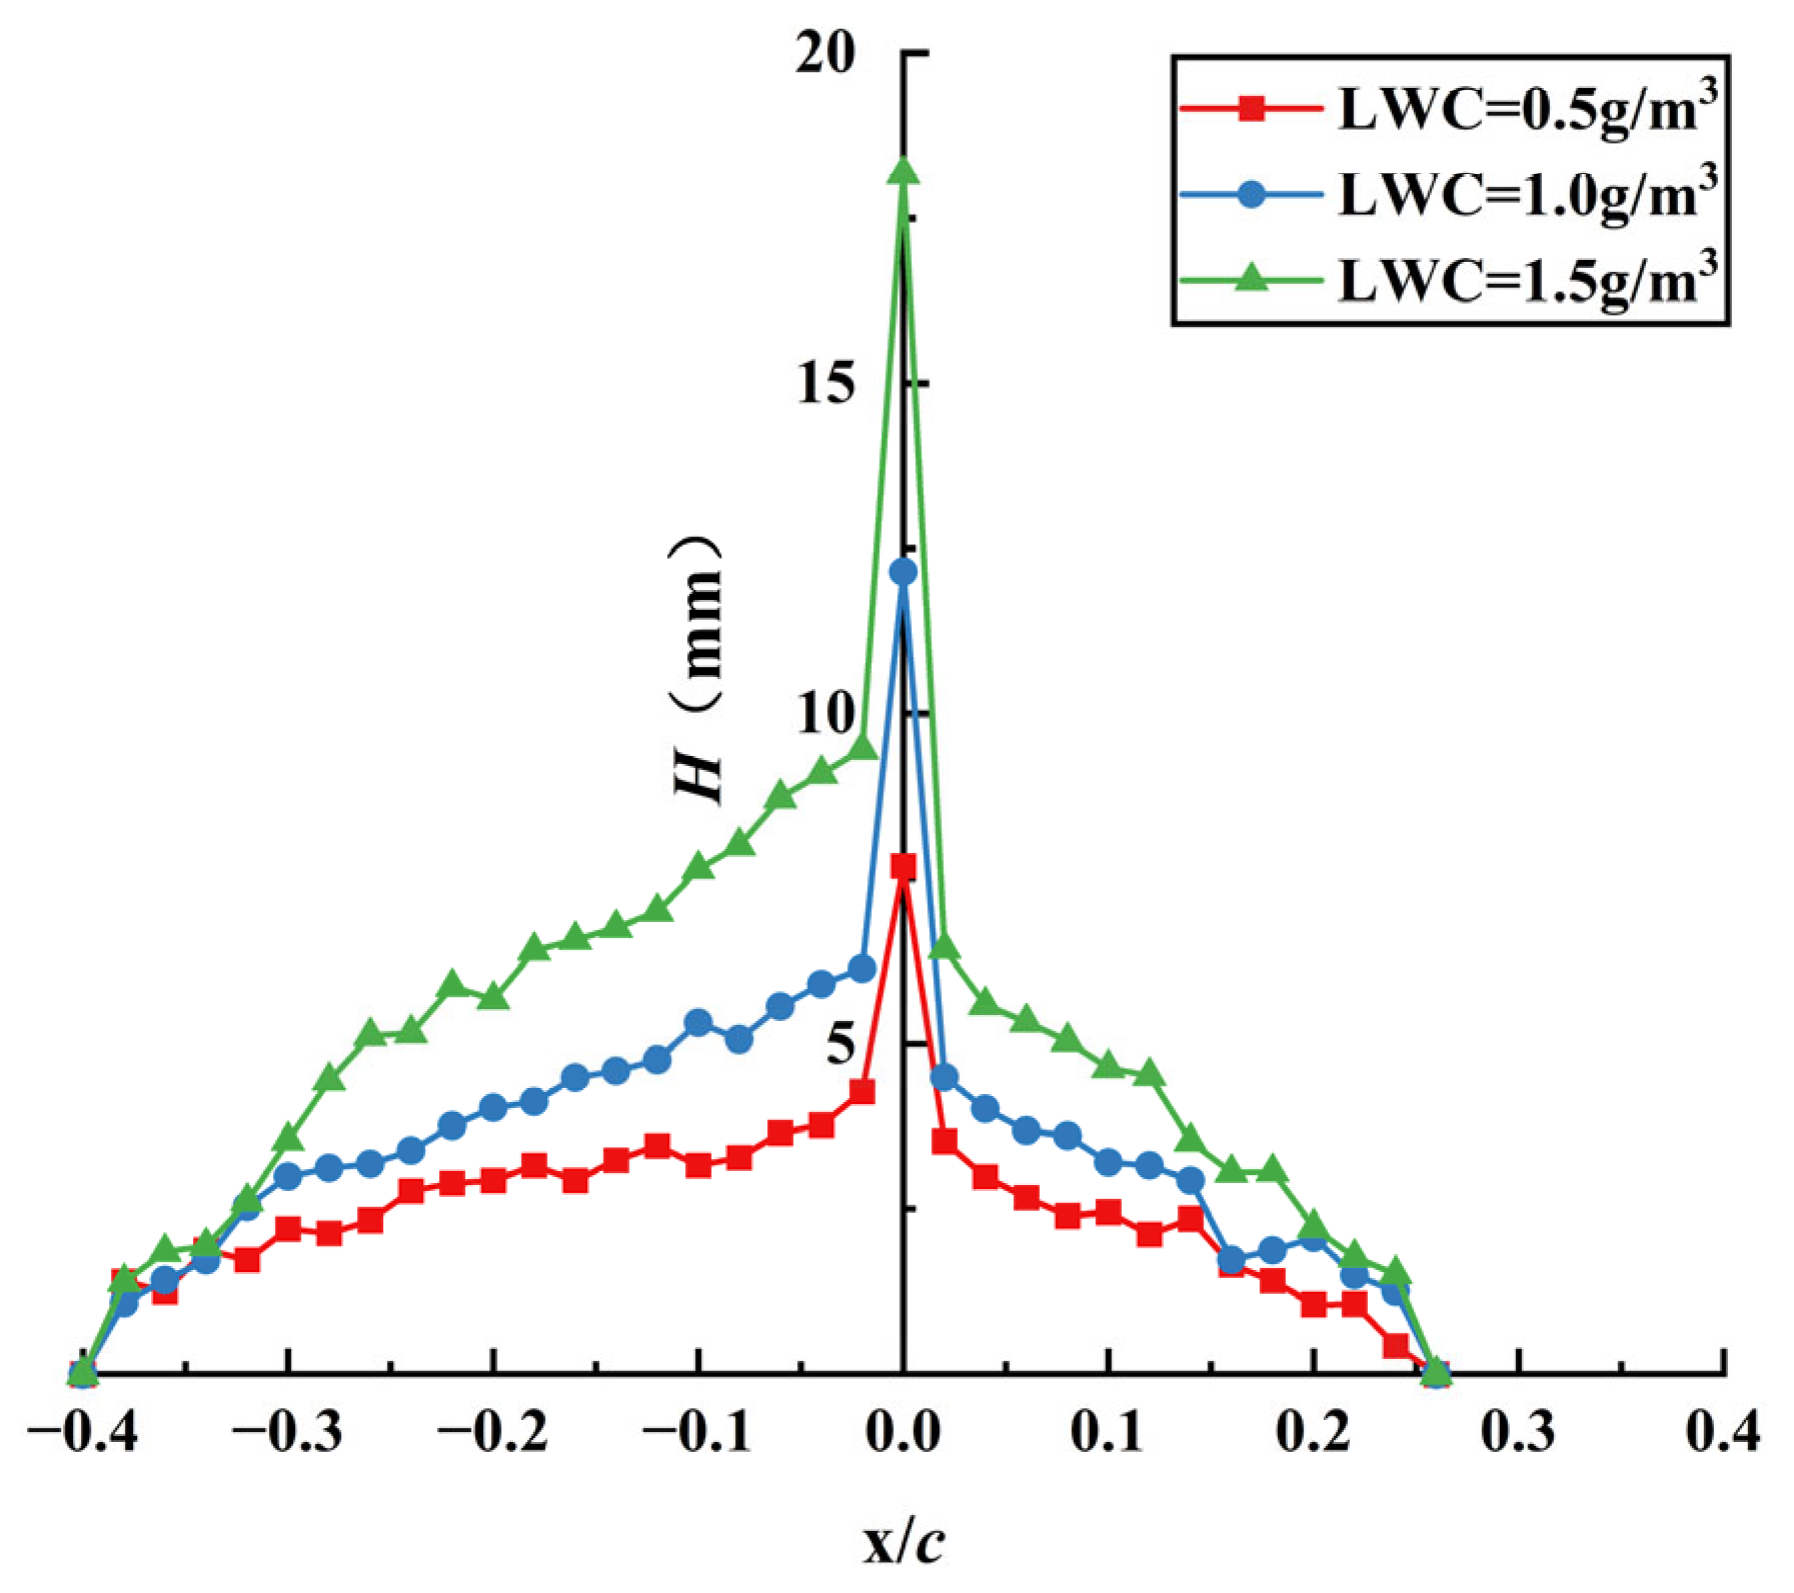
Figure 14 illustrates the variation in ice thickness after 6 min of exposure under different LWC conditions. The maximum ice thickness is concentrated near the leading edge (x/c = 0) and decreases sharply toward both the upper and lower surfaces. When LWC increases from 0.5 g/m3 to 1.5 g/m3, the maximum ice thickness at the leading edge rises from 7.69 mm to 18.17 mm—an increase of approximately 125%—indicating that LWC is a dominant factor influencing ice accretion thickness. Further analysis reveals distinct differences in the ice thickness distribution patterns across the tested LWC levels. At low LWC (0.5 g/m3), the icing profile is narrower and smoother, suggesting that ice accumulation is localized near the leading edge. In contrast, at high LWC (1.5 g/m3), the curve becomes wider and steeper, indicating that the ice-covered region expands significantly. This expansion has a notable aerodynamic impact: it increases the bluntness of the leading edge and may shift the boundary layer separation point forward along the chord, which can reduce lift and dramatically increase drag. Despite the increasing LWC, the icing extent remains consistently within the range of −40~26% along the chordwise direction. This suggests that the spatial limit of droplet impingement governs the icing range, rather than the quantity of available liquid water. The impingement limit is primarily influenced by factors such as freestream velocity, angle of attack, MVD of the droplets, and the airfoil’s geometric shape.
Figure 14.
Ice thickness of blade with different LWC.
3.3. Coupling Effect of Salinity and LWC
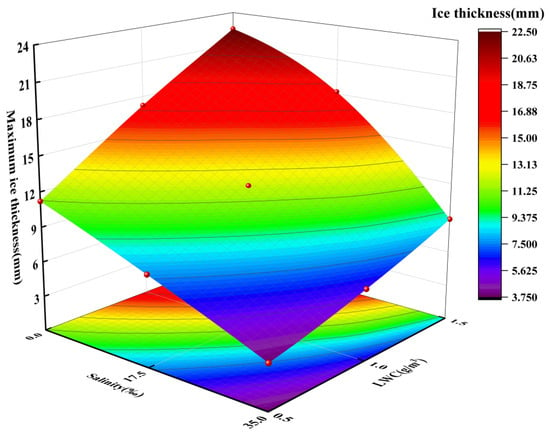
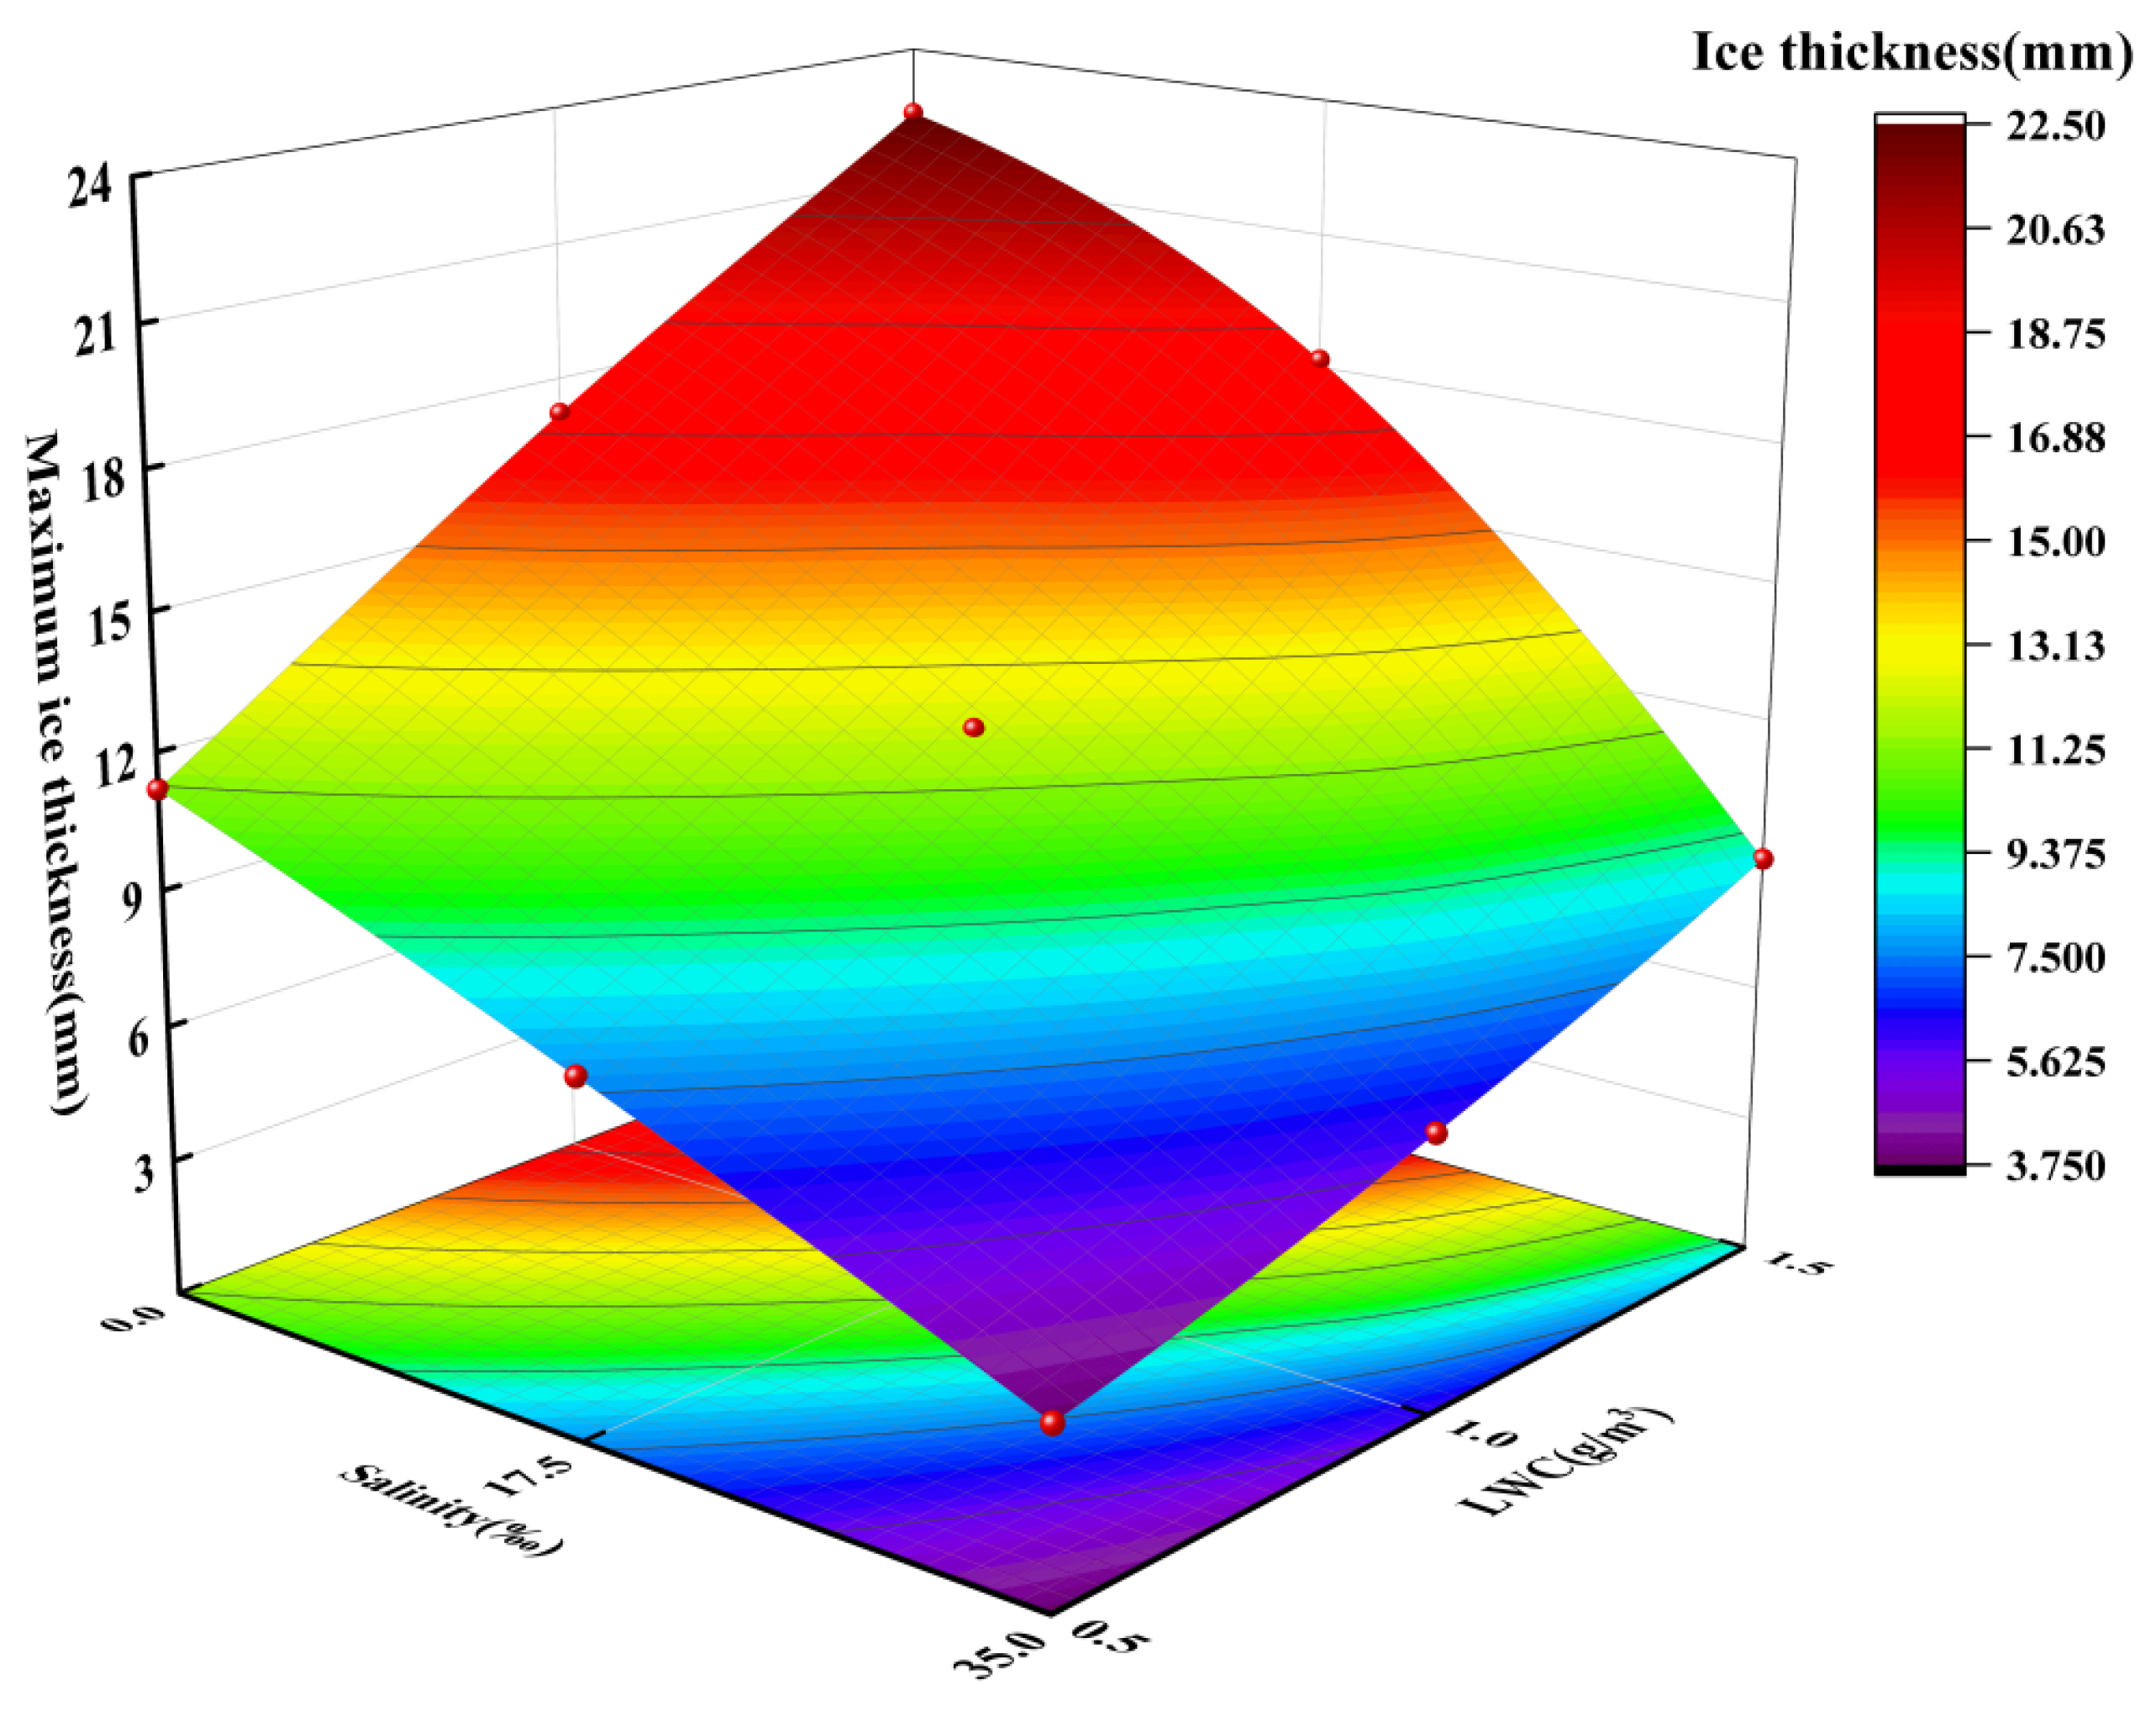
Based on the preceding analysis of the individual effects of salinity and LWC on icing characteristics, this study further investigates their coupled influence on the maximum ice thickness observed on the surface of the S809 airfoil. Figure 15 presents the peak ice thickness values under nine different icing conditions, combining three salinity levels with three LWC levels. Both salinity and LWC exert significant influence on the maximum ice thickness. LWC demonstrates a clear promoting effect on icing: under any fixed salinity condition, the maximum ice thickness increases monotonically as LWC increases. This trend confirms that LWC is a primary driving factor for ice accretion, in accordance with the principle of mass conservation in the icing process. Conversely, salinity exhibits a strong inhibitory effect: for any fixed LWC, the maximum ice thickness decreases markedly with increasing salinity. This supports the understanding that salinity weakens the icing process by mechanisms such as freezing point depression, delayed phase transition, and inhibition of ice crystal nucleation. Although the suppressive effect of salinity is evident across all LWC conditions, the magnitude of this suppression—expressed as the difference in ice thickness between the freshwater and high-salinity cases at the same LWC—increases with rising LWC. Specifically, at LWC = 0.5 g/m3, ΔH = 7.40 mm; at LWC = 1.0 g/m3, ΔH = 11.18 mm; and at LWC = 1.5 g/m3, ΔH = 13.60 mm. These values indicate that the regulatory effect of salinity on icing becomes more pronounced under higher LWC. Higher LWC increases the number of supercooled droplets available for ice nucleation. Salinity lowers the freezing point and delays nucleation, allowing droplets to spread further along the airfoil chord before freezing. When LWC is high, more droplets are exposed to salinity’s inhibitory effect, leading to a greater reduction in ice thickness. This mechanism explains why salinity’s anti-icing effect is more pronounced in high-moisture offshore environments. In summary, a significant interactive relationship exists between LWC and salinity. While LWC intensifies ice formation, it also amplifies the inhibitory influence of salinity. This coupled behavior highlights the dual role of LWC—not only as a driver of icing but also as a modulator that enhances salinity’s control over the icing process. This interaction has not been reported previously.
Figure 15.
Maximum ice thickness on S809 airfoil surface.
4. Conclusions
In this study, a series of controlled icing wind tunnel experiments were conducted to investigate the effects of salinity and LWC on the surface icing characteristics of the widely used S809 airfoil for wind turbine blades. For the first time, quantitative indicators have been proposed for the marine environment. Based on experimental results, the following conclusions have been reached:
- (1)
- Salinity has a pronounced inhibitory effect on ice accretion. Under a constant LWC of 1.0 g/m3 and an icing duration of 6 min, increasing salinity from 0‰ to 35‰ led to a reduction in icing area from 427.67 mm2 to 174.76 mm2, the total icing area rate drops by approximately 20.5%. The maximum ice thickness at the leading edge also dropped from 17.21 mm to 6.03 mm. Higher salinity produced smoother ice shapes, increased the proportion of glaze ice, and slightly extended the chordwise icing range—−36~24% at 0‰, to −42~30% at 35‰.
- (2)
- LWC is the dominant factor influencing icing severity. At a fixed salinity of 17.5‰, increasing LWC from 0.5 g/m3 to 1.5 g/m3 resulted in a 135% increase in total icing area within 6 min—from 222.58 mm2 to 541.67 mm2. The maximum ice thickness at the leading edge increased from 7.69 mm to 18.17 mm. Higher LWC conditions yielded thicker ice layers with more irregular surface protrusions, leading to greater aerodynamic degradation.
- (3)
- A significant interactive effect exists between salinity and LWC. The inhibitory influence of salinity on icing is amplified under higher LWC. For instance, when LWC = 0.5 g/m3, increasing salinity from 0‰ to 35‰ reduced the maximum ice thickness by 7.40 mm, whereas at LWC = 1.5 g/m3, the same salinity change resulted in a reduction of 13.60 mm. This demonstrates that salinity’s anti-icing effect becomes more pronounced in high-moisture environments.
- (4)
- In offshore atmospheric conditions, although salinity mitigates icing intensity and delays ice formation, significant glaze ice layers still form under high LWC. These ice layers extend along the chord, remain smooth, and predominantly consist of glaze ice. Compared to onshore conditions, this type of icing may induce different aerodynamic performance degradation and loading responses on wind turbine blades. The findings of this study reveal distinctive icing behaviors in saline offshore environments, especially under high-moisture conditions. This provides a scientific basis for the development of anti-icing coatings and surface treatments tailored for offshore wind turbine blades.
Author Contributions
Conceptualization, Q.W. and F.F.; formal analysis, Y.D. and Q.W.; funding acquisition, F.F.; investigation, J.L.; methodology, J.L. and Z.Z.; supervision, F.F.; validation, Q.W. and Z.Z.; writing—original draft, Q.W.; writing—review and editing, Q.W. All authors have read and agreed to the published version of the manuscript.
Funding
This work was supported by Project Grant NO.52076035 supported by the National Natural Science Foundation of China (NSFC).
Institutional Review Board Statement
Not applicable.
Informed Consent Statement
Not applicable.
Data Availability Statement
Data are contained within the article.
Acknowledgments
The authors extend their profound gratitude to the Northeast Agriculture University. Their expertise and support in the development and maintenance of this essential tool have greatly facilitated our research.
Conflicts of Interest
The authors declare no conflicts of interest.
References
- Christopher, J.; Dirk, S. Efficiency and effectiveness of global onshore wind energy utilization. Energy Convers. Manag. 2023, 280, 116788. [Google Scholar] [CrossRef] [Scilit]
- Yuchen, Z.; Yue, S.; Cong, S.; Nian-Zhong, C. Aerodynamic and structural analysis for blades of a 15MW floating offshore wind turbine. Ocean Eng. 2023, 287, 115785. [Google Scholar] [CrossRef] [Scilit]
- Haijun, W.; Chaojun, Y.; Yaohua, G.; Xu, Y.; Jijian, L.; Peiyao, W. Research on sinking and leveling control technology of tripod bucket foundation in sand. Appl. Ocean Res. 2022, 118, 103013. [Google Scholar] [CrossRef] [Scilit]
- Yirtici, O.; Cengiz, K.; Ozgen, S.; Tuncer, I.H. Aerodynamic validation studies on the performance analysis of iced wind turbine blades. Comput. Fluids 2019, 192, 104271. [Google Scholar] [CrossRef] [Scilit]
- Sackey, E.Q.; Kwakye, B.N.; Ayetor, G.K. Technological advancements for anti-icing and de-icing offshore wind turbine blades. Cold Reg. Sci. Technol. 2025, 231, 104400. [Google Scholar] [CrossRef] [Scilit]
- Veers, P.; Dykes, K.; Lantz, E.; Barth, S.; Bottasso, C.L.; Carlson, O.; Clifton, A.; Green, J.; Green, P.; Holttinen, H.; et al. Grand challenges in the science of wind energy. Science 2019, 366, eaau2027. [Google Scholar] [CrossRef] [Scilit]
- Jin, J.Y.; Virk, M.S. Study of ice accretion and icing effects on aerodynamic characteristics of DU96 wind turbine blade profile. Cold Reg. Sci. Technol. 2019, 160, 119–127. [Google Scholar] [CrossRef] [Scilit]
- Fupeng, H.; Yuhong, L.; Zuoyi, C. Suggestions for Improving Wind Turbines Blade Characteristics. Wind Eng. 2001, 25, 105–113. [Google Scholar] [CrossRef] [Scilit]
- Xu, Z.; Na, P.; Zhang, T.; Wang, Z. Ice Distribution Characteristics on the DU25 and NACA63-215 Airfoil Surfaces of Wind Turbines as Affected by Ambient Temperature and Angle of Attack. Coatings 2024, 14, 929. [Google Scholar] [CrossRef] [Scilit]
- Hu, L.; Zhu, X.; Hu, C.; Chen, J.; Du, Z. Wind turbines ice distribution and load response under icing conditions. Renew. Energy 2017, 113, 608–619. [Google Scholar] [CrossRef] [Scilit]
- Qiang, W.; Xian, Y. A computational strategy for determining the optimal scaled wind speed in icing wind tunnel experiments. Comput. Fluids 2023, 250, 105734. [Google Scholar] [CrossRef] [Scilit]
- Qian, T.; Zhang, D.; Liu, C.; Kong, X.; Wen, H.; Yuan, Y.; Ji, Y. Analysis of the Characteristics of Ice Accretion on the Surface of Wind Turbine Blades Under Different Environmental Conditions. Atmosphere 2025, 16, 246. [Google Scholar] [CrossRef] [Scilit]
- Chi, H.; Tong, G.; Yang, S.; Li, Y.; Guo, W.; Feng, F. A de-icing experimental investigation of blade airfoil for wind turbines based on external hot air method. Appl. Therm. Eng. 2024, 241, 122353. [Google Scholar] [CrossRef] [Scilit]
- Lian, Y.; Zhang, T.; Xu, Z.; Li, Y. Icing wind tunnel test of ice distribution characteristics on the NACA63–412 blade airfoil of wind turbine. Results Eng. 2025, 25, 104595. [Google Scholar] [CrossRef] [Scilit]
- Liang, D.; Zhao, P.; Shen, H.; Yang, S.; Chi, H.; Li, Y.; Feng, F. An Experimental Study of Surface Icing Characteristics on Blade Airfoil for Offshore Wind Turbines: Effects of Chord Length and Angle of Attack. Coatings 2024, 14, 623. [Google Scholar] [CrossRef] [Scilit]
- Jin, J.Y.; Virk, M.S. Experimental study of ice accretion on S826 & S832 wind turbine blade profiles. Cold Reg. Sci. Technol. 2020, 169, 102913. [Google Scholar] [CrossRef] [Scilit]
- Falacios, J.L.; Han, Y.; Brouwers, E.W.; Smith, E.C. Icing Environment Rotor Test Stand Liquid Water Content Measurement Procedures and Ice Shape Correlation. J. Am. Helicopter Soc. 2012, 57, 29–40. [Google Scholar] [CrossRef] [Scilit]
- Hann, R.; Hearst, R.J.; Sætran, L.R.; Bracchi, T. Experimental and Numerical Icing Penalties of an S826 Airfoil at Low Reynolds Numbers. Aerospace 2020, 7, 46. [Google Scholar] [CrossRef] [Scilit]
- Peng, G.; David, I. Wind turbine blade icing detection with multi-model collaborative monitoring method. Renew. Energy 2021, 179, 1098–1105. [Google Scholar] [CrossRef] [Scilit]
- Esmeryan, K.D. From Extremely Water-Repellent Coatings to Passive Icing Protection—Principles, Limitations and Innovative Application Aspects. Coatings 2020, 10, 66. [Google Scholar] [CrossRef] [Scilit]
- Liu, X.; Niu, C.; Chen, X.; Wang, Z.; Cheong, K.B. Experimental investigation on the characteristics of saltwater droplets ice accretion on an NACA0018 airfoil. Appl. Therm. Eng. 2025, 264, 125420. [Google Scholar] [CrossRef] [Scilit]
- Mu, Z.; Tian, G.; Feng, X.; Mu, S.; Kong, F.; Zhang, B.; Meng, X. Aerodynamic performance degradation of offshore wind turbine blades under icing with varying angles of attack. Ocean Eng. 2025, 341, 122776. [Google Scholar] [CrossRef] [Scilit]
- Hou, G.; Chi, J.; Shi, W.; Guo, W.; Li, Y.; Zhang, Y. Freezing characteristics of water droplet with sea salt on GFRP surface. Ocean Eng. 2025, 325, 120803. [Google Scholar] [CrossRef] [Scilit]
- Shu, L.; Li, H.; Hu, Q.; Jiang, X.; Qiu, G.; McClure, G.; Yang, H. Study of ice accretion feature and power characteristics of wind turbines at natural icing environment. Cold Reg. Sci. Technol. 2018, 147, 45–54. [Google Scholar] [CrossRef] [Scilit]
- Xu, Z.; Zhang, T.; Lian, Y.; Feng, F. A parametric study on the effect of liquid water content and droplet median volume diameter on the ice distribution and anti-icing heat estimation of a wind turbine airfoil. Results Eng. 2024, 22, 102121. [Google Scholar] [CrossRef] [Scilit]
- Wang, Q.; Xiao, J.; Zhang, T.; Yang, J.; Shi, Y. A new wind turbine icing computational model based on Free Wake Lifting Line Model and Finite Area Method. Renew. Energy 2020, 146, 342–358. [Google Scholar] [CrossRef] [Scilit]
- Ren, Y.; Wang, Y.; Chen, X.; Wang, Z.; Sun, H. Effect of inflow velocity and liquid water content on icing and aerodynamic characteristics of the inertial separator blade in marine environment. Int. J. Multiph. Flow 2026, 195, 105492. [Google Scholar] [CrossRef] [Scilit]
- Zhongqiu, M.; Wenfeng, G.; Yan, L.; Kotaro, T. Wind tunnel test of ice accretion on blade airfoil for wind turbine under offshore atmospheric condition. Renew. Energy 2023, 209, 42–52. [Google Scholar] [CrossRef] [Scilit]
- Yingwei, Z.; Wenfeng, G.; Yan, L.; Haodong, C.; Pengyu, Z.; Kotaro, T. An experimental study of icing distribution on a symmetrical airfoil for wind turbine blade in the offshore environmental condition. Ocean Eng. 2023, 273, 113960. [Google Scholar] [CrossRef] [Scilit]
- Yin, R. Impacts of external airfoil flaps on the S809 airfoil. Sci. Rep. 2025, 15, 31797. [Google Scholar] [CrossRef] [Scilit]
- Drage, M.A.; Hauge, G. Atmospheric icing in a coastal mountainous terrain. Measurements and numerical simulations, a case study. Cold Reg. Sci. Technol. 2007, 53, 150–161. [Google Scholar] [CrossRef] [Scilit]
- Wang, C.; Jiao, C.; Wu, T.; Zheng, R.; Liang, D.; Liu, Z.; Li, Y. Study on the Influence of Airfoil and Angle of Attack on Ice Distribution and Aerodynamic Performance of Blade Surface. Coatings 2025, 15, 1416. [Google Scholar] [CrossRef] [Scilit]
- Yan, L.; Ce, S.; Yu, J.; Xian, Y.; Yingwei, Z. Effect of liquid water content on blade icing shape of horizontal axis wind turbine by numerical simulation. Therm. Sci. 2019, 23, 1637–1645. [Google Scholar] [CrossRef] [Scilit]

Disclaimer/Publisher’s Note: The statements, opinions and data contained in all publications are solely those of the individual author(s) and contributor(s) and not of MDPI and/or the editor(s). MDPI and/or the editor(s) disclaim responsibility for any injury to people or property resulting from any ideas, methods, instructions or products referred to in the content. |
© 2026 by the authors. Licensee MDPI, Basel, Switzerland. This article is an open access article distributed under the terms and conditions of the Creative Commons Attribution (CC BY) license.