


Abstract
Vascular dysfunction at the level of cerebral endothelial cells is an early component of Alzheimer’s disease pathogenesis. Fluorescence lifetime imaging microscopy (FLIM) with phasor analysis enables label-free assessment of cellular metabolism based on NAD(P)H autofluorescence. This proof-of-concept study aimed to evaluate the potential of FLIM with fit-derived phasor analysis to compare cerebral endothelial cells (CECs) derived from a healthy donor and a patient with Alzheimer’s disease (AD) and to characterize their responses to metabolic modulators. CECs were differentiated from induced pluripotent stem cells obtained from a healthy donor (PO2) and a patient with AD (Alz9L, APP V717I mutation). Two-photon NAD(P)H FLIM was performed under basal conditions and following treatment with 3-chloro-5-hydroxybenzoic acid (3CLBA) and sodium lactate. The analysis included mean lifetime (τmean), phase lifetime (τφ), biexponential fitting parameters, and phasor coordinates reconstructed from these parameters. Under basal conditions, the phasor distributions of PO2 and Alz9L cells differed significantly despite similar mean NAD(P)H lifetimes. Alz9L cells exhibited a lower τφ and a higher lifetime of the short-lived component, τ1. Following sodium lactate treatment, Alz9L cells exhibited a higher a1/a2 ratio and lower τmean and τ1 values than PO2 cells. Comparison of the basal and post-lactate states revealed pronounced decreases in τmean and τ1 in Alz9L cells. Fit-derived phasor analysis jointly visualizes fitted NAD(P)H decay parameters and illustrates differences between the two studied CEC lines despite similar basal mean lifetimes. These proof-of-concept observations require validation in additional cell lines from independent donors.
1. Introduction
Vascular abnormalities are now considered an important component of Alzheimer’s disease (AD) pathogenesis, rather than merely a consequence of progressive neurodegeneration. Postmortem examination reveals both macrovascular changes, including large-artery atherosclerosis and arteriosclerosis, and microvascular lesions, such as microinfarcts, microangiopathy, and cerebral amyloid angiopathy, in most patients with AD [1]. These processes contribute to reduced cerebral blood flow and may induce neurodegenerative changes by promoting β-amyloid and tau accumulation. Neurodegeneration is also associated with impaired angiogenesis and the formation of functionally deficient microvessels with increased permeability and signs of endothelial dysfunction [2,3,4].
According to the two-hit vascular hypothesis of AD, initial vascular injury, including hypoperfusion and blood–brain barrier (BBB) disruption, creates conditions that accelerate amyloid and tau pathology. In turn, this pathology further impairs cerebral microcirculation, establishing a vicious cycle in the pathogenesis of neurodegeneration [1,5]. A central role in these processes is played by the neurovascular unit (NVU), which comprises endothelial cells, pericytes, astrocytes, and neurons and couples neuronal activity to local blood flow and metabolite exchange [6,7,8]. NVU dysfunction, including impaired endothelial–pericyte interactions and loss of perivascular cells, increases BBB permeability, disrupts cerebral microcirculation, and reduces β-amyloid clearance [1,9,10,11,12].
Clinical studies indicate that signs of chronic hypoperfusion and BBB damage may arise before substantial cognitive impairment and marked changes in cerebrospinal fluid molecular marker profiles [13]. Cerebral microbleeds, enlarged perivascular spaces, and altered cerebral perfusion are therefore considered potential markers of the vascular component of AD [14,15]. Cerebral endothelial cells (CECs) are consequently of particular interest as an early target of the pathological process.
CECs possess several specialized properties required to maintain BBB function, including high expression of tight junction proteins, low levels of fenestration and transcytosis, an extensive system of membrane transporters, and high metabolic activity [16,17,18]. Endothelial energy metabolism is closely related to endothelial functional state. In particular, changes in the balance between glycolytic and mitochondrial processes accompany angiogenic activation and phenotypic conversion of endothelial cells. During neurodegeneration, structural and functional abnormalities in CECs are also accompanied by changes in cellular metabolism; however, the nature of these changes and the approaches available for their precise detection remain insufficiently understood [19].
Morphological and functional alterations in CECs are detectable at early and preclinical stages of AD [20,21,22,23,24]. In the APPswe/PS1dE9 mouse model, reduced endothelial DR6 receptor expression and impaired BBB function preceded overt amyloid pathology [25]. Single-cell RNA-seq studies have revealed reduced activity of β-catenin-dependent genes and activation of proinflammatory TNF/NF-κB pathways in endothelial cells from patients with AD [26]. Dysregulation of cerebral blood flow associated with reduced endothelial nitric oxide synthase expression and impaired nitric oxide production has also been reported [27,28]. A reduction in circulating endothelial progenitor cells has been observed at preclinical stages of AD and may reflect diminished regenerative capacity of the vascular endothelium [29]. Together, these findings indicate that CEC status is an early predictor of the onset of AD-related pathology.
In recent years, endothelial-to-mesenchymal transition (EndMT) has received increasing attention as a mechanism underlying the loss of the specialized vascular phenotype during aging and central nervous system (CNS) diseases. During EndMT, endothelial cells partially or completely downregulate endothelial and barrier markers and acquire mesenchymal properties associated with migration, extracellular matrix remodeling, and proinflammatory/profibrotic responses. Partial EndMT states may be particularly relevant to the cerebral endothelium because they can be accompanied by weakened intercellular junctions, increased BBB permeability, and impaired neurovascular coupling. Proposed triggers of EndMT in the CNS include inflammatory cytokines, TGF-β/BMP–Smad signaling, hypoxia, oxidative stress, and organelle stress [30,31,32,33].
The association between EndMT and Alzheimer’s neurodegeneration is of additional interest in the context of endothelial metabolic reprogramming. Transcriptomic findings in experimental AD and single-cell RNA-seq data from the human brain indicate that EndMT-associated changes coexist with mitochondrial, endoplasmic reticulum, and oxidative stress, as well as remodeling of energy metabolism pathways [34]. In other models of vascular pathology, PDGF/NF-κB/Snail signaling has been shown to sustain mesenchymal transformation of endothelial cells and reduce their dependence on VEGFR2 [35]. These findings suggest that the metabolic FLIM phenotype may be associated not only with the cellular energy state itself but also with changes in endothelial identity and plasticity.
Lactate is an important metabolic and signaling regulator of cerebral endothelial function. In addition to linking glycolysis to mitochondrial energy metabolism through its conversion to pyruvate, lactate participates in intercellular metabolic exchange within the NVU via monocarboxylate transporters and acts as a signaling molecule through the GPR81 receptor [17]. Activation of this receptor in cerebral endothelial cells is associated with stimulation of mitochondrial biogenesis and regulation of angiogenesis [36,37]. In the peripheral endothelium, lactate-mediated GPR81 activation can also support an anti-inflammatory endothelial phenotype by increasing KLF2 expression, indicating a context-dependent signaling role of the lactate–GPR81/HCA1 axis [38]. Conversely, during neuroinflammation, reduced expression of GPR81 and monocarboxylate transporter 1 (MCT1) in CECs is accompanied by impaired barrier function [39]. Lactate produced by the cerebral endothelium may also regulate processes in other NVU cells [40,41]. Analysis of CEC responses to lactate and pharmacological GPR81 activation is therefore relevant to assessing the metabolic plasticity of these cells in AD.
At the same time, lactate should not be regarded exclusively as a protective or energy-related signal. In a model of hypoxic pulmonary hypertension, exogenous lactate enhanced EndMT through Twist1 lactylation followed by activation of the TGFB1/Smad2 signaling pathway [42]. Although these findings were obtained outside the CNS and cannot be directly extrapolated to the cerebral endothelium, they demonstrate that lactate effects depend on the cellular context and may involve both receptor-dependent and metabolic/epigenetic mechanisms.
Cell models derived from human induced pluripotent stem cells (iPSCs) are particularly promising for such studies. They allow individual genetically determined features of a disease to be reproduced and cellular phenotypes to be investigated under controlled in vitro conditions [43,44]. A previously developed three-cell iPSC-based BBB model using the Alz9L line showed increased barrier permeability and altered endothelial cell metabolism, supporting the presence of an AD-associated vascular phenotype [45]. Combining such models with sensitive analytical methods capable of detecting changes in cellular metabolism without exogenous labels or substantial perturbation of the cells is therefore a promising approach.
Fluorescence lifetime imaging microscopy (FLIM) is one such method. It enables label-free analysis of cellular metabolism based on the endogenous fluorescence of NADH and NADPH, reduced pyridine nucleotides detected together as NAD(P)H [46,47,48,49,50]. The fluorescence lifetime of NAD(P)H is determined by its molecular microenvironment and interactions with cellular enzymes. Free and enzyme-bound NAD(P)H pools exhibit different fluorescence kinetics, allowing FLIM parameters to detect changes in coenzyme state that accompany cellular metabolic reorganization [51,52,53,54,55]. FLIM does not require determination of the absolute NAD(P)H concentration and provides spatially resolved information on the metabolic heterogeneity of individual cells [54,55]. NADH-FLIM has previously revealed mitochondrial dysfunction in neuronal models of AD, demonstrating its sensitivity to metabolic changes associated with neurodegeneration [56]. The principles of FLIM, its applications in cellular metabolic imaging, and its clinical relevance, including tissue characterization and optical biopsy, have recently been reviewed in detail [57].
Phasor representation maps fluorescence decay kinetics onto a two-dimensional space defined by coordinates G and S, corresponding to the normalized cosine and sine components of the decay at a selected frequency [58,59]. NAD(P)H phasor trajectories have previously been used to describe sequential changes in cellular metabolic state during differentiation and transitions between functional states [53,60,61]. This representation characterizes integrated changes in multicomponent fluorescence decays and enables visual comparison of cellular states based on the positions and distributions of phasor points. Shifts in phasor distributions may reflect simultaneous changes in the lifetimes and relative contributions of different NAD(P)H states, even when these changes partially compensate for one another and have little effect on the mean fluorescence lifetime. The phase lifetime, τφ, determined by the angular position of the phasor, provides an additional integrated characteristic of fluorescence kinetics and can be used alongside multicomponent fitting parameters.
FLIM, including phasor analysis, is widely used to investigate metabolic changes in tumor and stem cells, immune cell activation, and neural tissue, and to assess cellular responses to oxidative and metabolic stress [48,53,62,63,64,65,66,67,68]. In CECs, FLIM can also detect early changes in the NAD(P)H-dependent metabolic phenotype under redox perturbations [69,70]. However, the potential of FLIM to characterize the NAD(P)H-dependent phenotype of AD patient-derived CECs and its response to metabolic modulators remains insufficiently explored.
The aim of this proof-of-concept study was to assess differences in the NAD(P)H-dependent FLIM phenotype of CECs derived from iPSCs obtained from a healthy donor (PO2) and a patient with AD (Alz9L), and to characterize changes induced by sodium lactate and the GPR81 receptor agonist 3CLBA. To this end, phase lifetime, mean lifetime, and multicomponent NAD(P)H fluorescence decay parameters were assessed quantitatively, and phasor coordinates were reconstructed from the biexponential fitting parameters for their joint visualization.
2. Materials and Methods
2.1. iPSC Culture
Human iPSC lines previously generated and characterized at the Institute of Cytology and Genetics, Siberian Branch of the Russian Academy of Sciences (Novosibirsk, Russia), and Lopukhin Federal Research and Clinical Center of Physical-Chemical Medicine (Moscow, Russia), were used in this study. Experiments were performed using the Alz9L line, derived from a patient with AD and carrying the V717I mutation in the APP gene (the London mutation), and the PO2 line, derived from an apparently healthy donor. The Alz9L iPSC line is registered in the Human Pluripotent Stem Cell Registry (hPSCreg, Würzburg, Germany) under accession number ICGi008-A (https://hpscreg.eu/cell-line/ICGi008-A accessed on 3 September 2026), its generation and characterization have been described previously [71].
The patient and donor provided informed consent to participate in the study. The study was approved by the Ethics Committee of the Russian Center of Neurology and Neuroscience (protocol No. 5-3/22, dated 1 June 2022). The iPSC lines were validated according to international standards, including verification of pluripotency marker expression, a normal stable karyotype, embryoid body formation, and spontaneous differentiation into derivatives of all three germ layers in vitro.
Cells were cultured on plastic coated with 1% Matrigel (354277, Corning, New York, NY, USA) in the commercial serum-free medium mTeSR1 (85850, STEMCELL Technologies, Vancouver, BC, Canada). At 85–90% confluence, cells were passaged at a 1:2 ratio using a gentle dissociation solution. To prevent apoptosis, 5 μM ROCK inhibitor (Y-27632, STEMCELL Technologies) was added to the culture medium at seeding.
2.2. Directed Differentiation of iPSCs into Endothelial Cells
Mesodermal differentiation of iPSCs was induced using commercial STEMdiff Mesoderm Induction Medium (Cat. #05221, STEMCELL Technologies) according to the manufacturer’s protocol. For subsequent specification of mesodermal progenitors into endothelial cells, cultures were transferred to a specialized medium prepared according to a modified protocol [72]. Cells were incubated for 7 days in a medium containing RPMI-1640 basal medium (Cat. #10-040-CV, Corning), 1× GlutaMAX (Cat. #35050-31, Gibco, Waltham, MA, USA), 20% fetal bovine serum (Cat. #FBS-11A, Capricorn Scientific, Ebsdorfergrund, Germany), 1× sodium pyruvate (Cat. #Ф023, PanEco, Gorki Leninskiye, Russia) and 1.4 μM hydrocortisone (Cat. #CAS 50-23-7, Merck, Darmstadt, Germany). RPMI medium contains 11 mM glucose. Cells were maintained under standard CO2 incubator conditions (37 °C, 5% CO2, and 95% humidity). Endothelial cells used for immunocytochemical analysis, assessment of angiogenic activity, extracellular L-lactate quantification, and FLIM were obtained from independent differentiation batches. For immunocytochemical analysis and FLIM, endothelial cells from an independent differentiation batch were passaged 2–4 times. Cells from one well of a 6-well plate were then seeded into eight wells of a 24-well plate containing Matrigel-coated glass coverslips.
2.3. Immunocytochemical Analysis
Immunocytochemical staining was performed using a standard procedure. Cells were fixed with 4% paraformaldehyde (PFA; Cat. #P1117, Solarbio, Beijing, China) for 10 min at room temperature and permeabilized with 0.1% Triton X-100 (Cat. #MB031, HiMedia, Thane, India) for 10 min. Nonspecific binding was blocked with 5% bovine serum albumin (BSA; Cat. #A0296-500, Biowest, Nuaillé, France) for 1 h.
Cells were incubated overnight at 4 °C in blocking buffer containing primary antibodies against CD31 (1:100; Cat. #A0378, ABclonal, Woburn, MA, USA), CD146 (1:100; Cat. #FNab01428, FineTest, Boulder, CO, USA), Claudin-5 (1:100; Cat. #A10207, ABclonal), PDGFRB (1:100; Cat. #E-AB-32531, Elabscience, Houston, TX, USA), and GPR81 (1:200; Cat. #DF2766, Affinity, Cincinnati, OH, USA).
For detection, cells were incubated with FITC-conjugated goat anti-rabbit IgG secondary antibodies (1:500; Cat. #SAA544Rb18, Cloud-Clone Corp., Katy, TX, USA) for 2 h at room temperature. Cell nuclei were stained using LumiMount DAPI (Cat. #53144, Lumiprobe, Moscow, Russia). Fluorescence was visualized using an EVOS M7000 imaging system (Thermo Fisher Scientific, Waltham, MA, USA).
2.4. Modulator Treatment
Experimental groups were established for each endothelial cell line to investigate metabolic changes in the differentiated cells. At 90% confluence, the conditioned medium was completely removed from the wells and replaced with fresh growth medium containing the modulators. The following compounds were used at their final concentrations: 20 μM 3-chloro-5-hydroxybenzoic acid (3CLBA; CAS 53984-36-4, BD28986, BidePharm, Shanghai, China; predissolved in DMSO) and 10 mM sodium lactate (L4263, Sigma, Taufkirchen, Germany; dissolved in PBS). Control cells were incubated in medium containing equivalent volumes of the solvents. Cells were incubated with the modulators for 24 h under standard conditions (37 °C, 5% CO2) and then collected for subsequent analysis.
2.5. Assessment of Angiogenic Activity
The ability of the derived endothelial cells to form capillary-like structures was assessed using a spheroid sprouting assay. To generate spheroids, cell suspensions (4000 cells per well) were seeded from an independent differentiation batch in round-bottom low-attachment plates (Cat. #34896, SPL, Pocheon-si, Republic of Korea) in the presence of 50 μM ROCK inhibitor (Y-27632; STEMCELL Technologies) and incubated for 72 h until aggregates formed.
The resulting spheroids were carefully collected and embedded in a type I collagen solution (final concentration, 2 mg/mL; 1.2.001, Biolot, Saint Petersburg, Russia). Collagen hydrogel polymerization was induced in a CO2 incubator at 37 °C for 30 min. To stimulate angiogenesis, recombinant human VEGF-A (20 ng/mL; Cat. #PSG010-100, Sci-Store, Moscow, Russia) and human bFGF-2 (20 ng/mL; Cat. #PSG060-10, Sci-Store, Russia) were added to the growth medium. After 16 h of culture, spheroids were fixed with 4% PFA (Cat. #P1117, Solarbio, China) for 10 min at 4 °C and examined by bright-field microscopy using an Image ExFluorer imaging system (Live Cell Instrument, Namyangju-si, Republic of Korea). Angiogenic activity, including sprout length and number, was assessed using ImageJ version 1.54p (National Institutes of Health, Bethesda, MD, USA).
2.6. Quantification of Extracellular L-Lactate
Extracellular L-lactate levels were measured 24 h after modulator addition in two biological replicates per group, with each biological replicate analyzed in technical duplicate, yielding four measurements per group. Conditioned medium samples were collected into tubes and centrifuged at 1000× g for 5 min at 4 °C to remove cell debris. Measurements were performed colorimetrically using a commercial L-Lactate Assay Kit (Cat. #ab65331, Abcam, Cambridge, UK) according to the manufacturer’s protocol. Absorbance was measured at 450 nm using a microplate spectrophotometer (INNO-S, Seongnam-si, Republic of Korea).
Total protein concentrations in the samples were determined using the colorimetric Bradford assay, with BSA (Cat. #A0296-500, Biowest) as the standard. Absorbance was measured at 595 nm using a microplate spectrophotometer (INNO-S). The resulting protein concentrations were used to normalize lactate levels in the samples. Protein-normalized lactate levels are expressed as μmol/mg protein.
2.7. FLIM Acquisition
The autofluorescence kinetics of CECs were recorded using two-photon FLIM. Excitation was provided by a Chameleon Ultra II femtosecond laser (Coherent, Saxonburg, PA, USA) at 730 nm, with a pulse repetition rate of 80 MHz and a nominal pulse duration of approximately 140 fs. A Plan-Apochromat 63×/1.4 Oil objective (Carl Zeiss, Oberkochen, Germany) was used with Immersol 518 F immersion oil. The average excitation power at the specimen was estimated by calculation to be approximately 4.7 mW.
Fluorescence decays were recorded using a FLIM system (Becker & Hickl, Berlin, Germany) integrated with an LSM 710 NLO confocal microscope and comprising an SPC-150 time-correlated single-photon counting (TCSPC) module, and HPM-100-07 hybrid photodetector. Data were acquired using SPCM software version 9.82 and analyzed using SPCImage 8.9 (Becker & Hickl, Germany). The TCSPC recording window was 12.5 ns, divided into 1024 temporal channels, corresponding to a sampling interval of approximately 12.2 ps per channel. NAD(P)H autofluorescence was detected through an FB450-40 bandpass filter (Thorlabs, Newton, MJ, USA; nominal center wavelength, 450 nm; bandwidth, 40 nm). The optical path also included the microscope’s BS-MP 355/690+(R) dichroic beamsplitter, which directed infrared excitation toward the specimen and transmitted visible fluorescence toward the detector. The detected signal was analyzed as combined NAD(P)H autofluorescence, without separating the contributions of NADH and NADPH.
Images were acquired at 512 × 512 pixels over a field of view of 134.7 × 134.7 μm. Acquisition was stopped when the total registered photon count for the entire image reached 108, typically requiring approximately 2 min. From the total count and acquisition time, the retrospectively estimated frame-averaged registration rate was approximately 0.83 × 10⁶ counts/s. This estimate does not characterize the peak detector count rate in individual pixels.
FLIM measurements were performed in culture medium at room temperature without active sample heating. The measurement period for each sample was limited to approximately 30 min after removal from the incubator to minimize time-dependent changes in cellular metabolism.
For each cell line, each modulator experiment (3CLBA or sodium lactate) included one control coverslip and one treated coverslip in separate wells. The pooled Control group comprised two control coverslips per cell line. Five fields of view were recorded per coverslip, corresponding to ten fields of view in the pooled Control group and five fields of view in each treatment group per cell line. Fields were selected to include as many cells as possible within the available measurement period. The sparse and uneven distribution of cells, together with the limited measurement period per sample, resulted in different numbers of analyzed cells between groups. FLIM parameters were determined individually for each cell, as described in Section 2.9.
2.8. Experimental Protocol
CECs differentiated from iPSCs obtained from a healthy donor and a patient with AD were studied under basal conditions and following treatment with metabolic modulators. The following experimental groups were established:
Control: basal culture conditions without metabolic modulators;
3CLBA: treatment with an agonist of the lactate receptor GPR81;
Sodium lactate: treatment with sodium lactate.
Identical acquisition and sample processing conditions were used for both cell lines.
2.9. Fluorescence Decay Fitting and Fit-Derived Phasor Analysis
NAD(P)H autofluorescence decays were analyzed individually for each cell, which was first selected as a separate region of interest (ROI). Cell-level fitting was performed on the fluorescence decay integrated over the selected cell ROI. Thus, cell-level lifetime parameters were obtained by fitting the integrated decay rather than by averaging pixel-wise fitted lifetimes. Recorded data in *.sdt format were analyzed using SPCImage 8.9 software (Becker & Hickl, Germany). Fluorescence decays were fitted using maximum likelihood estimation (MLE) with IRF reconvolution. The intrinsic biexponential fluorescence component was described as follows:
where a1 and a2 are the relative amplitudes of the short- and long-lived components, respectively, and τ1 and τ2 are their corresponding fluorescence lifetimes.
The model fitted to the measured TCSPC histogram was:
here, a1 and a2 are the fitted amplitudes of the short- and long-lived components, respectively; τ1 and τ2 are their corresponding fluorescence lifetimes; B is the constant background offset estimated automatically by SPCImage; and the asterisk denotes convolution. After fitting, the amplitudes were normalized and reported as percentages, with a1 + a2 = 100%.
IRFs were estimated from the fluorescence data. Some experimental decays contained additional delayed peaks of undetermined origin. For these decays, an effective multi-peak IRF was reconstructed using a custom program that represented the measured signal as a sum of exponentially modified Gaussian components, with shared fluorescence lifetimes across the response peaks. The Gaussian response components were used to construct the effective IRF, which was subsequently imported into SPCImage for reconvolution fitting. The main peak of the reconstructed effective IRF had a full width at half maximum (FWHM) of 50 ± 10 ps. A comparison of the automatically estimated IRF and the modeled effective IRF for the same experimental decay is presented in Figure S1.
Spatial binning was applied in SPCImage, typically with Bin set to 5. For each image, three cell-free regions were selected to estimate the background intensity. The maximum background count level observed in these regions at the selected binning setting was used to determine the intensity threshold (Threshold) for excluding low-intensity pixels from pixel-wise analysis. This intensity threshold was distinct from the constant temporal background offset included in the decay-fitting model.
The quality of the biexponential fits was assessed using the reduced χ2 statistic, which was predominantly within the range of 1.2–1.3 for the analyzed data. Representative experimental decays, IRFs, fitting residuals, and photon counts within the SPCImage gate are provided in Figures S1 and S2. Figure S1 illustrates the effect of IRF treatment, while Figure S2 compares monoexponential and biexponential fits to the same experimental decay.
To construct the fit-derived phasor representation, the relative integrated contribution of each fluorescence component (fractional intensity) was calculated from the biexponential fitting parameters:
Phasor coordinates G and S were calculated for each cell using the fractional intensities of both components:
where ω = 2πf, and f = 80 MHz is the laser pulse repetition rate.
Thus, a single pair of phasor coordinates, G and S, was obtained for each individually analyzed cell, defining its position in phasor space. Phasor coordinates were calculated from the intrinsic biexponential fluorescence component, excluding the constant background offset and the IRF. The resulting phasor representation was therefore a model-dependent, joint visualization of the fitted decay parameters.
Phasor plots were generated using a custom Python version 3.14 script. The universal phasor semicircle was used as a reference for monoexponential fluorescence decays, with positions corresponding to lifetimes from 0.1 to 10 ns marked along it. Kernel density estimation (KDE), implemented using the Seaborn version 0.13.2 library, was used to visualize the spatial distribution of cells under different experimental conditions. Distributions were represented by 15 density levels, overlaid with individual cell phasor points colored according to experimental condition.
For an additional comparison under basal conditions, phasor coordinates were obtained from the experimental TCSPC decays using the phasor analysis routine implemented in SPCImage version 8.9. The same cellular ROIs were used as in the fit-derived analysis, and the reconstructed effective IRF described above was supplied to the software. The resulting cell-level coordinates were exported and visualized using the same plotting procedure as for the fit-derived phasors. In this supplementary analysis, the coordinates were obtained from the experimental decay data rather than reconstructed from the fitted component lifetimes and amplitudes.
2.10. Calculation of Quantitative FLIM Parameters
Quantitative characteristics of NAD(P)H autofluorescence decays were calculated for each individual cell from the biexponential fitting parameters.
The amplitude-weighted mean fluorescence lifetime was calculated as τmean = (a1τ1 + a2τ2)/100.
The amplitude ratio a1/a2 was calculated to characterize the relative contributions of the short- and long-lived components. These components are predominantly associated with free and enzyme-bound NAD(P)H, respectively. However, lifetime parameters may depend on the intracellular microenvironment and the composition of enzyme complexes; therefore, the a1/a2 ratio was not interpreted as a direct quantitative measure of the activity of individual metabolic pathways.
The phase lifetime, τφ, was determined from the phasor coordinates as . This quantity is related to the phasor angle by ; therefore, . For the 80 MHz Fourier harmonic analyzed here, the phasor angle φ describes the phase lag of the reconstructed fluorescence response relative to excitation. The equivalent temporal phase delay is Δt = φ/ω, whereas the phase lifetime is .
For a monoexponential fluorescence decay, τφ equals the fluorescence lifetime. For multicomponent decays, τφ is a frequency-dependent effective lifetime and generally differs from the amplitude-weighted mean lifetime, τmean. In this study, τφ was calculated from fit-derived phasor coordinates and therefore depended on the biexponential model.
2.11. Statistical Analysis
Statistical analysis was performed in Python version 3.14 using NumPy version 2.4.3 and SciPy version 1.17.1 (scipy.linalg and scipy.stats). Individual cells were used as observational units. Descriptive statistics are reported as mean ± standard deviation (SD), together with 95% confidence intervals (CIs) for the group means. Confidence intervals were calculated from the cell-level parameter estimates using Student’s t-distribution as:
where is the group mean, s is the sample standard deviation, and n is the number of analyzed cells in the respective group.
Cells were nested within fields of view and culture wells, while treatments were applied at the well level. Reported cell counts therefore represent the number of analyzed observations rather than the number of independent experimental units.
The Mahalanobis distance (DM) was calculated to quantify the separation of cell groups in the two-dimensional phasor coordinate space [G,S], accounting for differences between group centroids and the covariance structure of the distributions. The Mahalanobis distance was used as a descriptive measure of phasor distribution separation and was not treated as an independent test of statistical significance.
The statistical significance of between-group differences in two-dimensional phasor space was assessed using Hotelling’s T2 test. A multivariate permutation test with 10,000 permutations was also applied, with the test statistic based on the Euclidean distance between group centroids.
The nonparametric Mann–Whitney U test was used for pairwise comparisons of the distributions of individual FLIM parameters between experimental groups. A nominal p-value threshold of 0.05 was used for exploratory comparisons.
The FLIM statistical tests did not account for clustering of cells within fields of view and wells. Accordingly, the reported p-values are nominal and exploratory and may overstate the evidence for between-group differences. The comparisons concern the two studied cell lines and do not establish disease-associated differences across independent donors.
Treatment-versus-control comparisons were performed separately within each cell line. A formal cell line-by-treatment interaction was not tested. Extracellular L-lactate data were analyzed using one-way analysis of variance (ANOVA) followed by Dunnett’s post hoc test.
3. Results
3.1. Immunocytochemical Staining
iPSC cells from both the healthy donor line (PO2) and the Alzheimer’s disease patient line (Alz9L) were differentiated to form cells with endothelial-vascular characteristics, that expressed CD31, CD146, CLDN5, and GPR81, indicating a retained ability for endothelial specification (Figure 1). Additionally, the presence of PDGFRβ displays potential perivascular/mesenchymal traits and phenotypic heterogeneity, which could indicate that a endothelial-to-mesenchymal like transition (EndMT-like) takes place within the obtained cell cultures.
Figure 1.
Representative immunofluorescence images of iPSC-derived cells from the healthy donor-derived PO2 line (upper row) and the AD patient-derived Alz9L line (lower row). Cells were stained for CD31, CD146, claudin-5, GPR81, and PDGFRβ (green); nuclei were counterstained with DAPI (blue). Scale bars: 75 μm.
PDGF-BB/PDGFRB signaling in the cerebral vasculature is known to undergo degenerative changes in AD [73], consistent with the observed reduction in the expression intensity of this marker in cultures derived from the patient with AD.
3.2. Assessment of Extracellular Lactate Levels and Angiogenic Activity in CEC Cultures
The cell lines differed in extracellular lactate production (Figure 2). Under basal conditions, protein-normalized extracellular lactate levels were 26.5% lower in Alz9L than in PO2. Following 3CLBA treatment, lactate levels were 41.8% lower in PO2 and 17.2% lower in Alz9L than in the corresponding controls.
Figure 2.
Extracellular lactate levels in conditioned medium from PO2 and Alz9L cells under control conditions and following 24 h treatment with 20 μM 3-chloro-5-hydroxybenzoic acid (3CLBA). Lactate levels were normalized to total protein and are expressed as μmol/mg protein. Data are presented as mean ± standard deviation. Each group comprised two biological replicates, each analyzed in technical duplicate, yielding four measurements per group. Each symbol represents one measurement. Statistical comparisons were performed using one-way ANOVA followed by Dunnett’s post hoc test. * p ≤ 0.05; ** p ≤ 0.01.
Microscopy analysis showed that spheroids derived from the patient with AD exhibited higher angiogenic activity post-stimulation than those derived from the healthy donor (Figure 3).
Figure 3.
Qualitative analysis of angiogenic activity in spheroids formed from endothelial cells of the PO2 and Alz9L lines differentiated according to the standard protocol, 16 h after stimulation with VEGF-A and FGF-2. Bright-field microscopy, ×10 magnification.
3.3. Assessment of the NAD(P)H-Dependent FLIM Phenotype of the PO2 and Alz9L Cell Lines
To assess the basal NAD(P)H-dependent FLIM phenotype, CECs from the control PO2 line (Healthy) were compared with those from the AD patient-derived Alz9L line (Alzheimer). Cell-level FLIM parameters and fit-derived phasor coordinates were obtained from fits to ROI-integrated decays. Representative images showed pronounced intracellular heterogeneity in NAD(P)H autofluorescence lifetime distributions in both cell lines (Figure 4A,B).
Figure 4.
Differences in the NAD(P)H-dependent FLIM phenotype of CECs derived from a healthy donor and a patient with AD under basal conditions. Colors of the image correspond to mean NAD(P)H fluorescence lifetime (τmean) in pixel (A,B) Representative images of CECs from the control PO2 line (Healthy, (A)) and the AD patient-derived Alz9L line (Alzheimer, (B)). NAD(P)H autofluorescence intensity images are shown on the left, with corresponding pseudocolor mean lifetime maps on the right; the color scale spans 300–1500 ps. Scale bars: 20 μm. (C) Fit-derived NAD(P)H phasor distributions for individually selected PO2 (n = 14) and Alz9L (n = 23) cells. Lines indicate distribution density contours. The Mahalanobis distance between groups was DM = 1.52; both Hotelling’s test and the permutation test yielded nominal cell-level p-values < 0.001. (D) Mean NAD(P)H fluorescence lifetime (τmean). (E) Amplitude ratio of the short- and long-lived components (a1/a2). (F) Phase lifetime (τφ). (G) Lifetime of the short-lived component (τ1). In the box plots, individual points represent individual cells; solid black lines indicate medians, and dashed red lines indicate means. Exact p-values are shown in the respective panels. *** p < 0.001. The quantities in panels C-G were calculated from ROI-integrated cell decays; n denotes the number of analyzed cells.
The fit-derived phasor distributions differed between the two studied cell lines (Figure 4C). The Alz9L phasor cloud was shifted toward higher G and lower S values relative to PO2. The Mahalanobis distance between the distributions was DM = 1.52, indicating moderate group separation with substantial overlap between the phasor clouds. Cell-level comparisons yielded nominal p-values < 0.001 with both Hotelling’s test (T2 = 20.18) and the permutation test.
An additional analysis using phasor coordinates obtained from the experimental decays in SPCImage also showed differences between the two cell lines under basal conditions (Figure S4). The Mahalanobis distance was DM = 1.94, and Hotelling’s test yielded T2 = 32.14 (p = 0.000017). However, the absolute phasor coordinates differed substantially from those obtained using the fit-derived representation. Thus, group separation was observed with both approaches, while quantitative agreement between their absolute coordinates was not established.
Despite the differences in phasor space, the mean NAD(P)H lifetime remained virtually unchanged. The τmean value was 0.67 ± 0.07 ns in Healthy cells and 0.68 ± 0.07 ns in Alzheimer cells (Figure 4D). Thus, the observed phasor shift was not accompanied by a change in the amplitude-weighted mean lifetime.
The relative amplitude of the short-lived component, a1, was also higher in Alzheimer cells: 75.44 ± 6.67% versus 71.50 ± 3.85% in Healthy cells. A similar trend was observed for the a1/a2 ratio, which was 3.41 ± 1.39 in Alzheimer cells and 2.56 ± 0.44 in Healthy cells (Figure 4E). The nominal cell-level p-value was 0.054 for both parameters.
More pronounced differences emerged when individual decay characteristics were analyzed. The phase lifetime, τφ, was lower in Alzheimer cells, at 1.08 ± 0.10 ns, compared with 1.21 ± 0.06 ns in Healthy cells (nominal p < 0.001; Figure 4F). In contrast, the lifetime of the short-lived component, τ1, changed in the opposite direction and was higher in Alzheimer cells: 0.31 ± 0.06 ns versus 0.23 ± 0.04 ns in Healthy cells (nominal p < 0.001; Figure 4G).
Thus, the studied CECs derived from a healthy donor and a patient with AD differed in the structure of their multicomponent fluorescence decays and phasor characteristics rather than in mean NAD(P)H lifetime. The decrease in τφ together with the increase in τ1 shows that the altered NAD(P)H-dependent FLIM phenotype of Alz9L cells cannot be described by a simple unidirectional lifetime change. The fit-derived phasor representation jointly visualizes these differences in the fitted lifetimes and relative amplitudes, complementing the comparison based on τmean alone.
To assess the plasticity of the NAD(P)H-dependent FLIM phenotype, we investigated the effects of 3CLBA, a GPR81 receptor agonist, and sodium lactate on CEC lines derived from a healthy donor and a patient with AD (Figure 5). The analysis included comparisons of fit-derived phasor distributions between cell lines under each treatment condition and quantitative assessment of mean lifetime (τmean), phase lifetime (τφ), the lifetimes of the short- and long-lived components (τ1 and τ2), and the relative contribution of the short-lived NAD(P)H component.
Figure 5.
Effects of 3CLBA on the NAD(P)H-dependent FLIM phenotype of CECs derived from a healthy donor (Healthy) and a patient with AD (Alzheimer). (A) Fit-derived NAD(P)H phasor distributions for individual Healthy and Alzheimer cells following 3CLBA treatment. The Mahalanobis distance between groups was DM = 0.21. The nominal cell-level p-values were 0.868 for Hotelling’s test and 0.856 for the permutation test. (B) Mean NAD(P)H fluorescence lifetime (τmean). (C) Amplitude ratio of the short- and long-lived components (a1/a2). (D) Phase lifetime (τφ). (E) Lifetime of the short-lived component (τ1). Individual points in the box plots represent individual cells; solid black lines indicate medians, and dashed red lines indicate means. Exact nominal cell-level p-values are shown in the respective panels. * p < 0.05.
Following 3CLBA treatment, the fit-derived phasor distributions of the two studied cell lines overlapped substantially (DM = 0.21). Both Hotelling’s test and the permutation test yielded nominal cell-level p-values above 0.85. Thus, the pronounced difference between Healthy and Alzheimer cells observed under basal conditions was no longer detectable in phasor space after 3CLBA treatment.
Most quantitative FLIM parameters also did not differ between the cell lines following 3CLBA treatment. The phase lifetime was 1.20 ± 0.05 ns in Healthy cells and 1.22 ± 0.11 ns in Alzheimer cells (p = 1.000); τ1 was 0.30 ± 0.06 and 0.25 ± 0.07 ns, respectively (p = 0.15). The a1/a2 ratio was also comparable: 3.09 ± 0.52 in Healthy cells and 3.28 ± 0.47 in Alzheimer cells (p = 0.364). The τmean values were 0.73 ± 0.08 ns in Healthy cells and 0.66 ± 0.08 ns in Alzheimer cells (nominal p = 0.044).
The observed changes relative to the corresponding basal states are summarized in Figure 6. In Healthy cells, 3CLBA treatment increased τ1 from 0.23 ± 0.04 to 0.30 ± 0.06 ns, together with increases in τmean and the a1/a2 ratio. In Alzheimer cells, by contrast, τ1 decreased from 0.31 ± 0.06 to 0.25 ± 0.07 ns, whereas τφ increased from 1.08 ± 0.10 to 1.22 ± 0.11 ns. Thus, the statistically significant difference between the Healthy and Alzheimer phasor distributions observed under basal conditions was no longer detected after 3CLBA treatment.
Figure 6.
Comparison of NAD(P)H-dependent FLIM parameters in CECs derived from a healthy donor (Healthy) and a patient with AD (Alzheimer) under basal conditions and following 3CLBA and sodium lactate treatment. (A) Mean NAD(P)H fluorescence lifetime (τmean). (B) Amplitude ratio of the short- and long-lived components (a1/a2). (C) Phase lifetime (τφ). (D) Lifetime of the short-lived component (τ1). Values under basal conditions (Control) and following 3CLBA and sodium lactate treatment are shown for each cell line. Individual points represent individual cells; solid black lines indicate medians, and dashed red lines indicate means. Brackets indicate within-line comparisons with nominal cell-level p-values below 0.05: * p < 0.05, ** p < 0.01, *** p < 0.001.
A different pattern was observed following sodium lactate treatment (Figure 7). Under these conditions, Healthy and Alzheimer cells showed pronounced differences in several fluorescence decay parameters. The mean lifetime, τmean, was lower in Alzheimer cells, at 0.55 ± 0.04 ns, compared with 0.68 ± 0.07 ns in Healthy cells (p < 0.001). The a1/a2 ratio was higher in Alzheimer cells: 3.01 ± 0.41 versus 2.16 ± 0.67 in Healthy cells (p = 0.001). The τ1 value was also lower in Alzheimer cells, at 0.18 ± 0.03 ns, compared with 0.22 ± 0.04 ns in Healthy cells (p = 0.013). The phase lifetime did not differ significantly: 1.18 ± 0.10 and 1.12 ± 0.11 ns in Healthy and Alzheimer cells, respectively (p = 0.320).
Figure 7.
Effects of sodium lactate on the NAD(P)H-dependent FLIM phenotype of CECs derived from a healthy donor (Healthy) and a patient with AD (Alzheimer). (A) Fit-derived NAD(P)H phasor distributions for individual Healthy and Alzheimer cells following sodium lactate treatment. The Mahalanobis distance between groups was DM = 0.99. The nominal cell-level p-values were 0.045 for Hotelling’s test and 0.412 for the permutation test. (B) Mean NAD(P)H fluorescence lifetime (τmean). (C) Amplitude ratio of the short- and long-lived components (a1/a2). (D) Lifetime of the short-lived component (τ1). (E) Phase lifetime (τφ). Individual points in the box plots represent individual cells; solid black lines indicate medians, and dashed red lines indicate means. Exact nominal p-values are shown in the respective panels. * p < 0.05, ** p < 0.01, **** p < 0.0001.
Following lactate treatment, the Mahalanobis distance between the fit-derived phasor distributions of the two cell lines was DM = 0.99. Hotelling’s test yielded a nominal cell-level p-value of 0.045, whereas the permutation test yielded p = 0.412. Thus, the evidence for between-line separation in phasor space was not consistent across the two tests.
Treatment-versus-control comparisons of FLIM parameters were performed separately within each cell line (Figure 6). In Healthy cells, the most pronounced changes occurred following 3CLBA treatment: mean lifetime (τmean), the a1/a2 ratio, and the lifetime of the short-lived component (τ1) increased. The phase lifetime, τφ, did not change significantly. Sodium lactate treatment did not induce statistically significant changes in the presented FLIM parameters relative to the basal Healthy state.
In Alz9L cells, 3CLBA treatment was associated with an increase in τφ and a decrease in τ1 relative to the basal state. The most pronounced response occurred following sodium lactate treatment: τmean decreased from 0.68 ± 0.07 to 0.55 ± 0.04 ns, and τ1 decreased from 0.31 ± 0.06 to 0.18 ± 0.03 ns. Following sodium lactate treatment, comparisons of a1/a2 and τφ with the basal state yielded nominal cell-level p-values above 0.05.
For the long-lived component, τ2, between-line comparisons yielded nominal cell-level p-values of 0.36 under basal conditions, 0.67 following 3CLBA treatment, and 0.95 following sodium lactate treatment (Figure S3). Within-line comparisons showed an increase in τ2 following 3CLBA treatment in PO2 cells and a decrease following sodium lactate treatment in Alz9L cells relative to their corresponding controls. These findings were interpreted as exploratory observations within the two studied cell lines.
Following 3CLBA treatment, τmean, a1/a2, τ1, and τ2 increased in PO2 cells, whereas τφ increased and τ1 decreased in Alz9L cells. Following sodium lactate treatment, τmean, τ1, and τ2 decreased in Alz9L cells. These observations summarize the within-line changes; differences in treatment-induced changes between the two cell lines were not formally tested.
A summary of the fluorescence decay parameters is presented in Table 1.
Table 1.
Summary of NAD(P)H-dependent FLIM parameters in PO2 and Alz9L cells.
4. Discussion
This proof-of-concept study identified differences in the NAD(P)H-dependent FLIM phenotype of the two studied iPSC-derived CEC lines, PO2 and Alz9L, using biexponential decay fitting and a fit-derived phasor representation [58,61,74,75]. Under basal conditions, the fit-derived phasor distributions of healthy donor-derived and AD patient-derived cells differed in exploratory cell-level comparisons despite similar mean NAD(P)H fluorescence lifetimes. These findings show that similar τmean values can accompany differences in individual fluorescence decay parameters. The fit-derived phasor representation provides a joint visualization of these differences.
The similar τmean values were accompanied by a lower τφ and a higher τ1 in Alz9L cells than in PO2 cells. The a1/a2 ratio and the amplitude of the short-lived component showed only upward trends. This combination indicates that differences between the cell lines cannot be described by the direction of change in mean lifetime or by an unambiguous redistribution of free and enzyme-bound NAD(P)H. One possible explanation is that the observed differences in multicomponent fluorescence decay reflect changes in the molecular microenvironment of NAD(P)H and its interactions with cellular enzymes [76,77].
When interpreting these changes, it is necessary to consider that the short- and long-lived components are only predominantly associated with free and enzyme-bound NAD(P)H, respectively. Their lifetimes also depend on the local microenvironment, compartmentalization, binding to different enzymes, pH, and other physicochemical factors [76,77,78]. In the present analysis, NADH and NADPH contributions were not separated, and the measured autofluorescence was interpreted as a combined NAD(P)H signal. NADPH plays an important role in maintaining cellular redox homeostasis and is closely associated with pentose phosphate pathway activity, which can change substantially in response to oxidative and metabolic stress [79,80,81]. Therefore, the increase in τ1 in the Alz9L cell line should not be directly interpreted as an increase or decrease in glycolytic activity. It represents a difference in the fitted short-lifetime component, whose molecular origin cannot be assigned uniquely from these data.
The distinction between τmean and τφ illustrates how different summaries of the same fitted decay can emphasize different aspects of its shape. The mean lifetime is an amplitude-weighted combination of individual decay components, so opposing changes in their lifetimes and amplitudes can partially compensate for one another. In contrast, the phase lifetime is determined by the angular position of the phasor and provides an integrated characteristic of multicomponent fluorescence kinetics. The lower τφ in Alz9L cells, despite similar τmean values, therefore reflects differences in the fitted decay that are not captured by τmean alone. In the present workflow, τφ and the phasor coordinates were calculated from the same biexponential parameters and provide complementary summaries of the fitted decay [74]. The fit-derived representation does not provide independent evidence beyond those parameters.
Treatment with metabolic modulators was associated with changes in NAD(P)H-dependent FLIM parameters within each studied cell line. Following 3CLBA treatment, the fit-derived phasor distributions overlapped substantially (DM = 0.21), and the between-line comparisons did not reach the nominal significance threshold in either Hotelling’s test or the permutation test.
In PO2 cells, 3CLBA treatment increased τmean, a1/a2, τ1, and τ2, whereas in Alz9L cells, τφ increased and τ1 decreased. These observed directions of change do not establish a difference in treatment effects between the cell lines, because a cell line-by-treatment interaction was not formally tested. Because 3CLBA is a GPR81 agonist, this effect may be associated with differences in GPR81-dependent regulation of metabolism and mitochondrial function in the studied cells [36,37,39]. However, FLIM data alone cannot establish which signaling components determine the observed effect, and this interpretation therefore requires additional functional validation.
Following sodium lactate treatment, exploratory cell-level comparisons between PO2 and Alz9L yielded nominal p-values below 0.05 for τmean, a1/a2, and τ1, whereas the comparisons of τφ and τ2 did not reach this threshold.
The Mahalanobis distance between the fit-derived phasor distributions was DM = 0.99. Hotelling’s test yielded a nominal cell-level p-value of 0.045, whereas the permutation test yielded p = 0.412. This again shows that changes in individual decay characteristics do not necessarily result in robust separation of the overall phasor distributions.
Within Alz9L cells, sodium lactate treatment was associated with decreases in τmean, τ1, and τ2 relative to the basal state. The corresponding within-line comparisons in PO2 cells did not reach the nominal significance threshold. Lactate can act both as an energy substrate after transport through monocarboxylate transporters and as a signaling molecule acting through GPR81. The observed differential response may therefore reflect alterations in one or more of these mechanisms [17,36,37,39,40,41].
Together, the results obtained with 3CLBA and lactate demonstrate changes in NAD(P)H-dependent FLIM parameters within the two studied cell lines. However, these data do not support an unambiguous interpretation of the observed changes as a switch between glycolysis and oxidative phosphorylation. Such a conclusion would require independent functional measurements, including oxygen consumption and extracellular acidification rates (OCR/ECAR), mitochondrial membrane potential, reactive oxygen species production, and analysis of the expression and activity of key metabolic enzymes and components of lactate-dependent signaling [82,83,84,85]. In this context, FLIM should provide label-free phenotyping tool capable of detecting changes in NAD(P)H state and cellular responses to metabolic perturbations.
The observed NAD(P)H-dependent FLIM differences should also be considered in the context of endothelial plasticity. EndMT and partial EndMT-like states in cerebral microvessels have been linked to loss of barrier properties, inflammation, extracellular matrix remodeling, and vascular fragility during aging and CNS diseases [30,31,32,33]. In experimental AD, EndMT-associated transcriptomic changes have been reported together with mitochondrial and endoplasmic reticulum stress, oxidative responses, and reorganization of energy metabolism [34]. Thus, FLIM-detected NAD(P)H changes could theoretically accompany changes in cellular identity; however, a causal relationship between the FLIM phenotype and EndMT was not established in this study.
The ambiguity of lactate-dependent effects deserves particular attention. GPR81/HCA1 can support anti-inflammatory endothelial programs. In a cellular model of oscillatory shear stress, lactate-mediated GPR81 activation restored GPR81 and activated KLF2 [38]. In another vascular pathology, however, lactate stimulated EndMT through the Twist1 lactylation–TGFB1–Smad2 signaling pathway [42]. These findings are not contradictory but emphasize the context-dependent action of lactate: its effects are determined by the combination of MCT-mediated transport, substrate utilization, GPR81 signaling, and epigenetic mechanisms. Interpreting the responses of PO2 and Alz9L therefore requires direct measurement of HCAR1/GPR81 and MCT1/MCT4 expression, as well as EndMT markers, before and after lactate treatment.
Several limitations of this study should be considered:
First, the recorded autofluorescence represents the combined NADH and NADPH signal, limiting the attribution of the observed changes to specific metabolic pathways.
Second, the study used cells derived from a single healthy control line (PO2) and a single AD patient-derived line (Alz9L). The observed differences should therefore be regarded as an initial characterization of the studied cellular models, and their reproducibility and interindividual variability require verification using additional independent donor lines [21,86,87]. This design does not distinguish disease-associated effects from donor- or line-specific effects.
Third, individual cells were nested within fields of view and culture wells, whereas treatment was applied at the well level, with one control well and one treated well per cell line in each modulator experiment. The FLIM statistical tests did not account for this clustering, and the reported cell-level p-values may therefore overstate the statistical evidence. These comparisons are exploratory and require confirmation in additional independent experiments.
Fourth, the phasor coordinates and τφ were derived from biexponential fit parameters and therefore inherit the assumptions and uncertainties of the fitting procedure. The effective IRF was reconstructed from fluorescence decays to account for additional response peaks in some recordings; an independent IRF measurement was not performed. The accuracy of the estimated lifetimes, particularly τ1, therefore depends on the adequacy of both the decay model and the reconstructed effective IRF.
The supplementary SPCImage analysis also distinguished the two cell lines under basal conditions, although its absolute phasor coordinates differed substantially from those obtained using the fit-derived approach. The origin of this discrepancy remains unresolved. Residual effects of the additional peaks and differences in their treatment during phasor calculation cannot be excluded. Consequently, this comparison supports the observation of group separation with both representations but does not independently validate the absolute phasor positions or their metabolic interpretation. The main analysis is therefore consistently described as a fit-derived phasor representation.
Fifth, the studied vascular cells originate from a common mesodermal/vascular progenitor pool. Current iPSC differentiation protocols can generate endothelial cells, pericytes, and smooth muscle cells from mesodermal progenitors; iPSC-derived pericytes characteristically express PDGFRβ, NG2/CSPG4, CD13, and CD146 [88]. Therefore, relatively weak CD31/Claudin-5 expression combined with strong PDGFRβ/CD146 expression may reflect not only EndMT in mature endothelial cells but also incomplete endothelial specialization or preferential differentiation of mesodermal progenitors toward a pericyte lineage. Distinguishing these scenarios is particularly important when comparing PO2 and Alz9L, because iPSC genetic background and stress sensitivity can influence differentiation efficiency and trajectory. This requires a quantitative panel of endothelial markers (PECAM1/CD31, CDH5/VE-cadherin, CLDN5, VWF, and SLC2A1/GLUT1), pericyte markers (PDGFRB, CSPG4/NG2, RGS5, and CD146), and EndMT markers (ACTA2/α-SMA, VIM, FN1, COL1A1, SNAI1/2, and TWIST1), preferably assessed over time from the mesodermal stage to a mature vascular culture.
The statistical assessment of phasor distributions also warrants consideration. The Mahalanobis distance was used as a descriptive measure of multivariate group separation and was not itself regarded as a test of statistical significance [89]. Exploratory cell-level comparisons were performed using Hotelling’s test and the permutation test. This was particularly important for the lactate-treated data, for which the parametric and permutation approaches yielded different results and did not support a conclusion of robust separation of the overall phasor distributions.
Despite these limitations, the findings provide proof-of-concept evidence that NAD(P)H-dependent FLIM can characterize differences between the two studied iPSC-derived CEC lines. The value of this approach lies in the joint interpretation of fitted decay parameters and their changes following metabolic perturbations. Expanding the number of independent iPSC lines and comparing FLIM parameters with standard molecular and functional markers of the endothelial and AD-associated phenotypes will help establish whether the identified features are reproducible characteristics of the cerebral endothelium in AD.
Thus, biexponential decay fitting combined with a fit-derived phasor representation provides a label-free approach to characterizing NAD(P)H-dependent fluorescence in the studied cellular models. This workflow visualized basal differences in fitted decay parameters despite similar τmean values and described within-line changes following 3CLBA and sodium lactate treatment. With further biological validation and an expanded range of independent cellular models, this approach may be useful for investigating the vascular component of AD and assessing metabolically targeted interventions [19,56,67].
5. Conclusions
This proof-of-concept study used biexponential fitting and fit-derived phasor analysis to characterize the NAD(P)H-dependent phenotype of CECs derived from one healthy donor (PO2) and one patient with AD (Alz9L). Under basal conditions, the cell lines differed in fit-derived phasor characteristics, phase lifetime (τφ), and the lifetime of the short-lived component (τ1), despite similar mean lifetimes (τmean). This shows that changes in the structure of multicomponent NAD(P)H fluorescence decays may remain undetected when only the mean fluorescence lifetime is analyzed.
Treatment with 3CLBA and sodium lactate was associated with within-line changes in several FLIM parameters. Following 3CLBA treatment, the fit-derived phasor distributions overlapped substantially, while τ1 increased in PO2 cells and decreased in Alz9L cells. Following sodium lactate treatment, τmean, τ1, and τ2 decreased in Alz9L cells. These observations describe changes within each line; differences in treatment effects between the lines were not formally tested.
These findings should be regarded as proof of concept because the study used iPSC-derived cells from one healthy donor control line and one AD patient-derived line, and the recorded autofluorescence represents the combined contributions of NADH and NADPH. Validation in additional independent cell lines and comparison with molecular and functional characteristics of the endothelial and AD-associated phenotypes are necessary to establish the reproducibility and biological specificity of the identified FLIM signatures.
Overall, biexponential fitting combined with a fit-derived phasor representation provides a label-free approach to characterizing NAD(P)H-dependent fluorescence in the studied iPSC-derived vascular cell models. The approach supports joint interpretation of fitted lifetimes and amplitudes and their changes following metabolic modulation. The relationship of these FLIM signatures to endothelial identity, EndMT-like plasticity, and angiogenic function is a promising hypothesis that requires quantitative phenotypic and functional validation.
Supplementary Materials
The following supporting information can be downloaded at: https://www.mdpi.com/article/10.3390/bios16110632/s1. Figure S1: Effect of IRF treatment on biexponential fitting; Figure S2: Comparison of monoexponential and biexponential fits to the same cellular decay, containing 42,876 photons within the selected time gate; Figure S3: Long-lifetime component τ2 of NAD(P)H fluorescence in PO2 (Healthy) and Alz9L (Alzheimer) cells; Figure S4: Comparison of fit-derived and SPCImage phasor representations of NAD(P)H fluorescence decays under basal conditions.
Author Contributions
Conceptualization V.I.M., N.A.R.; methodology V.I.M., Y.K.K., N.A.K.; software I.D.R.; validation V.I.M., N.A.R.; formal analysis E.S.P., M.A.L., A.S., V.I.Z., T.I.B.; investigation V.I.M., N.A.R., E.S.P., A.S.S., V.I.Z., Y.A.T.; resources V.I.M., A.S.A., A.B.S.; data curation V.I.M., I.D.R., Y.K.K., P.P.T., N.A.K.; writing—original draft preparation V.I.M., N.A.R., Y.K.K.; writing—review and editing Y.K.K., T.I.B., P.P.T., N.A.R., A.B.S.; visualization V.I.M., N.A.R., E.S.P., M.A.L.; supervision A.B.S.; project administration A.S.A., A.B.S.; funding acquisition V.I.M., Y.K.K., P.P.T., A.B.S. All authors have read and agreed to the published version of the manuscript.
Funding
This research was funded by the Russian Science Foundation, project № 22-15-00126-П, https://rscf.ru/project/22-15-00126/ (accessed on 3 September 2026).
Institutional Review Board Statement
The study was approved by the Ethics Committee of the Russian Center of Neurology and Neuroscience (protocol No. 5-3/22, dated 1 June 2022).
Informed Consent Statement
Informed consent was obtained from all subjects involved in the study.
Data Availability Statement
The data presented in this study are available on request from the corresponding author.
Acknowledgments
During the preparation of this manuscript, the authors used ChatGPT (Sol 6.1 model, OpenAI) for language editing, translation, assistance with manuscript wording, and preparation of the initial schematic vector graphical abstract. The graphical abstract was subsequently manually edited and refined by the author. The authors have reviewed and edited the output and take full responsibility for the content of this publication.
Conflicts of Interest
The authors declare no conflicts of interest.
References
- Eisenmenger, L.B.; Peret, A.; Famakin, B.M.; Spahic, A.; Roberts, G.S.; Bockholt, J.H.; Johnson, K.M.; Paulsen, J.S. Vascular contributions to Alzheimer’s disease. Transl. Res. 2023, 254, 41–53. [Google Scholar] [CrossRef] [Scilit] [PubMed]
- Georgieva, I.; Tchekalarova, J.; Iliev, D.; Tzoneva, R. Endothelial senescence and its impact on angiogenesis in Alzheimer’s disease. Int. J. Mol. Sci. 2023, 24, 11344. [Google Scholar] [CrossRef] [Scilit] [PubMed]
- Averchuk, A.S.; Ryazanova, M.V.; Stavrovskaya, A.V.; Novikova, S.V.; Salmina, A.B. Evaluation of angiogenesis and microvascular remodeling in the subventricular zone of the brain of mice with experimental Alzheimer’s disease. Kazan. Med. J. 2024, 105, 231–239. [Google Scholar] [CrossRef] [Scilit]
- Biron, K.E.; Dickstein, D.L.; Gopaul, R.; A Jefferies, W. Amyloid triggers extensive cerebral angiogenesis causing blood brain barrier permeability and hypervascularity in Alzheimer’s disease. PLoS ONE 2011, 6, e23789. [Google Scholar] [CrossRef] [Scilit] [PubMed]
- Custodia, A.; Ouro, A.; Romaus-Sanjurjo, D.; Pías-Peleteiro, J.M.; de Vries, H.E.; Castillo, J.; Sobrino, T. Endothelial progenitor cells and vascular alterations in Alzheimer’s disease. Front. Aging Neurosci. 2022, 13, 811210. [Google Scholar] [CrossRef] [Scilit] [PubMed]
- Soto-Rojas, L.O.; Pacheco-Herrero, M.; Martínez-Gómez, P.A.; Campa-Córdoba, B.B.; Apátiga-Pérez, R.; Villegas-Rojas, M.M.; Harrington, C.R.; de la Cruz, F.; Garcés-Ramírez, L.; Luna-Muñoz, J. The neurovascular unit dysfunction in Alzheimer’s disease. Int. J. Mol. Sci. 2021, 22, 2022. [Google Scholar] [CrossRef] [Scilit] [PubMed]
- Zlokovic, B.V. Neurovascular pathways to neurodegeneration in Alzheimer’s disease and other disorders. Nat. Rev. Neurosci. 2011, 12, 723–738. [Google Scholar] [CrossRef] [Scilit] [PubMed]
- McConnell, H.L.; Kersch, C.N.; Woltjer, R.L.; Neuwelt, E.A. The translational significance of the neurovascular unit. J. Biol. Chem. 2017, 292, 762–770. [Google Scholar] [CrossRef] [Scilit] [PubMed]
- Alkhalifa, A.E.; Al-Ghraiybah, N.F.; Odum, J.; Shunnarah, J.G.; Austin, N.; Kaddoumi, A. Blood–brain barrier breakdown in Alzheimer’s disease: Mechanisms and targeted strategies. Int. J. Mol. Sci. 2023, 24, 16288. [Google Scholar] [CrossRef] [Scilit] [PubMed]
- Divecha, Y.A.; Rampes, S.; Tromp, S.; Boyanova, S.T.; Fleckney, A.; Fidanboylu, M.; Thomas, S.A. The microcirculation, the blood-brain barrier and the neurovascular unit in health and Alzheimer’s Disease. Pharmacol. Rev. 2025, 77, 100052. [Google Scholar] [CrossRef] [Scilit] [PubMed]
- Halliday, M.R.; Rege, S.V.; Ma, Q.; Zhao, Z.; A Miller, C.; A Winkler, E.; Zlokovic, B.V. Accelerated pericyte degeneration and blood–brain barrier breakdown in apolipoprotein E4 carriers with Alzheimer’s disease. J. Cereb. Blood Flow. Metab. 2016, 36, 216–227. [Google Scholar] [CrossRef] [Scilit] [PubMed]
- Sengillo, J.D.; Winkler, E.A.; Walker, C.T.; Sullivan, J.S.; Johnson, M.; Zlokovic, B.V. Deficiency in mural vascular cells coincides with blood–brain barrier disruption in Alzheimer’s disease. Brain Pathol. 2013, 23, 303–310. [Google Scholar] [CrossRef] [Scilit] [PubMed]
- Takeuchi, L.E.; Kalia, L.V.; Simmons, C.A. Vascular models of Alzheimer’s disease: An overview of recent in vitro models of the blood-brain barrier. Neurobiol. Dis. 2025, 208, 106864. [Google Scholar] [CrossRef] [Scilit] [PubMed]
- Gyanwali, B.; Shaik, M.A.; Tan, C.S.; Vrooman, H.; Venketasubramanian, N.; Chen, C.; Hilal, S. Mixed-location cerebral microbleeds as a biomarker of neurodegeneration in a memory clinic population. Aging 2019, 11, 10581. [Google Scholar] [CrossRef] [Scilit] [PubMed]
- Gertje, E.C.; van Westen, D.; Panizo, C.; Mattsson-Carlgren, N.; Hansson, O. Association of Enlarged Perivascular Spaces and Measures of Small Vessel and Alzheimer Disease. Neurology 2021, 96, e193–e202. [Google Scholar] [CrossRef] [Scilit] [PubMed]
- Tregub, P.P.; Averchuk, A.S.; Baranich, T.I.; Ryazanova, M.V.; Salmina, A.B. Physiological and pathological remodeling of cerebral microvessels. Int. J. Mol. Sci. 2022, 23, 12683. [Google Scholar] [CrossRef] [Scilit] [PubMed]
- Salmina, A.B.; Kuvacheva, N.V.; Morgun, A.V.; Komleva, Y.K.; Pozhilenkova, E.A.; Lopatina, O.L.; Gorina, Y.V.; Taranushenko, T.E.; Petrova, L.L. Glycolysis-mediated control of blood-brain barrier development and function. Int. J. Biochem. Cell Biol. 2015, 64, 174–184. [Google Scholar] [CrossRef] [Scilit] [PubMed]
- Leung, S.S.; Shi, Y. The glycolytic process in endothelial cells and its implications. Acta Pharmacol. Sin. 2022, 43, 251–259. [Google Scholar] [CrossRef] [Scilit] [PubMed]
- Liu, Y.; Wu, Z.; Li, Y.; Chen, Y.; Zhao, X.; Wu, M.; Xia, Y. Metabolic reprogramming and interventions in angiogenesis. J. Adv. Res. 2025, 70, 323–338. [Google Scholar] [CrossRef] [Scilit] [PubMed]
- Bridges, L.R.; Andoh, J.; Lawrence, A.J.; Khoong, C.H.; Poon, W.W.; Esiri, M.M.; Markus, H.S.; Hainsworth, A.H. Blood–brain barrier dysfunction and cerebral small vessel disease (arteriolosclerosis) in brains of older people. J. Neuropathol. Exp. Neurol. 2014, 73, 1026–1033. [Google Scholar] [CrossRef] [Scilit] [PubMed]
- Sweeney, M.D.; Sagare, A.P.; Zlokovic, B.V. Blood–brain barrier breakdown in Alzheimer disease and other neurodegenerative disorders. Nat. Rev. Neurol. 2018, 14, 133–150. [Google Scholar] [CrossRef] [Scilit] [PubMed]
- Montagne, A.; Barnes, S.R.; Sweeney, M.D.; Halliday, M.R.; Sagare, A.P.; Zhao, Z.; Toga, A.W.; Jacobs, R.E.; Liu, C.Y.; Amezcua, L.; et al. Blood-brain barrier breakdown in the aging human hippocampus. Neuron 2015, 85, 296–302. [Google Scholar] [CrossRef] [Scilit] [PubMed]
- Marco, S.; Skaper, S.D. Amyloid β-peptide1–42 alters tight junction protein distribution and expression in brain microvessel endothelial cells. Neurosci. Lett. 2006, 401, 219–224. [Google Scholar] [CrossRef] [Scilit] [PubMed]
- Kook, S.Y.; Hong, H.S.; Moon, M.; Ha, C.M.; Chang, S.; Mook-Jung, I. Aβ1–42–RAGE interaction disrupts tight junctions of the blood–brain barrier via Ca2+-calcineurin signaling. J. Neurosci. 2012, 32, 8845–8854. [Google Scholar] [CrossRef] [Scilit] [PubMed]
- Huang, X.; Qi, J.; Su, Y.; Zhou, Y.; Wang, Q.; Huang, T.; Xue, D.; Zeng, Y.; Verkhratsky, A.; Zhou, B.; et al. Endothelial DR6 in blood-brain barrier malfunction in Alzheimer’s disease. Cell Death Dis. 2024, 15, 258. [Google Scholar] [CrossRef] [Scilit] [PubMed]
- Omar, O.M.F.; Kimble, A.L.; Cheemala, A.; Tyburski, J.D.; Pandey, S.; Wu, Q.; Reese, B.; Jellison, E.R.; Hao, B.; Li, Y.; et al. Endothelial TDP-43 depletion disrupts core blood–brain barrier pathways in neurodegeneration. Nat. Neurosci. 2025, 28, 973–984. [Google Scholar] [CrossRef] [Scilit] [PubMed]
- Katusic, Z.S.; d’Uscio, L.V.; He, T. Emerging roles of endothelial nitric oxide in preservation of cognitive health. Stroke 2023, 54, 686–696. [Google Scholar] [CrossRef] [Scilit] [PubMed]
- Austin, S.A.; Santhanam, A.V.; Hinton, D.J.; Choi, D.; Katusic, Z.S. Endothelial nitric oxide deficiency promotes Alzheimer’s disease pathology. J. Neurochem. 2013, 127, 691–700. [Google Scholar] [CrossRef] [Scilit] [PubMed]
- Apátiga-Pérez, R.; Soto-Rojas, L.O.; Campa-Córdoba, B.B.; Luna-Viramontes, N.I.; Cuevas, E.; Villanueva-Fierro, I.; Ontiveros-Torres, M.A.; Bravo-Muñoz, M.; Flores-Rodríguez, P.; Garcés-Ramirez, L.; et al. Neurovascular dysfunction and vascular amyloid accumulation as early events in Alzheimer’s disease. Metab. Brain Dis. 2022, 37, 39–50. [Google Scholar] [CrossRef] [Scilit] [PubMed]
- Vance, M.L.; Nagy, D.; Brunner, E.; Morkotinis, V.; Black, J.L.; Refai, L.H.; Csiszar, A.; Conley, S.M. Endothelial-to-mesenchymal transition in the central nervous system: A potential therapeutic target to combat age-related vascular fragility. J. Pharmacol. Exp. Ther. 2025, 392, 103747. [Google Scholar] [CrossRef] [Scilit] [PubMed]
- Ishak, N.I.; Siran, R.; Wan Mohamad Zain, W.N.I.; Azme, N. Endothelial-to-mesenchymal Transition at the Blood-brain Barrier: Molecular Mechanisms and Pathological Roles Across Brain Diseases. CNS Neurol. Disord. Drug Targets 2026. Online ahead of print. [Google Scholar] [CrossRef] [Scilit] [PubMed]
- Derada Troletti, C.; de Goede, P.; Kamermans, A.; de Vries, H.E. Molecular alterations of the blood-brain barrier under inflammatory conditions: The role of endothelial to mesenchymal transition. Biochim. Biophys. Acta 2016, 1862, 452–460. [Google Scholar] [CrossRef] [Scilit] [PubMed]
- Song, J. EndMT in vascular cognitive impairment and dementia: Mechanisms, evidence gaps, and therapeutic opportunities. Mol. Med. 2026, 32, 94. [Google Scholar] [CrossRef] [Scilit] [PubMed]
- Saaoud, F.; Ben Issa, M.; Liu, L.; Xu, K.; Lu, Y.; Shao, Y.; Han, B.; Jiang, X.; Liu, X.; Gillespie, A.; et al. Organelle stresses and energetic metabolisms promote endothelial-to-mesenchymal transition and fibrosis via upregulating FOSB and MEOX1 in Alzheimer’s disease. Front. Mol. Neurosci. 2025, 18, 1605012. [Google Scholar] [CrossRef] [Scilit] [PubMed]
- Liu, T.; Ma, W.; Xu, H.; Huang, M.; Zhang, D.; He, Z.; Zhang, L.; Brem, S.; O’rOurke, D.M.; Gong, Y.; et al. PDGF-mediated mesenchymal transformation renders endothelial resistance to anti-VEGF treatment in glioblastoma. Nat. Commun. 2018, 9, 3439. [Google Scholar] [CrossRef] [Scilit] [PubMed]
- Khilazheva, E.D.; Pisareva, N.V.; Morgun, A.V.; Boitsova, E.B.; Taranushenko, T.E.; Frolova, O.V.; Salmina, A.B. Activation of GPR81 lactate receptors stimulates mitochondrial biogenesis in cerebral microvessel endothelial cells. Ann. Clin. Exp. Neurol. 2017, 11, 34–39. [Google Scholar] [CrossRef] [Scilit]
- Benarroch, E. What is the role of lactate in brain metabolism, plasticity, and neurodegeneration? Neurology 2024, 102, e209378. [Google Scholar] [CrossRef] [Scilit] [PubMed]
- Sun, Z.; Han, Y.; Song, S.; Chen, T.; Han, Y.; Liu, Y. Activation of GPR81 by lactate inhibits oscillatory shear stress-induced endothelial inflammation by activating the expression of KLF2. IUBMB Life 2019, 71, 2010–2019. [Google Scholar] [CrossRef] [Scilit] [PubMed]
- Boitsova, E.B.; Morgun, A.V.; Osipova, E.D.; Pozhilenkova, E.A.; Martinova, G.P.; Frolova, O.V.; Olovannikova, R.Y.; Tohidpour, A.; Gorina, Y.V.; Panina, Y.A.; et al. The inhibitory effect of LPS on the expression of GPR81 lactate receptor in blood-brain barrier model in vitro. J. Neuroinflamm. 2018, 15, 196. [Google Scholar] [CrossRef] [Scilit] [PubMed]
- Chen, J.; Lin, R.; Jiang, C.; Chen, F.; Li, W.; Wang, L.; Pan, K.; Zhang, J.; Yin, Z.; Huang, Y. Brain endothelial HIF-1α exacerbates diabetes-associated cognitive impairment by accelerating glycolysis-driven lactate production. Acta Pharmacol. Sin. B 2025, 15, 5772–5788. [Google Scholar] [CrossRef] [Scilit] [PubMed]
- Chaudhari, P.; Madaan, A.; Rivera, J.C.; Charfi, I.; Habelrih, T.; Hou, X.; Nezhady, M.; Lodygensky, G.; Pineyro, G.; Muanza, T.; et al. Neuronal GPR81 regulates developmental brain angiogenesis and promotes brain recovery after a hypoxic ischemic insult. J. Cereb. Blood Flow. Metab. 2022, 42, 1294–1308. [Google Scholar] [CrossRef] [Scilit] [PubMed]
- Li, X.; Wang, F.; Liu, N.; Liu, Y.; Yu, W.; Tang, M. Lactate Promotes Endothelial-Mesenchymal Transition via Mediating Twist1 Lactylation in Hypoxic Pulmonary Hypertension. Int. J. Mol. Sci. 2026, 27, 2255. [Google Scholar] [CrossRef] [Scilit] [PubMed]
- Danačíková, Š.; Pecina, P.; Pecinová, A.; Svoboda, J.; Vondrášek, D.; Basello, D.A.; Čajka, T.; Hadraba, D.; Mráček, T.; Kořínek, V.; et al. Development of Cellular Energy Metabolism During Differentiation of Human iPSCs into Cortical Neurons. Mol. Neurobiol. 2026, 63, 37. [Google Scholar] [CrossRef] [Scilit] [PubMed]
- Gray, O.A.; Witonsky, D.B.; Jousma, J.; Sobreira, D.R.; Van Alstyne, A.; Huang, R.-T.; Fang, Y.; Di Rienzo, A. Transcriptomic analysis of iPSC-derived endothelium reveals adaptations to high altitude hypoxia in energy metabolism and inflammation. PLoS Genet. 2025, 21, e1011570. [Google Scholar] [CrossRef] [Scilit] [PubMed]
- Rozanova, N.A.; Averchuk, A.S.; Kapkaeva, M.R.; Zhdankina, V.I.; Makarov, V.I.; Skobeltsin, A.S.; Romanishkin, I.D.; Baranich, T.I.; Salmina, A.B. Application of a Three-Cell Blood–Brain Barrier Model to Assess Neurovascular Unit Cell Damage in Alzheimer’s Disease. Bull. Exp. Biol. Med. 2026, 180, 411–415. [Google Scholar] [CrossRef] [Scilit] [PubMed]
- Becker, W. Fluorescence lifetime imaging–techniques and applications. J. Microsc. 2012, 247, 119–136. [Google Scholar] [CrossRef] [Scilit] [PubMed]
- Skala, M.C.; Riching, K.M.; Bird, D.K.; Gendron-Fitzpatrick, A.; Eickhoff, J.; Eliceiri, K.W.; Keely, P.J.; Ramanujam, N. In vivo multiphoton fluorescence lifetime imaging of protein-bound and free nicotinamide adenine dinucleotide in normal and precancerous epithelia. J. Biomed. Opt. 2007, 12, 024014. [Google Scholar] [CrossRef] [Scilit] [PubMed]
- Datta, R.; Alfonso-García, A.; Cinco, R.; Gratton, E. Fluorescence lifetime imaging of endogenous biomarker of oxidative stress. Sci. Rep. 2015, 5, 9848. [Google Scholar] [CrossRef] [Scilit] [PubMed]
- Lakowicz, J.R.; Szmacinski, H.; Nowaczyk, K.; Berndt, K.W.; Johnson, M. Fluorescence lifetime imaging. Anal. Biochem. 1992, 202, 316–330. [Google Scholar] [CrossRef] [Scilit] [PubMed]
- Bird, D.K.; Yan, L.; Vrotsos, K.M.; Eliceiri, K.W.; Vaughan, E.M.; Keely, P.J.; White, J.G.; Ramanujam, N. Metabolic mapping of MCF10A human breast cells via multiphoton fluorescence lifetime imaging of the coenzyme NADH. Cancer Res. 2005, 65, 8766–8773. [Google Scholar] [CrossRef] [Scilit] [PubMed]
- Kolenc, O.I.; Quinn, K.P. Evaluating cell metabolism through autofluorescence imaging of NAD(P)H and FAD. Antioxid. Redox Signal 2019, 30, 875–889. [Google Scholar] [CrossRef] [Scilit] [PubMed]
- Georgakoudi, I.; Quinn, K.P. Label-free optical metabolic imaging in cells and tissues. Annu. Rev. Biomed. Eng. 2023, 25, 413–443. [Google Scholar] [CrossRef] [Scilit] [PubMed]
- Stringari, C.; Nourse, J.L.; Flanagan, L.A.; Gratton, E. Phasor fluorescence lifetime microscopy of free and protein-bound NADH reveals neural stem cell differentiation potential. PLoS ONE 2012, 7, e48014. [Google Scholar] [CrossRef] [Scilit] [PubMed]
- Hu, L.; Wang, N.; Bryant, J.D.; Liu, L.; Xie, L.; West, A.P.; Walsh, A.J. Label-free spatially maintained measurements of metabolic phenotypes in cells. Front. Bioeng. Biotechnol. 2023, 11, 1293268. [Google Scholar] [CrossRef] [Scilit] [PubMed]
- Shirshin, E.A.; Shirmanova, M.V.; Gayer, A.V.; Lukina, M.M.; Nikonova, E.E.; Yakimov, B.P.; Budylin, G.S.; Dudenkova, V.V.; Ignatova, N.I.; Komarov, D.V.; et al. Label-free sensing of cells with fluorescence lifetime imaging: The quest for metabolic heterogeneity. Proc. Natl. Acad. Sci. USA 2022, 119, e2118241119. [Google Scholar] [CrossRef] [Scilit] [PubMed]
- Niederschweiberer, M.A.; Schaefer, P.M.; Singh, L.N.; Lausser, L.; Bhosale, D.; Hesse, R.; Calzia, E.; Kestler, H.A.; Rueck, A.; Wallace, D.C.; et al. NADH fluorescence lifetime imaging microscopy reveals selective mitochondrial dysfunction in neurons overexpressing Alzheimer’s disease–related proteins. Front. Mol. Biosci. 2021, 8, 671274. [Google Scholar] [CrossRef] [Scilit] [PubMed]
- Shcheslavskiy, V.I.; Shirmanova, M.V.; Yashin, K.S.; Rück, A.C.; Skala, M.C.; Becker, W. Fluorescence Lifetime Imaging Techniques—A Review on Principles, Applications and Clinical Relevance. J. Biophotonics 2025, 18, e202400450. [Google Scholar] [CrossRef] [Scilit] [PubMed]
- Digman, M.A.; Caiolfa, V.R.; Zamai, M.; Gratton, E. The phasor approach to fluorescence lifetime imaging analysis. Biophys. J. 2008, 94, L14–L16. [Google Scholar] [CrossRef] [Scilit] [PubMed]
- Ranjit, S.; Malacrida, L.; Jameson, D.M.; Gratton, E. Fit-free analysis of fluorescence lifetime imaging data using the phasor approach. Nat. Protoc. 2018, 13, 1979–2004. [Google Scholar] [CrossRef] [Scilit] [PubMed]
- Stringari, C.; Edwards, R.A.; Pate, K.T.; Waterman, M.L.; Donovan, P.J.; Gratton, E. Metabolic trajectory of cellular differentiation in small intestine by Phasor Fluorescence Lifetime Microscopy of NADH. Sci. Rep. 2012, 2, 568. [Google Scholar] [CrossRef] [Scilit] [PubMed]
- Stringari, C.; Cinquin, A.; Cinquin, O.; Digman, M.A.; Donovan, P.J.; Gratton, E. Phasor approach to fluorescence lifetime microscopy distinguishes different metabolic states of germ cells in a live tissue. Proc. Natl. Acad. Sci. USA 2011, 108, 13582–13587. [Google Scholar] [CrossRef] [Scilit] [PubMed]
- Awasthi, K.; Moriya, D.; Nakabayashi, T.; Li, L.; Ohta, N. Sensitive detection of intracellular environment of normal and cancer cells by autofluorescence lifetime imaging. J. Photochem. Photobiol. B 2016, 165, 256–265. [Google Scholar] [CrossRef] [Scilit] [PubMed]
- Rodimova, S.; Mozherov, A.; Elagin, V.; Karabut, M.; Shchechkin, I.; Kozlov, D.; Krylov, D.; Gavrina, A.; Kaplin, V.; Epifanov, E.; et al. FLIM imaging revealed spontaneous osteogenic differentiation of stem cells on gradient pore size tissue-engineered constructs. Stem Cell Res. Ther. 2023, 14, 81. [Google Scholar] [CrossRef] [Scilit] [PubMed]
- Miskolci, V.; Tweed, K.E.; Lasarev, M.R.; Britt, E.C.; Walsh, A.J.; Zimmerman, L.J.; E McDougal, C.; Cronan, M.R.; Fan, J.; Sauer, J.-D.; et al. In vivo fluorescence lifetime imaging of macrophage intracellular metabolism during wound responses in zebrafish. eLife 2022, 11, e66080. [Google Scholar] [CrossRef] [Scilit] [PubMed]
- Izosimova, A.V.; Shirmanova, M.V.; Shcheslavskiy, V.I.; Sachkova, D.A.; Mozherov, A.M.; Sharonov, G.V.; Zagaynova, E.V.; Yuzhakova, D.V. FLIM of NAD(P)H in lymphatic nodes resolves T-cell immune response to the tumor. Int. J. Mol. Sci. 2022, 23, 15829. [Google Scholar] [CrossRef] [Scilit] [PubMed]
- Iyer, R.R.; Sorrells, J.E.; Yang, L.; Chaney, E.J.; Spillman, D.R.; Tibble, B.E.; Renteria, C.A.; Tu, H.; Žurauskas, M.; Marjanovic, M.; et al. Label-free metabolic and structural profiling of dynamic biological samples using multimodal optical microscopy with sensorless adaptive optics. Sci. Rep. 2022, 12, 3438. [Google Scholar] [CrossRef] [Scilit] [PubMed]
- Ryabova, A.; Romanishkin, I.; Skobeltsin, A.; Markova, I.; Pominova, D.; Linkov, K.; Loschenov, V. Detection of changes in macrophage polarization as a result of 5-aminolevulinic acid photodynamic therapy using fluorescence-lifetime imaging microscopy. Photonics 2022, 9, 961. [Google Scholar] [CrossRef] [Scilit]
- Gómez, C.A.; Sutin, J.; Wu, W.; Fu, B.; Uhlirova, H.; Devor, A.; A Boas, D.; Sakadžić, S.; Yaseen, M.A. Phasor analysis of NADH FLIM identifies pharmacological disruptions to mitochondrial metabolic processes in the rodent cerebral cortex. PLoS ONE 2018, 13, e0194578. [Google Scholar] [CrossRef] [Scilit] [PubMed]
- Makarov, V.I.; Skobeltsin, A.S.; Averchuk, A.S.; Berdnikov, A.K.; Chinenkova, M.V.; Salmina, A.B.; Loschenov, V.B. Effect of Photodynamic Therapy with the Photosensitizer Methylene Blue on Cerebral Endotheliocytes In Vitro. Photonics 2024, 11, 316. [Google Scholar] [CrossRef] [Scilit]
- Kolotyeva, N.A.; Novikova, S.; Rozanova, N.A.; Makarov, V.I. Detection of reductive stress in brain endothelial cells using FLIM imaging: New approaches to assessing endothelial dysfunction. Opt. Spectrosc. 2026, 134, 438–446. [Google Scholar]
- Grigor’eva, E.V.; Malankhanova, T.; Ustyantseva, E.; Minina, J.; Redina, O.; Morozov, V.; Shevela, A.; Zakian, S.; Medvedev, S. Generation of two iPSC lines (ICGi008-A and ICGi008-B) from skin fibroblasts of a patient with early-onset Alzheimer’s disease caused by London familial APP mutation (V717I). Stem Cell Res. 2019, 36, 101415. [Google Scholar] [CrossRef] [Scilit] [PubMed]
- Gu, M. Efficient differentiation of human pluripotent stem cells to endothelial cells. Curr. Protoc. Hum. Genet. 2018, 98, e64. [Google Scholar] [CrossRef] [Scilit] [PubMed]
- Smyth, L.C.D.; Highet, B.; Jansson, D.; Wu, J.; Rustenhoven, J.; Aalderink, M.; Tan, A.; Li, S.; Johnson, R.; Coppieters, N.; et al. Characterisation of PDGF-BB:PDGFRβ signalling pathways in human brain pericytes: Evidence of disruption in Alzheimer’s disease. Commun. Biol. 2022, 5, 235. [Google Scholar] [CrossRef] [Scilit] [PubMed]
- Datta, R.; Heaster, T.M.; Sharick, J.T.; Gillette, A.A.; Skala, M.C. Fluorescence lifetime imaging microscopy: Fundamentals and advances in instrumentation, analysis, and applications. J. Biomed. Opt. 2020, 25, 071203. [Google Scholar] [CrossRef] [Scilit] [PubMed]
- Lakowicz, J.R. Principles of Fluorescence Spectroscopy, 3rd ed.; Springer: New York, NY, USA, 2006. [Google Scholar]
- Blacker, T.S.; Mann, Z.F.; Gale, J.E.; Ziegler, M.; Bain, A.J.; Szabadkai, G.; Duchen, M.R. Separating NADH and NADPH fluorescence in live cells and tissues using FLIM. Nat. Commun. 2014, 5, 3936. [Google Scholar] [CrossRef] [Scilit]
- Blacker, T.S.; Duchen, M.R.; Bain, A.J. NAD(P)H binding configurations revealed by time-resolved fluorescence and two-photon absorption. Biophys. J. 2023, 122, 1240–1253. [Google Scholar] [CrossRef] [Scilit] [PubMed]
- Bystrov, F.G.; Makarov, V.I.; Pominova, D.V.; Ryabova, A.V.; Loschenov, V.B. Analysis of photoluminescence decay kinetics of aluminum phthalocyanine nanoparticles interacting with immune cells. Biomed. Photonics 2016, 5, 3–8. [Google Scholar] [CrossRef] [Scilit]
- Stincone, A.; Prigione, A.; Cramer, T.; Wamelink, M.M.C.; Campbell, K.; Cheung, E.; Olin-Sandoval, V.; Grüning, N.-M.; Krüger, A.; Tauqeer Alam, M.; et al. The return of metabolism: Biochemistry and physiology of the pentose phosphate pathway. Biol. Rev. Camb. Philos. Soc. 2015, 90, 927–963. [Google Scholar] [CrossRef] [Scilit] [PubMed]
- Kuehne, A.; Emmert, H.; Soehle, J.; Winnefeld, M.; Fischer, F.; Wenck, H.; Gallinat, S.; Terstegen, L.; Lucius, R.; Hildebrand, J.; et al. Acute activation of oxidative pentose phosphate pathway as first-line response to oxidative stress in human skin cells. Mol. Cell 2015, 59, 359–371. [Google Scholar] [CrossRef] [Scilit] [PubMed]
- Kolotyeva, N.; Novikova, S.; Namiot, E.; Zembatov, G.; Tregub, P.; Rozanova, N.; Makarov, V.; Komleva, Y.; Salmina, A. The Reductive Stress Nexus: Integrated Pathways of Metabolic Dysregulation, Senescence and Blood–Brain Barrier Failure in Neurodegenerative Disease and Brain Aging. Cell Biochem. Biophys. 2026, 84, 3291–3318. [Google Scholar] [CrossRef] [Scilit] [PubMed]
- Salabei, J.K.; Gibb, A.A.; Hill, B.G. Comprehensive measurement of respiratory activity in permeabilized cells using extracellular flux analysis. Nat. Protoc. 2014, 9, 421–438. [Google Scholar] [CrossRef] [Scilit] [PubMed]
- Kalyanaraman, B.; Darley-Usmar, V.; Davies, K.J.A.; Dennery, P.A.; Forman, H.J.; Grisham, M.B.; Mann, G.E.; Moore, K.; Roberts, L.J., II; Ischiropoulos, H. Measuring reactive oxygen and nitrogen species with fluorescent probes: Challenges and limitations. Free Radic. Biol. Med. 2012, 52, 1–6. [Google Scholar] [CrossRef] [Scilit] [PubMed]
- Murphy, M.P.; Bayir, H.; Belousov, V.; Chang, C.J.; Davies, K.J.A.; Davies, M.J.; Dick, T.P.; Finkel, T.; Forman, H.J.; Janssen-Heininger, Y.; et al. Guidelines for measuring reactive oxygen species and oxidative damage in cells and in vivo. Nat. Metab. 2022, 4, 651–662. [Google Scholar] [CrossRef] [Scilit] [PubMed]
- Spinazzi, M.; Casarin, A.; Pertegato, V.; Salviati, L.; Angelini, C. Assessment of mitochondrial respiratory chain enzymatic activities on tissues and cultured cells. Nat. Protoc. 2012, 7, 1235–1246. [Google Scholar] [CrossRef] [Scilit] [PubMed]
- Doss, M.X.; Sachinidis, A. Current challenges of iPSC-based disease modeling and therapeutic implications. Cells 2019, 8, 403. [Google Scholar] [CrossRef] [Scilit] [PubMed]
- Soldner, F.; Jaenisch, R. iPSC disease modeling. Science 2012, 338, 1155–1156. [Google Scholar] [CrossRef] [Scilit] [PubMed]
- Wang, S.; Zhong, H.; Wu, Y.; Zhang, Y.; Sha, A.; Zhu, Z.; Fang, X.; Bao, M.; Sun, D. Advances in the differentiation of induced pluripotent stem cells into vascular cells for the treatment of diabetic microvascular disease. Cardiovasc. Diabetol. 2026, 25, 136. [Google Scholar] [CrossRef] [Scilit] [PubMed]
- De Maesschalck, R.; Jouan-Rimbaud, D.; Massart, D.L. The Mahalanobis distance. Chemom. Intell. Lab. Syst. 2000, 50, 1–18. [Google Scholar] [CrossRef] [Scilit]
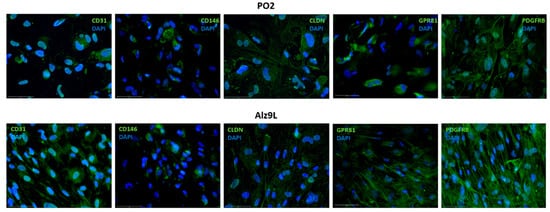
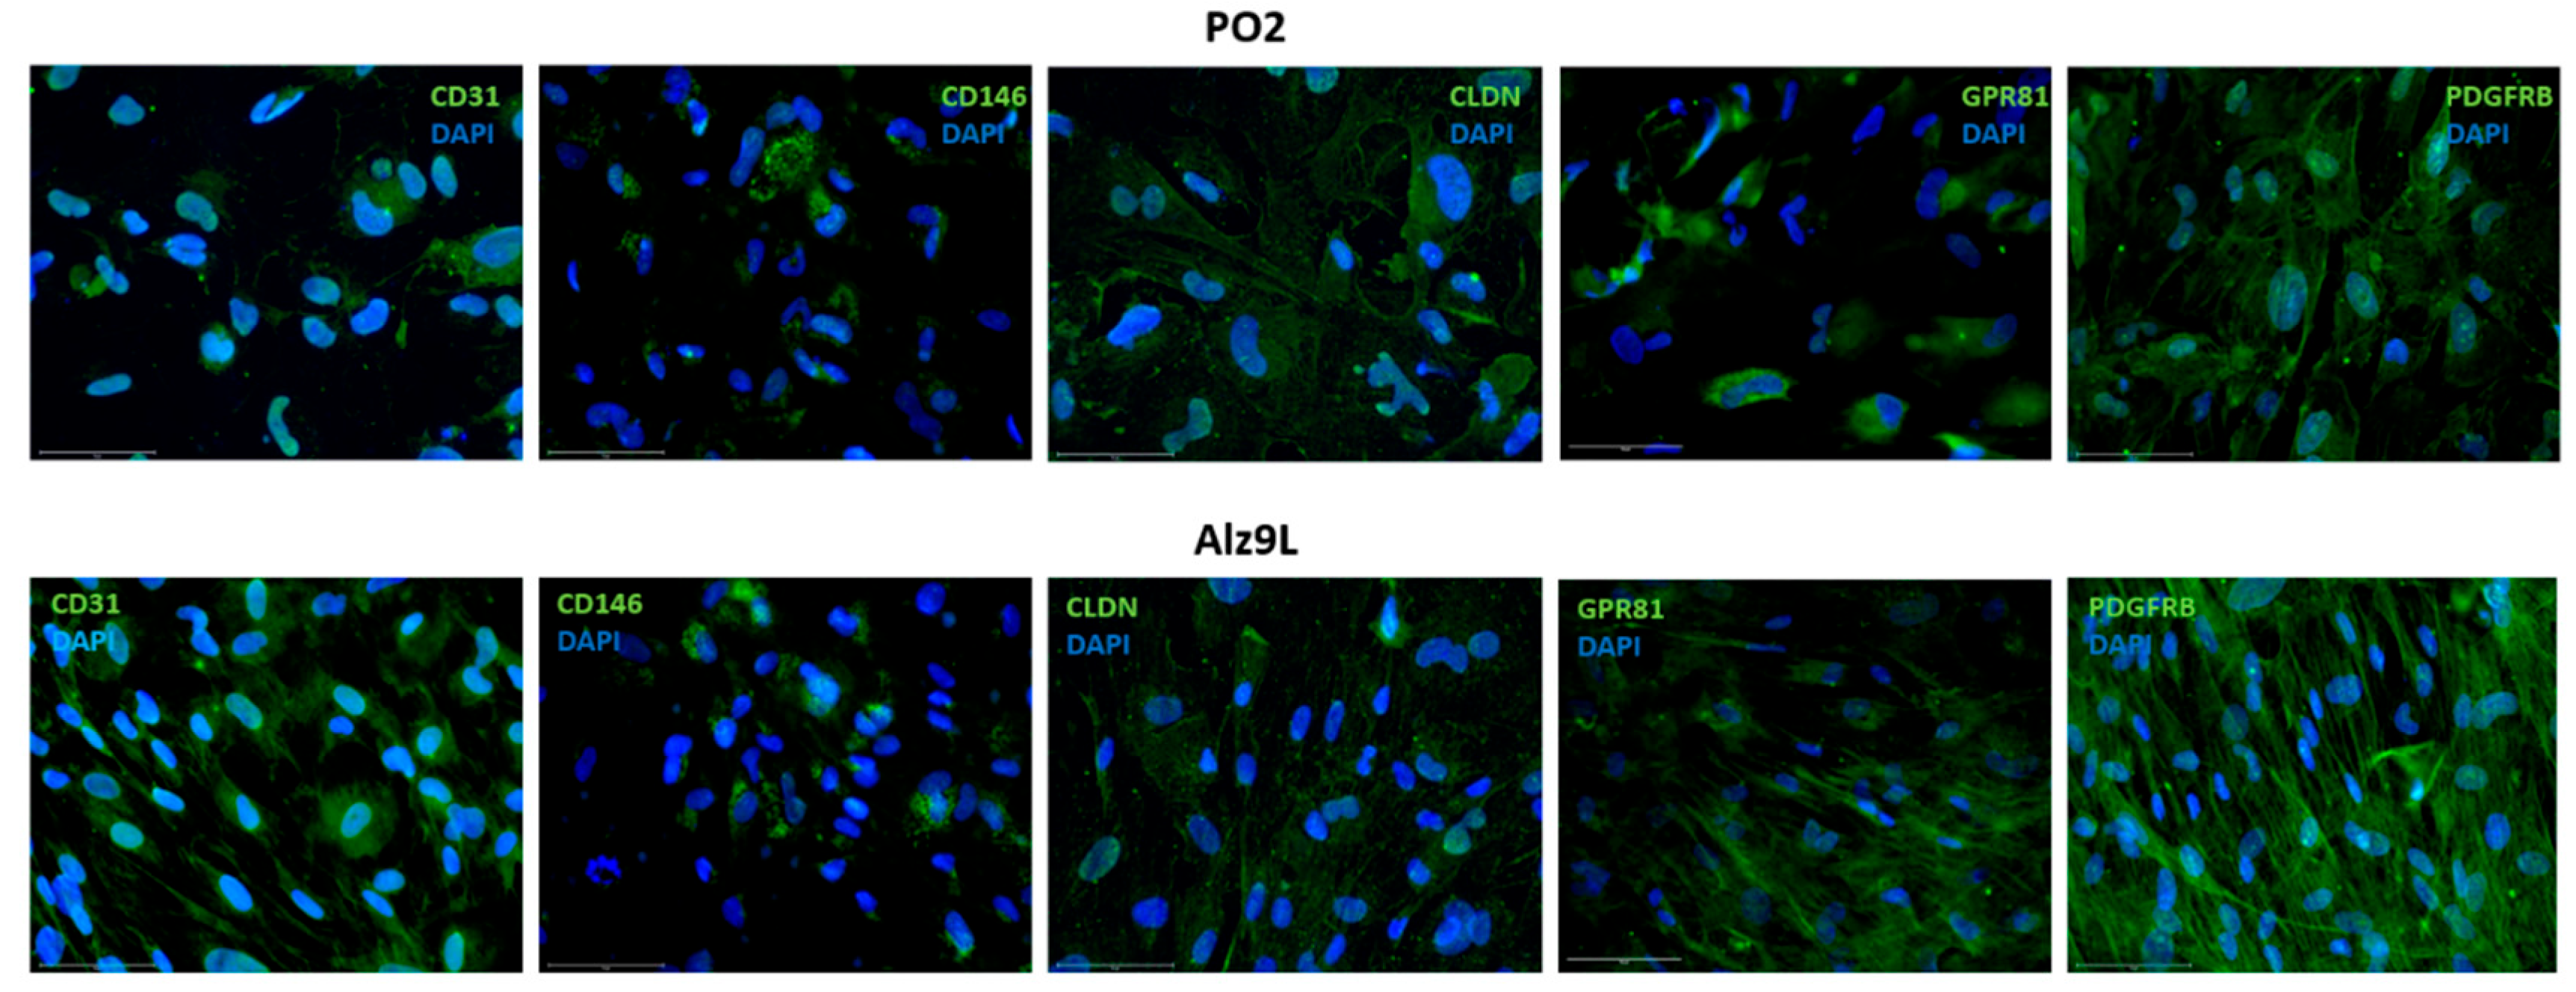
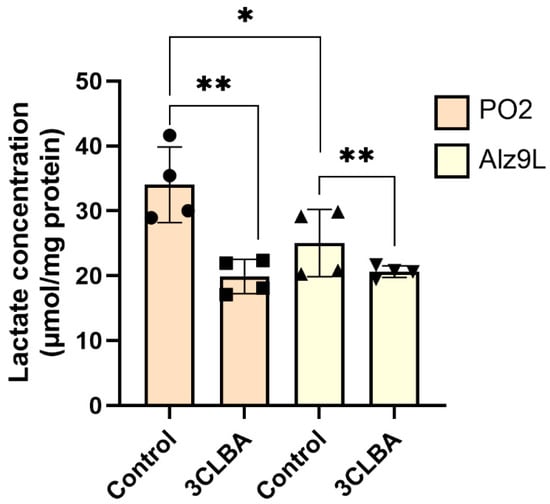
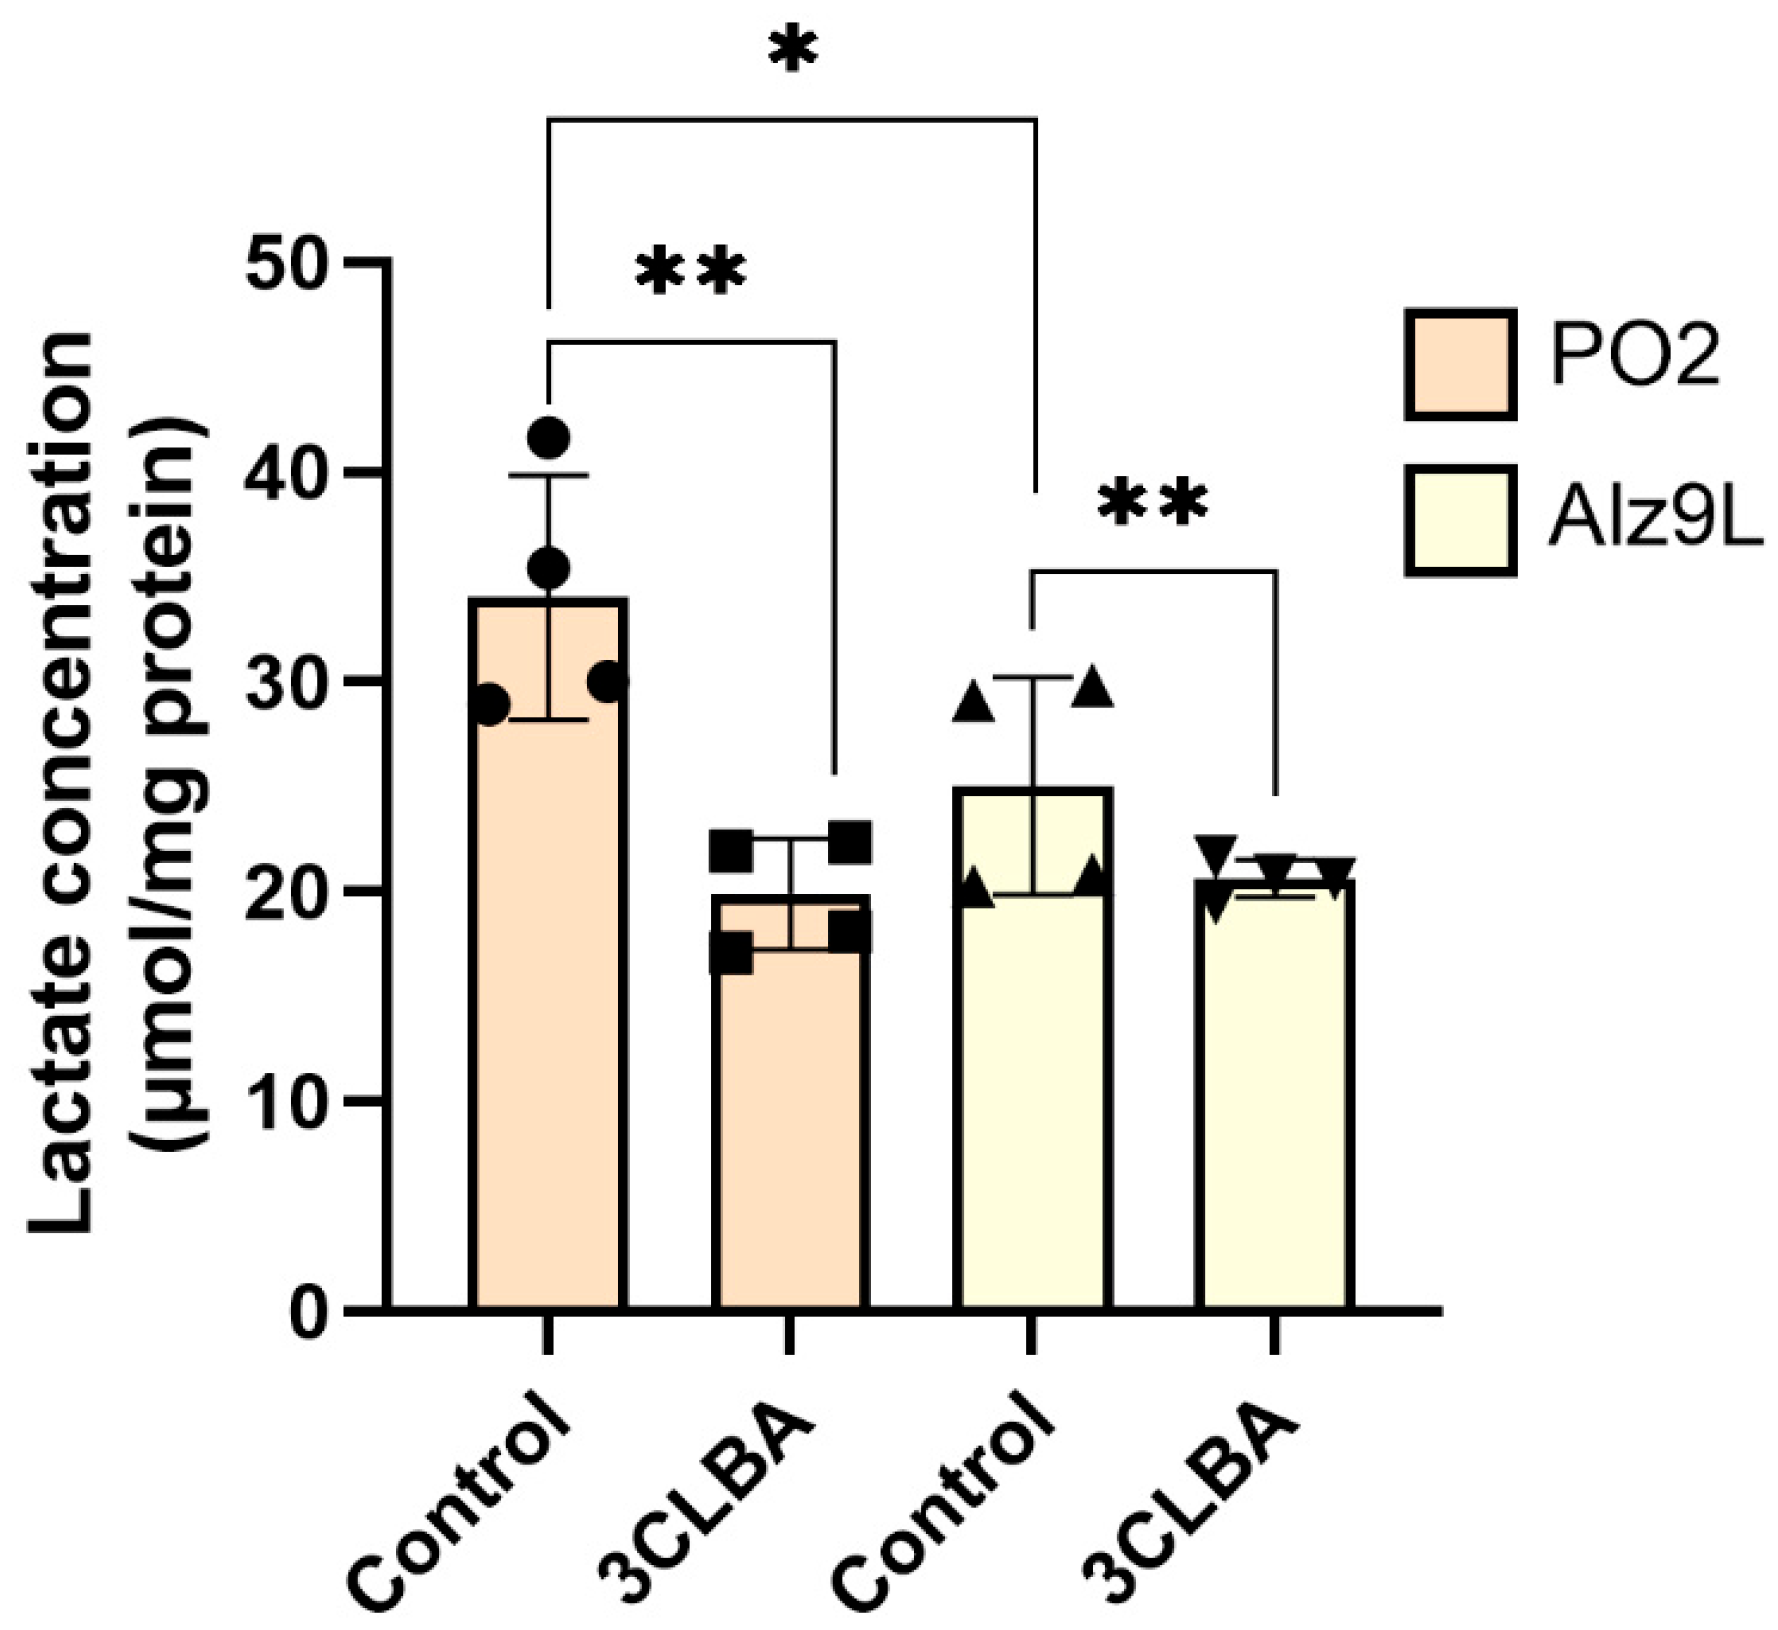
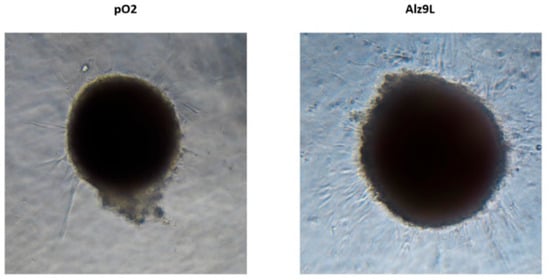
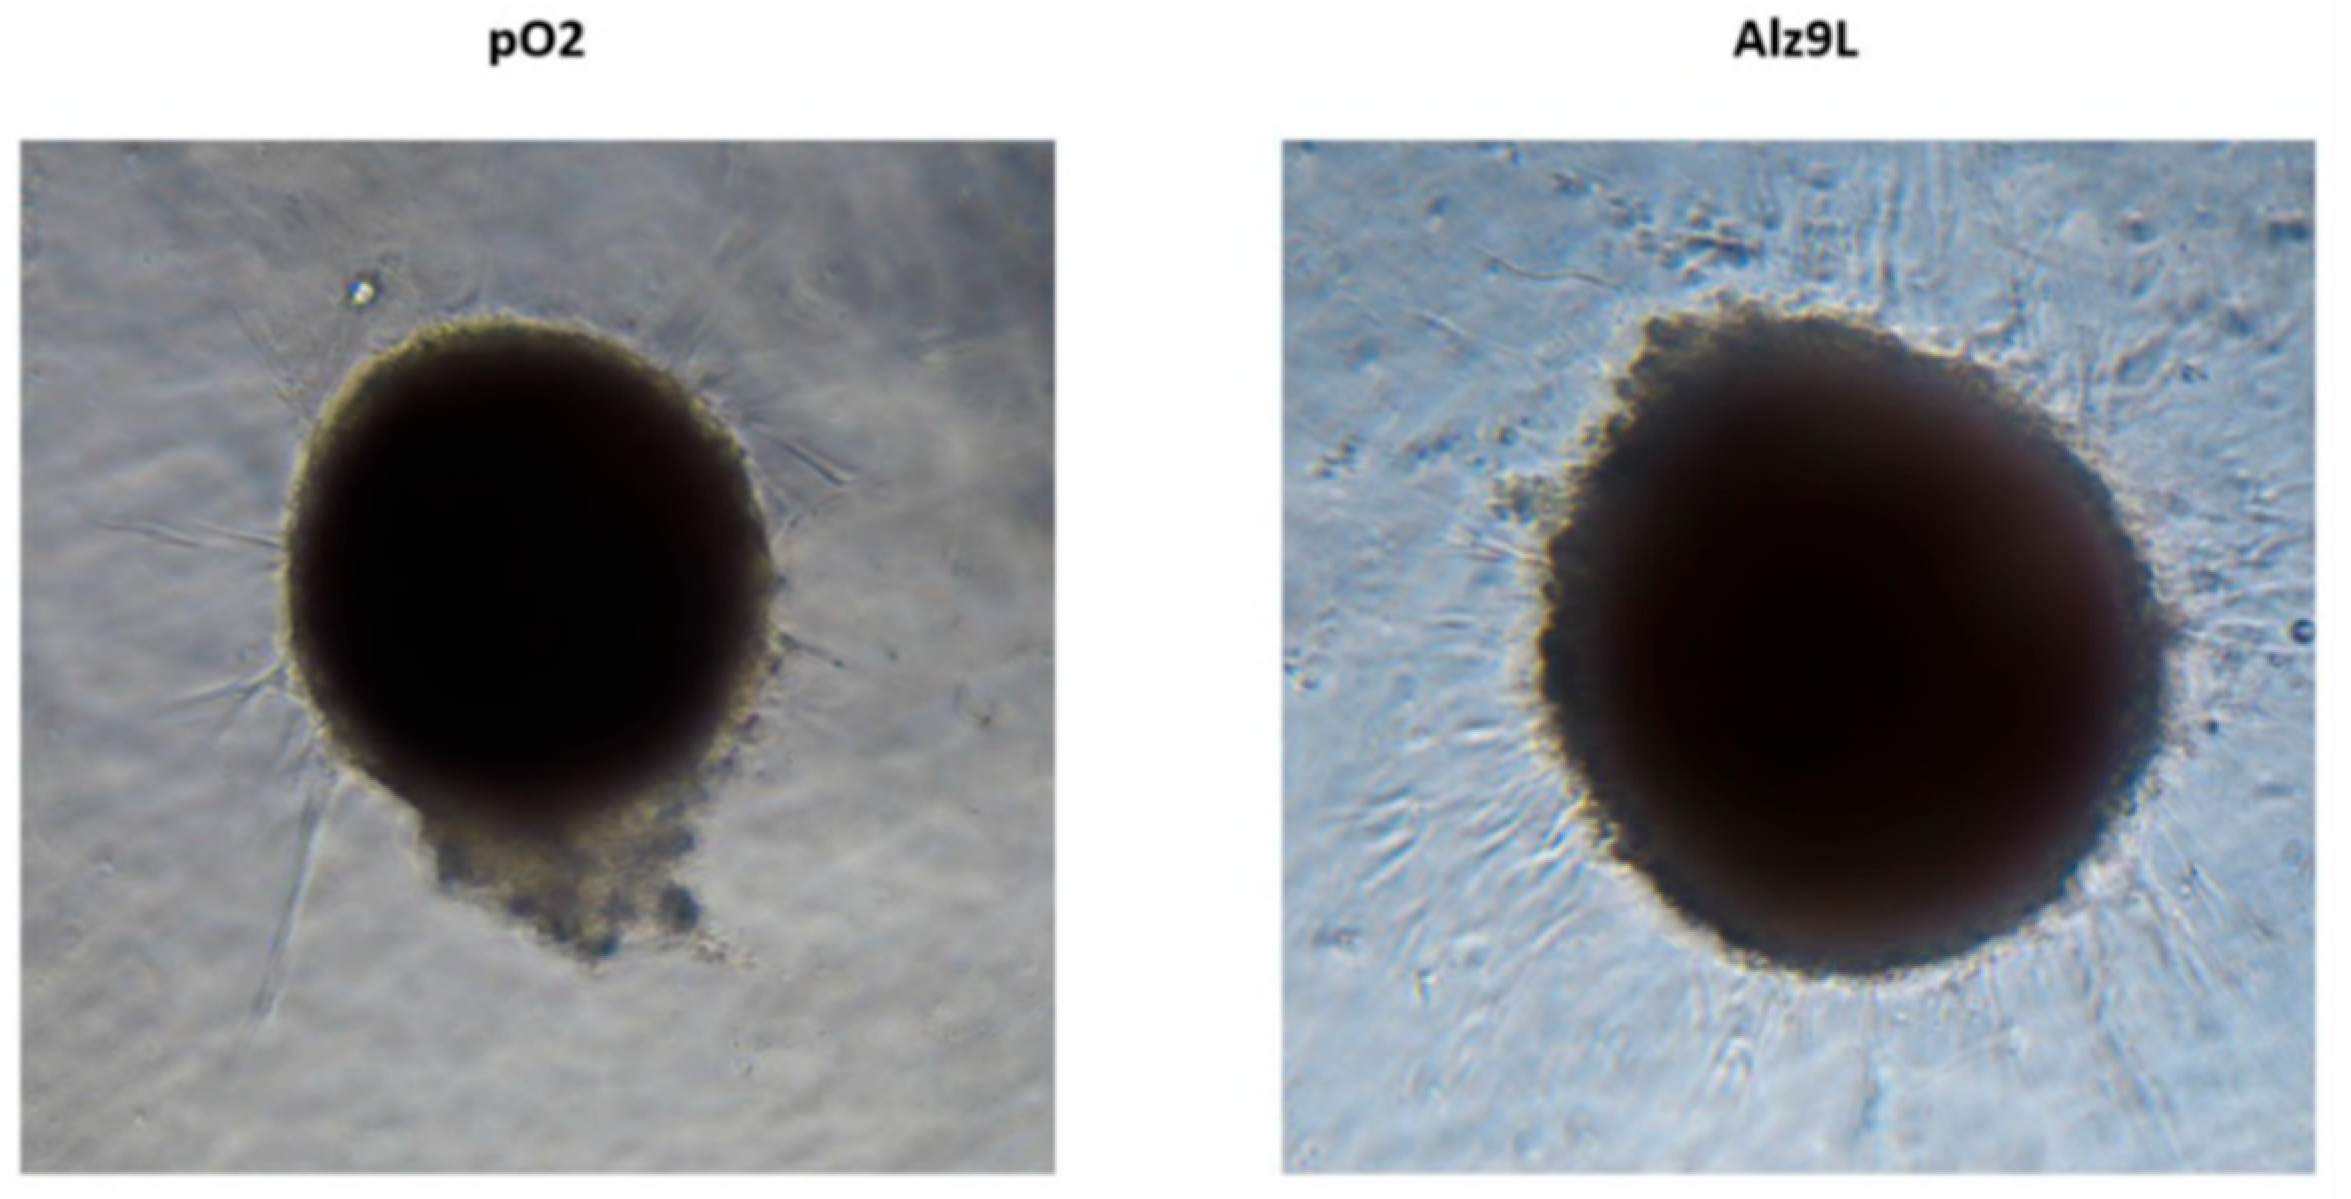
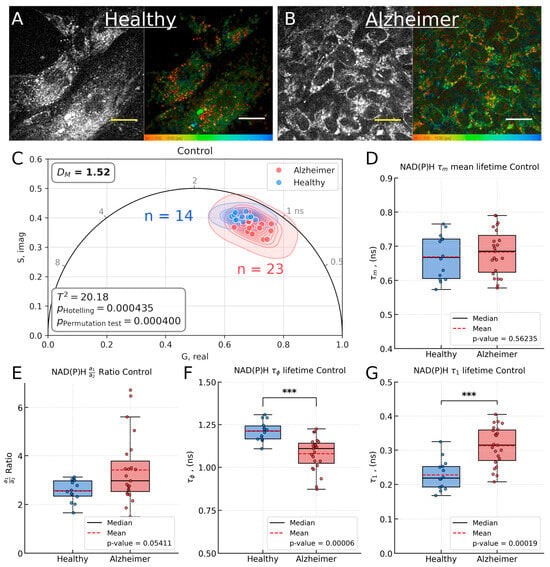
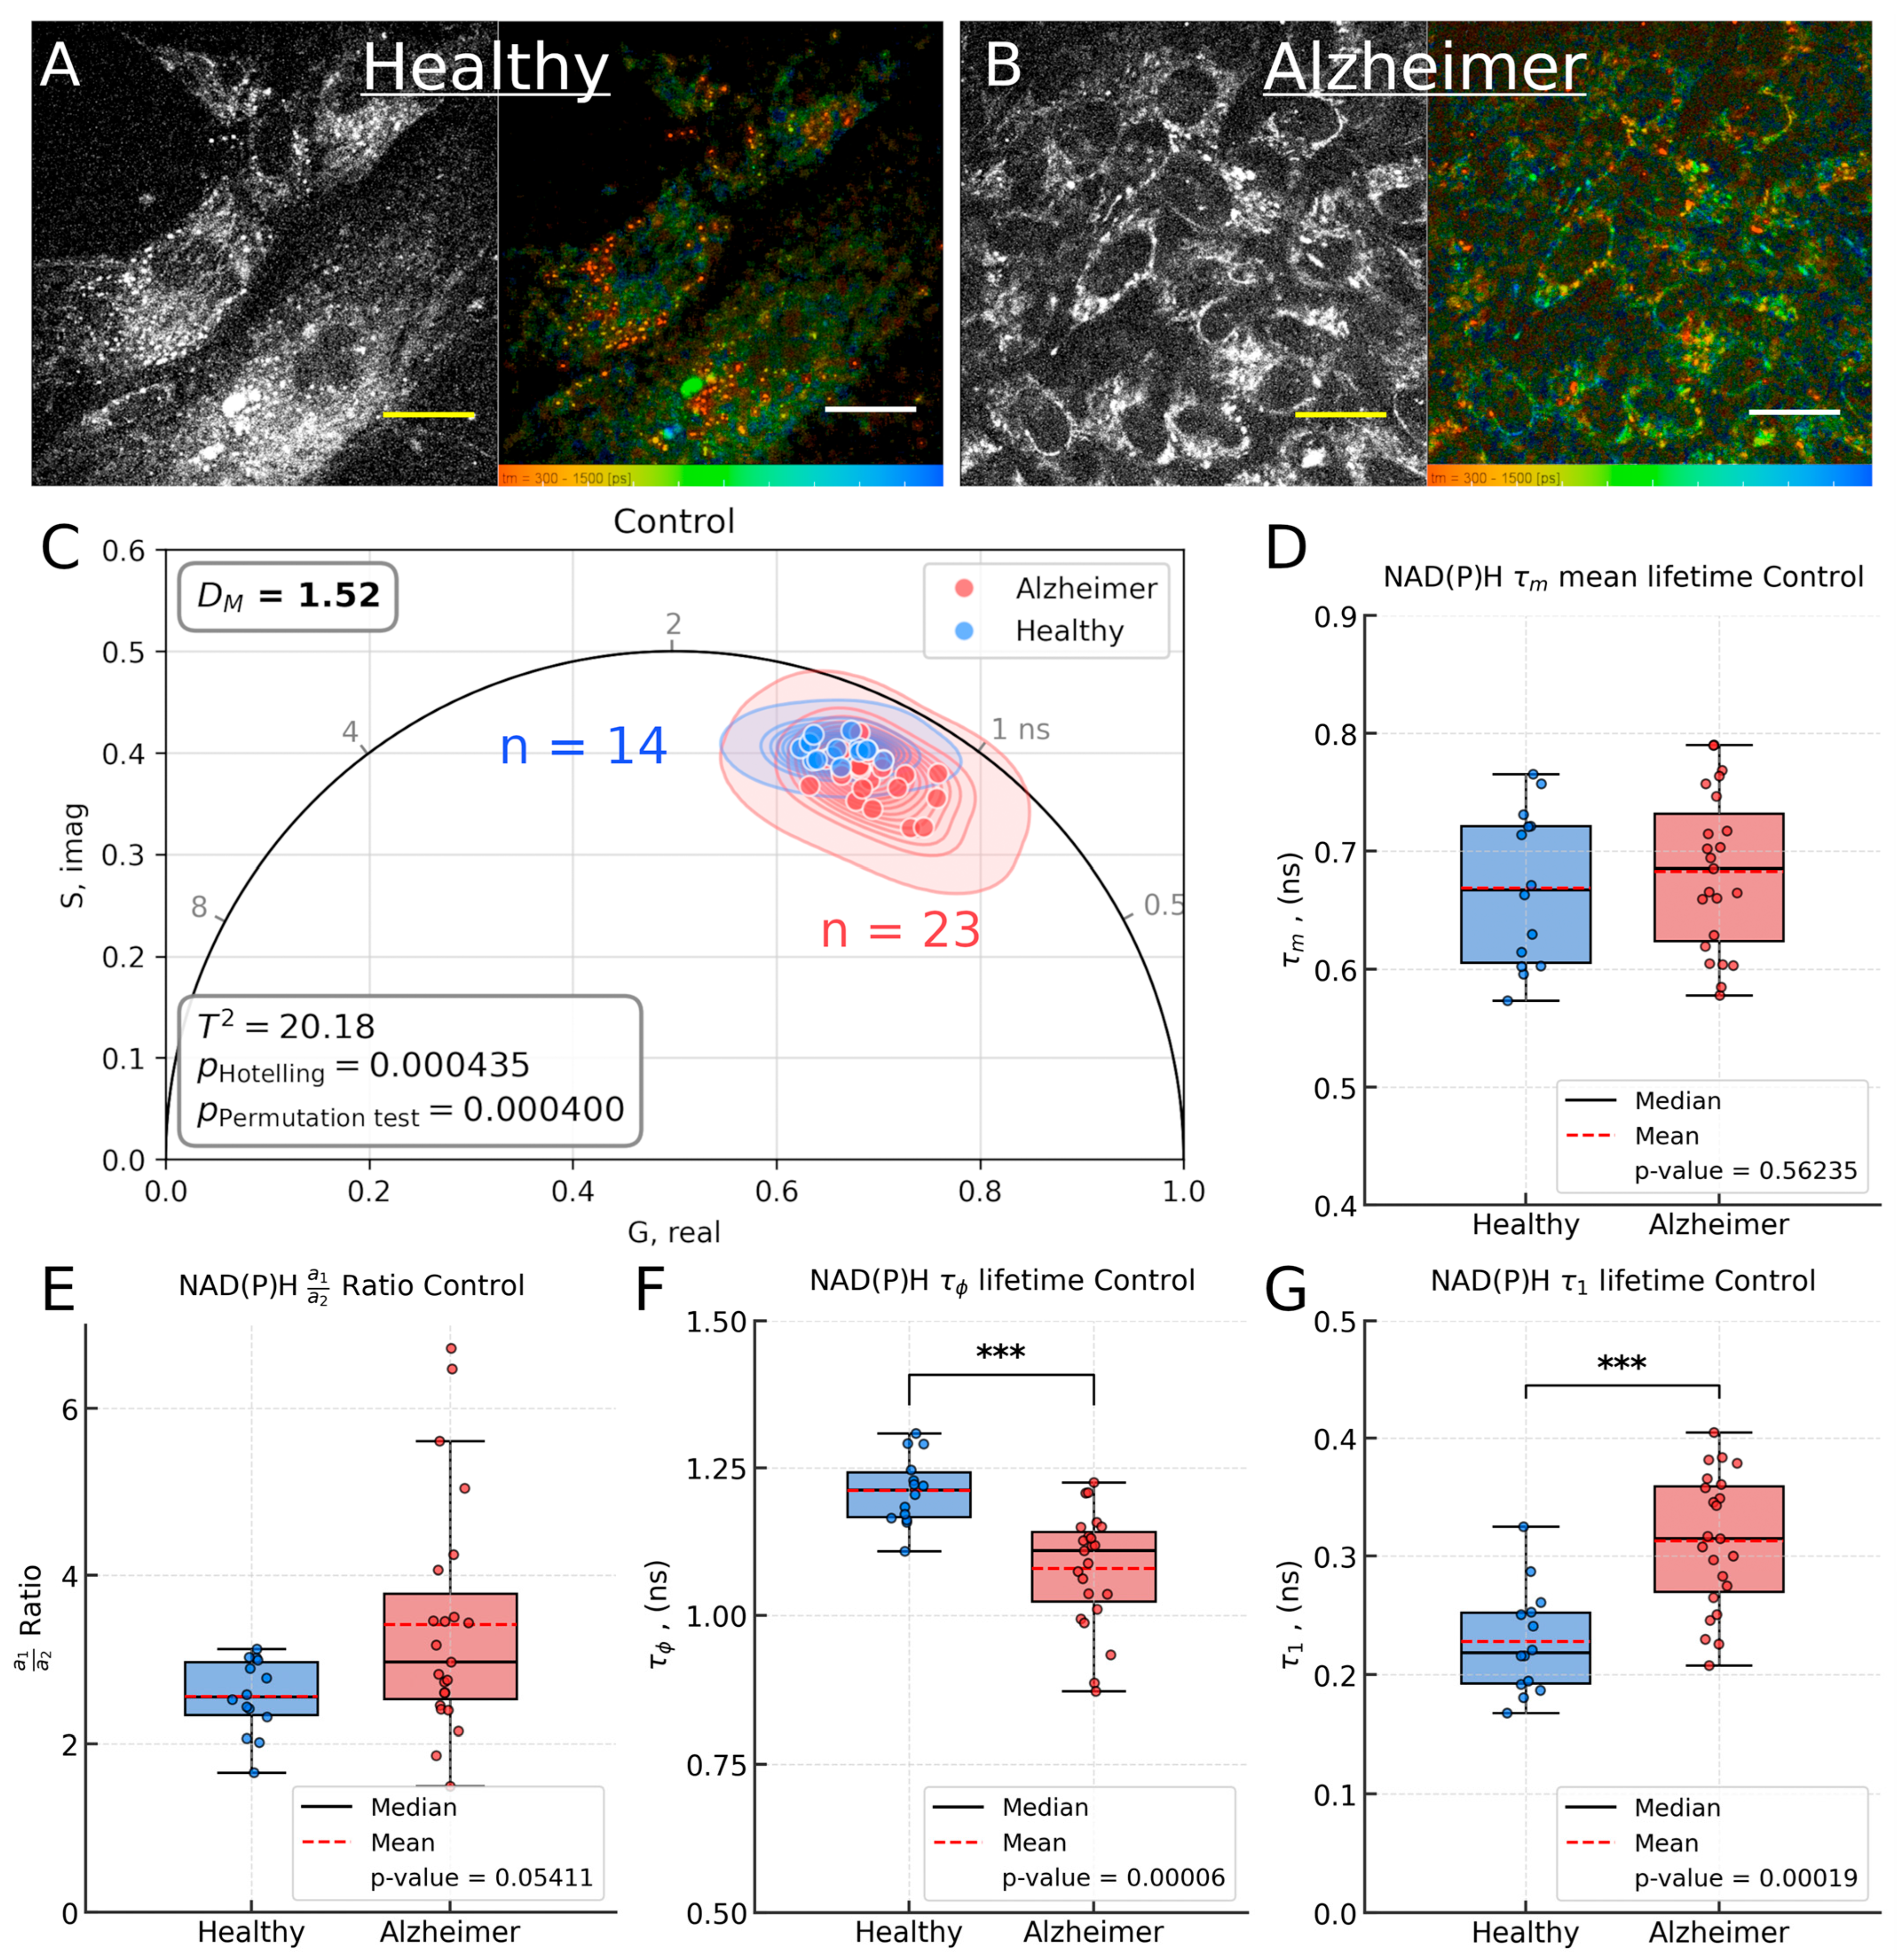
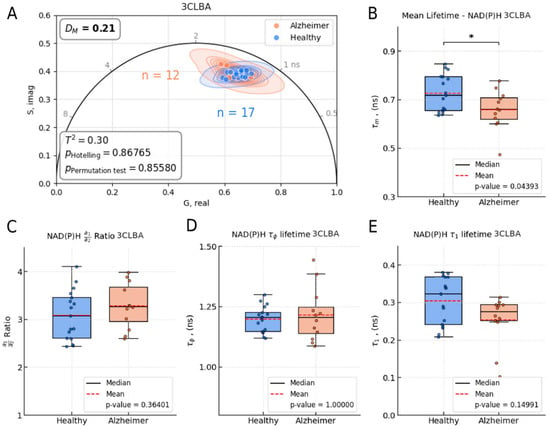
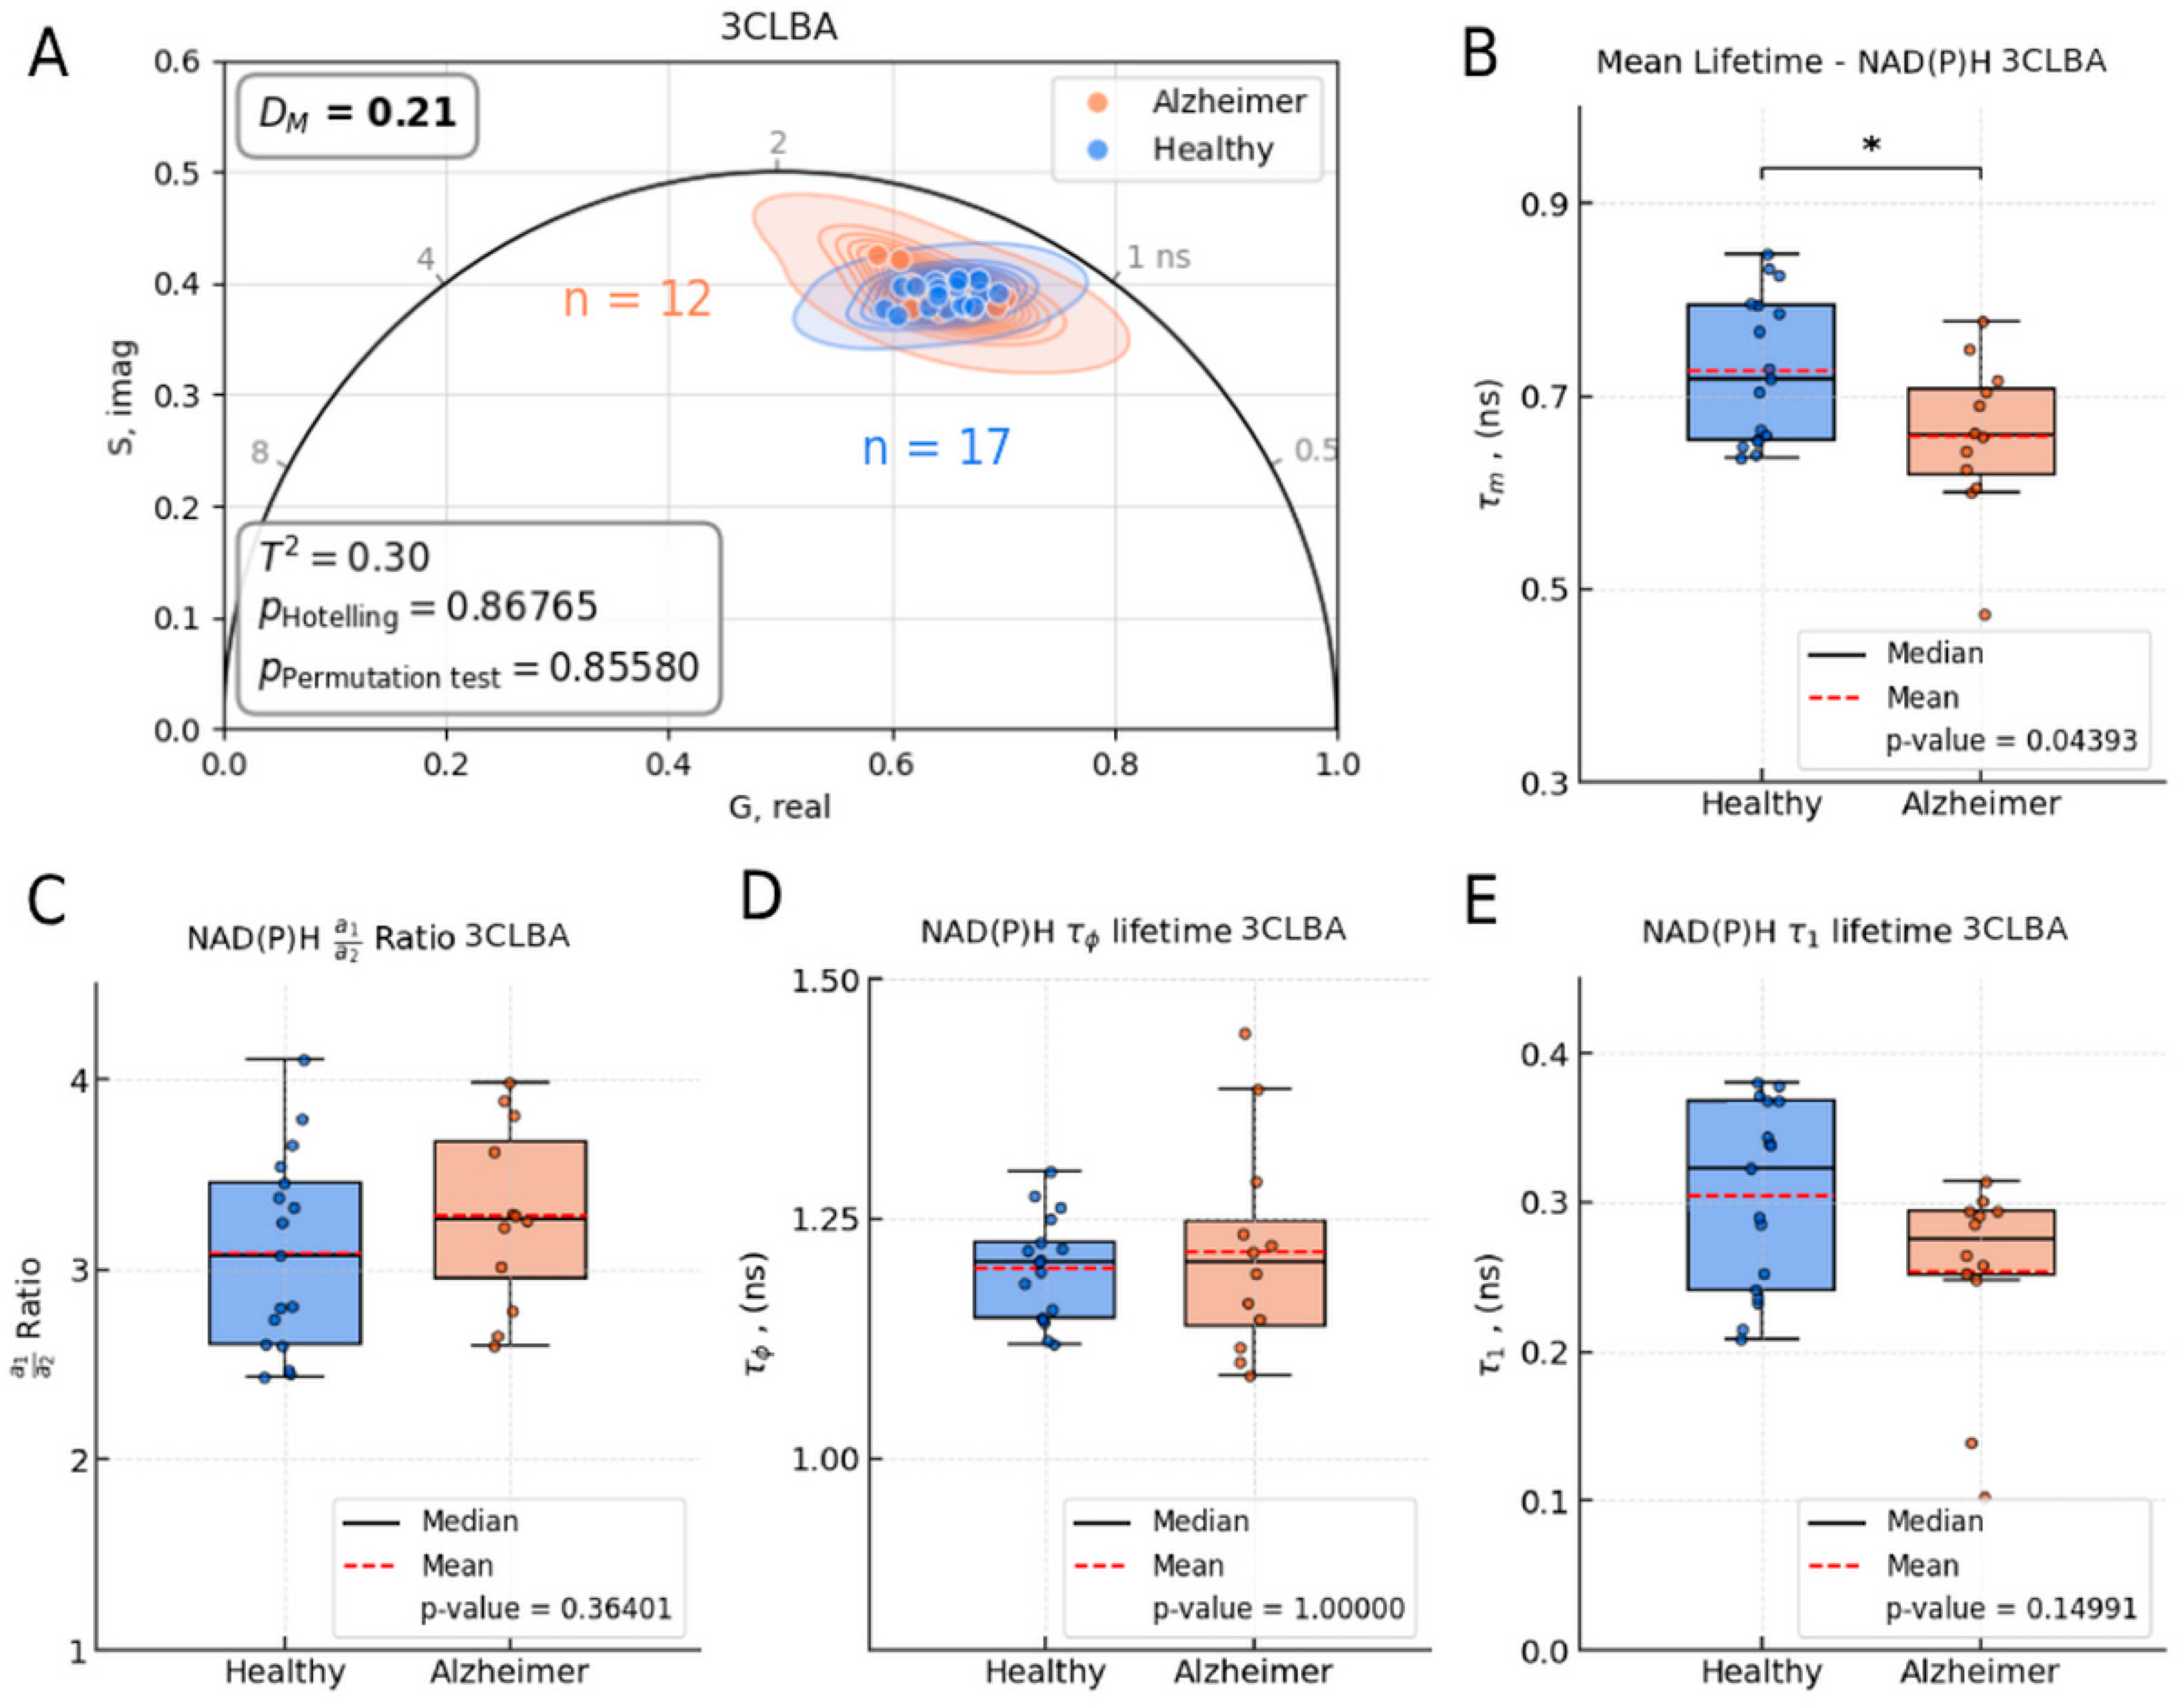
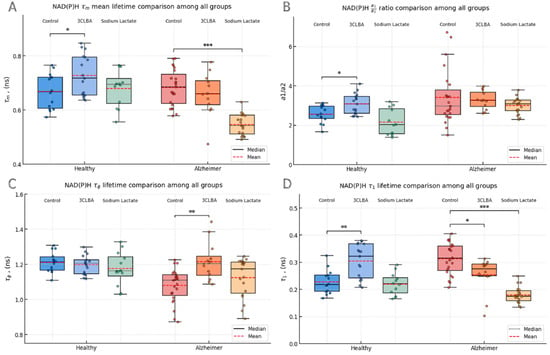
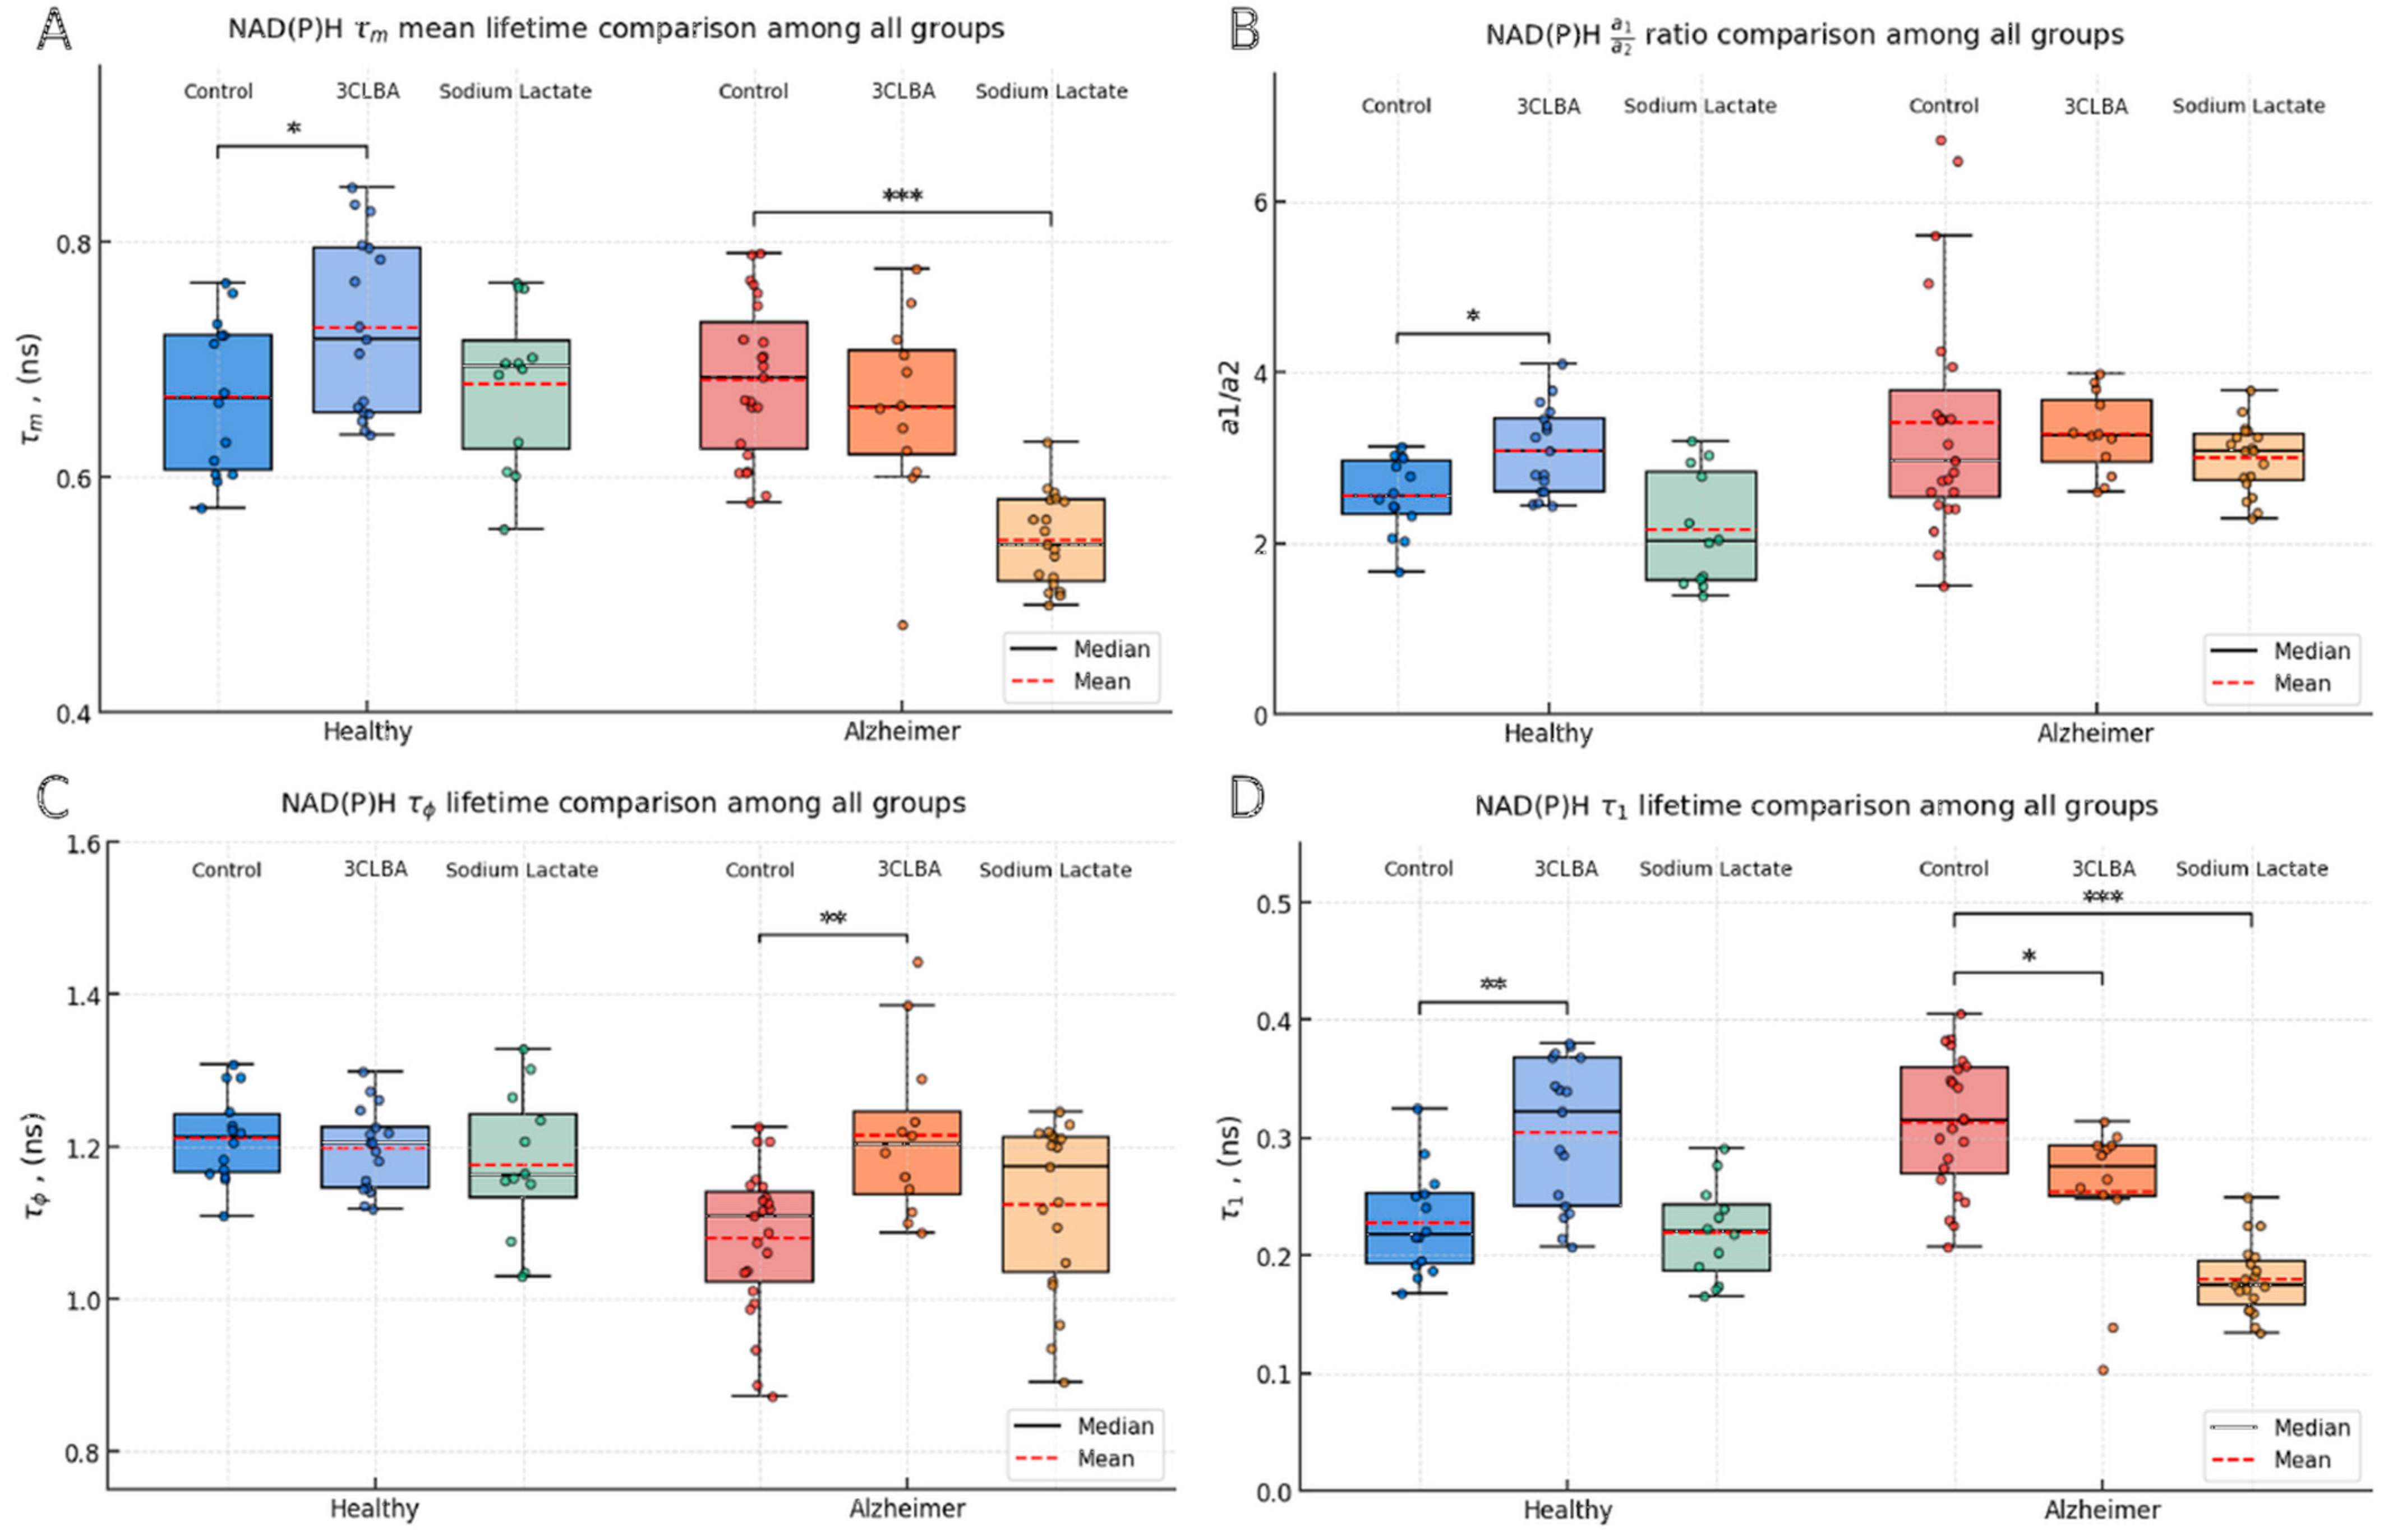
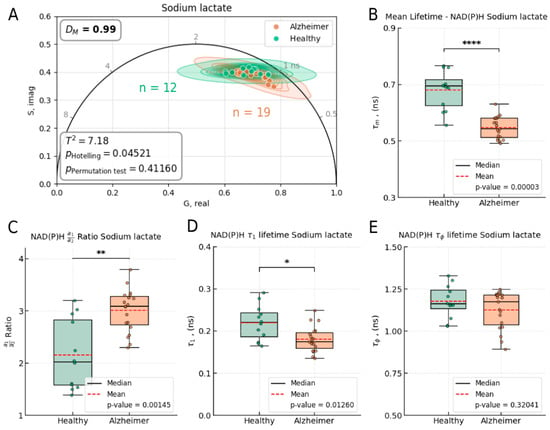
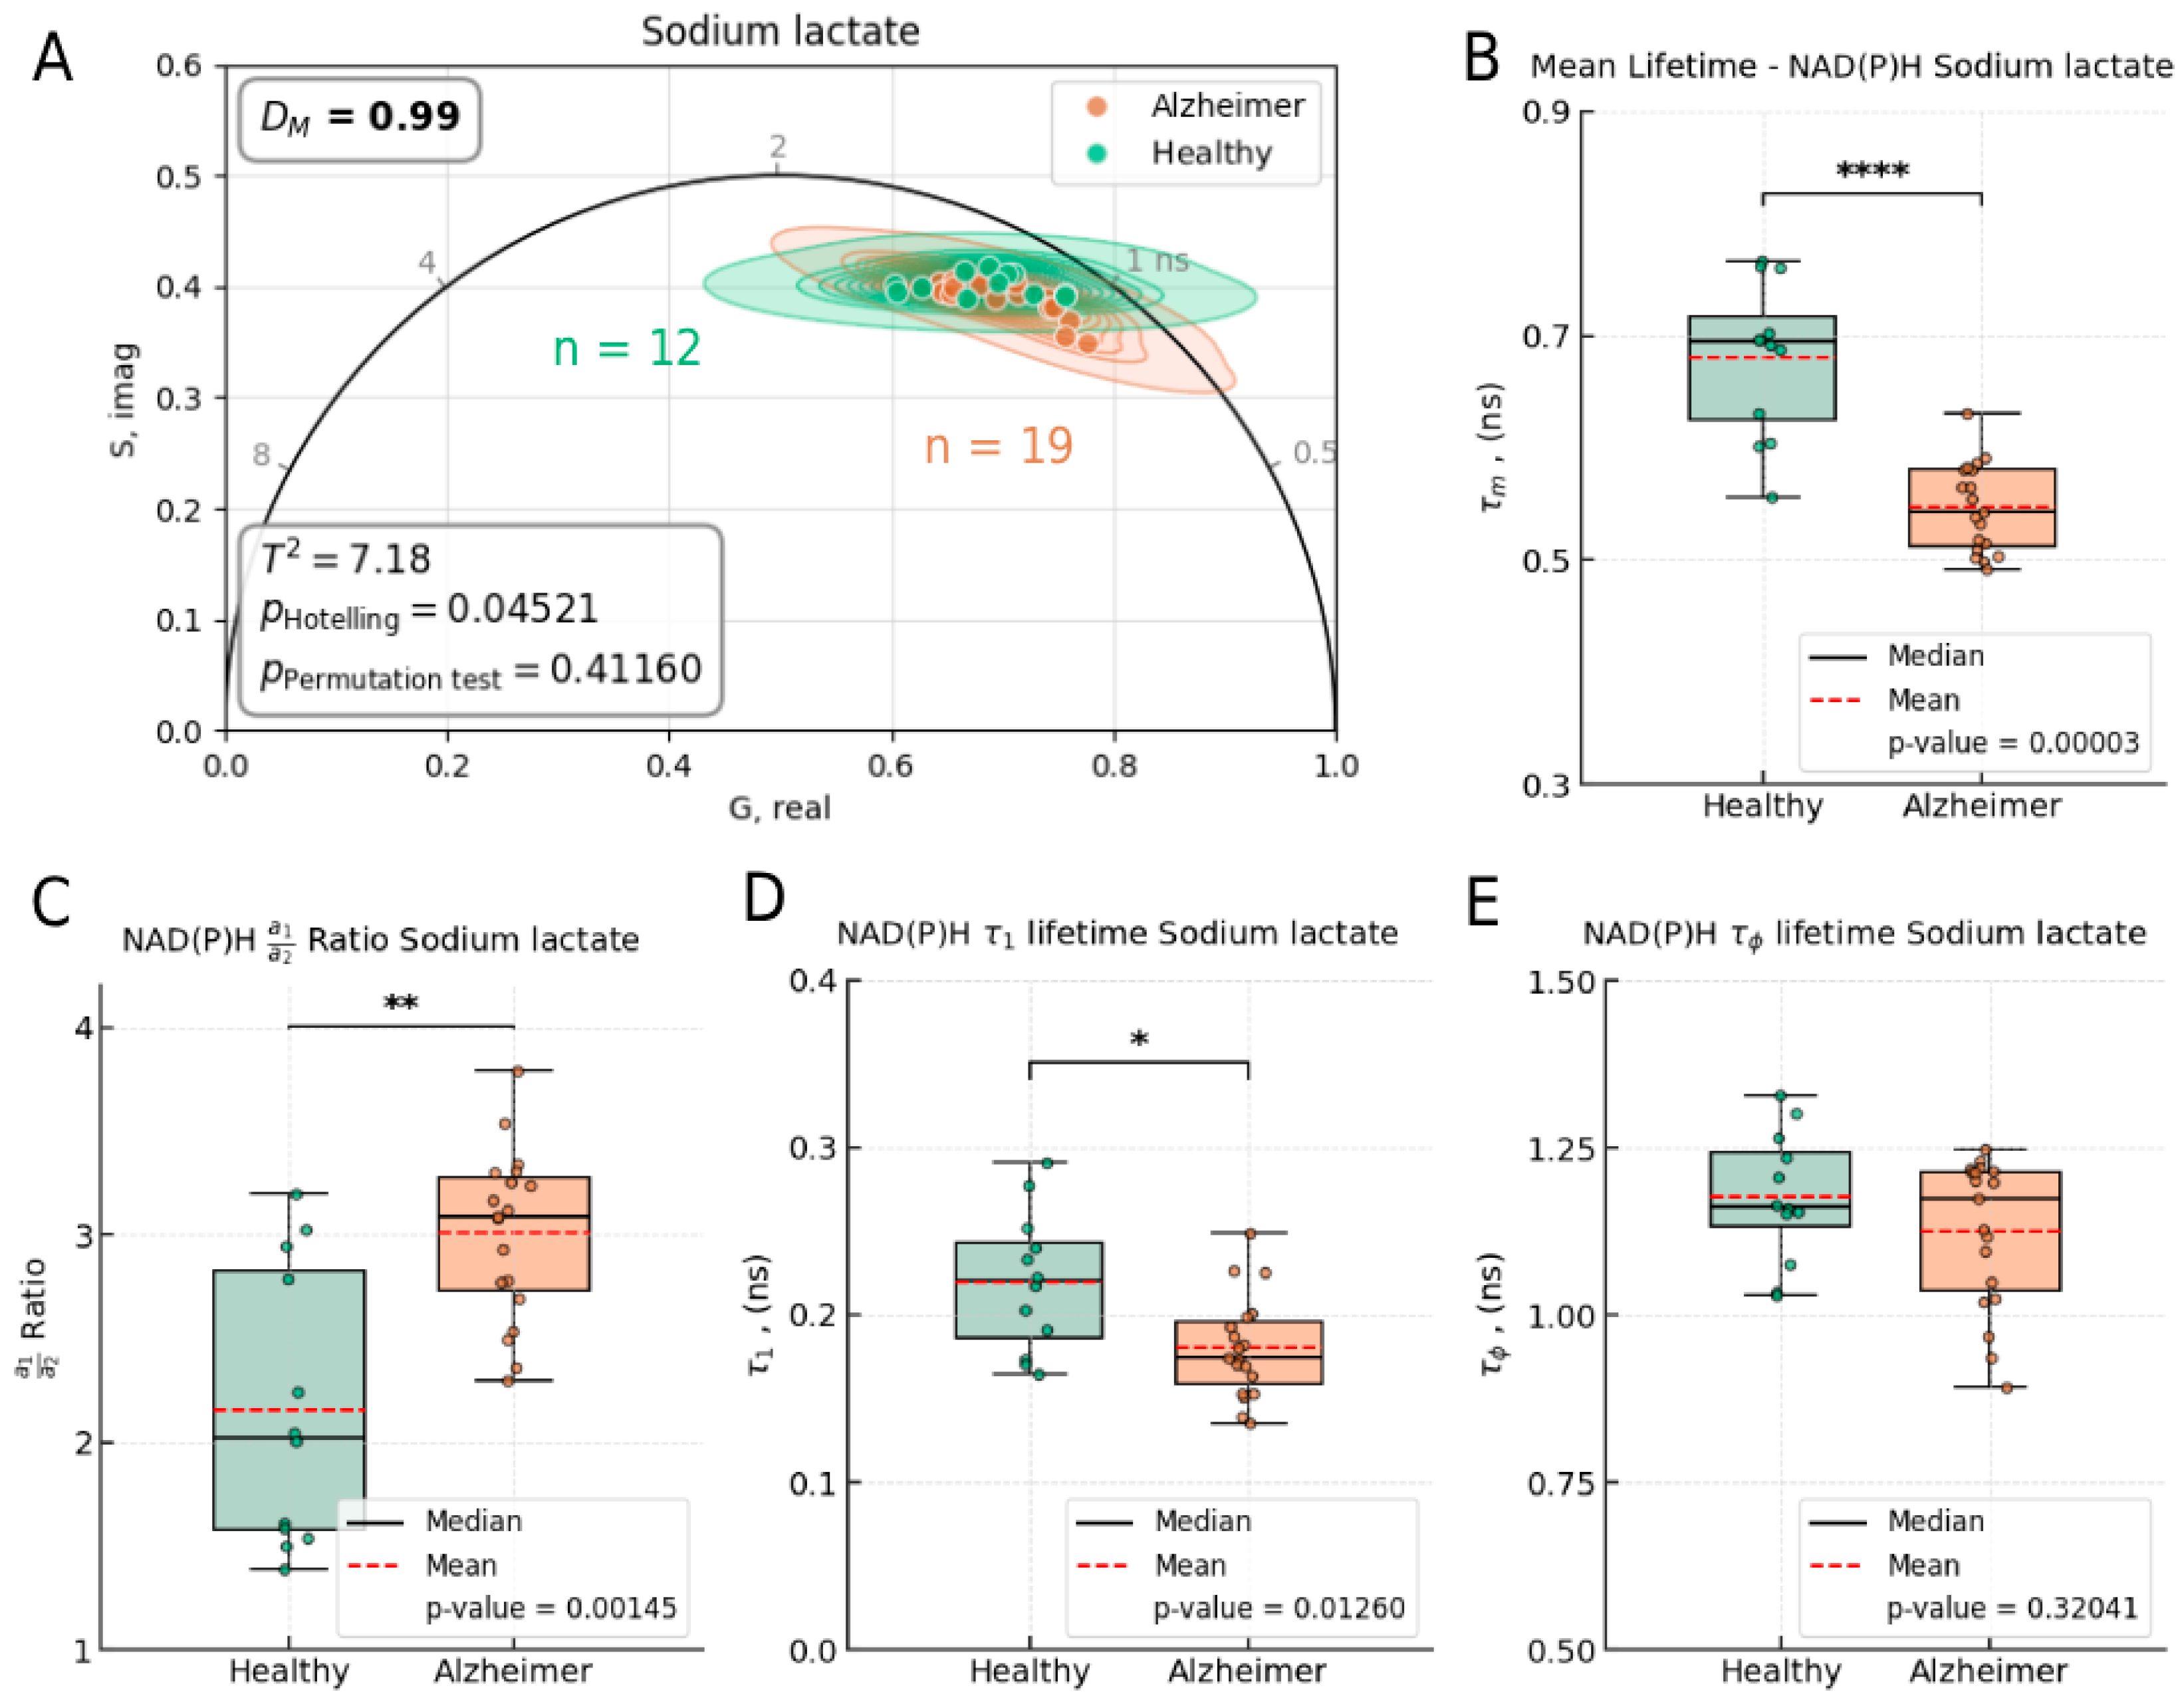

Disclaimer/Publisher’s Note: The statements, opinions and data contained in all publications are solely those of the individual author(s) and contributor(s) and not of MDPI and/or the editor(s). MDPI and/or the editor(s) disclaim responsibility for any injury to people or property resulting from any ideas, methods, instructions or products referred to in the content. |
© 2026 by the authors. Licensee MDPI, Basel, Switzerland. This article is an open access article distributed under the terms and conditions of the Creative Commons Attribution (CC BY) license.