


Abstract
Rapid and productive monitoring of pesticide residues in food is essential for effective food safety. In this study, a lateral flow immunoassay (LFIA) was developed for the simultaneous detection of two triazole fungicides, cyproconazole and difenoconazole, in fruits and berries. The assay was realized using an indirect competitive format and two types of gold nanoparticles, namely nanospheres and nanoflowers, as labels. The chosen nanoflowers-based assay, which was chosen for its greater sensitivity, achieved visual and instrumental limits of detection of 0.6 ng/mL and 0.01–0.02 ng/mL for cyproconazole and 4 ng/mL and 0.20–0.75 ng/mL for difenoconazole, respectively. The assay was successfully applied to plum, cranberry, and cherry extracts, with recoveries ranging from 91% to 113% for cyproconazole and from 92% to 119% for difenoconazole.
1. Introduction
The quality and safety of food products are pivotal determinants of public health outcomes and the sustainability of economic development [1,2]. Ensuring food safety mitigates the risks of food poisoning, allergic reactions, and chronic exposure to residual toxic contaminants, including antibiotics, mycotoxins, heavy metals, and pesticides [3,4,5]. Among systemic pesticides, triazole fungicides constitute one of the most extensively employed groups, owing to their pronounced efficacy against a broad spectrum of phytopathogenic fungi, prolonged protective action, and versatility across diverse agricultural crops. Within this group, cyproconazole and difenoconazole have garnered substantial practical application. They are included in numerous commercial formulations and are widely used to protect cereal, fruit, vegetable, and berry crops [6]. Currently, maximum residue limits (MRLs) for cyproconazole and difenoconazole are established under Regulation (EC) No 396/2005 of the European Parliament and of the Council on maximum residue levels of pesticides in or on food and feed of plant and animal origin. The established values vary significantly depending on the type of product and can differ by more than an order of magnitude [7]. The use of cyproconazole was banned in the European Union in 2021; however, imported commodities remain subject to regulatory oversight [8,9]. Consequently, permissible residue concentrations for cyproconazole display marked variation depending on the product type. Stringent requirements are imposed on berry crops, which have some of the lowest MRLs for both difenoconazole and cyproconazole.
Chronic dietary exposure to residual quantities of these pesticides exerts deleterious effects on human health, manifesting as hepatic and endocrine dysfunction, metabolic perturbations, reproductive system impairment, and cumulative toxicity [10,11]. Moreover, excessive or uncontrolled application of cyproconazole and difenoconazole leads to contamination of soil and aquatic ecosystems [12]. Accordingly, determining the levels of these pesticides in food commodities is a critical analytical task.
The compliance of raw materials and finished products with established standards should be ensured through timely and effective quality control. Food quality control systems require the implementation of rapid, easy-to-use, and cost-effective analytical methods to ensure that products meet safety and quality standards [13,14]. Traditional laboratory methods are highly accurate but time-consuming (from several hours to several days) and labor-intensive to perform (complex sample preparation procedure, several stages of analysis) [15,16].
During routine monitoring of several samples, there is a need for rapid and user-friendly methods that combine high sensitivity with rapid result acquisition. Conventional laboratory-based techniques, while characterized by high accuracy, are encumbered by protracted analysis durations—spanning several hours to days—and labor-intensive procedural demands, including complex sample preparation and multi-step analytical workflows. Lateral flow immunoassays (LFIA) are a promising tool for screening control. LFIA combines the ability to conduct analysis on-site without the need for specialized equipment or complex sample preparation. This approach allows for testing by unskilled personnel with rapid result acquisition (the average analysis time is 15–20 min) [17,18,19]. Beyond these inherent advantages, the multiparametric configuration of LFIA test systems permits substantial reductions in both analysis time and cost since there is no need to conduct repetitive determination procedures for individual compounds [20,21,22].
The most common nanoparticle label used in LFIA systems are gold nanospheres. However, to improve the assay performance, nanoparticles of different shapes are applied. The utilization of gold nanoflowers GNFs compared to gold nanospheres GNSs is conditioned by the increased particle sizes and developed surface, which ensure high sorption capacity, thereby facilitating more efficient antibody immobilization and amplification of the analytical signal [23,24,25]. The advantages of gold nanoflowers as labels in LFIA have been previously demonstrated in sandwich assay format [26,27,28]. However, in competitive LFIA configurations, the high antibody density on the surface of large nanoparticles may compromise the efficiency of competitive interactions, consequently deteriorating the analytical performance of the test system.
A promising strategy to overcome this limitation is the use of an indirect labeling scheme that allows for the combination of a high level of signal intensity with effective competition for analyte binding. The indirect labeling provides the separation of competitive interactions between specific antibodies and detectable analytes in the sample and a hapten–protein conjugate on the membrane of the test strip. The application of a label conjugated with anti-species antibodies allows for independent variation of marker concentration and prolongs the duration of specific antigen–antibody interaction during the assay. Previously, the advantages of this strategy were demonstrated predominantly in monoparametric LFIA using spherical gold nanoparticles, whereas its applicability with gold nanoflowers in multiplex competitive LFIA has remained virtually unexplored [29,30]. In this work, a combination of indirect labeling in LFIA based on gold nanoflowers and instrumental detection of the analysis results for the quantitative simultaneous determination of cyproconazole and difenoconazole was implemented for the first time.
The execution of this objective—developing a multiparametric test system for cyproconazole and difenoconazole—was based on the synthesis, comparative characterization, and application of GNSs and GNFs as LFIA labels within an indirect antibody labeling scheme. Under the established LFIA parameters, simultaneous detection of cyproconazole and difenoconazole in fruits and berries was performed.
2. Materials and Methods
2.1. Chemicals and Materials
The used reactants included chloroauric acid, sodium citrate, Tween-20, hydroquinone, cyproconazole (Sigma-Aldrich, St. Louis, MA, USA), bovine serum albumin (BSA) (Boval Biosolutions, Cleburne, TX, USA), difenoconazole (Ano-Aic, Moscow, Russia), goat anti-mouse (anti-species) antibodies (Imtek, Moscow, Russia). Anti-cyproconazole monoclonal antibodies and cyproconazole-BSA were earlier obtained in Jiangnan University as described in [31]. Anti-difenoconazole monoclonal antibodies and difenoconazole-BSA were obtained from Invitrogen (Carlsbad, CA, USA). All other salts, acids, and alkalis used in the study were of analytical or chemical grade (Chimmed, Moscow, Russia). Deionized water cleansed by the Simplicity system (Millipore, Burlington, MA, USA) was applied to prepare gold nanoparticles and their conjugates.
The working nitrocellulose membrane HF090 was from Millipore (Burlington, MA, USA), the AP-045 adsorption membrane and L-P25 plastic support were from Advanced Microdevices (Ambala Cantt, Haryana, India).
2.2. Synthesis of GNSs and GNFs
Gold nanospheres were synthesized according to the Frens method [32]: 100 mL of 0.01% HAuCl4 had been brought to boiling, following which 1.5 mL of 1% sodium citrate was added to the solution with vigorous stirring. The mixture was boiled within 15 min, then cooled and stored at 4 °C.
GNFs synthesis was carried out by gold seed-mediated growth method according to [33]. To obtain spherical nanoparticles serving as nucleation centers, 10 mL of a 0.01% aqueous solution of HAuCl4 was heated to boiling, and then 0.3 mL of a 1% aqueous solution of sodium citrate was added with vigorous stirring. The solution was boiled for 30 min and then cooled. Next, an aqueous solution of HAuCl4 in the final concentration of 0.12 mM, a solution of spherical nanoparticles in the concentration of 0.5% vol, 22 μL of a 1% aqueous solution of sodium citrate and 100 μL of 0.3 M hydroquinone were added to 10 mL of bidistilled water. The resulting mixture was thoroughly mixed for 30 min, then cooled and stored at 4 °C.
2.3. Characterization GNSs and GNFs
Images of GNSs and GNFs were obtained by transmission electron microscopy (TEM) using a CX-100 electron microscope (Jeol, Tokyo, Japan) at an acceleration voltage of 80 kV and a magnification of 33,000. The images were scanned and analyzed by the Image Tool 3.0 software (UTHSCSA, San Antonio, TX, USA).
To determine the hydrodynamic diameters (using dynamic light scattering (DLS) of the particles, Zetasizer Nano ZSP (Malvern Instruments, Malvern, UK) nanoparticle analyzer was used. Measurements were conducted at 25 °C, with light scattering recorded at an angle of 173°. The results were processed using Zetasizer software, version 7.11.
2.4. Conjugation of GNSs and GNFs with Anti-Species Antibodies
Antibodies were bound in identical protocol to the GNSs and GNFs as described in [34]: The solution of nanoparticles was adjusted to pH 8.5 with 0.2 M K2CO3 (Chimmed, Moscow, Russia). Anti-species antibodies, dialyzed against a 10 mM Tris–HCl (Chimmed, Moscow, Russia) buffer, pH 8.0, were then added to GNSs or GNFs at a final concentration of 5–20 μg/mL. After 1 h of incubation with stirring, 10% BSA was added with 40-fold dilution, and the mixture was stirred for 15 min with Intelli-Mixer RM-2S (Elmi, Riga Latvia) at 60 rpm. The resulting conjugate was precipitated centrifuging for 15 min at 13,400× g for GNSs and 7500× g for GNFs and 4 °C. The pellets were collected, twice resuspended in 10 mM Tris (pH 8.5) with 1% BSA, and 1% sucrose (Reachem, Moscow, Russia) (TBSA), and then centrifuged once more. The finished precipitate was redissolved in TBSA containing 0.05% sodium azide (Sigma-Aldrich, St. Louis, MA, USA) and stored at 4 °C. All stock solutions of the synthesized nanoparticles and their conjugates with antibodies were prepared in a single batch and used in all subsequent experiments on the development of LFIA.
2.5. Construction of the Test Strips
A millipore HF090 working nitrocellulose membrane was used to form an analytical zone by applying cyproconazole-BSA solution in PBS (0.2; 0.25; 0.5 mg/mL; application consumption 1 μL/mm) and difenoconazole-BSA solution (0.5; 1.0 mg/mL; application consumption 1 μL/mm) using an IsoFlow automatic dispenser (Imagene Technology, Lebanon, NH, USA). The working membrane was then dried at 20–22 °C for 24 h. A multimembrane composite (including working membrane and AP-045 adsorption membrane) was assembled, cut into 3.5 mm-wide strips using an Index Cutter-1 automatic guillotine cutter (A-Point Technologies Brea, CA, USA) and stored at room temperature in a sealed package containing silica gel.
2.6. Performing LFIA
To provide the analysis, cyproconazole (at concentrations of 500–0.03 ng/mL and 50–0.008 ng/mL) and difenoconazole (at concentrations of 1000–0.2 ng/mL) was mixed with conjugates of spherical GNSs (OD520 = 0.5), or GNFs with anti-species antibodies (OD580 = 0.8), and with specific antibodies (250 and 400 ng/mL for cyproconazole; 100 and 500 ng/mL for difenoconazole in GNSs-based LFIA; 100 and 250 ng/mL for cyproconazole; 500 and 1000 ng/mL for difenoconazole in GNFs-based LFIA) in 30 µL PBS with 0.5% Tween-20 (PBST), or in plum, cranberry, and cherry samples diluted with PBST (dilution coefficient 20) in microplate wells. The optical density values (OD520 = 0.5 for the GNSs and OD580 = 0.8 for the GNFs) were used to control the dilution of each conjugate preparation according to its individual optical characteristics. The test strips were introduced into the wells in a vertical position for 15 min. After the analysis was completed, test strips were removed, placed on a horizontal surface, and then immediately scanned.
2.7. Sample Preparation
Stones were removed from plums and cherries, and the pulp and skin were homogenized together. Cranberries were homogenized whole. Each sample matrix was processed separately. A 5.00 g portion of homogenate was mixed with 10 mL of methanol (Vekton, Saint Petersburg, Russia)–water (80:20, v/v) and shaken for 15 min at room temperature. The mixture was centrifuged at 5000× g for 10 min, and the supernatant was collected. The residue was re-extracted with 5 mL of the same solvent mixture by shaking for 10 min, followed by centrifugation under the same conditions. The supernatants were combined, and the solvent was removed under reduced pressure at a temperature not exceeding 35 °C. The resulting residue was dissolved in methanol–water (50:50, v/v), quantitatively transferred to a volumetric flask, and brought to a final volume of 5.00 mL with the same solvent mixture, yielding a sample mass-to-extract volume ratio of 1.00 g/mL. When suspended particles remained, the reconstituted extract was centrifuged again before further use. The extracts were diluted 20-fold with the immunoassay working buffer, yielding a methanol content of 2.5% (v/v) and a sample equivalent concentration of 0.05 g/mL. Pesticide standards were added after dilution, with the fortification volume accounted for in the final volume to maintain the 20-fold extract dilution.
2.8. Processing Test Strip Images and Calculating Assay Parameters
After LFIA, the test strips were scanned with a Canon Lide 90 flatbed scanner (Canon, Tokyo, Japan) at 600 dpi resolution without contrast and color correction mode and analyzed with the Total Lab v2009 software (Nonlinear Dynamics, Newcastle upon Tyne, UK). Line coloring intensities were presented as the same relative units for all data within the article.
The dependences of coloration intensity in the analytical zone on the antigen con-centration in the sample (x) were approximated by the Origin 9.0 software (OriginLab, Northampton, MA, USA) using a 4-parameter sigmoid function:
where a = maximal signal, b = minimal signal, c (or IC50) = the antigen concentration at which the decrease of y is 50% of its range of changes, and d = the slope of the approximating curve at point c.
y = (a − b)/[1 + (x/c)d] + b
The antigen concentration, corresponding to the disappearance of color in the analytical zone, was taken as the visual detection limit. The instrumental limits of detection were calculated from concentration dependences of immunochromatography using 3σ criteria for difference of the registered coloration from its value for sample without the analyte. LOD was estimated as the concentration corresponding to the signal obtained for the blank sample minus three times the standard deviation [35]. The blank signal was measured in ten replicates of test strips.
3. Results
3.1. Characterization of Nanoparticles
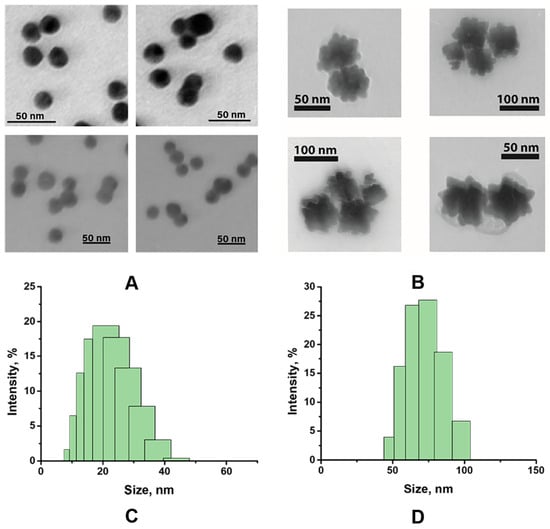
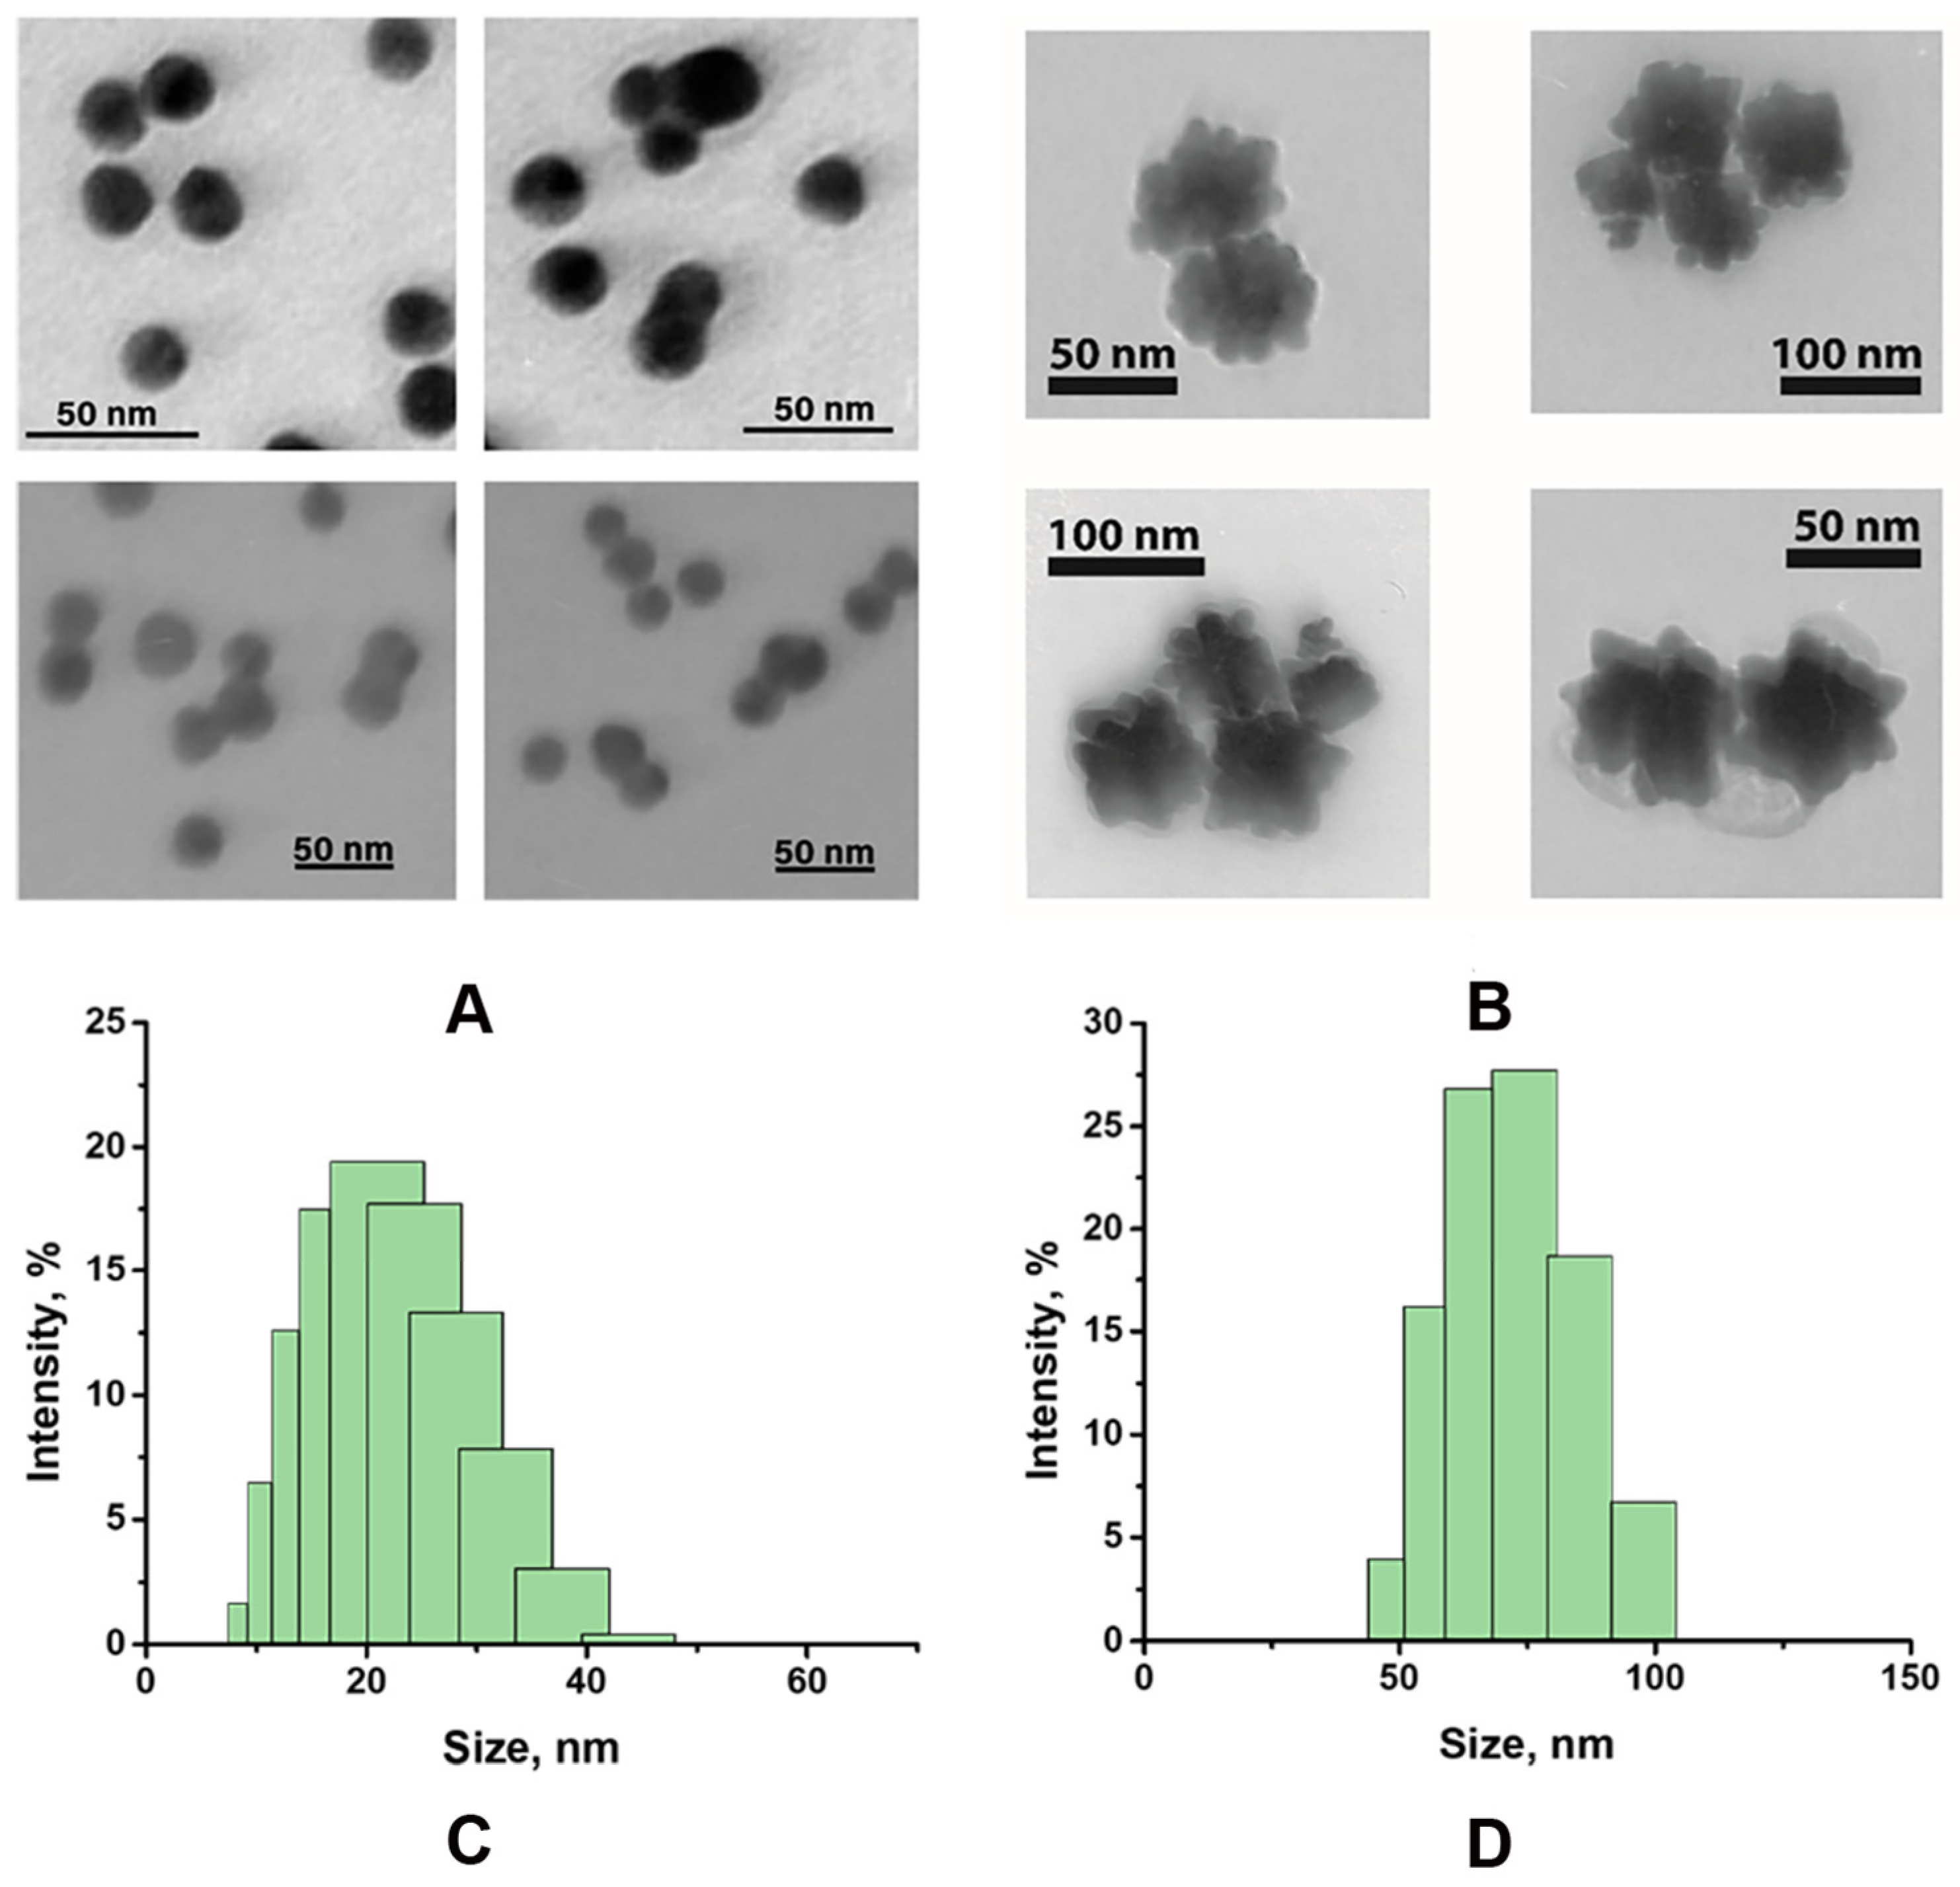
To characterize the obtained GNSs and GNFs, transmission electron microscopy and dynamic light scattering data were used. For spherical GNSs, the average diameter was 19.72 nm (n = 250, with a minimum value of 11.43 nm and a maximum value of 23.55 nm), with a degree of ellipticity of 1.23 ± 0.04 (Figure 1A). GNFs were synthesized using growing gold cores with a diameter of 11.53 nm in the presence of hydroquinone and sodium citrate. The final preparation of the highly anisotropic GNFs was characterized by an average diameter varying from 53 to 76 nm (Figure 1B). The resulting size of synthesized GNFs is proportional to the area-equivalent diameter of the nanoparticles.
Figure 1.
TEM micrographs of GNSs (A) and GNFs (B). DLS characterization of GNSs (C) and GNFs (D).
The synthesized GNSs and GNFs were also characterized by DLS. DLS allows the hydrodynamic diameters of particles in a solution to be determined, considering the formation of hydrate shells around the particles. Figure 1: Size distribution of GNSs (C) and GNFs (D) with hydrodynamic diameters of 22.47 and 70.4 nm, respectively. The difference in nanoparticle diameters obtained from the DLS method compared to the TEM method was due to the contribution of the hydration shell of the particle, which was accounted for by DLS.
3.2. Specification of LFIA Format
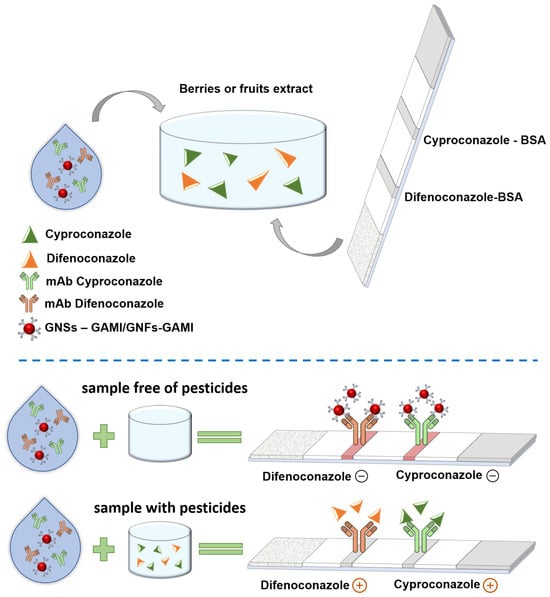
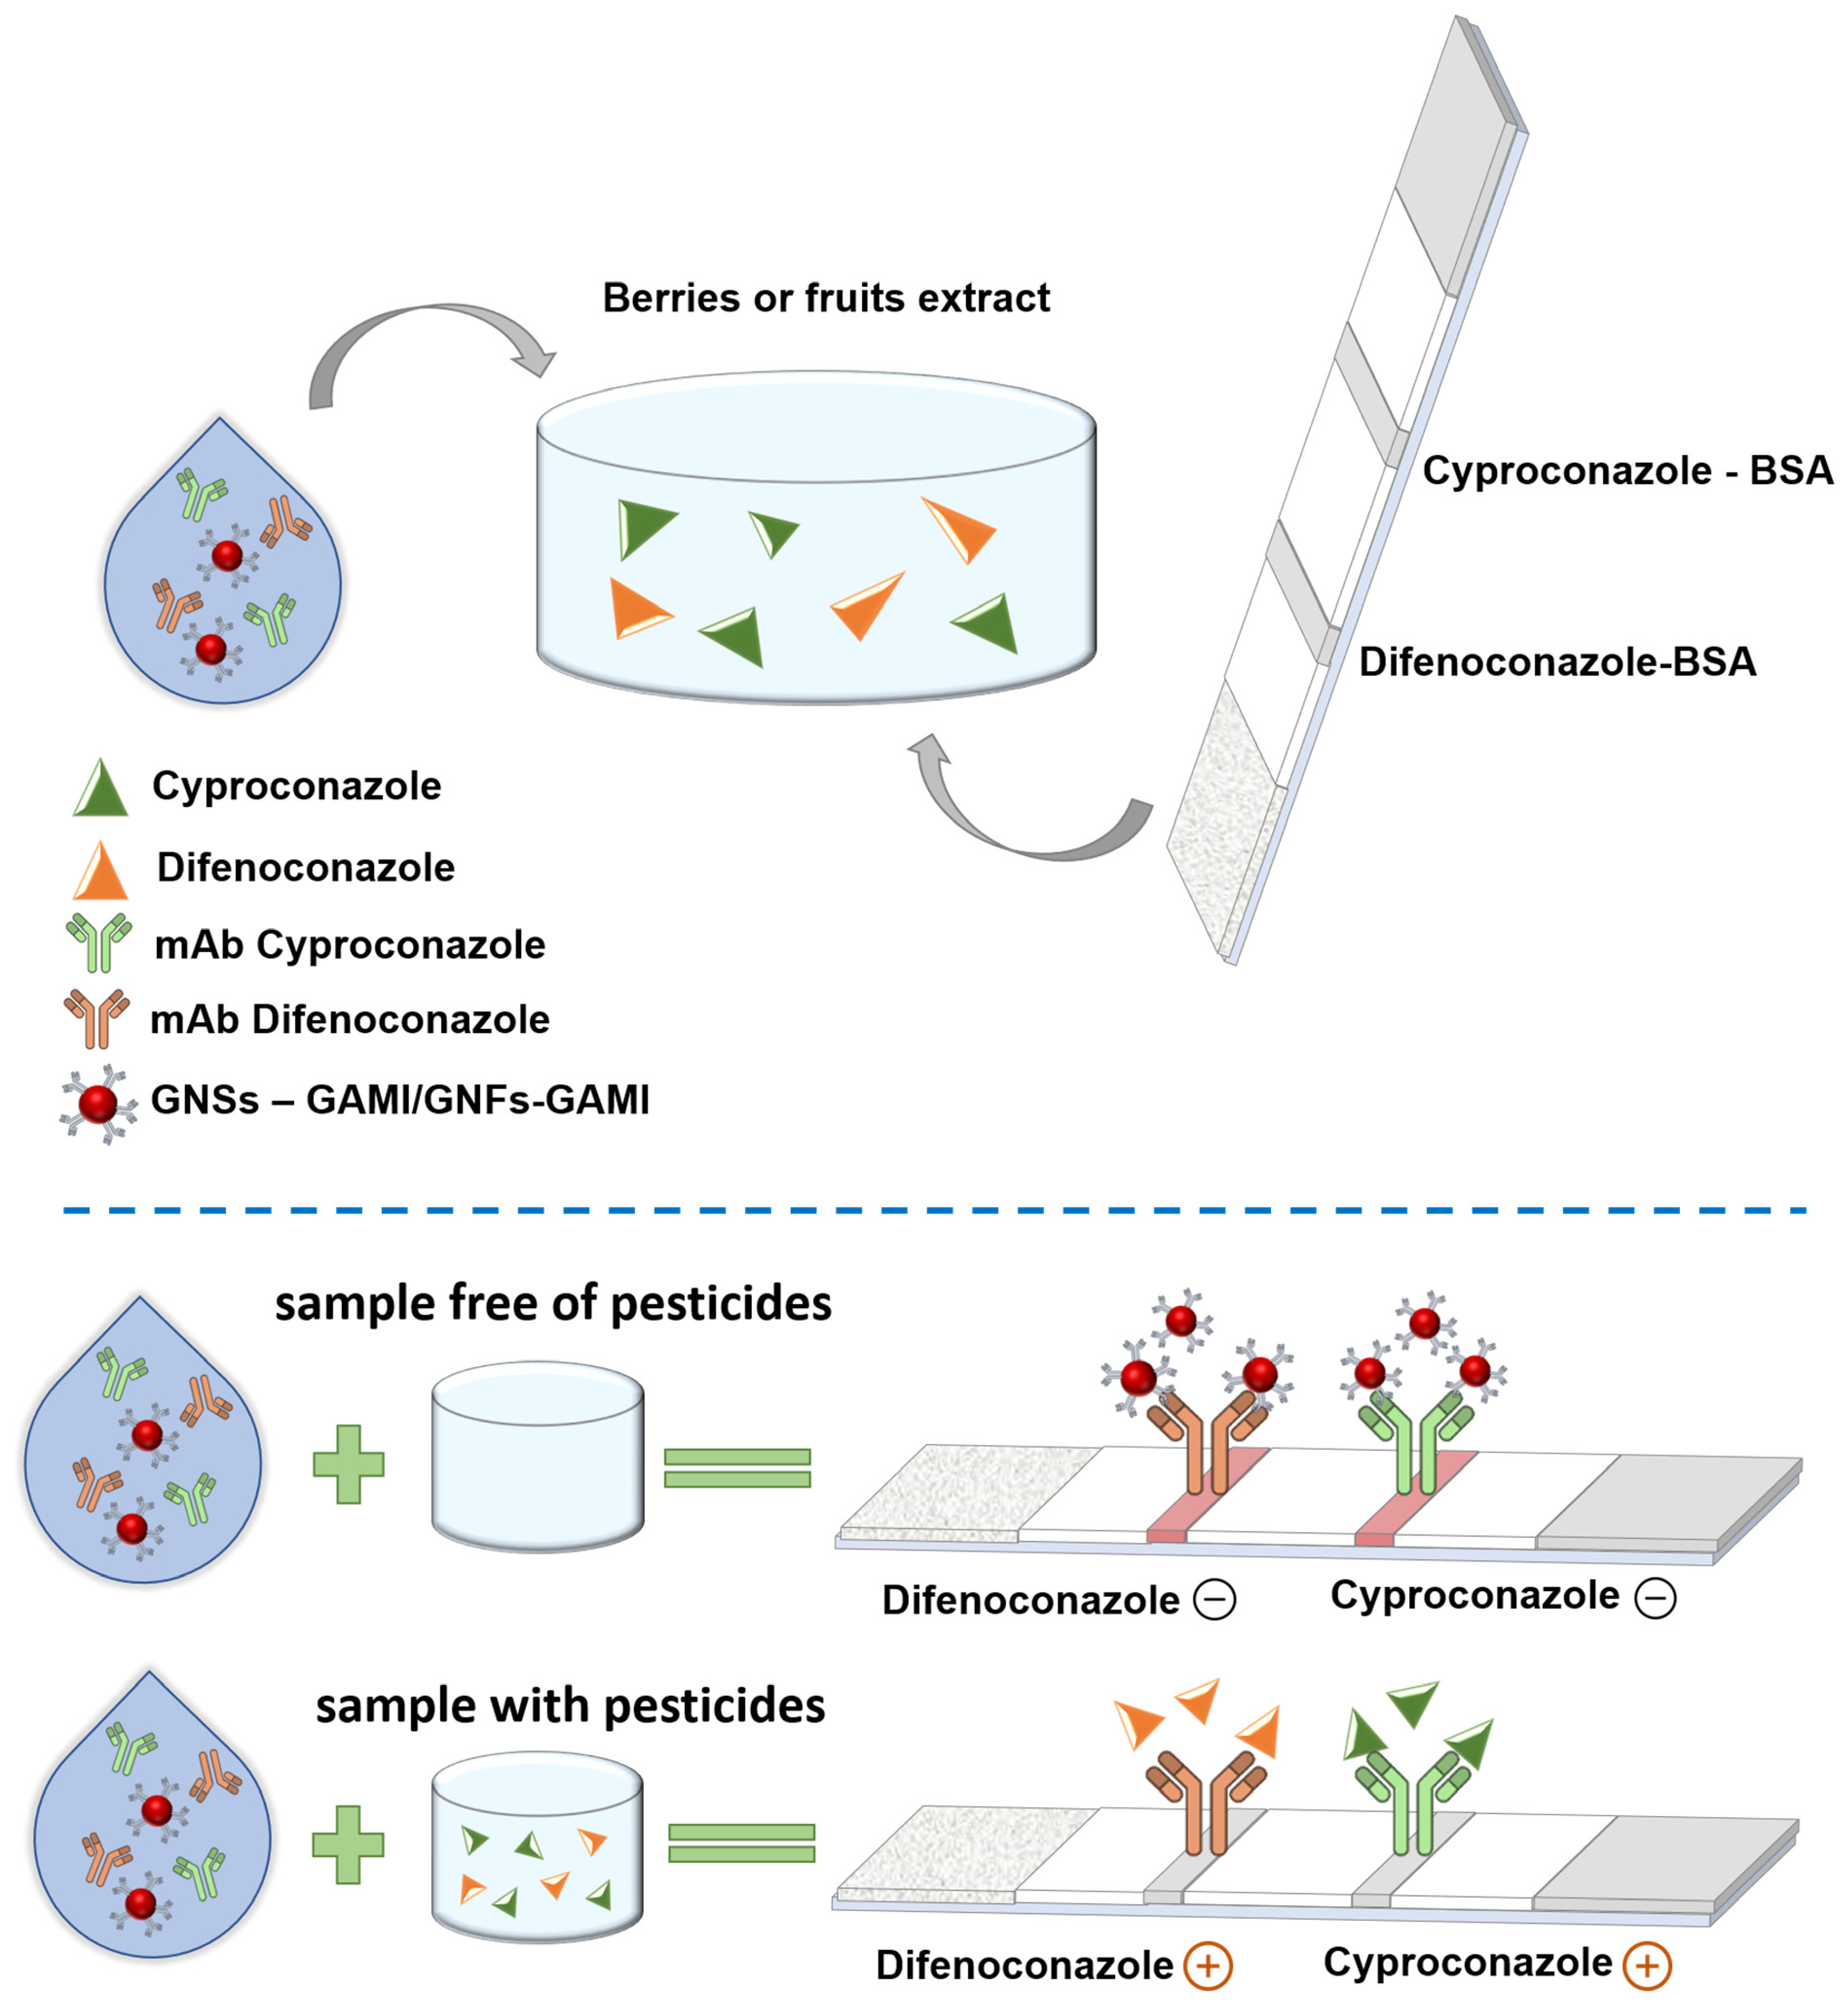
All experiments in this work are based on the indirect competitive scheme of LFIA for detecting small molecular weight analytes. In this scheme, antibodies specific to the target analytes are added to the sample, and the hapten–protein conjugate is immobilized in the analytical zone of the test strip. To detect immune complexes of free antibodies and antigens formed in the sample, a conjugate of gold nanoparticles with anti-species antibodies was used. When performing the analysis, a test strip is immersed in the reaction mixture, forming a complex between free specific antibodies, the antigen in the sample, and the nanoparticle conjugate with anti-species antibodies. When the liquid front reaches the analytical zone, some unbound antibodies interact with the immobilized hapten–protein conjugate. If the pesticide is present in the sample at a concentration above the threshold, it binds to the specific antibodies, preventing them from forming a complex with the immobilized antigen, and thus preventing the formation of a colored band upon interaction with the labeled anti-species antibodies (Figure 2).
Figure 2.
Scheme of multiparametric LFIA for cyproconazole and difenoconazole detection.
3.3. Optimization of Monoparametric LFIAs with Spherical GNSs and GNFs
To perform a comparative analysis of LFIA with two types of gold nanoparticles, we used the synthesized particles and their conjugates with anti-species antibodies. First, the conditions for monoparametric LFIA for cyproconazole and difenoconazole detection were established. Researchers often underestimate the challenge of combining a monoparametric system into a multiparametric format. However, such combinations carry risks of sensitivity loss compared to the monoparametric format due to possible interference between immunoreagents and their stability under combined use. Therefore, before developing and optimizing the multiparametric LFIA, we assessed the feasibility of incorporating our target compounds into monoparametric formats.
To estimate the optimal conditions for the monoparametric format of the developed LFIA, we conducted the analysis by varying the following:
- (1)
- concentration of the specific antibodies in the sample;
- (2)
- concentration of anti-species antibodies in the conjugate with gold nanoparticles.
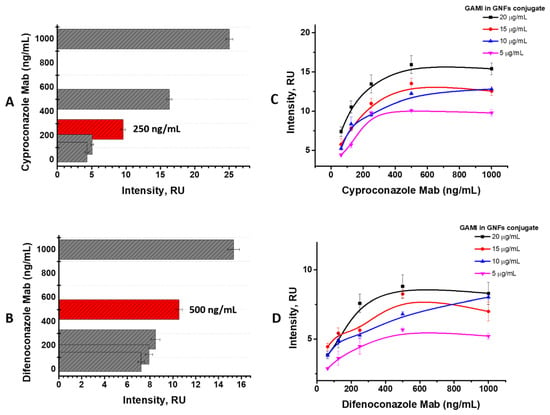
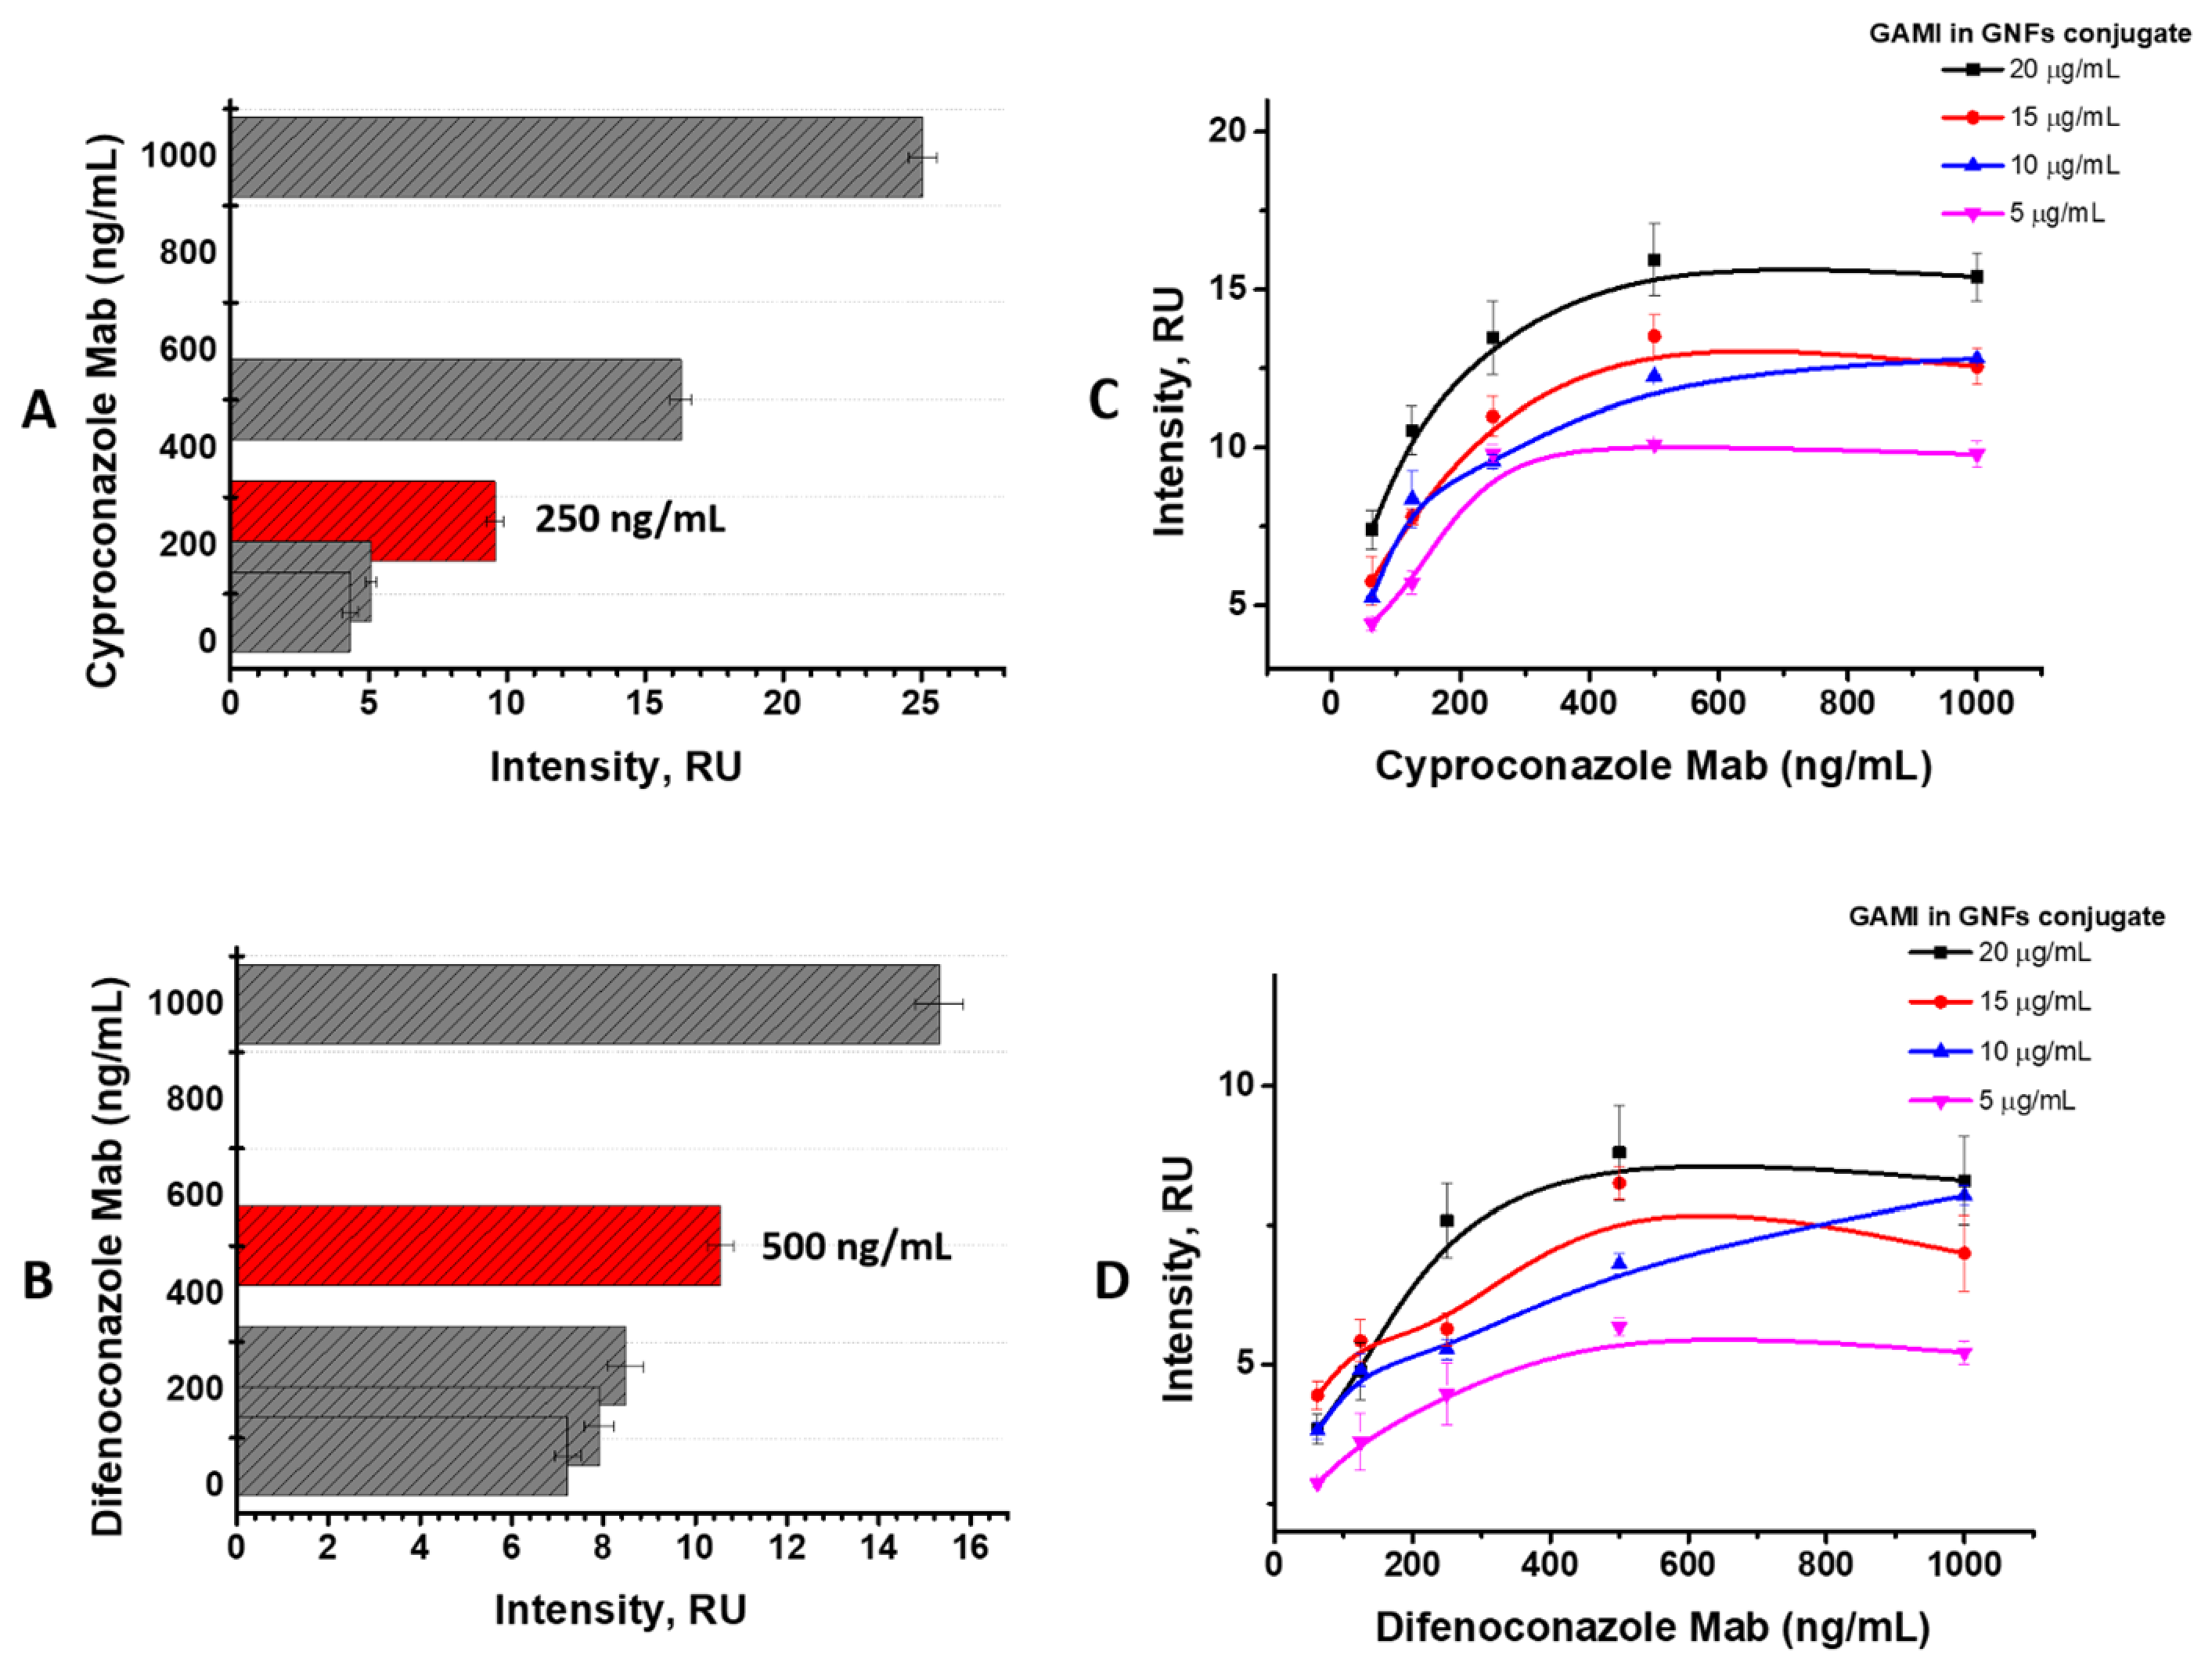
To this end, we systematically evaluated the dependence of color intensity in the analytical zone on both the concentration of specific antibodies added to the sample and the concentration of anti-species antibodies conjugated with gold nanoparticles. The data demonstrate a clear positive correlation: reducing the concentration of either specific or anti-species antibodies consistently diminishes the color intensity of the analytical zone. To ensure sufficient color intensity for reliable visual interpretation of assay results, we selected the following optimal parameters for LFIA employing spherical GNSs: 250 ng/mL for anti-cyproconazole antibodies and 500 ng/mL for anti-difenoconazole antibodies (Figure 3A,B). For the LFIA platform based on GNFs, we further optimized the concentrations of specific and anti-species antibodies within the marker conjugate. The optimal concentration of anti-species antibodies was determined to be 10 µg/mL, while the optimal concentrations of anti-cyproconazole and anti-difenoconazole antibodies were established at 250 ng/mL and 1000 ng/mL, respectively (Figure 3C,D).
Figure 3.
Optimization for monoparametric LFIAs: dependencies of color intensity in the analytical zone on concentrations of antibodies to cyproconazole ((A)–with GNSs, (C)–with GNFs) and difenoconazole ((B)–with GNSs, (D)–with GNFs). Grey columns indicate concentrations of antibodies (62.5–1000 ng/mL). Red columns indicate the chosen concentrations. All experiments were performed in triplicate; standard deviations are given as error bars.
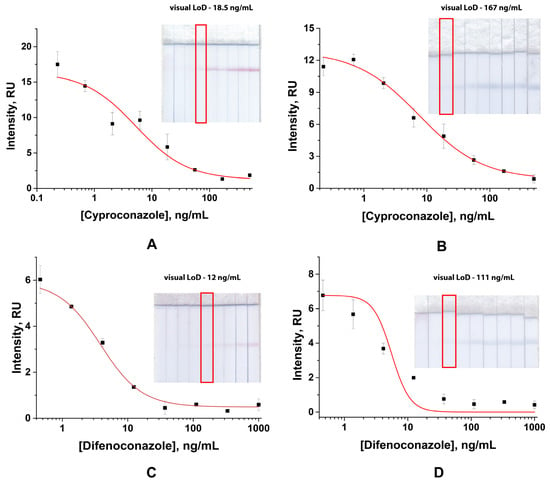
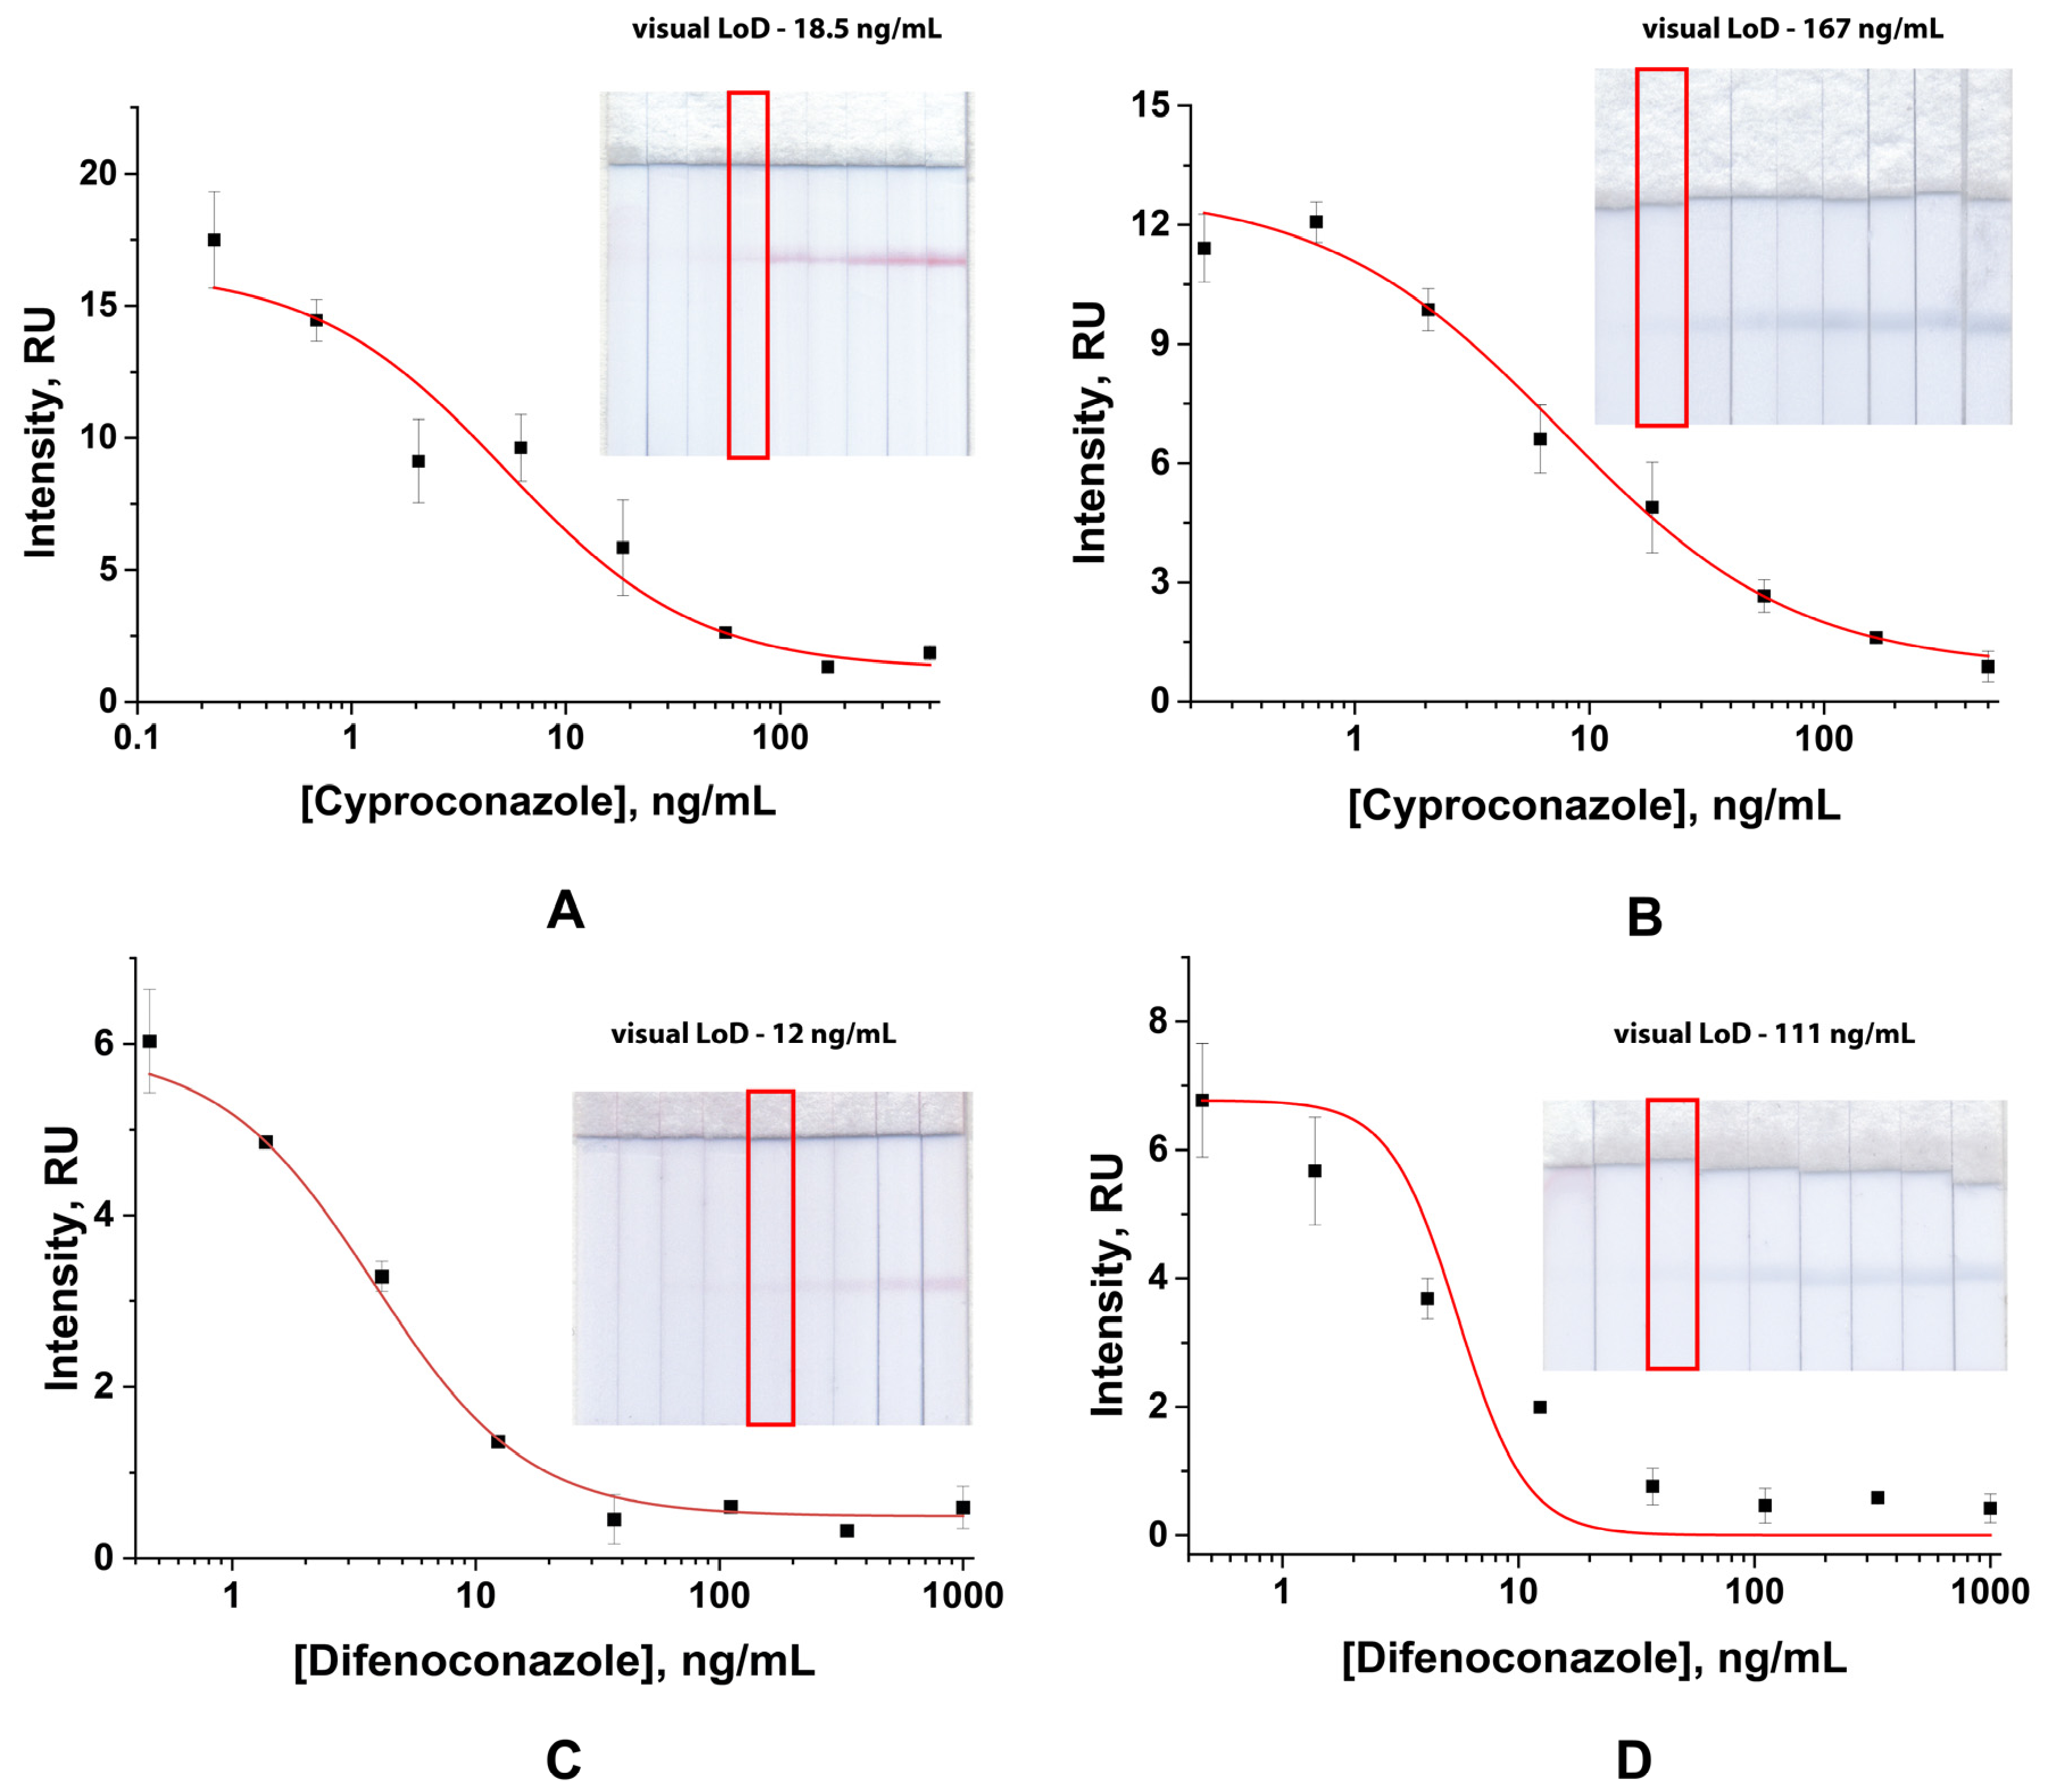
Considering the selected parameters, we have conducted the analysis first with spherical GNSs with evaluation of the limits of detection (LoD). To run LFIA, we chose the previously adjusted parameters, which resulted in a low color intensity of the analytical zone for both cyproconazole and difenoconazole detection. As for the detected limits, in the case of cyproconazole, the data for visual detection (56 ng/mL) exceeded the established MRLs (10 ng/mL) 5.6 times. When the concentration of antibodies was increased up to 400 ng/mL, the intensity in the analytical zone coloration grew two times, but the visual limit of detection (18.5 ng/mL) was still bigger than the regulatory value almost two times (Figure 4A). When running LFIA for difenoconazole with an established previously antibody concentration, the visual limit of detection was achieved at 12 ng/mL (Figure 4C).
Figure 4.
Results of monoparametric LFIA for cyproconazole and difenoconazole detection with spherical GNSs ((A): y = 1.21 + (16.63 − 1.21)/(1 + (x/4.88)0.94), R2 = 0.97; (C): y = 0.49 + (5.92 − 0.49)/(1 + (x/3.81)1.37), R2 = 0.998) and GNFs ((B): y = 0.49 + (12.17 − 0.49)/(1 + (x/8.78)0.76), R2 = 0.99502; (D): y = 0.54+ (6.43 − 0.54)/(1 + (x/5.54)1.14), R2 = 0.78). Red boxes indicate visual limit of detection. All experiments were performed in triplicate, standard deviations are given as error bars.
LFIA for cyproconazole and difenoconazole based on GNFs was provided using the following concentrations of immunoreagents: 250 and 1000 ng/mL for anti-cyproconazole and anti-difenoconazole antibodies, respectively, and 10 µg/mL for anti-species antibodies in conjugate with GNFs. Under these conditions, a reliable colorimetric signal in the analytical zone was consistently achieved. The LODs were determined to be 167 ng/mL for cyproconazole and 111 ng/mL for difenoconazole (Figure 4B,D).
3.4. Optimization of Multiparametric LFIA with GNSs and GNFs
To estimate the optimal conditions for the multiparametric LFIA format, we conducted the analysis by varying the following parameters:
- (1)
- concentration of specific antibodies in the sample
- (2)
- concentration of the hapten–protein conjugate in the analytical zone;
- (3)
- sequence of analytical zone immobilization on the working membrane of the test strip.
During the analysis of the dependence of LFIA parameters on specific antibodies in the sample and on hapten–protein concentration in the analytical zone, the achieved limits of detection were estimated. The experiments were carried out simultaneously with the determination of the order of the analytical zones on the working membranes. First, the conditions for the LFIA system based on GNSs were optimized.
It was shown that in the LFIA scheme with high concentrations of cyproconazole antibodies (400 and 250 ng/mL) and hapten–protein conjugate (0.5 and 0.25 mg/mL) in the analytical zone, located in the first position (near the beginning of the flow on the membrane), the visual limit of detection was 500 ng/mL, which is much higher than the established MRL for cyproconazole. In the case of difenoconazole—with immobilized hapten–protein conjugate at a concentration of 1.0 and 0.5 mg/mL in the second position (near the adsorption membrane) and a concentration of specific antibodies in the sample of 500 and 250 ng/mL—the limit of detection was 37 ng/mL. When hapten–protein conjugates were immobilized in the opposite direction—cyproconazole-BSA in the second position and difenoconazole-BSA in the first position, respectively—it was noted that the LoD had shifted toward a lower concentration range. The effect demonstrated that LFIA sensitivity depends on the order of analytical zone location on the working membrane. Thus, for difenoconazole, chemical equilibrium during immunoreactant interactions is reached faster than for cyproconazole. Therefore, we immobilized the difenoconazole-BSA conjugate next to the starting position of the working membrane [20].
To achieve characteristics of the developed test system that are reliable to the regulatory values, we decreased the concentration of the cyproconazole-BSA conjugate in the analytical zone to 0.15 mg/mL and chose to use a specific antibody concentration in the sample of 400 ng/mL so that the coloration of the analytical zone was intense enough to estimate the results of the analysis. For difenoconazole, the concentration of the immobilized hapten-protein conjugate was used the same (1 mg/mL) and for specific antibodies (100 ng/mL) to achieve reliable LoD.
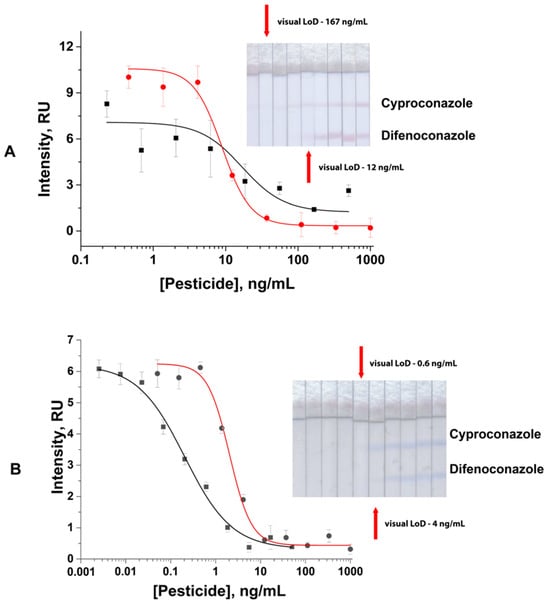
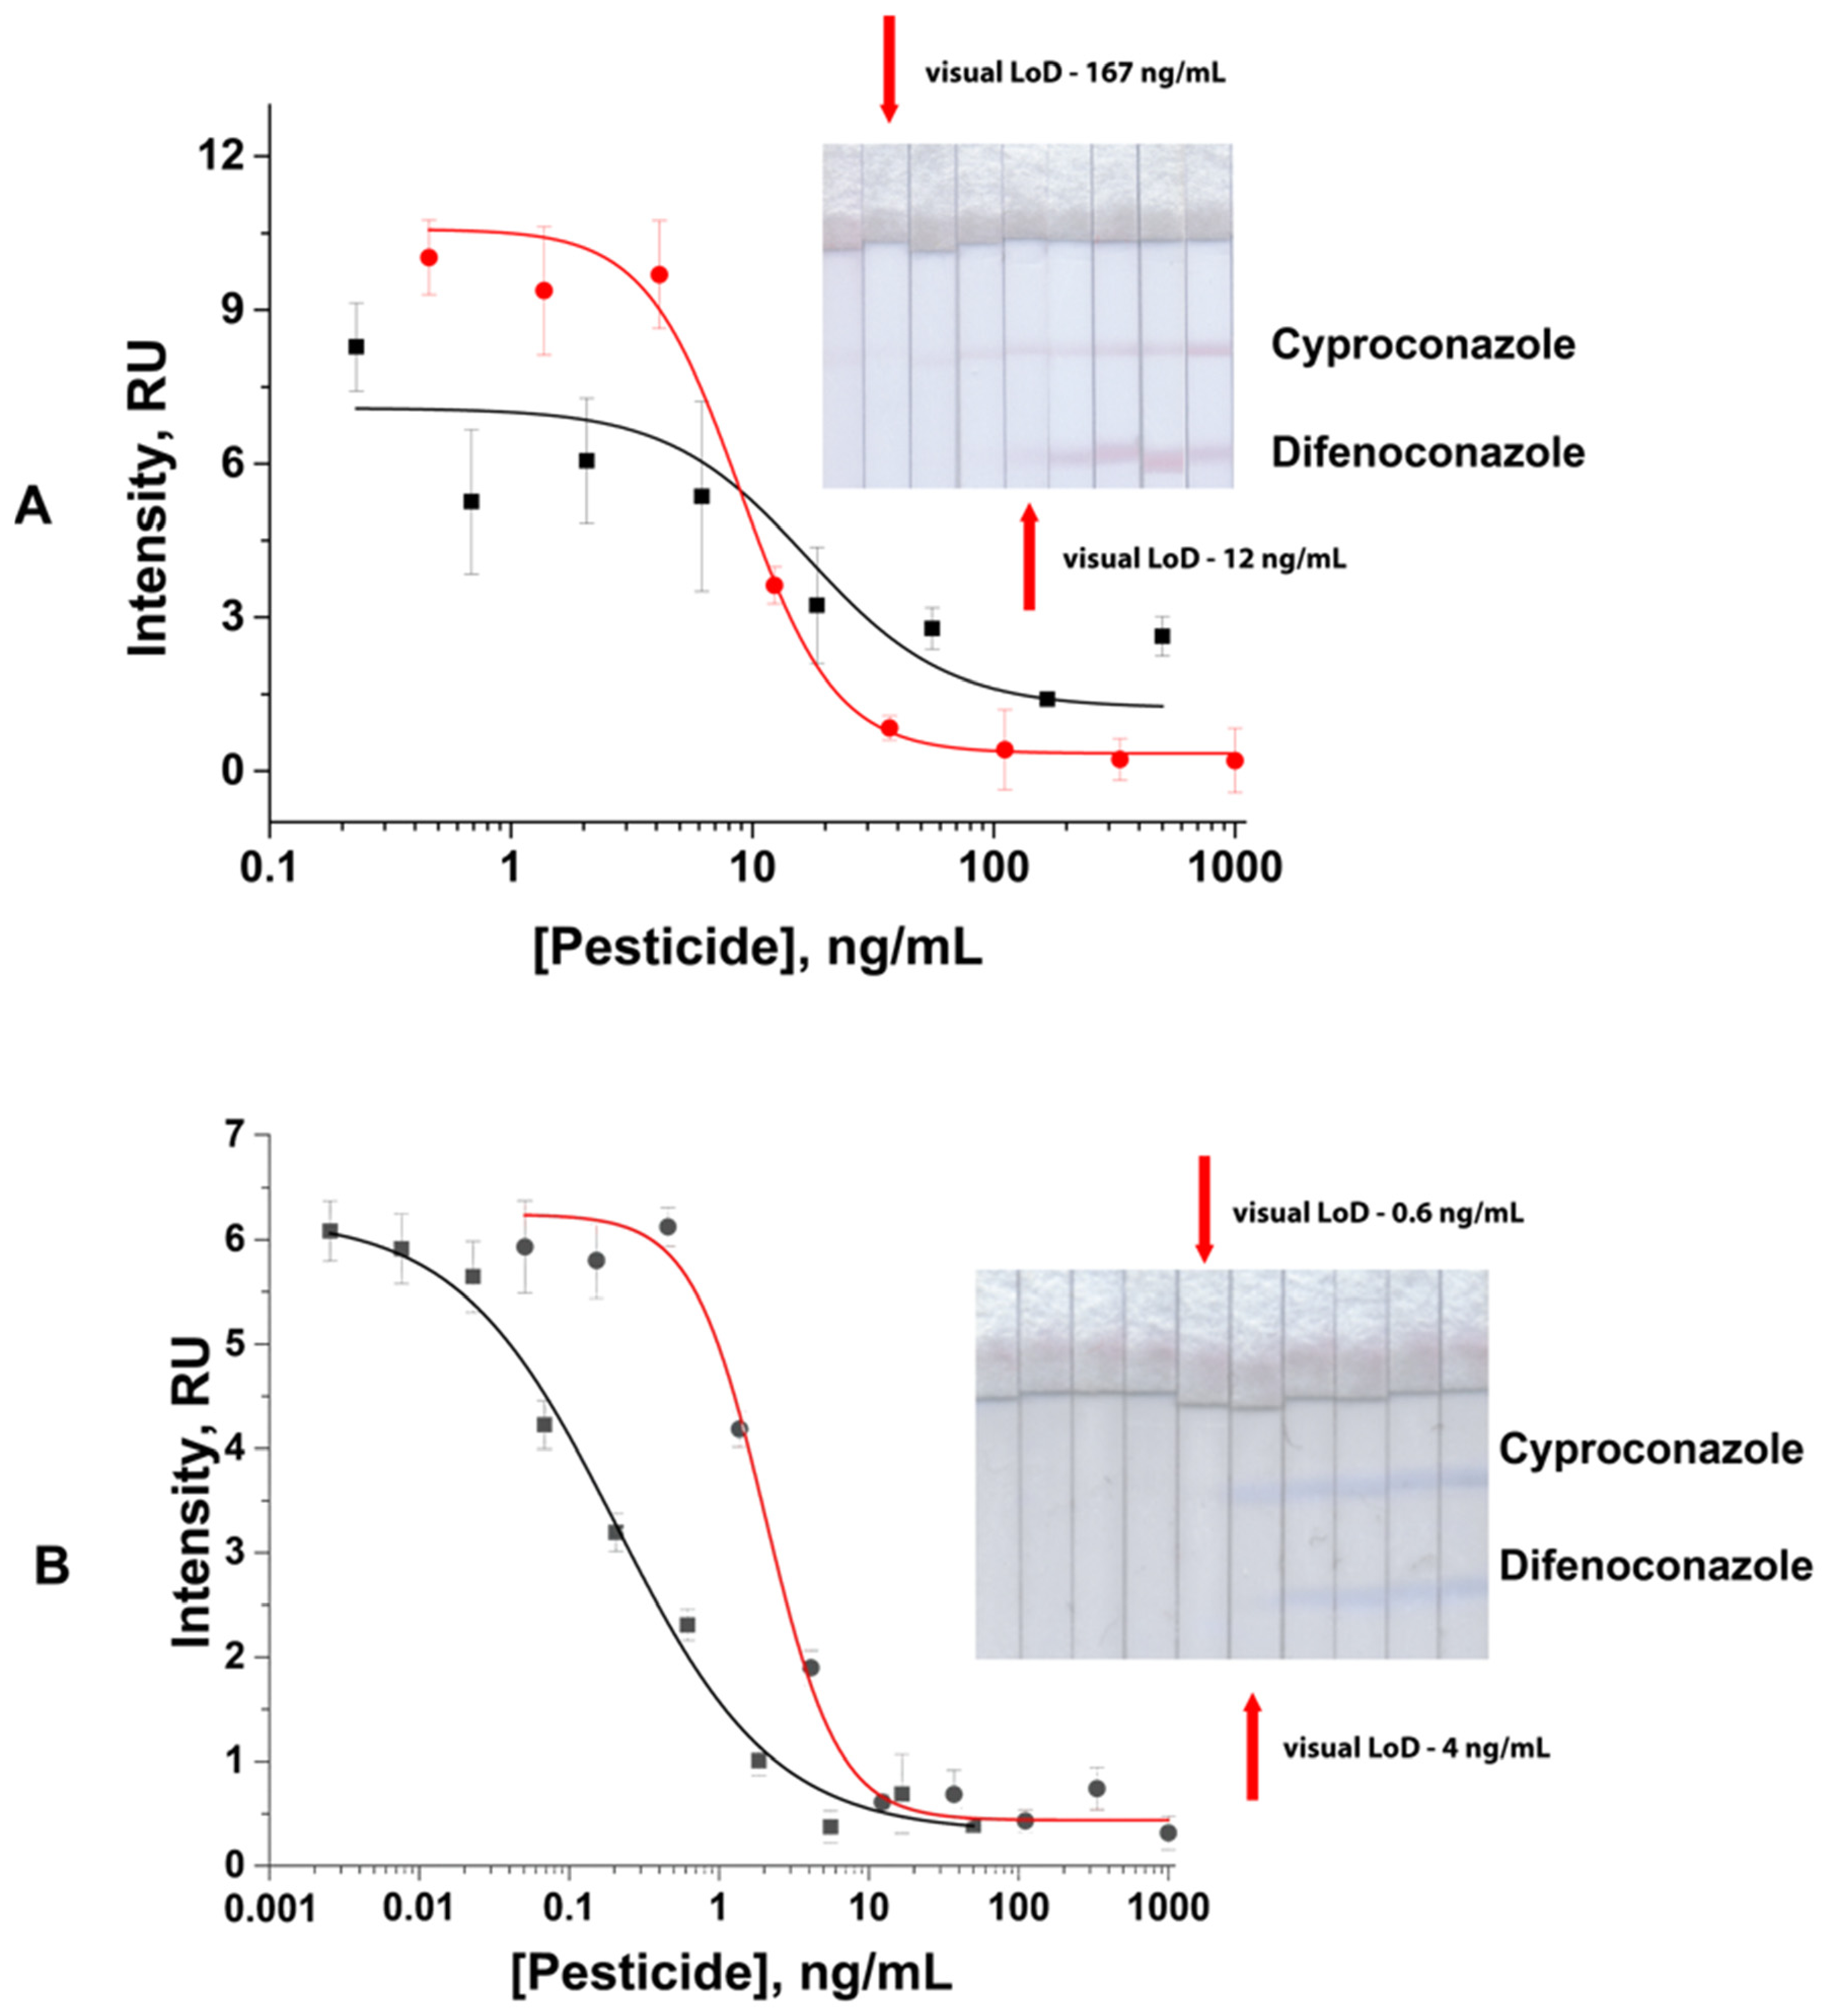
Thus, the results using LFIA based on GNSs were 167 ng/mL and 6.7 ng/mL for visual and instrumental LoD in cyproconazole detection (IC50 16.94 ng/mL, working range 6.8–42.5 ng/mL) and 12 ng/mL and 4.7 ng/mL for visual and instrumental detection (IC50 8.91 ng/mL, working range 4.7–16.7 ng/mL), respectively, in difenoconazole detection (Figure 5A).
Figure 5.
Results of multiparametric LFIA for cyproconazole and difenoconazole detection with spherical GNSs (A) and GNFs (B). Black curve—cyproconazole (for GNSs: y = 1.23 + (7.08− 1.23)/(1 + (x/16.94)1.51), R2 = 0.73; for GNFs: y = 0.32 + (6.21 − 0.32)/(1 + (x/0.21)0.82), R2 = 0.98); red curve—difenoconazole (for GNSs: y = 0.34 + (10.57 − 0.34)/(1 + (x/8.91)2.21), R2 = 0.73; for GNFs: y = 0.43 + (6.24 − 0.43)/(1 + (x/2.04)1.78), R2 = 0.96. All experiments were performed in triplicate; standard deviations are given as error bars.
For LFIA based on GNFs, we chose the order of hapten–protein conjugate immobilization as described above, varying cyproconazole-BSA (1.0 and 0.5 mg/mL) and specific antibody concentration (250, 100, and 50 ng/mL for cyproconazole; 750, 500, and 250 ng/mL for difenoconazole). The results showed that with the lowest antibody concentration, the characteristics of the test system were fully reliable with the established regulatory requirements for cyproconazole and difenoconazole detection, but the intensity of analytical zone coloration was difficult for adequate assessment. Thus, for the final set of the test-system assembly, the following parameters were chosen: specific antibody concentration—100 ng/mL and 500 ng/mL for cyproconazole and difenoconazole, respectively; 0.2 and 0.5 mg/mL of hapten–protein concentration for cyproconazole and difenoconazole, respectively. The data showed the following characteristics for cyproconazole detection: 0.6 ng/mL—visual, 0.03 ng/mL—instrumental, IC50 0.21 ng/mL, working range 0.04–1.1 ng/mL; and for difenoconazole, 4 ng/mL—visual, 1.1 ng/mL—instrumental, IC50 2.04 ng/mL, working range 1.2–4.4 ng/mL (Figure 5B).
The obtained results on the comparison LFIA based on GNSs and GNFs reflect the performance of the two specific assay configurations evaluated in the study. These configurations differed in nanoparticle dimensions and morphology, and optimized immunoreagent concentrations. The demonstrated results show the advantages of using GNFs as LFIA labels for pesticide determination in the optimized conditions, which contribute to the achievement of lower detection limits in the proposed system.
3.5. Approbation of the Developed Multiparametric LFIA
The developed test system was used to determine the target analytes in homogenized plum, cranberry, and cherry extracts under established conditions. Fruits and berries contain various compounds, such as natural pigments, sugars, etc., which may affect the performance of LFIA [36,37]. For instance, natural pigments, such as anthocyanins, may contribute to background coloration and interfere with the visual assessment of analytical line intensity [38]. Sugars and other soluble solids may influence the extract viscosity and, consequently, the capillary flow through the nitrocellulose membrane [39,40].
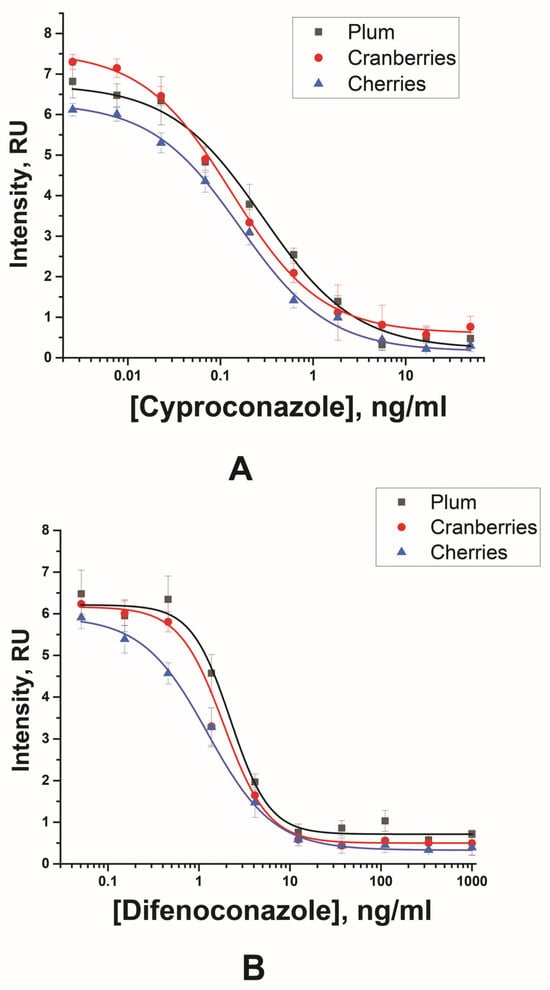
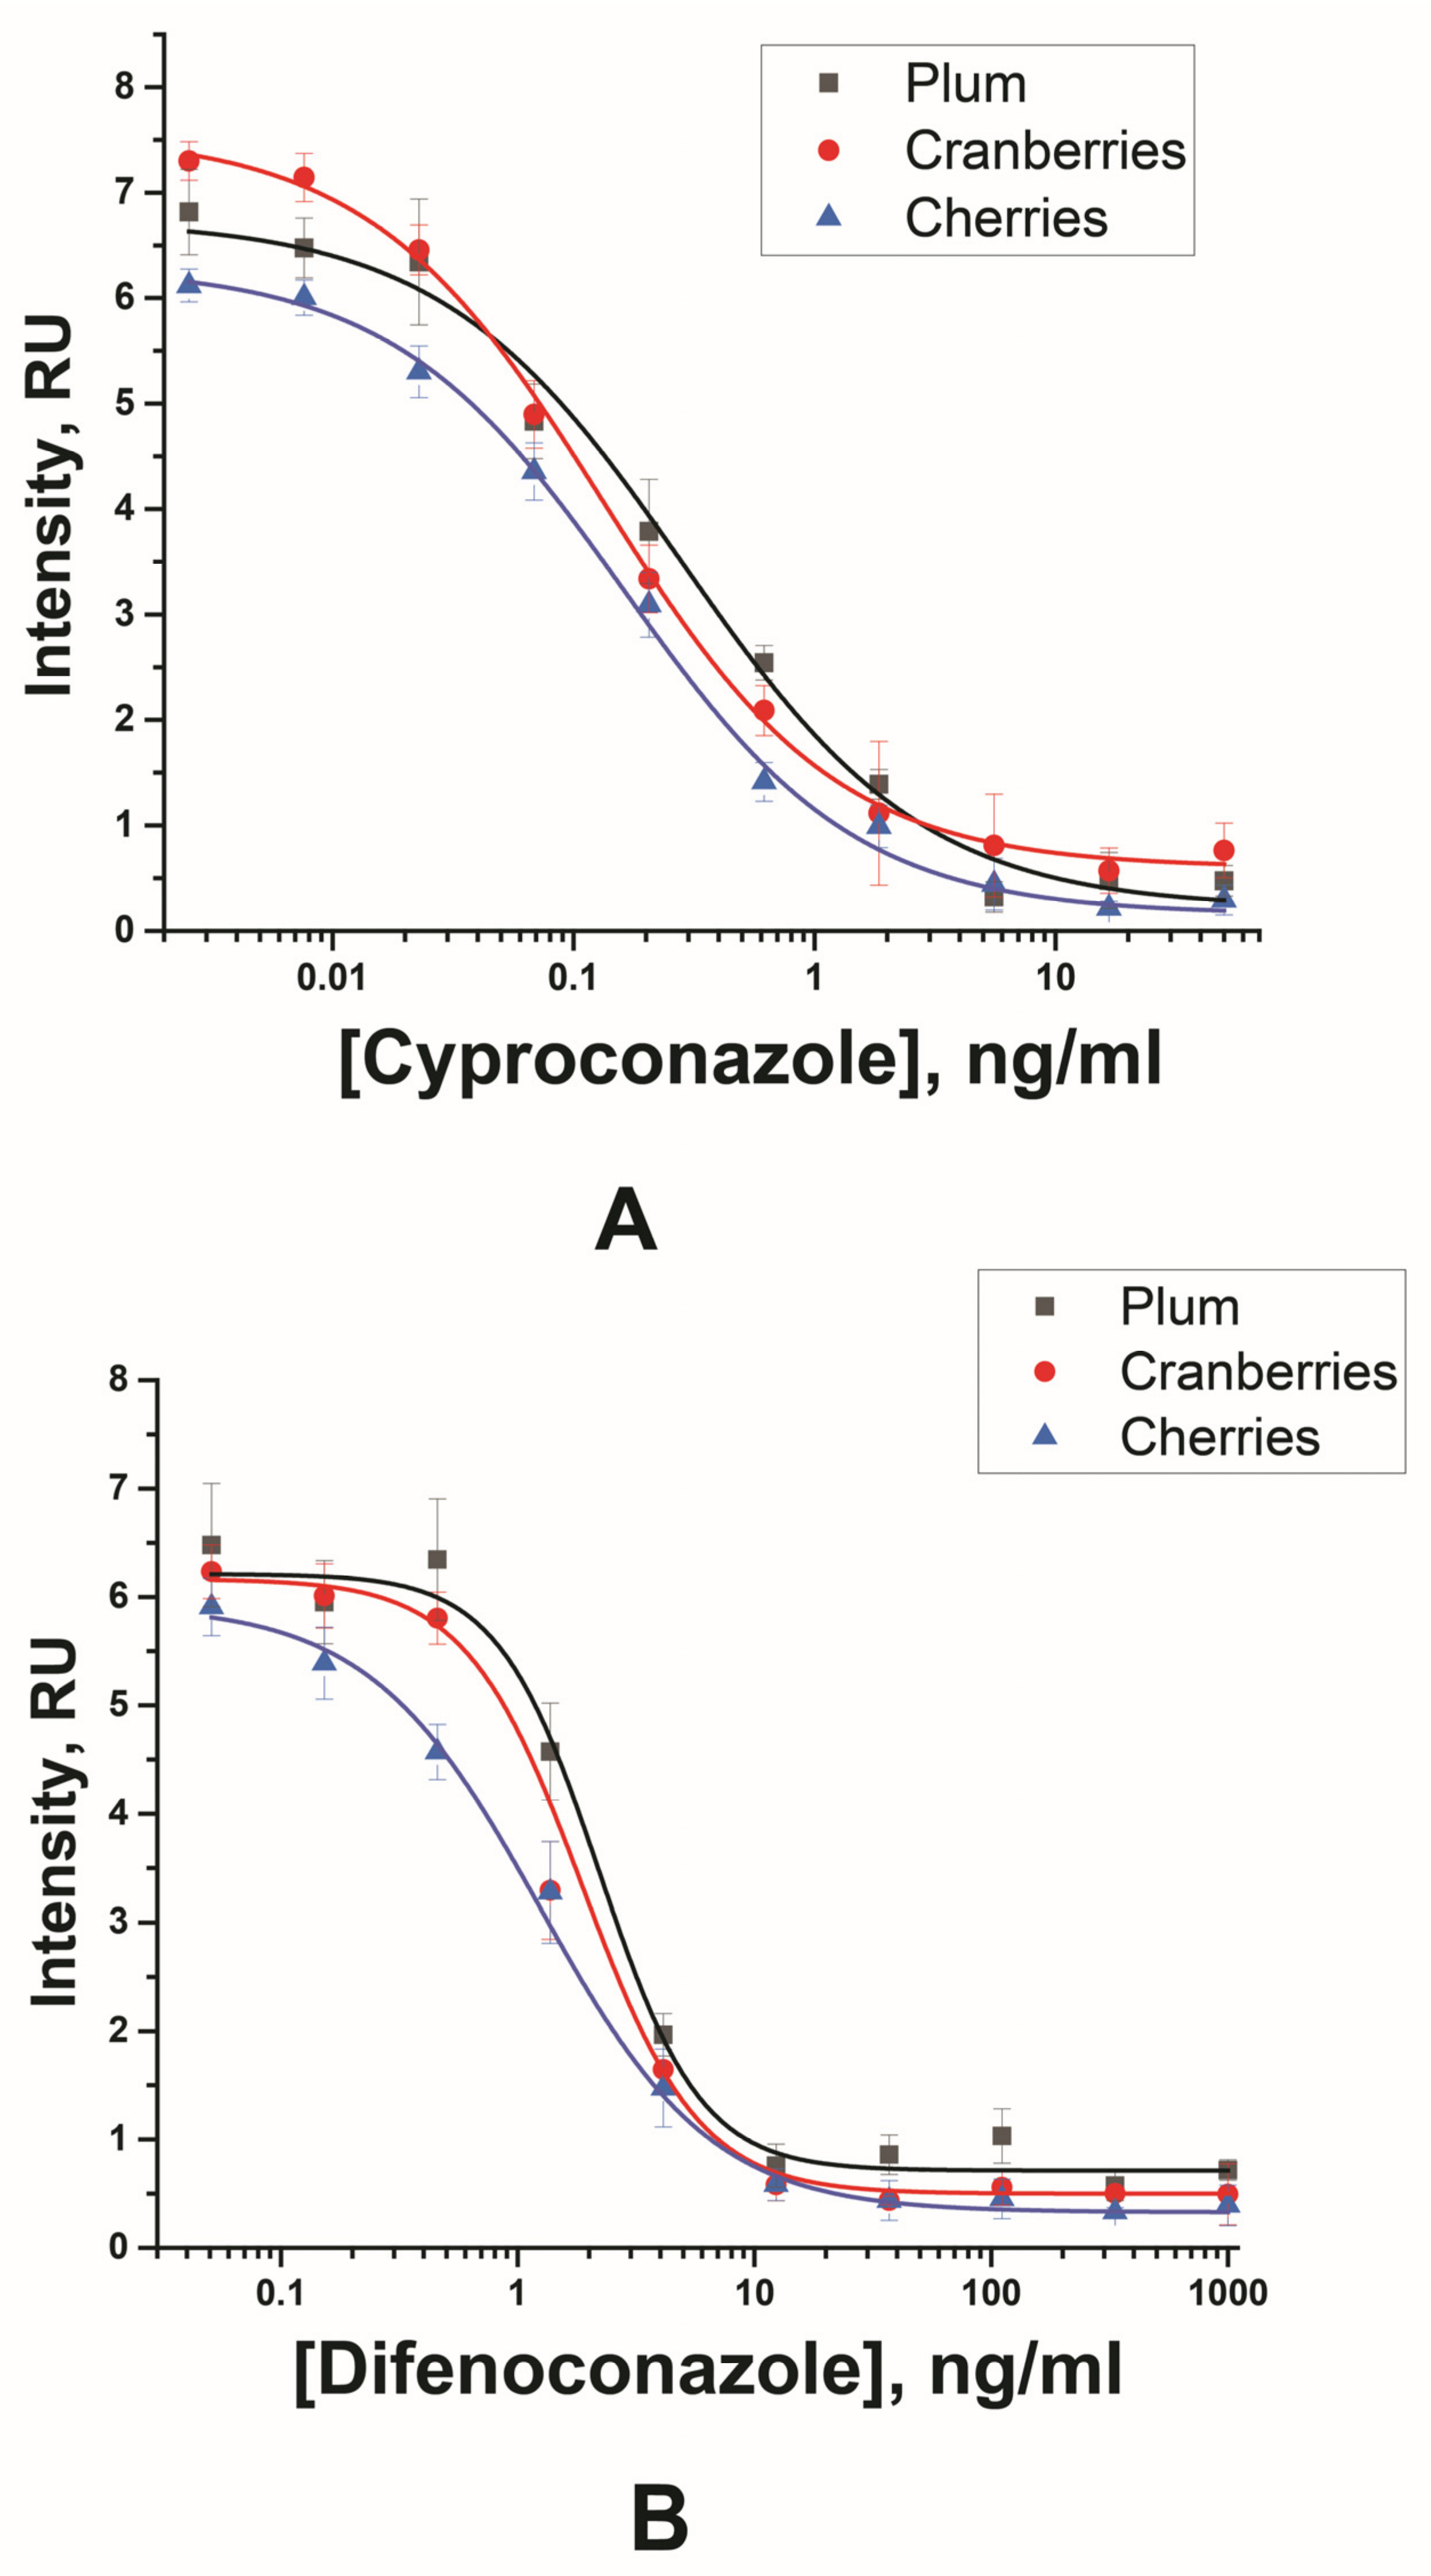
In this study, matrix-related effects were observed when testing diluted extracts. In experiments with 2-, 4-, and 10-fold dilution of the extracts, the passage of the liquid front was difficult; the particles stuck in the starting region of the working membrane, causing full staining in red or purple. The optimal dilution of the extracts for analysis was 20-fold. This dilution ensures minimal staining of the working membrane and the required extract viscosity. The obtained limit of detection considering 20-fold dilution of the samples are shown in Table 1 and Figure 6.
Table 1.
Comparative characteristics of LFIA based on GNFs obtained in 20-time diluted extracts of food samples (n = 3).
Figure 6.
Results of multiparametric LFIA for cyproconazole and difenoconazole detection with GNF in plum, cranberries and cherries for cyproconazole—(A) (plum: y = 0.21 + (6.73 − 0.21)/(1 + (x/0.28)0.86), R2 = 0.98; cranberries: y = 0.6 + (7.55 − 0.6)/(1 + (x/0.13)0.95), R2 = 0.996; cherries: y = 0.15 + (6.29 − 0.15)/(1 + (x/0.16)1.21), R2 = 0.97), and difenoconazole—(B) (plum: y = 0.71 + (6.21 − 0.71)/(1 + (x/2.21) 1.22), R2 = 0.98; cranberries: y = 0.49 + (6.16 − 0.49)/(1 + (x/1.87) 1.76), R2 = 0.995; cherries: y = 0.32 + (5.92 − 0.32)/(1 + (x/1.24)1.21), R2 = 0.997. All experiments were performed in triplicate; standard deviations are given as error bars.
To evaluate the developed LFIA, extracts obtained from fruit and berry were simultaneous spiked with cyproconazole and difenoconazole. As shown in Table 2, the recovery values of cyproconazole from the spiked samples varied between 91 and 113%, and for difenoconazole, the recovery values were in the range of 92 and 119%. The variability observed in replicate measurements should be considered when interpreting the quantitative results. Quantitative estimates should therefore be based on the mean of at least three independent replicate LFIA measurements, with the corresponding standard deviation reported. The recovery results demonstrate agreement of the mean measured concentrations with the fortified levels but should not be interpreted as evidence of high precision for individual measurements. Thus, the developed LFIA demonstrates the ability to simultaneous detect pesticides in pretreated samples of fruits and berries.
Table 2.
Recoveries of cyproconazole and difenoconazole in plum, cranberry and cherry (n = 3).
3.6. Selectivity Testing of the Developed Test System
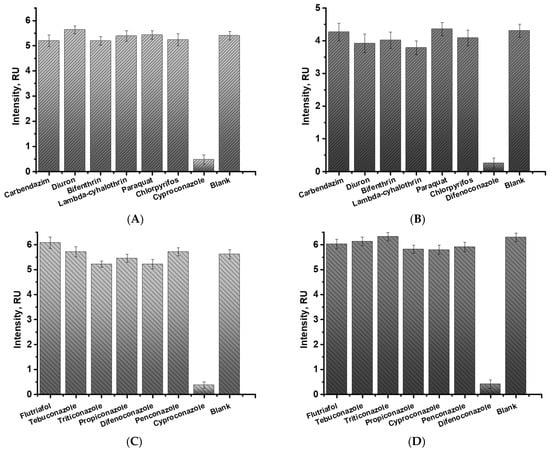
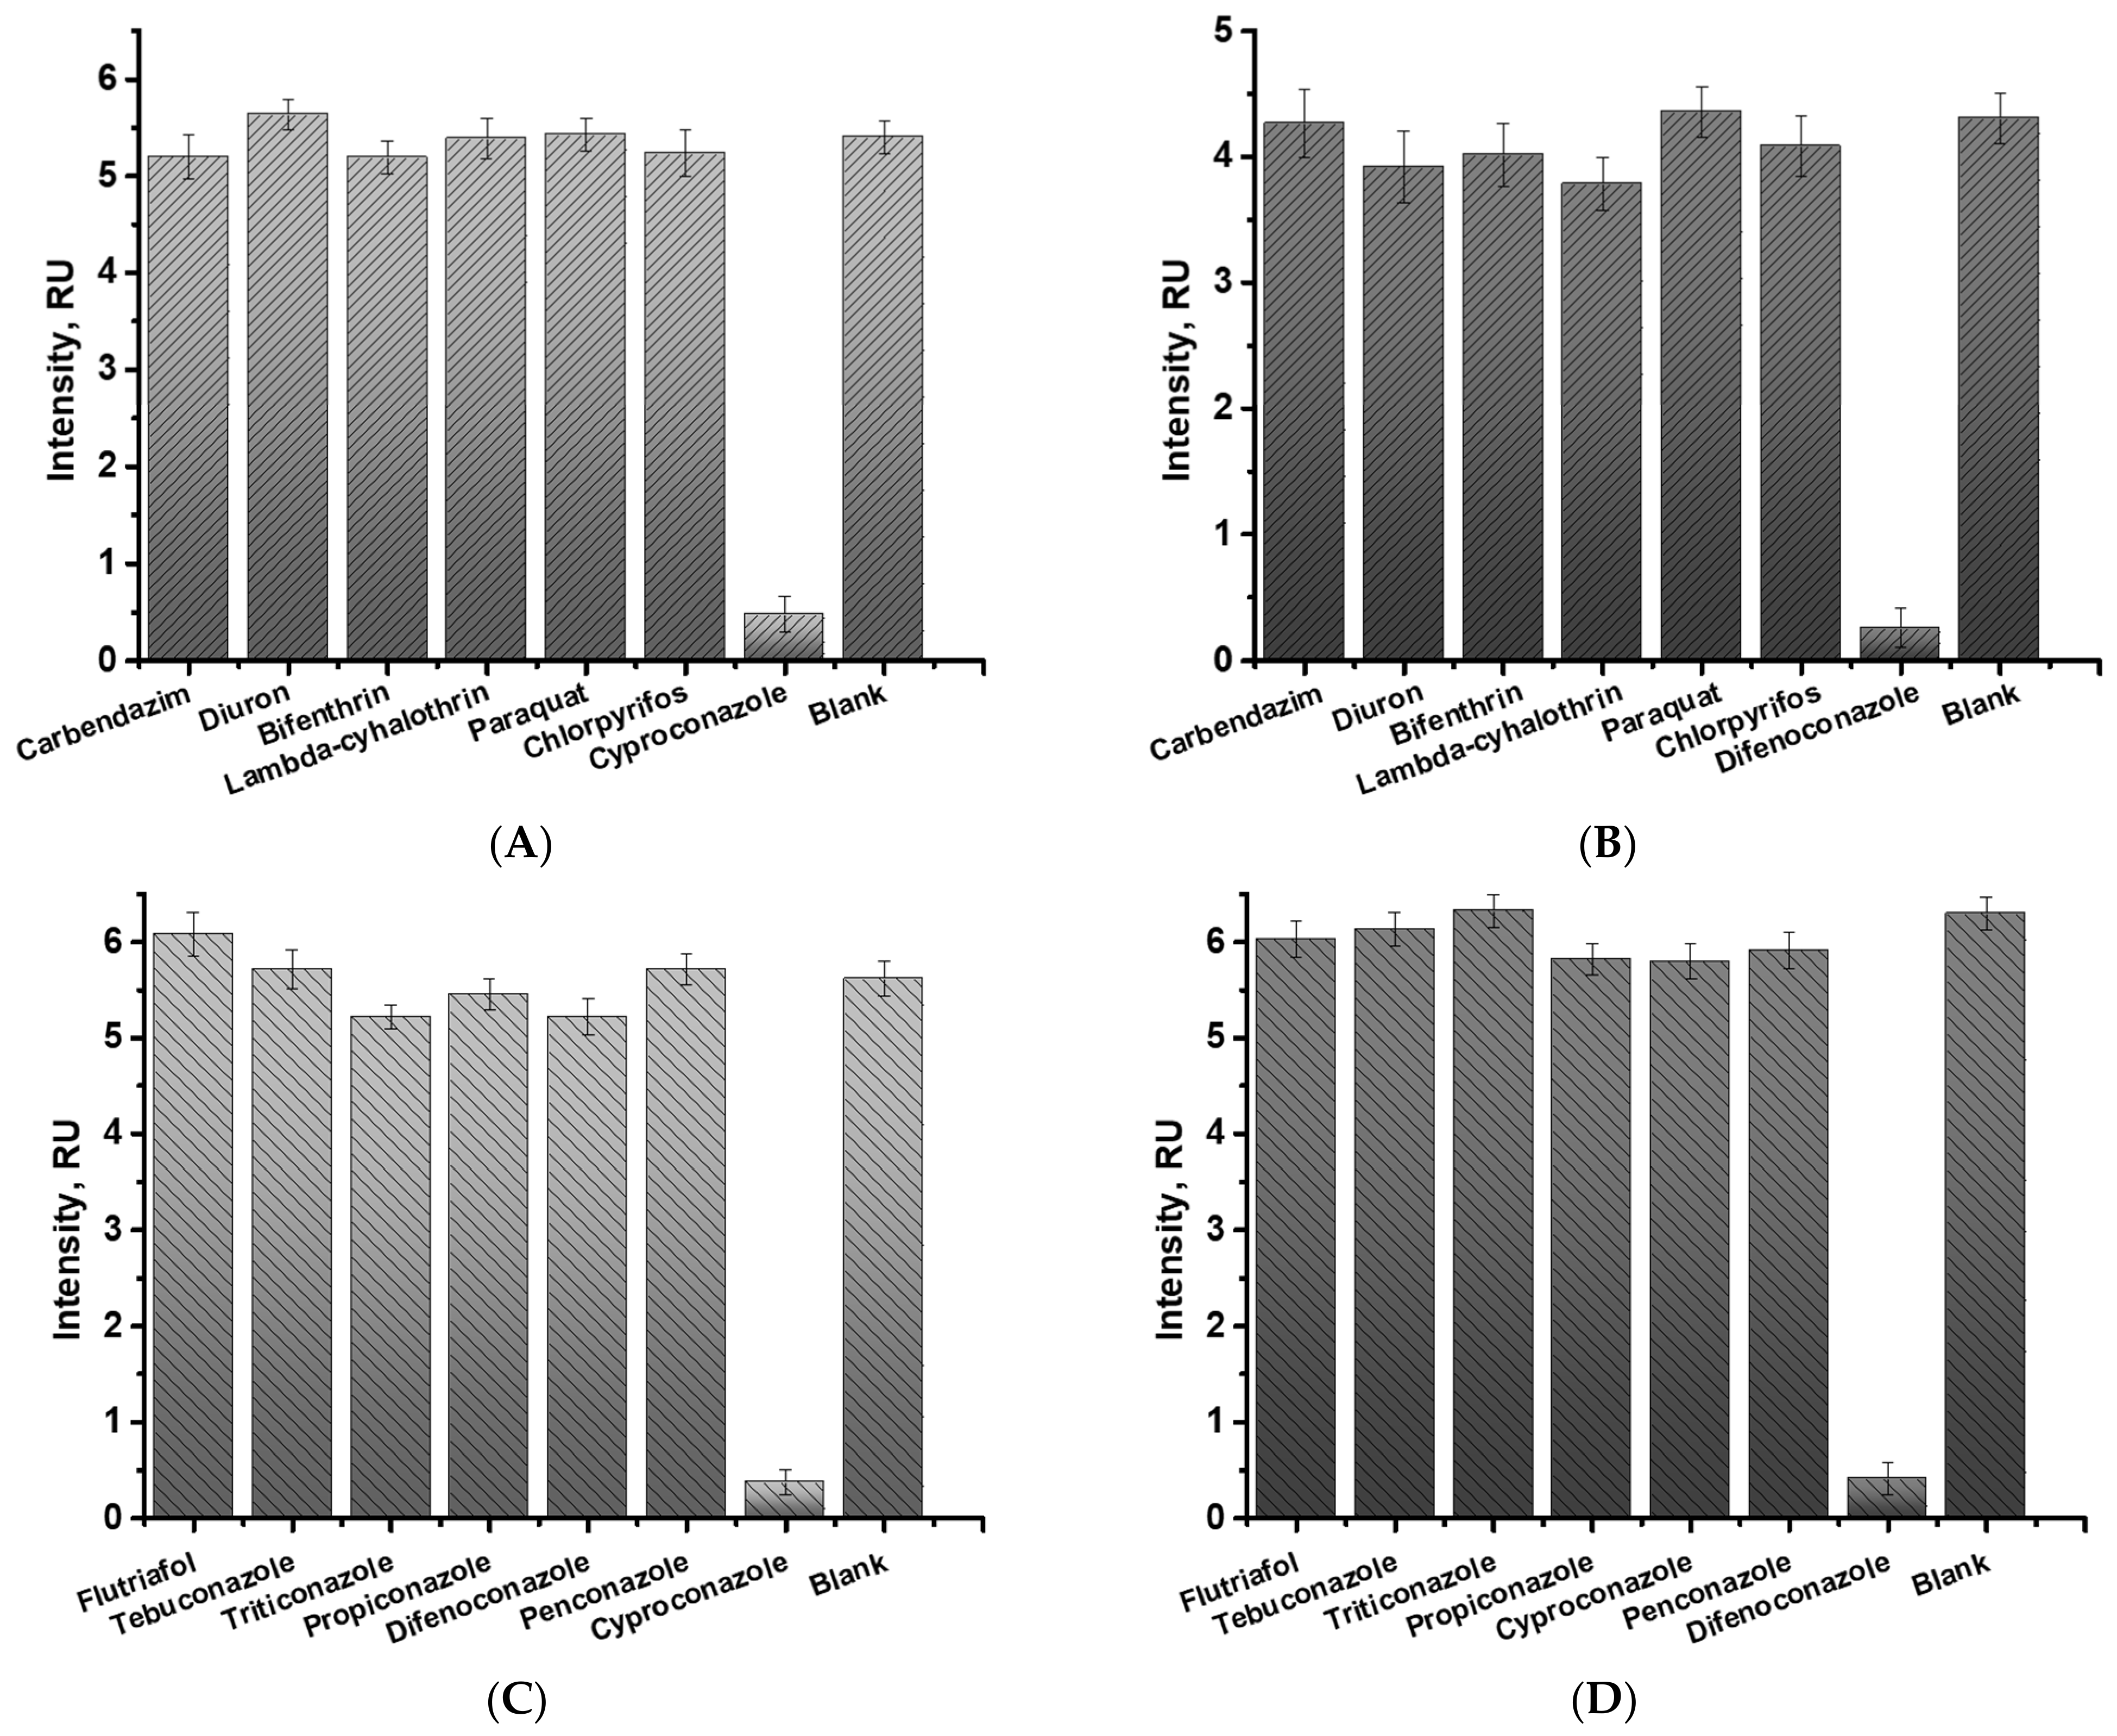
To test the selectivity of the developed test system, additional pesticides of group 1 (carbendazim, diuron, bifenthrin, lambda-cyhalothrin, paraquat, and chlorpyrifos) and group 2 (flutriafol, tebuconazole, triticonazole, propiconazole, penconazole, cyproconazole, and difenoconazole) were studied. Each of the above-mentioned pesticides (300 ng/mL) was added to the sample with anti-cyproconazole or anti-difenoconazole antibodies, GNFs-GAMI conjugate, and then incubated for 5 min. When cyproconazole or difenoconazole (150 ng/mL in the case of selectivity determination with group 1 and 50 ng/mL in the case of selectivity determination with group 2) was added to the sample, the reaction between specific antibodies and target analytes prevented color formation in the analytical zone. In the absence of cyproconazole or difenoconazole, the color intensity in the analytical zone corresponded to the values obtained for the PBS (blank). According to the data obtained (Figure 7), the developed test system shows specific binding only between target analytes and their antibodies.
Figure 7.
Selectivity of multiparametric LFIA to non-target analytes. Color intensities of the analytical zones specific to cyproconazole (A) and (C) and difenoconazole (B) and (D). All experiments were performed in triplicate; standard deviations are given as error bars.
3.7. Comparison of the Developed and Other LFIAs
There are very few published lateral flow immunoassays for the target analytes in this work. All of them are based on the use of spherical gold nanoparticles in different food matrices. For difenoconazole detection, Liu et al. [41] achieved visual and instrumental limits of detection of 5 µg/kg and 2.3–2.6 µg/kg, respectively, in cucumber and pear samples using a conventional GNP-based immunochromatographic assay. Wang et al. [42] reported the achieved LOD of 200 µg/kg (visual) for citrus samples. In contrast, the assay developed in this work provided visual and instrumental detection limits of 80 µg/kg and 16–42 µg/kg, respectively, while simultaneously enabling multiplex determination in fruit and berry matrices.
For cyproconazole, the number of available LFIA methods is even more limited. The recently reported assay by Liu et al. [31] achieved LODs of 10–50 µg/kg in rice, tomato, and grape samples using spherical gold nanoparticles. The multiplex assay developed in the present study achieved a visual detection limit of 12 µg/kg and an instrumental detection limit of 0.4–2 µg/kg in plum, cranberry, and cherry samples, demonstrating high sensitivity while extending the application of LFIA to simultaneous determination of two triazole fungicides in a single test (Table 3). Since the analytes were added after extraction, the LOD values expressed in µg/kg in the table were calculated from the data obtained for the extracts (Table 1), taking into account the dilution factor, sample mass, and extract volume.
Table 3.
Comparative characteristics of LFIAs for cyproconazole and difenoconazole detection.
4. Conclusions
A multiparametric LFIA was developed for the rapid and simultaneous determination of the triazole fungicides cyproconazole and difenoconazole in pretreated samples of fruits and berries. Preliminary testing in fruit and berry matrices was performed using supernatants fortified after sample preparation. Under the optimized conditions, the developed LFIA based on gold nanoflowers showed visual detection limits of 0.6 ng/mL for cyproconazole and 4 ng/mL for difenoconazole, while instrumental detection limits reached 0.01–0.02 ng/mL and 0.20–0.75 ng/mL, respectively. These analytical characteristics for satisfied the regulatory requirements for monitoring established maximum residue limits (MRLs) of difenoconazole in fruit and berry products. For cyproconazole, visual assessment enables the identification of samples with high contamination levels, whereas instrumental readout is required for detection of cyproconazole concentrations that is exceeded the established MRLs [43].
The findings substantiate that the integration of indirect labeling with gold nanoflowers, coupled with instrumental signal registration, constitutes a promising strategy for enhancing the analytical performance of competitive multiparametric LFIA. The proposed approach demonstrated the potential of LFIA based on GNFs and indirect labeling for the multiparametric determination of low-molecular-weight analytes and was a preliminary testing. Further work on developing the proposed approach should include the real contaminated samples, comparison with an independent reference method, and quantitative analysis of mixtures containing both target analytes at different concentrations and ratios.
Author Contributions
Writing—original draft preparation, A.V.B. and L.V.B.; writing—review and editing, A.V.B., L.V.B., A.V.Z., C.X. and B.B.D.; conceptualization, A.V.B., L.V.B. and B.B.D.; formal analysis, A.V.B., L.V.B. and A.V.Z.; investigation, A.V.B., L.V.B. and C.X.; visualization; A.V.B. and L.V.B.; methodology, A.V.B. and L.V.B.; C.X.; resources, C.X. and B.B.D.; data curation, A.V.Z.; validation, A.V.Z.; supervision, A.V.Z. and B.B.D.; project administration, B.B.D.; funding acquisition, C.X. All authors have read and agreed to the published version of the manuscript.
Funding
This study was supported by the Russian Science Foundation. grant number 24-43-00196 (in part of immunoassay development and characterization) and the Ministry of Science and Higher Education (in part of studying nanocarriers and their conjugates).
Institutional Review Board Statement
Not applicable.
Informed Consent Statement
Not applicable.
Data Availability Statement
The original contributions presented in this study are included in the article. Further inquiries can be directed to the corresponding author.
Acknowledgments
Authors are grateful to S.M. Pridvorova from A.N. Bach Institute of Biochemistry (Research Center of Biotechnology of the Russian Academy of Sciences, Moscow, Russia) for the support with TEM images.
Conflicts of Interest
The authors declare no conflict of interest.
References
- Focker, M.; van der Fels-Klerx, H.J. Economics applied to food safety. Curr. Opin. Food Sci. 2020, 36, 18–23. [Google Scholar] [CrossRef] [Scilit]
- Gizaw, Z. Public health risks related to food safety issues in the food market: A systematic literature review. Environ. Health Prev. Med. 2019, 24, 68. [Google Scholar] [CrossRef] [Scilit] [PubMed]
- Grace, D. Burden of foodborne disease in low-income and middle-income countries and opportunities for scaling food safety interventions. Food Secur. 2023, 15, 1475–1488. [Google Scholar] [CrossRef] [Scilit]
- Fung, F.; Wang, H.-S.; Menon, S. Food safety in the 21st century. Biomed. J. 2018, 41, 88–95. [Google Scholar] [CrossRef] [Scilit] [PubMed]
- Raposo, A.; Pérez, E.; Tinoco de Faria, C.; Carrascosa, C. Allergen management as a key issue in food safety. In Food Safety and Protection, 1st ed.; Rai, V.R., Bai, J.A., Eds.; CRC Press: Boca Raton, FL, USA, 2017; pp. 47–68. [Google Scholar]
- Jørgensen, L.N.; Heick, T.M. Azole Use in Agriculture, Horticulture, and Wood Preservation–Is It Indispensable? Front. Cell. Infect. Microbiol. 2021, 11, 730297. [Google Scholar] [CrossRef] [Scilit] [PubMed]
- Regulation (EC) no 396/2005 of the European Parliament and of the Council of 23 February 2005 on Maximum Residue Levels of Pesticides in or on Food and Feed of Plant and Animal Origin and Amending Council Directive 91/414/EEC. Available online: https://eur-lex.europa.eu/legal-content/EN/TXT/PDF/?uri=CELEX:32005R0396 (accessed on 1 August 2026).
- Karnaš Babić, M.; Majić, I.; Dandić, A.; Rastija, V. The future of azoles in agriculture—balancing effectiveness and toxicity. Appl. Sci. 2025, 15, 12902. [Google Scholar] [CrossRef] [Scilit]
- FSA (European Food Safety Authority); ECDC (European Centre for Disease Prevention and Control); ECHA (European Chemicals Agency); EEA (European Environment Agency); EMA (European Medicines Agency); JRC (European Commission’s Joint Research Centre). Impact of the use of azole fungicides, other than as human medicines, on the development of azole-resistant Aspergillus spp. EFSA J. 2025, 23, e9200. [Google Scholar] [CrossRef] [Scilit] [PubMed]
- Draskau, M.K.; Svingen, T. Azole fungicides and their endocrine disrupting properties: Perspectives on sex hormone-dependent reproductive development. Front. Toxicol. 2022, 4, 883254. [Google Scholar] [CrossRef] [Scilit] [PubMed]
- Hester, S.; Moore, T.; Padgett, W.T.; Murphy, L.; Wood, C.E.; Nesnow, S. The hepatocarcinogenic conazoles: Cyproconazole, epoxiconazole, and propiconazole induce a common set of toxicological and transcriptional responses. Toxicol. Sci. 2012, 127, 54–65. [Google Scholar] [CrossRef] [Scilit] [PubMed]
- Roman, D.L.; Voiculescu, D.I.; Ostafe, V.; Ciorsac, A.; Isvoran, A. A review of the toxicity of triazole fungicides approved to be used in European Union to the soil and aqueous environment. Ovidius Univ. Ann. Chem. 2022, 33, 113–120. [Google Scholar] [CrossRef] [Scilit]
- Kotsanopoulos, K.V.; Arvanitoyannis, I.S. The role of auditing, food safety, and food quality standards in the food industry: A review. Compr. Rev. Food Sci. Food Saf. 2017, 16, 760–775. [Google Scholar] [CrossRef] [Scilit] [PubMed]
- Panghal, A.; Chhikara, N.; Sindhu, N.; Jaglan, S. Role of food safety management systems in safe food production: A review. J. Food Saf. 2018, 38, e12464. [Google Scholar] [CrossRef] [Scilit]
- Stachniuk, A.; Fornal, E. Liquid chromatography-mass spectrometry in the analysis of pesticide residues in food. Food Anal. Methods 2016, 9, 1654–1665. [Google Scholar] [CrossRef] [Scilit]
- Aspromonte, J.; Lancioni, C.; Purcaro, G. Solid-phase microextraction—gas chromatography analytical strategies for pesticide analysis. Methods Protoc. 2022, 5, 82. [Google Scholar] [CrossRef] [Scilit] [PubMed]
- Dzantiev, B.B.; Byzova, N.A.; Urusov, A.E.; Zherdev, A.V. Immunochromatographic methods in food analysis. TrAC Trends Anal. Chem. 2014, 55, 81–93. [Google Scholar] [CrossRef] [Scilit]
- Xing, G.; Sun, X.; Li, N.; Li, X.; Wu, T.; Wang, F. new advances in lateral flow immunoassay (LFI) technology for food safety detection. Molecules 2022, 27, 6596. [Google Scholar] [CrossRef] [Scilit] [PubMed]
- Jara, M.D.L.; Alvarez, L.A.C.; Guimarães, M.C.C.; Antunes, P.W.P.; de Oliveira, J.P. Lateral flow assay applied to pesticides detection: Recent trends and progress. Environ. Sci. Pollut. Res. 2022, 29, 46487–46508. [Google Scholar] [CrossRef] [Scilit] [PubMed]
- Bartosh, A.V.; Sotnikov, D.V.; Hendrickson, O.D.; Zherdev, A.V.; Dzantiev, B.B. Design of multiplex lateral flow tests: A case study for simultaneous detection of three antibiotics. Biosensors 2020, 10, 17. [Google Scholar] [CrossRef] [Scilit] [PubMed]
- Wu, Y.; Zhou, Y.; Leng, Y.; Lai, W.; Huang, X.; Xiong, Y. Emerging design strategies for constructing multiplex lateral flow test strip sensors. Biosens. Bioelectron. 2020, 157, 112168. [Google Scholar] [CrossRef] [Scilit] [PubMed]
- Lamprou, E.; Kalligosfyri, P.M.; Kalogianni, D.P. Beyond traditional lateral flow assays: Enhancing performance through multianalytical strategies. Biosensors 2025, 15, 68. [Google Scholar] [CrossRef] [Scilit] [PubMed]
- Fu, Y.-f.; Zhu, J. Current and future opportunities for lateral flow immunoassay strips based on tunable plasmonic properties of gold nanoparticles. Microchim. Acta 2025, 192, 501. [Google Scholar] [CrossRef] [Scilit] [PubMed]
- He, X.; Hao, T.; Geng, H.; Li, S.; Ran, C.; Huo, M.; Shen, Y. Sensitization strategies of lateral flow immunochromatography for gold modified nanomaterials in biosensor development. Int. J. Nanomed. 2023, 18, 7847–7863. [Google Scholar] [CrossRef] [Scilit] [PubMed]
- Chen, X.; Ding, L.; Huang, X.; Xiong, Y. Tailoring noble metal nanoparticle designs to enable sensitive lateral flow immunoassay. Theranostics 2022, 12, 574–602. [Google Scholar] [CrossRef] [Scilit] [PubMed]
- Wang, Y.; Wu, Y.; Wu, Y.; Feng, Z.; Li, D.; Liu, Q. A gold nanoflower particle-based immunochromatographic assay sensor for on-site detection of six species of Salmonella in water and food samples. Anal. Chim. Acta 2025, 1350, 343813. [Google Scholar] [CrossRef] [Scilit] [PubMed]
- Wu, M.; Wu, Y.; Liu, C.; Tian, Y.; Fang, S.; Yang, H.; Li, B.; Liu, Q. Development and comparison of immunochromatographic strips with four nanomaterial labels: Colloidal gold, new colloidal gold, multi-branched gold nanoflowers and Luminol-reduced Au nanoparticles for visual detection of Vibrio parahaemolyticus in seafood. Aquaculture 2021, 539, 736563. [Google Scholar] [CrossRef] [Scilit]
- Liang, R.; Wang, F.; Li, S.; Niu, Y.; Sun, Y.; Hong, S.; Fan, A. A sensitive gold nanoflower-based lateral flow assay coupled with gold staining technique for the detection of SARS-CoV-2 antigen. Microchim. Acta 2024, 191, 434. [Google Scholar] [CrossRef] [Scilit] [PubMed]
- Bartosh, A.V.; Urusov, A.E.; Petrakova, A.V.; Kuang, H.; Zherdev, A.V.; Dzantiev, B.B. Highly sensitive lateral flow test with indirect labelling for zearalenone in baby food. Food Agric. Immunol. 2020, 31, 653–666. [Google Scholar] [CrossRef] [Scilit]
- Hendrickson, O.D.; Byzova, N.A.; Zvereva, E.A.; Zherdev, A.V.; Dzantiev, B.B. Sensitive lateral flow immunoassay of an antibiotic neomycin in foodstuffs. J. Food Sci. Technol. 2021, 58, 292–301. [Google Scholar] [CrossRef] [Scilit] [PubMed]
- Liu, Y.; Guo, L.; Liu, L.; Xu, X.; Kuang, H.; Xu, L.; Xu, C. Immunoassay for the detection of cyproconazole in foods: From hapten synthesis to the establishment of a gold immunochromatographic assay. Food Chem. 2024, 437, 137847. [Google Scholar] [CrossRef] [Scilit] [PubMed]
- Frens, G. Controlled nucleation for the regulation of the particle size in monodisperse gold suspensions. Nat. Phys. Sci. 1973, 241, 20–22. [Google Scholar] [CrossRef] [Scilit]
- Taranova, N.A.; Byzova, N.A.; Pridvorova, S.M.; Zherdev, A.V.; Dzantiev, B.B. Comparative assessment of different gold nanoflowers as labels for lateral flow immunosensors. Sensors 2021, 21, 7098. [Google Scholar] [CrossRef] [Scilit] [PubMed]
- Barshevskaya, L.V.; Zvereva, E.A.; Zherdev, A.V.; Dzantiev, B.B. Highly sensitive lateral flow flow immunodetection of the insecticide imidacloprid in fruits and berries reached by indirect antibody–label coupling. Foods 2025, 14, 25. [Google Scholar] [CrossRef] [Scilit] [PubMed]
- Uhrovčík, J. Strategy for determination of LOD and LOQ values–some basic aspects. Talanta 2014, 119, 178–180. [Google Scholar] [CrossRef] [Scilit] [PubMed]
- Ayub, H.; Nadeem, M.; Mohsin, M.; Ambreen, S.; Khan, F.A.; Oranab, S.; Rahim, M.A.; Zubair, M.K.; Zongo, E.; Zarlasht, M.; et al. A comprehensive review on the availability of bioactive compounds, phytochemicals, and antioxidant potential of plum (Prunus domestica). Int. J. Food Prop. 2023, 26, 2388–2406. [Google Scholar] [CrossRef] [Scilit]
- Karim, N.; Rashwan, A.K.; Liu, S.; Tangpong, J.; Lin, T.; Chen, W. An updated review on chemical compositions, biological capabilities, and clinical benefits of cranberries. Food Biosci. 2023, 54, 102877. [Google Scholar] [CrossRef] [Scilit]
- Nuntawong, P.; Putalun, W.; Tanaka, H.; Morimoto, S.; Sakamoto, S. Lateral flow immunoassay for small-molecules detection in phytoproducts: A review. J. Nat. Med. 2022, 76, 521–545. [Google Scholar] [CrossRef] [Scilit] [PubMed]
- Chen, C.; Xia, J.; Wang, J.; Wei, H.; Liang, Q.; Feng, Z.; Cai, H.; Fang, Q.; Hou, R.; Li, H. Comparative Assessment of Gold and Carbon Nanoparticles as Tags for Lateral Flow Immunoassay of Fenpropathrin in Green Tea. Foods 2025, 14, 2806. [Google Scholar] [CrossRef] [Scilit] [PubMed]
- Liang, X.; Kim, H.; Nguyen, T.M.; Wang, K.; Li, C.; Lee, S.; Zeng, J.; Choo, J. Advances in intelligent multi-mode lateral flow assays: From multi-metallic nanomaterials to smart analytical integration. Chem. Soc. Rev. 2026, 55, 5039–5079. [Google Scholar] [CrossRef] [Scilit] [PubMed]
- Liu, J.; Xu, X.; Wu, A.; Song, S.; Xu, L.; Xu, C.; Liu, L.; Kuang, H. Rapid and sensitive determination of difenoconazole in cucumber and pear samples using an immunochromatographic assay. Food Biosci. 2022, 47, 101745. [Google Scholar] [CrossRef] [Scilit]
- Wang, R.; Gong, M.; Liu, Y.; Zhu, W.; Zhang, K.; Zhao, Y.; Yin, C.; Liu, Y.; Wang, J.; Wan, Y. Development of a highly sensitive colloidal gold semiquantitative method for the determination of difenoconazole residues in citrus. Front. Nutr. 2024, 11, 1341219. [Google Scholar] [CrossRef] [Scilit] [PubMed]
- Pesticide Residue(s) and Maximum Residue Levels. Available online: https://ec.europa.eu/food/plant/pesticides/eu-pesticides-database/start/screen/mrls/details?lg_code=EN&pest_res_id_list=266&product_id_list= (accessed on 1 August 2026).

Disclaimer/Publisher’s Note: The statements, opinions and data contained in all publications are solely those of the individual author(s) and contributor(s) and not of MDPI and/or the editor(s). MDPI and/or the editor(s) disclaim responsibility for any injury to people or property resulting from any ideas, methods, instructions or products referred to in the content. |
© 2026 by the authors. Licensee MDPI, Basel, Switzerland. This article is an open access article distributed under the terms and conditions of the Creative Commons Attribution (CC BY) license.