


Abstract
Paper-based colorimetric devices could support decentralized screening of cholinesterase inhibition after organophosphate (OP) exposure. We systematically evaluated how substrate identity, concentration and volume, reagent hydration, reading time, glycerol addition, and serum volume affect color development in a two-layer platform comprising a glass-fiber (LF1) reaction layer and a pH-indicator detection layer. Acetylcholine chloride (AChCl), butyrylcholine chloride (BChCl), and butyrylcholine iodide were first screened in solution; AChCl and BChCl were then tested on paper with commercial serum and six individual human sera, and color was quantified as blue-channel intensity from scanned images of the pH-indicator. A working configuration using 8 µL of 60 mM substrate, with readings taken after 20 min, was selected based on the observed colorimetric response. AChCl and BChCl did not differ significantly under these conditions, and larger serum volumes gave no consistent improvement. The selected configuration was 4 µL of serum and 8 µL of 60 mM AChCl containing 5% (v/v) glycerol. Commercial serum-only controls without added substrate shifted the indicator from yellow to green, showing a sample-related contribution to the basal indicator color that may influence the final RGB signal. In a separate exploratory comparison using BChCl, blue-channel intensity was not significantly correlated with pre-treatment reference cholinesterase activity in the six human sera. These results provide a working configuration for further microdevice development and highlight the need to account for sample background.
1. Introduction
OP pesticides remain widely used in agriculture, and exposure to them is a persistent concern for agricultural workers and for people living near farming areas [1]. The toxic effects of OPs are primarily related to the inhibition of cholinesterase enzymes, resulting in the accumulation of acetylcholine and overstimulation of cholinergic pathways. Depending on the level and duration of exposure, this may lead to neurological, respiratory, and systemic effects and, in severe cases, life-threatening cholinergic toxicity [2]. Monitoring cholinesterase activity is therefore central to the surveillance of exposed populations. Baseline enzyme activity, however, may differ considerably among individuals due to genetic and physiological factors [3], so a single measurement is difficult to interpret, and inhibition is best assessed against each person’s own baseline or previous results [4]. Effective surveillance thus depends on measurements that can be repeated frequently and performed close to where exposure occurs.
Two cholinesterases serve as biomarkers of exposure: AChE, which is mainly associated with erythrocytes and neuronal tissues, and BChE, which is predominantly found in plasma and serum [5,6]. Both are inhibited by OP and carbamate pesticides, and erythrocyte AChE and plasma or serum cholinesterase activities provide complementary information on exposure [7,8]. Plasma cholinesterase is routinely measured with automated clinical analyzers, which provide reliable reference values [9]. These methods, however, require laboratory infrastructure, specialized instruments, and trained personnel, which limits their use for rapid screening in rural settings or wherever access to a laboratory is restricted [10,11].
Paper-based analytical devices offer an alternative for decentralized testing. They are inexpensive and easy to fabricate, require only microliter volumes of sample and reagents, and move fluids by capillary action without external pumps [11,12]. Colorimetric formats are particularly attractive because the result can be read by eye or quantified from digital images [11,13]. For cholinesterases, a simple readout exploits the acid released during substrate hydrolysis, which lowers the pH and changes the color of an indicator. Many paper-based cholinesterase assays instead use acetylthiocholine with a chromogenic reagent for thiocholine [14,15], whereas pH-based detection with choline esters has received less attention [16], despite requiring only a substrate and a commercially available indicator.
For a device intended to analyze the cell-free fraction of whole blood, the substrate must be readily hydrolyzed by BChE, the predominant cholinesterase in plasma and serum, and must release enough acid to produce a visible color change. BChE hydrolyzes both acetylcholine and butyrylcholine, so both substrate families are candidates. AChCl, BChCl, and BChI form a useful comparison set: AChCl and BChCl differ in the acyl group but share the counterion, whereas BChCl and BChI differ only in the counterion.
The choice of substrate is only part of the problem. On paper, color development also depends on substrate concentration [17,18], reagent composition, fluid transport, evaporation, and sample and reagent volumes [19]. Dried reagents must rehydrate adequately when the sample is applied [11], so suitable volumes and hydration conditions must be established for each paper matrix and assay format [20]. Image-based measurements additionally require standardized lighting, acquisition geometry, and processing [21,22]. Evaporation is a particular concern in small reaction zones. Glycerol can reduce water evaporation from aqueous solutions and could help keep the reaction zone moist [23]. However, glycerol also modifies solution viscosity, so its effect on the colorimetric response must be tested experimentally [24].
We previously developed a portable paper-based colorimetric biosensor for cholinesterase screening in human capillary blood using the Edson method, as modified by Limperos and Ranta, and RGB image analysis [25]. The next step toward a field device is a two-layer format in which LF1 paper serves as the reaction support and pH indicator paper serves as the detection layer, so that the assay can eventually operate on the cell-free fraction separated from a small whole-blood sample. To our knowledge, the effects of substrate formulation and assay conditions on color development in this two-layer LF1/pH-indicator format have not been systematically evaluated. This initial step was intended to guide the reaction and colorimetric readout zones of a future field microdevice. Here, we systematically evaluated the effects of substrate type, concentration and volume, serum volume, prior substrate drying, reading time, and glycerol addition on the colorimetric response of the two-layer LF1/pH-indicator paper platform. Commercial serum and serum from female and male volunteers were used to assess the response across different samples. We also examined the contribution of untreated and heat-treated serum to the indicator color. These experiments defined a working assay configuration and highlighted the need to account for sample-related color contributions before interpreting absolute RGB intensity as a quantitative measure of cholinesterase activity. In contrast with our previous device [25], which applied the Edson tintometric principle to capillary whole blood, the present format separates the reaction (LF1) and detection (pH-indicator paper) functions and is intended to operate on the cell-free fraction, thereby targeting plasma/serum cholinesterase, predominantly BChE. Unlike earlier pH-strip assays of acetylcholinesterase [17], the enzyme source here is human serum, whose own pH and buffering capacity become part of the measured signal. The main contributions of this work are: (i) a systematic map of how substrate identity, concentration and volume, reagent hydration, reading time, glycerol, and serum volume affect color development in a two-layer glass-fiber/pH-indicator format operated with serum; (ii) the identification of a sample-related contribution to the indicator color, highlighting the need to evaluate a sample-referenced readout; and (iii) operating conditions and design requirements for the reaction and readout zones of an integrated microdevice.
2. Materials and Methods
2.1. Reagents and Materials
Acetylcholine chloride, butyrylcholine chloride, butyrylcholine iodide, bromothymol blue (BTB), and glycerol were purchased from Sigma-Aldrich (Merck, Darmstadt, Germany). The three cholinergic substrates were evaluated for their colorimetric responses. Ultrapure water obtained using a Milli-Q purification system (Merck Millipore) was used to prepare the solutions. Whatman LF1 paper (Cytiva Little Chalfont, Amersham, United Kingdom; Cat. No. 8121-1750) was used as the reaction support, and pH indicator paper with a transition range of 6.4–8.0 (MACHEREY-NAGEL GmbH & Co. KG, Duren, Germany; Cat. No. 90210) was used for color detection. Commercial human serum (Merck KGaA, Darmstadt, Germany) and serum samples collected from volunteers were used in this study.
2.2. Serum Samples and Ethical Considerations
Serum samples were collected from healthy male and female volunteers aged 25–30 years. The study was approved by the Scientific Ethics Committee of the University of Talca (SEC-UTALCA) on 28 April 2026 (Approval No. 43/2024/E). The committee is accredited by the Regional Ministerial Secretariat of Health of Maule (SEREMI de Salud del Maule), under Exempt Resolution No. 1976, dated 28 September 2022. All participants provided written informed consent before sample collection. Blood samples were collected by venipuncture in tubes, and serum was separated by centrifugation at 3000× g for 5 min at room temperature. Samples were stored at −20 °C until analysis. Commercial serum and serum from male and female volunteers were included to explore whether the effects of substrate formulation and assay conditions were consistent across different samples. Commercial serum provided a common matrix for technical replicate measurements, whereas independent human samples allowed an initial assessment of between-sample variability. Six individual human serum samples were included, one from each of three female and three male volunteers. Samples were analyzed separately and were not mixed. This small donor set was used to explore response trends across individual sera, not to draw population-level conclusions. Cholinesterase activity was measured individually using a Cobas c311 analyzer and the CHE2 kit (Roche Diagnostics GmbH, Mannheim, Germany). Individual activities are reported in Table 1.
Table 1.
Baseline serum cholinesterase activity and post-treatment activity of commercial serum used as a paper-assay control.
2.3. Evaluation of Cholinergic Substrates Under Liquid Conditions
AChCl, BChCl, and BChI were evaluated in microcentrifuge tubes at concentrations ranging from 10 to 60 mM. Serum volumes of 4, 6, and 8 µL were combined with 4 µL of bromothymol blue (BTB; 0.04% w/v) and substrate volumes of 4 or 8 µL. Reactions were incubated at 20 °C for 20 min and photographed using a smartphone camera. Commercial serum (Merck) was used, and each condition was tested in three technical replicates. AChCl and BChCl were selected for subsequent paper-based experiments based on the observed color change. These preliminary tests were assessed by visual inspection of the color changes in the BTB-containing reaction mixtures. RGB measurements were not performed at this stage, as the main objective was to identify clear and easily distinguishable color changes rather than subtle differences in color intensity. Since pronounced color changes were expected, visual inspection was considered sufficient for this initial evaluation.
2.4. Paper-Based Experimental Platform
The experimental platform consisted of two square paper sections (4 mm × 4 mm): LF1 paper as the reaction zone and pH indicator paper for color detection. Both were mounted on opposite sides of a symmetric transparent plastic support, which remained flat (180° open configuration) during the reaction, keeping the papers separated. The substrate was first deposited onto the LF1 paper, followed by the addition of serum. After the specified reaction time (immediately or after 20 min), the two paper sections were brought into contact and gently pressed together by hand for 5 s, transferring the reaction mixture to the indicator paper and producing the colorimetric response. Applied pressure, alignment, and contact area were not controlled mechanically, and transfer reproducibility was not quantified. This manually operated laboratory-scale setup, termed the “stamp”, was used to evaluate the reaction and colorimetric detection conditions before development of the final integrated point-of-care microdevice. Basal color controls of pH paper with the liquids were evaluated using AChCl and BChCl, with and without glycerol, as well as ultrapure water, untreated serum, and heat-treated serum. For the serum-only paper controls, commercial serum (Merck) was heated at 60 °C for 30 min before application to the LF1 paper.
2.5. Evaluation of Substrate Formulation and Reaction Conditions
AChCl and BChCl were evaluated on paper at 30 and 60 mM using substrate volumes of 4 and 8 µL. The eight resulting formulations were prepared with and without 5% glycerol (v/v) and tested with serum volumes of 4, 6, and 8 µL. Glycerol concentration refers to the substrate solution before serum addition. Substrate concentrations refer to the prepared solutions before serum addition. Four experimental conditions were evaluated using the laboratory-scale “stamp” platform and substrate solutions with and without glycerol. In the first two conditions (SI and S20), the substrate was applied to the LF1 paper and dried at 50 °C for 20 min before serum addition. Colorimetric readings were then taken immediately (SI) or after 20 min (S20). In the other two conditions (HI and H20), the substrate was applied without prior drying, and readings were taken immediately (HI) or after 20 min (H20).
RGB intensities were measured using ImageJ software (version 1.54u8, National Institutes of Health, Bethesda, MD, USA). The blue channel was selected because its intensity decreased as the indicator paper turned yellow. Each formulation was evaluated at each serum volume and under each application and reading condition. Commercial serum was tested in three technical replicates from a single Merck vial. Human serum was obtained from three female and three male donors, with each sample tested separately once per condition. Each formulation at each serum volume therefore included three measurements per serum group. The same donor samples were used throughout the experiments, and sera were not mixed. The individual donor was the biological experimental unit (n = 3 per sex). Measurements obtained under different experimental conditions from the same donor were treated as repeated observations rather than independent biological replicates. All experiments and measurements were conducted under ambient laboratory conditions at 20 °C and 60% relative humidity.
2.6. Evaluation of Serum Volume and Comparison of Selected Assay Conditions
Serum volumes of 4, 6, and 8 µL were evaluated using 8 µL of AChCl or BChCl at 60 mM with 5% glycerol, without prior substrate drying and with reading after 20 min (H20). BChCl was used for this exploratory comparison because the reference method relies on butyrylthiocholine; using a butyryl-ester substrate was intended to reduce differences in substrate specificity between the paper response and the reference measurement. The effect of glycerol was assessed by comparing formulations with and without glycerol at each serum volume in commercial, female, and male serum. Blue-channel intensity obtained with BChCl under H20, using 4 µL of serum and 8 µL of substrate at 60 mM with 5% glycerol, was compared with the individual pre-treatment cholinesterase activities measured using the Cobas c311 analyzer. Each paper-based reading was paired with the reference activity of the same donor. This comparison included the six human serum samples; commercial serum was excluded from the correlation analysis.
2.7. Image Acquisition and RGB Analysis
Images of the liquid-phase assays were acquired using a smartphone camera. Paper-based assays were digitized using a Brother DCP-1600 series scanner at 600 dpi, maintaining the same orientation for all samples. Images were saved in JPEG format and analyzed using ImageJ. Red, green, and blue channel intensities were measured within regions of interest of the same size, positioned over the indicator reaction zone. The blue channel was used to compare paper-based responses across substrate formulations, serum groups, and serum volumes. The use of blue-channel intensity was guided by our previous paper-based assay [25] and the color transition observed in the present experiments. Its performance against Cobas activity was not compared with that of other color metrics.
2.8. Statistical Analysis
Data are presented as mean ± SD. Analyses were performed separately for commercial, female, and male serum. Two-way ANOVA was used to evaluate substrate formulation and serum volume within each application and reading condition, and substrate formulation and application/reading condition at each serum volume. Under H20, serum volume was analyzed together with substrate type or substrate formulation with and without glycerol. For human serum, repeated-measures two-way ANOVA was used for both factors, with measurements matched by donor. Sphericity was not assumed, and the Geisser–Greenhouse correction was applied. Ordinary two-way ANOVA was used for commercial serum. Multiple comparisons were adjusted using Šídák’s test. Significant ANOVA effects for the experiments without and with glycerol are reported in Supplementary Tables S1 and S2, respectively. These exploratory analyses compared responses under the tested conditions and were not intended to support population-level inference. Spearman’s rs rank correlation was used to assess the relationship between blue-channel intensity obtained with BChCl and individual pre-treatment cholinesterase activities measured using the Cobas c311 automated clinical chemistry analyzer (Roche Diagnostics GmbH, Mannheim, Germany) in the six human serum samples. Statistical significance was set at p < 0.05. Analyses were performed using GraphPad Prism version 11.
3. Results
3.1. Serum Cholinesterase Activity and Heat Treatment
Serum cholinesterase activity was measured using a Cobas c311 automated analyzer (Table 1). Female 1–3 and Male 1–3 identify individual donors. Baseline activities were 4818 U/L for commercial serum (Merck), 8945–9306 U/L for the three female serum samples, and 8287–10,305 U/L for the three male serum samples. Commercial serum was heated at 60 °C for 30 min for use as a serum-only control in the paper assay. After heat treatment, serum cholinesterase activity was reported by the laboratory as below the detectable range. Commercial serum (Merck) was used as a serum-only control in the paper assay.
3.2. Initial Evaluation and Selection of Cholinergic Substrates
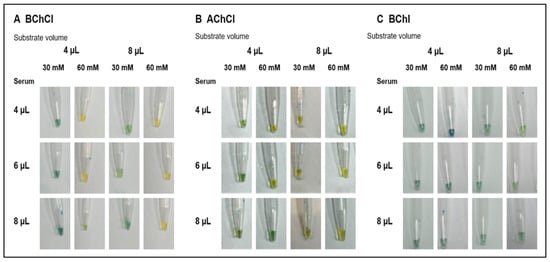
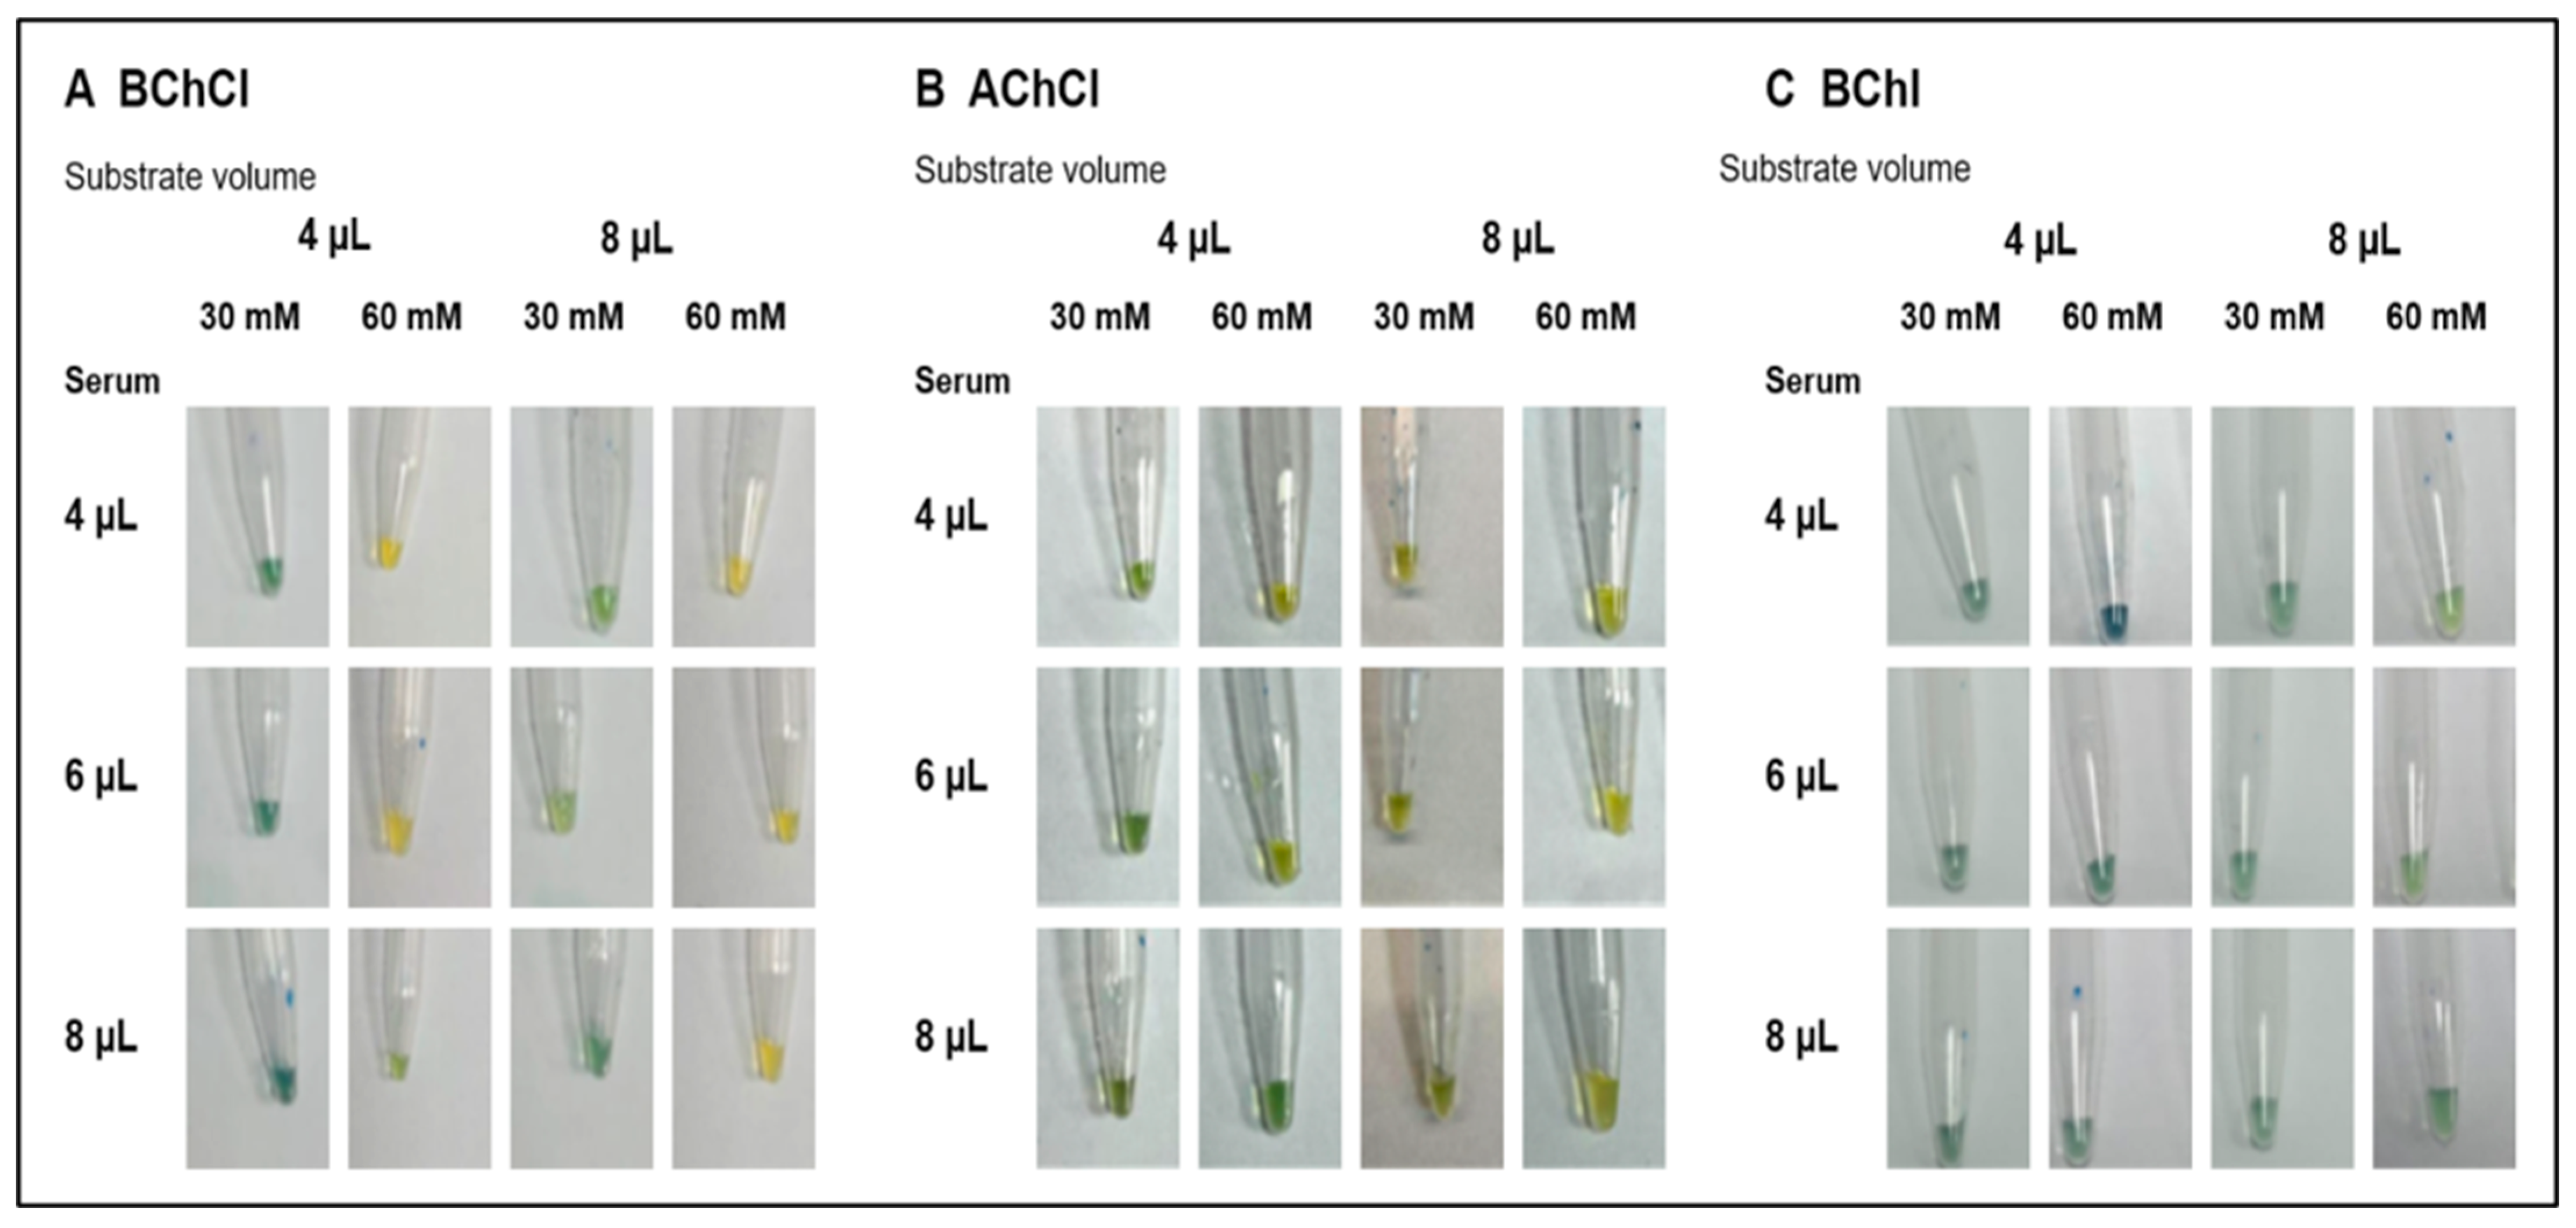
BChCl, AChCl, and BChI were initially evaluated under liquid conditions to compare their colorimetric responses. Serum volumes of 4, 6, and 8 µL were combined with either 4 or 8 µL of each substrate at concentrations ranging from 10 to 60 mM. Figure 1 shows representative responses at 30 and 60 mM; the complete set of conditions and technical replicates is provided in Supplementary Figure S1. Visual inspection showed that higher concentrations of AChCl and BChCl generally produced a more evident color change toward yellow. Among the substrates evaluated, acetylcholine chloride showed the clearest and most readily distinguishable response across the tested conditions. Butyrylcholine chloride also produced a favorable colorimetric response at higher concentrations and was retained as a comparative substrate because the Cobas c311 reference method measures serum cholinesterase activity using the related substrate butyrylthiocholine. In contrast, BChI showed less evident color differentiation across the evaluated concentrations and was excluded from the subsequent experiments. Based on this preliminary visual assessment, AChCl and BChCl were selected for subsequent paper-based evaluation.
Figure 1.
Initial visual evaluation of cholinergic substrates under liquid conditions. The upper portion of each vial contains air, while the lower portion contains the reaction mixture (substrate, BTB indicator, and plasma). The color changes from greenish (approximately pH 7.5) to yellow (approximately pH 6) as a result of enzyme activity, depending on the substrate used. Representative images of butyrylcholine chloride (BChCl) (A), acetylcholine chloride (AChCl) (B), and butyrylcholine iodide (BChI) (C) at 30 and 60 mM. Within each panel, columns show substrate volumes of 4 and 8 µL, each at the two concentrations, and rows show serum volumes of 4, 6, and 8 µL. Reactions were performed using commercial serum (Merck) and incubated at 20 °C for 20 min. One representative technical replicate is shown per condition. The complete concentration range (10–60 mM) and all three technical replicates are provided in Supplementary Figure S1.
3.3. Basal Color of the Indicator Paper and Assay Components
This initial evaluation relied on visual observations, as clear color changes were expected and subtle differences in intensity were not the focus. Therefore, RGB measurements were not performed.
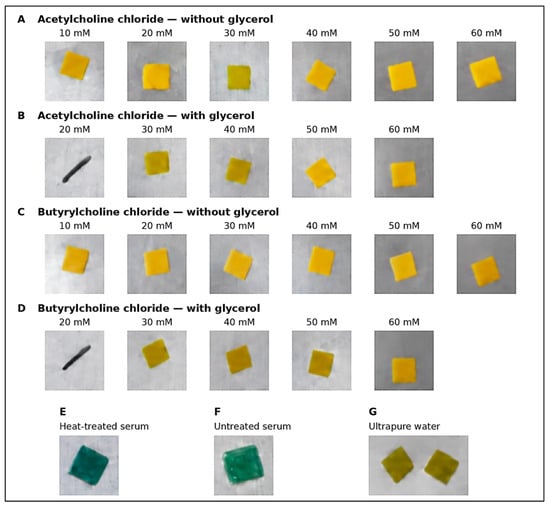
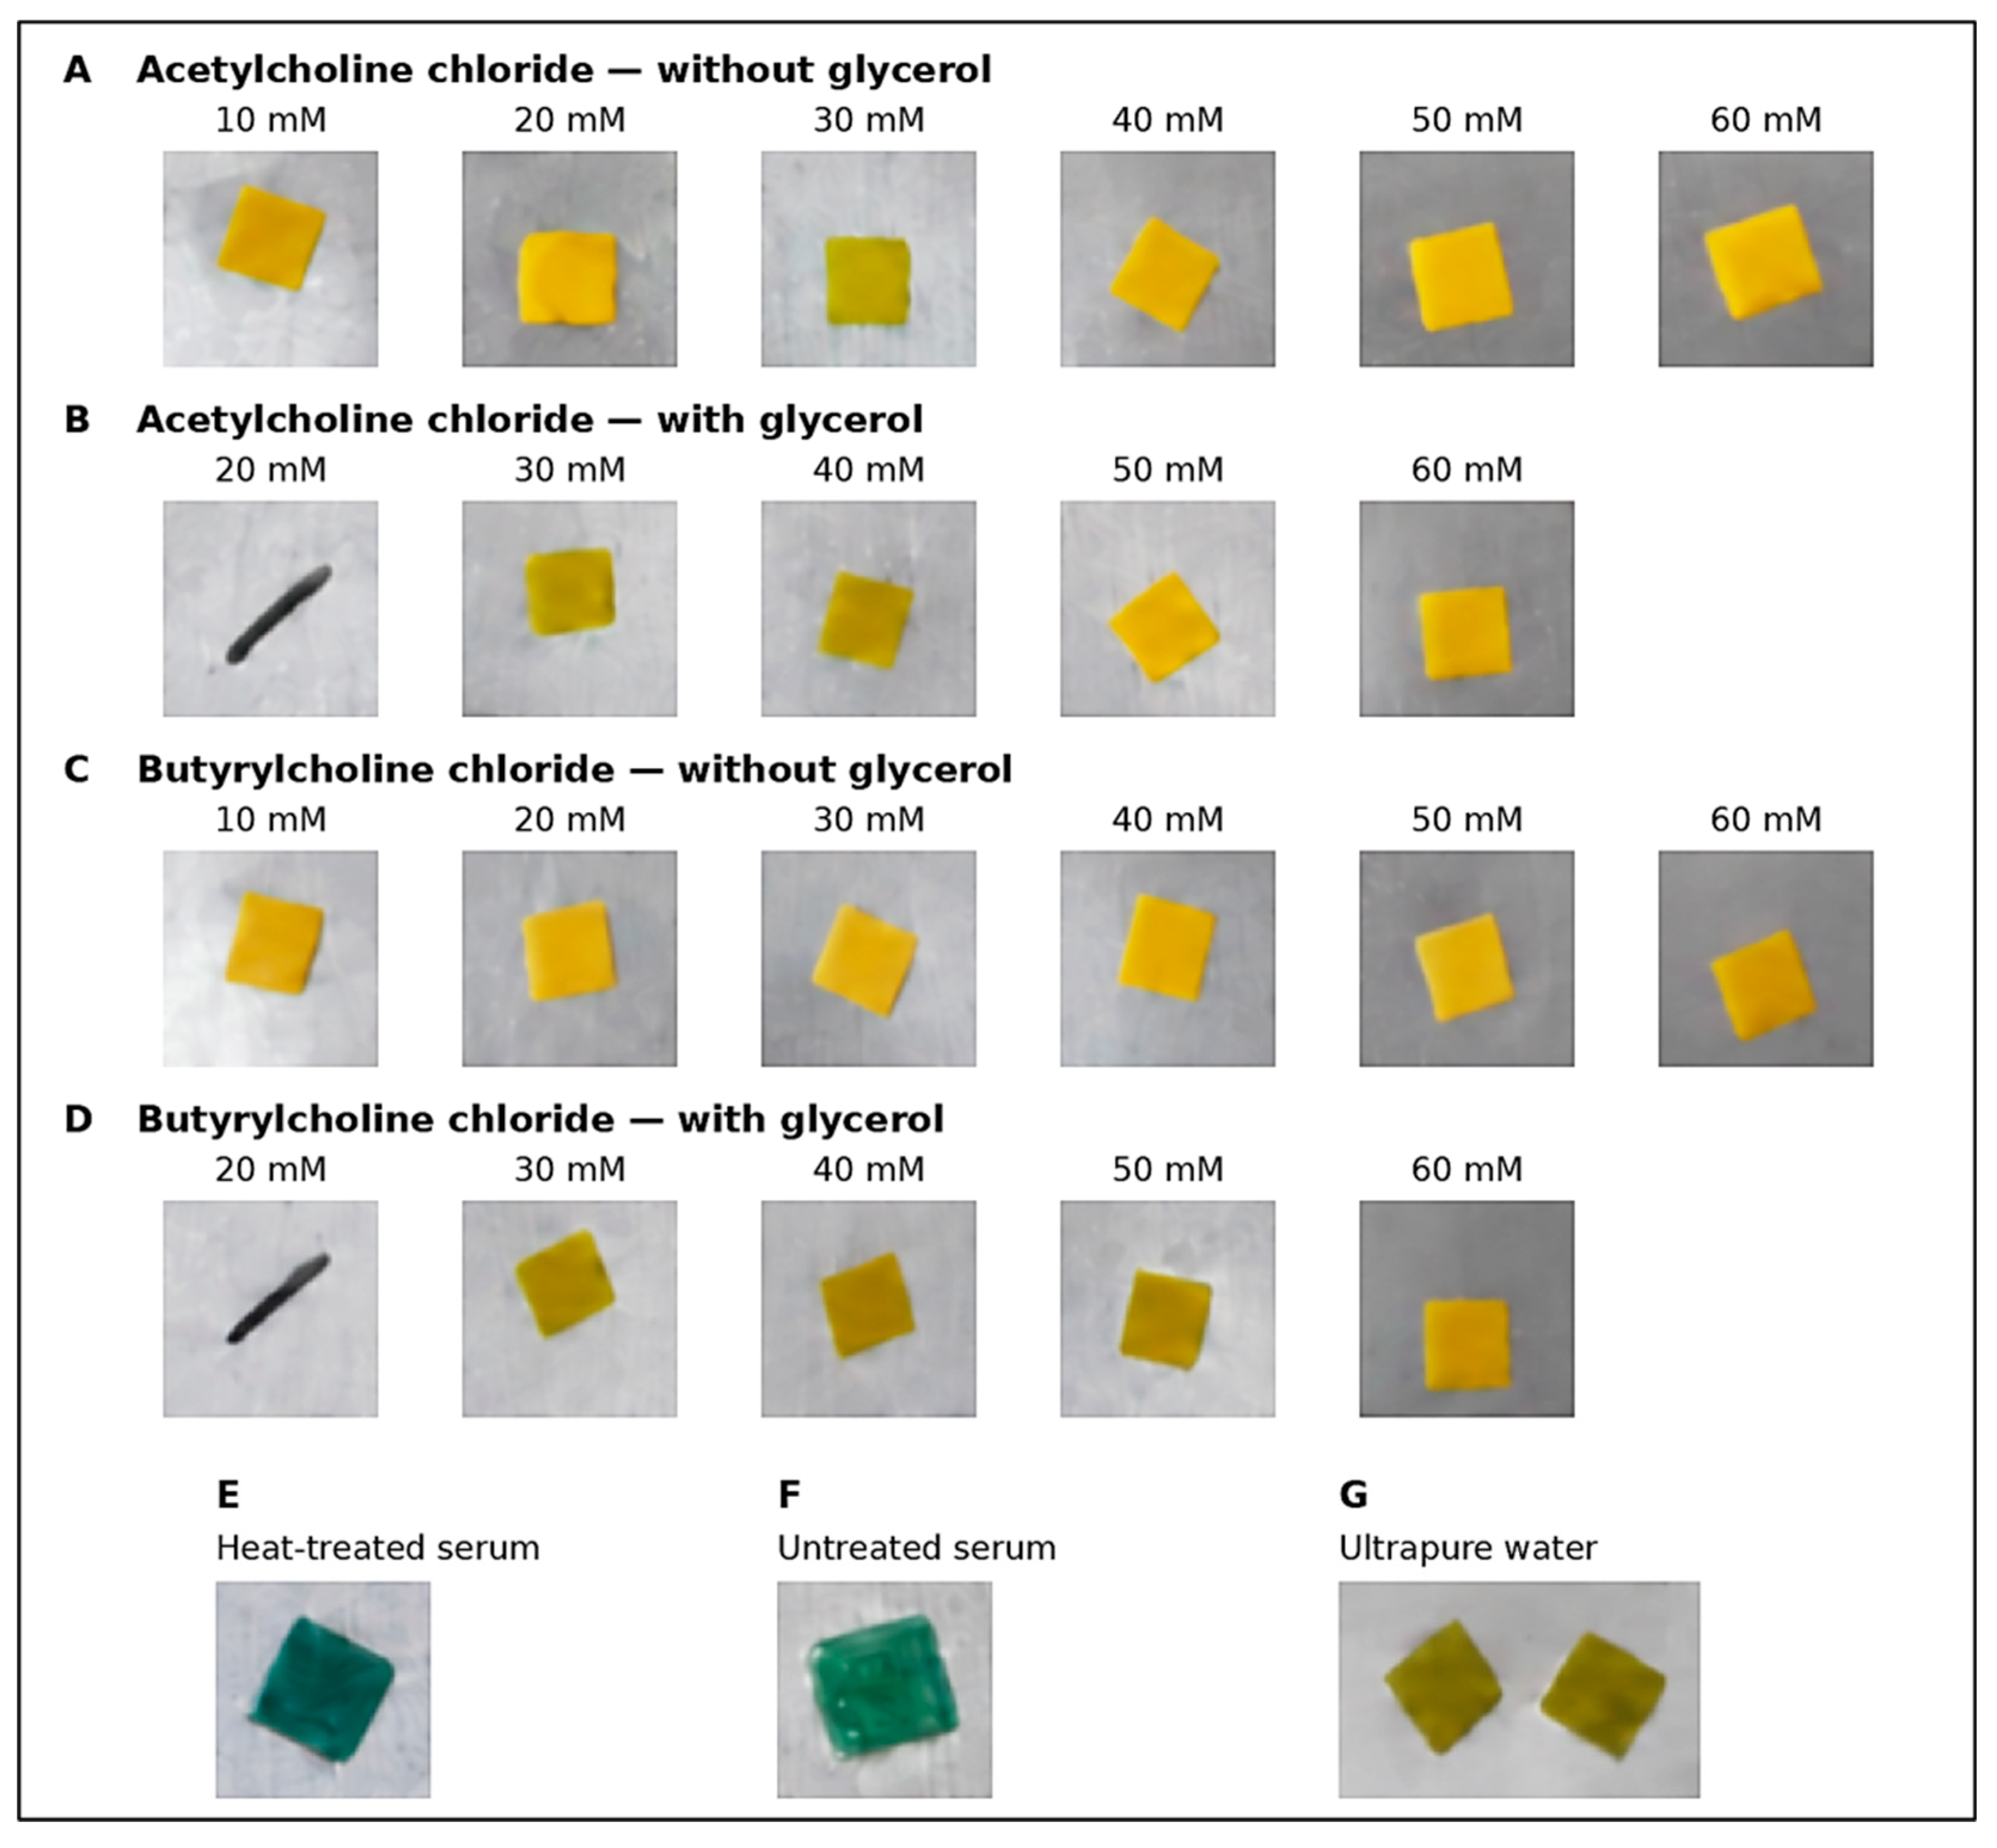
The pH indicator paper remained yellow after the addition of AChCl or BChCl, with or without glycerol. A similar color was observed with ultrapure water, suggesting that neither the substrates nor glycerol noticeably affected the original color of the indicator (Figure 2). In contrast, both untreated and heat-treated commercial serum (Merck) changed the indicator paper from yellow to green, a color consistent with the near-neutral pH typically found in human serum. However, serum pH and buffering capacity were not measured in this study, so this interpretation is based on the observed indicator color. Interestingly, both serum samples produced very similar colors despite their marked difference in cholinesterase activity. While untreated serum retained its enzymatic activity, the activity of heat-treated serum was below the detection limit of the reference method (Table 1). This suggests that, in the absence of substrate, cholinesterase activity has little visible influence on the basal color of the indicator paper.
Figure 2.
Basal color of the indicator paper and assay components. Acetylcholine chloride (AChCl) without glycerol (A) and with glycerol (B), and butyrylcholine chloride (BChCl) without glycerol (C) and with glycerol (D) were evaluated at the indicated concentrations. Heat-treated commercial serum (Merck; 60 °C for 30 min) without added substrate (E), untreated commercial serum (Merck) without added substrate (F), and ultrapure water (G) were included as controls.
These observations also show that serum itself contributes to the colorimetric response, regardless of its enzymatic activity. Since these controls were performed without substrate, the observed color changes cannot be attributed to substrate hydrolysis. This contribution from the serum must therefore be considered when interpreting the final RGB measurements of the paper-based assay.
3.4. Evaluation of the Colorimetric Response in the Absence of Glycerol
The colorimetric response was evaluated using blue-channel intensity, with lower values corresponding to the observed transition of the indicator paper toward yellow. Eight substrate formulations combining AChCl or BChCl at 30 or 60 mM and volumes of 4 or 8 µL were tested with commercial serum (Merck), female human serum, and male human serum. As described in Section 2.5, serum volumes of 4, 6, and 8 µL were evaluated under four conditions without glycerol: dried substrate with immediate reading (SI) or reading after 20 min (S20), and substrate without prior drying with immediate reading (HI) or reading after 20 min (H20). Figure 3 presents the blue-channel intensity measurements under these conditions. Representative assay images and the corresponding RGB intensity plots are provided in Supplementary Figures S2 and S3, respectively. The effect of substrate formulation depended on the application and reading conditions. Significant effects were observed in all three serum groups under SI, in commercial and female serum under S20, and only in commercial serum under HI (Table S1). H20 was selected for further evaluation because it generally produced lower blue-channel intensities with the 8 µL, 60 mM formulations, particularly with BChCl. With 8 µL of BChCl at 60 mM and 4 µL of serum, H20 produced lower intensity than S20 in commercial and female serum (p = 0.0491 and p = 0.0227, respectively). In female serum, H20 also produced lower intensity than SI at serum volumes of 6 and 8 µL (p = 0.0292 and p = 0.0407, respectively). However, these differences were not consistent across all conditions. With 8 µL of AChCl at 60 mM, H20 did not differ significantly from the other conditions at any serum volume (all p > 0.05). Under H20, substrate formulation affected intensity in commercial, female, and male serum (p < 0.0001, p = 0.0025, and p = 0.0029, respectively). With 8 µL of substrate and 4 µL of serum, increasing AChCl concentration from 30 to 60 mM reduced intensity in all three serum groups (p < 0.0001, p = 0.0287, and p = 0.0166, respectively), supporting the selection of 60 mM AChCl. No significant concentration effect was found for BChCl under H20 (p > 0.05). At 60 mM and 4 µL of serum, increasing substrate volume from 4 to 8 µL generally reduced mean blue-channel intensity, but the differences were not significant (p > 0.05). The 8 µL volume was therefore retained as a working condition based on this trend. At 8 µL and 60 mM, AChCl and BChCl showed no significant differences at any serum volume (p > 0.05), so both were retained for evaluation with glycerol.
Under H20, serum volume had no significant overall effect in commercial, female, or male serum (p = 0.4185, p = 0.1150, and p = 0.6259, respectively). Therefore, 4 µL was selected to minimize sample consumption, although all three volumes were retained for the subsequent glycerol experiments. Together, these results supported the selection of H20, using 8 µL of substrate at 60 mM and 4 µL of serum, as the working conditions for further evaluation rather than a statistically established optimum. An important observation was that very little moisture remained in the LF1 reaction zone after 20 min. This raised the possibility that, in some cases, the yellow color of the pH indicator paper reflected insufficient wetting during manual stamping rather than substrate hydrolysis. Glycerol was therefore added in the following experiments with the aim of maintaining moisture in the reaction zone and facilitating liquid transfer. These effects were not measured directly.
3.5. Evaluation of the Colorimetric Response in the Presence of Glycerol
This evaluation aimed to determine whether the experimental conditions previously selected without glycerol remained suitable after its addition. The same eight substrate formulations were tested, each supplemented with 5% glycerol. Commercial human serum (Merck) and serum samples from male and female volunteers were applied to the LF1 paper at volumes of 4, 6, and 8 µL under the four experimental conditions (SI, S20, HI, and H20). Figure 4 presents the blue-channel intensity measurements. Representative assay images and the corresponding RGB intensity plots are provided in Supplementary Figures S4 and S5, respectively.
Substrate formulation significantly affected blue-channel intensity in all three serum groups under SI and S20, and in commercial and female serum under HI (Table S2). With 8 µL of substrate at 60 mM, H20 produced the lowest mean blue-channel intensity among the four application and reading conditions for both AChCl and BChCl at every serum volume in commercial, female, and male serum. Direct comparisons supported this pattern in several cases. With 8 µL of AChCl at 60 mM and 4 µL of serum, H20 produced lower intensity than SI and S20 in commercial serum (p = 0.0020 and p = 0.0342, respectively) and male serum (p = 0.0044 and p = 0.0388, respectively). The corresponding differences in female serum were not significant (p = 0.1454 and p = 0.0763, respectively). With 8 µL of BChCl at 60 mM and 4 µL of serum, H20 produced lower intensity than SI and S20 in commercial serum (p = 0.0189 and p < 0.0001, respectively), and lower intensity than HI in male serum (p = 0.0492). In female serum, H20 did not differ significantly from SI, S20, or HI at this serum volume (p > 0.05). H20 was therefore retained based on its consistently lower mean intensity, although it was not significantly different from every alternative condition. Under H20, substrate formulation affected intensity in commercial, female, and male serum (p < 0.0001, p = 0.0029, and p = 0.0040, respectively). With AChCl at 60 mM, increasing substrate volume from 4 to 8 µL produced numerically lower intensities at all serum volumes in each serum type, but none of these differences were significant (p > 0.05). Thus, 8 µL was maintained based on the observed response and to preserve the formulation selected without glycerol. Increasing AChCl concentration from 30 to 60 mM at 8 µL also had no significant effect at any serum volume in any serum type (p > 0.05). The concentration of 60 mM was therefore retained for consistency between experiments, rather than as a demonstrated improvement over 30 mM in the presence of glycerol. With BChCl at 8 µL, increasing concentration from 30 to 60 mM reduced intensity only in commercial serum using 4 µL of serum (p = 0.0371). At 60 mM, increasing BChCl volume from 4 to 8 µL significantly reduced intensity only in female serum using 4 µL of serum (p = 0.0039); the remaining volume comparisons were not significant (p > 0.05). However, direct comparisons between AChCl and BChCl at 8 µL and 60 mM showed no significant differences at any serum volume in commercial, female, or male serum (p > 0.05). Both substrates were therefore retained under the same conditions for subsequent evaluation.
Figure 3.
Colorimetric response of the paper-based assay in the absence of glycerol. Blue-channel intensity in commercial serum (Merck), female human serum, and male human serum under four conditions: dried substrate with immediate reading (SI), dried substrate with reading after 20 min (S20), substrate without prior drying with immediate reading (HI), and substrate without prior drying with reading after 20 min (H20). Acetylcholine chloride (AChCl) and butyrylcholine chloride (BChCl) were evaluated at 30 and 60 mM using substrate volumes of 4 and 8 µL and serum volumes of 4, 6, and 8 µL. Values are mean ± SD (n = 3 per formulation at each serum volume and application/reading condition), representing three independent donors per sex or three technical replicates from a single Merck vial. Asterisks indicate Šídák-adjusted comparisons within each serum volume: * p < 0.05, ** p < 0.01, *** p < 0.001, and **** p < 0.0001. Purple, blue, and green bars represent serum volumes of 4, 6, and 8 µL, respectively. Representative assay images are provided in Supplementary Figure S2.
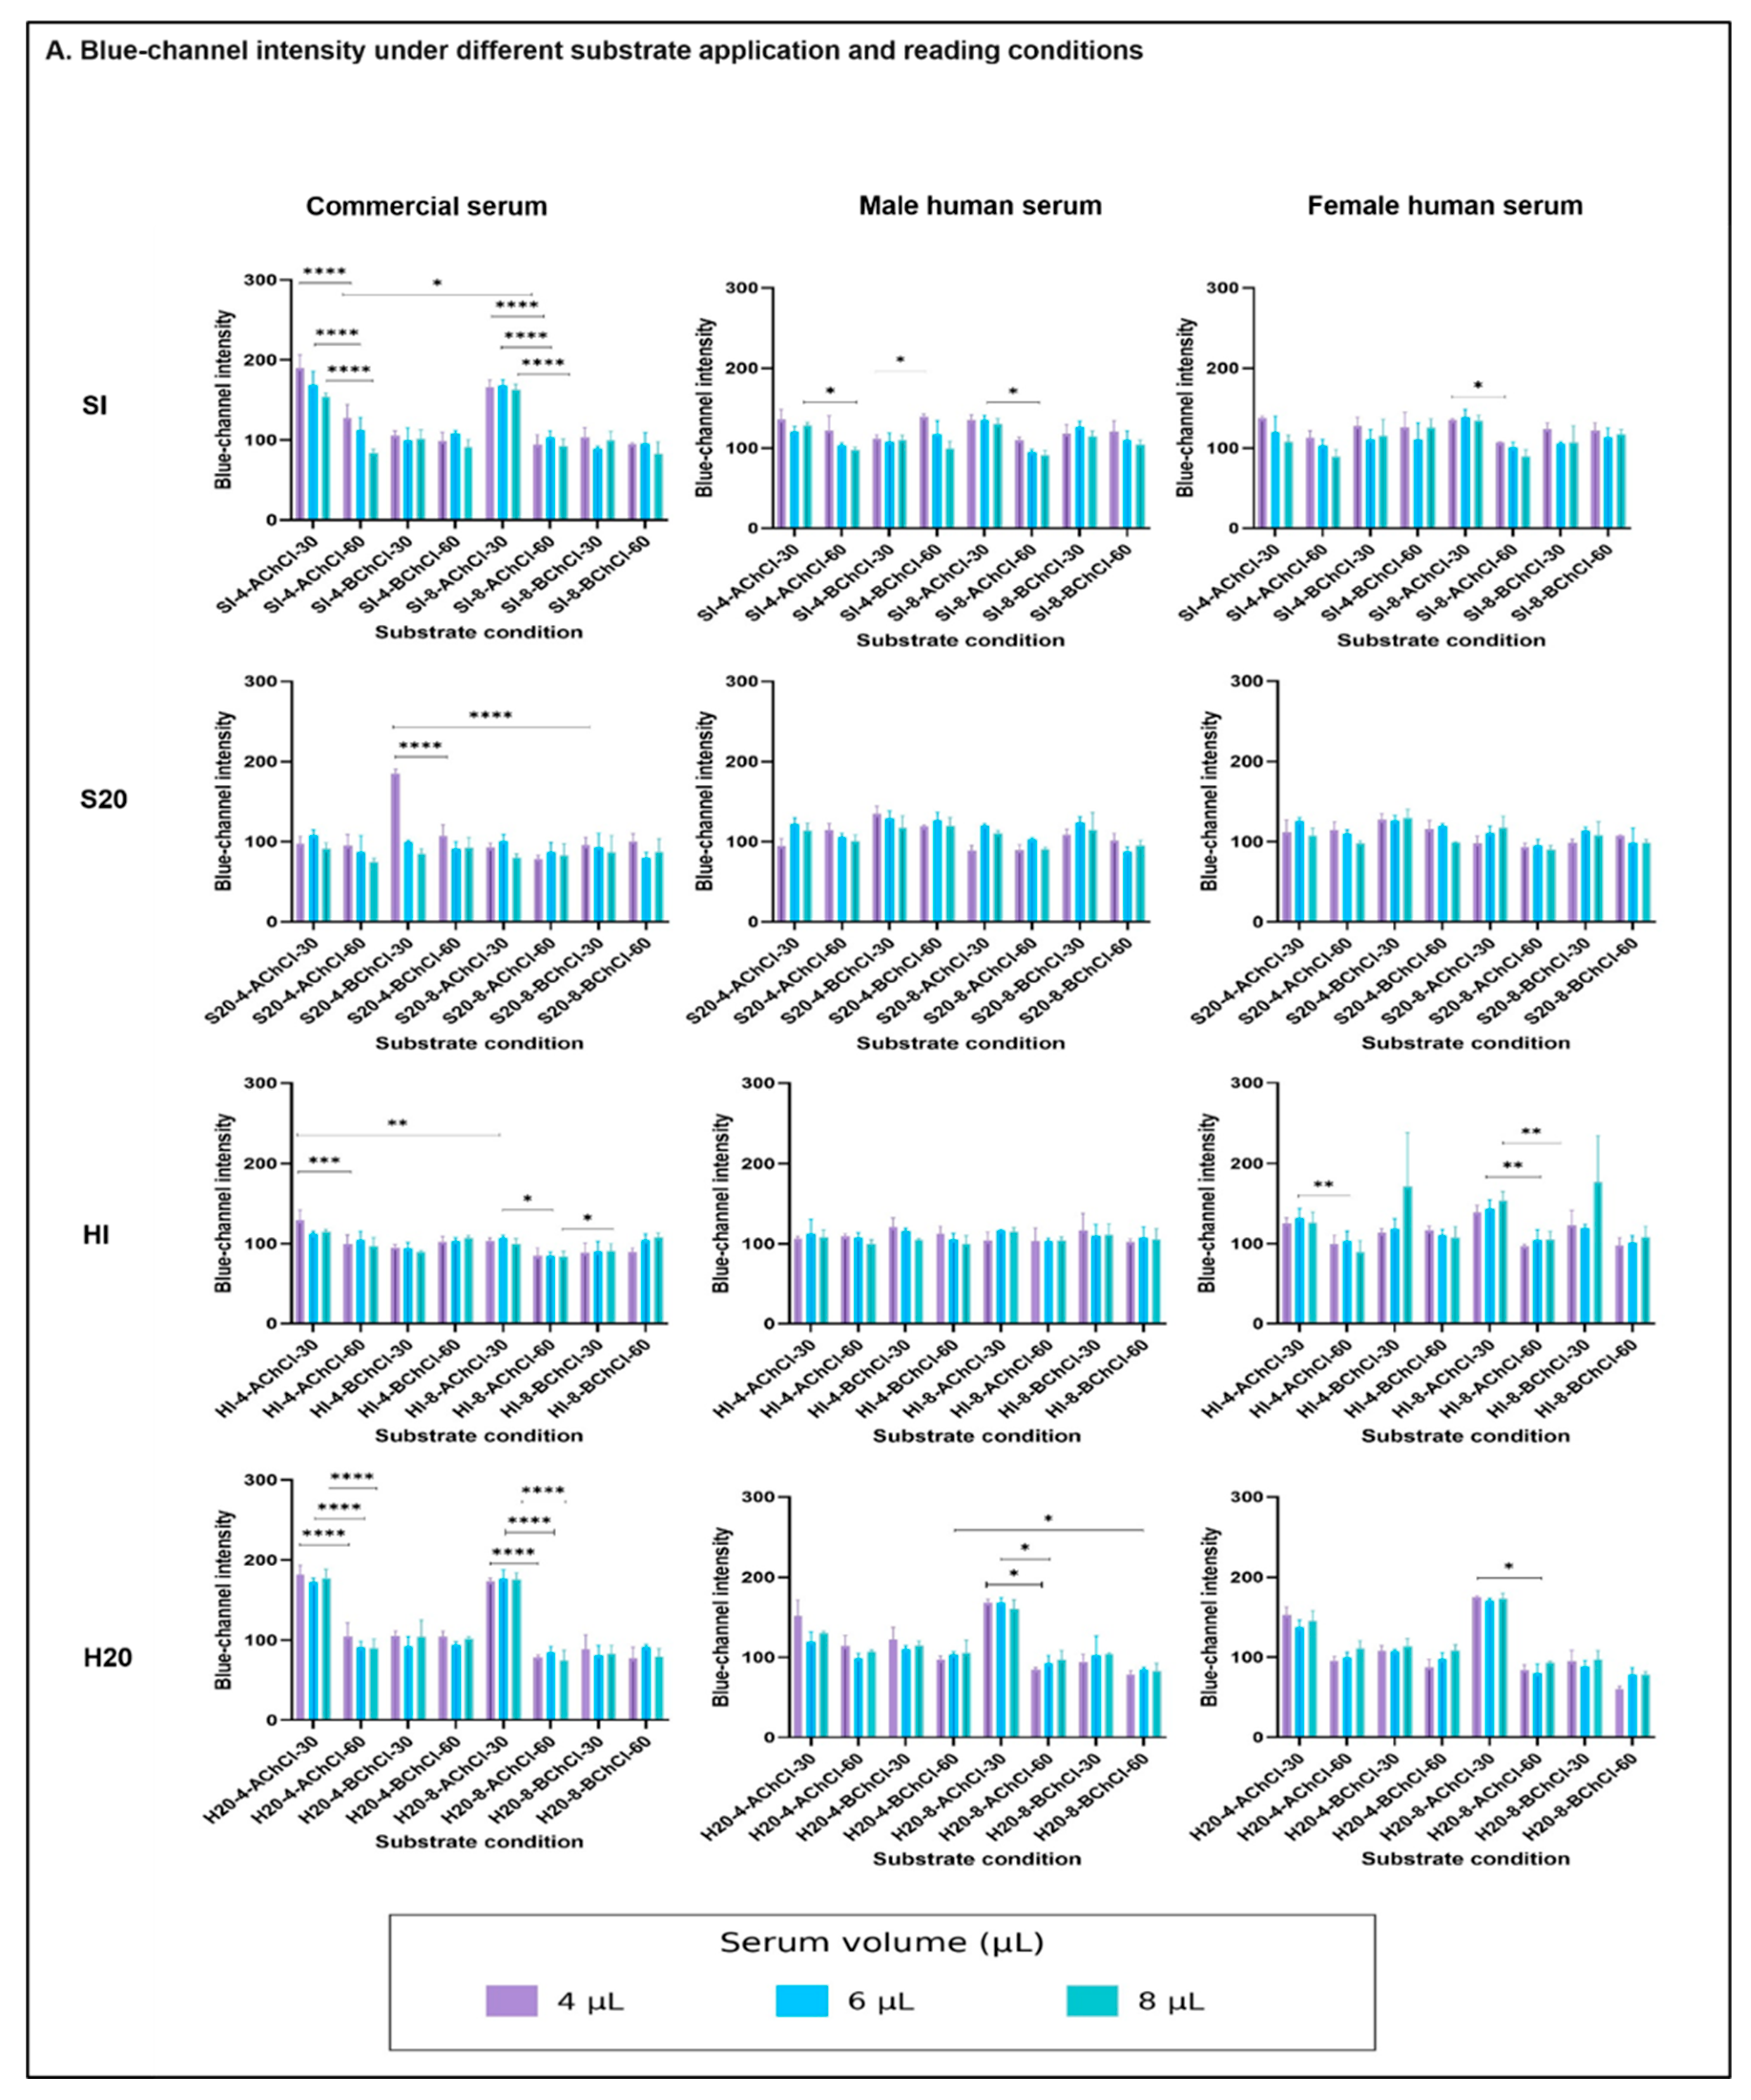
Figure 4.
Colorimetric response of the paper-based assay in the presence of 5% glycerol. Blue-channel intensity in commercial serum (Merck), female human serum, and male human serum under four conditions: dried substrate with immediate reading (SI), dried substrate with reading after 20 min (S20), substrate without prior drying with immediate reading (HI), and substrate without prior drying with reading after 20 min (H20). Acetylcholine chloride (AChCl) and butyrylcholine chloride (BChCl) were evaluated at 30 and 60 mM using substrate volumes of 4 and 8 µL and serum volumes of 4, 6, and 8 µL. Glycerol concentration was 5% (v/v) in the substrate solution before serum addition. Values are mean ± SD (n = 3 per formulation at each serum volume and application/reading condition), representing three independent donors per sex or three technical replicates from a single Merck vial. Asterisks indicate Šídák-adjusted comparisons within each serum volume: * p < 0.05, ** p < 0.01, *** p < 0.001, and **** p < 0.0001. Purple, blue, and green bars represent serum volumes of 4, 6, and 8 µL, respectively. Representative assay images are provided in Supplementary Figure S4.
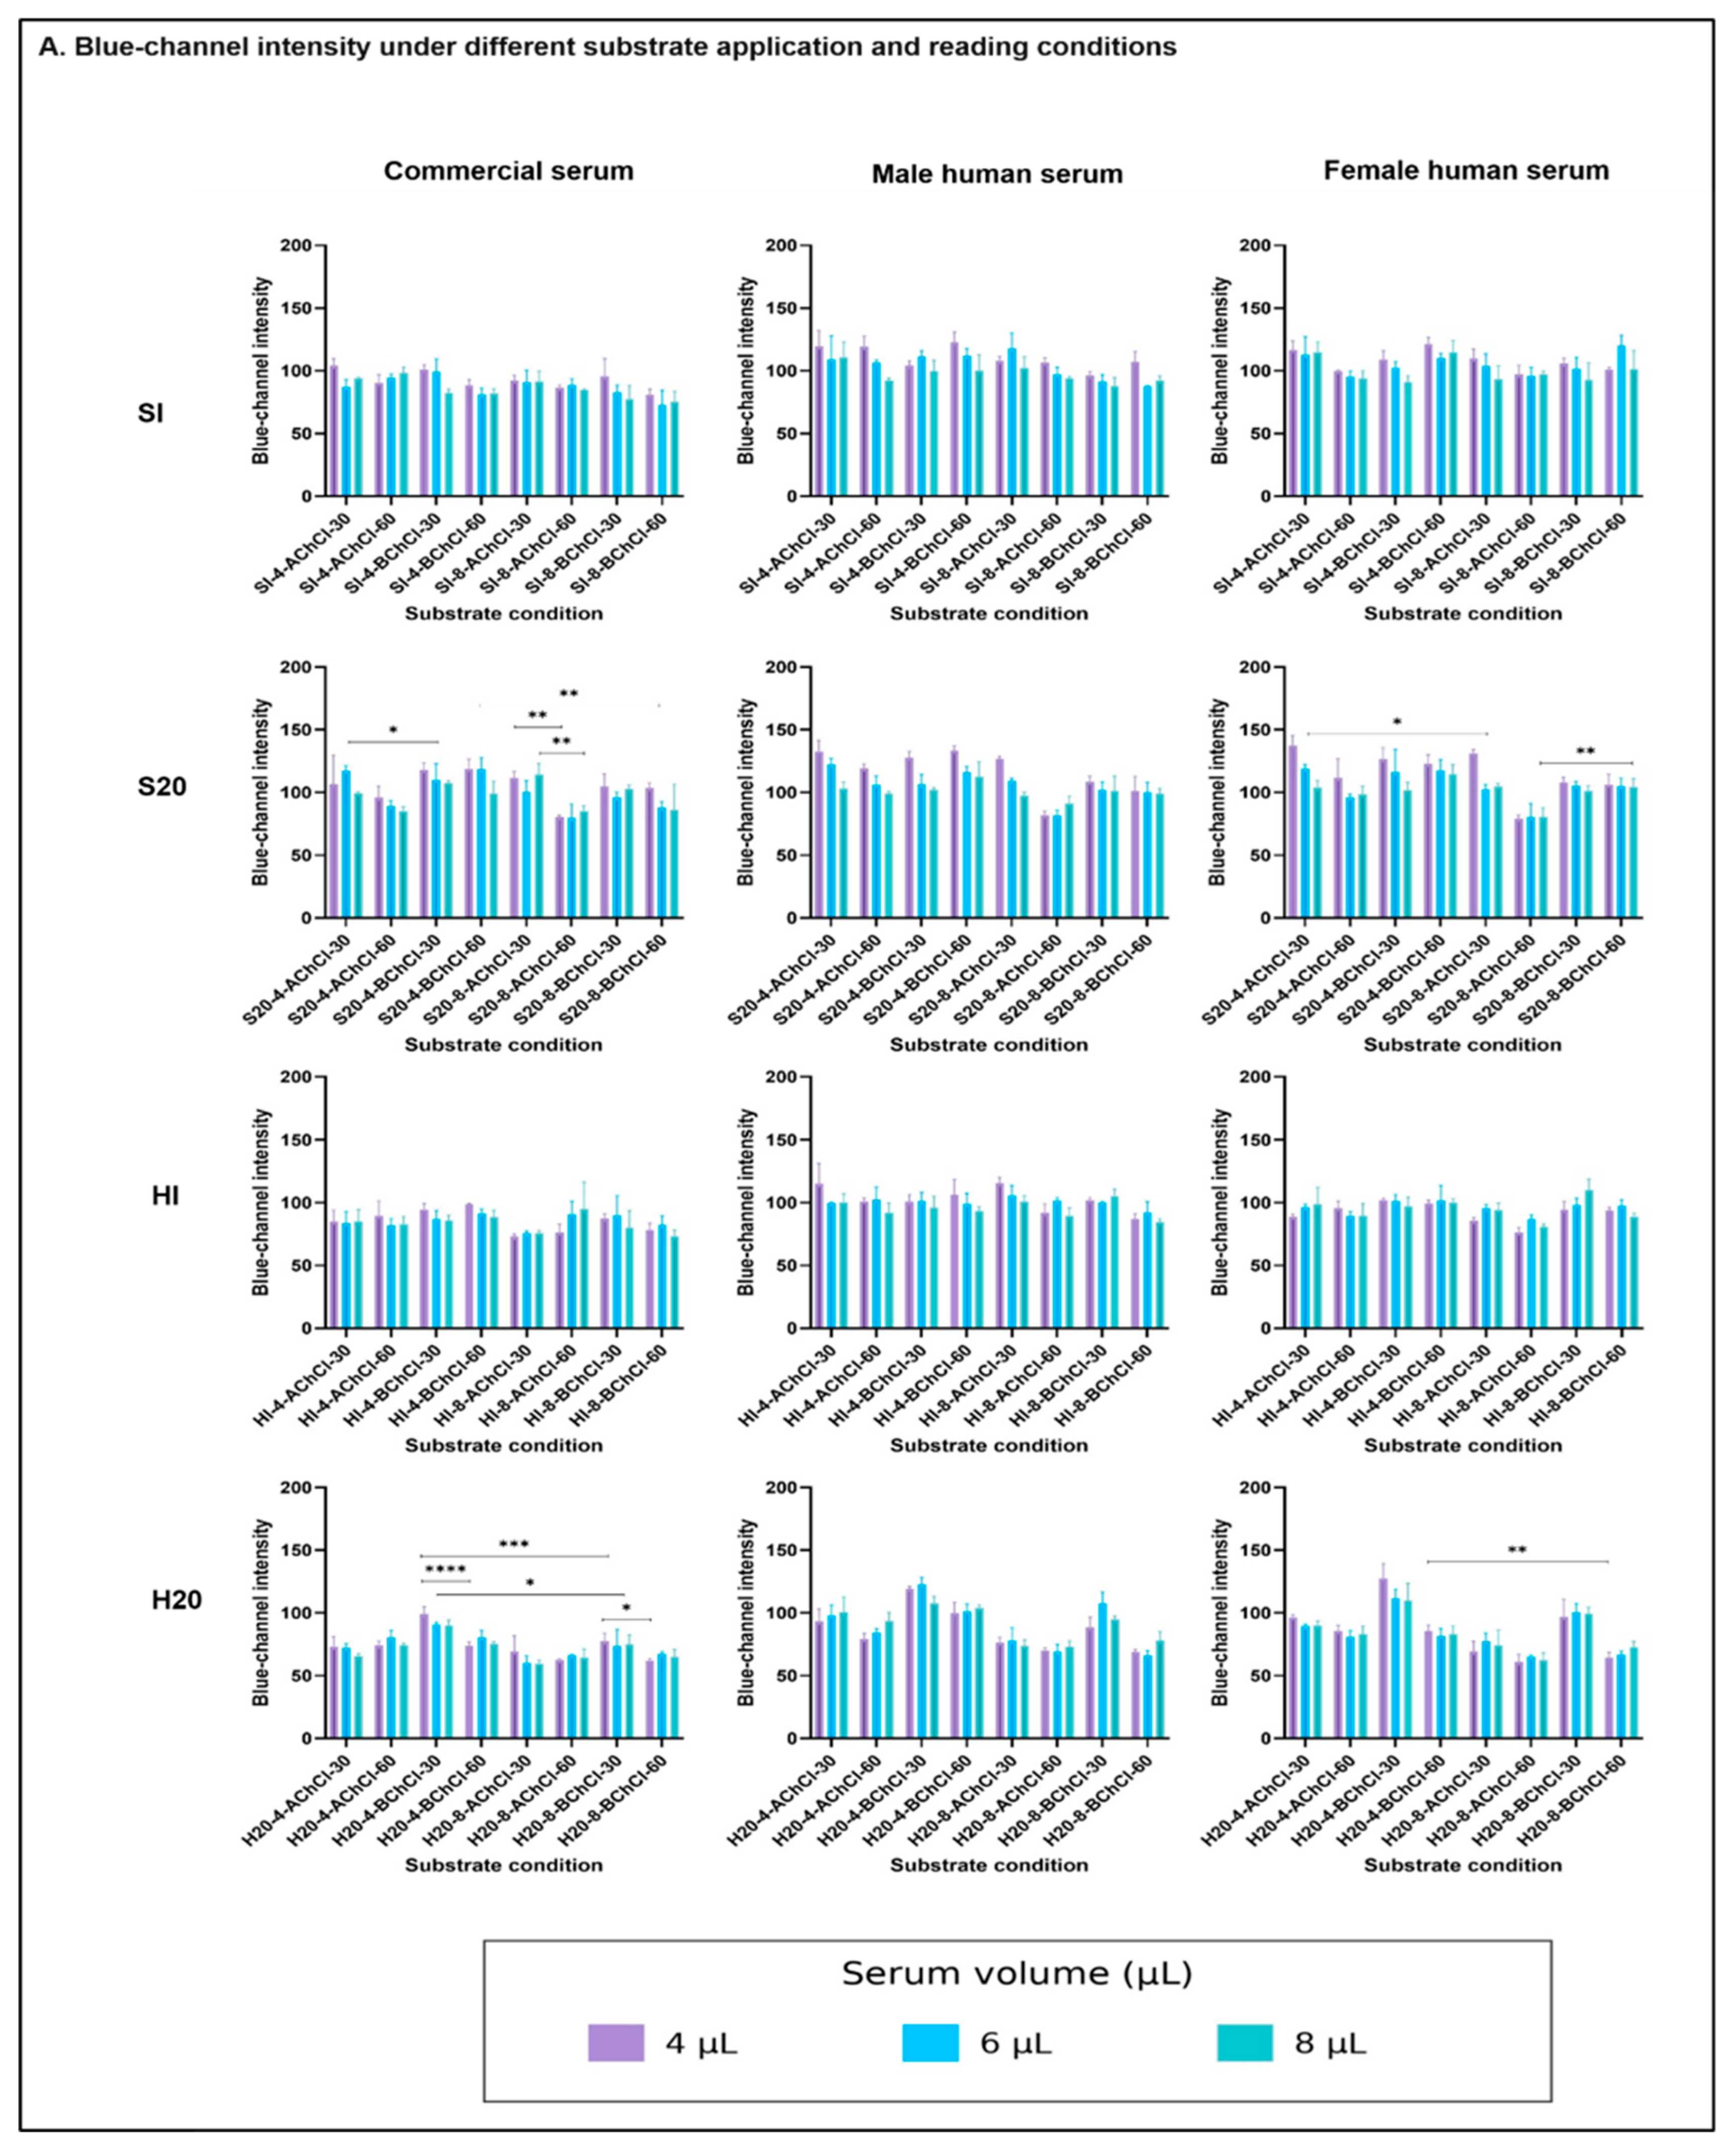
Under H20, serum volume had no significant overall effect in commercial or female serum (p = 0.1516 and p = 0.6884) but significantly affected male serum (p = 0.0069). Overall, H20 with 8 µL of substrate at 60 mM and 5% glycerol was retained for further evaluation, although its superiority was not always statistically significant. Serum volume and glycerol effects were further examined in Section 3.6.
3.6. Selection of Assay Conditions and Comparison with Reference Cholinesterase Activity
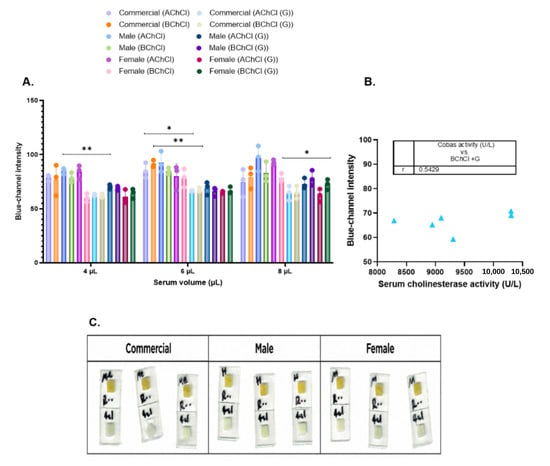
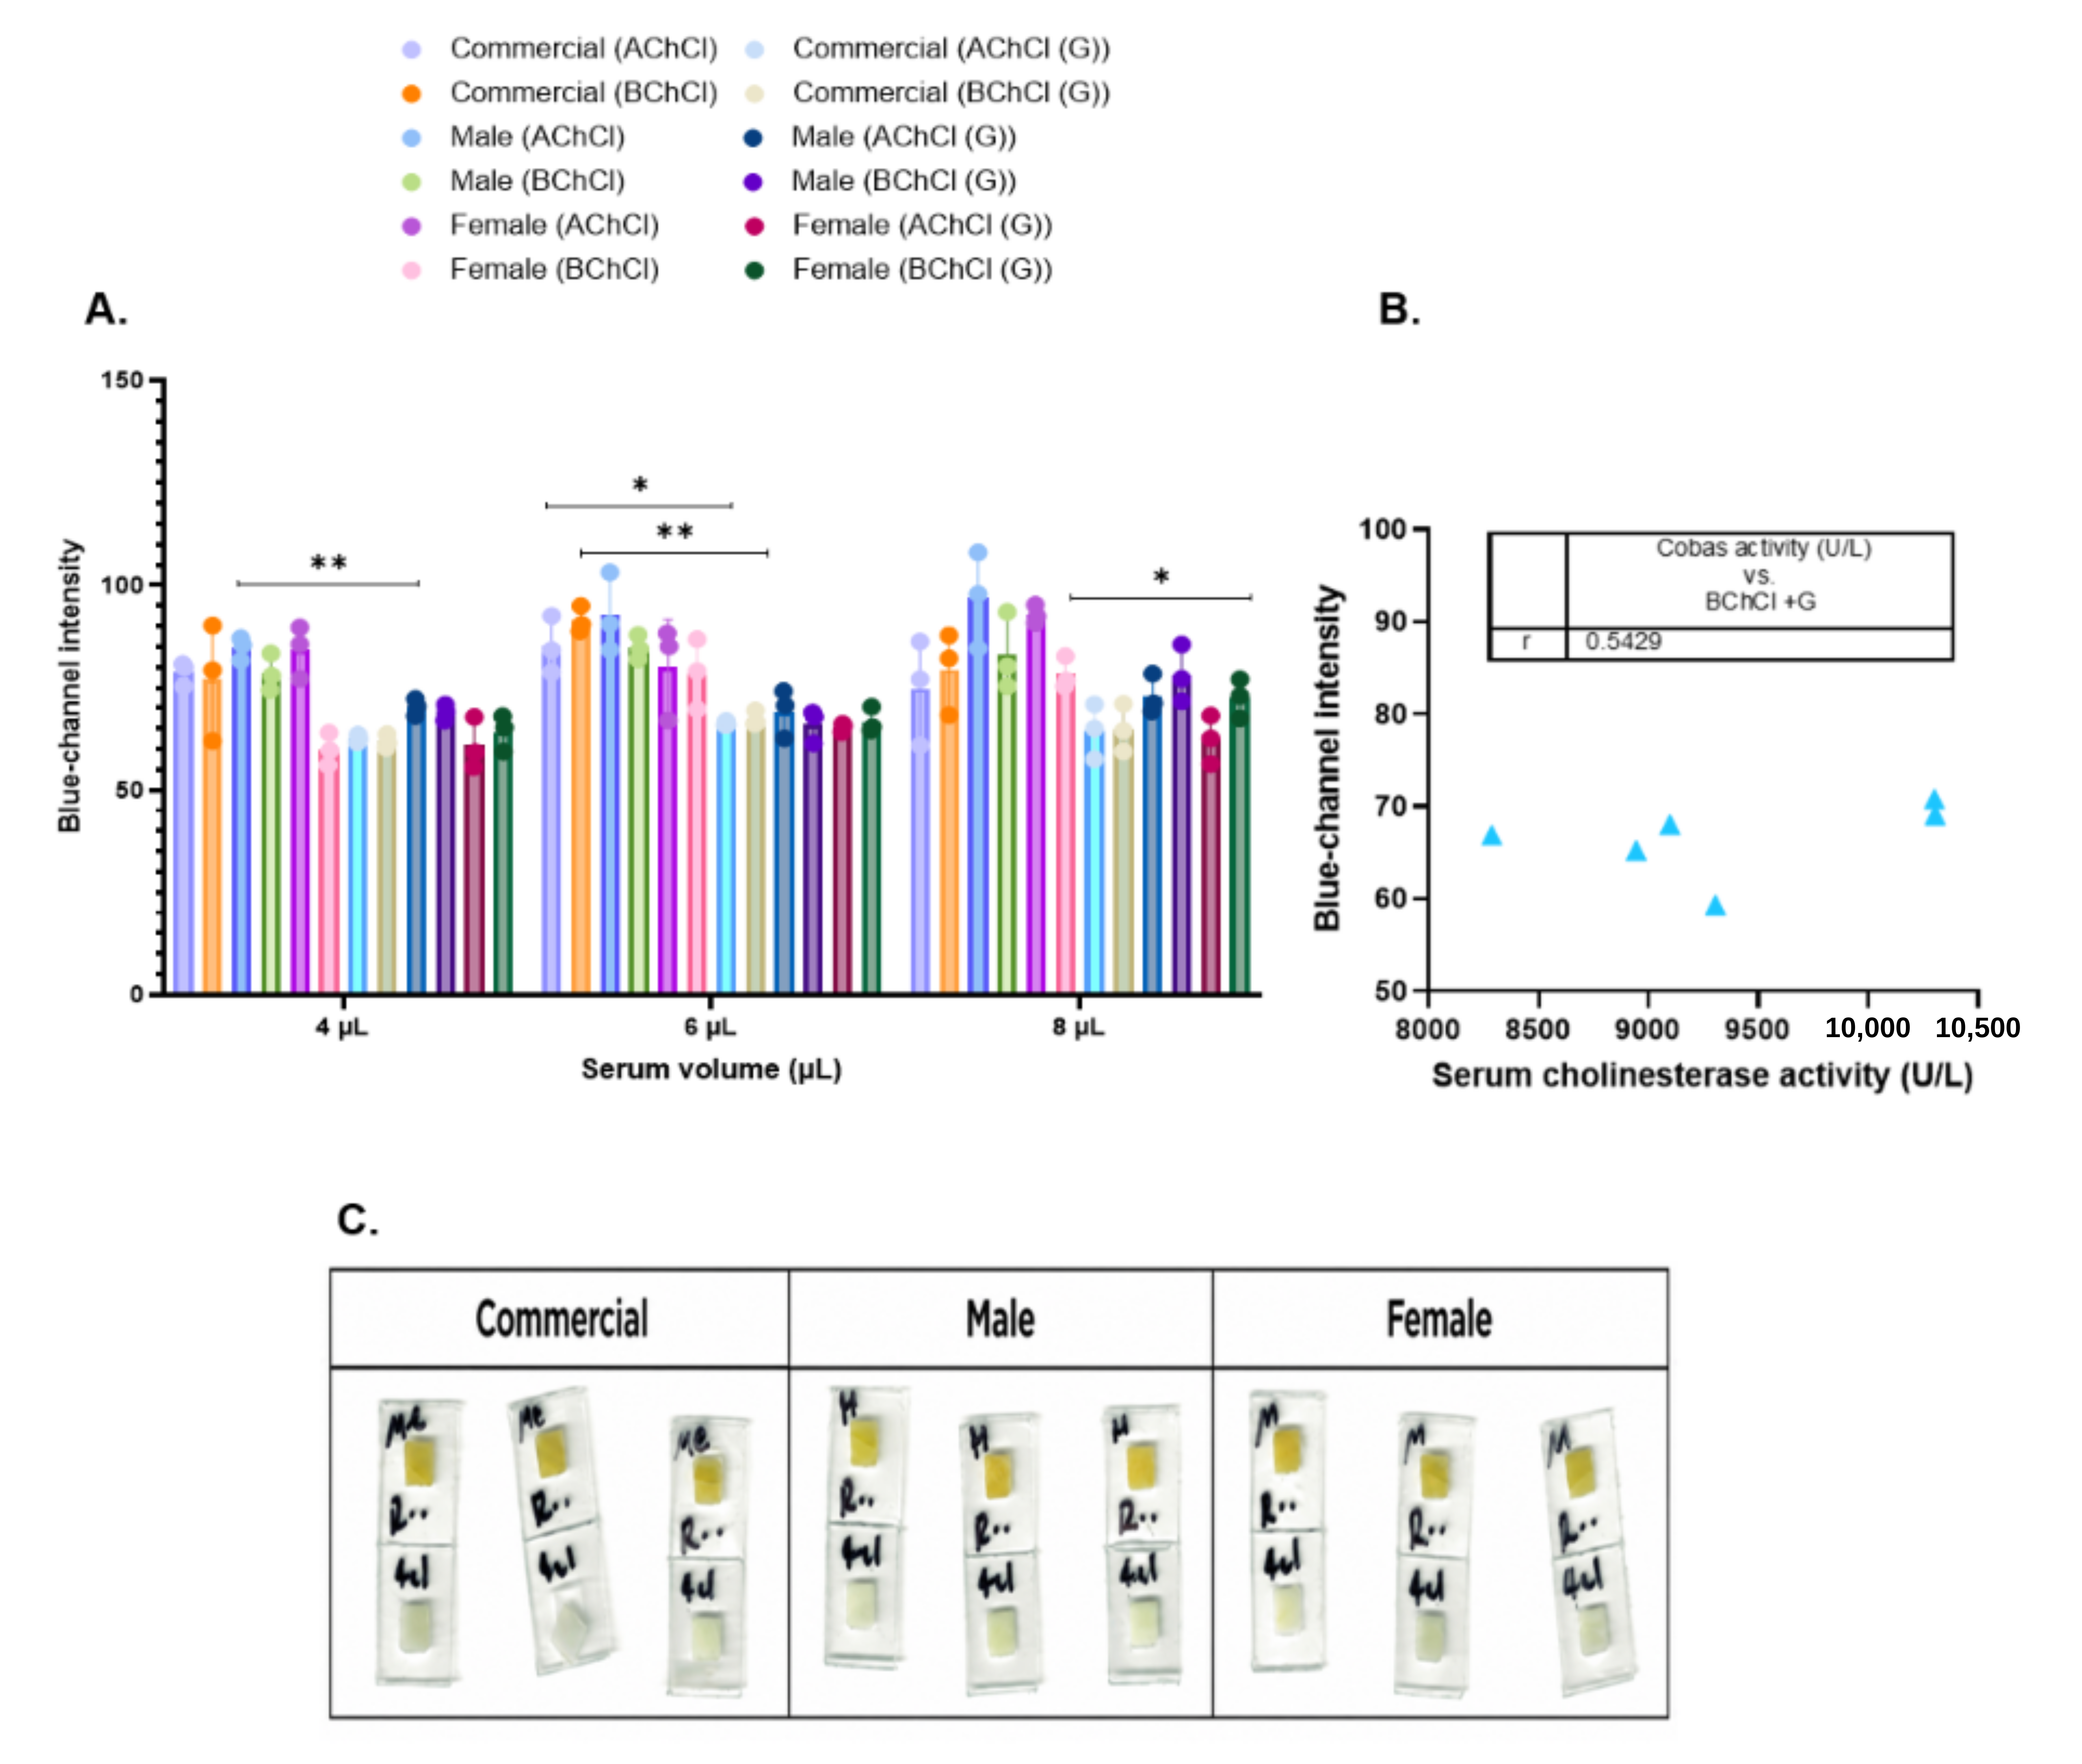
The effect of adding 5% glycerol was evaluated using 8 µL of substrate at 60 mM, without prior drying and with reading after 20 min (H20; Figure 5A). With AChCl, glycerol reduced mean blue-channel intensity at all serum volumes, although significant differences were observed only in commercial serum at 6 µL (p = 0.0221), female serum at 8 µL (p = 0.0297), and male serum at 4 µL (p = 0.0058). With BChCl, a significant reduction was found only in commercial serum at 6 µL (p = 0.0026). The remaining comparisons were not significant (p > 0.05). Although the effect of glycerol varied with serum group and volume, 5% glycerol was retained to help maintain moisture in the LF1 reaction zone, addressing the limited moisture observed after 20 min in the experiments without glycerol. At the selected serum volume of 4 µL, glycerol significantly reduced blue-channel intensity with AChCl only in male serum.
Figure 5.
Effect of glycerol and comparison with reference cholinesterase activity. (A) Blue-channel intensity obtained with acetylcholine chloride (AChCl) and butyrylcholine chloride (BChCl), with and without 5% glycerol (G), using 4, 6, and 8 µL of commercial, female, and male serum. Bars show mean ± SD, with individual values plotted (n = 3): three technical replicates from one Merck vial or three independent donors per sex. Asterisks indicate Šídák-adjusted comparisons between formulations with and without glycerol: p < 0.05 (*) and p < 0.01 (**). (B) Relationship between blue-channel intensity obtained with BChCl and cholinesterase activity measured using the Cobas c311 analyzer. Each point represents one human serum sample (n = 6; Spearman’s rs = 0.543, p = 0.2972). (C) Representative paper responses under the selected conditions using AChCl, 5% glycerol, and 4 µL of serum. All assays used 8 µL of substrate at 60 mM, without prior drying and with reading after 20 min (H20). Glycerol concentration is expressed as % (v/v) in the substrate solution before serum addition. In each image, the upper square is the pH indicator paper used for color detection, and the lower square is the LF1 reaction paper.
When the analysis was restricted to formulations containing glycerol (8 µL of AChCl or BChCl at 60 mM), serum volume had no significant overall effect in commercial, female, or male serum (p = 0.1505, p = 0.3125, and p = 0.1365, respectively). Comparisons between 4, 6, and 8 µL were also not significant with either substrate (p > 0.05). Therefore, 4 µL was selected to minimize sample consumption. AChCl and BChCl showed no significant differences at any serum volume (p > 0.05). AChCl was selected because it produced a more easily distinguishable color change during the initial screening, rather than because of a statistically demonstrated advantage over BChCl under the final assay conditions.
Blue-channel intensity obtained with BChCl using 4 µL of serum and 8 µL of substrate at 60 mM with 5% glycerol under H20 conditions was compared with the individual pre-treatment cholinesterase activities measured using the Cobas c311 analyzer (Table 1; Figure 5B). No significant correlation was found in the six human serum samples (Spearman’s rs = 0.543, p = 0.2972). The small sample size (n = 6) and narrow activity range (8287–10,305 U/L) limit this comparison. Samples with low or moderately inhibited cholinesterase activity were not included, so assay performance under these conditions remains unknown. This comparison evaluated the BChCl formulation under the tested conditions. The selected AChCl formulation was not compared directly with Cobas measurements. The correlation analysis alone does not establish agreement between methods.
Based on these results, the selected working conditions were 4 µL of serum and 8 µL of AChCl at 60 mM with 5% glycerol, without prior substrate drying and with reading after 20 min (H20). These conditions were retained for further assay development. Glycerol concentration refers to the substrate solution before serum addition. Representative responses obtained with commercial, female, and male serum under these conditions are shown in Figure 5C.
4. Discussion
Our previous study established a portable paper-based biosensor for cholinesterase activity screening in capillary blood using RGB analysis [25]. The present study used a two-layer LF1/pH-indicator paper platform to examine how substrate formulation, drying, reaction time, glycerol addition, and serum volume influence the colorimetric response. The aim was to identify suitable conditions for the reaction and detection layers before integrating them into a complete device, rather than establish quantitative analytical performance or clinical diagnostic accuracy. The experiments also revealed a contribution from the serum itself to the indicator color, which must be considered when interpreting the final response.
AChCl and BChCl produced distinguishable color changes in solutions and were selected for evaluation on paper, whereas BChI showed less evident color differentiation. However, these observations do not establish whether the weaker response of BChI was related to its iodide counterion. Previous paper-based cholinesterase assays have used acetylcholine chloride with a pH indicator [16] or acetylthiocholine with a chromogenic reagent [14,15]. Bagheri et al. measured BChE activity in human serum through the fading of Prussian Blue caused by enzymatically generated thiocholine, using a scanner and ImageJ [26]. More recent approaches include a two-layer foldable paper device for AChE detection [27] and a filter-assisted system for BChE detection in clinical samples with smartphone RGB analysis [28]. Both use thiocholine-dependent reactions to generate the colorimetric response. In our assay, detection relied on a pH indicator, so the final color may reflect both reaction-associated acidification and the acid–base properties of the serum.
AChCl and BChCl did not differ significantly under the selected H20 conditions, and AChCl was retained because of its more distinguishable visual response during the initial screening. H20 generally produced lower blue-channel intensities with 8 µL of substrate at 60 mM, although the differences were not significant in every comparison. Applying the substrate without prior drying eliminated the need for reagent rehydration, which can influence colorimetric performance in paper-based devices [20]. However, the contribution of rehydration and mixing to the observed differences was not directly measured. Without glycerol, increasing AChCl concentration from 30 to 60 mM under H20 significantly reduced blue-channel intensity in commercial, female, and male serum when using 8 µL of substrate and 4 µL of serum. This supported selecting 60 mM for further experiments. With glycerol, the same concentration increase did not produce significant differences with AChCl, while BChCl showed a significant reduction only in commercial serum at 4 µL. Increasing substrate volume from 4 to 8 µL at 60 mM generally reduced blue-channel intensity with AChCl, but without significant differences. With BChCl, a significant reduction was observed only in female serum at 4 µL. Therefore, 8 µL of substrate at 60 mM was retained based on the observed response and consistency with the formulation previously selected without glycerol.
An important observation in the experiments without glycerol was the limited moisture remaining in the LF1 reaction zone after 20 min. This raised concerns about incomplete wetting of the pH indicator paper during stamping, which could leave the paper yellow even without an adequate transfer of the reaction mixture. Glycerol was therefore added to help maintain moisture in the reaction zone. With AChCl, glycerol reduced mean blue-channel intensity at all serum volumes, although significant differences were found only in commercial serum at 6 µL, female serum at 8 µL, and male serum at 4 µL. With BChCl, a significant reduction was observed only in commercial serum at 6 µL. These findings supported retaining 5% glycerol in the working formulation, although its effect varied among samples and volumes. Glycerol can absorb atmospheric moisture, reduce evaporation, and modify solution viscosity [29,30,31]. These properties may have influenced the observed response. However, moisture loss, retained liquid volume, wetted area, transfer efficiency, and reaction kinetics were not measured. The changes in blue-channel intensity therefore cannot establish whether glycerol acted through improved hydration or liquid transfer. Manual stamping may also have introduced variability in liquid transfer because applied pressure, alignment, and contact area could vary between applications. The contribution of these factors to the observed signal variability was not determined.
Consequently, lower blue-channel intensity cannot be attributed to a specific mechanism or interpreted as increased cholinesterase activity, analytical sensitivity, or accuracy. Under H20 with glycerol, serum volume had no significant overall effect in commercial, female, or male serum, and comparisons between 4, 6, and 8 µL were not significant with either substrate. Therefore, 4 µL was selected to minimize sample consumption.
No significant correlation was found between blue-channel intensity obtained with BChCl and reference cholinesterase activity in the six human serum samples (Spearman’s rs = 0.543, p = 0.2972). Although greater enzymatic acid production might be expected to reduce blue-channel intensity, this relationship was not observed consistently. Differences in serum pH and buffering capacity may have influenced the response, although these properties were not measured. The narrow activity range (8287–10,305 U/L) and small sample size also limit interpretation. Importantly, this exploratory comparison used BChCl rather than the finally selected AChCl formulation, so the relationship between the selected assay response and reference cholinesterase activity remains to be established. Commercial serum also showed no higher blue-channel intensity despite its lower enzyme activity, although differences in sample characteristics and processing limit direct comparison. These findings suggest that absolute blue-channel intensity alone is not yet sufficient to estimate serum cholinesterase activity reliably.
The basal controls provided further insight into the colorimetric response. The pH indicator paper (transition range: 6.4–8.0) remained yellow after exposure to ultrapure water or substrate solutions, with or without glycerol. In contrast, both untreated and heat-treated commercial serum changed the indicator from yellow to green, consistent with the near-neutral pH of human serum. Interestingly, both serum samples produced similar green colors despite their marked difference in cholinesterase activity. This suggests that, without added substrate, enzymatic activity had little visible influence on the basal indicator color under the tested conditions. When serum reacts with a cholinergic substrate, the expected color change arises from acid production during enzymatic hydrolysis. However, this response also depends on the initial pH and buffering capacity of the sample, which may vary among individuals and with storage conditions. As a result, the final RGB signal may reflect both sample-related acid–base effects and reaction-associated acidification. The serum-only controls in Figure 2E,F contained no substrate and therefore cannot establish how active and heat-treated serum would differ after a 20-min reaction with substrate. The selected AChCl formulation containing 5% glycerol was not tested with heat-treated serum under H20 conditions, so its ability to distinguish untreated from heat-treated serum remains unestablished. In addition, incomplete wetting of the indicator paper may influence the measured color, as observed in the experiments without glycerol. Although image acquisition was standardized, individual serum pH and buffering capacity were not measured, and sample-specific background correction was not performed. The endpoint color therefore cannot be attributed solely to cholinesterase activity. Previous studies have shown that image acquisition conditions and RGB data processing can influence colorimetric measurements in paper-based assays [13,22,32,33]. Future experiments should therefore evaluate a matched background measurement for each sample and determine whether correcting for this contribution improves the relationship with reference cholinesterase activity.
Female and male serum samples were analyzed separately to describe the response within each group. However, with only three donors per sex, the study was not designed to investigate sex-related differences. The limited number of biological samples also reduces statistical power, meaning that nonsignificant differences cannot be taken as evidence of equivalent responses. Similarly, results obtained from a single commercial serum vial apply only to the material tested.
Despite these limitations, the selected configuration of 4 µL of serum and 8 µL of AChCl at 60 mM with 5% glycerol, without prior substrate drying and with reading after 20 min, provides a starting point for further microdevice development. Integrating a blood-separation component will require control of the liquid volume reaching the reaction zone and verification that residual blood cells do not interfere with color detection. If dried reagents are incorporated, their rehydration and subsequent colorimetric response will need separate evaluation. Reliable field operation will also require consistent reaction times and image acquisition conditions, together with studies of reagent stability and performance under different temperatures and humidity levels. Li et al. combined a paper-based assay with smartphone-assisted colorimetric and photothermal detection of BChE and alkaline phosphatase [34]. For the present assay, portable image acquisition would need to be evaluated together with sample-background correction and calibration against reference cholinesterase activity. Importantly, future development should consider both the basal color contribution of each sample and the efficiency of liquid transfer between the reaction and indicator layers. An initial reading or a matched sample control could help correct for background effects, although this approach must be tested experimentally. The resulting signal should then be calibrated against individually matched Cobas measurements over a broader range of cholinesterase activities, including low-activity samples. These studies will help determine whether the platform can reliably distinguish activity levels and eventually support quantitative measurements.
5. Conclusions
This study defined a working configuration for the reaction and detection components of a paper-based cholinesterase assay that combines LF1 paper with pH indicator paper. This provides preliminary operating conditions for future device development rather than a validated quantitative assay. The selected configuration used 8 µL of substrate at 60 mM, applied without prior drying and read after 20 min. AChCl and BChCl did not differ significantly under these conditions. AChCl was retained for its visual response during the initial screening. A serum volume of 4 µL was chosen because larger volumes offered no consistent improvement. The selected formulation contains 5% glycerol (v/v). The selected conditions provided a suitable colorimetric response while limiting sample consumption. However, not all selected conditions showed statistically significant differences from the alternatives tested.
Commercial serum contributed to the basal indicator color, indicating that the endpoint RGB signal may include sample-related effects in addition to reaction-associated acidification. No significant correlation was detected between blue-channel intensity obtained with BChCl and reference cholinesterase activity in the six human serum samples. Quantitative use will therefore require evaluation of a per-sample background correction, together with calibration against reference cholinesterase activity, including low-activity samples. Several properties remain to be established before this configuration can be integrated into a field microdevice: precision, formulation stability, behavior under varying temperature and humidity, and performance with the cell-free fraction separated from whole blood and with dried reagents. Before the assay can be used to quantify serum cholinesterase activity, further studies will need to establish its calibration range, sensitivity, limits of detection and quantification, precision, recovery, reproducibility, selectivity, and agreement with the reference method.
6. Patents
J.Z.-H. and C.E.Z. are named inventors on a patent application related to this work (application No. 202602888), filed on 27 August 2026.
Supplementary Materials
The following supporting information can be downloaded at: https://www.mdpi.com/article/10.3390/bios16110628/s1, Figure S1 presents the complete photographic record of the initial liquid-phase substrate evaluation. Figures S2 and S4 contain representative photographs of the paper-based assay without and with 5% glycerol, respectively. Figures S3 and S5 contain the corresponding RGB channel intensity plots. Tables S1 and S2 summarize significant two-way ANOVA effects for experiments without and with 5% glycerol, respectively.
Author Contributions
Conceptualization, C.E.Z. and J.Z.-H.; methodology, C.E.Z. and J.Z.-H.; investigation, F.B.-N., P.M.-S., P.R. and J.G.-H.; formal analysis, F.H.V., F.B.-N. and P.M.-S.; resources, J.Z.-H.; writing—original draft preparation, F.H.V.; writing—review and editing, C.E.Z., J.Z.-H., F.H.V., F.B.-N., P.M.-S., P.R. and J.G.-H.; supervision, C.E.Z. and J.Z.-H.; project administration, C.E.Z. and J.Z.-H.; funding acquisition, C.E.Z. and J.Z.-H. All authors have read and agreed to the published version of the manuscript.
Funding
This work was supported by the Chilean National Agency for Research and Development (ANID) through project FONDEF IT24I0045.
Institutional Review Board Statement
The study involving human participants was conducted in accordance with the Declaration of Helsinki and approved by the Scientific Ethics Committee of the University of Talca on 28 April 2026 (Approval No. 43/2024/E). The committee is accredited by the Regional Ministerial Secretariat of Health of Maule (SEREMI de Salud del Maule), Chile, under Exempt Resolution No. 1976, dated 28 September 2022.
Informed Consent Statement
Informed consent was obtained from all subjects involved in the study.
Data Availability Statement
The data supporting the findings of this study are available within the article and its Supplementary Materials. Additional data are available from the corresponding author upon reasonable request.
Acknowledgments
The authors thank Laboratorio Loncomilla for its support in this study. During manuscript preparation, the authors used ChatGPT (GPT-6, OpenAI, San Francisco, CA, USA) to improve the English and clarity of the text and to assist in preparing the graphical abstract. The authors reviewed and edited all outputs and take full responsibility for the content of this publication.
Conflicts of Interest
The authors declare no conflicts of interest.
References
- Saad, H.; Elfeky, S.A.; El-Gamel, N.E.A.; Abo Dena, A.S. Organophosphate pesticides: A review on classification, synthesis, toxicity, remediation and analysis. RSC Adv. 2025, 15, 40802–40822. [Google Scholar] [CrossRef] [Scilit]
- Grillo Pizarro, Á.; Achú Peralta, E.; Muñoz-Quezada, M.T.; Lucero Mondaca, B. Exposición a plaguicidas organofosforados y polineuropatía periférica en trabajadores de la región del Maule, Chile. Rev. Esp. Salud Pública 2018, 92, e201803006. [Google Scholar]
- Lepage, L.; Schiele, F.; Gueguen, R.; Siest, G. Total cholinesterase in plasma: Biological variations and reference limits. Clin. Chem. 1985, 31, 546–550. [Google Scholar] [CrossRef] [Scilit]
- Cocker, J.; Mason, H.J.; Garfitt, S.J.; Jones, K. Biological monitoring of exposure to organophosphate pesticides. Toxicol. Lett. 2002, 134, 97–103. [Google Scholar] [CrossRef] [Scilit]
- Lockridge, O. Review of human butyrylcholinesterase structure, function, genetic variants, history of use in the clinic, and potential therapeutic uses. Pharmacol. Ther. 2015, 148, 34–46. [Google Scholar] [CrossRef] [Scilit]
- Karlsen, R.L.; Sterri, S.; Lyngaas, S.; Fonnum, F. Reference values for erythrocyte acetylcholinesterase and plasma cholinesterase activities in children, implications for organophosphate intoxication. Scand. J. Clin. Lab. Investig. 1981, 41, 301–302. [Google Scholar] [CrossRef]
- Hofmann, J.N.; Keifer, M.C.; De Roos, A.J.; Fenske, R.A.; Furlong, C.E.; van Belle, G.; Checkoway, H. Occupational determinants of serum cholinesterase inhibition among organophosphate-exposed agricultural pesticide handlers in Washington State. Occup. Environ. Med. 2010, 67, 375–386. [Google Scholar] [CrossRef] [Scilit]
- Cao, J.; Wang, M.; Yu, H.; She, Y.; Cao, Z.; Ye, J.; Abd El-Aty, A.M.; Hacımüftüoğlu, A.; Wang, J.; Lao, S. An overview on the mechanisms and applications of enzyme inhibition-based methods for determination of organophosphate and carbamate pesticides. J. Agric. Food Chem. 2020, 68, 7298–7315. [Google Scholar] [CrossRef] [Scilit]
- Lewis, P.J.; Lowing, R.K.; Gompertz, D. Automated discrete kinetic method for erythrocyte acetylcholinesterase and plasma cholinesterase. Clin. Chem. 1981, 27, 926–929. [Google Scholar] [CrossRef] [Scilit]
- Worek, F.; Mast, U.; Kiderlen, D.; Diepold, C.; Eyer, P. Improved determination of acetylcholinesterase activity in human whole blood. Clin. Chim. Acta 1999, 288, 73–90. [Google Scholar] [CrossRef] [Scilit]
- Yetisen, A.K.; Akram, M.S.; Lowe, C.R. Paper-based microfluidic point-of-care diagnostic devices. Lab Chip 2013, 13, 2210–2251. [Google Scholar] [CrossRef] [Scilit]
- Martinez, A.W.; Phillips, S.T.; Whitesides, G.M.; Carrilho, E. Diagnostics for the developing world: Microfluidic paper-based analytical devices. Anal. Chem. 2010, 82, 3–10. [Google Scholar] [CrossRef] [Scilit]
- Soda, Y.; Bakker, E. Quantification of colorimetric data for paper-based analytical devices. ACS Sens. 2019, 4, 3093–3101. [Google Scholar] [CrossRef] [Scilit]
- Badawy, M.E.I.; El-Aswad, A.F. Bioactive paper sensor based on the acetylcholinesterase for the rapid detection of organophosphate and carbamate pesticides. Int. J. Anal. Chem. 2014, 2014, 536823. [Google Scholar] [CrossRef] [Scilit]
- Wongsakoonkan, W.; Ratanasongtham, P. Development of paper-based device for cholinesterase enzyme analysis from exposure to organophosphate pesticides. Health Sci. J. Thail. 2024, 6, 44–50. [Google Scholar] [CrossRef] [Scilit]
- Fernández-Ramos, M.D.; Ogunneye, A.L.; Babarinde, N.A.A.; Erenas, M.M.; Capitán-Vallvey, L.F. Bioactive microfluidic paper device for pesticide determination in waters. Talanta 2020, 218, 121108. [Google Scholar] [CrossRef] [Scilit]
- Kostelnik, A.; Cegan, A.; Pohanka, M. Acetylcholinesterase inhibitors assay using colorimetric pH sensitive strips and image analysis by a smartphone. Int. J. Anal. Chem. 2017, 2017, 3712384. [Google Scholar] [CrossRef] [Scilit]
- Miao, Y.; He, N.; Zhu, J.J. History and new developments of assays for cholinesterase activity and inhibition. Chem. Rev. 2010, 110, 5216–5234. [Google Scholar] [CrossRef] [Scilit]
- Cate, D.M.; Adkins, J.A.; Mettakoonpitak, J.; Henry, C.S. Recent developments in paper-based microfluidic devices. Anal. Chem. 2015, 87, 19–41. [Google Scholar] [CrossRef] [Scilit]
- Das, D.; Dsouza, A.; Kaur, N.; Soni, S.; Toley, B.J. Paper stacks for uniform rehydration of dried reagents in paper microfluidic devices. Sci. Rep. 2019, 9, 15755. [Google Scholar] [CrossRef] [Scilit]
- Morbioli, G.G.; Mazzu-Nascimento, T.; Stockton, A.M.; Carrilho, E. Technical aspects and challenges of colorimetric detection with microfluidic paper-based analytical devices (μPADs)—A review. Anal. Chim. Acta 2017, 970, 1–22. [Google Scholar] [CrossRef] [Scilit]
- Uhlikova, N.; Almeida, M.I.G.S.; McKelvie, I.; Morrison, R.; Kolev, S.D. Use of scanners for colorimetric analysis of microfluidic paper-based analytical devices (µPADs): A practical guide. Microchem. J. 2023, 191, 108879. [Google Scholar] [CrossRef] [Scilit]
- Chen, H.J.; Lee, P.Y.; Chen, C.Y.; Huang, S.L.; Huang, B.W.; Dai, F.J.; Chau, C.F.; Chen, C.S.; Lin, Y.S. Moisture retention of glycerin solutions with various concentrations: A comparative study. Sci. Rep. 2022, 12, 10232. [Google Scholar] [CrossRef] [Scilit]
- Uribe, S.; Sampedro, J.G. Measuring solution viscosity and its effect on enzyme activity. Biol. Proced. Online 2003, 5, 108–115. [Google Scholar] [CrossRef] [Scilit]
- Zambra, C.E.; Morales-Ferreiro, J.; Vielma, F.H.; Zúñiga-Hernández, J. Portable paper-based colorimetric biosensor for rapid screening of organophosphate exposure via acetylcholinesterase activity and RGB image analysis. Biosensors 2026, 16, 490. [Google Scholar] [CrossRef] [Scilit]
- Bagheri, N.; Cinti, S.; Caratelli, V.; Massoud, R.; Saraji, M.; Moscone, D.; Arduini, F. A 96-well wax printed Prussian Blue paper for the visual determination of cholinesterase activity in human serum. Biosens. Bioelectron. 2019, 134, 97–102. [Google Scholar] [CrossRef] [Scilit]
- Xu, J.; Tong, C.; Cao, Y.; Qin, Z.; Liao, C.; Chen, Y.; Shi, S.; Guo, Y. Dual-channel foldable microfluidic paper-based parallel enzymatic reaction systems for simultaneous visual colorimetric detecting acetylcholinesterase and α-glucosidase together with screening inhibitors. Sens. Actuators B Chem. 2024, 401, 134933. [Google Scholar] [CrossRef] [Scilit]
- Yu, Q.; Guo, Q.; Zhou, J.; Yuan, X.; Huang, K.; Chen, P. Filter-assisted smartphone colorimetry/ICP-MS dual-mode biosensor of butyrylcholinesterase in clinical samples. Sens. Actuators B Chem. 2022, 370, 132472. [Google Scholar] [CrossRef] [Scilit]
- Takamura, K.; Fischer, H.; Morrow, N.R. Physical properties of aqueous glycerol solutions. J. Pet. Sci. Eng. 2012, 98–99, 50–60. [Google Scholar] [CrossRef] [Scilit]
- Thayyil Raju, L.; Diddens, C.; Rodríguez-Rodríguez, J.; van der Linden, M.N.; Zhang, X.; Lohse, D.; Sen, U. Evaporation of binary liquids from a capillary tube. J. Fluid Mech. 2024, 983, A21. [Google Scholar] [CrossRef] [Scilit]
- Ault, J.T.; Shin, S.; Garcia, A.; Perazzo, A.; Stone, H.A. Viscosity measurements of glycerol in a parallel-plate rheometer exposed to atmosphere. J. Fluid Mech. 2023, 968, A2. [Google Scholar] [CrossRef] [Scilit]
- Menon, N.; Beery, D.; Sharma, P.; Crutchfield, A.; Kim, L.; Lauer, A.; Azimuddin, A.; Wronko-Stevens, B. Development of a smartphone enabled, paper-based quantitative diagnostic assay using the HueDx color correction system. PLoS ONE 2024, 19, e0311343. [Google Scholar] [CrossRef] [Scilit]
- Fiedoruk-Pogrebniak, M. Mathematical processing of RGB data in microfluidic paper-based analytical devices. Sci. Rep. 2024, 14, 13635. [Google Scholar] [CrossRef] [Scilit]
- Li, K.; Wang, J.; Wang, J.; Zheng, Z.; Liu, X.; Wang, J.; Zhang, C.; He, S.; Wei, H.; Yu, C.-Y. A programmable microfluidic paper-based analytical device for simultaneous colorimetric and photothermal visual sensing of multiple enzyme activities. Anal. Chem. 2024, 96, 12181–12188. [Google Scholar] [CrossRef] [Scilit]

Disclaimer/Publisher’s Note: The statements, opinions and data contained in all publications are solely those of the individual author(s) and contributor(s) and not of MDPI and/or the editor(s). MDPI and/or the editor(s) disclaim responsibility for any injury to people or property resulting from any ideas, methods, instructions or products referred to in the content. |
© 2026 by the authors. Licensee MDPI, Basel, Switzerland. This article is an open access article distributed under the terms and conditions of the Creative Commons Attribution (CC BY) license.