


Abstract
This study presents an on-device worker-safety framework that retains resolved primary risks as finite contexts for interpreting later worker behavior. Continuous FFH, workload, and BSEC-derived environmental monitoring is integrated with event-triggered No-motion gating and INT8 worker-state recognition. The selected 4.6-s CNN achieved 98.66% macro-F1 in segment-stratified validation, and nRF5340 replay completed the scheduled 1.2-s inference cycle without deadline misses. We distinguish representative literature-derived P1–P4 paradigms from a controlled integrated P4-I/P5 comparison using identical FFH, gas, workload and worker-state inputs, and identical same-episode decision rules. Across 1212 bounded matched event sequences, policy outputs agreed before episode closure; at 1812 post-closure worker-state checkpoints P5 retained prior-risk evidence, yielding 719 monitoring (R1) and 1093 elevated/critical (R2/R3) outputs, whereas P4-I had closed the earlier episode. A separate finite-state audit enumerated 9134 reachable abstract states and 91,861 admissible transitions. These deterministic findings isolate decision semantics rather than field hazard accuracy or subject-independent generalization. Separately, PPK2 profiling on an nRF5340-based Thingy:53 measured 3.319 versus 2.454 mA (periodic CNN versus CNN-skipped), a 26.05% reduction in the nRF5340 SoC mean current measured at the P2 header when inference was skipped.
1. Introduction
Industrial workers encounter acute FFH events, cumulative thermal workload, and gradual or rapid gas-related environmental changes. Occupational injury and heat-illness reports motivate wearable monitoring across these time scales [1,2,3,4]. Wearable safety systems combine inertial and environmental sensing, while TinyML enables local motion recognition [5,6,7,8]. Neither integration nor on-device inference alone establishes how a resolved hazard should affect later decisions.
Worker motion is not equivalent to occupational safety: stable behavior may coexist with ongoing environmental or workload risk, and later deterioration may occur after a primary event ends. Figure 1 contrasts direct response (P1), same-stream persistence (P2), concurrent fusion (P3), same-episode refinement (P4), and the proposed finite post-resolution retained context (P5). The taxonomy concerns decision semantics, not five independently trained classifiers.
Figure 1.
Conceptual comparison of P1–P5 decision semantics. P1 responds to current events; P2 adds same-process persistence; P3 integrates concurrent context; P4 refines evidence within one detected episode; and P5 retains a resolved risk identity for later, independently recognized worker-state evidence. P5 is shown here only as a concise conceptual post-resolution sequence; the detailed sensing-to-decision implementation is reserved for Figure 2. P4 here is a conceptual literature-derived family; the constructed, strengthened P4-I baseline used for controlled ablation is specified separately in Section 7. FFH denotes the primary fall-from-height trigger, and Fall denotes the downstream worker-state output. The schematic P4 post-event No-motion path is illustrative, not an unconditional No-motion alarm; its decision depends on the active episode and its follow-up rules. Panel colors separate the five decision paradigms, arrows denote processing order, and R0–R3 boxes show graded P5 outputs.
Our wrist-worn framework continuously evaluates FFH using the detector of [9], thermal workload through motion-derived Working/Resting and a Heat-Index-informed accumulator, and gas-related change using a BSEC indicator level and rate. When an Active or Retained risk requires more detailed evidence, the system processes a 4.6-s BMI270 window through a lightweight No-motion gate and an INT8 1D CNN, producing Stable, Unstable, or Fall. The FFH primary trigger and the CNN Fall state are separate observations. P5 preserves the identity and independently timed expiry of each risk, interprets subsequent worker-state evolution, and assigns an on-device – grade; wireless reporting is optional.
The main contributions are:
- 1.
- A fully on-device multi-sensor framework integrating FFH, thermal-workload, and gas-related primary-risk monitoring with event-triggered worker-state recognition on an nRF5340 wearable.
- 2.
- A compact worker-state abstraction—Stable, Unstable, Fall, and a separate No-motion rule—that provides behavioral evidence without requiring exhaustive activity recognition.
- 3.
- A retained-context P5 decision mechanism that separates primary-risk resolution from context expiration and maps subsequent worker-state evolution to graded – local risk levels.
- 4.
- A two-track assessment: literature-derived P1–P4 operational applicability, and a matched integrated P4/P5 ablation on identical risk and worker-state inputs that isolates retained context after episode closure, complemented by finite-state reachability checks. Neither analysis estimates population-level safety accuracy.
- 5.
- Deployment-oriented validation including continuous phase analysis, long-duration background screening, INT8 conversion, representative participant timelines, and direct nRF5340 timing.
2. Related Work
2.1. Wearable Occupational Safety and Worker-State Monitoring
Wearable occupational-safety systems integrate inertial, environmental, and physiological sensing [5,6,10,11,12]. Cumulative workload and recovery have been studied using activity, environmental exposure, worker factors, or physiological evidence [13,14,15,16,17,18]; occupational guidance motivates work–rest management without establishing the numerical parameters of our accumulator [19,20,21,22].
Wearable gas monitoring faces selectivity and calibration constraints [23,24]. BME688/BSEC and bVOC are algorithm-derived equivalents, not calibrated toxic-gas concentrations [25]. Studies combining gas with behavior or physiology motivate current-context fusion [26,27]; they do not independently demonstrate post-resolution hazard-identity retention.
IMU-based activity recognition and near-fall detection distinguish motion patterns [7,28,29,30,31,32,33,34]. Here, detailed activities are mapped to Stable, Unstable, and Fall safety evidence, with No-motion handled separately. Wearable TinyML and multi-risk systems demonstrate embedded feasibility [8,35,36,37,38,39,40], not the proposed temporal decision semantics.
2.2. Safety-Decision Paradigms and Contextual Interpretation
We organize representative safety-decision flows into five paradigms. The taxonomy describes how evidence is converted into a decision; it does not require every hazard to have a valid implementation under every paradigm.
- P1: Direct risk response.
A current event or hazardous condition directly determines the response,
Direct fall alarms and threshold-based environmental warnings are representative examples [6,41]. P1 can also issue an independent alert for a currently detected Unstable or Fall state; its limitation is the absence of explicit recovery or prior-risk linkage.
- P2: Persistence-based assessment.
P2 augments the current observation using duration, repeated evidence, trend, or accumulated burden of the same process,
Examples include accumulated exposure, temporal safety evidence, gas persistence/trend, and averaged or accumulated workload/fatigue [16,42,43]. P2 therefore adds temporal memory without requiring a separate downstream worker-state history.
- P3: Concurrent context-aware assessment.
P3 changes the interpretation of a current observation using concurrently available context,
Examples include awareness-aware proximity warnings, multi-source construction-risk fusion, location-aware fall interpretation, and gas assessment combined with worker behavior or physiology [26,27,44,45,46,47]. Workload methods that combine current activity/environment/physiology with temporal accumulation are treated as a P2–P3 boundary rather than as a separate paradigm [15,16].
- P4: Post-event refinement (same-episode follow-up).
P4 uses subsequent evidence to update the interpretation of the same detected episode,
Post-fall recovery/posture confirmation [48], post-fatigue recovery monitoring [17,18], and cascade/context-validity alert refinement [49,50,51] follow this logic. P4 can distinguish recovery from deterioration within the same episode, but the episode context closes after recovery or termination.
- P5: Retained-context stateful interpretation.
The proposed paradigm separates current risk activity from a finite resolved-but-retained context:
The decision can then depend on the risk state, its persistence/accumulated burden, the current worker state, worker-state history, No-motion evidence, and elapsed time:
Unlike P4, P5 allows a later independently recognized worker-state event to remain linked to a resolved primary risk until finite context expiry.
2.3. Implementation Dimension
Embedded TinyML, multi-sensor wearable nodes, and edge-enabled construction safety have precedents [6,8,40,52]. Their implementation features are orthogonal to the P1–P5 policy distinctions in Table 1.
Table 1.
Literature-derived P1–P5 decision paradigms. Implementation features such as TinyML, multi-sensor integration, and local MCU execution are orthogonal to this taxonomy.
2.4. Research Gap
Existing work therefore provides direct detection, persistence-based assessment, concurrent contextualization, post-event refinement within a detected episode, multi-sensor wearables, and embedded AI. The remaining distinction addressed here is the explicit preservation of a resolved primary-risk context so that later worker-state evidence can still be interpreted relative to that preceding risk. This separates behavioral recovery from primary-risk resolution and from context expiration. Retention is finite: after expiry, a later worker-state event is no longer attributed to the old risk.
The proposed contribution is consequently evaluated along two separate dimensions. First, the P1–P5 comparison isolates decision semantics by applying each paradigm to the same predefined hazard/state observations wherever that paradigm has a valid operational mapping. Second, the implementation evaluation verifies the multi-risk wearable, INT8 Edge-AI, and nRF5340 execution path. This distinction avoids attributing the retained-context contribution to TinyML or multi-sensor integration alone.
3. Proposed Context-Aware Wearable Safety Framework
3.1. System Architecture
Figure 2 summarizes the five-stage on-device pipeline: sensing, primary-risk detection, event-triggered worker-state recognition, temporal interpretation, and local safety decision. The continuously active ADXL362/BME688 path evaluates FFH, thermal workload, and gas-related deterioration; the BMI270 worker-state path is enabled only when behavioral interpretation is required. Table 2 summarizes the three primary-risk modules.
Figure 2.
Implementation detail of the proposed P5 wearable framework, complementing the conceptual policy comparison in Figure 1. ADXL362/BME688 monitoring and primary-risk status updates continue independently; the BMI270 No-motion/CNN worker-state path supplies detailed evidence only while an Active or Retained risk requires it. FFH is a primary event; Fall is the TinyML-recognized worker state. Blue/green blocks denote sensing and on-demand worker-state processing; orange blocks show primary-risk detection, and purple/red blocks denote context interpretation and graded decisions. Stage numbers indicate the stage order; arrows within Stage 3 indicate its internal processing flow, while Stages 3–5 form a recurrent decision loop.
Table 2.
Primary occupational-risk modules in the proposed framework.
The primary-risk detector output is
and each risk i maintains a semantic state
The Retained state begins only after the corresponding primary-risk resolution rule is satisfied. An ordinary activity label such as cooking or restroom use is a retrospective dataset annotation, not a state directly recognized by the embedded system; such a label does not automatically suppress a gas-related Active context. Detailed worker-state processing is enabled, while at least one risk is Active or Retained:
Thus, behavioral recovery, primary-risk resolution, and context expiration are separate system events. The finite-state evaluation permits at most one simultaneously Active primary-risk type but multiple independently Retained risk identities. Each valid Active/Retained context interprets subsequent worker-state evidence separately; the overall risk level is the maximum of its context-specific grades. Expiring one retained context removes only that identity and recomputes the grade from the remaining contexts. If the same primary risk reappears during Retained, its context is reactivated and interpreted as severe recurrence, without erasing other Retained risks.
3.2. Wearable Hardware and Primary-Risk Layer
The system extends the nRF5340 wrist-worn platform used in our previous FFH work [9]. The low-power ADXL362 and BME688 operate continuously, while the BMI270 supplies 100-Hz six-axis data for event-triggered worker-state recognition. Sensing, primary-risk logic, INT8 inference, context management, and local decision making run under Zephyr RTOS; wireless communication is optional and follows the on-device decision.
3.2.1. Fall-from-Height Risk
The FFH detector combines inertial and pressure evidence and was previously validated in detail [9]; its full detector derivation is not repeated here. In the present framework, the FFH output establishes the primary-risk context and triggers detailed worker-state observation. It is not the same signal as the later TinyML Fall state.
3.2.2. Thermal Workload
The thermal module combines motion-derived Working/Resting estimation with a Heat-Index-informed workload accumulator. Motion-peak amplitude and inter-peak interval index an empirical Working/Resting lookup table constructed from the data described in Section 5.1. Figure 3 shows the motion and Heat-Index maps.
Figure 3.
Empirical motion-derived Working/Resting probability (left) and Heat-Index-informed, study-defined workload levels (right). These operational categories do not reproduce OSHA/NIOSH exposure limits, WBGT, radiant heat or physiological measurements.
The implementation uses Heat-Index working-duration parameters of 60, 45, 30, and 15 min/h for Normal, Caution, High, and Very High conditions, respectively. These are system-specific monotonic operating parameters rather than OSHA/NIOSH compliance limits. The corresponding workload increment is
and Resting subtracts 3 points/min. The bounded score is
Thermal workload becomes Active at and resolves only when Resting reduces the accumulator to , not when Stable behavior is recognized or the score first drops below 180. Working adds 3/4/6/12 points/min according to the four Heat-Index levels, whereas Resting subtracts 3 points/min. These are internal workload-management parameters, not direct physiological measurements or OSHA/NIOSH exposure limits.
3.2.3. Rate-Aware Gas-Risk Assessment
The BME688/BSEC - and bVOC-equivalent values ( and ) are analyzed on their original ppm-equivalent scale, not as independently calibrated or toxic-gas concentrations [25]. The 1-s decision uses causal 60-s rates (ppm-equivalent/min) and 120-s projections:
For study-specific screening parameters , a fast rise is indicated by , and both forecasts reaching their respective reference levels. The condition must persist for 30 s, or both actual indicators must exceed their references for 60 s, to initiate Gas Active. The forecast therefore lowers the effective current-level threshold for fast increases; the correlated BSEC indicators do not independently confirm chemical exposure.
Gas resolution requires both measured levels and both signed projections below their respective references for 60 consecutive elapsed seconds. This prevents a sub-threshold but rapidly rebounding signal from being cleared; only confirmed resolution changes Gas Active to P5 Retained. The rates, reference levels, and hold times are study-specific operating choices obtained by exploratory replay, not concentration-based exposure limits. The 1–5-min horizon comparison motivating 120 s is reported in Section 5.1.2; transient gaps and invalid startup readings are excluded from confirmation.
3.3. Event-Triggered Worker-State Recognition
Detailed worker-state recognition uses a 4.6-s BMI270 window (460 samples at 100 Hz). A lightweight No-motion rule is evaluated before the CNN. For each sample,
A sample is quiet when and . No-motion is assigned when at least 95% of the first 3.6 s of the 4.6-s window is quiet; the newest 1.0 s is excluded to provide trailing-edge tolerance to emerging motion. Otherwise, the INT8 1D CNN classifies the Motion window as
Unstable is accepted from one decision (), whereas Fall is confirmed after three consecutive decisions (). The deployment decision interval is 1.2 s. Dataset construction and model selection are described in Section 4 and Section 5.
3.4. Retained-Context Interpretation and Graded Safety Decision
P5 combines the risk state, subsequent worker-state history, No-motion, and elapsed time:
and maps the local interpretation to
Here, is Normal with no Active/Retained context; denotes retained monitoring or recovery; denotes elevated concern/deterioration; and denotes a critical condition or severe recurrence. FFH primary detection and TinyML Fall are separate inputs: the former establishes context, while the latter can confirm or escalate the behavioral interpretation.
The distinction from same-episode refinement is the independent validity of a prior hazard identity after episode closure. In a matched P4 implementation, the memory associated with hazard i is cleared at . Under P5, closure of the observed episode need not delete the corresponding resolved primary-risk evidence: its risk-specific identity, residual severity, temporal history, and expiry timestamp remain available while , so a later and separately confirmed worker state can be attributed to that earlier hazard. Schematically, for the post-closure interval before expiry,
Here denotes eligibility to use the prior risk as interpretive context, not whether a newly detected worker state can independently produce an alert. P5 thus distinguishes primary-risk resolution, episode closure, and context expiry; tracks different risk types separately; and supports cross-event attribution, partial expiry, and recurrence. A prolonged P4 follow-up that preserves independently addressable hazard identity after episode closure would implement the defining retained-context function and would no longer represent the closure-limited P4 comparator used here.
P5 is executed as a recurrent Stage 3–5 decision loop rather than as a one-way Stage 1–5 chain. Newly available worker-state evidence is evaluated in Stage 3, combined with the current Active/Retained primary-risk context in Stage 4, and converted to the graded risk state in Stage 5. The decision path then returns to Stage 3 for the next worker-state update while at least one context remains Active or Retained. Stages 1–2 continue sensing and primary-risk status updates independently and are not the return target of the recurrent decision loop.
A context changes from Inactive to Active when its risk-specific activation criterion is satisfied. Active changes to Retained only after the corresponding primary-risk resolution criterion is satisfied; for thermal workload this requires complete accumulator recovery to . Retained returns to Active at a higher recurrent-risk grade (R3) if the same primary risk is reasserted, and Retained changes to Inactive only after finite expiry without reactivation or refresh. During Retained, Unstable or Fall refreshes the expiry timer as a context-management rule, whereas Stable does not. This timer rule does not assign a fixed risk meaning to the worker-state label. Stage 4 instead interprets Stable, Unstable, Fall, and No-motion jointly with the Retained risk type/status, elapsed time, and recent worker-state history, and Stage 5 then updates the graded decision from that interpretation.
The graded decision is recomputed whenever the Stage 3–5 loop receives new evidence and is therefore bidirectional rather than monotonic. New deterioration evidence can increase the decision toward or , but Unstable evidence alone must not lower a risk already at ; consistent recovery evidence can reduce a previously elevated or critical decision toward ; and the current grade can be held when the evidence does not justify a transition. is entered only when no relevant context remains Active or Retained; behavioral recovery alone does not force while a primary-risk context is still linked. Table 3 specifies the operational P5 state updates.
Table 3.
Operational P5 retained-context transition and recurrent-update semantics.
Representative P5 interpretations are summarized in Table 4. The table is not a second detector specification; it shows how the same recognized state changes meaning under different Retained risks.
Table 4.
Representative risk-specific interpretation of subsequent worker-state evidence in P5.
A system-specific follow-up interval of min is used to make retention finite. For thermal and gas risks,
whereas acute FFH uses . If Unstable or Fall occurs at while the context is Retained,
Stable does not refresh the timer. No-motion is interpreted in risk context but never substitutes for LUT-derived Rest: it cannot by itself decrement the workload accumulator. Persistent No-motion after FFH or under active/recent gas context can indicate severe deterioration. The 10-min interval is an implementation parameter, not a clinical or regulatory requirement.
4. Edge-AI Worker-State Recognition
4.1. BMI270 Inertial Data Acquisition
The hardware platform and continuously operating primary-risk sensing path are described in Section 3.2. This section focuses specifically on the six-axis BMI270 measurements used by the event-triggered worker-state recognizer. The BMI270 was configured to acquire three-axis acceleration and three-axis angular velocity at 100 Hz, with accelerometer and gyroscope ranges of and , respectively. Each worker-state sample is represented as
where denote the acceleration components and denote the corresponding angular-velocity components.
During worker-state data collection, the wearable band was worn on the dominant right wrist. The wearing position was kept consistent across recordings. When the right arm was extended forward with the back of the hand facing upward, the positive z-axis was approximately aligned with gravity; when the arm was naturally lowered beside the body with the back of the hand facing outward, the y-axis was approximately aligned with the negative gravitational direction. These reference orientations were used only to maintain consistent interpretation of the recorded six-axis signals; the CNN itself operated directly on the normalized multichannel sequence without explicit posture rules. Figure 4 shows the custom wearable and its right-wrist placement.
Figure 4.
Custom nRF5340-based wearable safety band and right-wrist wearing configuration used for BMI270 worker-state data acquisition. The BMI270 supplied the six-axis acceleration and angular-velocity measurements used by the event-triggered Edge-AI stage.
4.2. Worker-State Data Collection, Annotation, and Dataset Composition
The worker-state dataset combined two complementary acquisition modes. First, protocol-driven recordings were collected under predefined experimental conditions. These recordings included representative Stable activities and high-intensity hard-negative motions, as well as the intentionally elicited staggering motions used for the Unstable class and simulated falls used for the Fall class. Second, longer continuous recordings were collected while participants performed ordinary locomotion and work-related activities, providing additional Stable behavior and non-critical background motion beyond the predefined experimental trials. During these continuous recordings, a body-mounted action camera was used as a visual reference. After recording, the video was reviewed together with the corresponding inertial data, and the observed activity intervals were retrospectively annotated by assigning start_idx, end_idx, activity, event, and phase fields to the sensor stream. Thus, the Stable class contains data from both protocol-driven experimental recordings and video-assisted annotation of continuous activity recordings, whereas the Unstable and Fall target data were obtained from controlled experimental trials.
The numbers of participants contributing recordings to the three dynamic worker-state classes were 13 for Stable, 5 for Unstable, and 3 for Fall. The internal dataset/code label fall_like is retained only for backward compatibility. In the manuscript, the annotated simulated-fall class is consistently called Fall; the phrase fall-like nuisance is used only for non-FFH motion that can spuriously resemble a fall trigger. These values describe the class-specific data-collection pools and are reported separately from the number of mapped annotation segments and generated windows.
The study involving human participants was conducted in accordance with the Declaration of Helsinki and was approved by the Institutional Review Board of Kyungpook National University (initial approval: IRB No. KNU-2021-0164; most recent approved amendment: IRB No. 2026-0090). The study subsequently underwent continuing review and approved amendments, and IRB approval was maintained throughout the human-participant data-collection period. Informed consent was obtained from all participants prior to data collection.
The dataset was constructed to represent motion patterns relevant to post-risk safety interpretation rather than to maximize the number of fine-grained occupational activity classes. Recorded behaviors were therefore mapped to the three safety-oriented dynamic states used by the framework: Stable, Unstable, and Fall. Persistent No-motion was deliberately excluded from the CNN output space because it is determined by the pre-AI motion gate and interpreted using duration and Retained risk context, as described in Section 3.3.
The Stable class contains normal locomotion, work activities, transitions, and hard-negative movements, including walking, stair ascent/descent, turning, running, jumping, sit/stand transitions, stretching, sawing, cart handling, lifting, sorting, get-up, load carrying, and other work.
The Unstable class represents the annotated interval of temporary loss of balance without a completed fall. Staggering motions were recorded with forward-dominant and lateral-dominant perturbations during locomotion. Importantly, only the interval mapped to the stagger state contributes to the Unstable physical duration. Recovery following a stagger is mapped back to Stable when it is explicitly annotated as a recovery phase. The Fall class contains simulated forward falls, backward falls, and falls during walking. The annotation-to-state mapping is represented as
where , , and denote the annotated activity, event, and phase, respectively, and maps the detailed annotation to the corresponding safety-oriented worker state.
The dataset amount is reported at two different levels, and these quantities are not interchangeable. The physical source amount is the duration or number of independently annotated events in the recorded sensor data before window generation. The generated training amount is the number of windows produced from those recordings after applying the selected observation window, training stride, labeling rule, and optional temporal phase-shift augmentation. Because overlapping windows and shifted copies are highly correlated with their source recordings, they are reported as generated training samples rather than as additional physical recording duration.
The physical durations in Table 5 are obtained by summing samples belonging to annotation segments that are mapped to each AI state. Consequently, the currently reported 7.86 min for Unstable corresponds to approximately 13.9 s per mapped stagger segment on average across 34 segments; it does not represent the full duration of the longer recording sessions in which the stagger events occurred. These physical-duration totals are derived from the final annotation inventory and are not inflated by overlapping-window generation or phase-shift augmentation.
Table 5.
Composition and role of the recorded worker-state data before window generation. The Unstable duration refers only to intervals mapped to the stagger state; surrounding locomotion and explicitly annotated recovery intervals are not counted as Unstable. Fall data are additionally reported by event count because falls are discrete short-duration events.
Background evaluation was kept separate from conventional three-class classification. The BG pool contains only non-critical data and excludes the intentionally collected Unstable and Fall target events. It consists of two distinct sources. The first is labeled non-target data: intervals that were manually annotated during video-assisted review but were intentionally not mapped to the Stable class and were also not Unstable or Fall events. The second is unlabeled daily-life data: long continuous recordings of ordinary daily activity for which dense activity-level annotation was not performed. These unlabeled recordings can contain behavior that would likely be mapped to Stable if it were individually annotated, but they do not contain the intentionally collected Unstable or Fall target events used for model training and event evaluation.
Neither BG source is used as a fourth CNN class. Instead, both are reserved for background false-positive and robustness analysis. Because the BG recordings exclude the intentionally collected Unstable and Fall target events, only predictions of these two critical classes are counted in the background false-positive analysis. Stable predictions are not treated as false positives, because the BG pool includes ordinary non-critical behavior and may also contain unlabeled activity that would be mapped to Stable if it were densely annotated. Accordingly, the background evaluation reports Unstable and Fall abnormal predictions separately, together with their temporal persistence or episode formation. For the manually labeled non-target subset, such critical-class predictions can be treated as directly verified false positives, whereas the unlabeled daily-life subset is primarily used to assess long-duration robustness during ordinary continuous activity.
4.3. Window Generation, Labeling, and Normalization
The continuous six-axis BMI270 stream was segmented into fixed-duration observation windows. A window beginning at sample index i is represented as
where , , and is the observation-window duration.
Because safety-relevant events can occupy only part of a temporal window, both center-based and overlap-based labeling were evaluated. For Stable and Unstable annotations, an annotated interval A and observation window W were compared using the shared window-overlap ratio
and the corresponding Stable or Unstable label was assigned when
where denotes the candidate shared overlap threshold.
Fall annotations were handled separately because the physical fall interval is short relative to the longer observation windows used during model refinement. Applying the same window-overlap fraction to Fall events would cause a short but valid fall to disappear as the observation window became longer. An event-preserving labeling rule was therefore used for Fall windows. For a raw annotated fall event , the event-coverage ratio was defined as
A window was retained as Fall when and the midpoint of lay within the central 25–75% region of the window. This policy preserves almost the complete annotated fall while retaining the actual pre-event and post-event context from the same continuous recording. Windows containing only a partial fall that failed the event-preserving condition were excluded from overlap-mode training rather than being reassigned to Stable or Unstable. Thus, the candidate overlap threshold applies to Stable and Unstable, whereas Fall uses the separate event-preserving criterion.
Candidate window durations and overlap thresholds were examined using successive coarse-to-fine sweeps, with temporal windows spanning approximately 1–5 s across the complete model-development process. Training-window stride and deployment inference stride were treated as independent design variables: the former controls the temporal density of generated training samples, whereas the latter controls how frequently an already trained model is executed at deployment time.
Six-axis normalization parameters were calculated using training-partition samples only. Each channel c was standardized as
where and are the training-set mean and standard deviation of the corresponding channel. The same statistics were subsequently applied to validation data and reproduced in the embedded preprocessing pipeline.
Temporal phase-shift augmentation was evaluated only for the training partition. Three profiles were considered during refinement: no shift; a full profile containing offsets from 0 to 9 samples; and a lighter profile using offsets of 0, 3, 6, and 9 samples at the 100-Hz sampling rate. For each shifted copy, the selected training stride was retained; the shift therefore changes the window phase relative to the annotation boundaries rather than synthesizing a new motion sequence. Validation data were never augmented. Accordingly, augmentation increases the number and temporal diversity of generated training windows but does not increase the physical recording duration or the number of independent annotated events. Candidate-specific training and validation window counts are reported separately in the experimental results.
4.4. Lightweight 1D CNN Architecture and Training
A lightweight one-dimensional convolutional neural network (1D CNN) was employed to recognize safety-oriented worker states from the six-channel wrist IMU sequence. The network is intentionally compact because its role is to provide behavioral evidence to the higher-level temporal safety logic rather than to perform exhaustive fine-grained activity recognition.
Figure 5 summarizes the compact architecture: Conv1D channels increase from 6 to 32, 64, and 96 with kernel sizes 7, 5, and 3, respectively; the first two blocks include max pooling, and adaptive average pooling feeds a classifier.
Figure 5.
Architecture of the lightweight 1D CNN for worker-state recognition. The six-channel BMI270 window passes through three convolutional blocks with batch normalization, ReLU and pooling, followed by adaptive average pooling and a three-class classifier. No-motion is identified separately before CNN inference. Colored blocks identify successive processing stages, and arrows show the forward inference path.
The network contains 30,883 trainable parameters for the three-class problem. Its topology is identical for all temporal-window configurations; only the input sequence length N changes. Consequently, longer windows increase the number of convolution operations but do not change the trainable parameter count. This property enables model candidates with different temporal coverage to be compared using both recognition performance and input-dependent computational cost.
Training used a class-weighted cross-entropy loss to compensate for the substantial imbalance among Stable, Unstable, and Fall windows. For class c, the weight was inversely proportional to its number of training windows. Optimization used Adam with a learning rate of . Training was limited to 25 epochs and used early stopping with a patience of five epochs based on validation macro-F1. The best-performing model state was retained for subsequent evaluation. The random seed used for partitioning and model-development reproducibility was fixed at 42.
Host-side software environments. FP32 development used Python 3.11.5 and PyTorch 2.13.0+cu126 on a GTX 1080 Ti/i9-13900K host. INT8 conversion used Python 3.13.15, PyTorch 2.14.0, Keras 3.15.1, and TensorFlow 2.21.0 on macOS; Section 4.6 describes the conversion procedure.
The CNN produces three output logits and does not perform an activity-specific or risk-resolution decision internally. The predicted safety-oriented state is instead forwarded to the temporal interpretation stage in Section 3.4, where it is evaluated together with the retained primary-risk context, No-motion state, and dynamic-state history.
4.5. Configuration Search and Deployment-Oriented Model Selection
Model configuration was determined using a staged search rather than by selecting the highest window-level accuracy. The explored design variables included observation-window duration, training stride, labeling strategy, overlap threshold, temporal-shift augmentation profile, and deployment inference stride. Initial candidate screening used annotation-segment-stratified validation metrics, including accuracy, macro-F1, class-wise recall, and the mean recall of the safety-critical Unstable and Fall classes.
Configurations that failed to preserve all three classes in the training and validation partitions were excluded. Because multiple configurations achieved near-saturated window-level performance, the remaining candidates were further compared using event-level detection, detection delay, long-duration background false positives, temporal persistence behavior, computational complexity, INT8 robustness, and target-device execution cost. Background screening reused the trained checkpoints rather than retraining separate models for background evaluation.
After training-stride screening, the training stride was fixed at 0.1 s. Deployment decision stride was evaluated separately on fixed checkpoints, without retraining, and was selected using event coverage, phase robustness, background false positives, and embedded timing.
For clarity, the final deployment configuration uses a 4.6-s observation window, overlap-based labeling with threshold 0.725, no temporal-shift augmentation, and a 1.2-s deployment decision stride. Their comparative recognition, temporal, background, quantization, and deployment results are presented in Section 5; direct nRF5340 timing and computational-efficiency measurements are presented in Section 6.
4.6. INT8 Quantization and Deployment Preparation
High-performing FP32 candidates were converted to full-integer INT8 TensorFlow Lite models for deployment on the nRF5340. For conversion, the selected PyTorch network topology was reproduced as an equivalent Keras model, the trained PyTorch weights were transferred to the corresponding Keras layers, and FP32 output consistency between the PyTorch and Keras implementations was verified before quantization. Full-integer post-training quantization was then performed using TensorFlow Lite. Representative calibration windows were drawn exclusively from the training partition so that the held-out validation partition did not influence the quantization parameters. Multiple calibration profiles were evaluated with different numbers and class distributions of Stable, Unstable, and Fall training windows.
Quantization robustness was assessed on the held-out validation data by comparing FP32 and INT8 accuracy, macro-F1, class-wise recall, critical-state recall, and sample-wise prediction agreement. Candidate selection required preservation of safety-critical behavior after quantization rather than merely a reduction in model size.
The selected quantized model was exported as a TensorFlow Lite file and then converted to a static model-data representation for direct integration into the Zephyr firmware. The embedded preprocessing reproduced the same six-channel normalization and window organization used during host-side evaluation. The resulting inference path is
5. Experimental Evaluation
5.1. Experimental Basis and Characterization of the Continuous Primary-Risk Modules
FFH performance was previously evaluated in detail [9]; here we characterize the continuously operating thermal-workload and gas-related modules.
5.1.1. Thermal Workload Module
The Working/Resting LUT was derived from 250 h of motion data from 13 participants. Its minute-level decisions update the operational Heat-Index-informed accumulator (Equation (11)); these system-specific scores are neither physiological measurements nor WBGT exposure limits.
5.1.2. Gas-Risk Characterization and Adaptive-Threshold Basis
Table 6 summarizes 800 h of daily indoor recordings, 400 h of confined-accumulation data, and 20 rapid-change trials. Exp. 1–3 are illustrative confined combustion experiments ending at flame extinction; oxygen was not measured, so this is a qualitative endpoint rather than a measured oxygen-depletion threshold. Elevated ordinary environments and controlled rapid-change trials overlap in absolute BSEC outputs but differ in typical temporal slopes (Table 7). The daily-life comparison intentionally selected elevated outputs above 2000 (an analysis-selection value, not a gas-safety threshold).
Table 6.
Data used to construct or experimentally characterize the continuously operating thermal-workload and gas-related primary-risk modules. The environmental data amounts denote the actual recording duration or number of controlled tests used for characterization.
Table 7.
BME688/BSEC-derived - and bVOC-equivalent indicator levels and rates in representative environments. Values and rates are in BSEC ppm-equivalent units and are not calibrated exposure concentrations or limits.
The controlled rapid-change group showed mean indicator rates of 1156.66 () and 213.40 (bVOC) ppm-equivalent/min versus 133.64 and 12.72 in the selected elevated daily-life group; Cooking and Toilet overlapped these regimes. These aggregate observations motivate but do not validate the online screening thresholds in Equation (12). In a separate exploratory replay using 10-s median bins, the setting generated 6, 10, 11, 14, and 16 activations for forecast horizons of 1–5 min, respectively. At min, threshold pairs , , , and yielded 22, 16, 10, and 6 activations. These are sensitivity counts over screened, partly unlabeled recordings, not verified hazardous exposures or an optimized safety limit; they differ in sampling from the separate 1-s replay below.
A separate timestamp-aware replay of the raw ENV logs used 237 of the prior 240 files (three context-ambiguous files excluded), encompassing 5,423,763 recorded observations; 5,023,585 had valid trailing-rate comparisons after startup, gap and default-output screening. With , trailing rate limits (150,40) ppm-equivalent/min, s and 30/60-s activation/resolution holds, the gas module generated 10 Active episodes (including one Retained-to-Active reactivation) and 10 confirmed resolutions. Nine episodes were fast-rise first activations; the remaining activation was recurrence. A 60-s dual-level-only comparator was reached once within the matched Active intervals, 36 s after adaptive activation; in this case the instantaneous dual-level crossing had already occurred 23 s before the adaptive activation. The nine other adaptive Active intervals never met the 60-s dual-level comparator. These are algorithmic event counts and a single matched lead-time example, not true hazard-onset anticipation, independent gas accuracy, or measured nuisance false-positive rates. Episode lists, timestamps, and source record IDs are supplied with the replay protocol; filenames such as Cooking and Toilet do not constitute ground-truth hazard classes.
5.2. Edge-AI Evaluation Protocol and Metrics
Training-window generation and deployment-time decision sampling were treated as separate stages. The selected model uses a 4.6-s observation window, a 0.1-s training stride, overlap-based labeling with a threshold of 0.725, no temporal-shift augmentation, and full-integer INT8 deployment. Deployment decisions are generated every 1.2 s. The training stride therefore controls only the density of generated learning windows, whereas the 1.2-s decision stride controls the temporal sampling of the already trained model during continuous operation.
The train/validation partition was annotation-segment-stratified rather than subject-independent; consequently, different annotated segments from the same participant could occur in both partitions. The window-level validation results should therefore not be interpreted as cross-subject generalization performance. Window-level classification metrics are retained as a model-development measure, but final deployment selection is not based on window-level accuracy alone. The deployment-oriented evaluation emphasizes event coverage, phase robustness, temporal confirmation, long-duration background episode rates, No-motion gating, and measured target-device execution.
For continuous temporal analysis, the selected INT8 model was evaluated over the complete usable sensor recordings rather than only over isolated annotated windows. Dense inference produced 12,463,194 valid 4.6-s windows. The 1.2-s deployment stride corresponds to 120 samples at 100 Hz; therefore, all 120 unique sample-level phase offsets of the deployment decision grid were evaluated. The critical-event set contained 34 annotated Unstable events and 62 annotated Fall events.
Table 8 compares floating-point and INT8 validation results. The INT8 confusion matrix on these 98,471 windows was , using the class order Stable, Unstable, and Fall. Floating-point and INT8 predictions agreed on 99.949% of validation windows. The small change in macro-F1 after quantization (absolute decrease 0.138 percentage points) indicates that full-integer conversion preserved the classification behavior of the selected model. Because overlapping 0.1-s validation windows are highly correlated, these window-level results are reported as model-conversion and development metrics; deployment claims are based primarily on the continuous event-, phase-, background-, and target-device analyses described below.
Table 8.
Host validation of the selected 4.6-s model before and after INT8 conversion. Validation used a 0.1-s stride; the final deployment decision stride was 1.2 s.
5.3. Coarse-to-Fine Configuration Selection
The worker-state model was selected sequentially rather than by one exhaustive Cartesian sweep. Broad ranges were narrowed stage by stage, fixing variables before subsequent deployment-oriented analyses; training stride was therefore selected before deployment decision stride. Table 9 summarizes the sequential selection process.
Table 9.
Sequential coarse-to-fine selection of the final worker-state operating point.
The resulting model uses a 4.6-s window, 0.1-s training stride, overlap threshold 0.725, no temporal-shift augmentation, and INT8 conversion; deployment stride was subsequently set to 1.2 s.
The final deployment-stride comparison was narrowed to four operating points. Table 10 reports the worst phase-specific background episode rates used in this final comparison. Throughout this section, abnormal Unstable/Fall prediction runs in the background pool are reported as BG critical episodes/h. In manually labeled non-target intervals, these outputs are verified false positives relative to the annotations. In long-duration, incompletely annotated daily-life recordings, the same metric denotes an operational background alert-burden proxy rather than confirmed false positives for every episode. The BG pool intentionally excludes elicited Unstable/Fall targets; neither source is used as a fourth CNN class.
Table 10.
Long-duration background comparison of the final operating points. BG critical episodes/h counts abnormal Unstable/Fall runs; U and Fall columns show their class-specific run rates. Values are the maxima over decision-grid phase alignments and are not uniformly confirmed false-positive rates for incompletely annotated daily-life recordings.
The two 4.6-s candidates exhibited substantially lower background critical-episode rates than the 5.0-s candidates. Between the 4.6-s operating points, the 1.2-s interval retained the required critical-event robustness while reducing decision frequency relative to 0.8 s. It was therefore carried forward to class-specific temporal confirmation, No-motion validation, and target-device benchmarking.
5.4. Continuous Temporal Robustness and Class-Specific Confirmation
Across all 120 phase offsets, Unstable achieved 94.12% minimum, 94.88% mean, and 97.06% maximum event recall; or reduced worst-phase recall to 88.24%. A single decision was therefore retained to preserve short instability events.
Fall preserved 100% recall for all 62 events across every phase, whereas reduced worst-phase recall to 72.58%. The final policy is therefore Unstable and Fall , with the first Fall output treated as candidate evidence and the third as confirmation.
The exact temporal analysis also quantified confirmation delay. For Unstable , the maximum phase-wise median delay was 1.740 s and the maximum observed delay was 6.210 s. For Fall , the maximum phase-wise median confirmation delay was 3.945 s, the maximum phase-wise 95th-percentile delay was 4.529 s, and the maximum observed delay was 4.900 s. These values include the temporal effect of the 4.6-s observation window and the 1.2-s decision grid and should therefore be interpreted as system-level confirmation delays rather than neural-network execution latency.
Long-duration background predictions were additionally grouped into exact consecutive runs at the 1.2-s decision interval. Relative to accepting every single prediction, a three-consecutive-decision requirement reduced Fall background runs by approximately 74.27% while retaining 100% Fall event recall across all phases. In contrast, imposing additional persistence on Unstable would remove many isolated background predictions but would also reduce sensitivity to short true instability events. This difference motivates the class-specific temporal rules rather than a single persistence requirement for both critical states.
5.5. No-Motion-First Gating and Continuous Participant Measurements
The pre-AI No-motion gate and its acceleration/gyroscope criteria are specified in Section 3. Here we evaluate the selected 3.6-s-core/95% gate during continuous deployment; its newest 1.0-s tolerance window and 1.2-s update step remain unchanged.
This rule was evaluated using the same dense continuous inference cache and all 120 deployment-grid phases. With the final 3.6-s/95% rule, no previously confirmed critical event was lost: the Unstable worst-phase recall remained 94.12%, and Fall remained 100%. Approximately 27.86% of background decision windows satisfied the No-motion criterion. Critical BG episode rates were essentially unchanged after gating, indicating that the principal role of the gate is to separate persistent low activity from dynamic Edge-AI interpretation rather than to suppress motion-containing false positives.
Figure 6 presents all four original recorded examples—(a) Stable running, (b) staggering, (c) forward Fall, and (d) Fall while walking—with synchronized acceleration, gyroscope, Motion-only Edge-AI probabilities, manual annotations, and system decisions. In No-motion intervals, the CNN output is not interpreted as a worker-state decision; the system state is reported directly as No-motion. The forward-fall example further illustrates the intended temporal behavior: residual post-fall motion remains classified through the dynamic path until the inertial signal satisfies the No-motion rule, after which the system transitions to persistent No-motion.
Figure 6.
Representative continuous participant measurements: (a) Stable running, (b) staggering, (c) forward Fall, and (d) Fall while walking. Four panels synchronize inertial signals, Motion-only Edge-AI output, annotated activity, and the temporal system decision. Edge-AI output is not interpreted during No-motion. In all four panels, annotated activity, Edge-AI output, and system decisions use aligned, continuous colored state bands without overlapping annotation boxes. Fall pending denotes unconfirmed CNN Fall evidence before three consecutive decisions; Fall confirmed denotes the confirmed Fall state after the third consecutive decision (). The FFH primary trigger is a separate signal.
Additional participant-recorded timelines and diagnostic cases, including challenging Unstable events and background false-positive examples, are provided in Sections S1–S3 of the Supplementary Materials.
6. Embedded Deployment and Real-Time Feasibility
6.1. nRF5340 Deployment
The final 4.6-s worker-state model was converted to full-integer INT8 TensorFlow Lite and deployed directly on the Nordic nRF5340-based wearable platform. The deployed input contains 460 samples at 100 Hz from each of the six BMI270 inertial channels. Host and MCU preprocessing used the same channel order, normalization parameters, quantization parameters, and window organization. The deployment decision interval was 1.2 s.
6.2. Memory Requirements of the Selected Model
The exported INT8 model occupied 40,680 bytes (approximately 39.7 KiB). A 32,768-byte tensor arena was configured, of which 25,620 bytes were used during execution, leaving 7148 bytes of arena headroom. Table 11 summarizes memory usage and on-device timing.
Table 11.
Memory and real-time characteristics of the final 4.6-s INT8 worker-state model on the nRF5340.
6.3. On-Device Latency and Continuous Replay
Model-only latency was measured after 20 warm-up runs using 200 measured inference runs. The final model required a mean model-only inference time of 337.839 ms; the measured minimum, 95th percentile, and maximum were 337.646, 337.982, and 338.043 ms, respectively.
Continuous replay was then used to evaluate the complete embedded processing path under the 1.2-s deployment interval. Ten repeated continuous replay runs were performed, each comprising 1097 scheduled inference cycles, for a total of 10,970 inference cycles. All scheduled inference cycles were completed, with no deadline misses observed across the repeated runs. The mean total processing time was 342.027 ms, and the maximum observed total processing time was 342.407 ms. The maximum processing time therefore consumed 28.53% of the 1.2-s decision budget, leaving approximately 857.6 ms of worst-case timing margin for the remaining wearable tasks.
The utilization ratio is
All 10,970 replay cycles met the 1.2-s deadline, supporting the feasibility of event-triggered on-device inference. The selected stride also reflects continuous phase and background results (Section 5.3).
6.4. Thingy:53 PPK2 Power Measurements and Conditional CNN Operation
PPK2 measured nRF5340 SoC current on a Nordic Thingy:53 board sharing the custom wearableś nRF5340 chip. The current-measurement/debug board P2 connector carries current to the nRF5340 SoC from VOUTB; P1 is the battery-to-PMIC path. With sensor acquisition and other firmware activity held constant, CNN-enabled operation executed INT8 inference every 1.2 s, whereas CNN-skipped operation omitted it. Segment mean currents include idle intervals between CNN calls. The P2-path measurement results are summarized in Table 12. As the voltage trace was not recorded, power is calculated for an assumed 3.0-V SoC rail, not measured battery-input power.
Table 12.
Thingy:53 nRF5340 SoC current at the P2 header, measured using PPK2. Mean power assumes a 3.0-V SoC supply and is not a measurement of whole-board or battery-input power. Measurement intervals are unequal, so the comparison uses time-normalized mean current rather than raw accumulated charge.
The periodic CNN increased average SoC current by mA ( mW at 3.0 V); skipping inference decreased mean SoC current by 26.05%. A prior 8-s CNN-off segment averaged 2.4559 mA versus 2.4545 mA for the later 45-s off segment; these two segments are not independent device replicates.
For an Active/Retained CNN-enabled fraction f during a defined monitoring period, the estimated current, power and reduction relative to always executing the periodic CNN are
For a 24-h observation period, let be the total union duration (h/day) during which at least one primary risk is Active or Retained, so . Multiple overlapping contexts are counted only once for CNN gating. At fixed supply voltage, projected SoC charge and energy are
The P2 data give an incremental mAh and (at 3.0 V) mWh for each additional hour of CNN-enabled Active/Retained operation. For instance, 24-h continuously scheduled inference would consume approximately 238.96 mWh at this SoC rail, versus 187.09 mWh if it were scheduled for only 4 h (21.71% savings). The 24-h scenarios are summarized in Table 13; they are extrapolations of the measured ON/OFF averages, not 24-h PPK2 recordings.
Table 13.
Calculated 24-h nRF5340 SoC energy for assumed CNN-enabled Active/Retained duty cycles. Values are projections using the measured short-segment ON/OFF mean currents at an assumed 3.0 V, not 24-h PPK2 recordings or full-device battery consumption.
A longer Retained interval can increase and reduce gating savings. The 10-min expiry is per context, not the daily CNN runtime; repeated/overlapping risks can extend this runtime. Projections assume representative ON/OFF mean currents and negligible switching overhead; neither actual 24-h occupancy nor full-board/battery lifetime was measured.
7. Decision-Policy Evaluation
7.1. Comparison Design and Operational Scope
We separate the literature-derived operational scope of P1–P4 (Table 14) from a controlled P4-I/P5 ablation. These representative adapters are not full reproductions of published systems and may omit risk-specific functions: P2 has no source-grounded FFH accumulation rule, and P4-L has no gas-specific post-episode refinement rule. Such N/A entries denote undefined mappings, not missed detections or inherent limitations of every published implementation.
Table 14.
Operational rules and scope of the two P1–P5 comparisons. The literature-derived P4 adapter (P4-L) and the constructed integrated control (P4-I) have intentionally different purposes; P4-I is the matched ablation that isolates finite retained context.
For the retention ablation, a deliberately strong integrated P4 control (P4-I) shares P5’s FFH/Gas/Workload and confirmed worker-state inputs, initial grades, within-episode rules, and – scale. Only context lifetime differs: P4-I deletes the hazard identity at episode closure, whereas P5 preserves it until expiry/reactivation. The shared graded scale is a comparison convention, not a feature attributed to published P4 systems. denotes monitoring; only is an alert.
7.2. Matched P4-I/P5 Sequence Comparison
We generate a policy-independent, bounded symbolic sequence inventory from a declared event grammar, rather than sampling states that belong to either policy. Let denote the primary-risk types, the confirmed worker-state events (Stable, Unstable, Fall, and No-motion), and the optional worker-state choices. Here is the empty event, ⊕ denotes ordered sequence concatenation, and is a worker-state event for but is empty for . Define for gas and workload, and because FFH is an acute trigger. The initial episode pattern is
With , the three generated sequence families are
where , if and otherwise. represents one resolved episode followed by worker evidence and expiry; adds a second primary risk after the first episode closes, either a different-risk overlap () or same-risk recurrence (); and inserts one synthetic, rejected FFH-like nuisance event after closure. The cases test operational semantics, not real measured false positives. The first optional worker state precedes risk resolution (if present), whereas the second is within the first episode’s follow-up period; in and occurs after its explicit closure.
All combinations of the declared discrete choices are enumerated exactly once, yielding
Both policies start from an empty state for each path and receive the same confirmed worker events, including after episode closure in this symbolic fixture. This isolates decision semantics; it does not imply that a physical P4-I wearable would keep its CNN running after closure. For the alert-onset row of Table 15, define for policy at step j in path s, with . Then
is monitoring, not an alert. EXPIRE represents a timer-expiry event, not every intervening second; thus, the 1212 paths exhaust the stated bounded event grammar, not arbitrary-length time series, retention-horizon choices, or physical accidents.
Table 15.
Matched bounded-sequence P4-I/P5 comparison. All 1212 input paths and pre-closure decision rules are shared. Counts are symbolic output/checkpoint totals with equal weight per generated path, not field hazard sensitivity, confirmed unnecessary-alert rates, or independent real-world alarm events. In this table an alert means ; is monitoring only.
Both policy variants start from the same empty condition on every trace, receive the same input order, and use the same severity handling before episode closure. Unstable may increase a live context to at least but does not reduce an existing ; Fall sets ; No-motion is interpreted by risk type; and Stable may support de-escalation but does not erase an Active primary risk. After closure, P4-I has no old context. P5 retains each resolved primary risk and recomputes the global grade from the remaining risk-specific grades. A new primary risk arriving alongside another Retained risk or a same-risk recurrence is evaluated as critical (); an already critical state remains . Expiry removes only the targeted risk. This is a defined decision policy, not evidence that a Retained risk is clinically dangerous or that all such decisions are correct in field operation.
The 719 monitoring and 1093 alert checkpoints cover the 1812 post-closure worker observations in the designed inventory. P4-I assigns for the discarded original episode; these are modeled semantic differences, not independently adjudicated safety benefits. Of the Stable checkpoints, 198 remained at under P5 because retained severity/history still warranted concern: a confirmed Fall after resolved Gas can establish , with later Stable reducing it only to . Likewise, a new primary risk overlapping a Retained risk can receive under P5, while P4-I treats it independently. Identical detectors and pre-closure rules isolate the effect of retention.
The 2432 P4-I and 2028 P5 alert onsets are transitions into across separately initialized symbolic paths, not verified nuisance false positives. Because paths have equal weight and lack independent hazard-severity labels, the difference cannot establish fewer field alarms. The original 30-scenario inventory, illustrated in Figure 7, is also distinct from the Table 15 denominator.
Figure 7.
Representative common-input time-axis responses of the literature-derived P1–P4 adapters and P5 for FFH, gas, and thermal workload. The P1–P4 panels report binary Alert/Normal or candidate evidence; P5 reports –. These illustrative tracks are distinct from the matched P4-I/P5 ablation in Table 15. Blue and orange segments in the dedicated P5 retained-context time strip distinguish the initial retention period and the extension following the Unstable/Fall timer refresh, respectively. Unstable/Fall refresh extends the retained expiry by 10 min from the triggering event. Nominal expiry denotes the original unrefreshed reference time. All source event times, risk grades, and context boundaries remain unchanged.
7.3. Finite-State Reachability and Representative Timelines
A separate finite-state audit exhaustively explored the defined abstract event graph, not arbitrary clock-time sequences. After correcting the P3 acute-FFH flag and preventing Unstable from demoting an existing , it reached 9134 states and 91,861 transitions without tested expiry, recurrence, or cross-risk invariant violations. This source-adapted P1–P4 graph is distinct from the matched P4-I/P5 ablation and is not the denominator of Table 15. Edge traces are retained for audit; neither test measures field hazard incidence.
The Supplementary Materials retain 30 reference cases (9 FFH, 11 Gas, 10 Workload); Figure 7 illustrates selected timelines, not independent field observations for every symbolic transition.
7.4. Retention Horizon and Study Scope
The nominal min begins at Gas/Workload resolution or the acute FFH event; confirmed Unstable/Fall refreshes it, while Stable/No-motion does not. Symbolic EXPIRE is a timer event, not second-by-second enumeration. Ten minutes is a study parameter; its association and power trade-offs require field validation.
8. Discussion
The central contribution is the ability to interpret later worker-state evidence using a resolved but unexpired hazard identity, including independent expiry, recurrence and grade updates. This changes decision semantics rather than CNN accuracy.
The selected dynamic-state path confirmed 62 simulated Falls across all 120 deployment phases with three-decision confirmation; the No-motion gate represents inactivity separately rather than materially reducing background dynamic false positives. The final nRF5340 implementation used no more than 28.53% of the decision-stride budget, with no replay deadline miss. These results establish event-oriented timing feasibility, not battery-life savings.
Several limitations constrain generalization. Annotation-segment-stratified validation was not participant-independent, and only five Unstable and three Fall contributors were available; real occupational falls were not collected. Consequently, correlated validation windows characterize model development and INT8 agreement, not unseen-person accuracy. Larger participant pools and strictly independent field tests are needed.
The Heat-Index-informed workload rule uses wrist-device temperature and humidity, not direct natural wet-bulb, radiant-heat, WBGT, heart-rate, or core-temperature measurement. A No-motion decision from the pre-AI gate must not be equated with the motion-LUT-derived Rest input used to decrease . Accurate WBGT measurement would require additional sensor geometry and calibration beyond this compact wrist device; its numerical workload score is an operational proxy, not a clinical or occupational exposure limit. BSEC equivalent indicators cannot establish calibrated toxic-gas exposure limits, field false-alarm rates, or actual hazard-onset lead times. P5’s 10-min retention is not physiologically optimized. Thingy:53 PPK2 profiling at the P2 header measured nRF5340 SoC mean currents of 3.319 mA with periodic CNN and 2.454 mA when skipped. With an assumed 3.0-V rail, the incremental SoC power is 2.593 mW, or 2.593 mWh for an additional CNN-enabled hour. Over a hypothetical 24-h period, 4 or 12 h of total Active/Retained CNN operation would reduce SoC energy by 21.71% or 13.02%, respectively, compared with continuously scheduled 1.2-s inference. These are duty-cycle projections, not observed 24-h power reductions; longer retention increases the CNN-enabled occupancy. The P2 measurement excludes non-SoC board loads, and true rail voltage, custom-board battery input, actual context occupancy and field battery life remain to be characterized.
Finally, two complementary comparisons clarify interpretation. The literature-derived P1–P4 adapters have different defined scopes and N/A boundaries, whereas the integrated P4-I/P5 ablation applies identical hazard and worker-state inputs, identical within-episode graded interpretation, and a single differential feature: deletion at episode closure versus finite post-closure retention. In 1212 declared bounded symbolic sequences, P5 could still use a resolved hazard identity at 719 monitoring and 1093 warning-level post-closure worker checkpoints; P4-I could not attribute those inputs to the closed episode. In particular, the occurrence of 198 Stable observations with retained illustrates that Stable is not always synonymous with no risk. These outputs are imposed by the comparison rules and cannot establish appropriate field alarm rates without independent severity labels. Separately, the corrected finite-state audit traversed 9134 reachable states and 91,861 transitions under its abstract event alphabet with zero checked invariant violations. Neither study exhausts arbitrary continuous-time event sequences. The retention horizon and associated nuisance-alert or stale-association trade-offs need longitudinal field investigation.
9. Conclusions
We presented a wrist-worn framework integrating FFH, thermal-workload, and BSEC-derived gas indicators with event-triggered INT8 worker-state evidence and risk-specific retained context. An integrated P4-I versus P5 comparison isolated episode closure from finite context expiry while holding detectors, worker-state inputs, and within-episode interpretation constant. In 1212 generated bounded event sequences, the two implementations agreed before closure; after closure, P5 retained prior-risk linkage and could represent monitoring, continued warnings, delayed deterioration, multi-risk overlap, and recurrence. A separate corrected formal model enumerated 9134 reachable abstract states and 91,861 transitions. The retained-context contribution concerns cross-event decision semantics, not universally higher classification accuracy or a field-validated reduction in unnecessary alerts. A controlled Thingy:53 PPK2 measurement at P2 identified a 0.864 mA additional nRF5340 SoC mean current from periodic CNN execution; calculated 24-h SoC energy savings range with the cumulative Active/Retained duty time, whereas field occupancy and custom-band battery life remain unmeasured. Future work requires unseen participants, calibrated exposure instruments, timed hazard annotations, retention-length sensitivity, and custom-board battery-path power validation.
Supplementary Materials
The following supporting information can be downloaded at https://www.mdpi.com/article/10.3390/bios16110629/s1: Figures S1a–S1c, additional Stable activity timelines (walking, sawing, and stretching); Figures S2a–S2b, annotated Unstable stagger events; Figures S3a–S3d, background abnormal-prediction diagnostic cases; Section S4, the complete set of 30 P1–P5 scenario timelines (9 FFH, 11 Gas, and 10 Workload cases).
Author Contributions
Conceptualization, methodology, software, formal analysis, investigation, data curation, visualization, and writing—original draft preparation, S.K.; writing—review and editing, supervision, and funding acquisition, D.P. All authors have read and agreed to the published version of the manuscript.
Funding
This work was supported in part by the Basic Science Research Program through the National Research Foundation of Korea (NRF) funded by the Ministry of Education under Grant NRF-RS-2018-NR031059.
Institutional Review Board Statement
The study was conducted in accordance with the Declaration of Helsinki and approved by the Institutional Review Board of Kyungpook National University (initial approval: IRB No. KNU-2021-0164; most recent approved amendment: IRB No. 2026-0090). The study subsequently underwent continuing review and approved amendments, and IRB approval was maintained throughout the human-participant data-collection period.
Informed Consent Statement
Informed consent was obtained from all subjects involved in the study.
Data Availability Statement
Due to the size and breadth of the raw multi-sensor recordings, the complete dataset is available from the corresponding author on reasonable request. Selected labeled subsets and annotation tables can also be provided for reproducibility and method verification.
Acknowledgments
During the preparation of this manuscript, the authors used ChatGPT (OpenAI; GPT-5-series models, accessed in 2026) for English-language editing, logical-consistency checks, assistance with data organization and analysis-code review, LaTeX formatting, and figure/layout refinement. No experimental data were generated or altered by the tool. The authors reviewed and edited all AI-assisted output, independently verified the reported analyses, numerical results, interpretations, and references, and take full responsibility for the content of this publication.
Conflicts of Interest
The authors declare no conflicts of interest.
References
- Ministry of Employment and Labor, Republic of Korea. 2024 Occupational Accident Statistics. Policy Data, Occupational Safety and Health Policy Division. 2025. Available online: https://www.moel.go.kr/policy/policydata/view.do?bbs_seq=20250402181 (accessed on 11 September 2026).
- Ministry of Employment and Labor, Republic of Korea. Occupational Accident Statistics as of December 2024: Supplementary Statistics on Fatal Accidents Subject to Investigation. Policy Data. 2025. Available online: https://www.moel.go.kr/policy/policydata/view.do?bbs_seq=20250300573 (accessed on 11 September 2026).
- Korea Disease Control and Prevention Agency. Results of the 2024 Heat-Related Illness Emergency Department Surveillance System. Surveillance Period: 20 May–30 September 2024. Available online: https://www.kdca.go.kr/bbs/eng/189/225889/download.do (accessed on 11 September 2026).
- International Labour Organization. Heat at Work: Implications for Safety and Health; Technical Report; International Labour Organization: Geneva, Switzerland, 2024; Available online: https://www.ilo.org/publications/heat-work-implications-safety-and-health (accessed on 11 September 2026).
- Márquez-Sánchez, S.; Campero-Jurado, I.; Herrera-Santos, J.; Rodríguez, S.; Corchado, J.M. Intelligent Platform Based on Smart PPE for Safety in Workplaces. Sensors 2021, 21, 4652. [Google Scholar] [CrossRef] [Scilit] [PubMed]
- Formisano, F.; Dellutri, M.; Massera, E.; Del Giudice, A.; Barretta, L.; Di Francia, G. Wearable Sensor Node for Safety Improvement in Workplaces: Technology Assessment in a Simulated Environment. Sensors 2024, 24, 4993. [Google Scholar] [CrossRef] [Scilit] [PubMed]
- Park, S.; Youm, M.; Kim, J. IMU Sensor-Based Worker Behavior Recognition and Construction of a Cyber–Physical System Environment. Sensors 2025, 25, 442. [Google Scholar] [CrossRef] [Scilit] [PubMed]
- Yu, X.; Park, S.; Kim, D.; Kim, E.; Kim, J.; Kim, W.; An, Y.; Xiong, S. A Practical Wearable Fall Detection System Based on Tiny Convolutional Neural Networks. Biomed. Signal Process. Control 2023, 86, 105325. [Google Scholar] [CrossRef] [Scilit]
- Kim, S.; Park, D.; Kang, S.J. A Data-Driven Real-Time Fall-from-Height Detection Method for On-Device Worker Safety Wearables. Big Data Cogn. Comput. 2026, 10, 227. [Google Scholar] [CrossRef] [Scilit]
- Wang, M.; Chen, J.; Ma, J. Monitoring and Evaluating the Status and Behaviour of Construction Workers Using Wearable Sensing Technologies. Autom. Constr. 2024, 165, 105555. [Google Scholar] [CrossRef] [Scilit]
- Fasoyinu, A.A.; Azhar, S.; Sattineni, A.; Toyin, J.O. Wearable Sensing Devices for Construction Safety: Research Trends, Applications, Challenges, and Future Opportunities. Autom. Constr. 2025, 179, 106424. [Google Scholar] [CrossRef] [Scilit]
- Kim, J.; Lee, K.; Jeon, J. Systematic Literature Review of Wearable Devices and Data Analytics for Construction Safety and Health. Expert Syst. Appl. 2024, 257, 125038. [Google Scholar] [CrossRef] [Scilit]
- Shakerian, S.; Habibnezhad, M.; Ojha, A.; Lee, G.; Liu, Y.; Jebelli, H.; Lee, S.H. Assessing Occupational Risk of Heat Stress at Construction: A Worker-Centric Wearable Sensor-Based Approach. Saf. Sci. 2021, 142, 105395. [Google Scholar] [CrossRef] [Scilit]
- Cannady, R.; Warner, C.; Yoder, A.; Miller, J.; Crosby, K.; Elswick, D.; Kintziger, K.W. The Implications of Real-Time and Wearable Technology Use for Occupational Heat Stress: A Scoping Review. Saf. Sci. 2024, 177, 106600. [Google Scholar] [CrossRef] [Scilit]
- Hashiguchi, N.; Kodama, K.; Lim, Y.; Che, C.; Kuroishi, S.; Miyazaki, Y.; Kobayashi, T.; Kitahara, S.; Tateyama, K. Practical Judgment of Workload Based on Physical Activity, Work Conditions, and Worker’s Age in Construction Site. Sensors 2020, 20, 3786. [Google Scholar] [CrossRef] [Scilit] [PubMed]
- Bangaru, S.S.; Wang, C.; Aghazadeh, F. Automated and Continuous Fatigue Monitoring in Construction Workers Using Forearm EMG and IMU Wearable Sensors and Recurrent Neural Network. Sensors 2022, 22, 9729. [Google Scholar] [CrossRef] [Scilit] [PubMed]
- Yi, W.; Zong, H.; Antwi-Afari, M.F.; Chan, A.P.C. Determining the Optimal Recovery Time for Fatigued Construction Workers: Machine Learning Approach Based on Physiological and Environmental Measurements. Build. Environ. 2025, 275, 112808. [Google Scholar] [CrossRef] [Scilit]
- Jo, D.; Kim, H. The Influence of Fatigue, Recovery, and Environmental Factors on the Body Stability of Construction Workers. Sensors 2024, 24, 3469. [Google Scholar] [CrossRef] [Scilit] [PubMed]
- Occupational Safety and Health Administration. Heat: Engineering Controls, Work Practices, and Personal Protective Equipment. 2026. Available online: https://www.osha.gov/heat-exposure/controls (accessed on 14 September 2026).
- Occupational Safety and Health Administration. Heat: Water. Rest. Shade. 2026. Available online: https://www.osha.gov/heat-exposure/water-rest-shade (accessed on 14 September 2026).
- Jacklitsch, B.L.; Williams, W.J.; Musolin, K.; Coca, A.; Kim, J.H.; Turner, N. Criteria for a Recommended Standard: Occupational Exposure to Heat and Hot Environments; Technical Report DHHS (NIOSH) Publication No. 2016-106; National Institute for Occupational Safety and Health: Cincinnati, OH, USA, 2016.
- Victoroff, T.; Yeoman, K. Heat Stress: Work Schedules; Technical Report DHHS (NIOSH) Publication No. 2017-127; National Institute for Occupational Safety and Health: Spokane, WA, USA, 2017.
- Hooshmand, S.; Kassanos, P.; Keshavarz, M.; Duru, P.; Kayalan, C.I.; Kale, I.; Bayazit, M.K. Wearable Nano-Based Gas Sensors for Environmental Monitoring and Encountered Challenges in Optimization. Sensors 2023, 23, 8648. [Google Scholar] [CrossRef] [Scilit] [PubMed]
- Anwer, A.H.; Saadaoui, M.; Mohamed, A.T.; Ahmad, N.; Benamor, A. State-of-the-Art Advances and Challenges in Wearable Gas Sensors for Emerging Applications: Innovations and Future Prospects. Chem. Eng. J. 2024, 502, 157899. [Google Scholar] [CrossRef] [Scilit]
- Bosch Sensortec GmbH. BME688: Digital Low Power Gas, Pressure, Temperature & Humidity Sensor with AI—Datasheet, revision 1.3 ed.; Document No. BST-BME688-DS000-03; Bosch Sensortec GmbH: Reutlingen, Germany, 2024. [Google Scholar]
- Feeney, J.; Durkee, K.; Kiehl, Z.; DePriest, W.; Ewer, M. Contextualized Sensor Systems. WIPO Patent Publication WO2021133938A1, 1 July 2021. [Google Scholar]
- Kim, H.G. AI-Based Smart Safety Monitoring System: Integrating Gas Leak Detection and Abnormal Behavior Analysis. J. Startup Converg. Consult. 2025, 4, 19–27. [Google Scholar] [CrossRef] [Scilit]
- Bao, L.; Intille, S.S. Activity Recognition from User-Annotated Acceleration Data. In Proceedings of the Pervasive Computing; Lecture Notes in Computer Science; Springer: Berlin/Heidelberg, Germany, 2004; Volume 3001, pp. 1–17. [Google Scholar] [CrossRef] [Scilit]
- Wang, J.; Chen, Y.; Hao, S.; Peng, X.; Hu, L. Deep Learning for Sensor-Based Activity Recognition: A Survey. Pattern Recognit. Lett. 2019, 119, 3–11. [Google Scholar] [CrossRef] [Scilit]
- Mekruksavanich, S.; Jitpattanakul, A. Construction Worker Activity Recognition Using Deep Residual Convolutional Network Based on Fused IMU Sensor Data in Internet-of-Things Environment. IoT 2025, 6, 36. [Google Scholar] [CrossRef] [Scilit]
- Mekruksavanich, S.; Hnoohom, N.; Jitpattanakul, A. A Hybrid Deep Residual Network for Efficient Transitional Activity Recognition Based on Wearable Sensors. Appl. Sci. 2022, 12, 4988. [Google Scholar] [CrossRef] [Scilit]
- Gießler, M.; Werth, J.; Waltersberger, B.; Karamanidis, K. A Framework to Automatically Detect Near-Falls Using a Wearable Inertial Measurement Cluster. Commun. Eng. 2024, 3, 181. [Google Scholar] [CrossRef] [Scilit] [PubMed]
- Lee, S.; Koo, B.; Yang, S.; Kim, J.; Nam, Y.; Kim, Y. Fall-from-Height Detection Using Deep Learning Based on IMU Sensor Data for Accident Prevention at Construction Sites. Sensors 2022, 22, 6107. [Google Scholar] [CrossRef] [Scilit] [PubMed]
- Yuhai, O.; Cho, Y.; Mun, J.H. Machine Learning-Based Framework for Pre-Impact Same-Level Fall and Fall-from-Height Detection in Construction Sites Using a Single Wearable Inertial Measurement Unit. Biosensors 2025, 15, 618. [Google Scholar] [CrossRef] [Scilit] [PubMed]
- Hu, J.; Cheng, F.; Liu, M.; Xu, X.; Li, X. MicroFallNet: A Lightweight Model for Real-Time Fall Detection on Smart Wristbands. Pervasive Mob. Comput. 2025, 109, 102046. [Google Scholar] [CrossRef] [Scilit]
- Turetta, C.; Ali, M.T.; Demrozi, F.; Pravadelli, G. A Lightweight CNN for Real-Time Pre-Impact Fall Detection. In Proceedings of the 2025 Design, Automation & Test in Europe Conference (DATE), Lyon, France, 31 March–2 April 2025; pp. 1–7. [Google Scholar] [CrossRef] [Scilit]
- Malche, T.; Upadhyay, G.M.; Tharewal, S.; Balyan, V.; Mishra, V.K.; Gupta, G.; Soni, P.K. A Wearable System for Real-Time Fall Detection on Resource-Constrained Devices. Future Internet 2026, 18, 211. [Google Scholar] [CrossRef] [Scilit]
- Gautam, Y.; Jebelli, H. EMG-FLES: Flexible Wearable Electromyography and Edge-AI System for Near-Real-Time Muscle Fatigue Monitoring for Construction-Relevant Tasks. Sens. Bio-Sens. Res. 2026, 52, 101029. [Google Scholar] [CrossRef] [Scilit]
- Anjum, S.; Goode, A.; Nnaji, C.; Aryal, A. Physical Fatigue Monitoring of Construction Workers Using Edge-Based Machine Learning and Wearable Sensors. In Proceedings of the Construction Research Congress 2026: Advanced Technologies, Artificial Intelligence, and Data Analytics in Construction, San Antonio, TX, USA, 18–21 March 2026; pp. 765–775. [Google Scholar] [CrossRef] [Scilit]
- Kumar, V.A.; Bharath, P.; Nirosha, R. Wearable Real-Time Fall Detection and Hazardous Gas Exposure Monitoring Tiny ML-Based Wearable Device. In Proceedings of the 2026 International Conference on Connected Intelligence for Industrial Applications (CI2A), Punjab, India, 3–5 April 2026. [Google Scholar] [CrossRef] [Scilit]
- Abdollahpour, N.; Moallem, M.; Narimani, M. Real-Time Safety Alerting System for Dynamic, Safety-Critical Environments. Automation 2025, 6, 43. [Google Scholar] [CrossRef] [Scilit]
- Gómez-de-Gabriel, J.M.; Rey-Merchán, M.d.C.; López-Arquillos, A.; Fernández-Madrigal, J.A. Monitoring Worker Exposure to COVID-19 and Other Occupational Risks Using BLE Beacons. J. Sens. 2022, 2022, 7254225. [Google Scholar] [CrossRef] [Scilit]
- Zaidi, S.F.A.; Yang, J.; Abbas, M.S.; Hussain, R.; Lee, D.; Park, C. Vision-Based Construction Safety Monitoring Utilizing Temporal Analysis to Reduce False Alarms. Buildings 2024, 14, 1878. [Google Scholar] [CrossRef] [Scilit]
- Chan, K.; Louis, J.; Albert, A. Incorporating Worker Awareness in the Generation of Hazard Proximity Warnings. Sensors 2020, 20, 806. [Google Scholar] [CrossRef] [Scilit] [PubMed]
- Chern, W.C.; Hyeon, J.; Nguyen, T.V.; Asari, V.K.; Kim, H. Context-Aware Safety Assessment System for Far-Field Monitoring. Autom. Constr. 2023, 149, 104779. [Google Scholar] [CrossRef] [Scilit]
- Chen, J.; Zhang, Z.; Sun, X.; Zhou, Y.; Zhou, Y.; Zhao, Y.; Shi, J. A Multi-Source Data Fusion-Based Method for Safety Monitoring of Construction Workers on Concrete Placement Surfaces. Buildings 2026, 16, 1165. [Google Scholar] [CrossRef] [Scilit]
- Shastry, M.C.; Asgari, M.; Wan, E.A.; Leitschuh, J.; Preiser, N.; Folsom, J.; Condon, J.; Cameron, M.; Jacobs, P.G. Context-Aware Fall Detection Using Inertial Sensors and Time-of-Flight Transceivers. In Proceedings of the 2016 38th Annual International Conference of the IEEE Engineering in Medicine and Biology Society (EMBC), Orlando, FL, USA, 16–20 August 2016; pp. 570–573. [Google Scholar] [CrossRef] [Scilit] [PubMed]
- Casilari, E.; Oviedo-Jiménez, M.A. Automatic Fall Detection System Based on the Combined Use of a Smartphone and a Smartwatch. PLoS ONE 2015, 10, e0140929. [Google Scholar] [CrossRef] [Scilit] [PubMed]
- Nahid, N.; Ahad, M.A.R.; Inoue, S. Context-Aware Alerting in Elderly Care Facilities: A Hybrid Framework Integrating LLM Reasoning with Rule-Based Logic. Sensors 2025, 25, 6560. [Google Scholar] [CrossRef] [Scilit] [PubMed]
- Fan, L.; Peng, H.; Shi, L.; Lu, Y.; Song, Y.; Peng, F.; Wan, C.; Fan, X.; Fan, H. A Nurse-Centered Edge–Server Wearable System for Real-Time Monitoring of Occupational Stress in Clinical Care. Front. Public Health 2026, 14, 1894346. [Google Scholar] [CrossRef] [Scilit] [PubMed]
- Hong, S.; Choi, H.J.; Min, B. Separating Alert Onset Rate from Alert Duration in Wearable Stress Monitoring: A Behavior-Level Alert Policy Based on Signal Quality and Context Validity. J. Ergon. Soc. Korea 2026, 45, 361–375. [Google Scholar] [CrossRef] [Scilit]
- Lee, C.M.; Hsieh, S.H. Edge-Enabled Real-Time Framework for Context-Aware Data Acquisition and Hazard Alerting in Smart Construction Sites. Autom. Constr. 2026, 181, 106642. [Google Scholar] [CrossRef] [Scilit]
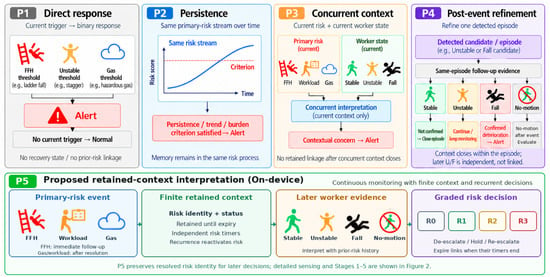
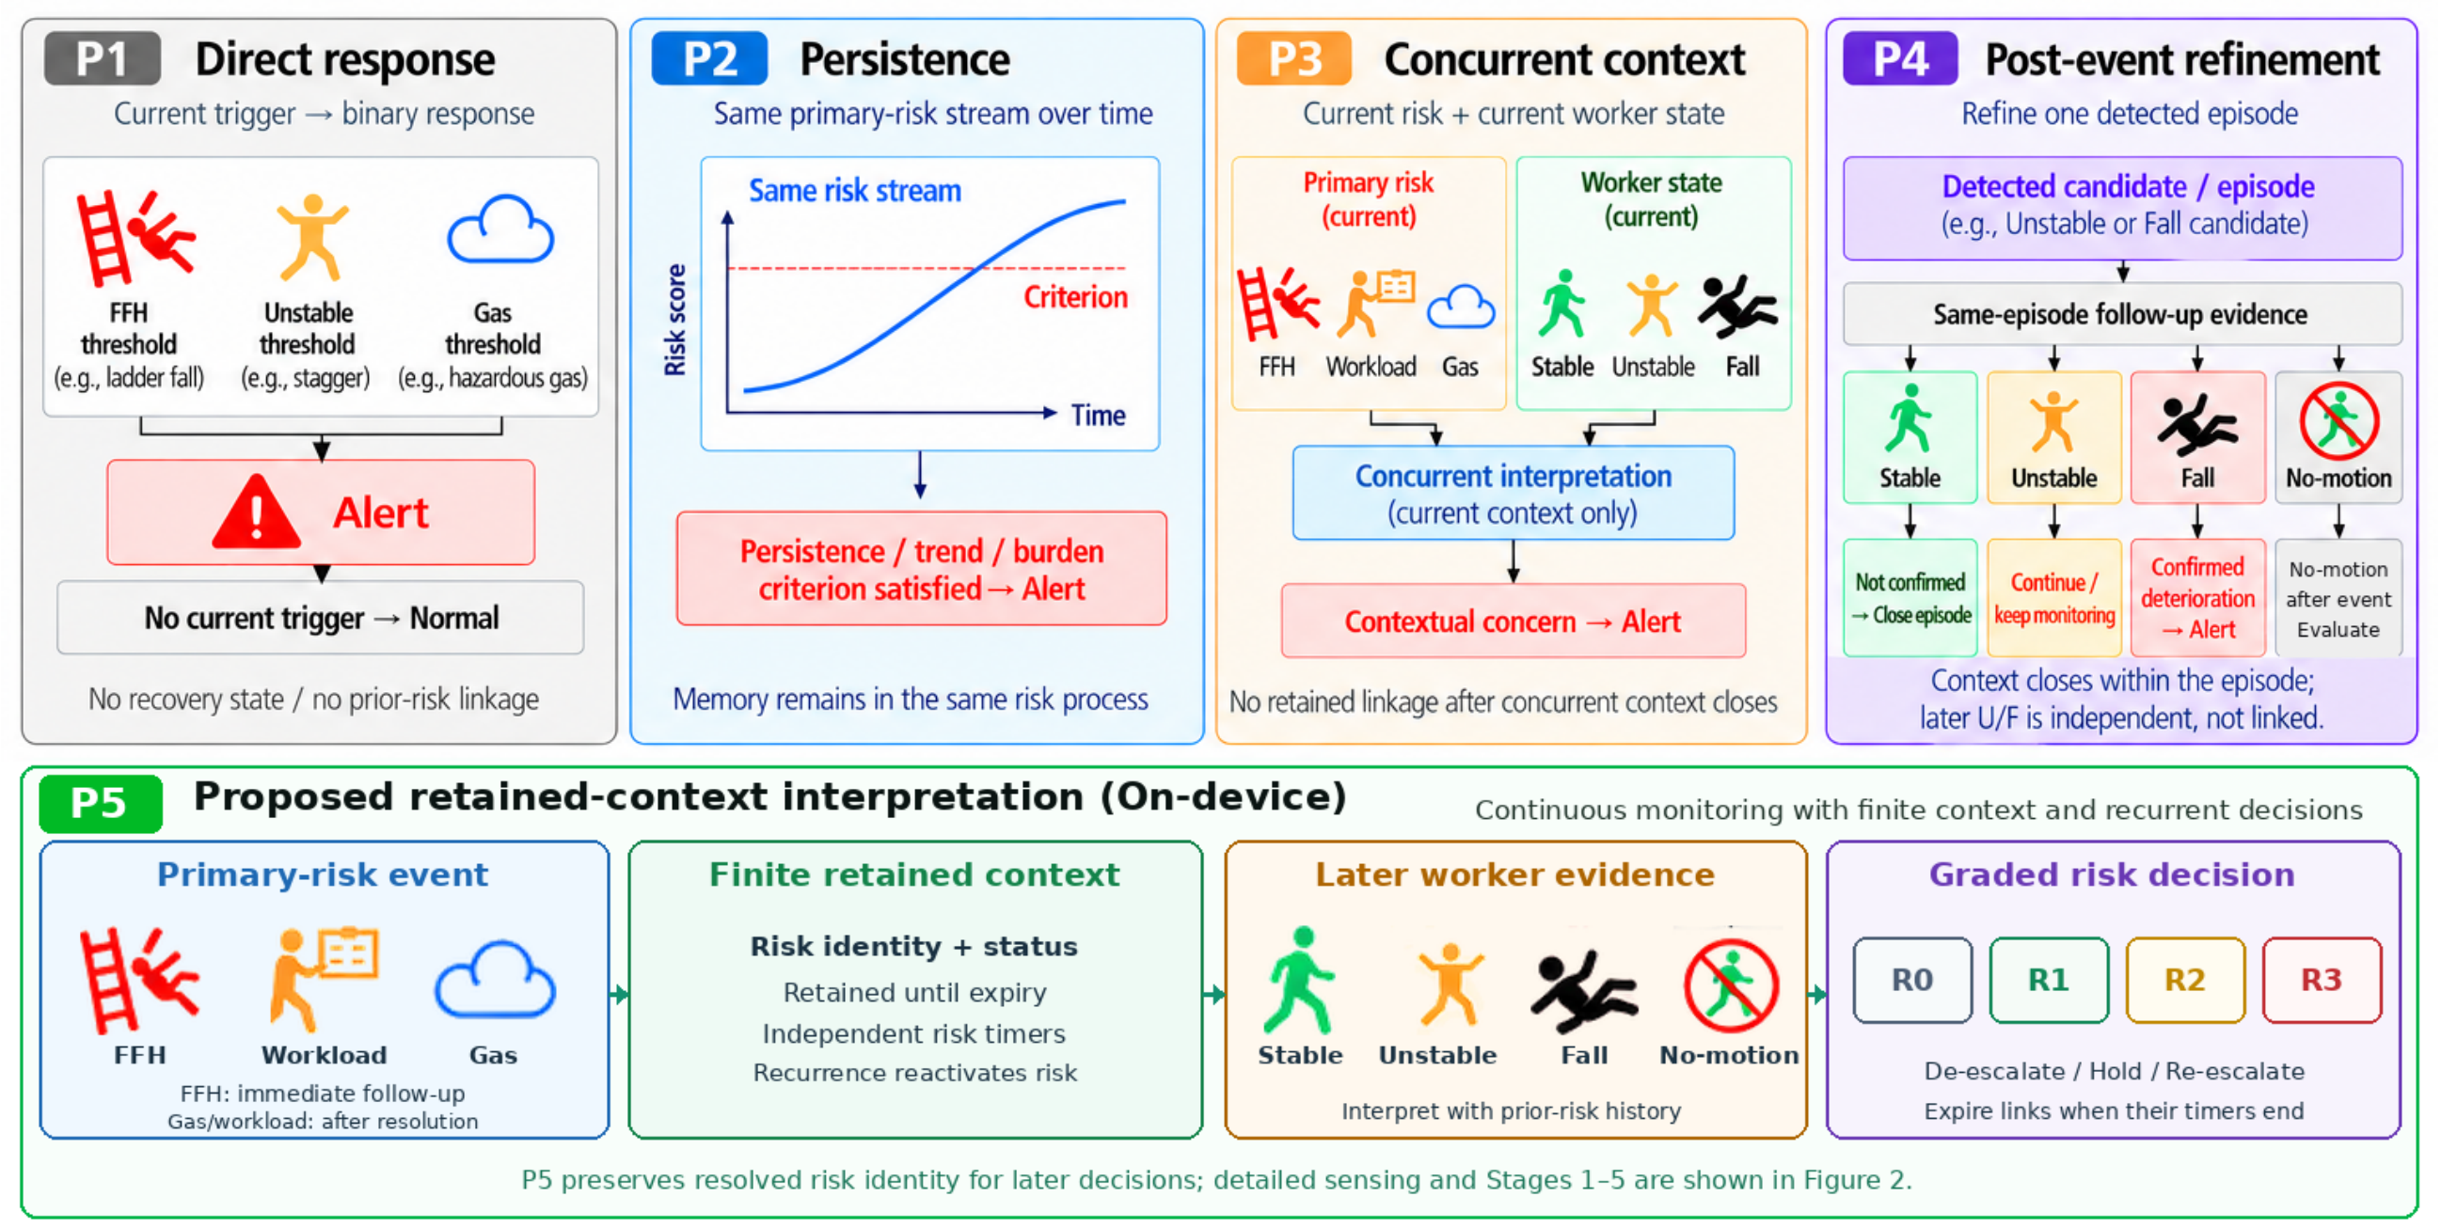
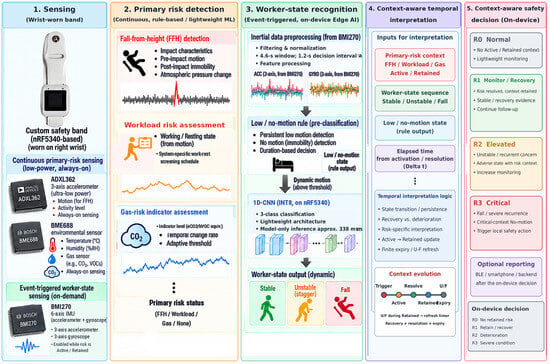
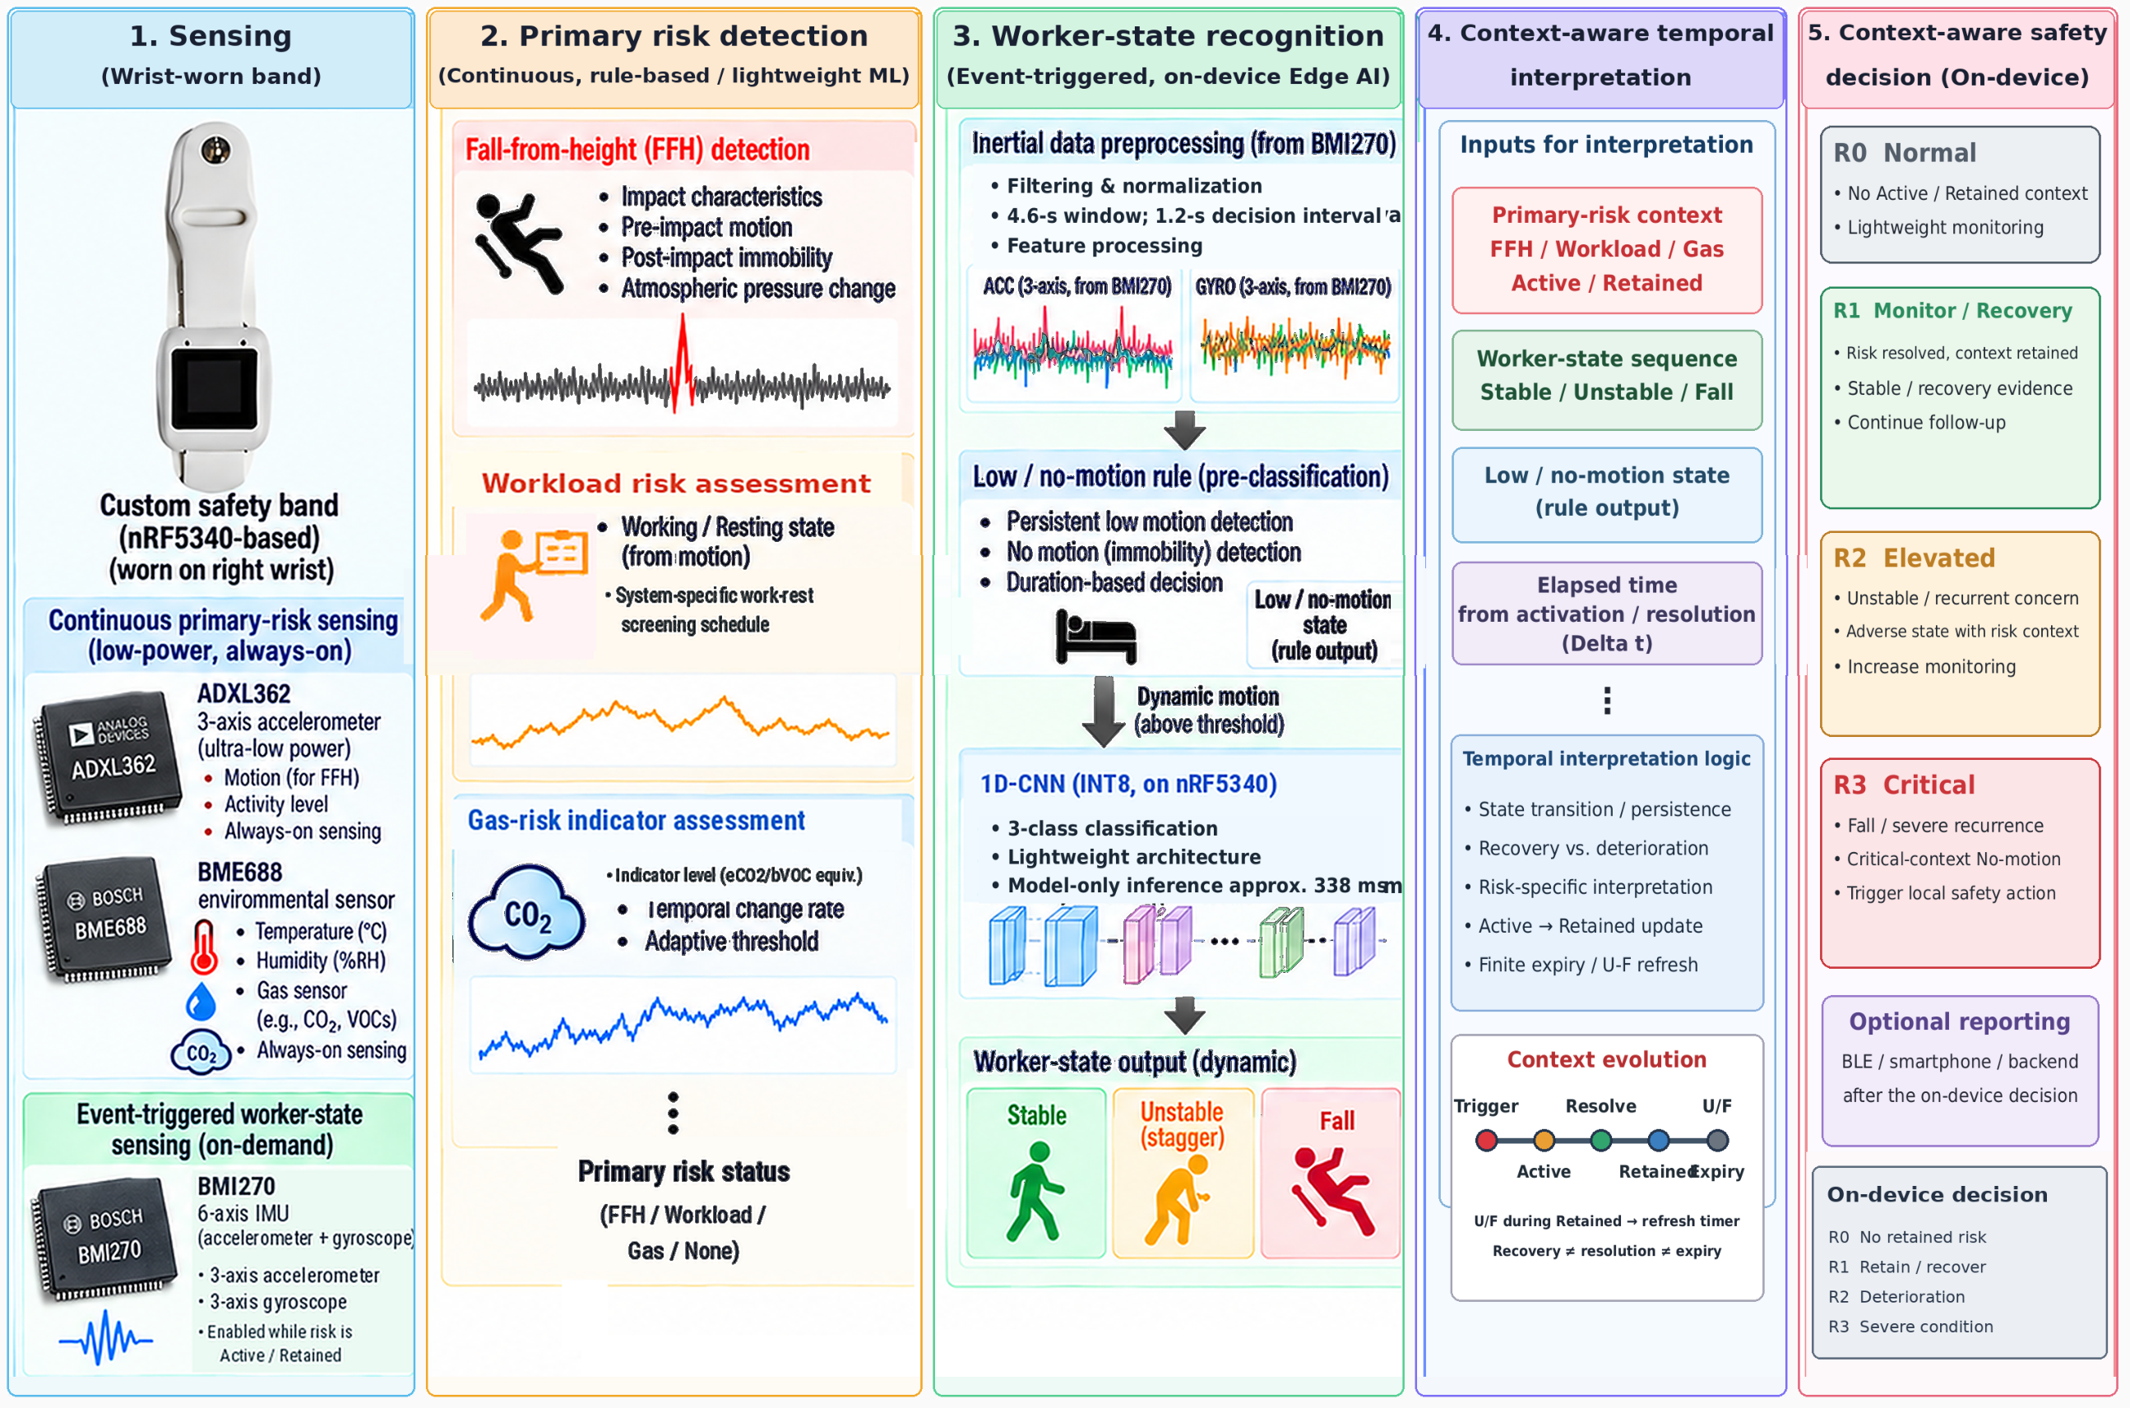
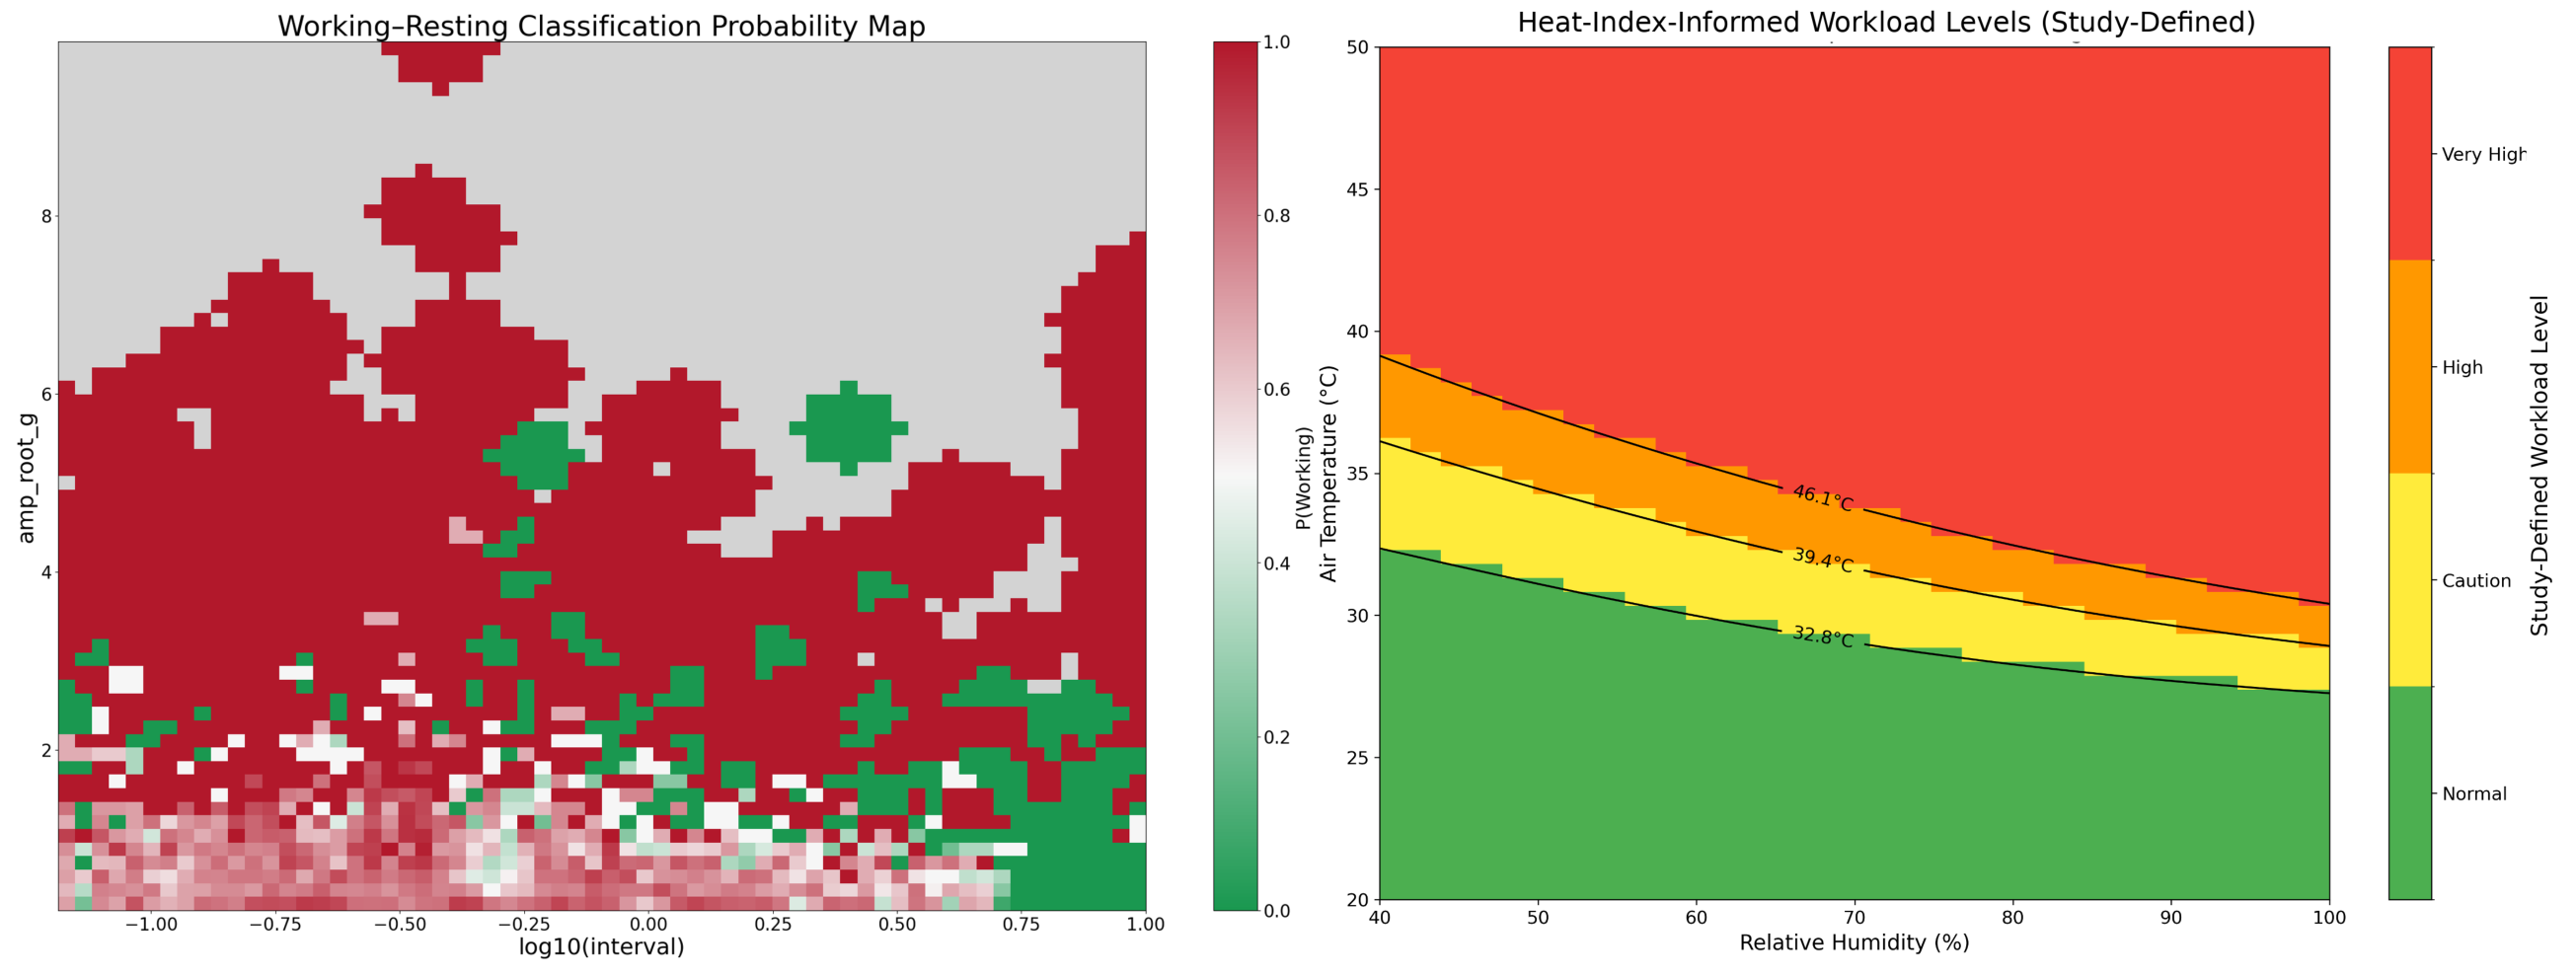
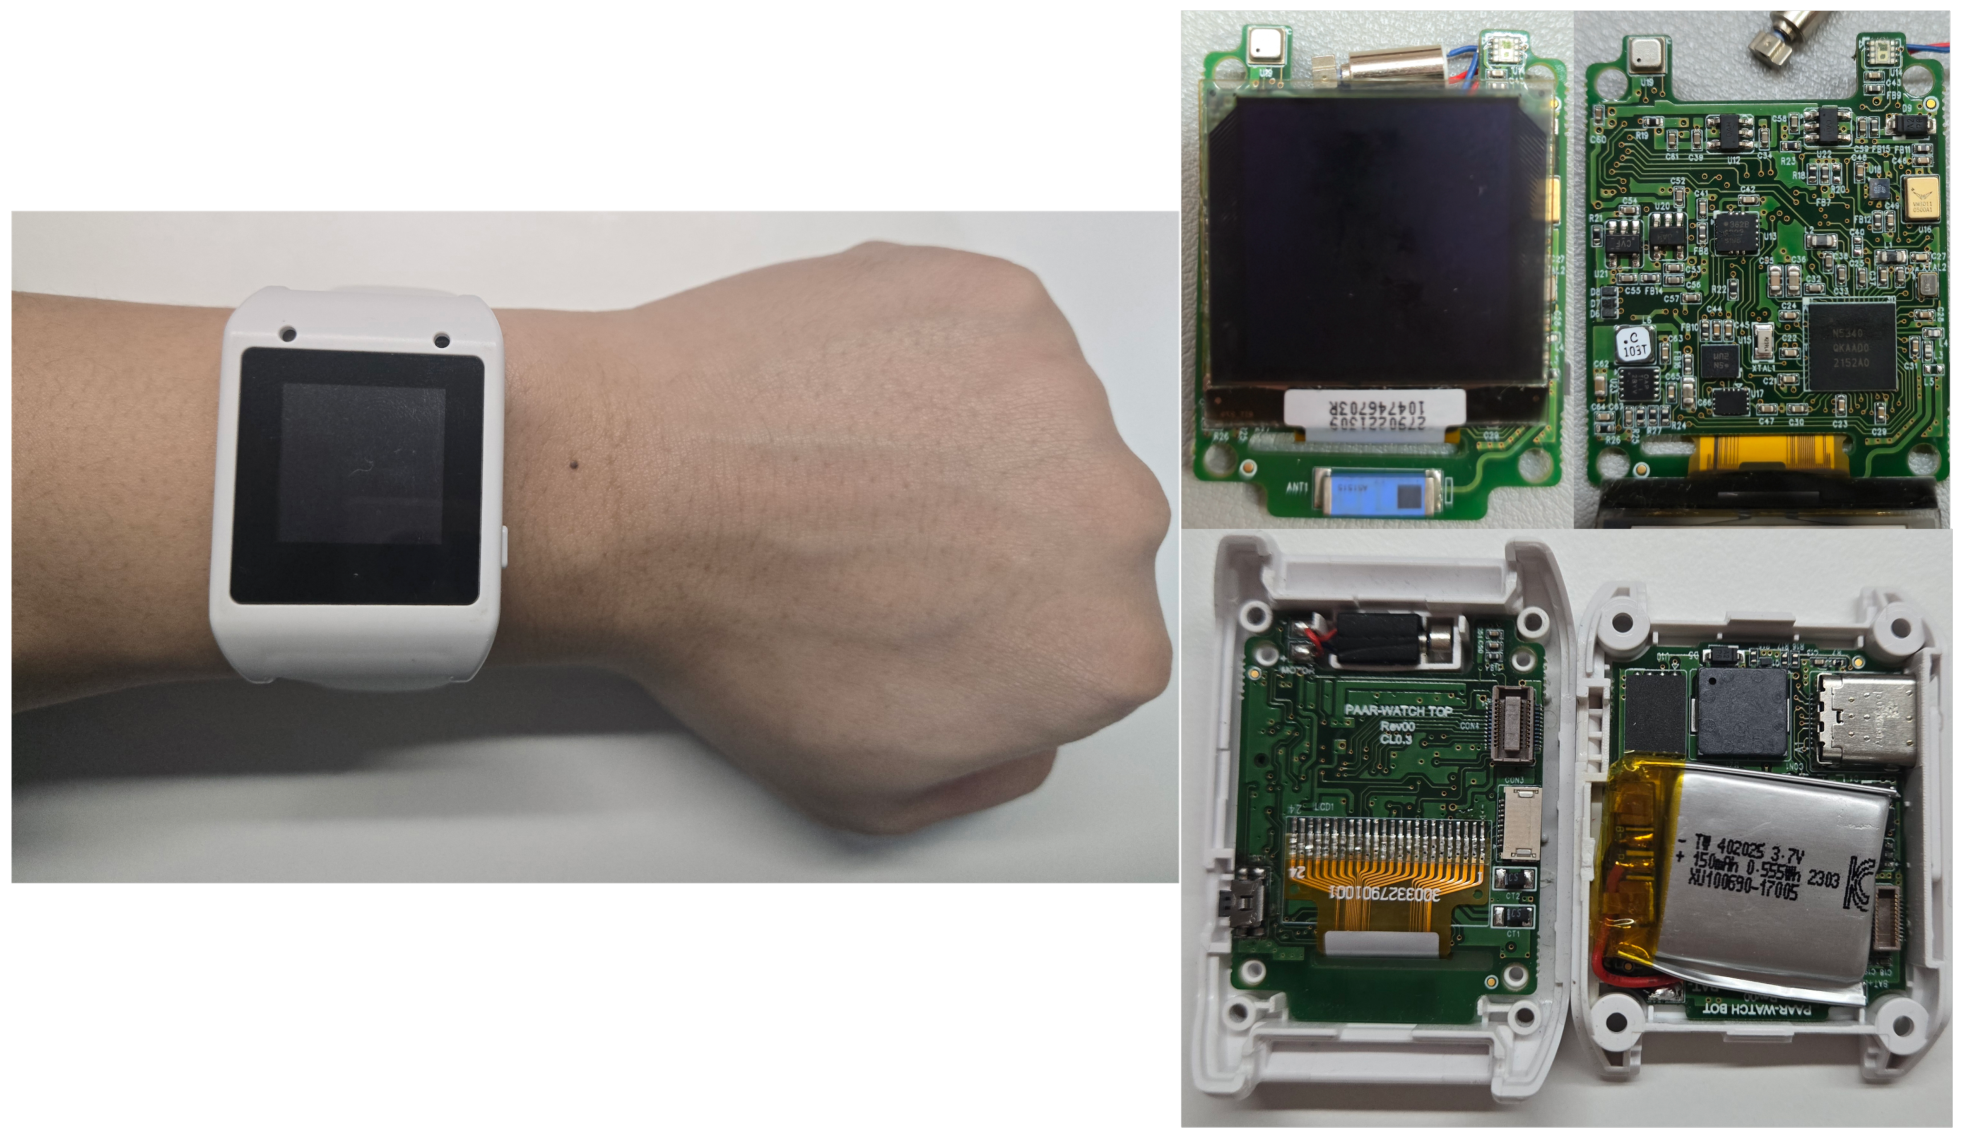
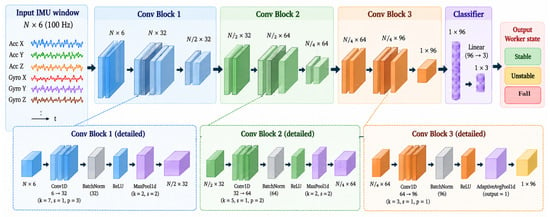
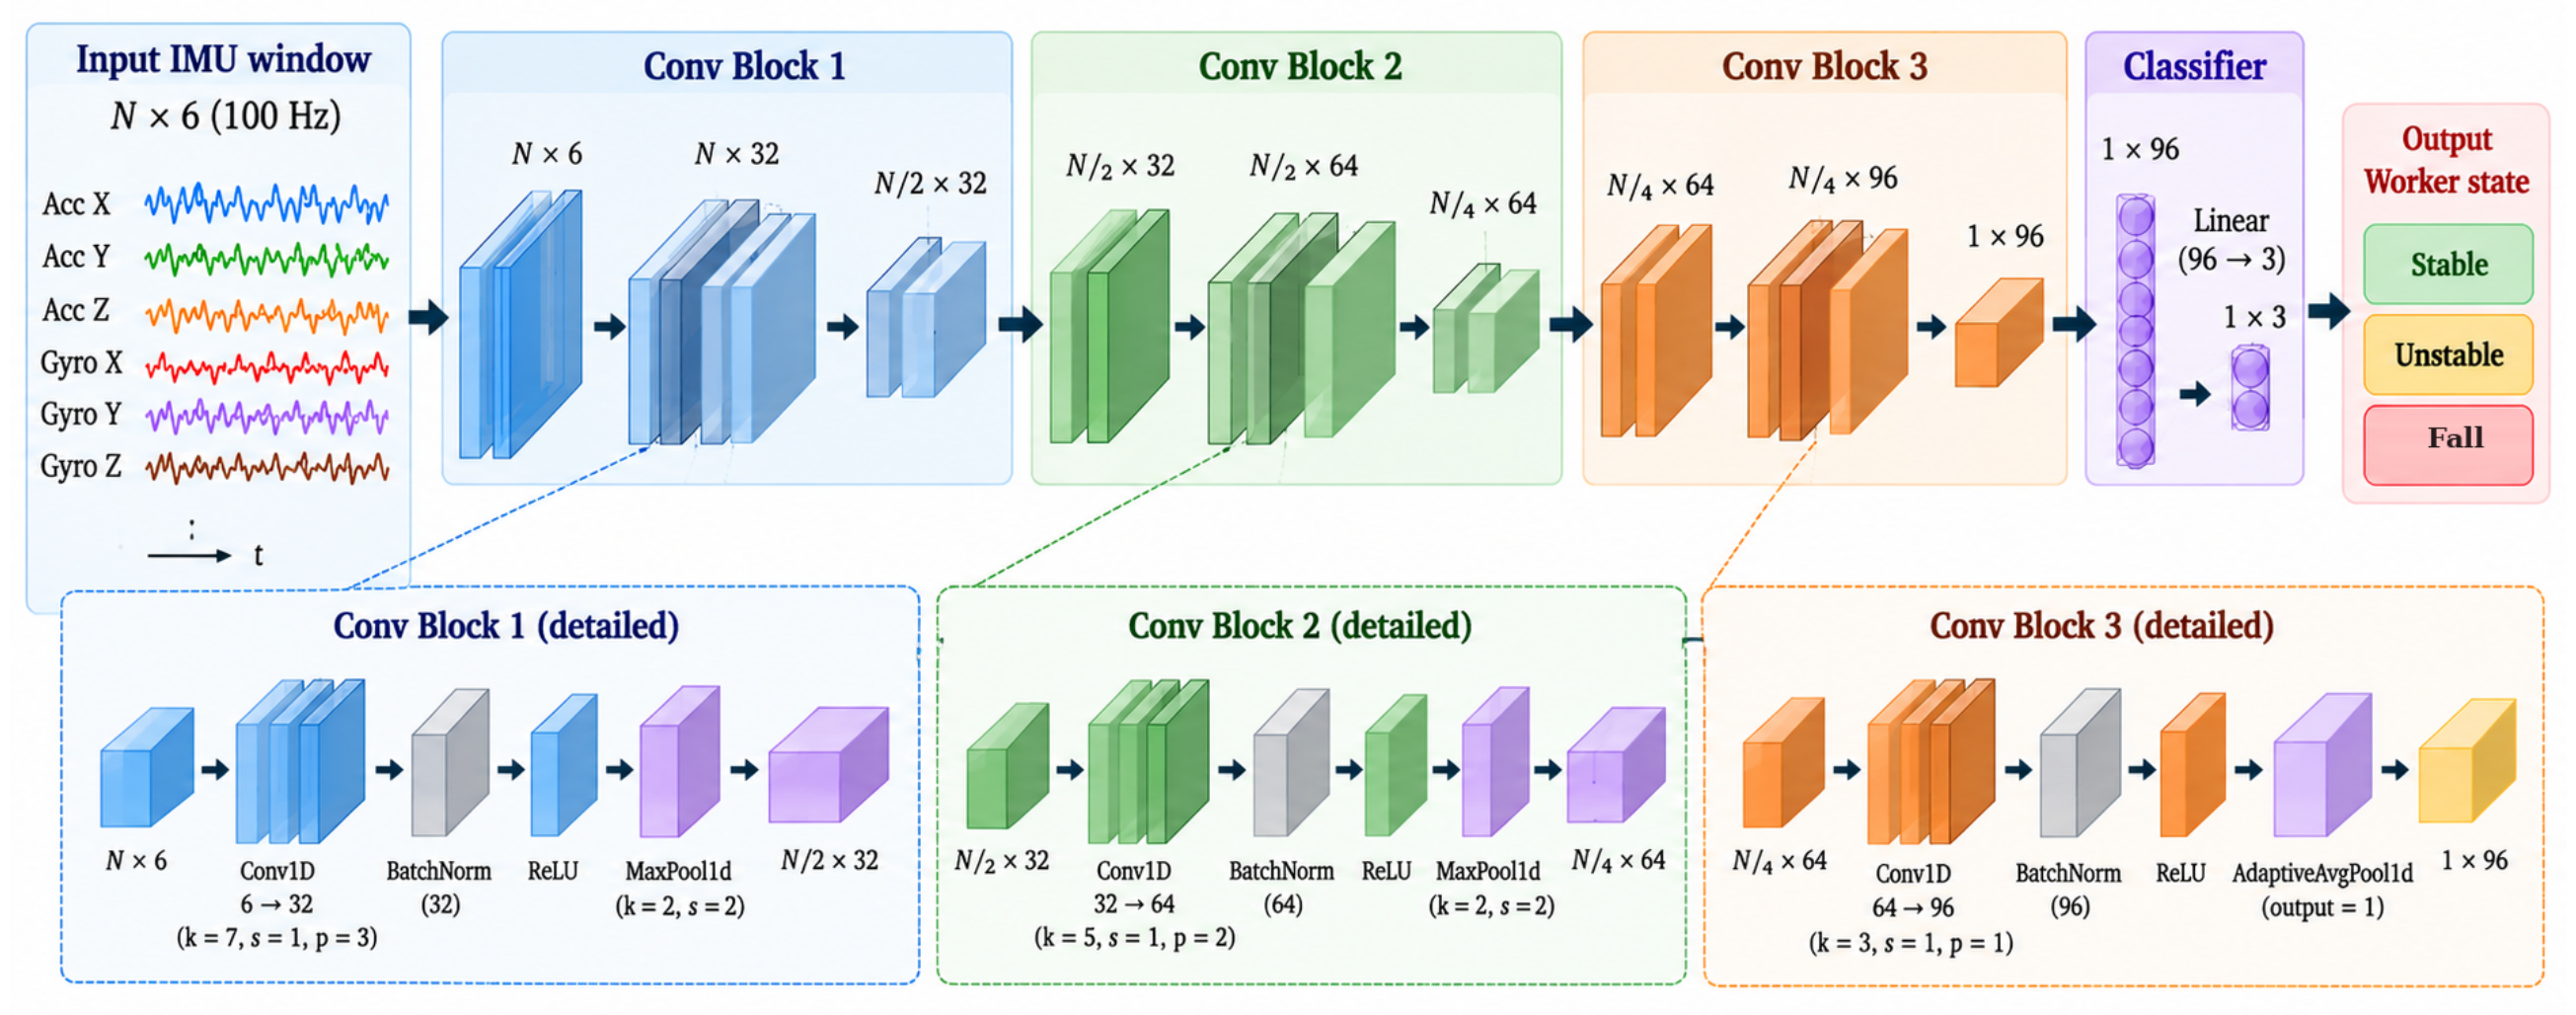
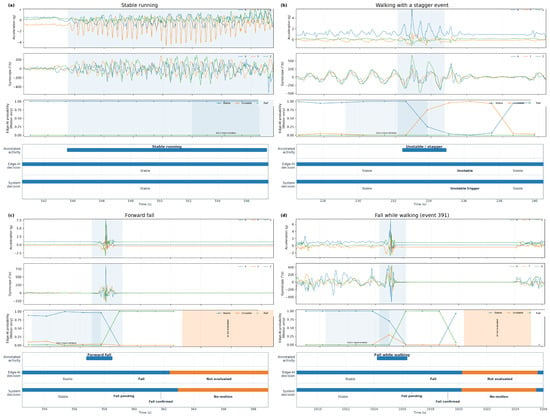
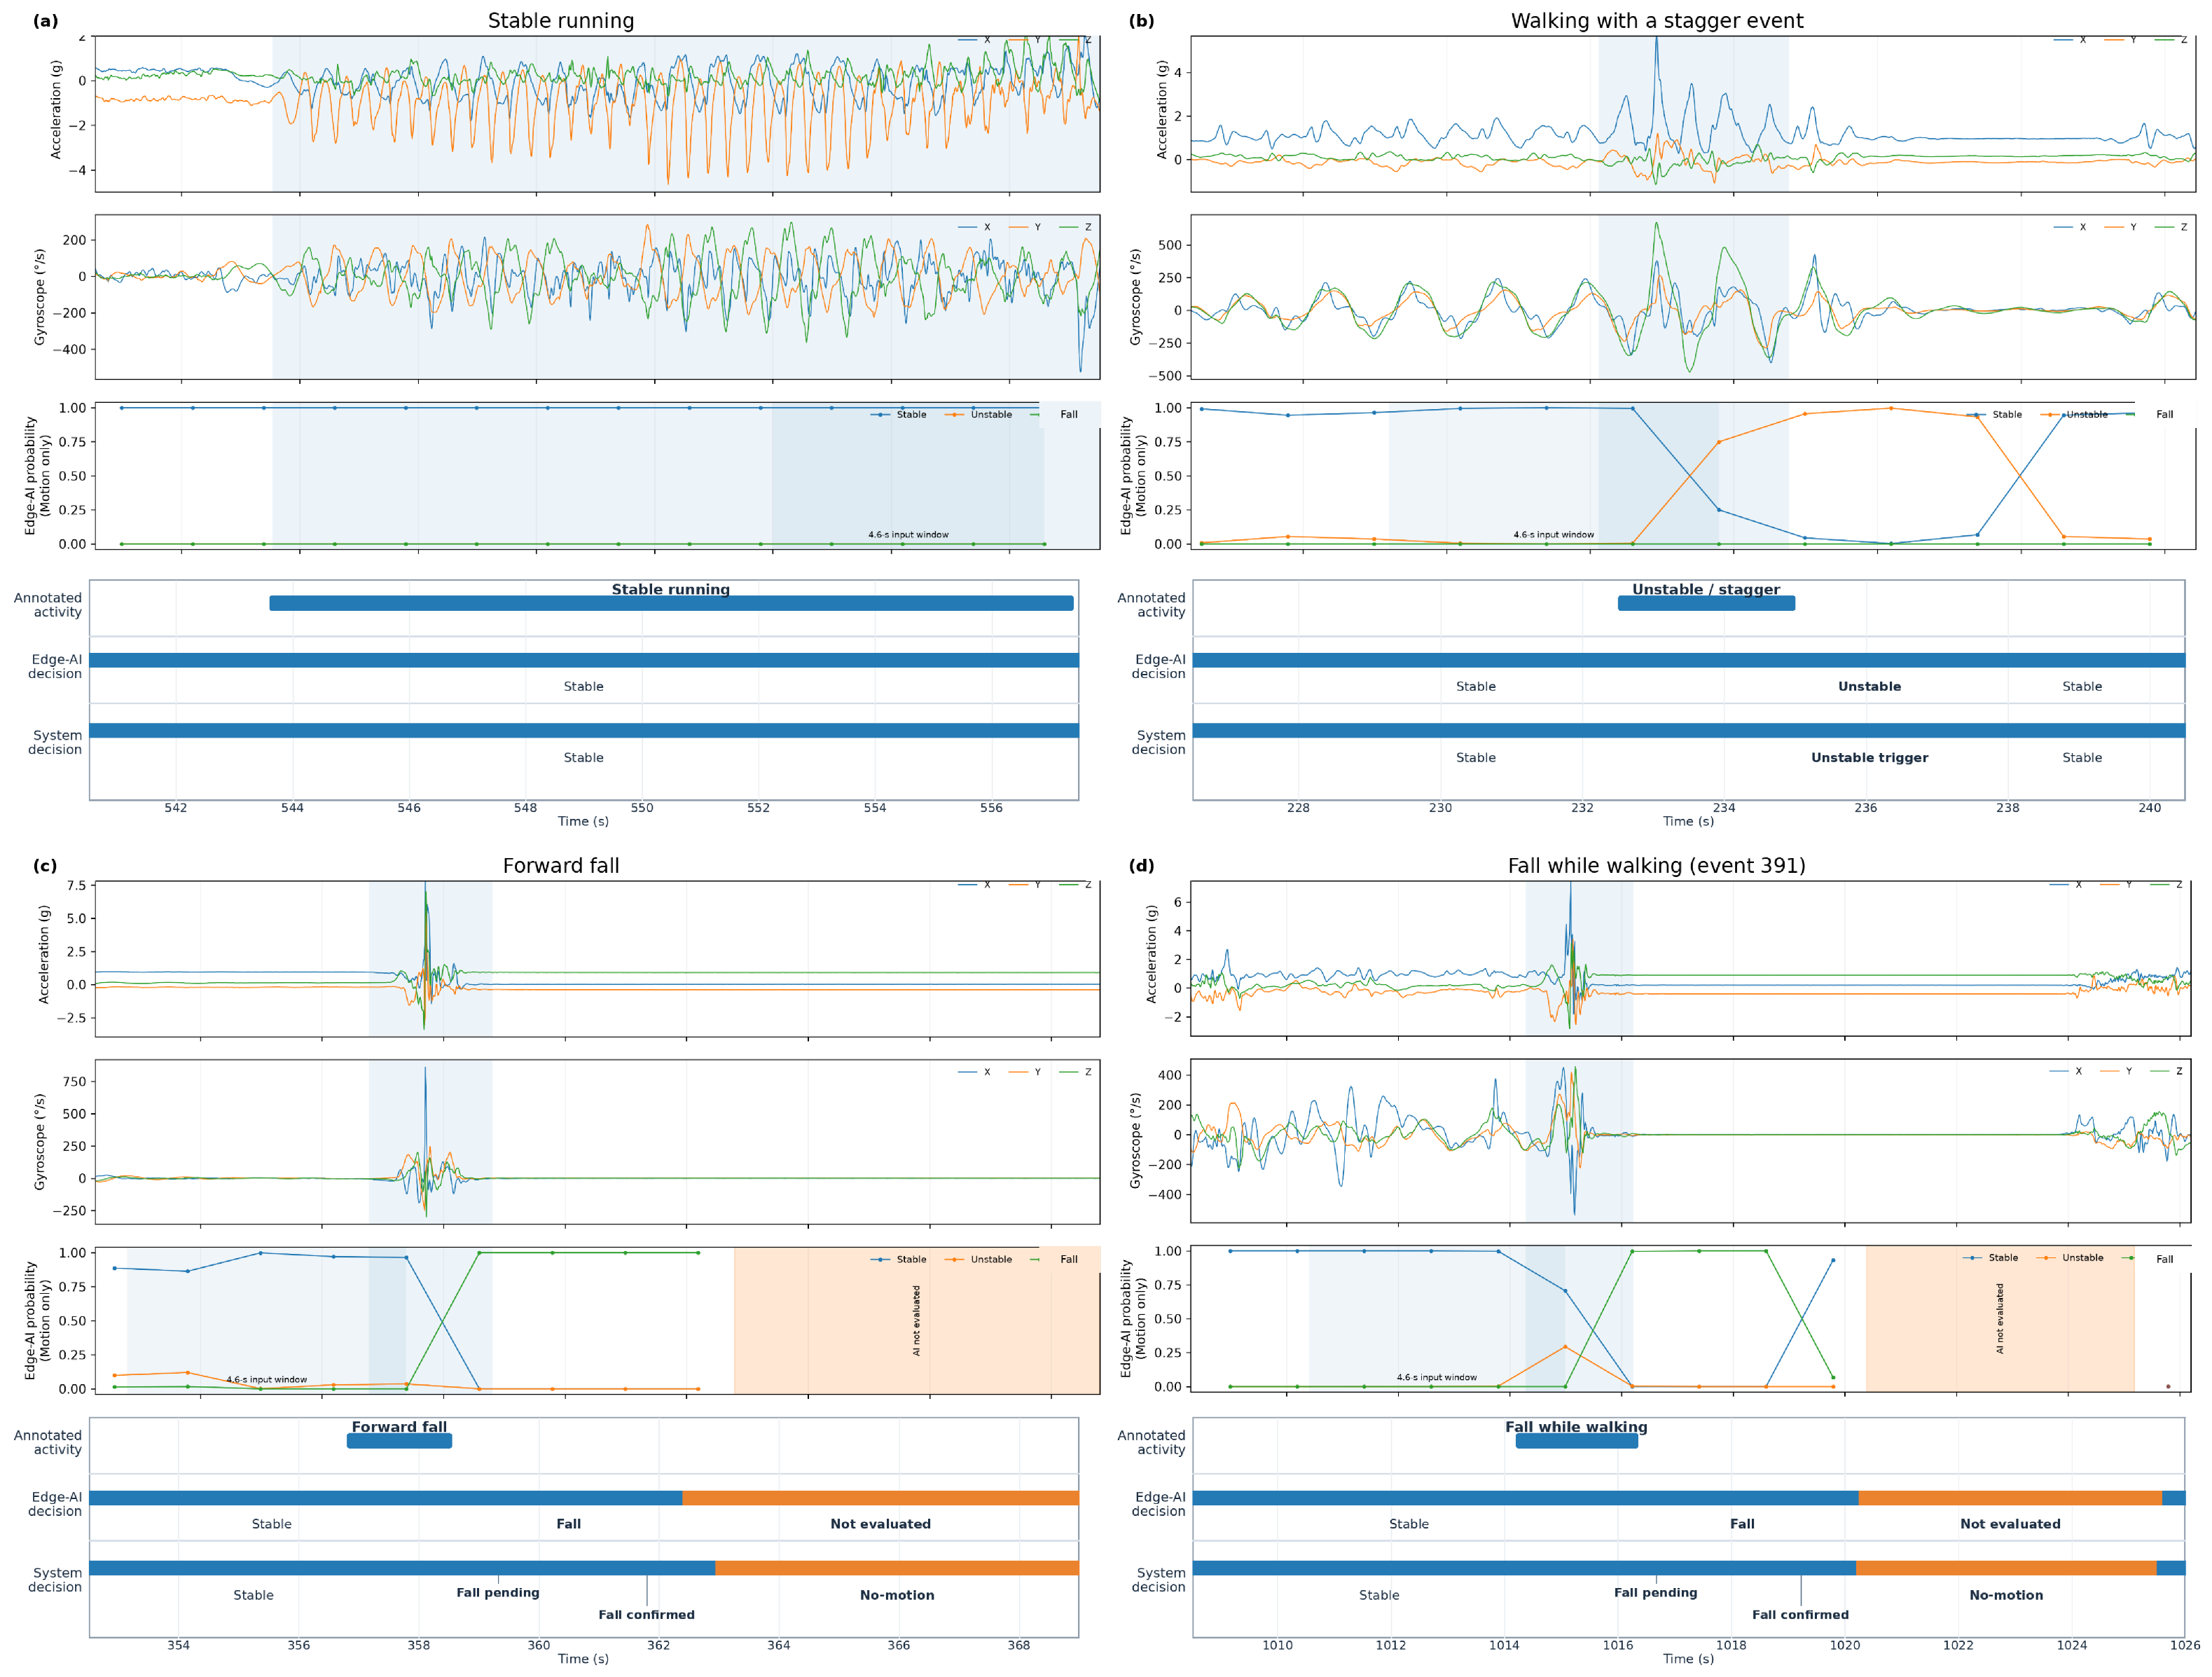
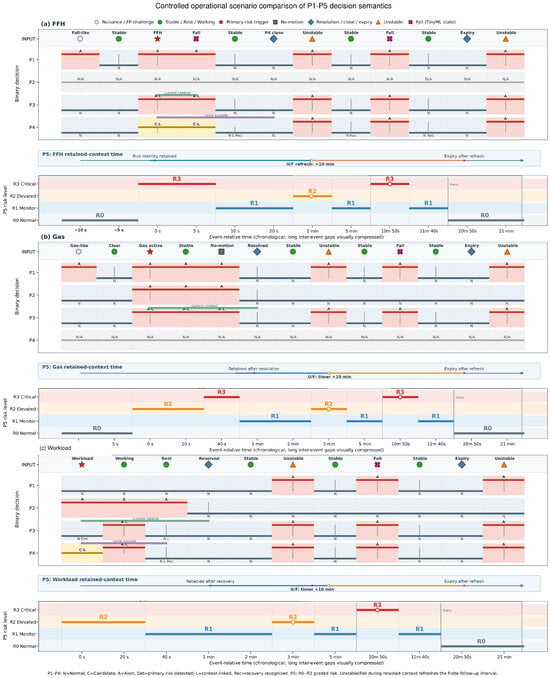
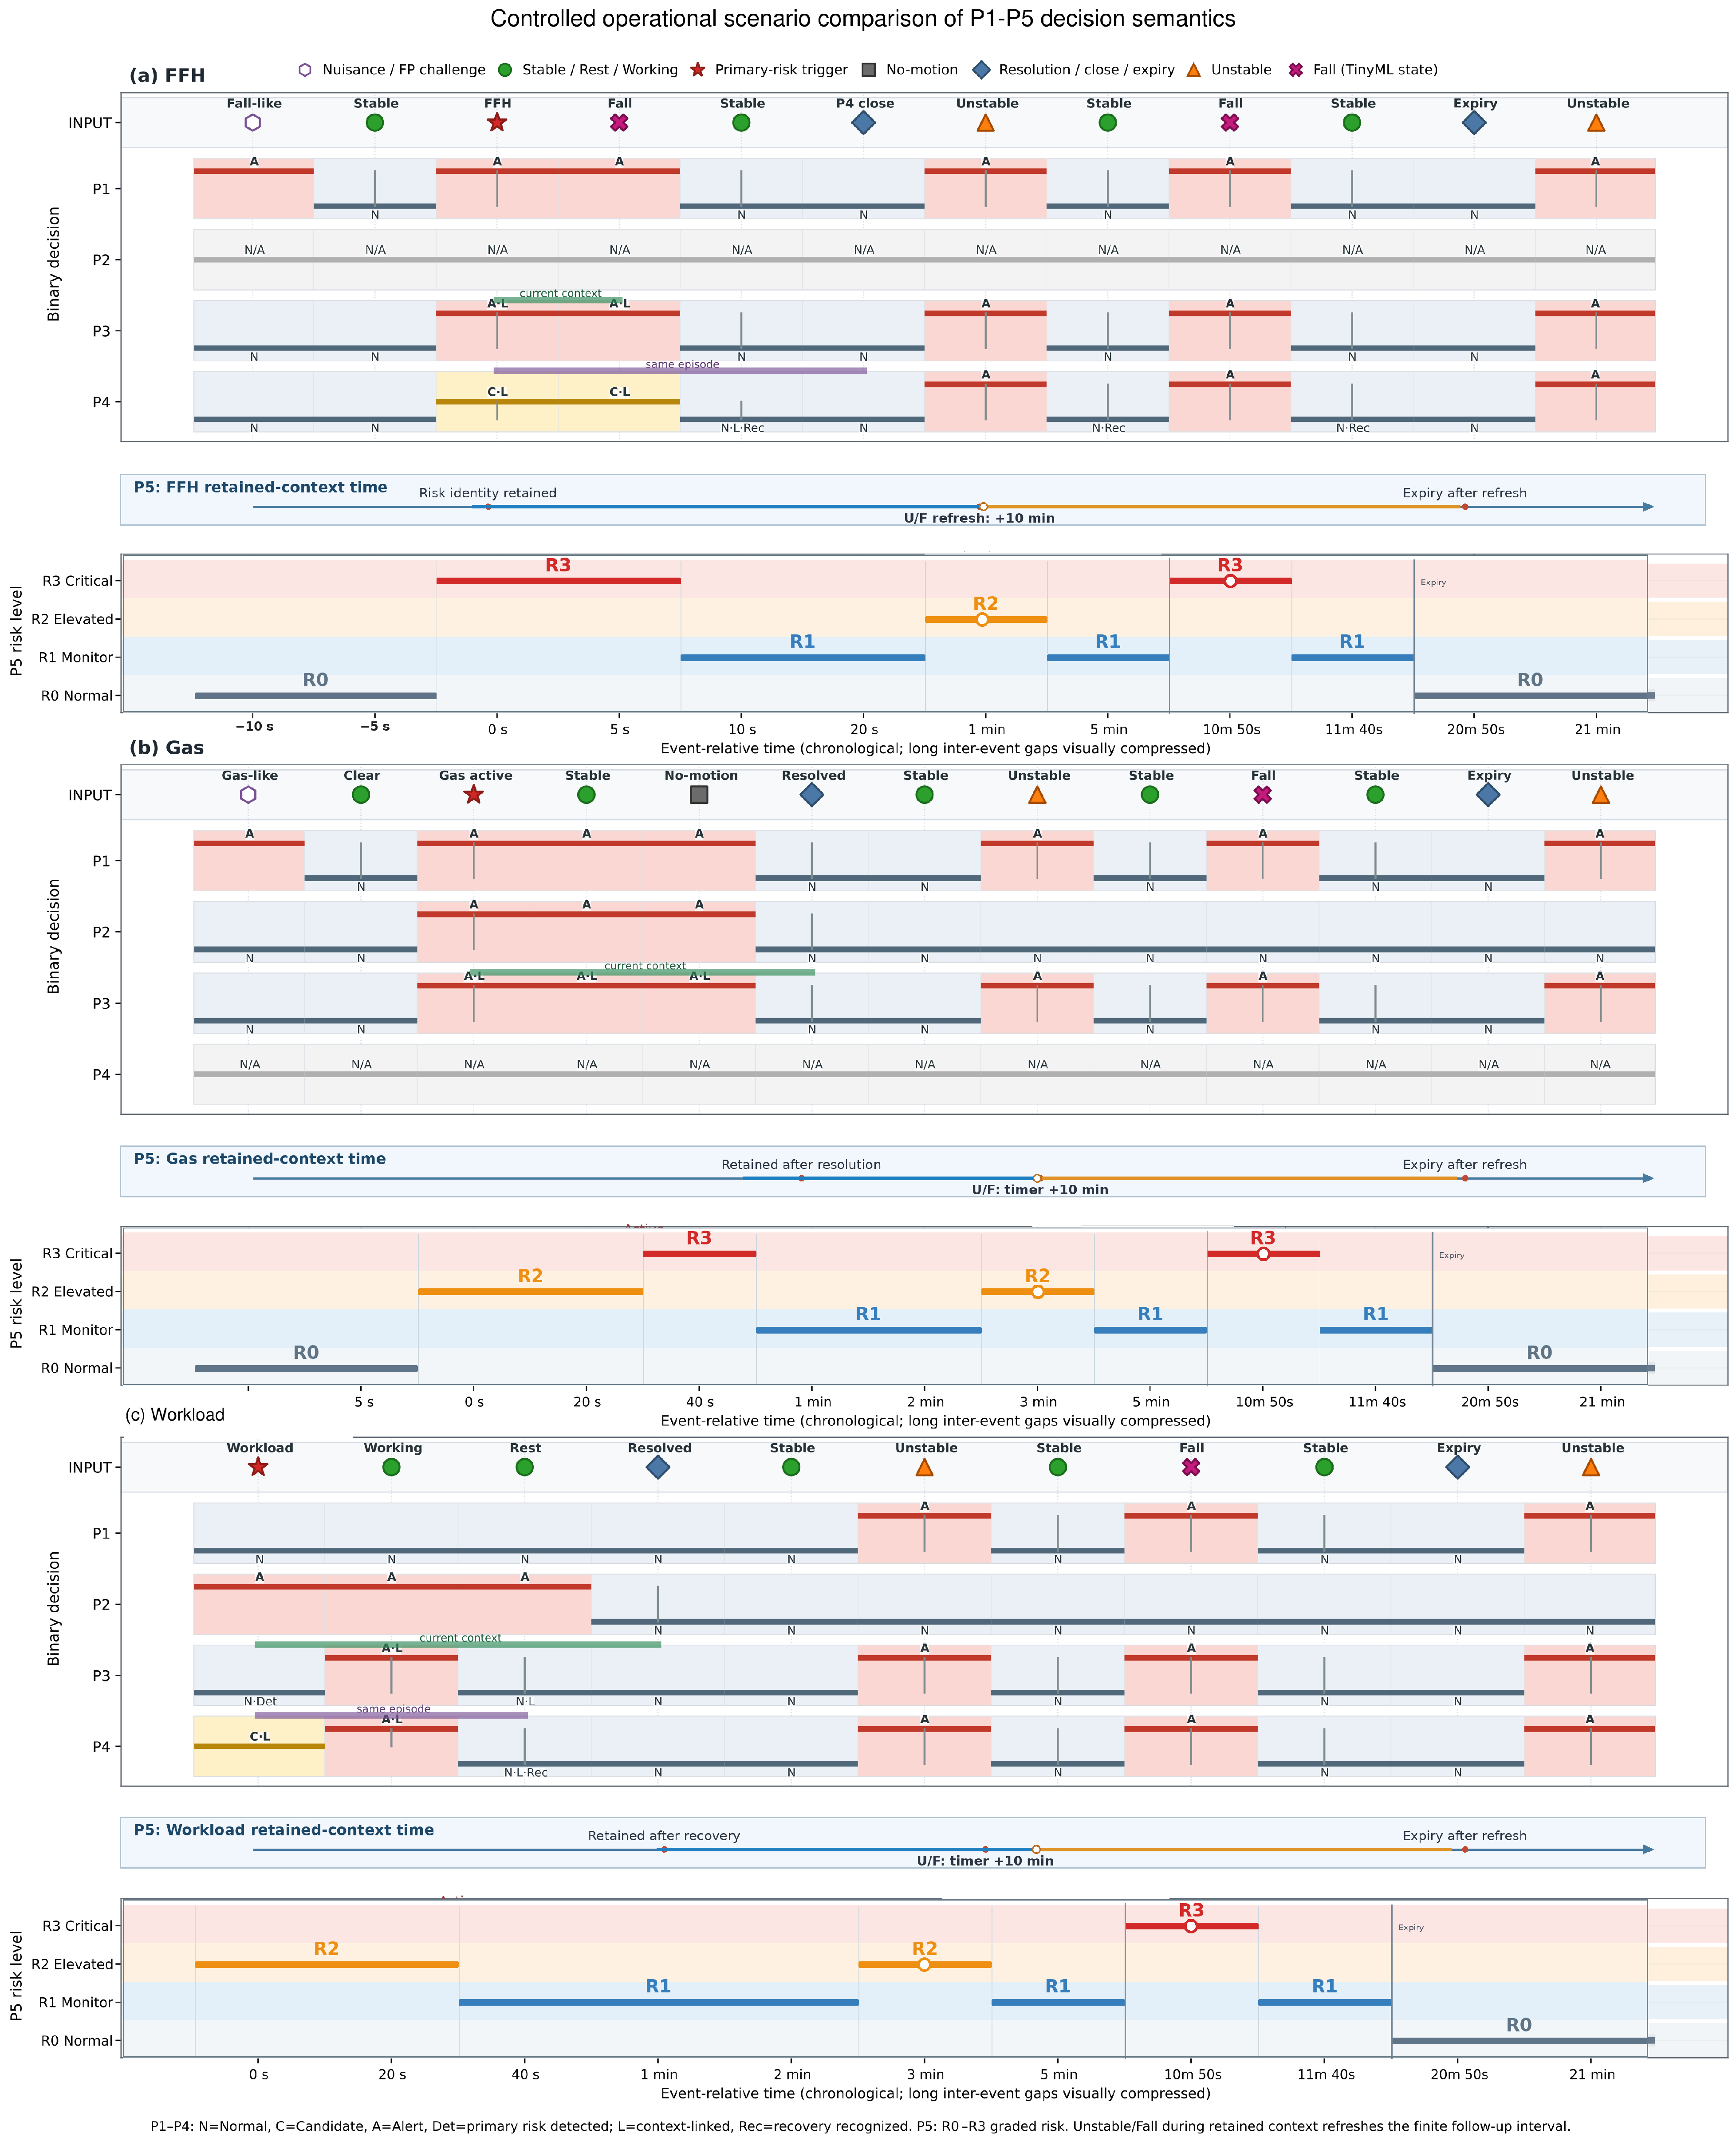

Disclaimer/Publisher’s Note: The statements, opinions and data contained in all publications are solely those of the individual author(s) and contributor(s) and not of MDPI and/or the editor(s). MDPI and/or the editor(s) disclaim responsibility for any injury to people or property resulting from any ideas, methods, instructions or products referred to in the content. |
© 2026 by the authors. Licensee MDPI, Basel, Switzerland. This article is an open access article distributed under the terms and conditions of the Creative Commons Attribution (CC BY) license.