


Abstract
Machine-learning intrusion detection on multi-attack Internet-of-Things (IoT) datasets is often reported through aggregate metrics that can hide near-failure on rare attack classes, and through single hand-picked feature subsets whose stability is seldom examined. Using the real TON_IoT Network dataset (211,043 flows, 10 classes, with man-in-the-middle (MITM) traffic at 0.5% prevalence), this study contributes a transparent empirical mapping rather than a new detector. A strong full-feature Random Forest reaches 0.969 accuracy and 0.945 macro-averaged F1 (macro-F1) yet recalls only 0.776 of the rare MITM class, and a mutual-information filter raises aggregate macro-F1 to 0.948 while leaving worst-class recall unchanged at 0.776. A self-coded non-dominated sorting genetic algorithm (NSGA-II) is then used to map the trade-off between macro-F1 and worst-class recall as the selected subset varies, alongside a matched-size random-subset control, standard imbalance remedies, and two additional classifiers. Three findings are robust. First, imbalance remedies on the full feature set—class weighting and, especially, the synthetic minority over-sampling technique (SMOTE)—raise MITM recall to 0.818 and 0.904, matching or exceeding the wrapper, so feature selection is not the most effective tool for the rare class. Second, re-adding a single destination-port feature inflates ransomware recall by 0.094 and cross-site-scripting (XSS) recall by 0.066 while doing nothing for MITM, showing that several apparently detected classes are separable by an identifier artifact whereas the genuinely hard class is not. Third, selected subsets are unstable (Nogueira index 0.21) despite reproducible objective values. The wrapper’s own rare-class advantage is small and does not reach significance under a cross-validation-appropriate corrected test. The two transferable findings replicate on the NSL-KDD benchmark. We argue that IoT intrusion-detection studies should report the aggregate–worst-class frontier, an identifier ablation, a selection-stability index, and cross-validation-appropriate significance tests.
1. Introduction
Machine-learning intrusion detection for the Internet of Things (IoT) is a mature and competitive research area, and studies on public multi-attack datasets frequently report aggregate accuracy and macro-F1 above 0.94 [1,2,3]. Two issues receive comparatively little attention. First, aggregate metrics such as accuracy, weighted-F1, and even macro-F1 can remain high while a detector performs poorly on the rarest and most operationally consequential class. Second, public datasets can embed identifier shortcuts—fixed ports, addresses, or certificate identities tied to how a testbed generated each attack—that allow a model to separate classes without learning attack behavior, producing performance that does not transfer to deployment [4,5].
This paper does not propose a new optimizer or a new state-of-the-art score. Its contribution is a transparent empirical mapping: for one widely used dataset, we trace the trade-off surface between aggregate detection and worst-class recall as the selected feature subset varies; we compare feature selection against standard imbalance remedies and controls, and we measure how much reported detection is attributable to a single identifier feature. To keep the analysis honest, we also report where our own multi-objective search fails to deliver a statistically reliable advantage.
Contributions. (1) We show, on real held-out data, that strong aggregate metrics coexist with weak rare-class recall, and that a mutual-information filter improves the aggregate while leaving the rare class untouched (Section 4.1 and Section 4.2). (2) We map the aggregate/worst-class Pareto frontier with a fully self-coded NSGA-II and situate it against a matched-size random-subset control, class weighting, SMOTE, and undersampling; we find that imbalance remedies on the full feature set match or exceed feature selection for the rare class (Section 4.3 and Section 4.4). (3) We quantify identifier-shortcut inflation via a destination-port ablation (Section 4.7). (4) We measure selection stability, classifier sensitivity, on-device and feature-acquisition cost, and generalization to a second corpus, and we evaluate significance with cross-validation-appropriate tests and leakage-free nested cross-validation (Section 4.5, Section 4.6, Section 4.7, Section 4.8, Section 4.9 and Section 4.10).
Research questions. RQ1: do aggregate metrics conceal rare-class failure, and does filter-based feature selection remedy it? RQ2: does multi-objective feature selection improve worst-class recall beyond controls and beyond standard imbalance remedies, and is any improvement statistically reliable? RQ3: how much of the apparent per-class detection is an identifier artifact?
2. Related Work
TON_IoT and IoT IDS benchmarks. The TON_IoT collection provides telemetry, operating-system, and network flow captures for IoT/IIoT intrusion-detection research [1,6]; the Network subset used here consists of Zeek/Bro flow records with a binary label and a 10-class attack type. Comprehensive reviews of IoT intrusion detection report that random train/test splitting and aggregate-only reporting are common and can inflate apparent performance [4,5].
Feature selection for IDS. Feature selection for network intrusion detection spans filter methods (e.g., mutual information and information gain), wrapper methods, and metaheuristic search. Recent work applies hybrid and swarm metaheuristics to IoT IDS [2], multi-objective formulations to attack detection [7], and dedicated feature-selection studies to modern network-intrusion-detection corpora [8]. Evolutionary multi-objective optimization, and NSGA-II in particular [9], is a natural fit when objectives conflict.
Class imbalance and rare-class sensitivity. Class imbalance is central to intrusion detection because attack categories are unevenly represented. Standard remedies include cost-sensitive weighting, synthetic oversampling such as SMOTE [10], and undersampling. Closest to our motivation, class-aware feature selection has been proposed to preserve minority-class information that global relevance measures discard [3]. Our study differs by measuring the aggregate/worst-class trade-off across subsets and by directly comparing feature selection against these remedies rather than asserting that a selection method rebalances the classes.
Stability and leakage. Feature-selection stability—whether similar features are chosen under data or algorithm perturbation—is quantified by the Nogueira index [11]. Evaluation-integrity work argues for leakage-aware protocols such as device-disjoint or temporal splits and train-only preprocessing [4,5]. We adopt the stability index, use a cross-validation-appropriate significance test [12], and report leakage-free nested cross-validation; we also make explicit which leakage-safe protocol our data copy does not permit (Section 3.1).
3. Materials and Methods
3.1. Dataset and Provenance
We use the TON_IoT Network dataset [1,6]. The analyzed CSV contains 211,043 flows with 42 raw Zeek/Bro flow features plus a binary label and a 10-class type. Class counts are: normal 50,000; backdoor, ddos, dos, injection, password, ransomware, scanning, xss each; and mitm (0.5%), the rare class throughout. This file is the training partition of the standard Train_Test_Network distribution of the Network subset, obtained through a public redistribution of the UNSW release (md5 e9c9e8a9c8595dcf85ae88fa12b838c2); it carries the canonical 44-column Zeek/Bro schema, and, consistent with the dataset author’s protocol [1], the four identifier columns are excluded from the main analysis. This partition contains the dataset’s entire MITM population (1043 flows); because the rare class of interest is therefore absent from the companion partition, evaluating worst-class (MITM) recall requires a fresh stratified split rather than the provided train/test partition. Two properties constrain the study and are revisited in Section 5: the processed distribution omits a packet-timestamp column, so a leakage-safe temporal split is not available (the raw Zeek logs would be required); and the main analysis uses this single processed snapshot, which we address by externally validating the findings on a second corpus (Section 3.7).
3.2. Preprocessing and Target-Leakage Prevention
Preprocessing is fully scripted. (i) Identifier columns src_ip, dst_ip, src_port, and dst_port are dropped for the main analysis to avoid trivial address/port shortcuts; dst_port is cached separately for the ablation in Section 4.7. (ii) Zeek ‘-’ placeholders in numeric columns are coerced to numeric with NaN→0 (“not applicable”). (iii) Low-cardinality categoricals (proto, service, conn_state, and DNS/SSL/HTTP flags) are one-hot encoded. (iv) High-cardinality identity-like strings (dns_query, http_uri, http_user_agent, and ssl_subject/ssl_issuer) are reduced to binary presence indicators; an earlier iteration one-hot-encoded specific certificate identities, which were reclassified to presence-only because they are host-identity shortcuts rather than behavior. (v) Near-constant columns are dropped. The final matrix is features with a 10-class target. Crucially for target-leakage prevention, both the binary label column and the 10-class type column are removed from the feature matrix before any model sees the data: type is used solely as the multiclass prediction target, and the binary label (attack vs. normal) is never provided as an input feature, so the target cannot leak through a redundant label column.
3.3. Metrics
Let C be the number of classes and, for class c, let and be recall and precision. We report:
together with accuracy and the multiclass Matthews correlation coefficient (MCC). Worst-class recall is our primary rare-class metric; on TON_IoT it is driven by MITM in most settings, although we identify the actual minimum-recall class for each experiment because the two need not coincide (Section 4.4). Note that macro-F1, balanced accuracy (mean recall), and worst-class recall (min recall) all up-weight minority classes relative to accuracy, so macro-F1 and worst-class recall are positively associated but not redundant—macro-F1 can rise while the minimum recall is unchanged, as Section 4.2 shows.
3.4. Learners and Evaluation Protocol
The primary classifier is a Random Forest [13] (80 trees, maximum depth 28) trained with scikit-learn [14]; imbalance remedies use imbalanced-learn [15]. Evaluation uses three protocols of increasing rigour: (a) a fixed stratified 70/30 train/test split (seed 42; MITM: 730 train, 313 test) for detailed per-class reporting; (b) repeated stratified 5-fold × 2 cross-validation for variance; and (c) leakage-free nested cross-validation (Section 4.5) in which the entire selection procedure is re-run inside each outer training fold. All randomness uses seed 42 unless stated.
3.5. Multi-Objective Feature Selection
We implemented NSGA-II [9] from scratch (Algorithm 1) for transparency and reproducibility. A candidate is a binary mask over the 105 features; the three objectives, evaluated by a fast Decision Tree on an inner validation split of a rare-class-preserving subsample, are to maximize macro-F1, maximize worst-class recall, and minimize subset size. Parameters are listed in Table 1. We describe the optimizer as multi-objective throughout: although the figures visualize the two-dimensional aggregate–worst-class projection of the frontier (the trade-off of interest), the search itself optimizes three objectives, with subset size as the third. A Decision Tree proxy (rather than the Random Forest evaluator) keeps the ∼1000 fitness evaluations tractable on a single CPU; Section 4.5 quantifies the resulting inner→outer optimism.
| Algorithm 1 Self-coded NSGA-II for feature-subset selection. |
|
Table 1.
NSGA-II configuration.
3.6. Baselines, Controls, Statistical Testing, and Leakage Control
We compare against: the full 105-feature model; a mutual-information filter at ; a matched-size random-subset control (12 random subsets per size); class weighting (balanced, balanced_subsample), SMOTE [10], and random undersampling on the full feature set; and two additional classifier families (Extra-Trees and histogram gradient boosting). Significance of paired cross-validation differences is assessed with the Nadeau–Bengio-corrected resampled t-test [12] (which accounts for the correlation among overlapping folds that a naive paired test ignores), complemented by a bootstrap 95% confidence interval and a Wilcoxon signed-rank test. On-device cost is characterized by inference latency, serialized model size, and a feature-acquisition-cost tiering (cheap flow/header counters versus expensive DNS/TLS/HTTP application-layer parses). All data-dependent selection and sampling steps are leakage-free: mutual-information ranking, feature-subset selection, and resampling (SMOTE and undersampling) are fit on the training data only and then applied to the untouched held-out data; no test-set rows enter ranking, selection, or synthetic-sample generation. The nested protocol in Section 4.5 strengthens this further by re-executing the entire NSGA-II selection inside each outer training fold, so the reported estimates contain no feature-selection leakage.
3.7. External-Validation Dataset (NSL-KDD)
To test whether the methodological findings generalize beyond IoT and beyond a single corpus, we replicate the core analyses on NSL-KDD [16], a canonical network intrusion-detection benchmark with a different origin, era, and feature schema. It provides 125,973 training and 22,543 test records with 41 features (three categorical—protocol_type, service, flag—one-hot encoded to 122 columns) and a 5-class label (normal, dos, probe, r2l, u2r). Its rarest class, u2r, comprises only 52 training instances (0.04%)—an order of magnitude rarer than MITM—making it a demanding test of rare-class behavior. We use repeated stratified 70/30 splits (six seeds) of the training partition for an in-distribution comparison matched to our TON_IoT protocol, and additionally report the official (distribution-shifted) KDDTest+ partition. As on TON_IoT, mutual-information ranking and resampling are fit on training folds only. NSL-KDD is a general network-intrusion-detection benchmark rather than an IoT capture; we use it to probe the generality of the evaluation-methodology findings, not as IoT coverage.
4. Results
4.1. Aggregate Metrics Conceal the Rare Class
Table 2 summarizes the full-feature Random Forest on the held-out test split. Aggregate scores are excellent, yet worst-class recall is 0.776.
Table 2.
Full-feature Random Forest baseline on the held-out test split.
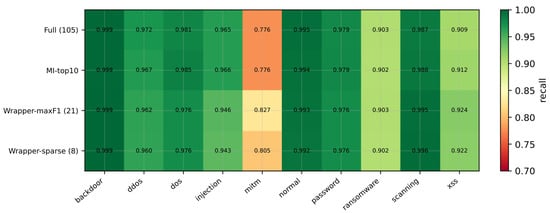
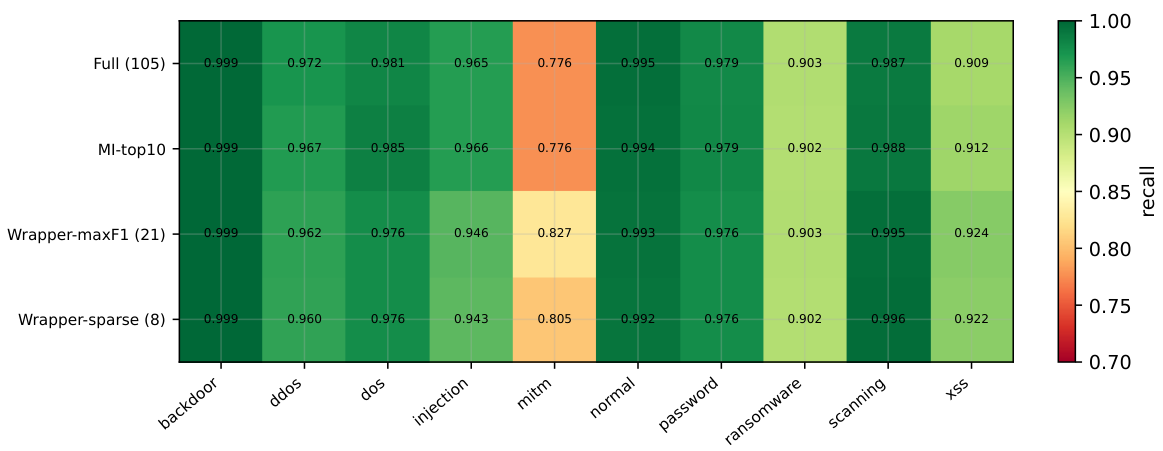
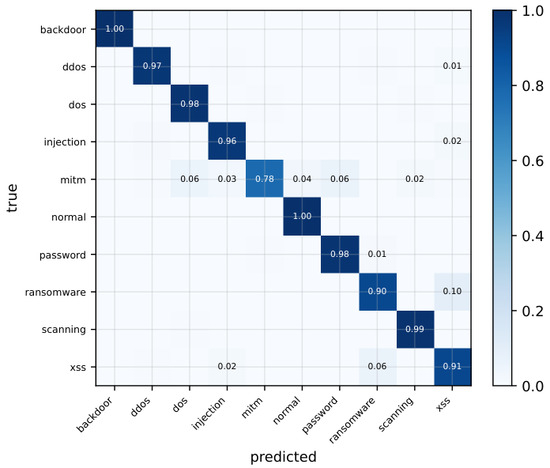
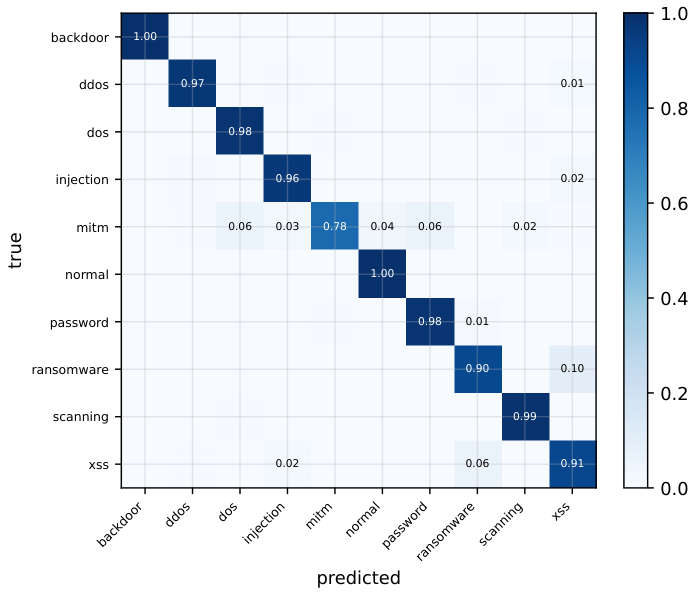
Per-class recall (Table 3, “Full” column) shows the concealment: easy classes exceed 0.97 while ransomware (0.903), XSS (0.909), and MITM (0.776) lag; Figure 1 shows the same per-class recalls as a heatmap across all four methods considered below. The full-model confusion matrix (Figure 2) shows MITM is misclassified mainly as password, dos, and normal, with no single dominant confusion, consistent with genuine class overlap rather than one adjacent class.
Table 3.
Per-class recall on the held-out test split, to three decimals. Bold marks the highest recall in each row, computed at full precision; where two methods tie at full precision, both are bolded.
Figure 1.
Per-class recall on the held-out test split across the four key methods. The rare MITM class remains the bottleneck for every method.
Figure 2.
Row-normalized confusion matrix of the full-feature Random Forest on the held-out split. MITM (0.78 on the diagonal) is spread mainly across password, dos, and normal, indicating genuine overlap rather than one adjacent class. Cells are row-normalized proportions, shown to two decimals.
4.2. Mutual-Information Filtering Does Not Help the Rare Class
Keeping the top-k features by mutual information improves aggregate macro-F1 (top-10: 0.948 vs. 0.945 full) at a fraction of the features, but worst-class (MITM) recall remains 0.776 for all (Table 3, MI-top10 column). A filter that optimizes average relevance is indifferent to the rare class, motivating worst-class recall as an explicit objective.
4.3. Multi-Objective Frontier and the Random-Subset Control
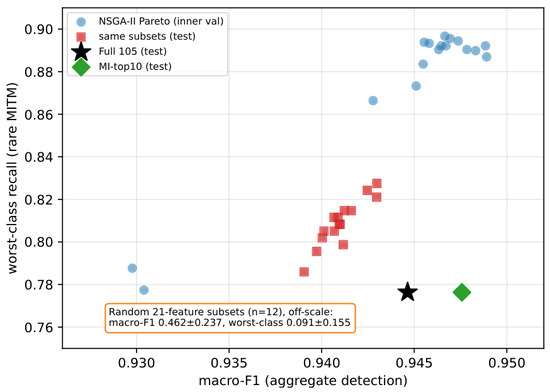
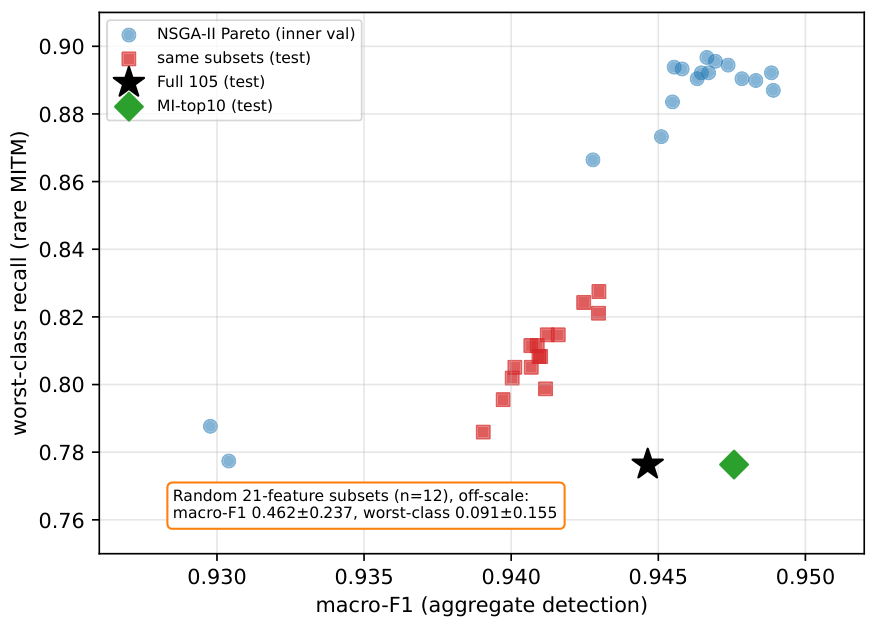
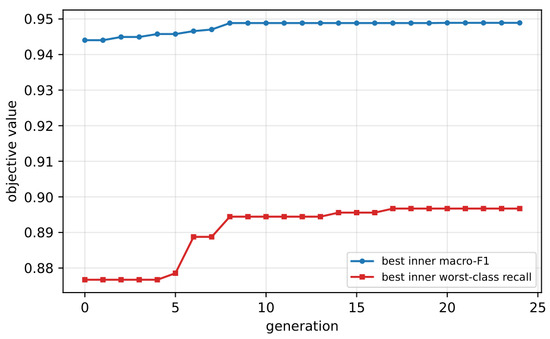
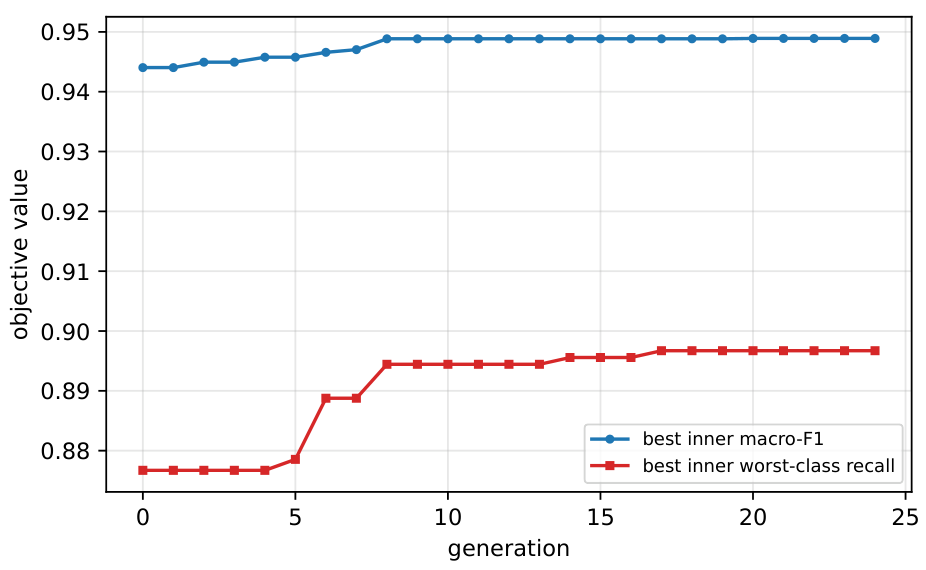
On the fixed split, the NSGA-II subsets lie up-and-left of the baselines on the macro-F1/worst-class plane (Figure 3): the max-macro-F1 subset (21 features) attains macro-F1 0.943 with MITM recall 0.827— over the full model for a macro-F1 change, at fewer features. That the selection is non-trivial is confirmed by the matched-size random-subset control: 21-feature random subsets average macro-F1 and worst-class recall (n = 12), far below the wrapper and the full model. The search itself converges within roughly ten generations (Figure 4). The search is thus finding genuinely good small subsets; the open question (Section 4.5) is whether its rare-class edge over the full model is reliable.
Figure 3.
Aggregate vs. worst-class trade-off on TON_IoT (10-class), zoomed to the informative region. NSGA-II Pareto subsets on the inner validation split (circles) and the same subsets on the held-out test split (squares), against the full-105-feature model (star) and the MI-filter top-10 baseline (diamond). The matched-size random-subset control lies far below this range and is reported in the annotation (macro-F1 , worst-class recall , n= 12). The wrapper subsets sit up-and-left of the baselines, with a visible inner→test optimism gap.
Figure 4.
NSGA-II convergence (seed 42): best inner-validation macro-F1 and worst-class recall over generations.
4.4. Feature Selection Versus Imbalance Remedies
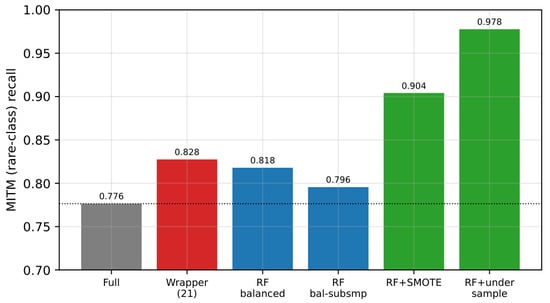
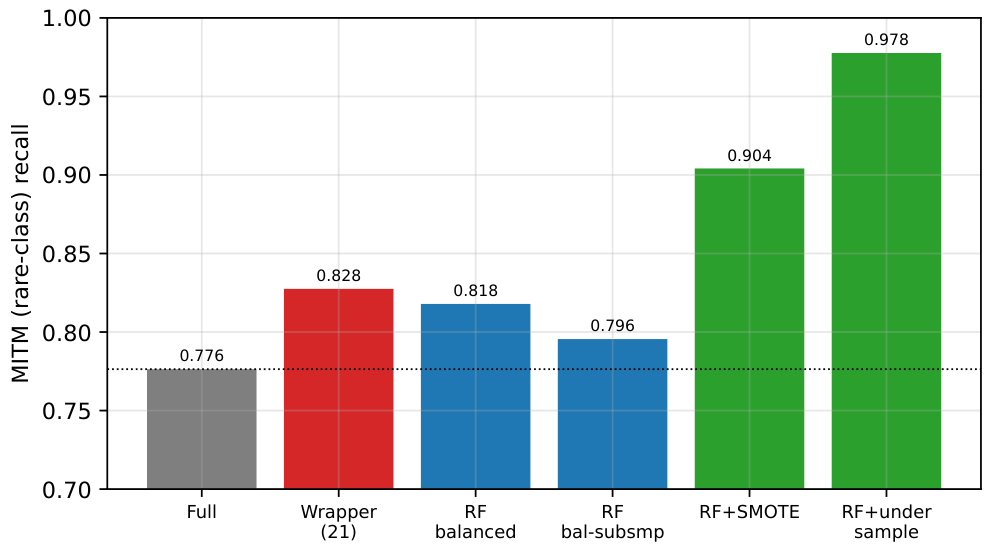
Because the target is rare-class recall, the natural comparison is against standard imbalance remedies applied to the full feature set (Table 4, Figure 5). Class weighting raises MITM recall to 0.818 at essentially unchanged macro-F1, and SMOTE raises it to 0.904—both matching or exceeding the wrapper’s 0.827, without any feature selection. Undersampling is a special case that also illustrates why we track worst-class recall rather than the recall of a fixed class: it raises MITM recall to 0.978, but in doing so, it depresses another class, so that XSS becomes the worst class at 0.894. The worst-class recall under undersampling is therefore 0.894 (XSS), not the MITM value; Table 4 reports both columns so the distinction is explicit, and Figure 5 plots MITM recall specifically (the paper’s focal rare class), which is why the undersampling bar reads 0.978 there. The practical implication is direct: for improving rare-class recall on this dataset, resampling or cost-sensitive weighting is at least as effective as—and simpler than—multi-objective feature selection. Feature selection’s distinctive value here is compactness, not rare-class recall.
Table 4.
Imbalance remedies on the full 105-feature set (held-out test). Feature selection does not lead to rare-class recall. The worst class is MITM for every row except undersampling, where MITM recall rises to 0.978 but XSS becomes the worst class (0.894); the two right-hand columns therefore differ only for that row.
Figure 5.
Rare-class (MITM) recall for feature selection versus imbalance remedies on the full feature set. SMOTE and undersampling exceed the wrapper; class weighting matches it. The dotted line marks the plain full-feature baseline. This panel shows MITM recall specifically; under undersampling, MITM recall reaches 0.978 but the worst class becomes XSS (0.894), as reported in Table 4.
4.5. Generalization: Corrected Tests and Leakage-Free Nested CV
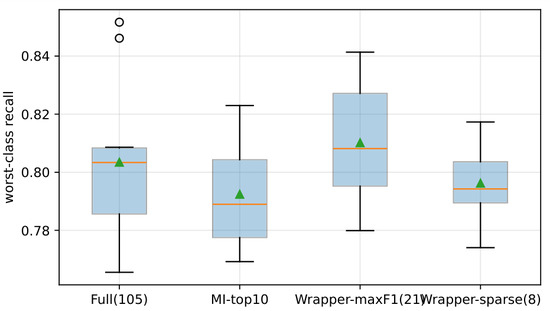
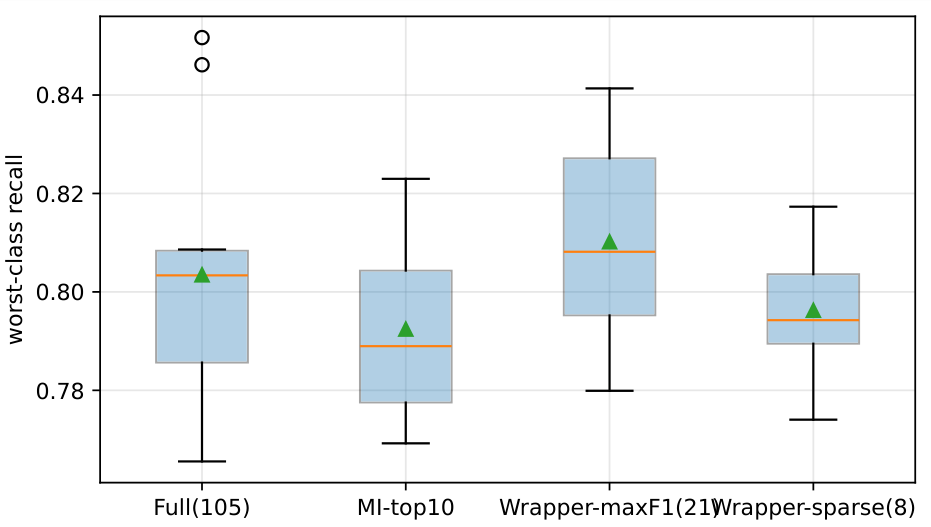
Repeated stratified 5-fold × 2 cross-validation of frozen subsets (Table 5) shows the wrapper’s worst-class advantage over the full model shrinks to a mean of . A Nadeau–Bengio corrected t-test [12] gives , (naive paired t: ; Wilcoxon ), with a bootstrap 95% confidence interval of the mean difference of that includes zero. The wrapper’s macro-F1 is, however, significantly lower by 0.003 (corrected ): a difference that is statistically detectable but practically negligible. Worst-class recall varies by – across folds (Figure 6); on a 313-instance test class this variance alone precludes confident rare-class claims.
Table 5.
Repeated stratified 5-fold × 2 cross-validation of frozen subsets (mean ± std over 10 folds).
Figure 6.
Worst-class recall across the 10 cross-validation folds (5-fold × 2) for each subset. Boxes span the interquartile range, the orange line is the median, the green triangle the mean, whiskers extend to 1.5 × IQR, and circles are outliers. Fold-to-fold variance dominates the differences between methods.
Because the frozen-subset CV still selects features on data that reappears in evaluation, we additionally run leakage-free nested cross-validation: the entire NSGA-II selection is re-executed inside each of five outer training folds and evaluated on the held-out outer fold. Here, the wrapper attains worst-class recall versus the full model’s (mean ), with macro-F1 versus and mean selected size 31.8. The leakage-free effect is thus positive but modest and within fold variance, consistent with, and no larger than, the corrected-test conclusion.
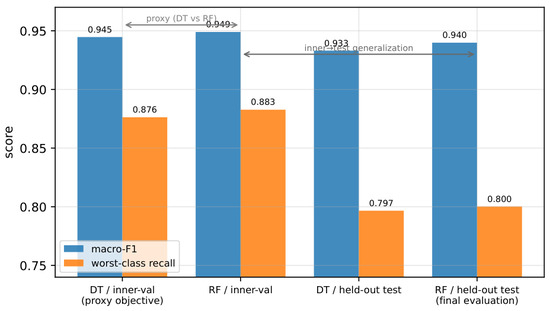
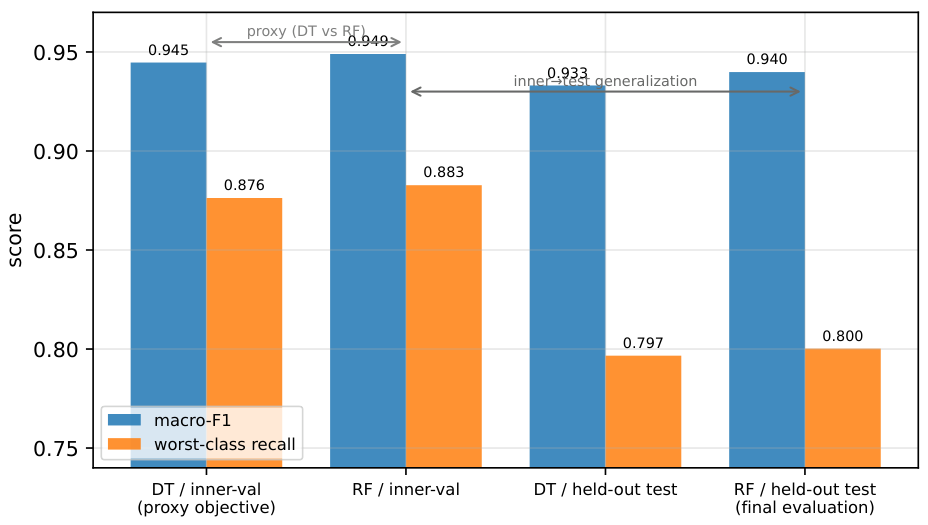
Proxy versus evaluator. A natural question is how much of the inner-to-test shift visible in Figure 3 is an artifact of using a fast Decision Tree (DT) proxy inside the search rather than the Random Forest (RF) evaluator, as opposed to ordinary inner-validation optimism. To separate the two effects, we re-evaluated every NSGA-II Pareto subset in a design that crosses the model (DT vs. RF) with the data split (inner-validation vs. held-out test), holding the subsets and the splits fixed (Table 6, Figure 7). Averaged over the 17 Pareto subsets, the total shift from the inner DT objective to the final RF-on-test evaluation is only in macro-F1 but in worst-class recall. Decomposing the worst-class shift, the proxy component—swapping DT for RF on the same data—is small and, if anything, slightly negative ( on the inner split, on the test split): the Decision Tree proxy marginally under-estimates worst-class recall relative to Random Forest, so it does not inflate the frontier. Almost the entire shift is the generalization component—moving from the inner-validation split to the held-out test with the model held fixed—at for RF and for DT. The same pattern holds for the max-macro-F1 subset alone (worst-class recall: DT/inner 0.887, RF/inner 0.900, DT/test 0.824, RF/test 0.827). The inner-to-test optimism is therefore driven by re-using the rare-class-preserving inner-validation subsample during selection, not by the Decision Tree proxy, which is precisely why the leakage-free nested protocol above—which removes that reuse—closes most of the gap.
Table 6.
Decomposition of the inner-to-test shift: model (Decision Tree vs. Random Forest) crossed with data split (inner-validation vs. held-out test), averaged over the 17 NSGA-II Pareto subsets. The DT/inner-validation cell is the search objective and the RF/held-out-test cell is the final evaluation; the proxy effect is a column-wise (DT→RF) change and the generalization effect is a split-wise (inner→test) change.
Figure 7.
Decomposition of the inner-to-test shift, averaged over the 17 Pareto subsets. Swapping the Decision Tree proxy for the Random Forest evaluator (proxy effect) barely moves either metric, whereas moving from the inner-validation split to the held-out test (generalization effect) accounts for almost all of the drop in worst-class recall.
4.6. Classifier Sensitivity
The phenomena above are partly classifier-dependent (Table 7). Random Forest is the strongest learner here; the Decision Tree-selected subset transfers to Random Forest (MITM over five RF seeds, vs. full ) but not cleanly to histogram gradient boosting, whose worst-class recall drops under both the MI filter and the wrapper. Extra-Trees is unstable on this task at the full feature set. This dependence is a caution against reading any single subset as classifier-agnostic.
Table 7.
Macro-F1 and worst-class recall on the held-out split for two additional classifiers, reported in separate columns. These are single-split values (no cross-validation), so no ± is reported.
4.7. Identifier-Shortcut Ablation
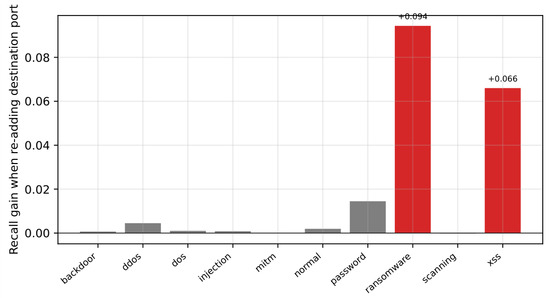
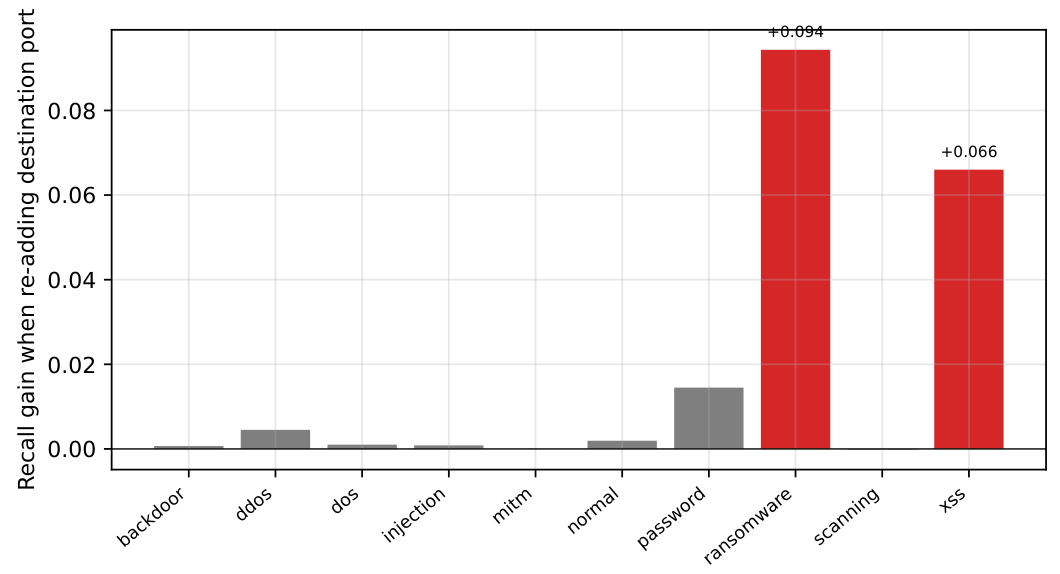
Re-adding the single cached dst_port feature to the full set raises aggregate macro-F1 from 0.945 to 0.964, almost entirely through three classes (Table 8, Figure 8). A single identifier turns classes that appear hard (ransomware, XSS) into nearly solved ones, indicating their apparent difficulty in the main analysis was a port-shortcut artifact rather than learned behavior. MITM gains nothing from the port—it is genuinely hard. This is the study’s most reproducible result and argues for reporting performance with identifiers excluded, or at least reporting the identifier-ablation delta.
Table 8.
Per-class recall change on the held-out split when dst_port is re-added to the full feature set (classes with a non-zero change).
Figure 8.
Identifier-shortcut inflation: per-class recall gained by re-adding the single dst_port feature. Ransomware and XSS are largely port-separable; MITM gains nothing.
4.8. Feature-Selection Stability
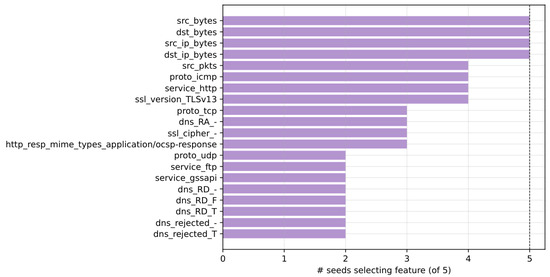
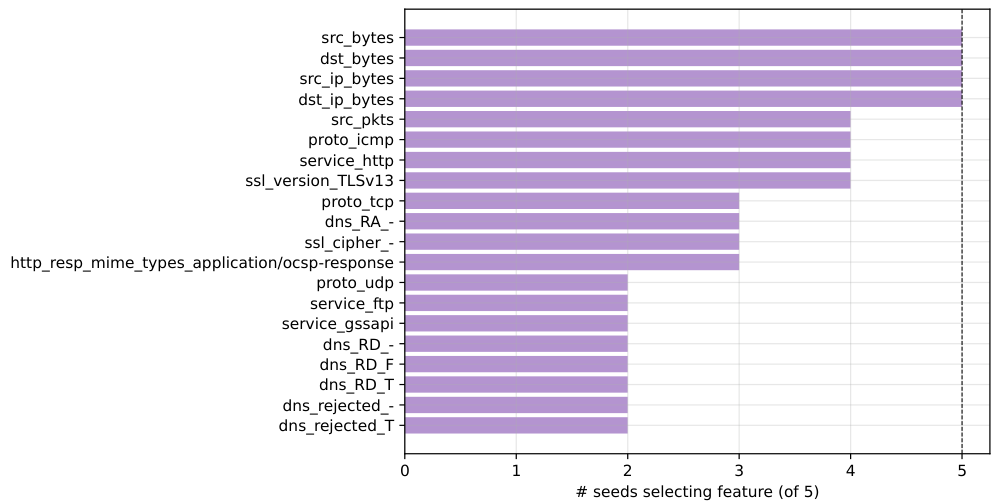
Across five random seeds, the wrapper’s inner objective values are highly reproducible (macro-F1 , worst-class ), but the selected subsets are not: Nogueira stability index [11] 0.21 and mean pairwise Jaccard 0.25 (sizes 21–29). Only four traffic-volume features (src_bytes, dst_bytes, src_ip_bytes, dst_ip_bytes) are selected by every seed (Figure 9). This is classic selection multiplicity: many near-equivalent subsets achieve the same frontier, which is why we report the recurring core rather than presenting one subset as if it were uniquely optimal.
Figure 9.
Feature-selection frequency across 5 seeds for the Wrapper-maxF1 selection (Nogueira stability , mean Jaccard ). Only a small traffic-volume core (dashed line at all five seeds) recurs.
4.9. Efficiency and Feature-Acquisition Cost
The 21-feature model is smaller and faster than the full model (serialized size 25.2 vs. 46.8 MB; inference 7.3 vs. 9.0 μs/flow on a single CPU). However, compactness does not imply cheap features: of the 21 selected features, 15 require application-layer parsing (6 HTTP, 5 TLS, 2 service/deep-packet-inspection, 1 DNS, 1 Zeek “weird”) and only 6 are cheap flow/header counters (byte, packet, and duration counters plus the IP protocol). On constrained IoT gateways, the dominant deployment cost is often feature acquisition, so a smaller subset dominated by DNS/TLS/HTTP parsing may not reduce end-to-end cost as much as its feature count suggests.
To quantify what the expensive tier actually buys, we compared three Random Forest models on the held-out split (Table 9): one restricted to the 11 cheap flow/header features (byte, packet, and duration counters plus the one-hot IP protocol), the full 105-feature model, and the 21-feature wrapper. The cheap-only model matches the full model on aggregate macro-F1 (0.945) but has the lowest rare-class recall of the three (MITM 0.757, below the full model’s 0.776 and well below the wrapper’s 0.827). The application-layer features that dominate the wrapper are therefore precisely the ones that lift rare-class recall: the cheap counters, which are essentially free to acquire, suffice for aggregate accuracy but not for the rare class. This exposes a direct tension on constrained gateways, where DNS/TLS/HTTP parsing is the dominant per-flow cost—reducing feature-acquisition cost by dropping to header counters would sacrifice exactly the rare-class recall the study is concerned with. A principled way to surface this trade-off in future work is to add a per-feature acquisition-cost term as an explicit fourth objective in the multi-objective search (alongside macro-F1, worst-class recall, and subset size), so that the frontier is drawn over accuracy, rare-class recall, and real acquisition cost rather than over feature count.
Table 9.
Feature-acquisition cost tiers on the held-out test split (Random Forest). The cheap tier (11 flow/header features) matches the full model on macro-F1 but gives the lowest rare-class recall; the application-layer features carried by the wrapper are what raise MITM recall.
4.10. External Validation on NSL-KDD
Table 10 reports the replication on NSL-KDD. Finding 1 holds: an aggregate-strong Random Forest (macro-F1 ) still misses the rare class, with u2r recall only ; on the official distribution-shifted KDDTest+ split the collapse is far more severe (accuracy 0.751, macro-F1 0.496, u2r recall 0.030). Finding 2 holds, and is if anything sharper than on TON_IoT: mutual-information filtering does not help the rare class—u2r recall is 0.375 at both top-10 and top-20 and 0.438 at top-30 (reference split), at or below the full-feature value while aggregate macro-F1 stays high. Finding 3 partially holds: SMOTE again gives the best aggregate/rare-class balance (macro-F1 , u2r ) and undersampling maximizes rare-class recall at heavy aggregate cost (u2r , macro-F1 ), as on TON_IoT; however, cost-sensitive class weighting—which helped on TON_IoT—does not reliably help here (, within noise of the baseline), a dataset-dependent nuance. As on TON_IoT, u2r is the rarest class and is the worst-performing class for every method except undersampling, where its recall is maximized and another class becomes the minimum. The u2r estimates carry wide uncertainty because only 52 u2r instances exist in the entire NSL-KDD training corpus; under a stratified 70/30 split, this leaves roughly 36 u2r flows for training and only about 16 in each test fold, so a single misclassified test instance moves u2r recall by approximately 0.06. The wide standard deviations we report (for example, for the plain Random Forest) are a direct consequence of this scarcity. We therefore report u2r as mean ± sd over six seeds, treat the single-split KDDTest+ value as indicative only, and deliberately avoid strong per-method claims for that class; importantly, the qualitative findings—aggregate metrics conceal the rare class, and relevance-based filtering does not remedy it—do not rest on small u2r differences. Overall, the two robust and transferable messages of the paper—aggregate metrics conceal rare-class failure, and relevance-based filtering does not remedy it—replicate on a second, non-IoT corpus with an order-of-magnitude rarer class.
Table 10.
External validation on NSL-KDD (rarest class u2r). The Random Forest rows are repeated stratified 70/30 (mean ± sd over 6 seeds); the mutual-information top-k rows are from a single reference split and the last row is the official distribution-shifted KDDTest+ partition, so those rows carry no ±. u2r is the rarest class (0.04%) and is the worst-performing class for every method except undersampling.
5. Discussion
Read together, the results reframe what feature selection does and does not buy on this task. The reliable benefits of the multi-objective search are a smaller feature set at a negligible but statistically detectable aggregate cost (macro-F1 lower by 0.003 under repeated cross-validation, corrected ), together with a frontier far better than random subsets of the same size. Its rare-class benefit, by contrast, is small and not statistically reliable under a cross-validation-appropriate test, and it is matched or exceeded by simply reweighting or oversampling the full feature set (Section 4.4). For a practitioner whose goal is rare-class recall, SMOTE or class weighting is the simpler and stronger lever; feature selection is better motivated by model compactness and interpretability.
The identifier ablation and the stability analysis are the more transferable messages. The port ablation shows that per-class difficulty on this dataset is partly an artifact of testbed identifiers, so benchmark results that retain ports or addresses may overstate detection of ransomware- and XSS-like traffic. The stability result shows that a single reported subset is one of many near-equivalent choices; reporting a recurring feature core and a stability index is more honest than presenting one subset as canonical. Finally, the classifier-sensitivity results caution that subsets selected with one learner need not transfer to another.
Feature-acquisition cost. The efficiency analysis (Section 4.9) shows that model compactness and deployment cost are not the same thing on IoT hardware. The 21-feature wrapper is smaller and faster to score, but 15 of its 21 features require DNS, TLS, HTTP, or service-level parsing, and the cost experiment (Table 9) shows that these application-layer features are exactly what lift rare-class recall—a header-only model matches the aggregate score but drops MITM recall to 0.757. For a constrained gateway, then, the meaningful axis is feature-acquisition cost rather than feature count, and rare-class recall and acquisition cost are in direct tension. We therefore suggest that future multi-objective formulations replace or augment the subset-size objective with a per-feature acquisition-cost term, so that the search trades off aggregate accuracy, worst-class recall, and real deployment cost directly rather than treating all features as equally cheap.
Operational adequacy. Even the best rare-class configurations here (SMOTE at MITM recall 0.904; the wrapper at 0.827) miss roughly one in ten to one in six MITM flows. For a security control, this is typically inadequate on its own and would need to be paired with complementary detection or human triage; we state this plainly rather than presenting any configuration as deployment-ready.
Limitations
Several limitations bound these conclusions. First, the study rests on two lab-generated corpora: the primary analysis uses one processed TON_IoT Network partition (provenance recorded in Section 3.1), and the two transferable findings are additionally validated on NSL-KDD (Section 4.10); both are controlled-testbed datasets, NSL-KDD is not IoT-specific, and validation on live IoT traffic remains future work, while the identifier-shortcut ablation and the multi-objective frontier are reported on TON_IoT only. The NSL-KDD rare class is moreover extremely scarce (only 52 u2r instances, roughly 16 per test fold), so its per-method recall estimates are inherently noisy and are reported with that caveat rather than used for fine-grained ranking. Second, the available copy lacks a packet-timestamp column, so the leakage-safe temporal split recommended in the literature [4,5] cannot be performed here; the stratified split is therefore optimistic relative to deployment, and although nested cross-validation removes selection leakage, it does not remove this dataset-level optimism. Third, the frontier is drawn with a Decision Tree proxy and evaluated mainly with Random Forest; the decomposition in Section 4.5 shows that the inner-to-test gap is driven mainly by inner-validation generalization rather than by the proxy itself (the proxy contributes only about to worst-class recall, in the conservative direction), but Section 4.6 shows that transfer of a selected subset across learners is not guaranteed. Fourth, the identifier ablation re-adds only dst_port; addresses and certificate identities were removed at preprocessing and were not separately quantified. Finally, a single CPU with roughly 4 GB of memory constrained model sizes and the search budget, so larger ensembles and deep models were out of scope.
6. Conclusions
On a real multi-attack IoT dataset, strong aggregate metrics conceal weak rare-class recall, and a mutual-information filter does not fix it. A transparent multi-objective search maps the aggregate/worst-class frontier and reliably yields much smaller subsets at a negligible aggregate cost (macro-F1 lower by 0.003) and far above random subsets, but its rare-class advantage is small and not statistically reliable, and it is matched or exceeded by class weighting and SMOTE on the full feature set. The identifier ablation shows that several attack classes are separable mainly by a port artifact, while the genuinely rare class (MITM) is not; and selected subsets are unstable despite reproducible objective values. The two transferable messages—aggregate metrics conceal rare-class failure, and relevance-based filtering does not remedy it—replicate on the NSL-KDD benchmark with an even rarer class. We recommend that IoT intrusion-detection studies report the aggregate–worst-class frontier, an identifier-shortcut ablation, a feature-selection stability index, and cross-validation-appropriate significance tests, rather than a single aggregate score and a single hand-picked subset. Future work should repeat the analysis on the timestamped raw TON_IoT logs with a temporal split, on live IoT traffic and additional IoT datasets, and with additional learners.
Author Contributions
Conceptualization, N.N.S.; methodology, N.N.S., S.I.S. and T.K.; software, N.N.S.; validation, N.N.S.; formal analysis, N.N.S., S.I.S. and T.K.; investigation, N.N.S., S.I.S. and T.K.; data curation, N.N.S., S.I.S. and T.K.; writing—original draft preparation, N.N.S.; writing—review and editing, N.N.S., S.I.S. and T.K.; visualization, N.N.S., S.I.S. and T.K. All authors have read and agreed to the published version of the manuscript.
Funding
This research received no external funding.
Institutional Review Board Statement
Not applicable.
Informed Consent Statement
Not applicable.
Data Availability Statement
The TON_IoT dataset is publicly available from its original providers [1,6]; the analyzed Network training partition has md5 e9c9e8a9c8595dcf85ae88fa12b838c2. The NSL-KDD benchmark [16] is publicly available; the analyzed KDDTrain+/KDDTest+ files have md5 8e1ddf4f9555080ee5f7af685ba27907 and 75f88adea793cfef2d3db83f96aa5dea. All preprocessing scripts, the self-coded NSGA-II, evaluation and statistical-testing code, and the fixed data split that reproduce every table and figure are openly available in Mendeley Data at https://doi.org/10.17632/tsgmrj9gf9.1 (V1). Global random seed 42 was used throughout.
Conflicts of Interest
The authors declare no conflicts of interest.
Abbreviations
The following abbreviations are used in this manuscript:
| IoT | Internet of Things |
| IIoT | Industrial Internet of Things |
| IDS | Intrusion Detection System |
| NIDS | Network Intrusion Detection System |
| MITM | Man-in-the-Middle |
| XSS | Cross-Site Scripting |
| DoS | Denial of Service |
| DDoS | Distributed Denial of Service |
| U2R | User-to-Root |
| R2L | Remote-to-Local |
| RF | Random Forest |
| DT | Decision Tree |
| CV | Cross-Validation |
| MCC | Matthews Correlation Coefficient |
| MI | Mutual Information |
| NSGA-II | Non-dominated Sorting Genetic Algorithm II |
| SMOTE | Synthetic Minority Over-sampling Technique |
| TP | True Positive |
| FN | False Negative |
| FP | False Positive |
References
- Moustafa, N. A New Distributed Architecture for Evaluating AI-Based Security Systems at the Edge: Network TON_IoT Datasets. Sustain. Cities Soc. 2021, 72, 102994. [Google Scholar] [CrossRef] [Scilit]
- Kareem, S.S.; Mostafa, R.R.; Hashim, F.A.; El-Bakry, H.M. An Effective Feature Selection Model Using Hybrid Metaheuristic Algorithms for IoT Intrusion Detection. Sensors 2022, 22, 1396. [Google Scholar] [CrossRef] [Scilit] [PubMed]
- Mchina, J.P.; Mduma, N.; Sinde, R.S. Adaptive Class-Aware Feature Selection for High-Dimensional and Imbalanced Multi-Class Network Intrusion Detection. Front. Big Data 2026, 9, 1871346. [Google Scholar] [CrossRef] [Scilit] [PubMed]
- Arp, D.; Quiring, E.; Pendlebury, F.; Warnecke, A.; Pierazzi, F.; Wressnegger, C.; Cavallaro, L.; Rieck, K. Dos and Don’ts of Machine Learning in Computer Security. In Proceedings of the 31st USENIX Security Symposium; USENIX Association: Boston, MA, USA, 2022; pp. 3971–3988. [Google Scholar]
- Chikezie, C.I.; Usman, A.U.; David, M.; Zubair, S.; Ohize, H.O.; Ojeniyi, J. A Scientific Integrity Framework for Open-Set IoT Intrusion Detection with Device-Disjoint Splits. Future Internet 2026, 18, 287. [Google Scholar] [CrossRef] [Scilit]
- Alsaedi, A.; Moustafa, N.; Tari, Z.; Mahmood, A.; Anwar, A. TON_IoT Telemetry Dataset: A New Generation Dataset of IoT and IIoT for Data-Driven Intrusion Detection Systems. IEEE Access 2020, 8, 165130–165150. [Google Scholar] [CrossRef] [Scilit]
- Roopak, M.; Tian, G.Y.; Chambers, J. Multi-Objective-Based Feature Selection for DDoS Attack Detection in IoT Networks. IET Netw. 2020, 9, 120–127. [Google Scholar] [CrossRef] [Scilit]
- Westphal, C.; Hailes, S.; Musolesi, M. Feature Selection for Network Intrusion Detection. In Proceedings of the 31st ACM SIGKDD Conference on Knowledge Discovery and Data Mining (KDD ’25), Toronto, ON, Canada, 3–7 August 2025; pp. 1599–1610. [Google Scholar]
- Deb, K.; Pratap, A.; Agarwal, S.; Meyarivan, T. A Fast and Elitist Multiobjective Genetic Algorithm: NSGA-II. IEEE Trans. Evol. Comput. 2002, 6, 182–197. [Google Scholar] [CrossRef] [Scilit]
- Chawla, N.V.; Bowyer, K.W.; Hall, L.O.; Kegelmeyer, W.P. SMOTE: Synthetic Minority Over-sampling Technique. J. Artif. Intell. Res. 2002, 16, 321–357. [Google Scholar] [CrossRef] [Scilit]
- Nogueira, S.; Sechidis, K.; Brown, G. On the Stability of Feature Selection Algorithms. J. Mach. Learn. Res. 2017, 18, 1–54. [Google Scholar] [CrossRef] [Scilit]
- Nadeau, C.; Bengio, Y. Inference for the Generalization Error. Mach. Learn. 2003, 52, 239–281. [Google Scholar] [CrossRef] [Scilit]
- Breiman, L. Random Forests. Mach. Learn. 2001, 45, 5–32. [Google Scholar] [CrossRef] [Scilit]
- Pedregosa, F.; Varoquaux, G.; Gramfort, A.; Michel, V.; Thirion, B.; Grisel, O.; Blondel, M.; Prettenhofer, P.; Weiss, R.; Dubourg, V.; et al. Scikit-learn: Machine Learning in Python. J. Mach. Learn. Res. 2011, 12, 2825–2830. [Google Scholar]
- Lemaître, G.; Nogueira, F.; Aridas, C.K. Imbalanced-learn: A Python Toolbox to Tackle the Curse of Imbalanced Datasets in Machine Learning. J. Mach. Learn. Res. 2017, 18, 1–5. [Google Scholar]
- Tavallaee, M.; Bagheri, E.; Lu, W.; Ghorbani, A.A. A Detailed Analysis of the KDD CUP 99 Data Set. In Proceedings of the 2009 IEEE Symposium on Computational Intelligence for Security and Defense Applications (CISDA), Ottawa, ON, Canada, 8–10 July 2009; pp. 1–6. [Google Scholar]

Disclaimer/Publisher’s Note: The statements, opinions and data contained in all publications are solely those of the individual author(s) and contributor(s) and not of MDPI and/or the editor(s). MDPI and/or the editor(s) disclaim responsibility for any injury to people or property resulting from any ideas, methods, instructions or products referred to in the content. |
© 2026 by the authors. Licensee MDPI, Basel, Switzerland. This article is an open access article distributed under the terms and conditions of the Creative Commons Attribution (CC BY) license.