


Abstract
We evaluated whether predictive alerts improve recovery in DriftGuard-SLA, a bounded controller for the Kubernetes-based DeathStarBench Hotel Reservation application. A logistic model trained on 35 monitoring runs was frozen before evaluation in 350 runs comprising 70 matched blocks, five policies, six faults, and a no-fault condition. For new sustained service-level objective breaches within 10 s, monitoring-run predictions achieved a Matthews correlation coefficient of 0.285, tie-aware average precision of 0.174, precision of 0.725, and recall of 0.119. Compared with monitoring alone, the complete controller reduced violation time by 7.70 s (95% confidence interval, 0.00–21.40; Holm-adjusted p = 0.031). Compared with fixed rules sharing its action mapping, the reduction was inconclusive at 1.08 s (−1.07–5.18; Holm-adjusted p = 0.453). Excluding four pre-injection actions yielded a descriptive sensitivity estimate of 0.02 s (−1.21–1.40). Of 38 faulted run actions, 4 preceded injection, 14 occurred during an active breach, 14 preceded a new onset, 5 had neither relation during complete observation, and one was censored. These findings support the feasibility of bounded intervention and paired evaluation, but do not establish superior predictive triggering, cost savings, or generalization beyond this benchmark.
1. Introduction
Service-oriented architecture (SOA) organizes software capabilities as interacting services governed by explicit contracts [1]. Cloud-native microservices retain this service orientation while emphasizing independent deployment, elastic scaling, and operational autonomy. The distinction matters here: the intervention targets a deployed microservice, whereas the outcome is the end-to-end behavior of an SOA request path. DeathStarBench Hotel Reservation supplies such a path because one client request crosses several services and data stores before it completes.
The engineering problem begins when a disturbance propagates through that path. A resource or communication fault changes the running system; telemetry may then indicate that a service-level objective (SLO) is about to be violated. The controller must decide whether to intervene. An early action may prevent or shorten a user-visible failure, but the same action may arrive too late, restart healthy work, or reserve capacity without improving the service. This sequence preserves the established distinction among a fault, the internal error it creates, and the failure observed by users [2]. It also makes safety part of the research question rather than an afterthought.
Prediction and automated recovery are established research areas. Autonomic computing and architecture-based adaptation introduced reusable monitor–analyze–plan–execute loops [3,4]. Seer predicts imminent quality-of-service (QoS) violations in cloud microservices [5]; FIRM, Sage, Sinan, Nodens, and Narya couple diagnosis or prediction with resource adaptation or mitigation [6,7,8,9,10]. More recent systems address failure prediction, multimodal diagnosis, requirements-driven autoscaling, and executable remediation [11,12,13,14,15,16,17]. Consequently, this article does not claim that pre-violation prediction or closed-loop self-correction is new in isolation.
The narrower gap concerns evaluation. The studies reviewed in Section 2 do not jointly examine the same operational question across heterogeneous, repeatable SOA fault classes: whether a frozen prospective SLO breach signal is associated with a favorable paired recovery outcome difference when disturbances and workload seeds are paired, the fault-specific action mapping is held constant in the key comparison, and lead time, SLO exposure, recovery, containment, measured operational exposure, and poorly aligned actions are reported together. DriftGuard-SLA was built to examine that question. Its distinct contribution is the paired prediction-to-action evaluation and the evidence it retains, not priority over earlier predictive or self-healing systems. Realized action occurrence and timing remain part of the intention-to-treat contrast rather than controlled quantities.
Against this background, we asked three research questions:
RQ1: On temporally later runs, can a run-balanced model predict the onset of a new sustained SLO breach episode better than no-skill, time-only, and modest nonlinear baselines?
RQ2: How much service benefit is attributable to the complete DriftGuard-SLA package, and how much remains in an intention-to-treat comparison with fixed rules that share the same fault-specific action mapping but differ in whether and when they act?
RQ3: What timing, action alignment, operational exposure, and trace propagation trade-offs accompany prediction-triggered self-correction?
The contribution consists of an implemented artifact, an evaluation method, and the evidence needed to judge both. Specifically, the study provides:
- A bounded controller that converts a frozen prospective SLO breach estimate into at most one Kubernetes intervention per run while recording the complete trigger-to-outcome timeline.
- A matched fault–seed–policy design comprising 35 calibration runs and 350 accepted evaluation runs, with monitor-only, same-mapping fixed rule, isolate-on-alert, and native Kubernetes comparators that separate the whole intervention package from the trigger policy contrast.
- A breach onset target and event-aligned analysis that separates pre-injection action, action during an active breach, action before a new onset, a fully observed neither category, right censoring, and abstention, while retaining service outcomes and the measured operational exposure proxy.
- A verification package containing frozen protocols and amendments, model and controller artifacts, accepted and quarantined registers, derived telemetry summaries, trace counts, environment records, hashes, and executable revision analyses. The supplementary package also includes the complete retained raw archive of one-second dashboards and sampled traces, with instructions for checking the reported results.
The scope is deliberately bounded. During a run, DriftGuard-SLA receives the localized fault class and invokes the preassigned action for that condition; it neither discovers the root cause nor learns or invents an open-ended repair. The model coefficients, threshold, 10 s horizon, SLO thresholds, and action mapping are configuration-specific. No online updating occurred during the frozen evaluation, and the retained evidence does not support a claim about drift-selective adaptation.
2. Related Work and Study Positioning
2.1. Failure Prediction and Proactive SLO Management
PREFACE predicts failures in autoscaling distributed applications from variable-size collections of performance indicators [11], whereas InstantOps combines metrics, logs, and traces for failure prediction and root cause identification [12]. Seer goes further by predicting imminent QoS violations and identifying the microservice or resource most likely to be responsible [5]. MicroRCA instead emphasizes real-time localization from service dependencies and resource use under injected Kubernetes anomalies [14]. These studies establish that useful warning or diagnostic signals can be obtained before or around externally visible failures; they do not, by themselves, provide this study’s paired intention-to-treat service outcome contrast for responding to a particular warning.
That distinction matters because prediction, diagnosis, action choice, and recovery are separate decisions. A predictor may discriminate well yet trigger an ineffective action, while a simple reactive rule may perform adequately when the actuator dominates the outcome. Recent trace-oriented work similarly identifies the move from predictive evidence to trustworthy intervention as an open deployment problem [17]. Our evaluation therefore measures prediction on monitor-only runs and evaluates interventions separately in paired policy runs.
We chose logistic regression because the calibration evidence contains only 35 independent runs. Under that constraint, a compact model can be inspected, replayed once per second, and evaluated more defensibly than a data-intensive sequence model. Simplicity, however, is not treated as protection against a weak baseline. The deployed iteratively reweighted least-squares model is compared with prevalence, an elapsed time placebo, a separately implemented run-balanced logistic sensitivity model, and shallow gradient boosting on the same calibration/evaluation split. The second logistic row is an alternative fitting pipeline rather than a refit of the deployed artifact. Together, the comparisons test whether the warning is merely a recurring time-of-run pattern and whether it depends on one linear implementation. Deep sequence or graph models remain plausible extensions once substantially more independent runs are available.
2.2. Self-Adaptation and Automated Remediation
The Monitor–Analyze–Plan–Execute over a shared Knowledge base (MAPE-K) loop and Rainbow established influential foundations for adaptive software and reusable architectural support [3,4]. Within microservices, FIRM localizes resource contention and reprovisions resources to protect SLOs [6]; Sage combines dependency-aware diagnosis with corrective action [7]; and Sinan predicts QoS consequences when choosing per-tier resource allocations [8]. Nodens responds to load and dependency dynamics through load prediction and resource adjustment [10], while Narya demonstrates predictive and adaptive mitigation of cloud virtual machine interruptions at production scale [9]. These systems preclude any claim that DriftGuard-SLA is the first predictive or closed-loop remediation approach.
Requirements-driven microservice autoscaling [13] and newer remediation systems [15,16] further broaden the design space. E2E-REME generates executable playbooks, and Safe Remediation formulates intervention as a risk-constrained decision, although the latter was a non-peer-reviewed preprint when this revision was prepared. Relative to these systems, DriftGuard-SLA is intentionally modest: it uses a frozen predictor and a fixed action set. Its contribution is a paired experiment that asks whether the trigger improves an executed action and whether any improvement justifies its timing and measured operational exposure.
2.3. Real-Time Cloud Applications, Orchestration, and QoS Control
Research on real-time online interactive applications (ROIA) offers a complementary lineage. The Real-Time Framework Resource Management System (RTF-RMS) selects load-balancing and cloud allocation actions as user demand changes [18], and later scalability models estimate the benefit–cost trade-off of adding, removing, or redistributing resources [19]. Predictive provisioning for massively multiplayer online games likewise combines workload forecasts with processor, memory, and network-demand models [20]. Work on mobile online games extends these concerns to latency-sensitive mobile–cloud paths [21]. These studies motivate proactive control, but their principal disturbance is workload or capacity pressure rather than a common set of injected service faults.
At the deployment level, Kubernetes-based session slot architectures combine QoS, autoscaling, and efficient use of central processing unit (CPU), graphics processing unit (GPU), and memory resources [22]. Multi-cloud orchestration adds secure inter-cloud connectivity, placement, and cross-cloud resource management [23]. Software-defined networking (SDN) provides another control surface by translating application-level QoS needs into programmable network behavior [24]. In a different setting, the alarm system study of Tomak and Gorlatch shows how response time measurements can test whether fault management in a legacy distributed system meets hard timing constraints [25]. DriftGuard-SLA neither implements multi-cloud placement nor controls an SDN data plane; these works instead define deployment contexts in which the paired trigger–action protocol could be replicated.
2.4. Chaos-Based Evaluation and the Remaining Gap
CHESS demonstrates how chaos engineering can evaluate self-adaptive systems [26], while DeathStarBench provides a reproducible workload for cloud-microservice experiments [27]. We combine these elements in matched fault–seed blocks that compare five policies. The design addresses four specific threats: predictable injection timing, confounding the trigger with the recovery action, counting an active breach as repeated impending events, and equating a no-fault condition with an automatically false action. Table 1 places those choices beside representative predictive, adaptive, and cloud control studies. The comparison supports a narrow gap: prior systems establish that prediction and remediation are possible, whereas this study estimates whether a frozen prospective trigger adds operational value under matched, heterogeneous faults and records when it does not.
Table 1.
How the evaluated contribution differs from representative prediction, adaptation, and remediation studies.
3. DriftGuard-SLA Architecture
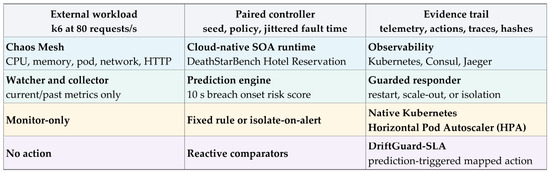
DriftGuard-SLA contains four runtime components: a Watcher, a Collector, a Prediction Engine, and a Responder. Every second, the Watcher samples Kubernetes resource state, pod readiness, service probes, and node pressure. The Collector converts the current and recent samples into eight bounded features, after which the Prediction Engine evaluates the frozen logistic model. When the trigger condition is satisfied, the Responder invokes the fault-class action supplied by the experimental launcher and records the trigger time, the invoked action, its execution duration, and the deployment state that followed. Action selection was not learned or inferred from telemetry. Consul reconciliation and Jaeger traces are retained as evidence about discovery and propagation; neither is an unreported model input. Figure 1 summarizes these components and the comparator pathways.
Figure 1.
Implemented prediction-to-recovery loop for the cloud-native SOA. CPU denotes central processing unit, HTTP denotes Hypertext Transfer Protocol, and HPA denotes Horizontal Pod Autoscaler.
3.1. Prediction State
At second t, the model receives the target container’s CPU and memory ratios, their non-negative one-step slopes, latency headroom above 20 ms, the non-negative latency slope, the unready pod ratio, and node CPU headroom above 50%. Standardization uses means and scales estimated only from calibration runs. The model never sees elapsed time, fault class, planned injection time, future observations, or the later outcome of any policy. Equation (1) converts the standardized feature vector into a nominal logistic risk score for a new sustained breach beginning within the next 10 s; Section 5.1 evaluates its calibration rather than assuming that the score is a calibrated probability.
For the target used in Equation (1), a second is positive only when a new sustained breach begins between t + 1 and t + 10. Onset requires three consecutive seconds with 95th percentile (p95) latency above 100 ms or a failed request rate above 1%. An episode ends after five consecutive clean seconds. Samples inside an active episode are removed from the eligible set so that a continuing violation is not misrepresented as a sequence of new impending events.
3.2. Guarded Recovery Actions
The launcher assigned one of two action families by condition. CPU and memory pressure used a rolling restart of the localized deployment; pod faults, network delay, packet loss, and HTTP delay used scale-out. Fixed rules and DriftGuard-SLA shared this condition-specific mapping, which supports an intention-to-treat comparison of the two trigger policies. Because the policies could differ in whether and when they acted, the contrast is not a pure timing effect. Isolate-on-alert deliberately used a different response: a more sensitive reactive threshold followed by target pod deletion. Native Kubernetes retained Deployment reconciliation and enabled a Horizontal Pod Autoscaler (HPA) with a 150 millicore average CPU target, a minimum of one replica, and a maximum of two replicas.
Table 2 also clarifies a mechanistic limit. When applied, a mode-one Chaos Mesh object attaches to a selected pod or link endpoint; it does not automatically follow a restarted pod or a new replica. A restart or scale-out can therefore contain a localized disturbance by shifting work to clean or unaffected capacity. We count this as a legitimate availability mechanism, but not as evidence that DriftGuard-SLA removes a persistent fault that follows every replacement.
Table 2.
Controlled conditions, injected scope, and action semantics. MiB denotes mebibytes. The injector did not re-target mode-one replacement pods.
4. Materials and Methods
4.1. Study Design and Execution Environment
We evaluated the implemented artifact using a design science approach [28]. DeathStarBench Hotel Reservation (commit 6ecb09706140f8730b5385c08f1386c654c3c526) ran on K3s, a lightweight Kubernetes distribution, on a dedicated Amazon Web Services (AWS; Amazon Web Services, Inc., Seattle, WA, USA) m7i-flex.large application node in the us-east-1 region (2 logical CPUs and approximately 7.6 gibibytes (GiB) of reported memory). A separate c7i-flex.large node (2 logical CPUs and approximately 3.7 GiB of reported memory) generated k6 load over a private virtual network. The captured environment used K3s/Kubernetes v1.36.2+k3s1, Chaos Mesh 2.8.3, Jaeger 1.57, Consul 1.13.2, k6 2.1.0, and the HPA from that Kubernetes release; the precise versions and image digests are retained in the reproducibility record. The corresponding official documentation describes these platforms [29,30,31,32,33]. The record also retains operating systems, kernels, Kubernetes objects, clock configuration, package versions, and Secure Hash Algorithm 256-bit (SHA-256) hashes.
Each run lasted 150 s under a fixed offered load of 80 requests/s; the injected fault remained active for 45 s. Depending on its seeded start between 25 and 50 s, the design retained 55–80 s of observation after fault removal. The constant workload was chosen to preserve a matched policy contrast around one bounded disturbance, not to represent production demand variation. Policies within a fault–seed block received the same injection time. For each block, a pseudorandom permutation of the five policies was generated from a recorded seed. The permutation varied run position, while the stored seed made the order exactly reproducible. Before accepting a run, we checked readiness, start alignment, telemetry length, pre-fault load, Consul service discovery state, trace collection, controller errors, and k6 completion. An attempt failing any gate was quarantined and retried no more than three times. A k6 exit status of 99 indicated that a performance threshold had been crossed; the run was retained only when all ordinary completeness checks still passed.
Calibration used 35 monitor-only runs obtained by crossing seeds 301–305 with six fault classes and the no-fault condition. The model was frozen before evaluation on seeds 11, 22, 33, 44, 55, 66, 77, 88, 99, and 111. The resulting matrix contains 350 accepted runs (seven conditions × five policies × ten seeds) organized as 70 complete paired blocks. Before examining outcomes, a timestamped amendment increased the evaluation set from five to ten seeds; the model, endpoints, analysis families, and stopping rule were unchanged. We did not select the number of runs from a power calculation performed before data collection. Accordingly, the analysis emphasizes paired effect estimates and their uncertainty. A non-significant result is not interpreted as proof that two policies are equivalent, and fault-specific estimates remain descriptive.
The audit trail is append-only and retains 15 excluded attempts, five superseded evaluation directories, and one interrupted directory. Exclusions were based solely on the operational and completeness gates above. Quarantined runs remain available for inspection but contributed neither labels nor outcomes. Five otherwise acceptable cells were superseded when an interrupted process required their entire blocks to be rerun consistently. The raw journals therefore contain 390 historical accepted entries, whereas the scientific dataset contains 385 unique runs: 35 calibration runs and 350 evaluation runs. In addition, after repeated trace-backend saturation caused incomplete collections, we introduced a Jaeger health check. It queried collector availability only and exposed neither policy identity nor interim outcomes. Every operational amendment was timestamped and hashed before execution resumed.
4.2. Model Fitting and Locked Evaluation
We first assigned equal total weight to each calibration run and then applied inverse class weights within its eligible seconds. Coefficients were fitted by L2-regularized logistic regression using the archived iteratively reweighted least-squares trainer. The operating threshold was selected from leave-one-run-out calibration predictions by maximizing the Matthews correlation coefficient (MCC), with ties resolved first by specificity and then by the higher threshold. After this choice, the coefficients and standardization parameters were refitted on all calibration runs and locked for evaluation. The resulting logistic output is treated as a risk score: its ranking and operating point behavior are evaluated separately from probability calibration.
Prediction performance was measured only on later monitor-only runs so that controller actions could not change the evaluation labels. We report eligible sample counts and prevalence by run, Matthews correlation coefficient (MCC), precision, recall, specificity, false positive rate, tie-aware average precision (AP), area under the receiver operating characteristic curve (ROC-AUC), and Brier score [34,35]. AP is the prevalence-sensitive average of precision over successive increases in recall. It was recomputed with the non-interpolated, tie-aware scikit-learn 1.9.0 average_precision_score implementation [36]; the archived score arrays and version manifest reproduce every model row. The deployed operating threshold was selected once from leave-one-run-out out-of-fold calibration predictions and then held at 0.950. At the event level, consecutive threshold exceedances were merged into alert episodes; breach event sensitivity, lead time, and false alerts per run hour were then calculated. Prevalence, elapsed time, and shallow gradient boosting use the same split.
4.3. Policies
The five policies differ in whether and how they intervene. Monitor-only records telemetry and never acts. Fixed rules act after three consecutive samples showing an unsuccessful probe, CPU ratio of at least 0.90, memory ratio of at least 0.90, latency of at least 100 ms, or readiness below one; when the rule fires, its fault-specific action is identical to DriftGuard-SLA’s action. Isolate-on-alert applies lower CPU and memory thresholds (0.80 and 0.85), retains the same latency and readiness conditions, and deletes the target pod. DriftGuard-SLA acts when the frozen risk crosses the locked threshold. Native Kubernetes has no custom trigger. All conditions retain ordinary Deployment reconciliation; the native condition also enables the HPA. To bound harm, each custom controller may execute at most one action per run, and scale-out is capped at two replicas.
4.4. Outcomes and Event-Aligned Safety
Outcomes were calculated within each run before any paired comparison. For each recorded one-second bin t, q(t) denotes the failed request proportion, l(t) the one-second request 95th percentile latency (p95), r(t) the controller-observed number of matching target container runtime statistics records, and I(·) an indicator. The latency and failed request thresholds are L = 100 ms and Q = 0.01. Equation (2) expresses availability as 100 times one minus the equal-weight mean of q(t) over every recorded bin in the run; it is a time average, not a request-weighted availability. Mean one-second p95 is likewise the full-run mean of l(t), not a request-level percentile. Equation (3) counts every post-anchor bin in which either threshold is crossed, irrespective of episode membership. For injected conditions, τ is the scheduled fault anchor. No-fault runs retain the same seeded pseudo-anchor between 25 and 50 s solely to support matched post-anchor comparisons; no fault is applied in those runs. In the displayed equations, subscript t denotes the same one-second bin as the argument t in q(t), l(t), and r(t).
A sustained breach is dated retrospectively to the first of three consecutive violating bins. Prediction samples from that onset through the five clean observations required to confirm episode closure are ineligible. For outcome recovery, however, the recovery timestamp is dated to the first bin of the first five-bin clean window. Conditional mean time to recovery (MTTR) is recovery window start minus breach onset. Union violation time remains the count of all individual violating bins after the anchor, including any later episode.
Besides the mean one-second p95, we calculated the post-anchor median and a 10% trimmed mean. Conditional mean time to recovery (MTTR) uses the first post-anchor sustained breach and the start of its first five-bin clean recovery window. Because this conditional quantity omits runs with no breach or no observed recovery, recovery burden assigns zero when no breach begins, observed MTTR when recovery occurs, and the last observed second plus one minus the onset when recovery is right-censored. Equation (4) sums max(0, r(t) − 1) over controller samples. Although retained as ‘extra replica seconds’ for continuity, r(t) is the count of matching Container Runtime Interface (CRI) statistics records, not Deployment desired or ready replicas. The measure is therefore an operational exposure proxy; it does not measure CPU time, memory occupancy, energy, currency cost, restart disruption, or displaced capacity for other services.
Of the 350 accepted dashboards, 349 contained the planned 150 bins. The native Kubernetes HTTP run for seed 33 contained 152 and was retained. Truncating that run to its first 150 bins changed the 60-pair DriftGuard-SLA improvement over native Kubernetes from 6.341 to 6.330 availability points, 219.771 to 219.546 ms for mean one-second p95, 8.133 to 8.100 violation seconds, and 6.283 to 6.250 recovery-burden seconds. The exact sign-flip p-values (0.001953) and 16-test-family Holm values (0.03125) were unchanged for all four outcomes; Table S1 gives the corresponding bootstrap intervals.
Action alignment is assessed at the continuous recorded trigger timestamp; its input values come from the telemetry row carrying that same timestamp. Sustained breach intervals are defined on integer one-second bins. A future onset is counted only when trigger < onset ≤ trigger + 10 s; a neither classification requires trigger + 10 s to be no later than the last observed bin, otherwise the action is right-censored. Faulted run actions therefore enter one of five mutually exclusive states: before injection; during an already-active sustained breach; after injection and before a new breach onset within 10 s; after injection with neither relation over a complete horizon; or right-censored. Runs without an action form a separate abstention category. The active breach state is reactive rather than prospective, and the fully observed neither state is observational rather than proof of an unnecessary action because intervention may change the subsequent event. For every category, we retain paired changes in violation time, recovery burden, availability, and the container count exposure proxy relative to monitor-only. No-fault runs are examined separately under the same horizon and censoring rules.
4.5. Trace Propagation
For each service, the no-fault monitor threshold is the median p95 span duration plus the larger of 1 ms or three median absolute deviations. The primary analysis is restricted to services observed in every accepted run with at least 20 spans in each service run. Within that fixed intersection, the propagation ratio is the fraction of services whose p95 span duration exceeds its own threshold. We report service run span counts, the minimum-sample rule, bootstrap uncertainty in thresholds, and paired two-way cluster effects. Fixing the denominator prevents a policy difference from being attributed to a service that simply vanished from the sampled traces [37].
4.6. Paired Inference
Effects were first calculated within fault class–workload seed cells. For each aggregate outcome and comparator, the six fault effects belonging to a workload seed were averaged, yielding ten seed cluster means. The primary p-value is an exact two-sided sign-flip test of the absolute unstudentized mean: all 210 = 1024 sign assignments were enumerated, with one common sign applied to the six effects within a seed. Pointwise 95% intervals use 10,000 crossed bootstrap replicates; each replicate samples six fault labels and ten workload seed labels with replacement independently and averages the resulting Cartesian array. Table S2 uses deterministic contrast-specific seeds of the form scope:metric:comparator and empirical percentile endpoints. These unstudentized intervals are neither simultaneous intervals nor inversions of the sign-flip tests. Holm’s step-down procedure adjusts the raw sign-flip p-values within the explicitly listed recovery (16 tests), SLO component (12), operational exposure (4), corrected trace (4), and no-fault (40) families; Wilcoxon sensitivities are not included in those corrections [38,39,40]. The complete family ledger is Table S2. A descriptive sensitivity excludes blocks in which DriftGuard-SLA acted before injection.
The authors designed and conducted the study and retained responsibility for the analysis and interpretation. OpenAI Codex assisted with experimental and statistical analysis code under their supervision. The reported results are based on the retained experimental records.
5. Results
The completed evaluation contains all 350 planned cells in 70 complete paired blocks. Fifteen attempts failed the frozen gates and were excluded from fitting and aggregation, although their records remain in the archive. The append-only journals also retain five earlier cells that were superseded and were not counted twice. Throughout this section, point estimates are interpreted with their uncertainty; a favorable direction is not treated as established benefit when the interval includes zero or the family-adjusted p-value remains large.
5.1. Prediction of New Breach Episodes (RQ1)
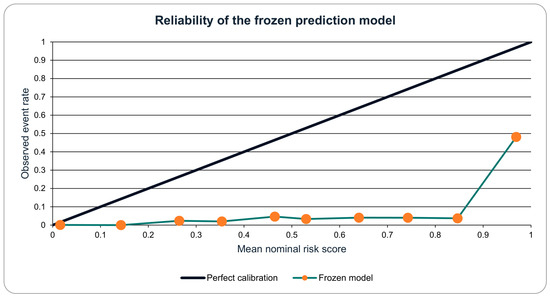
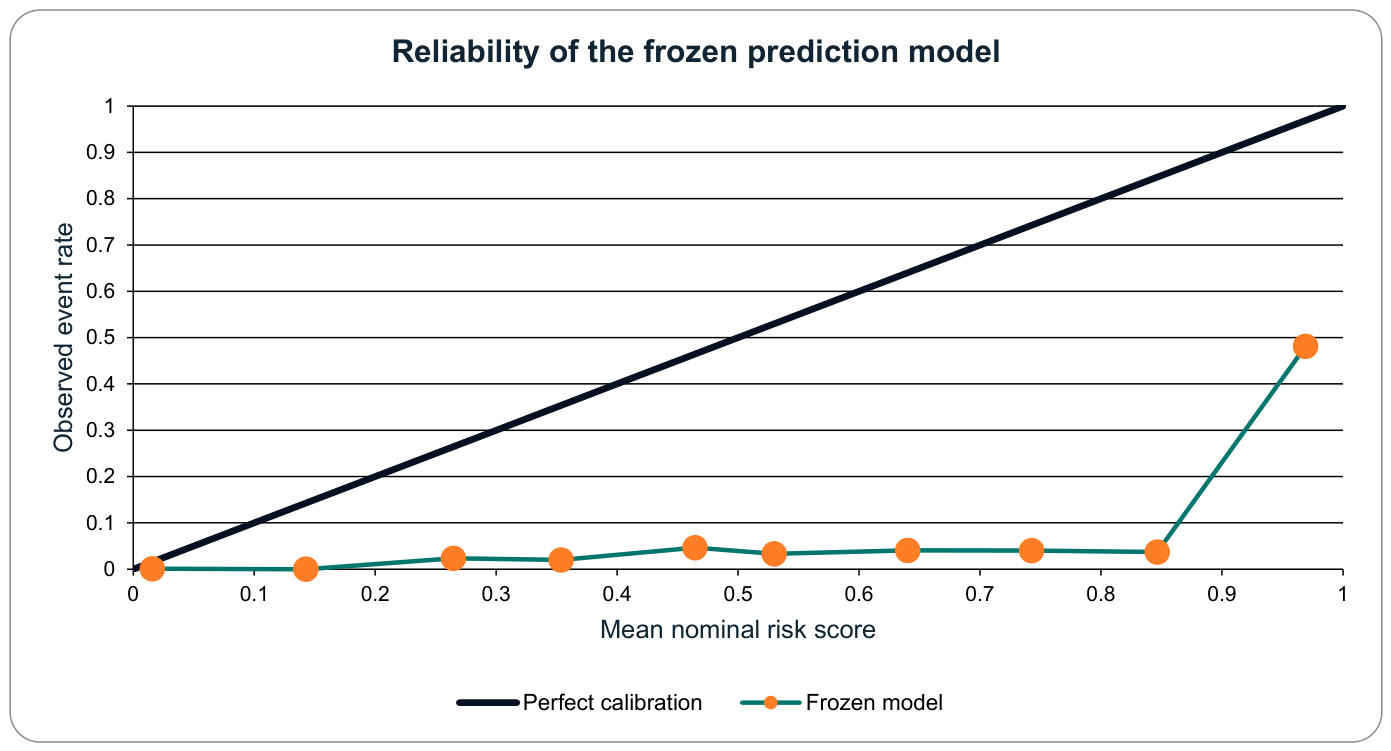
The eligible calibration data contained 150 positive seconds among 4119 observations (3.6%). In the later monitor-only evaluation data, the corresponding count was 310 among 8190 observations (3.8%). Seconds inside an active breach episode were ineligible for prediction evaluation. With this target and the deployed threshold fixed at 0.950, the model produced an MCC of 0.285, precision of 0.725, recall of 0.119, specificity of 0.998, a false positive rate of 0.002, AP of 0.174, ROC-AUC of 0.611, and a Brier score of 0.231. The calibration intercept (−3.274), slope (0.537), and Brier score—compared with 0.036 for the prevalence baseline—show that the class-weighted output is not a well-calibrated probability estimate. We therefore interpret it as a risk score evaluated at a locked operating point.
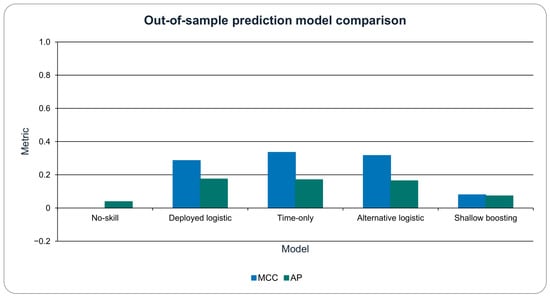
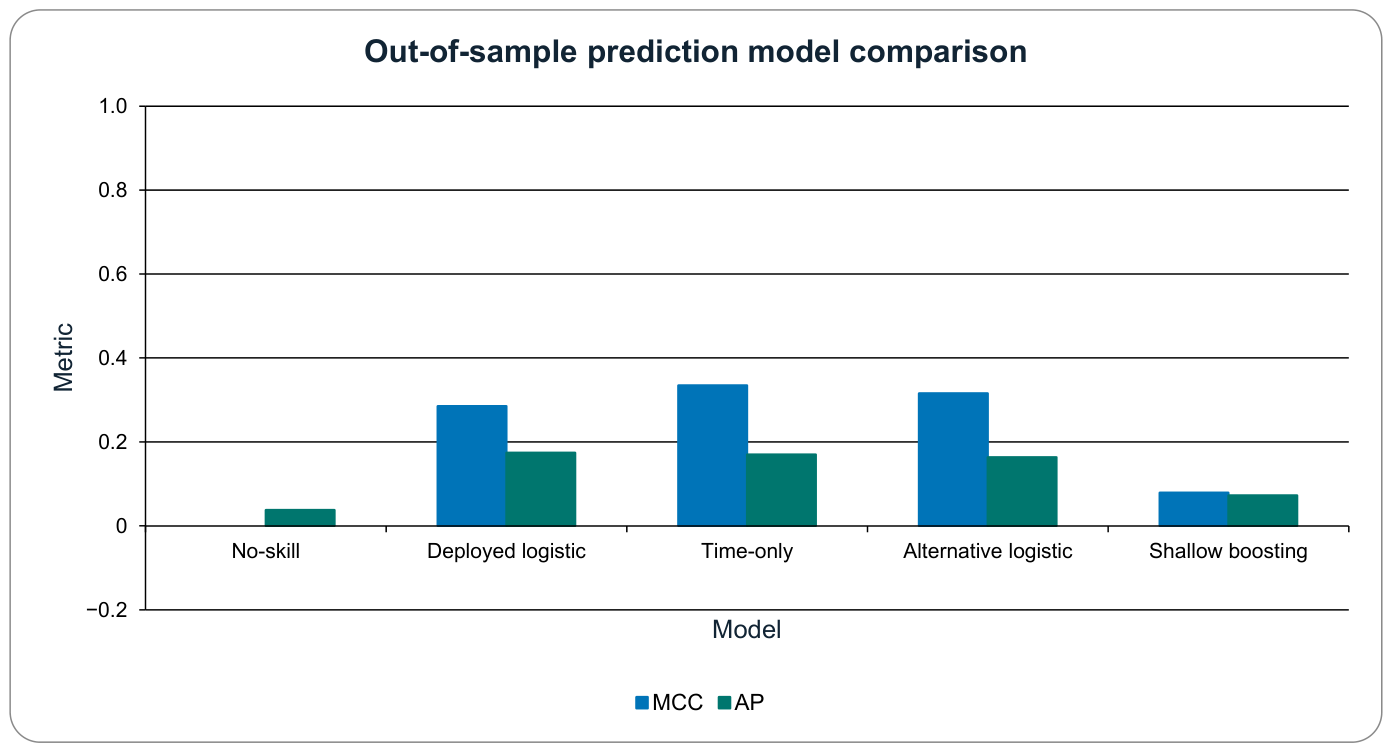
The elapsed time placebo reached a higher MCC (0.334) than the deployed model, a much higher ROC-AUC (0.891 versus 0.611), and a lower Brier score (0.131 versus 0.231), while its AP was similar (0.170 versus 0.174). The alternative logistic pipeline reached an MCC of 0.316, and shallow gradient boosting reached 0.079. This is a substantive warning: when faults are injected within a scheduled interval, elapsed time can become a strong surrogate predictor. Injection time was jittered and withheld from the deployed model, but the placebo remains a demanding comparison. Figure 2 and Table 3 therefore place the frozen model beside all alternatives rather than presenting it in isolation.
Figure 2.
Prediction performance on later monitor-only runs. Every model uses the same calibration/evaluation split; larger MCC and tie-aware AP values indicate better performance.
Table 3.
Out-of-sample sample-level prediction using the corrected breach onset target. Thr. denotes threshold; MCC, Matthews correlation coefficient; Prec., precision; FPR, false positive rate; AP, tie-aware average precision; and Brier, Brier score.
The calibration intercept was −3.274, and the slope was 0.537. The deployed threshold of 0.950 came from the prespecified out-of-fold calibration procedure and remained unchanged throughout evaluation. Threshold ranges obtained from a separate post hoc refitting routine are not presented as stability evidence because that routine does not reproduce the frozen deployed fit. Figure 3 shows the nonempty reliability bins, while the embedded workbook and supplement preserve their exact counts.
Figure 3.
Reliability of the frozen model on monitor-only evaluation runs. The dark identity line denotes perfect calibration. Empty bins are omitted. From the lowest to highest nonempty risk score interval, eligible-second counts are 892, 132, 212, 397, 2775, 2954, 492, 174, 81, and 81; corresponding positive counts are 1, 0, 5, 8, 129, 98, 20, 7, 3, and 39. The accompanying workbook includes interval bounds and both counts.
Sample-level scores do not tell the whole operational story. The 70 monitor-only runs produced 31 alert episodes, or 10.6 alerts per run hour. Seventeen alerts were followed by a new sustained breach within 10 s, and 14 were not, corresponding to 4.8 false alert episodes per run hour. The detector preceded 17 of the 31 observed breach episodes, giving an event sensitivity of 0.548; among detected events, median lead time was 3.0 s (interquartile range, 1.0–3.0 s). Four alerts in faulted monitor runs occurred before injection. We therefore interpret RQ1 through discrimination, calibration, event sensitivity, and alert burden together. The time-only baseline tests whether the signal can be explained by run timing, while the event analysis asks whether sample-level discrimination becomes a usable warning.
5.2. Service Outcomes Under Five Policies (RQ2)
Table 4 summarizes the descriptive service outcomes for each policy. Two estimands answer different questions. Relative to monitor-only, DriftGuard-SLA reduced mean union violation time by 7.70 s; this is the effect of the complete package—prediction, trigger, and action. Relative to fixed rules that share the same fault-specific action mapping, the reduction was 1.08 s (pointwise 95% CI, −1.07 to 5.18; Holm-adjusted p = 0.4531). This second, intention-to-treat contrast includes both action occurrence and timing; it more directly estimates the incremental value of the trigger policy, but it is not a pure timing or mediation effect and does not establish superiority. DriftGuard-SLA performed 14.20 s worse than isolate-on-alert on the positive-favors-DriftGuard scale and 8.13 s better than native Kubernetes. Table 5 reports the uncertainty and adjusted tests for every contrast.
Table 4.
Descriptive means over the 60 faulted runs for each policy. Avail. denotes availability; p95, one-second 95th percentile latency; Cond. MTTR, conditional mean time to recovery; and replica-s, controller-observed excess target container count seconds. Conditional MTTR omits runs without a breach or an observed recovery.
Table 5.
Paired effects across faulted blocks. CI denotes confidence interval; CRI denotes Container Runtime Interface. Positive values favor DriftGuard-SLA, except for the CRI-derived excess count proxy, where positive values denote greater measured exposure under DriftGuard-SLA. The table retains the legacy label replica-s for continuity; it does not denote Deployment replica capacity. Raw p-values are exact two-sided workload seed sign-flip values. Holm p-values adjust across 16 primary recovery tests for the first four outcomes and four operational exposure tests for this proxy. Confidence intervals are pointwise crossed bootstrap intervals.
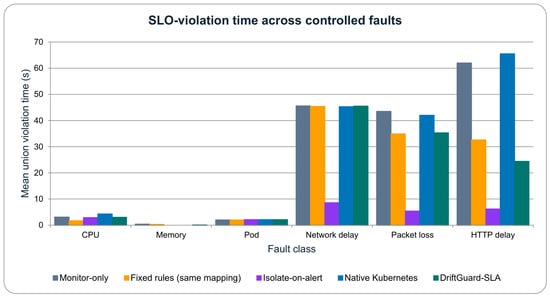
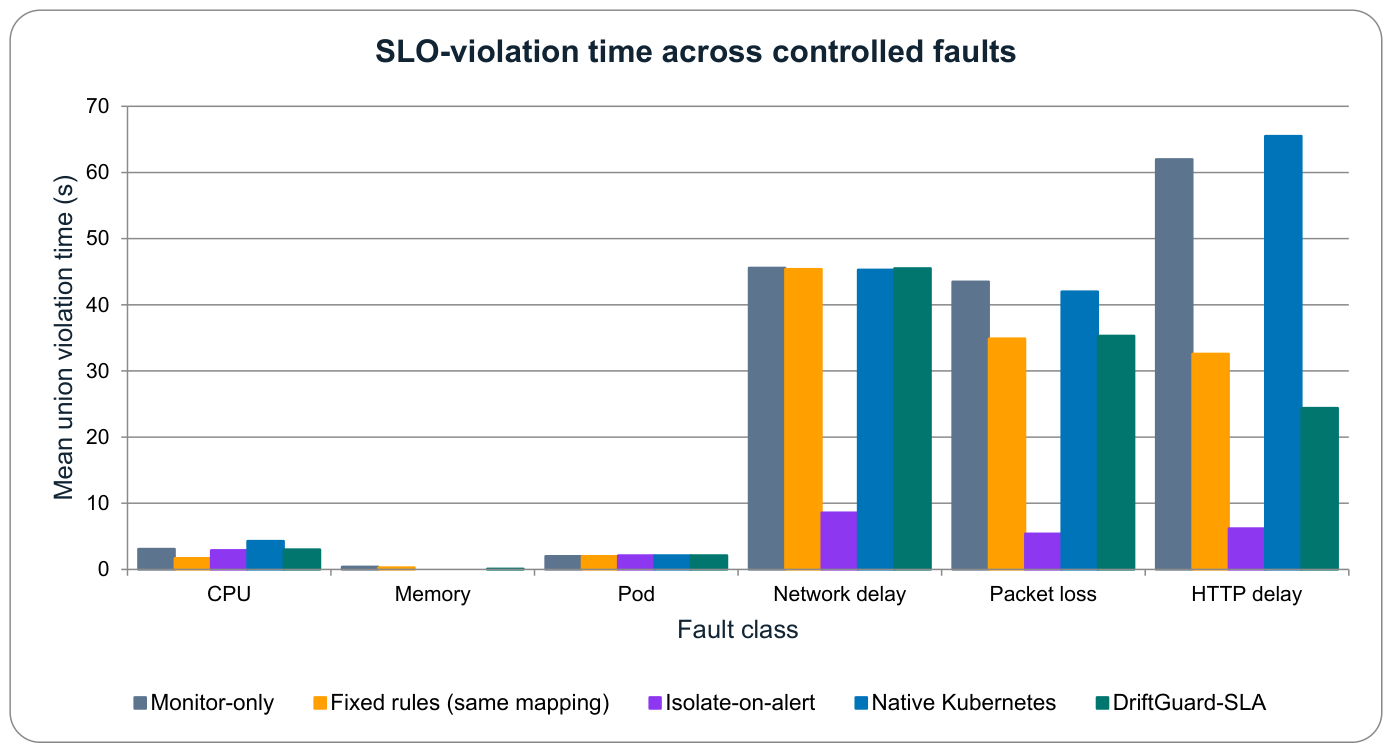
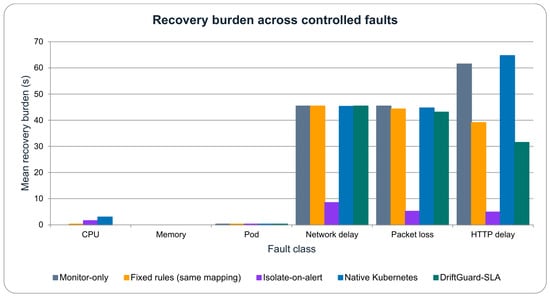
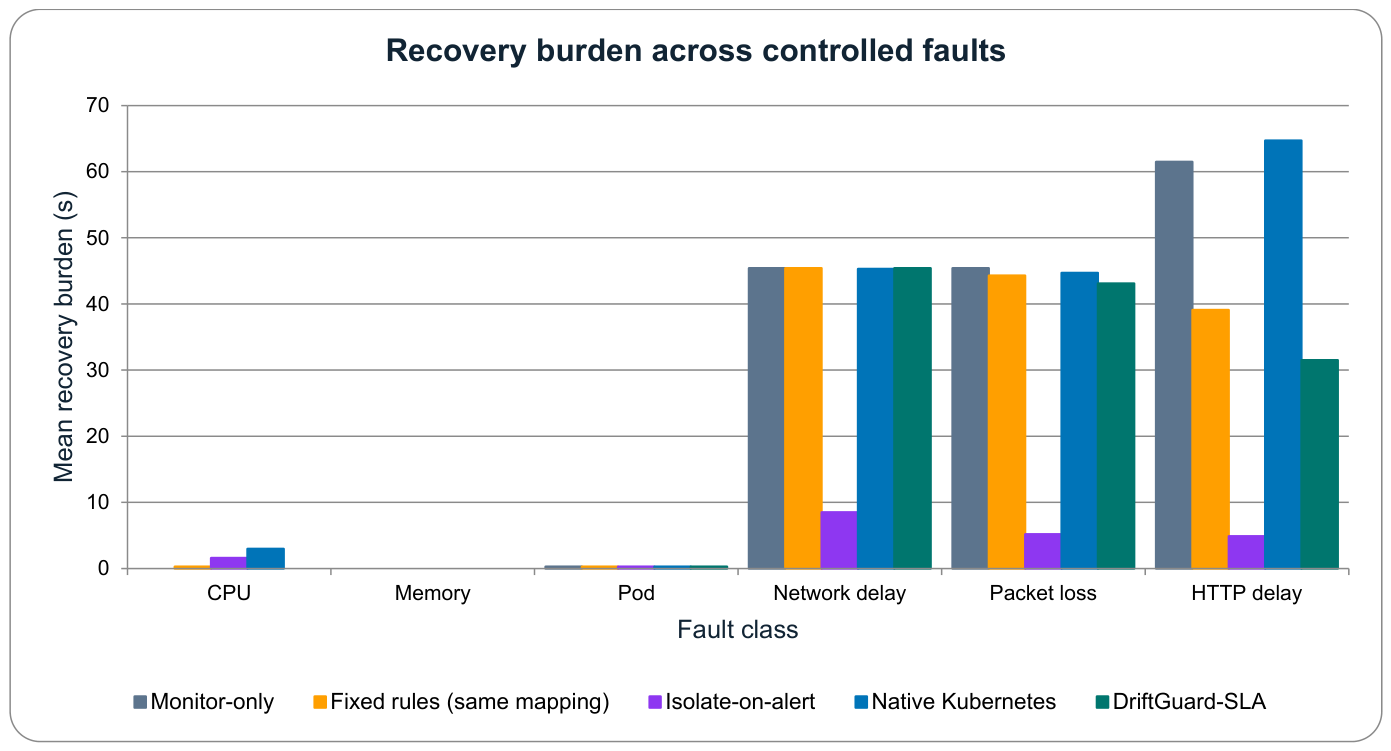
The same distinction holds for recovery burden and operational exposure. Against fixed rules, the mean recovery-burden difference was 1.52 s (pointwise 95% CI, −0.82 to 6.72), while the CRI-derived excess count proxy was 5.07 s higher under DriftGuard-SLA (−0.12 to 13.93). After removing the four blocks in which DriftGuard-SLA acted before injection, its estimated violation time advantage over monitor-only was 6.05 s (−0.07 to 16.91), but the same-mapping trigger policy estimate fell to 0.02 s (−1.21 to 1.40). The predictive trigger’s practical advantage is therefore limited in this experiment, even though the complete intervention package often outperformed non-acting baselines. Figure 4 and Figure 5 show the fault-specific violation times and recovery burdens, respectively.
Figure 4.
Mean post-injection union SLO violation time by fault class and policy. Each bar represents ten workload seeds.
Figure 5.
Mean recovery burden by fault class and policy. Avoided breaches contribute zero, whereas right-censored recoveries contribute the remaining observation time.
5.3. Trigger Timing and Action Concordance (RQ2)
The DriftGuard-SLA and fixed rule policies both acted in 34 of the 60 faulted blocks; only DriftGuard-SLA acted in 4, only fixed rules acted in 6, and neither acted in 16. Within the 34 both-action blocks, DriftGuard-SLA triggered earlier in 31 and later in 3. Its paired trigger time was a median 3.00 s earlier (interquartile range, 2.47–6.00 s earlier), and the median trigger occurred 1.00 s after injection compared with 4.00 s for fixed rules. Four pre-injection blocks account for 64 of the aggregate 65 fixed-minus-DriftGuard violation seconds, which explains why excluding them reduces the same-mapping trigger policy mean from 1.08 to 0.02 s.
Earlier triggering did not translate into a large average improvement. In the both-action blocks, fixed-minus-DriftGuard violation time averaged 1.85 s (median 0), recovery burden averaged 2.68 s lower under DriftGuard-SLA, and the CRI-derived excess count proxy was 3.74 s higher under DriftGuard-SLA. In the four DriftGuard-only blocks, the mean violation difference was 0.25 s in its favor, whereas the proxy was 52.25 s higher. These action-occurrence strata are descriptive because action occurrence is a post-treatment variable; they explain the observed pattern but do not support a causal subgroup claim.
5.4. Action Alignment, Operational Exposure, and Propagation (RQ3)
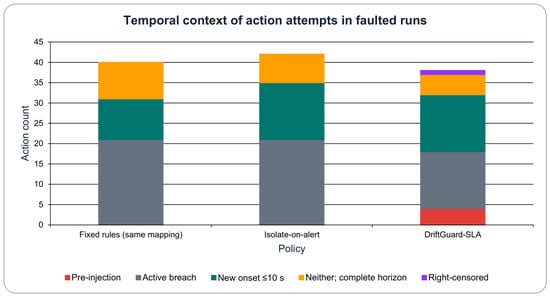
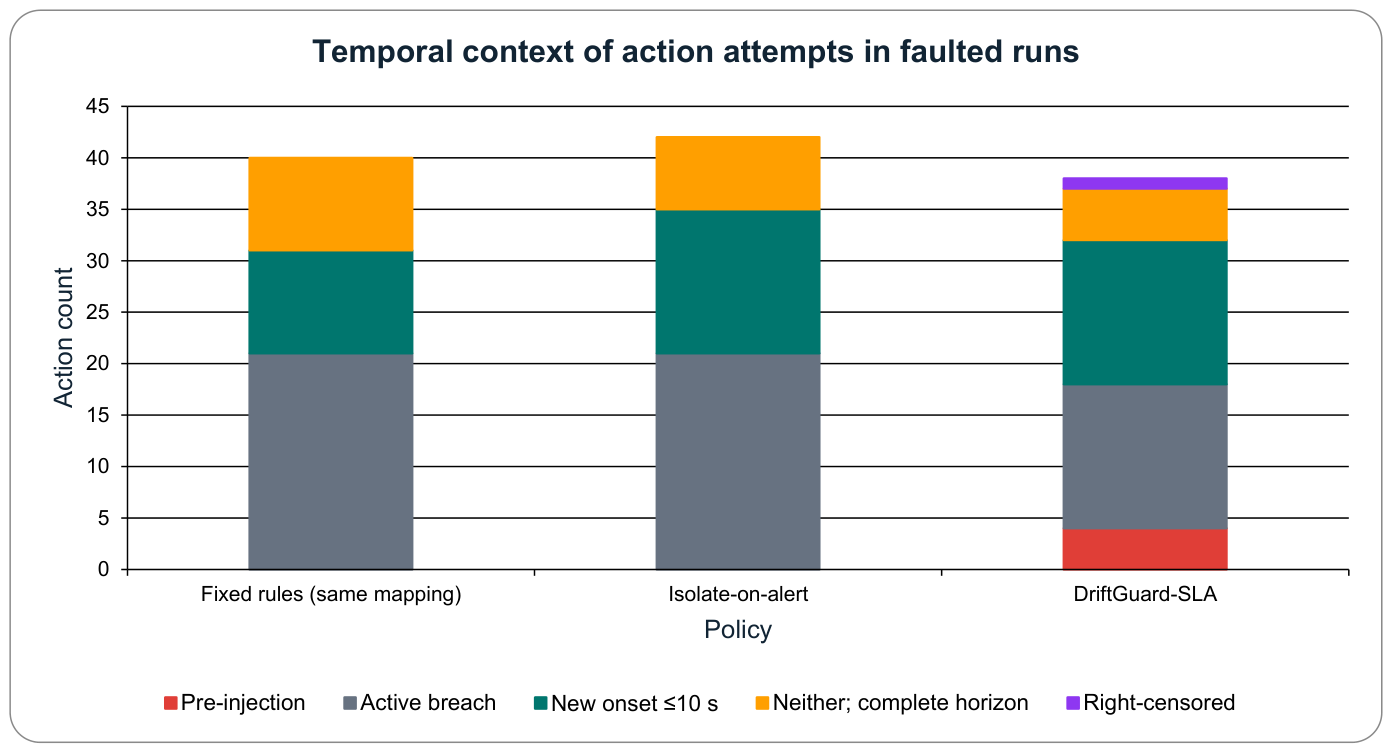
The revised audit corrects more than an overlap in the submitted counts. Among 38 faulted run DriftGuard-SLA actions, 4 preceded injection, 14 were issued while a sustained breach was already active, 14 preceded a new onset within 10 s, 5 had a complete horizon with no relation, and 1 lacked enough follow-up for classification. Together with 22 abstentions, these categories exhaust the 60 faulted runs. Training and prediction scoring excluded active episode samples, but the deployed controller had no online active episode gate and evaluated its score continuously; consequently, the 14 active breach actions are model-triggered recovery actions, not prospective warnings with positive lead. The controller recorded successful execution for all 38 DriftGuard-SLA actions (median duration 1.43 s; interquartile range, 1.15–1.91) and all 40 fixed rule actions; 40 of 42 isolate-on-alert deletion attempts succeeded. Execution success means that the requested Kubernetes operation completed, not that the service necessarily improved. Table 6 reports the mutually exclusive temporal states across policies, and Figure 6 displays their distribution in faulted runs. Table 7 links each DriftGuard-SLA category to paired service outcomes and measured operational exposure.
Table 6.
Mutually exclusive temporal states at the trigger or attempted-action timestamp. Pre-inj. denotes pre-injection and run h denotes run hour. Active means that a sustained breach was already in progress; new onset means that no breach was active and an onset followed within 10 s. Neither requires the full 10 s horizon, whereas censored does not. Attempt incidence uses the scheduled run duration; 40 of 42 isolate-on-alert deletion attempts succeeded, while all fixed rule and DriftGuard-SLA attempts succeeded.
Figure 6.
Temporal context of attempted actions in faulted runs. The five categories are mutually exclusive. The fully observed neither category is not, by itself, proof that an action was unnecessary because intervention may change the subsequent event. Two isolate-on-alert deletion attempts failed; all other attempts succeeded.
Table 7.
Descriptive consequences of mutually exclusive DriftGuard-SLA action categories in faulted runs. IQR denotes interquartile range; Δ denotes DriftGuard-SLA minus monitor-only; and replica-s denotes controller-observed excess target container count seconds. Negative violation and recovery values and positive availability values are favorable; positive replica-s denotes greater measured exposure. Categories are post-treatment descriptions and are not causal subgroups.
The categories reveal different operational profiles. The 14 actions issued during an active breach were reactive; relative to paired monitor-only runs, their mean violation time was 2.57 s lower, and their container count exposure proxy was 110.14 s higher. For the 14 actions that preceded a new onset within 10 s, the corresponding paired outcomes were 21.57 s lower violation time and 101.50 more proxy seconds. For the five fully observed neither cases, they were 0.80 s lower and 42.00 proxy seconds higher. In four matched monitor runs, the trajectory evaluated at the corresponding DriftGuard-SLA trigger time likewise had neither an active breach nor a new onset during the complete 10 s horizon; the paired differences were 0.75 s lower violation time, negligible availability change, and 26.75 more proxy seconds. These are descriptive, fault-confounded, post-treatment strata rather than causal subgroups. The four pre-injection actions—two restarts and two scale-outs—occurred 15.0–35.0 s before the scheduled anchor at risk scores between 0.962 and 0.987; their exact trigger inputs, action timestamps, later Chaos-selected instances, and matched outcomes appear in Table S3. Their outcome differences do not show anticipation of a fault that had not started. Finally, of the two no-fault actions, one had a complete neither horizon and the other was right-censored; each had two additional proxy seconds and one additional violation second relative to its matched monitor run.
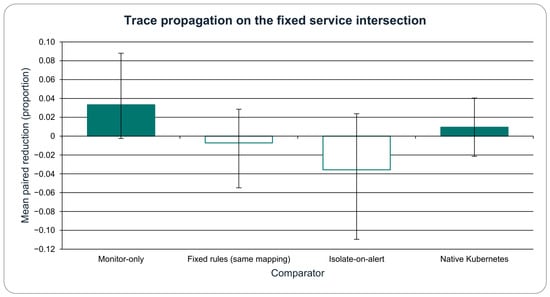
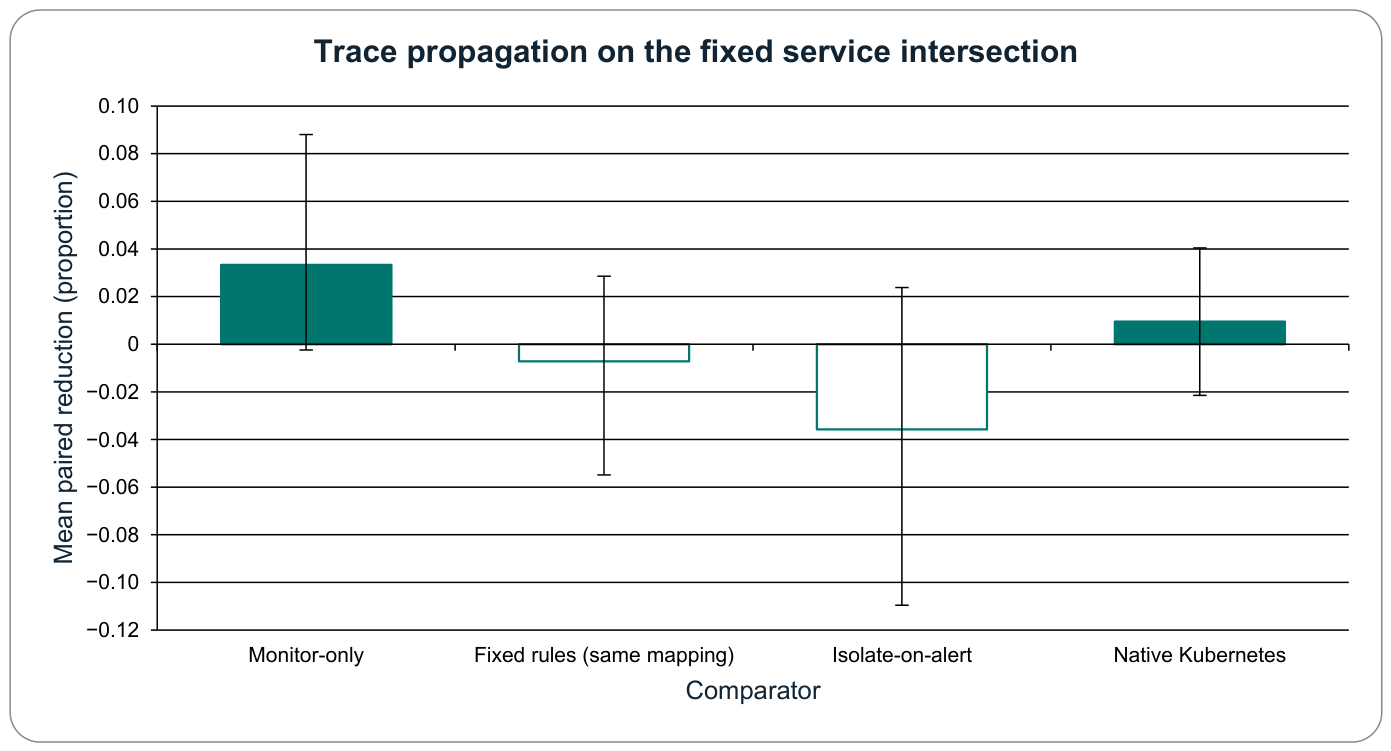
The full per-run distribution further limits the cost interpretation. Across 60 faulted runs, the proxy was nonzero in 38 DriftGuard-SLA runs (mean 59.70 s; median 96.5; range 0–139), 37 fixed rule runs (54.63; 59.5; 0–136), 12 isolate-on-alert runs (1.97; 0; 0–34), 11 native Kubernetes runs (14.35; 0; 0–105), and 4 monitor runs (3.30; 0; 0–150). In the monitor runs with nonzero values, the recorded values were 1, 1, 46, and 150 s. The 150 s case showed two matching runtime statistics records while Deployment desired and ready replicas remained one throughout, confirming that this CRI-derived quantity can include an extra retained record and must not be read as billed capacity or measured CPU, memory, energy, or monetary consumption. Tables S4 and S5 provide every run and the distributional summaries. The evaluated safeguards were the one-intervention-per-run limit and two-replica cap. Persistence checks, state-aware vetoes, canaries, explicit recovery or rollback criteria, and broader cost-aware control were not evaluated. Figure 7 presents the paired trace-propagation contrasts over the fixed service intersection.
Figure 7.
Mean paired reduction in the trace-derived propagation ratio over the fixed common-service intersection. Error bars show pointwise 95% crossed bootstrap intervals. The vertical scale spans −0.12 to 0.10 so that every interval is visible.
Seven services satisfied the fixed intersection rule, and every included service run contained at least 20 spans; the minimum observed count was 62. The supplement reports the span counts and uncertainty in the service thresholds. This outcome concerns propagation in sampled traces and is not a causal graph of influence among services. Its intervals include zero for every comparator in Table 8. Taken together with the action audit, the trace result reinforces RQ3’s main lesson: service benefit cannot be interpreted apart from trigger timing, abstention, poorly aligned actions, and measured operational exposure.
Table 8.
Effects on trace propagation over the fixed service intersection. CI denotes confidence interval. Positive values favor DriftGuard-SLA. Raw p-values are exact two-sided workload seed sign-flip values; Holm p-values adjust across the four comparator contrasts for this outcome. Confidence intervals are pointwise and unadjusted.
6. Discussion
6.1. What the Paired Design Adds
The paired design separates three questions that are often collapsed. First, does the warning model generalize to later runs? Second, does the complete prediction–action package improve service outcomes relative to non-acting or differently acting controls? Third, when the fault-specific action mapping is held constant, does the prospective trigger policy add value beyond a reactive rule? The last contrast is intention-to-treat: it includes whether an action occurs as well as when it occurs. Treating these as distinct estimands prevents prediction accuracy and recovery success from appearing as independent achievements when they are linked stages of one operational process.
This separation changes the interpretation of the headline numbers. The 7.70 s monitor-only contrast describes the complete intervention package; the 1.08 s fixed rule contrast is the more direct intention-to-treat estimate of the trigger policy’s increment and remains uncertain. Four pre-injection blocks contribute 64 of the aggregate 65 fixed-minus-DriftGuard violation seconds. Once those blocks are removed, the estimate is 0.02 s. Moreover, the 34 both-action blocks show that DriftGuard-SLA usually acted about 3 s earlier, yet the average violation reduction was only 1.85 s. The result is not evidence that prediction has no value; rather, it shows that this experiment does not establish a practically important advantage over the simpler same-mapping rule.
6.2. Safety as an Event Property
A no-fault label is an unreliable proxy for action quality because a genuine SLO episode can occur without a Chaos object. Conversely, a faulted run does not make every action appropriate. The revised audit classifies the decision at its timestamp and reports what happened next, but it avoids treating the absence of a subsequent onset as direct proof of a false action. Once the controller acts, the counterfactual event is unobserved. The matched monitor run and the measured operational exposure proxy provide useful evidence, yet they cannot make a post-action label fully causal.
Pre-injection alerts require especially cautious interpretation. Negative mean time to detection relative to injection does not mean that the model foresaw an external fault before it existed. The audit establishes only that qualifying telemetry signals occurred before the recorded injection; it does not identify their source. Jittering injection time, comparing with an elapsed time placebo, and repeating the paired analysis without these blocks reduce the risk of mistaking the experimental schedule for proactive diagnosis, but they do not establish why those four triggers occurred. A second issue appears after injection: 14 actions occurred during an already-active breach because the deployed controller, unlike the evaluation labeler, had no active episode gate. The controller may therefore act as a reactive recovery mechanism even though its model was trained on prospective onset labels. The fully observed neither cases expose a third concern—an intervention can be issued when little paired service improvement is observed.
6.3. Operational and Mechanistic Implications
The observed mechanism is containment, not guaranteed removal of the underlying fault. Mode-one Chaos Mesh objects attach to selected pods or link endpoints and do not automatically follow replacement instances. Restarting a pod or adding a replica can therefore move work to clean or unaffected capacity. That behavior may improve availability, but it does not demonstrate healing of a disturbance that persists across replacements. A production-oriented controller should be evaluated with namespace-wide or continuously re-targeted faults and with additional responses such as draining, retry control, circuit breaking, dependency-aware routing, and rollback.
The proxy does not quantify several plausible intervention costs. Scale-out may occupy schedulable CPU and memory and may contend with other services. A rolling restart can interrupt in-flight work, cool caches, reset connections, or disrupt stateful components even when replica count barely changes. The experiment bounded these risks by allowing one action per run and at most two replicas, but it did not measure cache recovery, state loss, or cross-service opportunity cost. Practical deployment would therefore require hysteresis, cooldowns, per-service action budgets, state-aware vetoes, canary execution, and explicit rollback criteria.
For researchers, the fault–seed–policy block is a reusable unit of analysis. More seeds, applications, workload regimes, fault scopes, or response actions can be added without abandoning the evidence trail. With a larger independent sample, the same structure could support hierarchical models, graph-based localization, contextual bandits, or risk-constrained remediation. Whatever the controller, a credible comparison should retain a same-mapping trigger policy baseline, vary disturbance timing, evaluate decisions at their timestamps, preserve native platform behavior, and report a clearly defined operational exposure measure together with its limitations.
6.4. Transferability and Boundary Conditions
The evaluation protocol is more transferable than the fitted controller. It can be reused in another distributed SOA when end-to-end SLOs are measurable at a stable cadence, disturbances can be repeated under matched workload seeds, and candidate interventions are bounded and observable, with explicit recovery or rollback criteria where applicable. Under those conditions, the monitor-only contrast estimates the complete intervention package, the same-mapping intention-to-treat contrast estimates the trigger policy increment, and the event audit exposes action timing and measured operational exposure. These are design principles, not claims that the present numerical effects will recur.
By contrast, the eight feature definitions, standardization values, 0.950 threshold, 10 s horizon, SLO limits, action mapping, and effect sizes require re-estimation in a new setting. A latency-sensitive ROIA or mobile-cloud service may share the need for proactive QoS control [18,19,20,21,22], but session state and access network variability alter both labels and safe actions. Multi-cloud deployment adds placement, inter-cloud latency, and failover dependencies [23], while an SDN-controlled system adds route selection as an actuator [24]. Accordingly, the findings generalize analytically to how such systems should be evaluated; they do not yet generalize empirically to their performance.
The aggregate effect was also heterogeneous across the six controlled faults. Descriptively, DriftGuard-SLA reduced violation time relative to monitor-only by 37.6 s for HTTP delay and 8.2 s for packet loss, but by only 0.1, 0.3, and 0.1 s for CPU, memory, and network delay, respectively, and was 0.1 s worse for pod faults. Relative to fixed rules, the corresponding differences were −1.3, +0.2, −0.1, −0.1, −0.4, and +8.2 s for CPU, memory, pod, network delay, packet loss, and HTTP delay. Each estimate uses ten fixed, nonrandom fault instances and no prespecified interaction test; the pattern is therefore exploratory. The largest descriptive monitor-only differences occurred for HTTP delay and packet loss, while the largest same-mapping difference occurred for HTTP delay; this is not an interaction claim.
7. Limitations
7.1. Internal and Causal Validity
Because all policies ran sequentially on one cluster, residual state cannot be ruled out. We reduced this risk with readiness checks, a one-replica reset, deletion of Chaos objects, Consul checks, start alignment, and the recorded pseudorandom policy order within each block. Fixed rules and DriftGuard-SLA share the predefined action mapping, so their paired contrast compares trigger policies while retaining differences in action occurrence and timing; isolate-on-alert and native Kubernetes compare broader policy packages. Injector semantics create a second limitation: replacement pods were not re-targeted, so part of the observed benefit may reflect escape from a localized injector. The archive retains pod identifiers and Chaos state before and after each run so this mechanism can be inspected.
7.2. Construct and Statistical Validity
The SLO joins p95 latency above 100 ms with a failed request rate above 1%. Different thresholds or prediction horizons would change the labels and may alter intervention timing. Requiring three seconds for onset and five clean seconds for recovery filters isolated spikes, but these are still design choices. The mean one-second p95 is not the request-level p95, so median and 10% trimmed mean sensitivities are also reported. Recovery burden handles avoided, observed, and right-censored breaches consistently, but it is not the same as conditional MTTR. Finally, an action without an observed onset in the next 10 s may still help outside that window or may itself avert the event; the label records temporal alignment, not counterfactual necessity.
The inferential sample is modest. Ten workload seeds are reused across six fault classes, yielding 60 faulted blocks rather than 60 fully independent observations. The crossed bootstrap and seed-level sign flip preserve that dependence, and medians accompany means. We did not calculate the run count in advance to achieve a specified statistical power. The experiment is therefore used primarily to estimate paired effects and their uncertainty; a non-significant result is not evidence of equivalence. Ten seeds improve cluster-level precision but do not support strong fault-specific generalization. Pointwise intervals are unadjusted, whereas Holm p-values apply within prespecified families.
The interval and sign-flip test need not agree because they resample different objects and the interval is not an inversion of the test. For example, the exploratory CPU-latency comparison with isolate-on-alert had five nonzero seed effects, all favorable; its crossed bootstrap interval was −4.2 to −0.4 s on the signed DriftGuard-minus-comparator scale, but the smallest attainable two-sided sign-flip p-value was 0.0625 and Holm adjustment across four comparators gave 0.2500. Conversely, the isolate-on-alert trace contrast had six nonzero seed means with the same sign (raw p = 0.03125), yet heterogeneity across fault cells widened its crossed bootstrap interval to −0.1095 to 0.0238; its four-test-family Holm value was 0.1250. Table S2 makes each family and inferential status explicit.
7.3. External and Tool Validity
The experiment uses one DeathStarBench application, one K3s application node, one external load generator, one constant offered load, six fault mechanisms, and 150 s runs. The window was designed to observe one 45 s disturbance and bounded recovery, not repeated failures, diurnal demand, long-lived controller interactions, or steady-state resource cost. A single node also cannot reveal placement, failover, and network effects found in multi-node or multi-cluster deployments. The study did not evaluate stateful failover, where responsibility moves while mutable state and in-flight operations must remain consistent, or Byzantine faults, where a component may return arbitrary or contradictory results instead of merely slowing, dropping traffic, exhausting resources, or stopping. Both settings require safeguards beyond the restart and scale-out actions tested here. A credible second benchmark study should use its own calibration data and complete paired blocks—rather than reuse these coefficients or add a few unpaired demonstration runs—and should include variable load, multi-node placement, and faults that re-target replacement instances.
Trace evidence introduces additional constraints. Sampling 5% of traces may miss uncommon paths. Requiring a fixed service intersection and at least 20 spans stabilizes the denominator but favors frequently observed services. The no-fault thresholds, moreover, are based on five monitor runs and remain uncertain despite the reported bootstrap intervals. Finally, the environment capture fixes the versions of Chaos Mesh, K3s, k6, and the containers; later versions may behave differently.
8. Conclusions
This article contributes a paired method for evaluating whether a prospective SLO breach trigger policy adds operational value when the fault-specific action mapping is held constant, together with an implemented bounded SOA controller and event-aligned measures of action timing, service effect, and operational exposure. It does not introduce the first predictive remediation concept. For RQ1, the frozen model detected 17 of 31 later breach episodes with a median 3.0 s lead time, but its sample-level MCC (0.285) was below the time-only placebo (0.334), its probability calibration was poor, and its alert burden was 10.6 episodes per run hour. The evidence therefore supports a limited warning signal at the locked operating point, not broad predictive superiority. All three research question answers are limited to the single-node DeathStarBench Hotel Reservation/K3s configuration and the frozen workload and fault protocol evaluated here.
For RQ2, DriftGuard-SLA reduced mean violation time by 7.70 s relative to monitor-only operation, which measures the complete intervention package. The intention-to-treat comparison with fixed rules sharing the same action mapping showed only a 1.08 s reduction and remained inconclusive; after excluding four pre-injection actions, the descriptive conditional estimate was 0.02 s. Isolate-on-alert produced shorter violation times than DriftGuard-SLA, while the predictive policy had a larger CRI-derived excess count exposure than the custom-action comparators. The experiment therefore does not establish that the predictive trigger policy is superior to simpler reactive control.
For RQ3, action timing and measured operational exposure materially changed the interpretation. Four of 38 faulted run actions preceded injection, 14 occurred during an already-active breach, 14 preceded a new onset within 10 s, 5 had a complete horizon with neither relation, and 1 was right-censored. Relative to paired monitor-only runs, the active breach group had 2.57 s lower mean violation time and 110.14 more CRI-derived excess count seconds, while the fully observed neither group had 0.80 s lower violation time and 42.00 more. Because these are post-treatment categories, they describe operational trade-offs rather than causal action effects, and the proxy is not direct resource consumption. These findings make the evaluation method—not a general superiority claim—the principal contribution. The next evidence should come from an independently calibrated second SOA benchmark, variable demand, multi-node and multi-cloud placement, persistent re-targeted faults, state-aware safeguards, and decision policies that balance expected recovery benefit against intervention risk and cost.
Supplementary Materials
The following supporting information can be downloaded at: https://www.mdpi.com/article/10.3390/computation14100229/s1, Supplementary Material.zip contains the experimental protocol, controller and fault manifests, frozen model, accepted-run registers, prediction scores, analysis code, source values for tables and figures, and integrity manifests. The Supplementary Tables folder contains Table S1: Dashboard Length Sensitivity; Table S2: Complete Inference Ledger; Table S3: Pre-Injection Action Ledger; Table S4: CRI Exposure by Run; and Table S5: CRI Exposure Distribution. The Reproducibility Record folder preserves the original experimental files, executable analyses, and historical filenames; the package guide provides the numbering crosswalk. The complete retained raw archive and portable verification instructions and scripts are also included. CRI exposure is an excess-record-count proxy derived from Container Runtime Interface statistics. The verification guide identifies the current analyses and historical files retained for provenance.
Author Contributions
Conceptualization, A.J.A.; methodology, A.J.A. and A.G.; software, A.J.A.; validation, A.J.A., A.G. and B.K.A.; formal analysis, A.J.A.; investigation, A.J.A.; resources, A.J.A.; data curation, A.J.A.; writing—original draft preparation, A.J.A.; writing—review and editing, A.J.A., A.G. and B.K.A.; visualization, A.J.A.; supervision, A.G. and B.K.A.; project administration, A.J.A. All authors have read and agreed to the published version of the manuscript.
Funding
This research received no external funding.
Data Availability Statement
The data and supporting code for checking the reported results are provided in Supplementary Material.zip, including the separately hashed complete raw archive of one-second dashboards and sampled traces. The package includes a data inventory, integrity checks, and instructions for recalculation. A public repository DOI has not yet been assigned; no public repository deposit is claimed in this revision.
Acknowledgments
The authors acknowledge the research environment provided by King Saud University and the open-source communities supporting DeathStarBench, K3s, Chaos Mesh, Jaeger, and k6. OpenAI Codex (OpenAI) was used as an assistive tool under researcher supervision for code development and statistical analysis, literature and citation checks, language editing, and preparation of editable tables, figures, and supporting files. The authors retain full responsibility for the scientific content and final manuscript.
Conflicts of Interest
The authors declare no conflicts of interest.
Abbreviations
| AIOps | Artificial intelligence for information technology operations |
| AP | Average precision; tie-aware stepwise summary of the precision–recall curve |
| AWS | Amazon Web Services |
| CI | Confidence interval |
| CPU | Central processing unit |
| CRI | Container Runtime Interface |
| FPR | False positive rate |
| GiB | Gibibyte |
| GPU | Graphics processing unit |
| HPA | Horizontal Pod Autoscaler |
| HTTP | Hypertext Transfer Protocol |
| IQR | Interquartile range |
| MAPE-K | Monitor–Analyze–Plan–Execute over a shared Knowledge base |
| MCC | Matthews correlation coefficient |
| MiB | Mebibyte |
| MTTR | Mean time to recovery |
| p95 | 95th percentile latency calculated within a one-second bin |
| QoS | Quality of service |
| replica-s | Controller-observed excess target container count seconds; an operational proxy |
| ROC-AUC | Area under the receiver-operating-characteristic curve |
| ROIA | Real-time online interactive application |
| SDN | Software-defined networking |
| SHA-256 | Secure Hash Algorithm 256-bit |
| SLA | Service-level agreement |
| SLO | Service-level objective |
| SOA | Service-oriented architecture |
References
- Niknejad, N.; Ismail, W.B.; Ghani, I.; Nazari, B.; Bahari, M.; Hussin, A.R.B.C. Understanding service-oriented architecture (SOA): A systematic literature review and directions for further investigation. Inf. Syst. 2020, 91, 101491. [Google Scholar] [CrossRef] [Scilit]
- Avizienis, A.; Laprie, J.-C.; Randell, B.; Landwehr, C. Basic concepts and taxonomy of dependable and secure computing. IEEE Trans. Dependable Secur. Comput. 2004, 1, 11–33. [Google Scholar] [CrossRef] [Scilit]
- Kephart, J.O.; Chess, D.M. The vision of autonomic computing. Computer 2003, 36, 41–50. [Google Scholar] [CrossRef] [Scilit]
- Garlan, D.; Cheng, S.-W.; Huang, A.-C.; Schmerl, B.; Steenkiste, P. Rainbow: Architecture-based self-adaptation with reusable infrastructure. Computer 2004, 37, 46–54. [Google Scholar] [CrossRef] [Scilit]
- Gan, Y.; Zhang, Y.; Hu, K.; Cheng, D.; He, Y.; Pancholi, M.; Delimitrou, C. Seer: Leveraging big data to navigate the complexity of performance debugging in cloud microservices. In Proceedings of the Twenty-Fourth International Conference on Architectural Support for Programming Languages and Operating Systems (ASPLOS); Association for Computing Machinery: New York, NY, USA, 2019; pp. 19–33. [Google Scholar] [CrossRef] [Scilit]
- Qiu, H.; Banerjee, S.S.; Jha, S.; Kalbarczyk, Z.T.; Iyer, R.K. FIRM: An intelligent fine-grained resource management framework for SLO-oriented microservices. In Proceedings of the 14th USENIX Symposium on Operating Systems Design and Implementation (OSDI), Virtual, 4–6 November 2020; pp. 805–825. Available online: https://www.usenix.org/conference/osdi20/presentation/qiu (accessed on 7 September 2026).
- Gan, Y.; Liang, M.; Dev, S.; Lo, D.; Delimitrou, C. Sage: Practical and scalable ML-driven performance debugging in microservices. In Proceedings of the 26th ACM International Conference on Architectural Support for Programming Languages and Operating Systems (ASPLOS); Association for Computing Machinery: New York, NY, USA, 2021; pp. 135–151. [Google Scholar] [CrossRef] [Scilit]
- Zhang, Y.; Hua, W.; Zhou, Z.; Suh, G.E.; Delimitrou, C. Sinan: ML-based and QoS-aware resource management for cloud microservices. In Proceedings of the 26th ACM International Conference on Architectural Support for Programming Languages and Operating Systems (ASPLOS); Association for Computing Machinery: New York, NY, USA, 2021; pp. 167–181. [Google Scholar] [CrossRef] [Scilit]
- Levy, S.; Yao, R.; Wu, Y.; Dang, Y.; Huang, P.; Mu, Z.; Zhao, P.; Ramani, T.; Govindaraju, N.K.; Li, X.; et al. Predictive and adaptive failure mitigation to avert production cloud VM interruptions. In Proceedings of the 14th USENIX Symposium on Operating Systems Design and Implementation (OSDI), Virtual, 4–6 November 2020; pp. 1155–1170. Available online: https://www.usenix.org/conference/osdi20/presentation/levy (accessed on 7 September 2026).
- Shi, J.; Zhang, H.; Tong, Z.; Chen, Q.; Fu, K.; Guo, M. Nodens: Enabling resource efficient and fast QoS recovery of dynamic microservice applications in datacenters. In Proceedings of the 2023 USENIX Annual Technical Conference (USENIX ATC), Boston, MA, USA, 10–12 July 2023; pp. 403–417. Available online: https://www.usenix.org/conference/atc23/presentation/shi (accessed on 7 September 2026).
- Denaro, G.; El Moussa, N.; Heydarov, R.; Lomio, F.; Pezzè, M.; Qiu, K. Predicting failures of autoscaling distributed applications. Proc. ACM Softw. Eng. 2024, 1, 1960–1981. [Google Scholar] [CrossRef] [Scilit]
- Rouf, R.; Rasolroveicy, M.; Litoiu, M.; Nagar, S.; Mohapatra, P.; Gupta, P.; Watts, I. InstantOps: A joint approach to system failure prediction and root cause identification in microservices cloud-native applications. In Proceedings of the 15th ACM/SPEC International Conference on Performance Engineering (ICPE); Association for Computing Machinery: New York, NY, USA, 2024; pp. 119–129. [Google Scholar] [CrossRef] [Scilit]
- Nunes, J.P.K.S.; Nejati, S.; Sabetzadeh, M.; Nakagawa, E.Y. Self-adaptive, requirements-driven autoscaling of microservices. In Proceedings of the 19th International Symposium on Software Engineering for Adaptive and Self-Managing Systems (SEAMS); Association for Computing Machinery: New York, NY, USA, 2024; pp. 168–174. [Google Scholar] [CrossRef] [Scilit]
- Wu, L.; Tordsson, J.; Elmroth, E.; Kao, O. MicroRCA: Root cause localization of performance issues in microservices. In NOMS 2020—IEEE/IFIP Network Operations and Management Symposium; IEEE: Piscataway, NJ, USA, 2020; pp. 1–9. [Google Scholar] [CrossRef] [Scilit]
- Zhang, L.; Zhai, Y.; Jia, T.; He, M.; Duan, C.; Liu, Z.; Ding, B.; Li, Y. E2E-REME: Towards end-to-end microservices auto-remediation via experience-simulation reinforcement fine-tuning. In Proceedings of the 34th ACM International Conference on the Foundations of Software Engineering (FSE Companion ’26), Montreal, QC, Canada, 5–9 July 2026; Association for Computing Machinery: New York, NY, USA, 2026; pp. 322–333. [Google Scholar] [CrossRef] [Scilit]
- Dai, C.; Yan, Z.; Lei, C.; Li, Q.; Zhang, L. Safe remediation as risk-constrained intervention decision in microservice systems. arXiv 2026, arXiv:2607.20005. [Google Scholar] [CrossRef] [Scilit]
- Yu, M.; Liu, H.; Du, J.; Lin, K.; Dai, T.; Fu, Y.; Yang, C. From distributed tracing to proactive SLO management: A mini-review of trace-driven performance prediction for cloud-native microservices. Front. Comput. Sci. 2026, 8, 1783945. [Google Scholar] [CrossRef] [Scilit]
- Meiländer, D.; Ploss, A.; Glinka, F.; Gorlatch, S. A dynamic resource management system for real-time online applications on clouds. In Euro-Par 2011: Parallel Processing Workshops, LNCS 7155; Springer: Berlin/Heidelberg, Germany, 2012; pp. 149–158. [Google Scholar] [CrossRef] [Scilit]
- Meiländer, D.; Gorlatch, S. Modeling the scalability of real-time online interactive applications on clouds. Future Gener. Comput. Syst. 2018, 86, 1019–1031. [Google Scholar] [CrossRef] [Scilit]
- Nae, V.; Iosup, A.; Prodan, R. Dynamic resource provisioning in massively multiplayer online games. IEEE Trans. Parallel Distrib. Syst. 2011, 22, 380–395. [Google Scholar] [CrossRef] [Scilit]
- Meiländer, D.; Glinka, F.; Gorlatch, S.; Lin, L.; Zhang, W.; Liao, X. Bringing mobile online games to clouds. In Proceedings of the IEEE Conference on Computer Communications Workshops (INFOCOM WKSHPS); IEEE: Piscataway, NJ, USA, 2014; pp. 340–345. [Google Scholar] [CrossRef] [Scilit]
- Jarrous-Holtrup, S.; Schamel, F.; Hofer, K.; Gorlatch, S. A scalable cloud deployment architecture for high-performance real-time online applications. In High Performance Computing: ISC High Performance Digital 2021 Workshops, LNCS 12761; Springer: Berlin/Heidelberg, Germany, 2021; pp. 395–405. [Google Scholar] [CrossRef] [Scilit]
- Jarrous-Holtrup, S.; Gorlatch, S.; Dey, M.; Schamel, F. Multi-cloud container orchestration for high-performance real-time online applications. In Proceedings of the 31st Euromicro International Conference on Parallel, Distributed and Network-Based Processing (PDP); IEEE: Piscataway, NJ, USA, 2023; pp. 307–313. [Google Scholar] [CrossRef] [Scilit]
- Gorlatch, S.; Humernbrum, T.; Glinka, F. Improving QoS in real-time internet applications: From best-effort to software-defined networks. In Proceedings of the International Conference on Computing, Networking and Communications (ICNC); IEEE: Piscataway, NJ, USA, 2014; pp. 189–193. [Google Scholar] [CrossRef] [Scilit]
- Tomak, J.; Gorlatch, S. Measuring performance of fault management in a legacy system: An alarm system study. In Modelling, Analysis, and Simulation of Computer and Telecommunication Systems—MASCOTS 2020, LNCS 12527; Springer: Berlin/Heidelberg, Germany, 2021; pp. 129–146. [Google Scholar] [CrossRef] [Scilit]
- Malik, S.; Naqvi, M.A.; Moonen, L. CHESS: A framework for evaluation of self-adaptive systems based on chaos engineering. In Proceedings of the 2023 IEEE/ACM 18th Symposium on Software Engineering for Adaptive and Self-Managing Systems (SEAMS); IEEE: Piscataway, NJ, USA, 2023; pp. 195–201. [Google Scholar] [CrossRef] [Scilit]
- Gan, Y.; Zhang, Y.; Cheng, D.; Shetty, A.; Rathi, P.; Katarki, N.; Bruno, A.; Hu, J.; Ritchken, B.; Jackson, B.; et al. An open-source benchmark suite for microservices and their hardware-software implications for cloud and edge systems. In Proceedings of the 24th International Conference on Architectural Support for Programming Languages and Operating Systems (ASPLOS); Association for Computing Machinery: New York, NY, USA, 2019; pp. 3–18. [Google Scholar] [CrossRef] [Scilit]
- Hevner, A.R.; March, S.T.; Park, J.; Ram, S. Design science in information systems research. MIS Q. 2004, 28, 75–105. [Google Scholar] [CrossRef] [Scilit]
- K3s Project Authors. “K3s Documentation,” 2026. Available online: https://docs.k3s.io/ (accessed on 5 August 2026).
- Chaos Mesh Authors. “Chaos Mesh Documentation, Version 2.8.3,” 2026. Available online: https://chaos-mesh.org/docs/ (accessed on 5 August 2026).
- Jaeger Authors. “Jaeger Documentation,” 2026. Available online: https://www.jaegertracing.io/docs/ (accessed on 7 September 2026).
- Grafana Labs. “k6 Documentation,” 2026. Available online: https://grafana.com/docs/k6/ (accessed on 5 August 2026).
- Kubernetes Authors. “Horizontal Pod Autoscaling,” 2026. Available online: https://kubernetes.io/docs/tasks/run-application/horizontal-pod-autoscale/ (accessed on 5 August 2026).
- Chicco, D.; Jurman, G. The advantages of the Matthews correlation coefficient over F1 score and accuracy in binary classification evaluation. BMC Genom. 2020, 21, 6. [Google Scholar] [CrossRef] [Scilit] [PubMed]
- Brier, G.W. Verification of Forecasts Expressed in Terms of Probability. Mon. Weather Rev. 1950, 78, 1–3. [Google Scholar] [CrossRef] [Scilit]
- Pedregosa, F.; Varoquaux, G.; Gramfort, A.; Michel, V.; Thirion, B.; Grisel, O.; Blondel, M.; Prettenhofer, P.; Weiss, R.; Dubourg, V.; et al. Scikit-learn: Machine learning in Python. J. Mach. Learn. Res. 2011, 12, 2825–2830. [Google Scholar]
- Sigelman, B.H.; Barroso, L.A.; Burrows, M.; Stephenson, P.; Plakal, M.; Beaver, D.; Jaspan, S.; Shanbhag, C. Dapper, a Large-Scale Distributed Systems Tracing Infrastructure; Technical Report dapper-2010-1; Google: Mountain View, CA, USA, 2010. [Google Scholar]
- Holm, S. A simple sequentially rejective multiple test procedure. Scand. J. Stat. 1979, 6, 65–70. [Google Scholar]
- Efron, B.; Tibshirani, R.J. An Introduction to the Bootstrap; Chapman & Hall/CRC: New York, NY, USA, 1993. [Google Scholar] [CrossRef] [Scilit]
- Wilcoxon, F. Individual comparisons by ranking methods. Biom. Bull. 1945, 1, 80–83. [Google Scholar] [CrossRef] [Scilit]

Disclaimer/Publisher’s Note: The statements, opinions and data contained in all publications are solely those of the individual author(s) and contributor(s) and not of MDPI and/or the editor(s). MDPI and/or the editor(s) disclaim responsibility for any injury to people or property resulting from any ideas, methods, instructions or products referred to in the content. |
© 2026 by the authors. Licensee MDPI, Basel, Switzerland. This article is an open access article distributed under the terms and conditions of the Creative Commons Attribution (CC BY) license.