


Abstract
Decompression of dense and supercritical CO2 containing impurities was investigated using an equilibrium isentropic model coupled with NIST REFPROP 10 and GERG-2008. The pressure plateau was determined from the intersection of the isentropic path and the bubble line. The adopted numerical settings, ΔP = 0.5 kPa and 500 pressure points, changed the plateau pressure by less than 1%. Validation included 18 binary phase-equilibrium points, seven shock-tube cases, and four large-scale tests. The mean absolute relative deviations were 1.25%, 4.54% and 1.75%, respectively. For the shock-tube cases, the deviation range was −10.14% to 8.19%; six cases had R2 ≥ 0.95 and RMSE ≤ 0.53 MPa, whereas the H2-containing case gave RMSE = 1.42 MPa. At 15 MPa and 40 °C, 3 mol% of CH4, Ar, N2, O2, CO or H2 increased the bubble pressure at 20 °C by 0.76–2.06 MPa relative to pure CO2, following the order H2 > CO > O2 > N2 > Ar > CH4. The plateau pressure increased with impurity concentration and initial temperature, whereas initial pressure mainly shifted the isentropic path. These results provide a basis for impurity screening and fracture-control assessment in CO2 pipelines.
1. Introduction
Carbon capture and storage is an important strategy for reducing industrial CO2 emissions, and pipelines are the most practical means of transporting CO2 at a large scale [1,2]. To improve transport efficiency, CO2 is commonly conveyed in dense or supercritical conditions. Pipeline rupture under these conditions causes rapid depressurization and phase transition, producing behavior that differs substantially from natural-gas decompression [3].
A decompression wave propagates from the rupture, and its speed depends on the local sound speed and induced flow velocity. In the Battelle two-curve method, the decompression wave speed curve is compared with the crack-resistance curve to assess running-ductile-fracture arrest [4]. For dense-phase CO2, the pressure plateau formed during phase transition directly affects the crack-driving force [5].
Experimental studies have provided important benchmark data for CO2 decompression. Botros et al. measured decompression wave speeds for pure CO2 and CO2-rich mixtures containing N2, O2, CH4, H2, CO and Ar using a high-pressure shock tube with a nominal pipe size of 2 in [6,7,8,9,10,11]. Full-scale programs, including COOLTRANS, COSHER and CO2SAFE-ARREST, further investigated fracture propagation and dense-phase CO2 release under realistic pipeline conditions [12,13,14,15,16]. Recent large-scale tests have also examined the effects of impurity composition on decompression behavior [17,18,19]. These studies show that CO2 decompression is sensitive to mixture composition, initial state and pipe geometry.
Computational models have also been developed. Elshahomi et al. [20] reproduced shock-tube measurements using computational fluid dynamics and GERG-2008, but considered only a limited number of compositions. Dall’Acqua et al. [21] proposed an efficient Peng–Robinson-based tool, although GERG-2008 generally provides more accurate phase-equilibrium predictions for CO2-rich mixtures. Gu et al. [22] and Liao et al. [23] improved the treatment of phase change and critical-flow behavior, but did not separately quantify the effects of impurity species, impurity concentration, initial pressure and initial temperature within one validated equilibrium framework.
Accordingly, this study has three objectives: (i) to establish a unified equilibrium-isentropic model coupled with REFPROP 10 and GERG-2008 and validate it against shock-tube and large-scale data; (ii) to determine the pressure plateau from the bubble-line intersection, thereby reducing pressure-grid dependence; and (iii) to quantify separately the effects of impurity species, impurity concentration, initial pressure and initial temperature on decompression behavior and fracture-control implications.
2. Methodology
2.1. Thermodynamic Description of Decompression
The decompression of dense-phase CO2 and CO2-rich mixtures was described using an equilibrium isentropic framework. After the initial entropy s0 was obtained from the operating condition, the temperature and density at each pressure were determined by satisfying Equation (1). This assumption implies thermal and mechanical equilibrium between phases and is suitable for comparing the thermodynamic effects of impurity type and concentration.
where s, P, T, and z denote entropy, pressure, temperature, and mixture composition, respectively.
For each state along the decompression path, the decompression wave speed W(P) was evaluated from
where a(P) is the equilibrium sound speed and u(P) is the flow velocity induced behind the decompression front.
2.2. Construction of Isentropic Path
The decompression path was generated on a monotonically decreasing pressure grid from P0 to Pmin (0.1 MPa), with 500 pressure points used for numerical integration. At each pressure Pi, a pressure–entropy flash was performed to obtain Ti, ρi and Qi, as shown in Equation (3).
where Ti, ρi, and Qi are the equilibrium temperature, density, and vapor quality, respectively.
The flash is the built-in pressure-entropy routine of REFPROP (PSFLSH), called through the MATLAB R2023 wrapper, so that no custom iteration over temperature is involved. The vapor quality was used only to indicate the phase state. Thermodynamic properties were evaluated with NIST REFPROP: pure CO2 was calculated using the Span–Wagner EOS, and CO2-rich mixtures using GERG-2008.
The choice of GERG-2008 was based on its coverage of all six impurities considered and its implementation within the same property database as the pure-CO2 model. Published comparisons using the same shock-tube data show that GERG-2008 generally predicts a higher bubble line and a more conservative plateau pressure than Peng–Robinson [21,24]. EOS-CG is applicable to several CO2-related mixtures but does not include H2 and CH4 in its original formulation [25]; EOS-CG-2021 would be a suitable alternative for a complete comparison but requires a separate property-library implementation and validation [26].
The uncertainties declared for GERG-2008 depend on property type rather than the binary pair. They are approximately 0.1% for gas-phase density, below 0.1% for gas-phase sound speed within the main validity range, 0.1–0.5% for liquid density, and 1–3% for vapor pressure, increasing to 5% or more for some systems. No pair-specific uncertainty is provided, and systems involving H2 or He have a weaker experimental basis [27].
2.3. Equilibrium Sound Speed
The sound speed used in this study is the equilibrium, Wood-type sound speed, evaluated under the assumption of instantaneous phase equilibrium. The frozen sound speed is outside the scope of the present equilibrium model.
For single-phase states, the sound speed was directly evaluated from REFPROP. However, in the two-phase region, the direct sound-speed output is not available or is not suitable for the present equilibrium-wave calculation. Therefore, the two-phase sound speed a was calculated numerically from density changes along the same isentrope:
For a pressure point Pi, two neighboring pressures Pi + ΔP and Pi − ΔP were considered, while keeping entropy fixed at s0. The corresponding densities ρup and ρdn were obtained as
The local sound speed ai was then calculated as
A pressure perturbation of 0.5 kPa was adopted. If the perturbation calculation failed at an individual point, a finite-difference estimate based on neighboring valid states was used.
2.4. Flow Velocity and Decompression Wave Speed
The flow velocity behind the decompression wave was calculated by integrating the momentum relation along the isentropic path. Since the pressure grid decreases from P0 to lower pressures, the velocity u at pressure P was evaluated as
with u(P0) = 0. The integral was computed using the cumulative trapezoidal rule. The decompression wave speed was subsequently obtained from W(P) = a(P) − u(P). Thus, at the initial state, the decompression wave speed equals the initial sound speed because the induced flow velocity is zero.
2.5. Determination of Plateau Pressure
The plateau pressure was determined from the intersection of the isentropic path and the bubble line. The saturation temperature Tsat was obtained by solving
after which the plateau pressure Pplateau was calculated from the corresponding bubble-point pressure Pbubble.
This procedure avoids selecting the first two-phase grid point and reduces sensitivity to pressure-grid resolution. The root search was performed over a bounded temperature interval, with an extended upper bound used when necessary. If no valid sign change was found, the plateau was reported as undefined.
For H2-containing mixtures, pressure–entropy flash results showing an increase in temperature during pressure reduction were rejected because such behavior is inconsistent with physical decompression. The adjacent sound speed was obtained using the fallback finite-difference procedure. This filter affects only path construction; the plateau pressure is calculated independently from the bubble-line intersection.
2.6. Model Scope and Limitations
The model provides an equilibrium reference for decompression behavior. It does not resolve phase slip, delayed phase transition, friction, heat transfer or spatial pressure gradients. Therefore, the calculated wave speed and plateau pressure should not be interpreted as complete transient blowdown predictions.
For the seven shock-tube cases, the difference between calculated and measured plateau pressures was at most 10.1%; for the four large-scale cases, it was at most 2.2%. The deviations did not have a consistent sign. The calculated plateau should therefore be regarded as a thermodynamic reference rather than as a universally conservative or unconservative value. Published experiments report a non-equilibrium departure of a comparable scale: in large-scale leakage tests on CO2 with CH4 and CO impurities, the phase-transition non-equilibrium was mitigated by the impurities, and the departure of the measured plateau from the equilibrium value depended on the impurity and on the initial state; tube-depressurization experiments on CO2 + N2 and CO2 + He likewise relate the measured plateau level to the phase-change model [19].
3. Model Validation
3.1. Numerical Independence Analysis
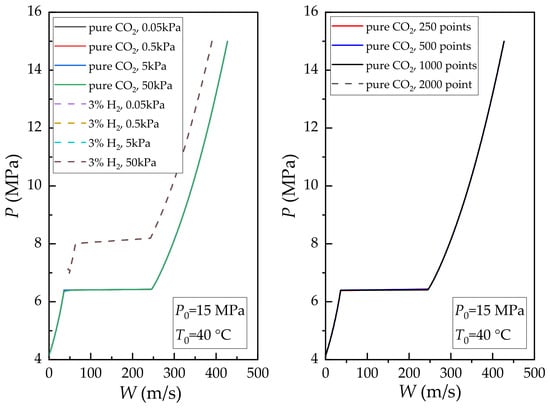
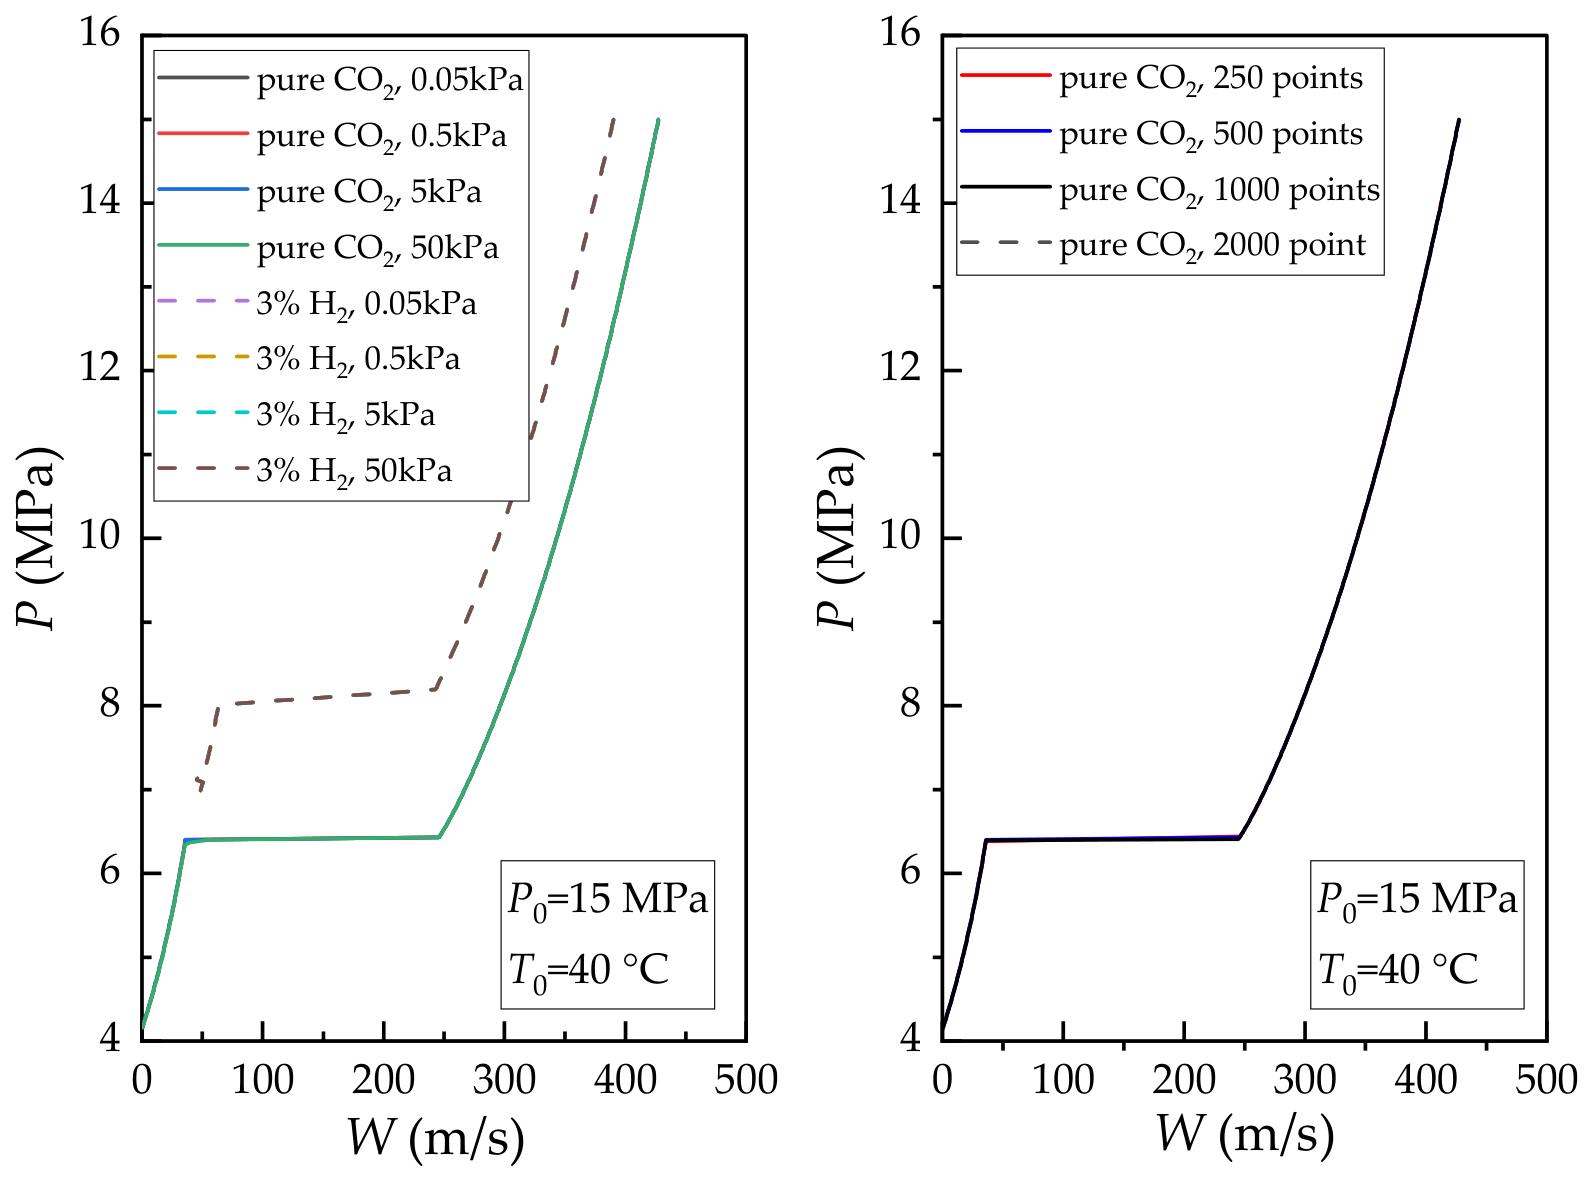
The effects of pressure perturbation and grid resolution were examined for pure CO2 and CO2 + 3 mol% H2 at 15 MPa and 40 °C, as shown in Figure 1. Perturbations of 0.05, 0.5, 5 and 50 kPa produced nearly identical pressure–wave-speed curves. The plateau pressure varied by less than 0.05 MPa, or 1%, and only the 5 kPa case showed a short deviation near the steep plateau knee. Therefore, ΔP = 0.5 kPa was adopted.
Figure 1.
Curves of pressure and decompression wave speed for pressure perturbation of 0.05, 0.5, 5, 50 kPa (left) and pressure points of 250, 500, 1000, 2000 used for numerical integration (right).
Calculations using 250, 500, 1000 and 2000 pressure points also produced nearly coincident curves. The maximum pressure difference was approximately 0.05 MPa, and the results for 500, 1000 and 2000 points were indistinguishable. Accordingly, 500 pressure points were used in all subsequent calculations.
3.2. Validation of Mixture Phase Equilibrium
The phase boundary was validated independently because the plateau pressure is determined by the bubble-line intersection. Eighteen bubble- and dew-point data points for CO2 + CO, CO2 + N2 and CO2 + O2 mixtures were compared with GERG-2008 predictions, as shown in Table 1.
Table 1.
Comparison of measured and predicted bubble- and dew-point data for CO2-rich mixtures containing CO, O2 and N2.
The overall mean absolute relative deviation was 1.25%, with a maximum of 4.07%. The dew-point deviation averaged 0.24% and reached 0.86%, whereas the bubble-point deviation averaged 2.25% and reached 4.07%. The CO2 + N2 bubble pressures agreed within 0.1%. The larger deviations for CO2 + CO and CO2 + O2 were treated as part of the uncertainty of the phase-envelope calculations.
3.3. Validation of Decompression Wave with Shock-Tube Measurements
The model was validated against seven shock-tube cases reported by Botros et al. The initial pressures ranged from 11.111 to 15.46 MPa, and the temperatures ranged from 35.09 to 36.50 °C. The validation conditions are listed in Table 2.
Table 2.
Shock-tube test conditions for validation of pure CO2 and CO2-rich mixtures from Botros et al. [7,8].
The experimental wave-speed curves were digitized from the published figures of Botros et al. [7,8] using custom Python 3.13 scripts. The source PDF pages were rasterized at 288 DPI (pypdfium2, scale factor 4.0); the plot box was located automatically from the axis/grid lines, and the red measured curves were segmented by HSV/RGB color thresholds. For each column inside the plot box the median red pixel was retained, continuity filtering removed outliers, and the resulting pixel coordinates were mapped linearly to the physical axes shown in the figures. Each curve was resampled to about 80 points evenly spaced in wave speed. From the pixel scale (approximately 0.02 MPa and 0.6 m/s per pixel) and the printed curve line width of about two pixels, the estimated digitization uncertainty is ±0.03 MPa in pressure and ±1.0 m/s in wave speed. This corresponds to a relative uncertainty of about 0.4–0.5% in the plateau pressure, well below the 4.54% mean absolute relative deviation (MARD) between prediction and measurement; the model–data differences are therefore not dominated by digitization error. The source publications do not report a pressure-resolved measurement uncertainty for the decompression wave speed, so the comparison below is interpreted as an assessment of the physical model rather than of the measurement.
For both measured and predicted curves, the plateau interval was identified using the same slope-based criterion. The averaged plateau pressure was calculated from all points within the selected wave-speed interval. Changing the slope threshold by ±50% altered the averaged plateau pressure by less than 1%.
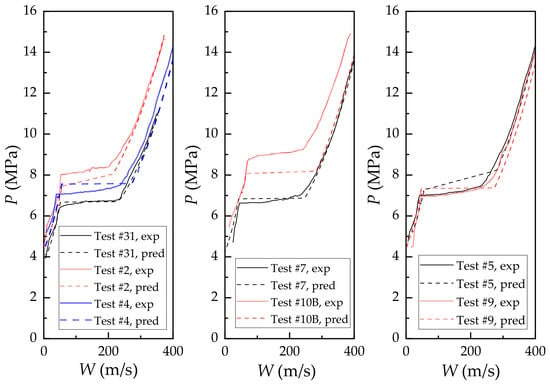
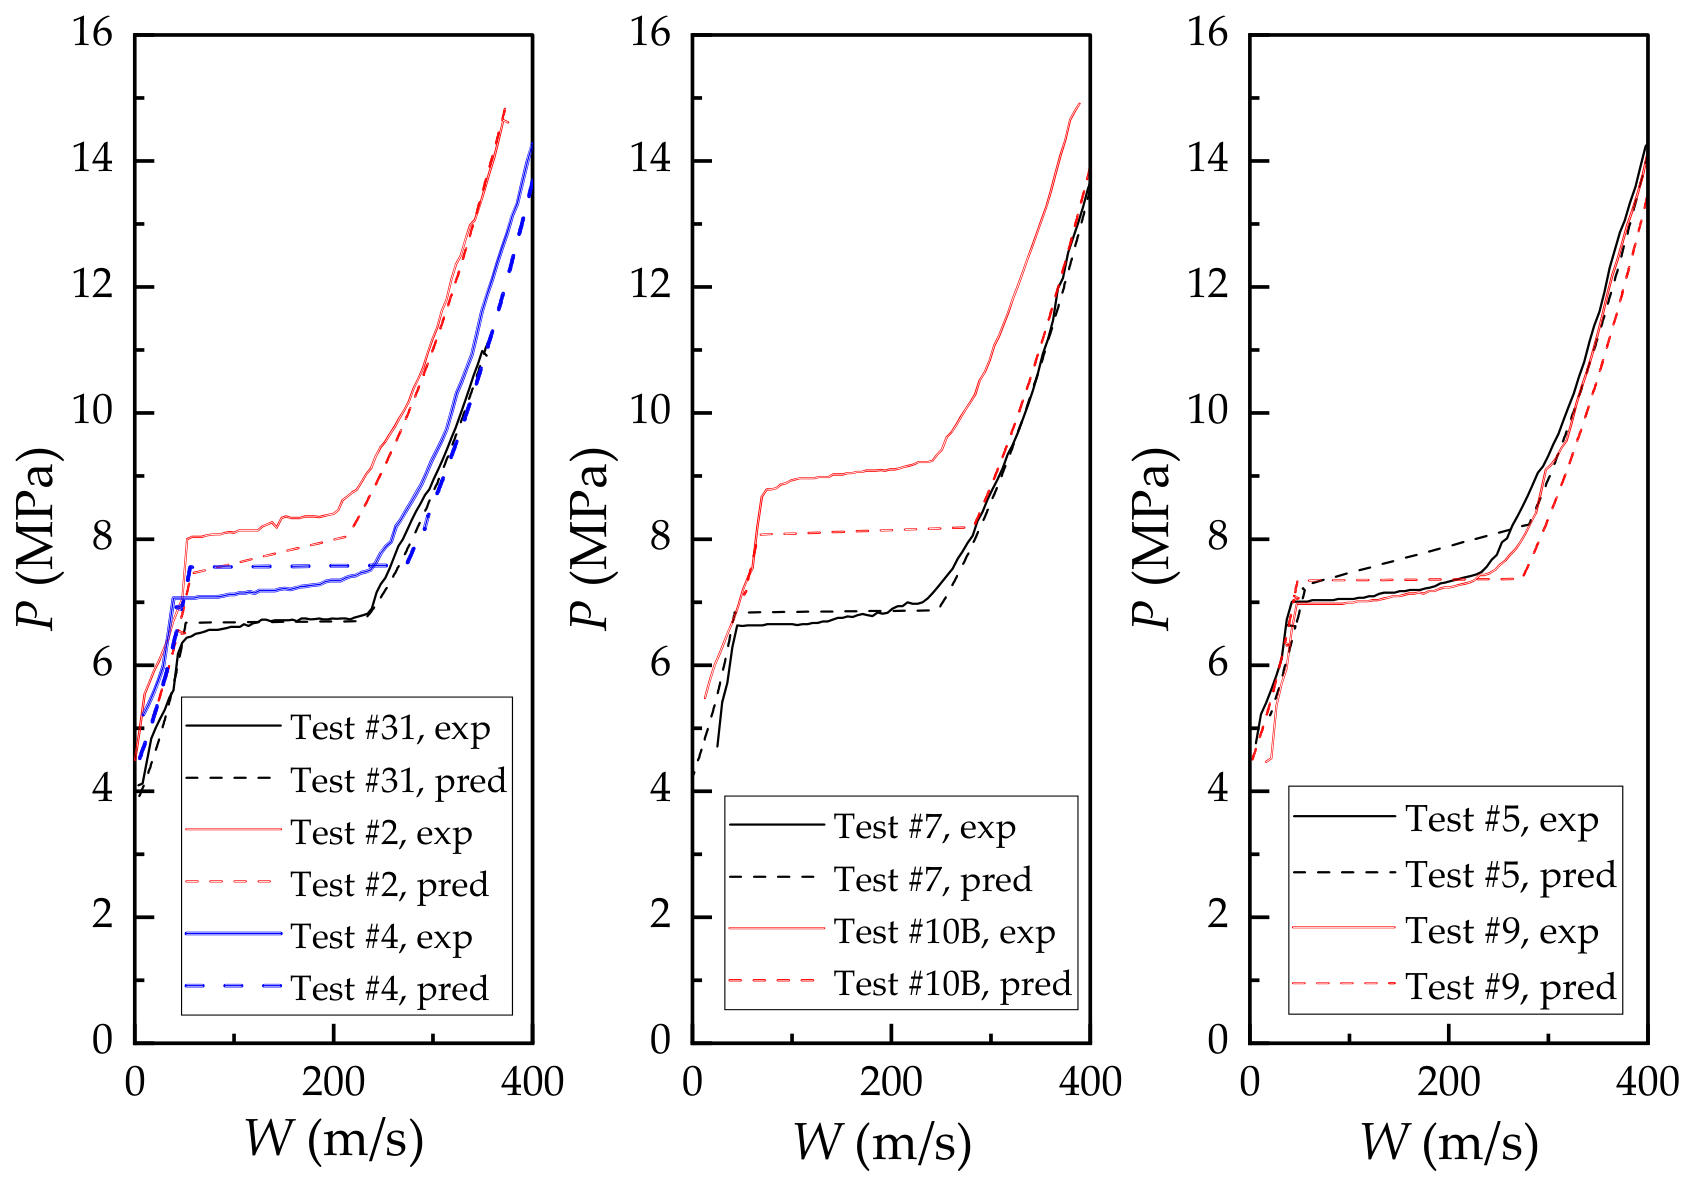
Figure 2 compares the calculated decompression wave speed curves with the experimental data. Table 3 shows the comparison between measured and predicted plateau pressures for pure CO2 and CO2-rich mixtures. For pure CO2, the measured and predicted plateau pressures were 6.67 and 6.69 MPa, respectively. For the impurity-containing cases, the deviations ranged from −10.14% to 8.19%, with a MARD of 4.54%. The largest deviation occurred for the H2-containing mixture.
Figure 2.
Comparison between measured and predicted decompression wave speed curves for pure CO2 and CO2-rich mixtures. Experimental data (denoted by ‘exp’) were extracted from Botros et al. [7,8].
Table 3.
Comparison between measured and predicted plateau pressures for pure CO2 and CO2-rich mixtures.
Curve-based metrics were also calculated over the entire curve and the plateau region, as shown in Table 4. For six of the seven cases, the entire-curve results gave R2 ≥ 0.95 and root-mean-square error (RMSE) ≤ 0.53 MPa. The H2-containing case gave RMSE = 1.42 MPa and R2 = 0.414. In the plateau region, RMSE values ranged from 0.07 to 0.93 MPa.
Table 4.
Curve-based error metrics between measured and predicted decompression wave speed curves for the cases of Figure 2 (pressure deviations in MPa).
The H2 deviation is attributed mainly to the CO2–H2 phase envelope and the equilibrium assumption. The plateau was independently determined from the bubble-line intersection and was not affected by the numerical filter or root-search lower bound.
Published comparisons indicate that GERG-2008 generally predicts higher plateau pressures than Peng–Robinson for CO2–Ar mixtures, whereas both equations of state give similar results for several CO2–H2 cases [31]. Other studies show that the equation of state affects the initial single-phase wave speed more strongly than the long-time plateau [32]. The declared GERG-2008 vapor-pressure uncertainty of 1–3% corresponds to approximately 0.07–0.20 MPa at a 6.7 MPa plateau, which is smaller than the mean model–data deviation of 4.54%. Thus, the absolute plateau pressure is EOS-dependent by several percent, whereas the impurity ranking and parameter trends are expected to be more robust.
3.4. Validation Against Large-Scale Tests
The model was further compared with four large-scale CO2 + N2 decompression tests from the SARCO2 [33] and CO2SAFE-ARREST programs [15,16], shown in Table 5. The N2 content ranged from 3.8% to 10.22%, the initial pressure from 12.70 to 15.04 MPa, and the initial temperature from 11.6 to 17.8 °C.
Table 5.
Comparison between measured and predicted plateau pressures in large-scale CO2 decompression tests.
The relative deviations of the plateau pressure ranged from −2.16% to 1.77%, with a mean absolute relative deviation of 1.75% and a mean bias of 0.67%. The measured plateau pressure increased with N2 concentration, and the model reproduced this trend. These results support the use of the equilibrium framework for impurity screening over the investigated composition range, while the effects of friction, heat transfer and non-equilibrium phase change remain outside the model scope.
4. Results and Discussion
4.1. Effect of Impurity Species on Decompression Wave Speed and Decompression Path
The effect of impurity species was examined for CO2-rich mixtures containing 3 mol% CH4, Ar, N2, O2, CO or H2 at 15 MPa and 40 °C. This concentration was selected because current transported CO2 specifications generally limit total non-CO2 content to a few mole percent; 3 mol% therefore represents a conservative single-impurity screening level.
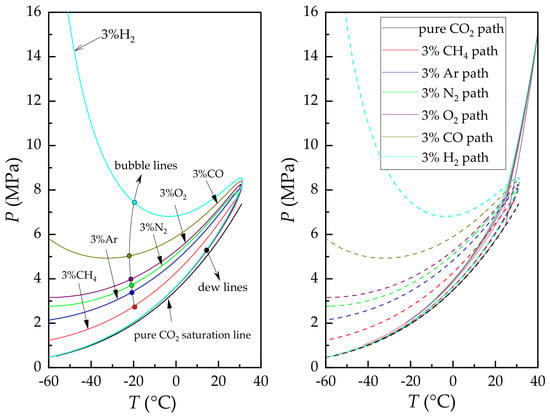
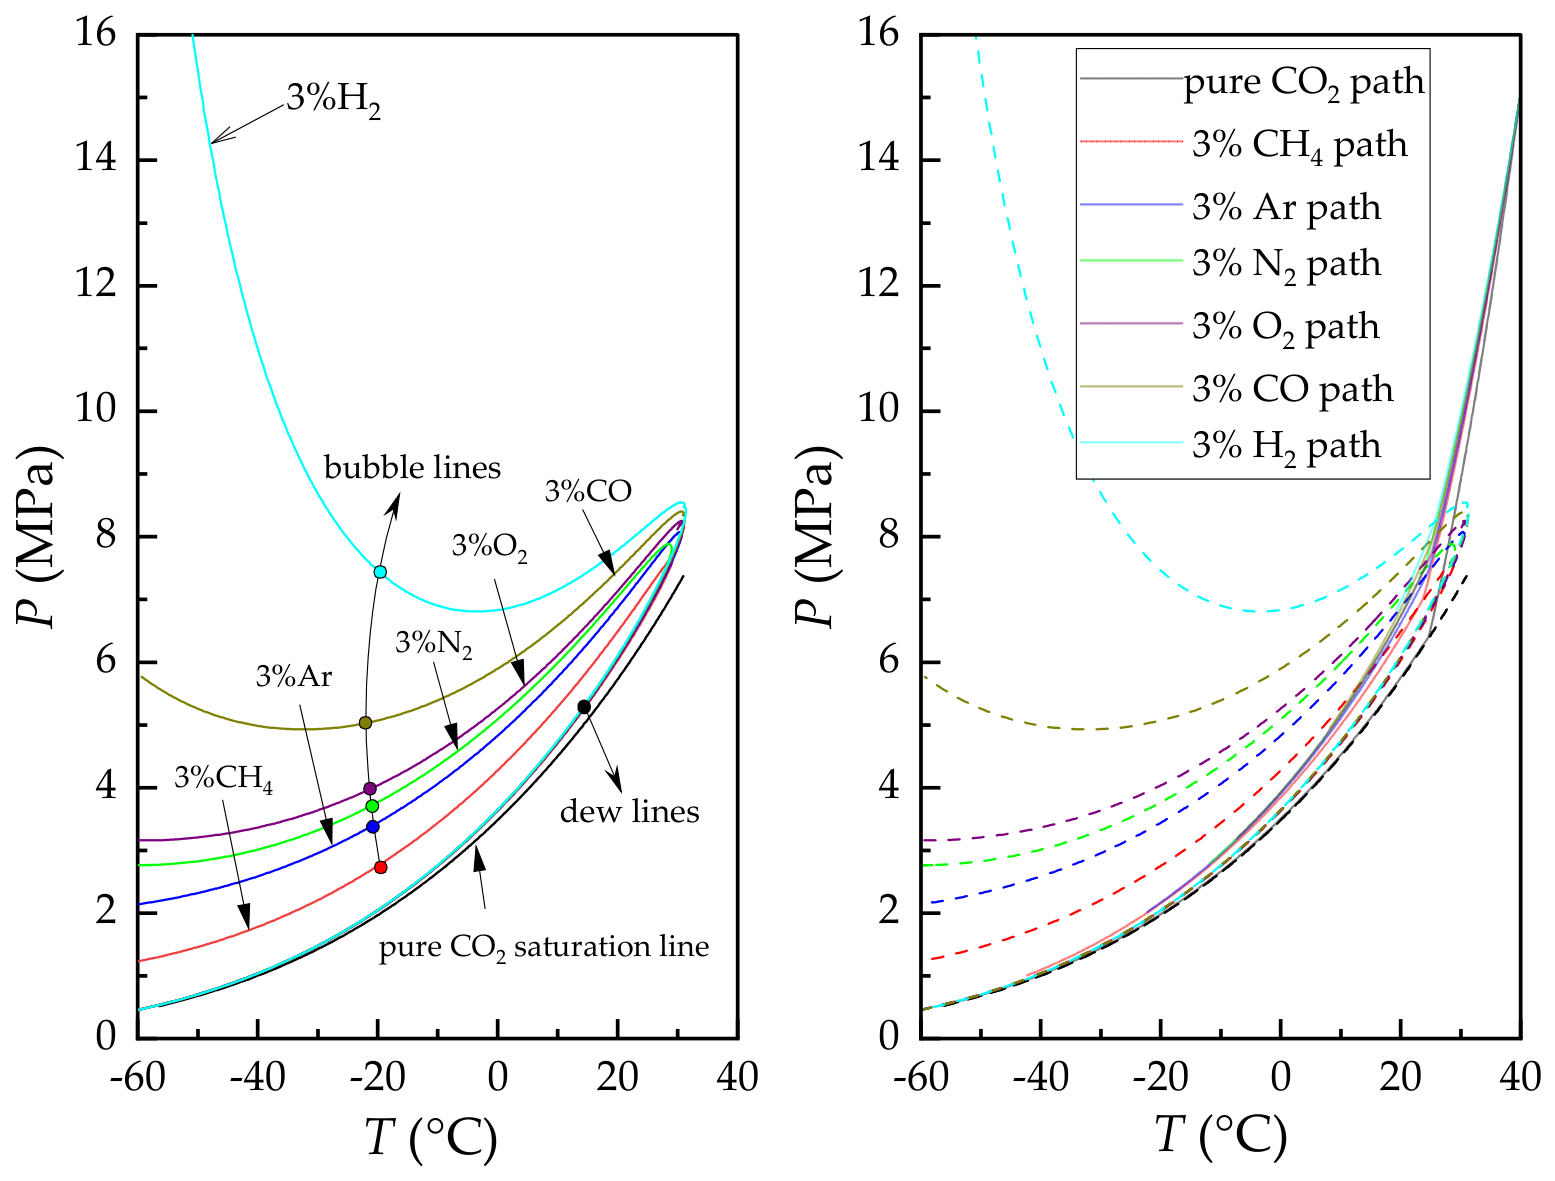
Figure 3 shows the phase envelopes (left) and isentropic decompression paths (right) of pure CO2 and CO2-rich mixtures containing 3 mol% impurity. Table 6 lists the bubble-point pressures together with the critical pressure and temperature of each mixture and the saturation pressure of pure CO2 at the same two temperatures, providing a numerical basis for the ordering discussed below.
Figure 3.
Phase envelopes (left) and isentropic decompression paths (right) of pure CO2 and CO2-rich mixtures containing 3 mol% impurity at an initial condition of 15 MPa and 40 °C.
Table 6.
Critical properties and bubble-point pressures of the six CO2-rich binary mixtures containing 3 mol% impurity, compared with pure CO2 at 20 °C and 0 °C.
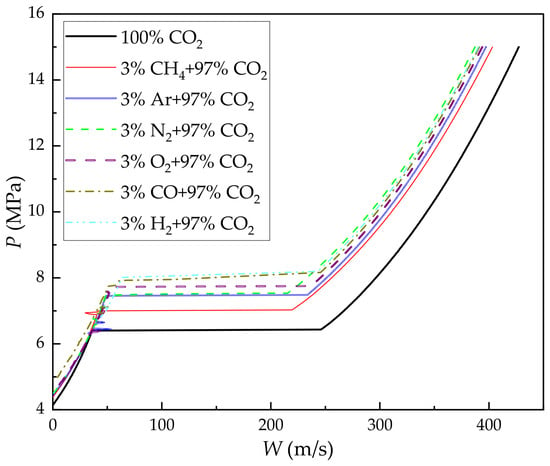
The impurities shifted the bubble line to higher pressures and caused earlier entry of the isentropic path into the two-phase region. The resulting bubble-pressure elevation and decompression plateau followed the order H2 > CO > O2 > N2 > Ar > CH4. At 20 °C, the bubble-pressure increase relative to pure CO2 ranged from 0.76 MPa for CH4 to 2.06 MPa for H2. The same ranking was obtained at 0 °C. All impurity-containing mixtures therefore produced higher plateaus than pure CO2.
The ranking does not follow the pure-component critical-temperature sequence. The dominant factor is impurity volatility relative to liquid CO2, which is better represented by the normal boiling point. For species with similar volatility, binary interaction parameters and reducing functions in GERG-2008 determine the excess Gibbs energy and impurity solubility in liquid CO2. Lower solubility at a fixed impurity fraction promotes transfer to the vapor phase and produces a larger bubble-pressure elevation.
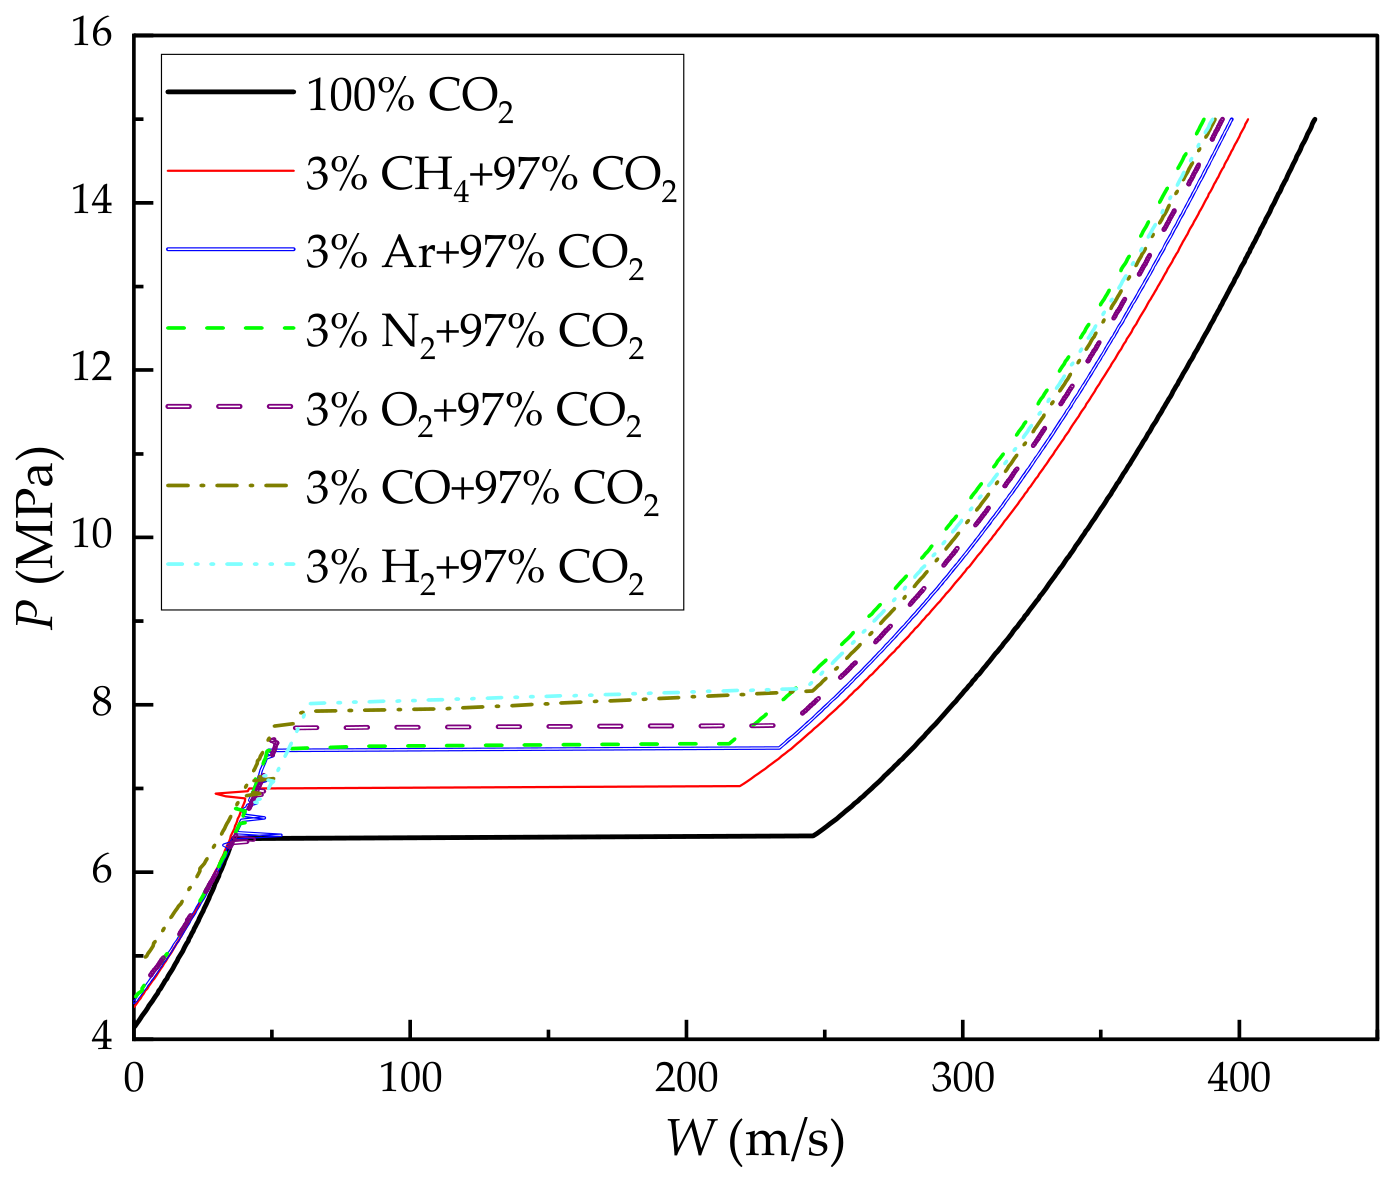
Figure 4 presents the decompression wave speed curves. The wave speed decreased smoothly in the single-phase region and dropped sharply when the isentropic path reached the bubble line. The plateau pressure followed the same order as the bubble-line elevation. Impurity effects on the plateau-region wave speed arose from changes in equilibrium sound speed and density.
Figure 4.
Effect of impurity species on decompression wave speed curves for CO2-rich mixtures containing 3 mol% impurity at 15 MPa and 40 °C.
4.2. Effect of Impurity Mole Fraction on Decompression Wave Speed and Decompression Path
N2 was selected as a representative impurity to examine the effect of mole fraction. CO2-rich mixtures containing 3, 6 and 9 mol% N2 were calculated at P0 = 15 MPa and T0 = 40 °C.
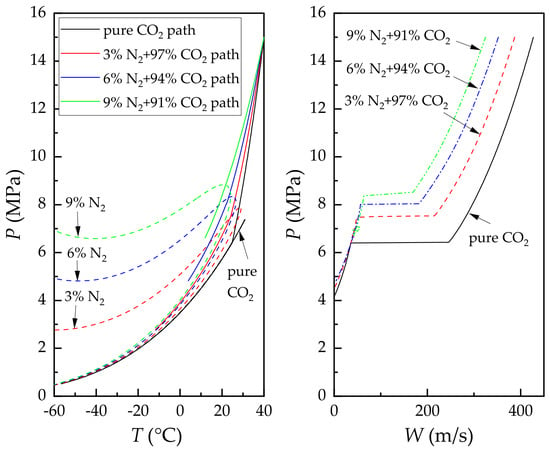
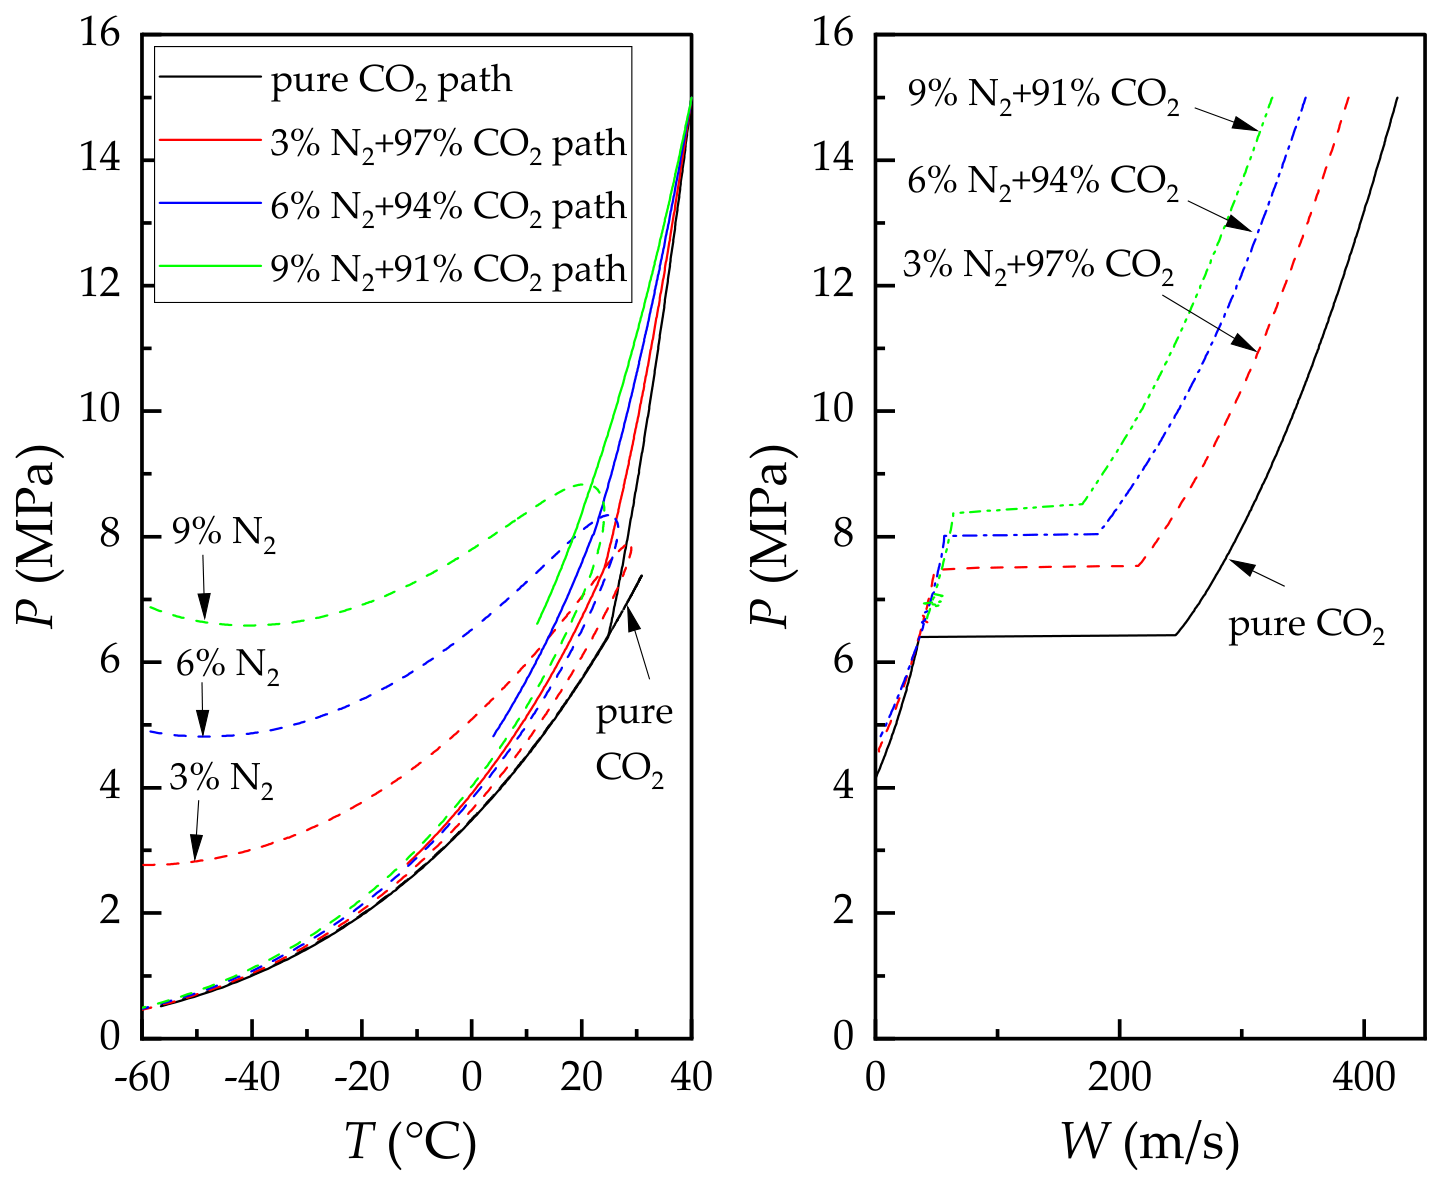
As shown in Figure 5, increasing the N2 concentration shifted the bubble line upward and caused earlier saturation crossing. The plateau pressures increased from 6.4 MPa for pure CO2 to 7.45, 8.05 and 8.35 MPa for 3, 6 and 9 mol% N2, respectively. The curves also separated on the single-phase branch; at a wave speed of 250 m/s, the 9 mol% mixture exceeded pure CO2 by approximately 2.4 MPa while both states remained single-phase.
Figure 5.
Effect of N2 mole fraction on CO2-rich mixture decompression at P0 = 15 MPa and T0 = 40 °C: phase envelopes and isentropic decompression paths (left); decompression wave speed curves (right).
Thus, N2 concentration affects the entire decompression curve, with the effect becoming stronger after phase transition because of the higher compressibility of the two-phase mixture.
4.3. Effect of Initial Pressure on Decompression Wave Speed and Decompression Path
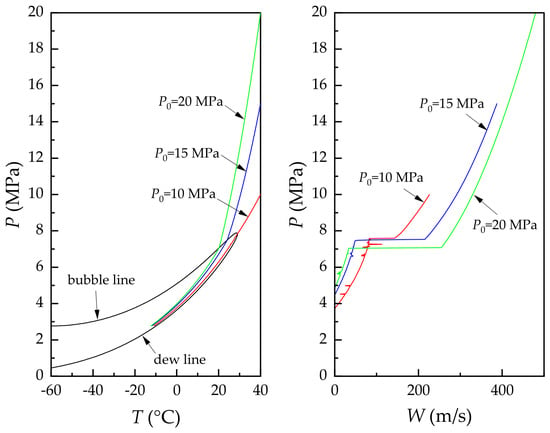
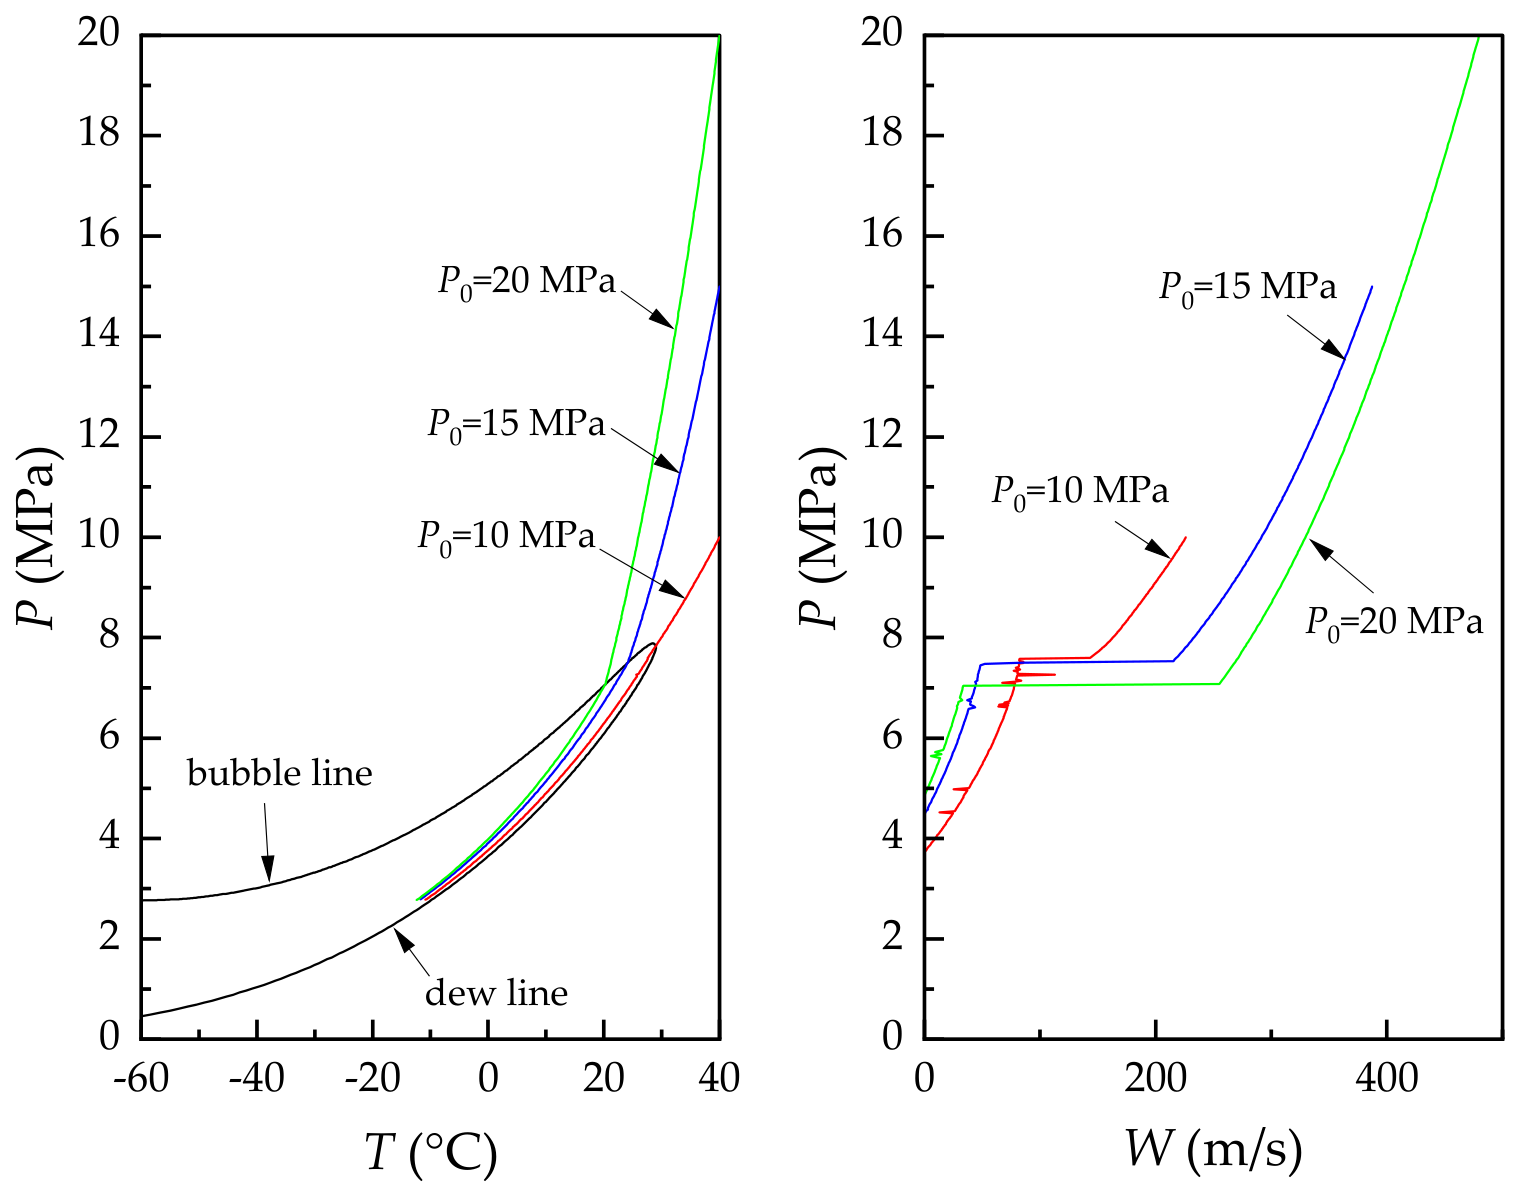
The effect of initial pressure was investigated for the mixture containing 3 mol% N2 and 97 mol% CO2 at T0 = 40 °C, with P0 = 10, 15 and 20 MPa.
As shown in Figure 6, increasing the initial pressure produced a denser, lower-entropy initial state and extended the single-phase decompression interval. It also increased the initial wave speed. In contrast, lower initial pressure placed the initial state closer to the saturation boundary.
Figure 6.
Effect of initial pressure on phase behavior and decompression wave speed for the CO2-rich mixture containing 3 mol% N2 at T0 = 40 °C: phase envelope and isentropic decompression paths (left); decompression wave speed curves (right).
The plateau pressures for 10, 15 and 20 MPa were approximately 7.4, 7.4 and 7.0 MPa, respectively, differing by less than 0.4 MPa. Thus, initial pressure strongly affected the initial wave speed and single-phase branch but had a limited influence on the plateau once the two-phase region was reached. The plateau was mainly controlled by the mixture phase envelope and composition.
4.4. Effect of Initial Temperature on Decompression Wave Speed and Decompression Path
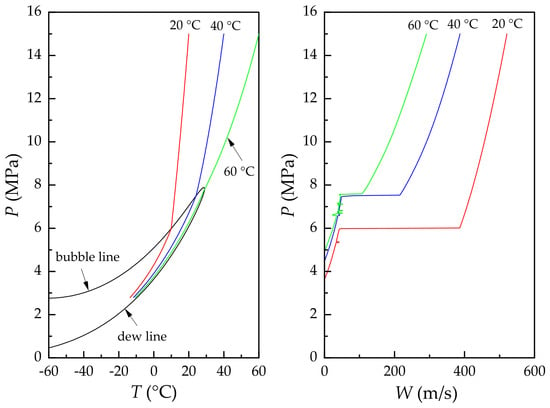
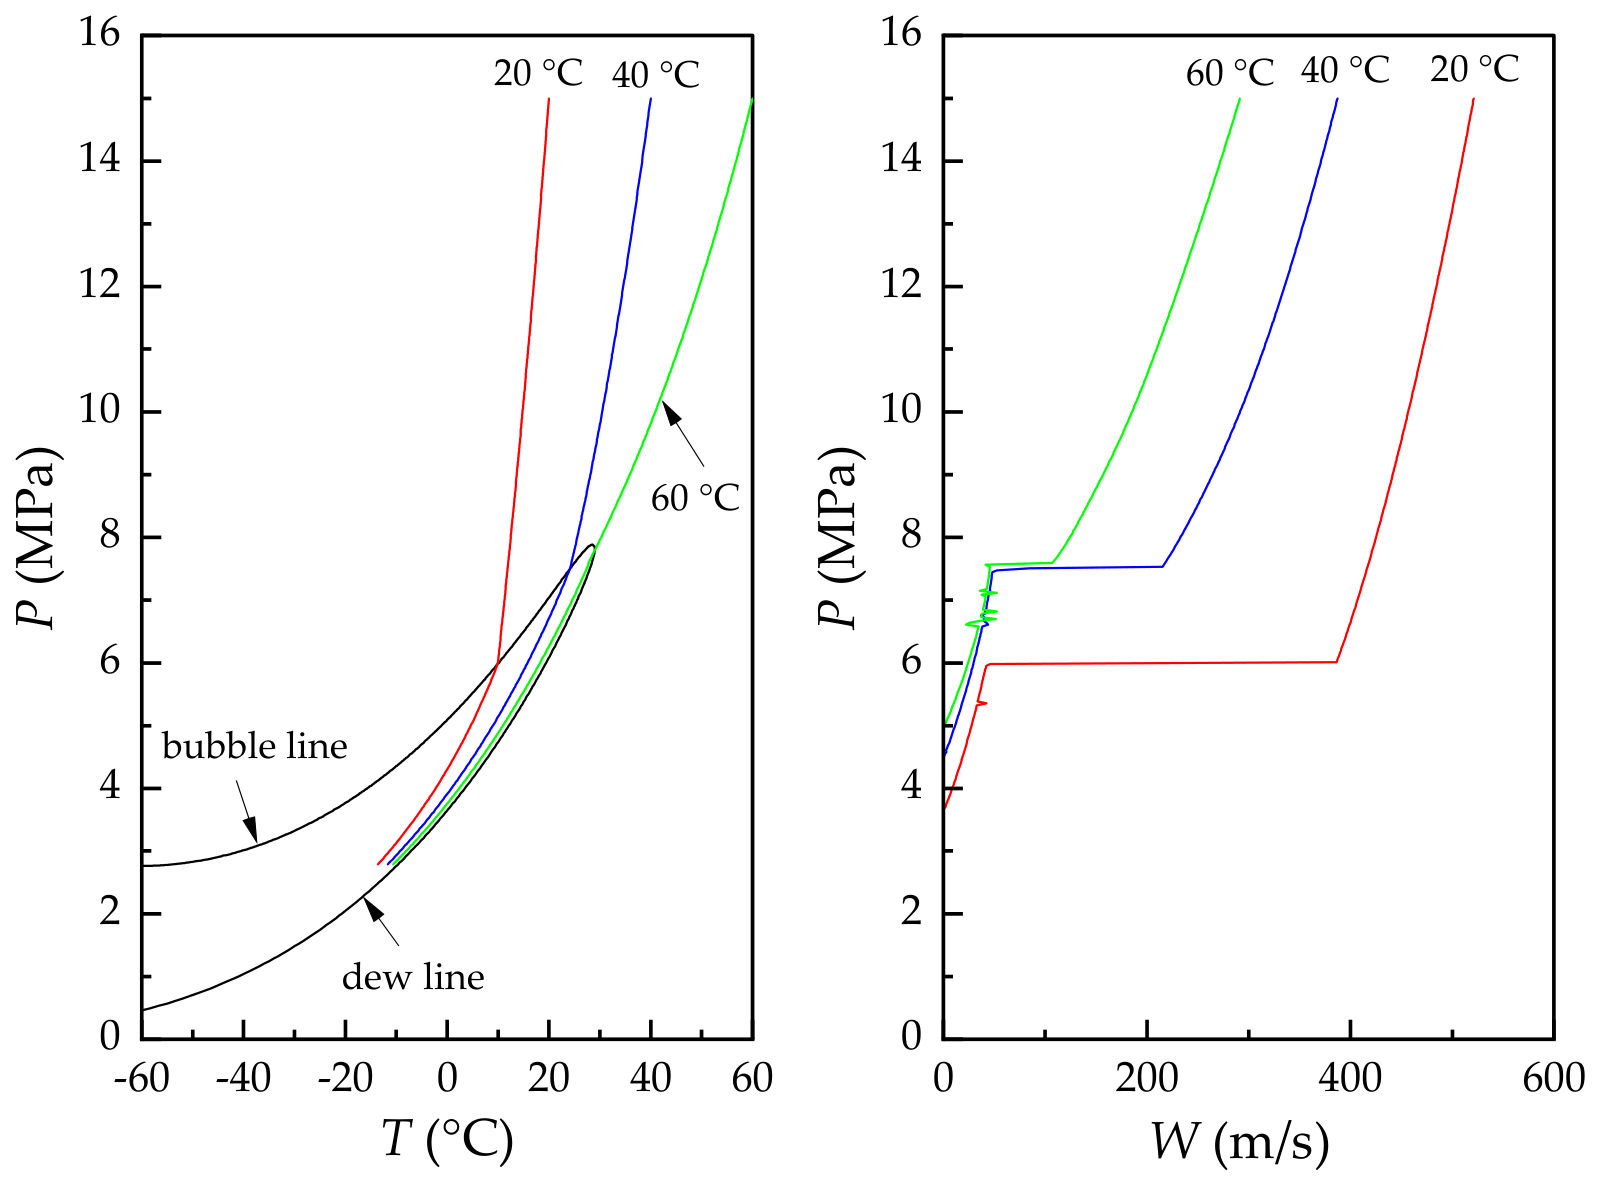
The effect of initial temperature was studied for the 3 mol% N2 and 97 mol% CO2 mixture at P0 = 15 MPa, with T0 = 20, 40 and 60 °C.
Figure 7 shows that higher initial temperature increased the initial entropy and shifted the isentropic path to a higher-temperature and higher-pressure bubble-line intersection. The plateau pressure therefore increased in the order of 20, 40 and 60 °C.
Figure 7.
Effect of initial temperature on phase behavior and decompression wave speed for the CO2-rich mixture containing 3 mol% N2 at P0 = 15 MPa: phase envelope and isentropic decompression paths (left); decompression wave speed curves (right).
Because the plateau condition is determined by the equality between the initial entropy and the saturated-liquid entropy on the bubble line, the crossing temperature and pressure increase with initial entropy. The lower density and sound speed associated with higher temperature mainly affect the wave-speed curve and its single-phase branch, rather than the plateau condition itself.
4.5. Engineering Implications for CO2 Pipeline Decompression and Fracture Control
Decompression behavior is governed by impurity composition, impurity concentration and the initial thermodynamic state through the relative position of the isentropic path and mixture phase envelope.
The plateau pressure represents the pressure sustained behind a propagating crack after two-phase decompression begins. In the Battelle two-curve framework, a higher plateau generally increases the crack-driving pressure and makes fracture arrest more difficult. Therefore, impurity species and operating conditions should be included in fracture-control assessments.
Impurity type is as important as total impurity concentration. At the examined condition, 3 mol% CH4 and 3 mol% H2 increased the bubble pressure by 0.76 and 2.06 MPa, respectively. Under a linear pressure-scaling approximation, these increases correspond to an indicative 13–36% increase in the required crack-arrest toughness relative to pure CO2. This estimate is only a lower-bound indication; a complete two-curve calculation requires a specific pipe geometry, crack-driving-force model and crack-velocity law.
Higher initial pressure generally extends the single-phase decompression interval and increases the initial wave speed, whereas higher initial temperature raises the saturation crossing pressure and may increase the crack-driving plateau pressure. Decompression analysis should therefore cover the actual operating envelope rather than a single nominal state.
The absolute values are subject to the limitations of the equilibrium model and the selected equation of state. Published comparisons suggest that replacing GERG-2008 with a cubic EOS would lower the predicted plateau by several percent in many cases, while EOS selection has a larger effect on the single-phase branch. For a specific CO2 stream, the calculation should be repeated with a property model validated for its complete impurity composition, particularly when H2, CH4 or significant water is present.
5. Conclusions
An equilibrium-isentropic model coupled with REFPROP 10 and GERG-2008 was developed to predict decompression paths, wave speeds and pressure plateaus for dense and supercritical CO2 mixtures.
- (1)
- The model reproduced the measured decompression-wave curves and plateau pressures with acceptable accuracy. The shock-tube plateau-pressure MARD was 4.54%, and the large-scale-test MARD was 1.75%. Six of the seven shock-tube cases had R2 ≥ 0.95 and RMSE ≤ 0.53 MPa over the full curve.
- (2)
- The pressure plateau was determined by the intersection of the isentropic path and the mixture bubble line. The result was insensitive to the numerical settings tested: pressure perturbations from 0.05 to 50 kPa and grids from 250 to 2000 points changed the plateau by less than 1%.
- (3)
- At 3 mol% impurity, the bubble pressure and plateau elevations followed the order H2 > CO > O2 > N2 > Ar > CH4. At 20 °C, the increase relative to pure CO2 ranged from 0.76 MPa for CH4 to 2.06 MPa for H2. The ranking was governed primarily by impurity volatility and binary interaction effects rather than critical temperature alone.
- (4)
- Increasing N2 concentration raised the bubble-point pressure, saturation-crossing pressure and decompression plateau. The effect was also evident on the single-phase branch of the wave-speed curve.
- (5)
- Initial pressure mainly shifted the isentropic path and affected the single-phase wave-speed branch, while the plateau changed little after the two-phase region was entered. Higher initial temperature increased the initial entropy and raised the saturation-crossing and plateau pressures.
- (6)
- Because the plateau pressure directly affects the crack-driving force, impurity composition, impurity concentration and the full operating envelope should be considered in CO2 pipeline fracture-control design.
Author Contributions
Conceptualization, X.Y.; methodology, X.Y.; software, Z.L.; validation, Z.L.; formal analysis, Y.W.; investigation, Y.W.; resources, X.W.; data curation, X.W.; writing—original draft preparation, Y.W.; writing—review and editing, L.S.; visualization, L.S.; supervision, X.Y.; project administration, X.Y.; funding acquisition, X.Y. All authors have read and agreed to the published version of the manuscript.
Funding
This research was funded by the Sinopec Technology Development Project ‘Suitability Assessment and Performance Optimization of Pipeline Materials for Dense-Phase CO2 Transportation’ under grant No. 325011.
Data Availability Statement
The original contributions presented in this study are included in the article. Further inquiries can be directed to the corresponding authors.
Acknowledgments
The authors thank the NIST Standard Reference Data support team for assistance with the REFPROP database acquisition process.
Conflicts of Interest
Authors Lei Shi, Xiaolin Wang and Yuxin Wang were employed by SINOPEC Dalian Research Institute of Petroleum and Petrochemicals Co., Ltd. The remaining author declares that the research was conducted in the absence of any commercial or financial relationships that could be construed as a potential conflict of interest.
Nomenclature and Abbreviations
The following nomenclature and abbreviations are used in this manuscript:
| Nomenclature and symbols: | |
| a | Equilibrium sound speed (m/s) |
| N | Number of pressure grid points |
| P | Pressure (MPa) |
| Q | Vapor quality (-) |
| R2 | Coefficient of determination |
| s | Specific entropy (kJ/kg·K) |
| T | Temperature (K or °C) |
| u | Induced flow velocity (m/s) |
| W | Decompression wave speed (m/s) |
| z | Mixture composition (mol%) |
| ρ | Density (kg/m3) |
| ΔP | Pressure perturbation for the numerical sound-speed derivative (kPa) |
| Subscripts: | |
| 0 | Initial state |
| i | Grid-point index |
| bubble | Bubble point |
| plateau | Plateau point |
| sat | Saturation point |
| Abbreviations | |
| EOS | Equation of state |
| GERG | Groupe Europeen de Recherches Gazieres formulation |
| MAE | Mean absolute error |
| MARD | Mean absolute relative deviation |
| NIST | National Institute of Standards and Technology |
| REFPROP | Reference Fluid Thermodynamic and Transport Properties Database |
| RMSE | Root-mean-square error |
References
- Lu, H.; Ma, X.; Huang, K.; Fu, L.; Azimi, M. Carbon dioxide transport via pipelines: A systematic review. J. Clean. Prod. 2020, 266, 121994. [Google Scholar] [CrossRef] [Scilit]
- Munkejord, S.T.; Hammer, M.; Løvseth, S.W. CO2 transport: Data and models—A review. Appl. Energy 2016, 169, 499–523. [Google Scholar] [CrossRef] [Scilit]
- Wu, X.; Xing, X.; Liu, J.; Jia, W.; Yang, F.; Liu, J. Rupture and leakage risk assessment: A review of the chain disaster mechanism of CO2 pipeline. Int. J. Greenh. Gas Control 2026, 155, 104744. [Google Scholar] [CrossRef] [Scilit]
- Aursand, E.; Dumoulin, S.; Hammer, M.; Lange, H.I.; Morin, A.; Munkejord, S.T.; Nordhagen, H.O. Fracture propagation control in CO2 pipelines: Validation of a coupled fluid–structure model. Eng. Struct. 2016, 123, 192–212. [Google Scholar] [CrossRef] [Scilit]
- Nordhagen, H.O.; Munkejord, S.T.; Hammer, M.; Gruben, G.; Fourmeau, M.; Dumoulin, S. A fracture-propagation-control model for pipelines transporting CO2-rich mixtures including a new method for material-model calibration. Eng. Struct. 2017, 143, 245–260. [Google Scholar] [CrossRef] [Scilit]
- Botros, K.K.; Geerligs, J.; Rothwell, B.; Robinson, T. Measurements of decompression wave speed in pure carbon dioxide and comparison with predictions by equation of state. J. Press. Vessel Technol. 2016, 138, 031302. [Google Scholar] [CrossRef] [Scilit]
- Botros, K.K.; Geerligs, J.; Rothwell, B.; Robinson, T. Measurements of decompression wave speed in binary mixtures of carbon dioxide and impurities. J. Press. Vessel Technol. 2017, 139, 021301. [Google Scholar] [CrossRef] [Scilit]
- Botros, K.K.; Geerligs, J.; Rothwell, B.; Carlson, L.; Fletcher, L.; Venton, P. Transferability of decompression wave speed measured by a small-diameter shock tube to full size pipelines and implications for determining required fracture propagation resistance. Int. J. Press. Vessels Pip. 2010, 87, 681–695. [Google Scholar] [CrossRef] [Scilit]
- Botros, K.K.; Geerligs, J.; Eiber, R.J. Measurement of decompression wave speed in rich gas mixtures at high pressures (370 bars) using a specialized rupture tube. J. Press. Vessel Technol. 2010, 132, 051303. [Google Scholar] [CrossRef] [Scilit]
- Botros, K.K.; Geerligs, J.; Zhou, J.; Glover, A. Measurements of flow parameters and decompression wave speed following rupture of rich gas pipelines, and comparison with GASDECOM. Int. J. Press. Vessels Pip. 2007, 84, 358–367. [Google Scholar] [CrossRef] [Scilit]
- Cosham, A.; Jones, D.G.; Armstrong, K.; Allason, D.; Barnett, J. Analysis of a dense phase carbon dioxide full-scale fracture propagation test in 24-inch diameter pipe. In Proceedings of the 11th International Pipeline Conference, IPC2016–64456, Calgary, AB, Canada, 26–30 September 2016. [Google Scholar] [CrossRef] [Scilit]
- Cosham, A.; Jones, D.G.; Armstrong, K.; Allason, D.; Barnett, J. Analysis of two dense phase carbon dioxide full-scale fracture propagation tests. In Proceedings of the 10th International Pipeline Conference, IPC2014–33080, Calgary, AB, Canada, 29 September–3 October 2014. [Google Scholar] [CrossRef] [Scilit]
- Cosham, A.; Jones, D.G.; Armstrong, K.; Allason, D.; Barnett, J. Ruptures in gas pipelines, liquid pipelines and dense phase carbon dioxide pipelines. In Proceedings of the 9th International Pipeline Conference, IPC2012-90463, Calgary, AB, Canada, 24–28 September 2012. [Google Scholar] [CrossRef] [Scilit]
- Ahmad, M.; Lowesmith, B.; De Koeijer, G.; Nilsen, S.; Tonda, H.; Spinelli, C.; Cooper, R.; Clausen, S.; Mendes, R.; Florisson, O. COSHER joint industry project: Large scale pipeline rupture tests to study CO2 release and dispersion. Int. J. Greenh. Gas Control 2015, 37, 340–353. [Google Scholar] [CrossRef] [Scilit]
- Linton, V.; Leinum, B.H.; Newton, R.; Fyrileiv, O. CO2SAFE-ARREST: A full-scale burst test research program for carbon dioxide pipelines—Part 1: Project overview and outcomes of Test 1. In Proceedings of the 12th International Pipeline Conference, IPC2018–78517, Calgary, AB, Canada, 24–28 September 2018. [Google Scholar] [CrossRef] [Scilit]
- Michal, J.; Davis, B.; Østby, E.; Lu, C.; Røneid, S. CO2SAFE-ARREST: A full-scale burst test research program for carbon dioxide pipelines—Part 2: Is the BTCM out of touch with dense-phase CO2? In Proceedings of the 12th International Pipeline Conference, IPC2018–78525, Calgary, AB, Canada, 24–28 September 2018. [Google Scholar] [CrossRef] [Scilit]
- Chen, L.; Hu, Y.; Yang, K.; Yan, X.; Yu, S.; Yu, J.; Chen, S. Experimental study of decompression wave characteristics and steel pipe applicability of supercritical CO2 pipeline. Gas Sci. Eng. 2024, 121, 205203. [Google Scholar] [CrossRef] [Scilit]
- Yu, S.; Yan, X.; He, Y.; Chen, L.; Hu, Y.; Yang, K.; Cao, Z.; Yu, J.; Chen, S. Study on the decompression behavior during large-scale pipeline puncture releases of CO2 with various N2 compositions: Experiments and mechanism analysis. Energy 2024, 296, 131180. [Google Scholar] [CrossRef] [Scilit]
- Qiao, F.; Liu, Z.; Yu, S.; He, Y.; Zhao, K.; Yang, X.; Yan, X.; Yu, J. Experimental study on leakage characteristics of large-scale CO2 pipelines containing CH4 and CO impurities. Energy 2026, 342, 139640. [Google Scholar] [CrossRef] [Scilit]
- Elshahomi, A.; Lu, C.; Michal, G.; Liu, X.; Godbole, A.; Venton, P. Decompression wave speed in CO2 mixtures: CFD modelling with the GERG-2008 equation of state. Appl. Energy 2015, 140, 20–32. [Google Scholar] [CrossRef] [Scilit]
- Dall’Acqua, D.; Terenzi, A.; Leporini, M.; D’Alessandro, V.; Giacchetta, G.; Marchetti, B. A new tool for modelling the decompression behaviour of CO2 with impurities using the Peng-Robinson equation of state. Appl. Energy 2017, 206, 1432–1445. [Google Scholar] [CrossRef] [Scilit]
- Gu, S.; Li, Y.; Teng, L.; Hu, Q.; Zhang, D.; Ye, X.; Wang, C.; Wang, J.; Iglauer, S. A new model for predicting the decompression behavior of CO2 mixtures in various phases. Process Saf. Environ. Prot. 2018, 120, 237–247. [Google Scholar] [CrossRef] [Scilit]
- Liao, H.; Wang, X.; Yang, K.; Hou, Z.; Wang, H. Impurity-driven variations in CO2 critical flow dynamics: Modeling approaches for enhanced CCS safety. Energy 2025, 323, 135850. [Google Scholar] [CrossRef] [Scilit]
- Botros, K.K.; Geerligs, J.; Rothwell, B.; Robinson, T. Effects of argon as the primary impurity in anthropogenic carbon dioxide mixtures on the decompression wave speed. Can. J. Chem. Eng. 2017, 95, 440–448. [Google Scholar] [CrossRef] [Scilit]
- Gernert, J.; Span, R. EOS-CG: A Helmholtz energy mixture model for humid gases and CCS mixtures. J. Chem. Thermodyn. 2016, 93, 274–293. [Google Scholar] [CrossRef] [Scilit]
- Neumann, T.; Herrig, S.; Bell, I.H.; Beckmüller, R.; Lemmon, E.W.; Thol, M.; Span, R. EOS-CG-2021: A mixture model for the calculation of thermodynamic properties of CCS mixtures. Int. J. Thermophys. 2023, 44, 178. [Google Scholar] [CrossRef] [Scilit]
- Kunz, O.; Wagner, W. The GERG-2008 wide-range equation of state for natural gases and other mixtures: An expansion of GERG-2004. J. Chem. Eng. Data 2012, 57, 3032–3091. [Google Scholar] [CrossRef] [Scilit]
- Westman, S.F.; Austegard, A.; Stang, H.G.J.; Løvsteh, S.W. Vapor-liquid equilibrium data for the carbon dioxide and carbon monoxide (CO2 + CO) system at the temperatures 253, 273, 283 and 298 K and pressures up to 13 MPa. Fluid Phase Equilib. 2018, 473, 37–49. [Google Scholar] [CrossRef] [Scilit]
- Westman, S.F.; Stang, H.G.J.; Løvseth, S.W.; Austegard, A.; Snustad, I.; Ertesvåg, I.S. Vapor-liquid equilibrium data for the carbon dioxide and oxygen (CO2 + O2) system at the temperatures 218, 233, 253, 273, 288 and 298 K and pressures up to 14 MPa. Fluid Phase Equilib. 2016, 421, 67–87. [Google Scholar] [CrossRef] [Scilit]
- Westman, S.F.; Stang, H.G.J.; Lovseth, S.W.; Austegard, A.; Snustad, I.; Størset, S.Ø.; Ertesvåg, I.S. Vapor-liquid equilibrium data for the carbon dioxide and nitrogen (CO2 + N2) system at the temperatures 223, 270, 298 and 303 K and pressures up to 18 MPa. Fluid Phase Equilib. 2016, 409, 207–241. [Google Scholar] [CrossRef] [Scilit]
- Munkejord, S.T.; Deng, H.; Austegard, A.; Hammer, M.; Aasen, A.; Skarsvåg, H.L. Depressurization of CO2-N2 and CO2-He in a pipe: Experiments and modelling of pressure and temperature dynamics. Int. J. Greenh. Gas Control 2021, 109, 103361. [Google Scholar] [CrossRef] [Scilit]
- Aursand, E.; Aursand, P.; Hammer, M.; Lund, H. The influence of CO2 mixture composition and equations of state on simulations of transient pipeline decompression. Int. J. Greenh. Gas Control 2016, 54, 599–609. [Google Scholar] [CrossRef] [Scilit]
- Wang, Y.; Hu, Q.; Yin, B.; Zhao, X.; Meng, L.; Zhu, J.; Ouyang, X.; Li, Y. Research progress on dynamics crack propagation and crack arrest models of supercritical and dense-phase CO2 pipelines. J. Pipeline Sci. Eng. 2025, 5, 100255. [Google Scholar] [CrossRef] [Scilit]

Disclaimer/Publisher’s Note: The statements, opinions and data contained in all publications are solely those of the individual author(s) and contributor(s) and not of MDPI and/or the editor(s). MDPI and/or the editor(s) disclaim responsibility for any injury to people or property resulting from any ideas, methods, instructions or products referred to in the content. |
© 2026 by the authors. Licensee MDPI, Basel, Switzerland. This article is an open access article distributed under the terms and conditions of the Creative Commons Attribution (CC BY) license.