


Abstract
This study evaluates the On-Demand All-Red Interval (ODAR) at signalized intersections to address red-light running (RLR) issues. Traditional fixed all-red intervals fail to adapt to dynamic traffic conditions, leading to potential safety risks and unnecessary delays. This study introduces a novel approach for dynamically extending the all-red interval on demand to enhance intersection efficiency while maintaining safety by eliminating unnecessary clearance intervals when no risk exists. Utilizing software-in-the-loop simulation, the study assesses the effectiveness of the ODAR method compared to conventional fixed-duration and Dynamic All-Red Extension (DARE) methods, allowing realistic controller testing without field deployment. The ODAR method adapts to real-time traffic conditions by incorporating vehicle speed and signal timing, ensuring vehicles with high collision risk clear the intersection safely. The study is conducted using a microsimulation model based on the Washington Street arterial network in Lake County, Illinois, validated against real traffic conditions. The results demonstrate that ODAR increases throughput and, in specific scenarios, reduces delays and stop occurrences compared to FAR and DARE strategies, based on a field-calibrated microsimulation dataset of a real-world arterial corridor. Importantly, these efficiency improvements are achieved while maintaining comparable intersection safety outcomes, as measured by red-light-running events, conflict frequency, and conflict severity.
1. Introduction
Signalized intersections are critical points in a road network where various traffic flows converge, often becoming hotspots for collisions, particularly during traffic signal clearance intervals. In the United States, over 20% of crashes occur at signalized intersections due to signal violations [1], primarily attributed to red-light running [2]. The propensity for red-light running behavior can depend on multiple factors, including human, roadway infrastructure, traffic flow, and operational characteristics, present at the intersection, and visibility [3,4,5,6,7].
Some of the most common engineering countermeasures for mitigating red-light running include driver information systems, physical improvements, and signal operation strategies [8]. Among these, the all-red interval serves a critical role in ensuring intersection safety, providing sufficient time for vehicles entering near the end of the green phase to exit the intersection before the onset of cross-traffic. Several methods to calculate all-red intervals are used in the field [9]. However, a fixed all-red duration may not always be sufficient to accommodate varying traffic conditions [10,11]. For instance, fixed all-red intervals may not account for unexpected delays, such as vehicles moving slower than expected or aggressive drivers. Researchers recognize two ways to address the safe passage through intersection at the onset of yellow: either dynamically extend the green light for approaching vehicles or dynamically extend the all-red interval to provide enough time for the red-light running (RLR) vehicle to cross the intersection [12]. Dynamic all-red extension has been used in Europe for decades. However, in the USA, only a few departments of transportation (DOT) employ dynamic all-red extension (e.g., North Carolina, Maryland, and Oregon) [9,11,13,14,15]. It is worth mentioning that since the 2009 edition the Manual on Uniform Traffic Control Devices for Streets and Highways (MUTCD) allows all-red changes on a cycle-by-cycle basis, while yellow interval changes on a cycle-by-cycle basis are not allowed [16]. Changes in the MUTCD provided researchers with an opportunity to investigate the concept of dynamic all-red extension (DARE) [16]. DARE aims to minimize the likelihood of angle collisions, which are common at intersections during signal changes, by providing a couple of additional seconds for vehicles with high collision risk (VHCR) to clear the intersection. Typically, this extension is added to the original all-red interval as a fixed number of seconds [13]. However, some researchers have suggested that the all-red extension should depend on the speed of the approaching VHCR [17]. In other words, instead of adding a fixed value for every VHCR, some researchers proposed extending the initial all-red interval by a variable number of seconds. This value would depend on the detected speed of a VHCR and the remaining time until the conflicting phases’ green light, and it would be long enough for the VHCR to safely clear the intersection [10,11,17]. Therefore, this method requires sensors or cameras capable of detecting the speed of the VHCR [10,11,13,17].
Many studies and reports have investigated change and clearance (all-red) intervals. For example, in 2010, Archer and Young tested the impact of green time and all-red extensions on intersection safety, by utilizing pair of advanced detectors and two different speed limits [14]. 2019, Abadi et al. evaluated four all-red extension strategies with hardware-in-the-loop simulation [13]. These strategies included three differently spaced pairs of detectors and a strategy considering actuation of a downstream detector. They tested various red extensions by utilizing field-like controllers, but all of the all-red extensions were fixed intervals. On the other hand, in 2016, Gates and Noyce proposed a concept of dynamic all-red extension, which depends on the speed of the VHCR and the zone where the vehicle is detected [17].
However, to the authors’ knowledge, no one has considered eliminating the all-red interval entirely and adding it only when needed for safety reasons. The authors speculate that this approach could enhance traffic signal control efficiency while maintaining or potentially improving safety compared to traditional fixed all-red (FAR) or the DARE system. In this study, we aim to fill the gap in existing research by removing all-red intervals on a regular basis and adding them as needed based on the speed of the detected VHCR. Furthermore, to ensure that the results of this research are practical, we investigate this by modifying the “RedExtension” feature in commercial traffic signal controllers that comply with the most recent version of the National Transportation Communications for ITS Protocol (NTCIP). Therefore, this study has three main contributions. First, it proposes a different all-red interval system where the all-red is implemented only when needed and, whenever possible, traffic of at least one phase would be moving. In other words, unless there is an unsafe situation, we will not provide an all-red interval. Second, the study implements the proposed method using a Software-in-the-Loop Simulation (SILS) framework, ensuring that the developed algorithm is scalable and adaptable for real-world field deployment. Third, the study evaluates the proposed system’s safety and traffic control efficiency, comparing its performance against existing all-red strategies. The study utilizes a microsimulation model with verified simulation driving behaviors to accurately simulate behavior during the amber interval and red light runners, as shown in the previous studies [18]. To focus on the relevant factors, without too much of background noise (which could be found in very urban settings), the paper tests the proposed concept at isolated intersections with high-speed limits (which are also the most vulnerable to red-light running) operating in actuated free mode without any coordination between subsequent intersections. Additionally, this study tests a comprehensive set of scenarios including fixed all-red interval, dynamic all-red extension and the proposed on-demand all-red interval (hereby called ODAR). The performance of these all-red extension methods is evaluated by using the Surrogate Safety Assessment Model (SSAM) and traditional efficiency performance measures. Moreover, since red-light extension can cause additional delays, we aim to determine which method is the most efficient among those compared. The remainder of the paper is structured as follows: First, we provide a literature review of the most relevant previous studies. Next, we present an overview of our methodology, including the experimental setup. Following this, we discuss the experimental results in detail. Finally, we offer concluding remarks and suggest opportunities for future research.
2. Literature Review
The literature on all-red interval design and extension has grown substantially since the early 2000s, reflecting increasing concern over red-light-running (RLR) and intersection safety. Existing studies can be broadly grouped into three categories: (1) traditional methods for calculating clearance intervals, (2) fixed and dynamic all-red extension strategies aimed at mitigating high-risk vehicle crossings, and (3) prediction-based approaches that estimate driver stop–go behavior during the yellow interval.
Traditional approaches to all-red interval calculation focus on fixed clearance design intended to accommodate vehicle stopping and intersection traversal under conservative assumptions. The 2012 NCHRP report ‘Guidelines for Timing Yellow and All-Red Intervals at Signalized Intersections’ provides a comprehensive overview of established clearance interval calculation methods [9]. More recently, Cesme et al. emphasized the need for improved documentation and consistent implementation of clearance change interval calculation procedures across agencies [15]. While these methods provide a standardized basis for signal timing, they do not adapt to vehicle-specific risk or real-time traffic conditions.
To address limitations of fixed clearance intervals, several studies have explored dynamic or conditional all-red extensions, particularly for high-risk vehicle crossings. Research has shown that heavy vehicles require longer stopping distances and clearance times, motivating extended protection in dilemma zone conditions [19]. Subsequent studies evaluated the relationship between all-red duration and crash likelihood [20]. Building on this work, the same researchers introduced limited flexibility in all-red extensions based on the speed of incoming vehicles, although the concept was not implemented in field-like controllers [14].
Field and simulation-based evaluations of all-red extensions have demonstrated measurable safety benefits. Olson reported reductions in right-angle crashes following the deployment of a fixed all-red extension system [21]. Similarly, the Dynamic All-Red Extension (DARE) system, featuring a predefined extension duration, was implemented in North Carolina and later revisited to document long-term operational and safety impacts [10,11]. More recent analyses have examined driver behavior and system performance under DARE operation, using speed–space analysis to refine system parameters such as detection zone length and speed thresholds [22]. Additional studies have evaluated dynamic all-red extensions in hardware-in-the-loop simulation environments, demonstrating safety improvements but relying primarily on default controller configurations with discrete extension values [13,23]. Other related work has investigated the role of all-red clearance during protected–permissive phase transitions and alternative actuated control strategies to reduce specific conflict types [24,25].
A parallel line of research has focused on predicting red-light-running behavior and driver decision-making during the yellow interval. Early work proposed RLR prediction methods using inductive loop detectors and IntelliDrive-based infrastructure [26,27]. More recent studies have employed machine learning techniques to address the dilemma zone problem and estimate driver intent under varying traffic conditions [12]. In connected and automated vehicle environments, trajectory optimization and cooperative control strategies have been explored to mitigate collision risk at signalized intersections [28]. Foundational behavioral studies have also examined driver response at the onset of the yellow interval, providing insight into the mechanisms underlying stop–go decisions [29].
Despite the breadth of existing research, prior studies generally retain a mandatory all-red interval or rely on predictive or anticipatory logic to infer driver behavior within the dilemma zone. To the authors’ knowledge, no previous work has eliminated the default all-red interval and applied it solely on demand based on confirmed vehicle behavior using field-like controller logic. While several studies have examined the safety impacts of fixed or dynamic all-red extensions, these evaluations have typically been limited to field crash analyses or conceptual frameworks and have not been implemented within a microsimulation-based SILS environment. As a result, prior work has had limited ability to simultaneously assess detailed operational performance measures (e.g., delay, stops, and throughput) alongside surrogate safety metrics. The present study addresses these gaps by implementing the proposed ODAR strategy in a SILS framework, enabling direct access to controller-level logic and facilitating a comprehensive evaluation of both safety and efficiency relative to traditional and dynamic all-red extension methods.
3. Methodology
To implement and evaluate all-red methods in SILS, the authors have developed a set of methodological steps. Thus, the methodology of our study consists of four basic steps:
- Description of fixed, dynamic all-red methods and the proposed all-red method.
- Calibration of the driver’s response in Vissim.
- Description of SILS.
- Experimental setup and evaluation of all-red methods.
3.1. Dynamic All-Red Methods
In this subsection we will describe the analyzed all-red methods and extension systems. As mentioned in the introduction, the all-red methods can be:
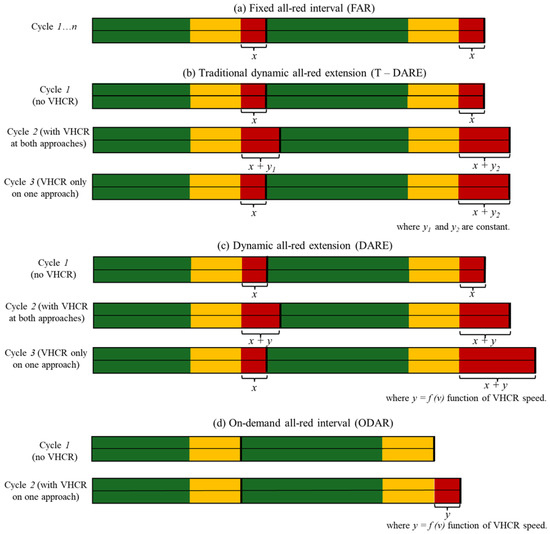
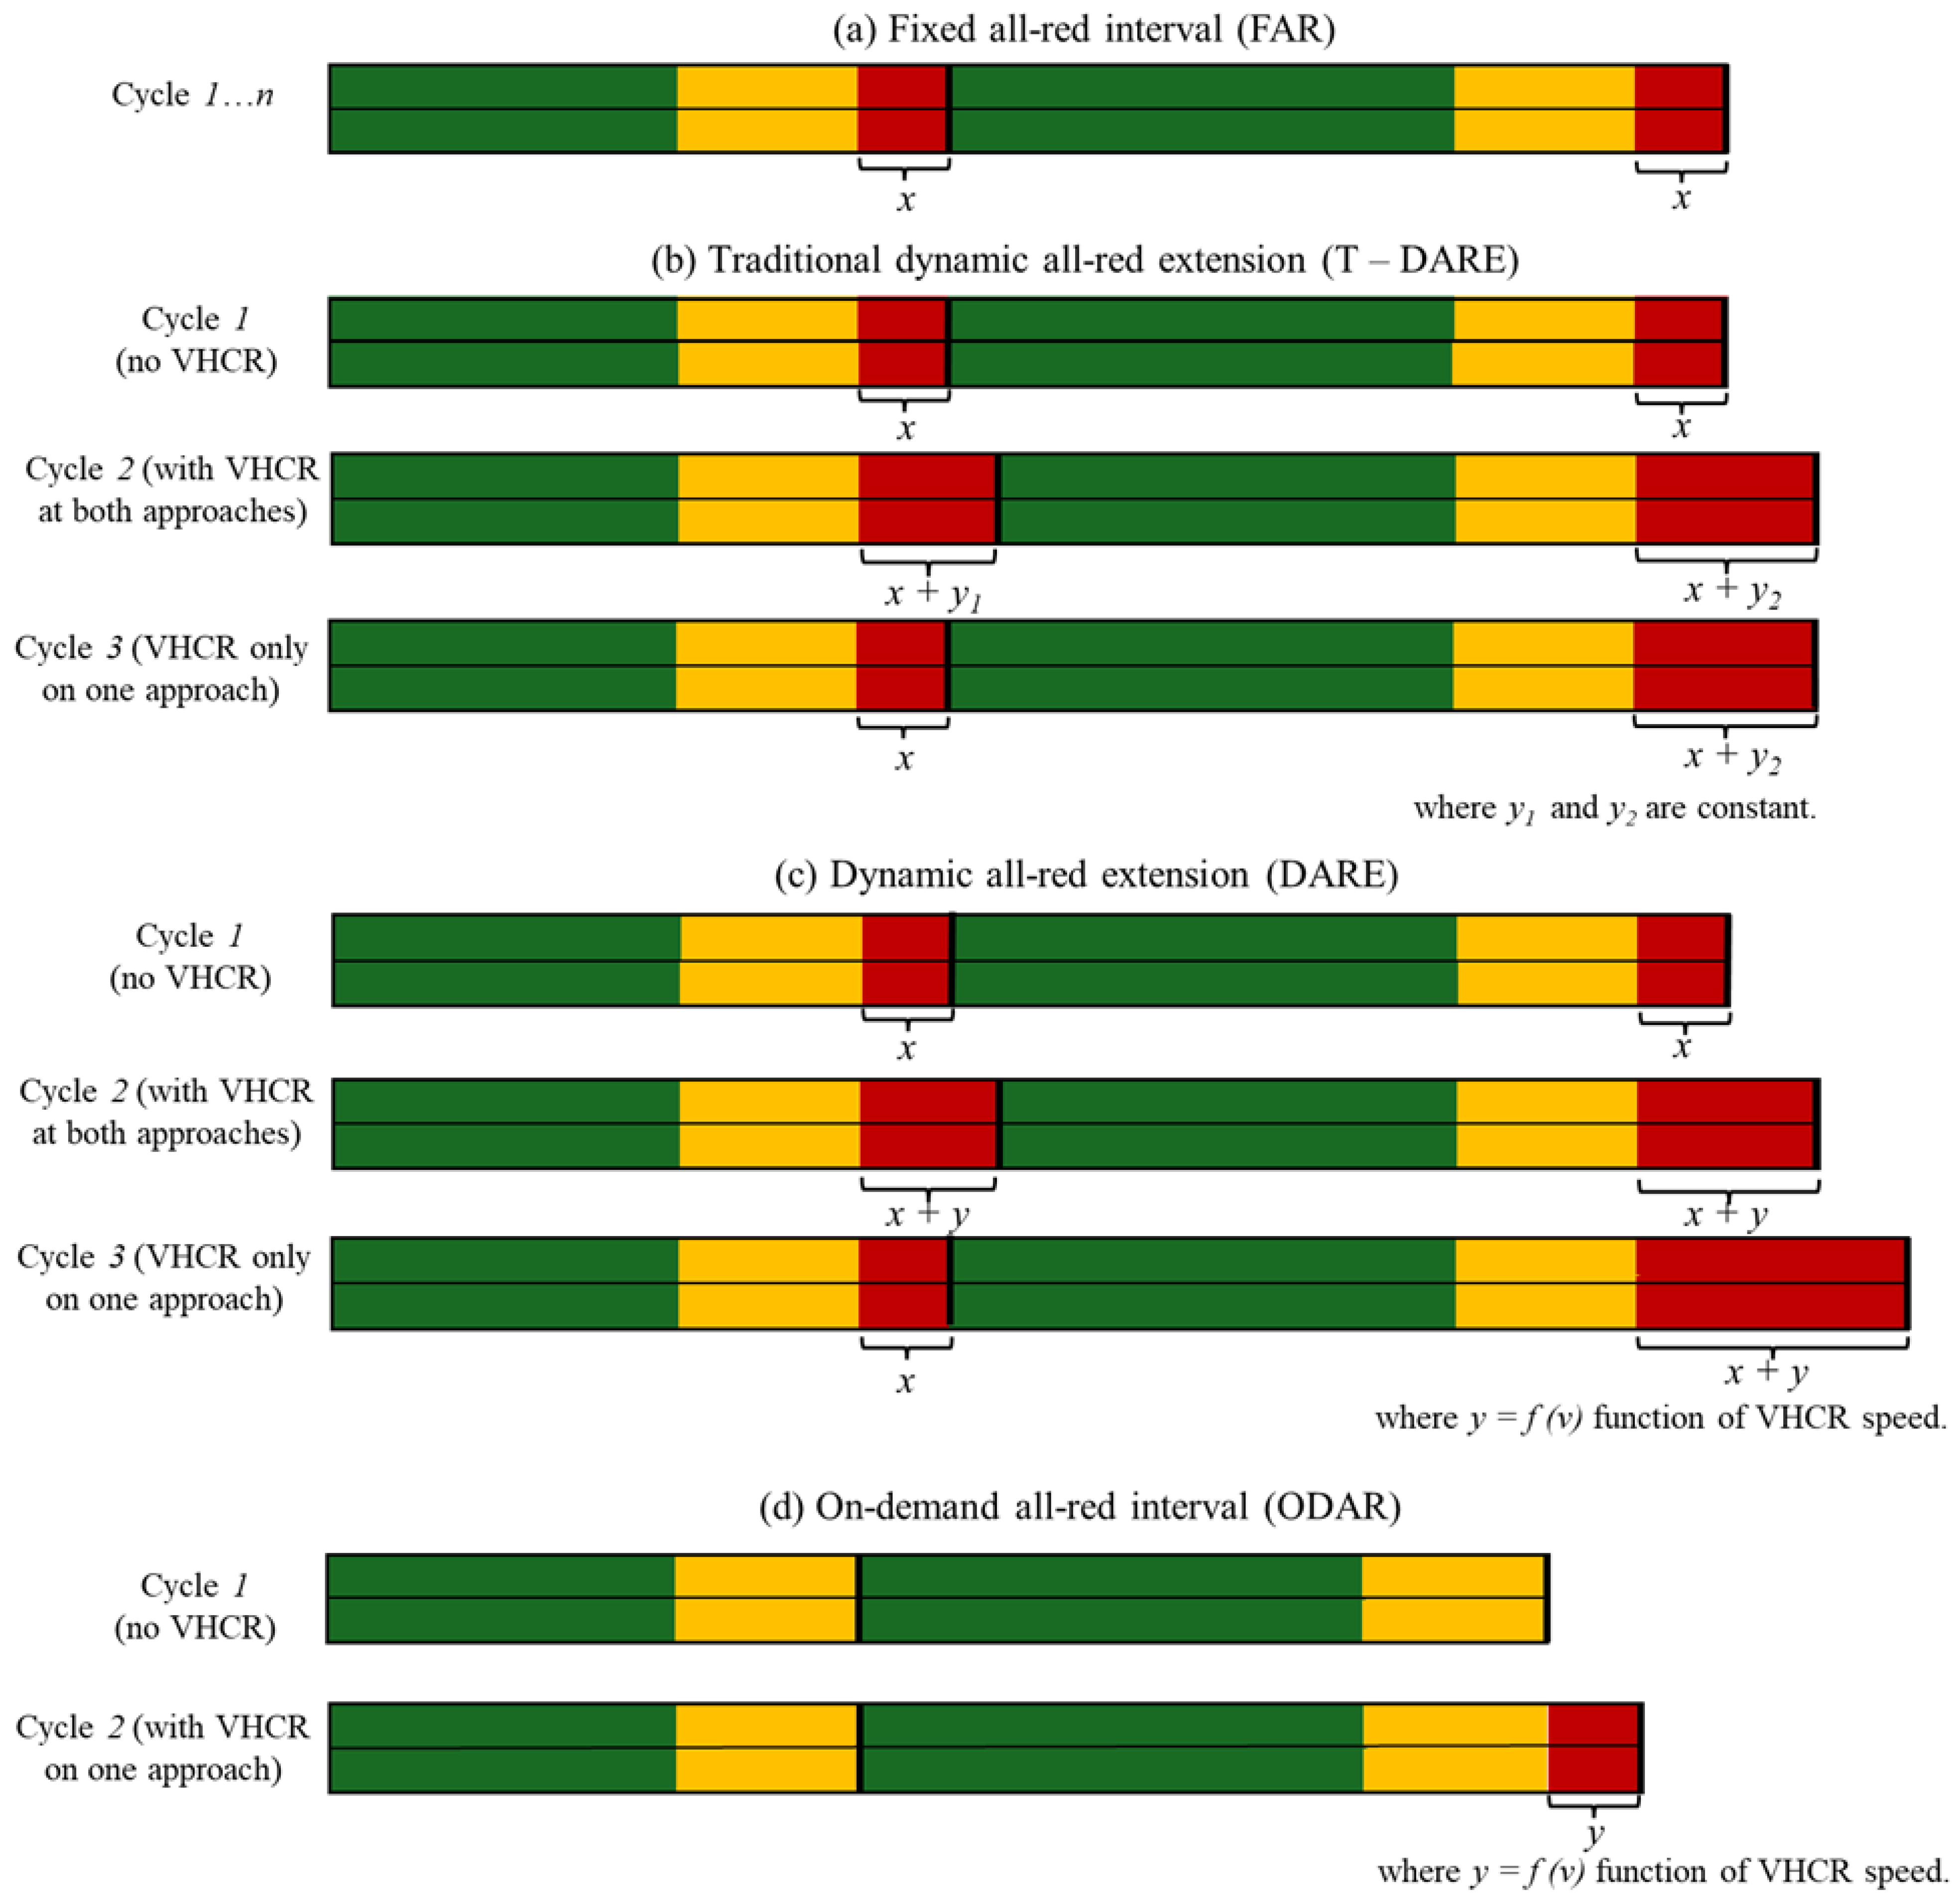
- Fixed all-red (FAR) method: the all-red interval is the same every cycle (in Figure 1 presented as x), and it is calculated by practitioners during preparations of signal timing plans.Figure 1. Schematic representation of the analyzed all-red systems.
- Traditional ‘dynamic’ all red extension (T-DARE) system: the all-red interval is the same for each cycle (in Figure 1 presented as x) and is extended for a fixed number of seconds when a VHCR is detected on both intersection approaches (in Figure 1 presented as y1 and y2 for the two intersection approaches). In this system, the all-red extension is not calculated based on the vehicle’s speed and position or the time in the cycle when VHCR detection occurs; instead, it is a fixed value of time. While this method offers a degree of ‘dynamic safety’, it has several limitations, as it assumes that the same extension time will suffice for vehicles running the red light at different speeds.
- Dynamic all-red interval (DARE) system: the system operates by dynamically extending the all-red clearance interval at signalized intersections when it detects a vehicle likely to violate the red signal. This extension provides additional time for the offending vehicle to clear the intersection before the next phase receives a green indication, thereby protecting vehicles entering the intersection on the cross street. DARE needs user-programmable logic to process the inputs from the inductive loops and decide whether to extend the all-red interval based on the detected speed of the approaching vehicle (in Figure 1 presented as y = f (v)). The system calculates the necessary extension of the all-red interval based on the speed, position of the detected vehicle, and time in the cycle when the detection happened. However, the DARE system relies on the accuracy of its predictions of which vehicle will run the red light. Furthermore, the DARE system uses the red clearance times and additional extensions, which increases the delays at the intersections.
- On-demand all-red (ODAR) system: the system proposed in this study eliminates the all-red interval from the signal timing plan and adds it only when necessary due to the detection of a vehicle running a red light or yellow light. Similar to DARE, this extension provides a safety buffer to prevent collisions due to red-light running. In our system, an all-red interval is triggered only if a vehicle is detected passing through the intersection during the yellow light phase. If a vehicle enters the intersection during the yellow interval, it is classified as a VHCR, indicating that additional red clearance time is required to enhance safety. In this case, the dynamic extension is a function of the VHCR vehicle speed (in Figure 1 presented as y = f (v)). If no vehicle enters on yellow, then no extended red clearance is required. The necessary red time is calculated using the speed of the vehicle, assuming the vehicle continues at a constant speed, the intersection width, and the vehicle length as given in the MUTCD:where W is the intersection width in meters, is the length of the vehicle, and represents the speed of the vehicle. To increase the applicability of the system, the vehicle length is assumed to be the same for every vehicle, set at 5 m. The minimum all-red time is set to 0 s, and the maximum all-red time is set to 6 s for the sake of this study. Additionally, the calculated all-red time is rounded to have only one decimal place.In this study, a uniform vehicle length of 5 m was assumed to simplify the real-world variability in vehicle dimensions and to focus on evaluating the core ODAR control logic. While this assumption is representative of the majority of passenger vehicles, it may underestimate the required clearance time for longer vehicles such as trucks or buses. Future work would address this limitation by incorporating vehicle-class–specific lengths or real-time vehicle dimension estimates obtained from advanced detection technologies, enabling more precise and adaptive clearance time calculations.
In the proposed ODAR implementation, vehicle detection is performed at the approach lane associated with each signal head using link-based monitoring rather than fixed-distance point detectors. A vehicle is considered to have “passed” the intersection when it is present on the signal-head approach during the yellow interval and subsequently departs the lane, indicating a committed stop-line crossing. As a result, the exact detection location depends on the geometric length of the approach link and is not tied to a predefined dilemma-zone boundary. The main novelty of the ODAR system is that it does not rely on the prediction of driver decision-making but instead depends on accurate detection of vehicle behavior. Using parameters defined in Equation (1), which can be obtained through video-based detection systems, ODAR identifies the specific cycles and signal phases that require an all-red interval. Unlike DARE, which applies all-red extensions based on anticipation of unsafe clearance using arrivals during the yellow interval, ODAR triggers all-red activation only after a vehicle has been observed entering the intersection. This event-confirmation-based logic places ODAR downstream of the dilemma zone and avoids prediction-based extensions that may occur when vehicles ultimately stop safely.
3.2. Testbed Microsimulation Model and Setup of Driver’s Response Model in Vissim
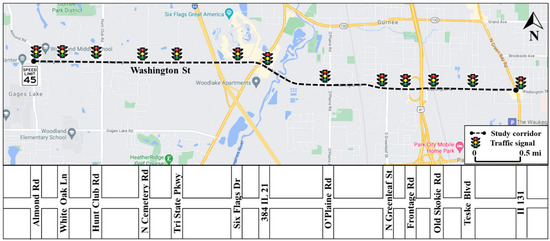
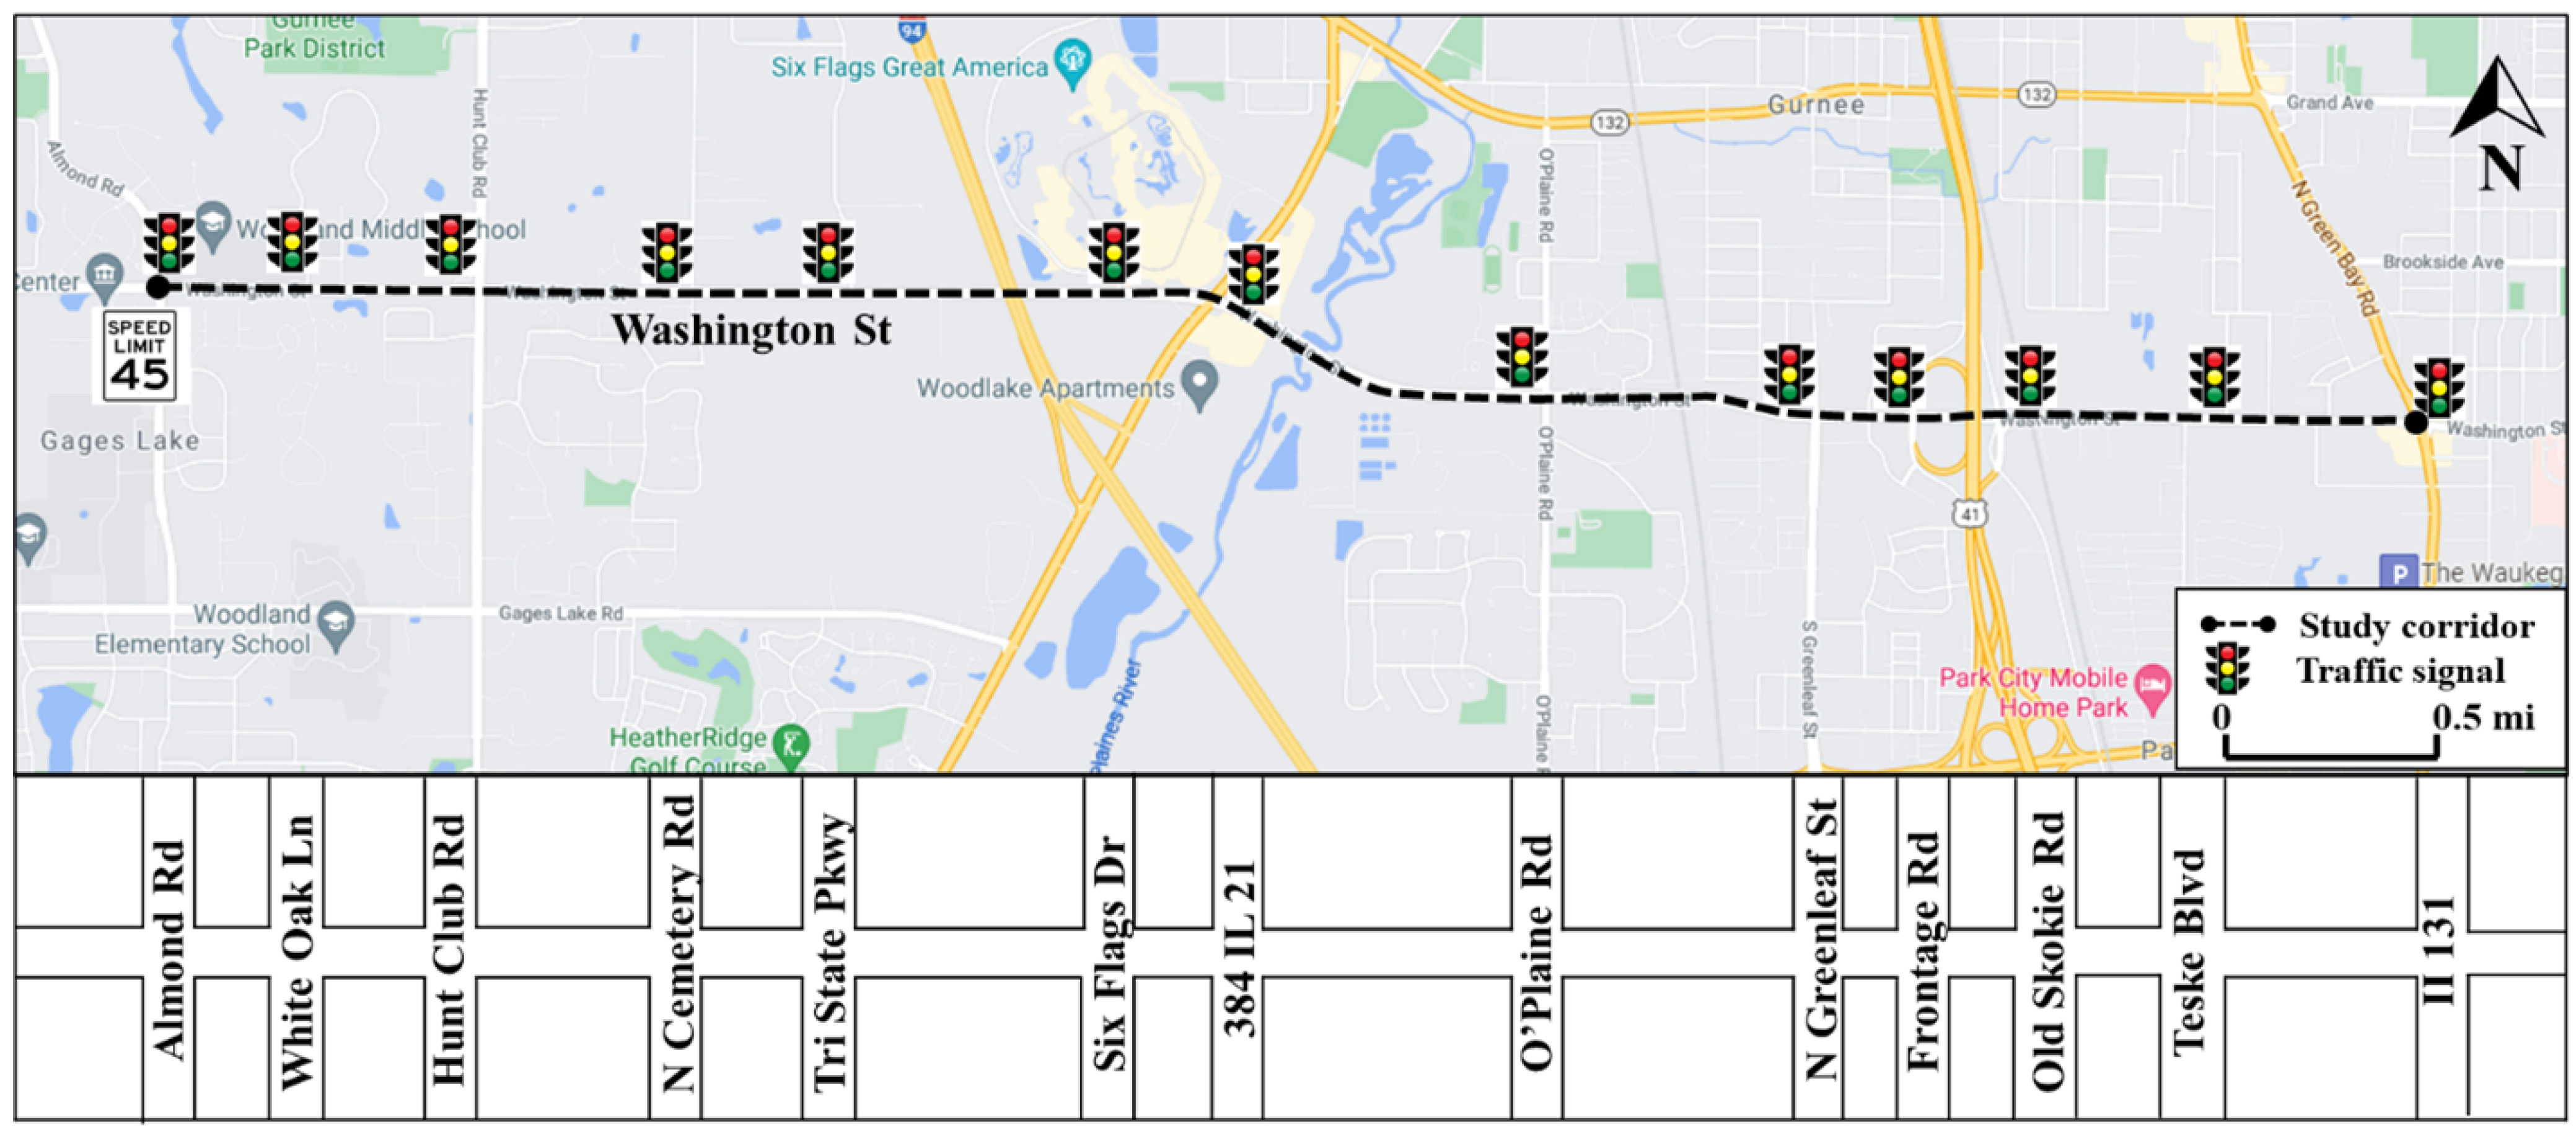
The arterial network of Washington Street (Lake A22) in Lake County, Chicago, IL, the United States, was selected as the test site for the proposed methodology. This network comprises thirteen signalized intersections, as illustrated in Figure 2. The posted speed limit on Washington Street is 45 mph. The developed microsimulation model was calibrated to closely replicate the actual traffic conditions observed along Washington Street during the PM peak hour.
Figure 2.
Testbed corridor.
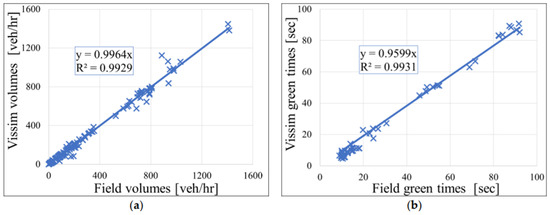
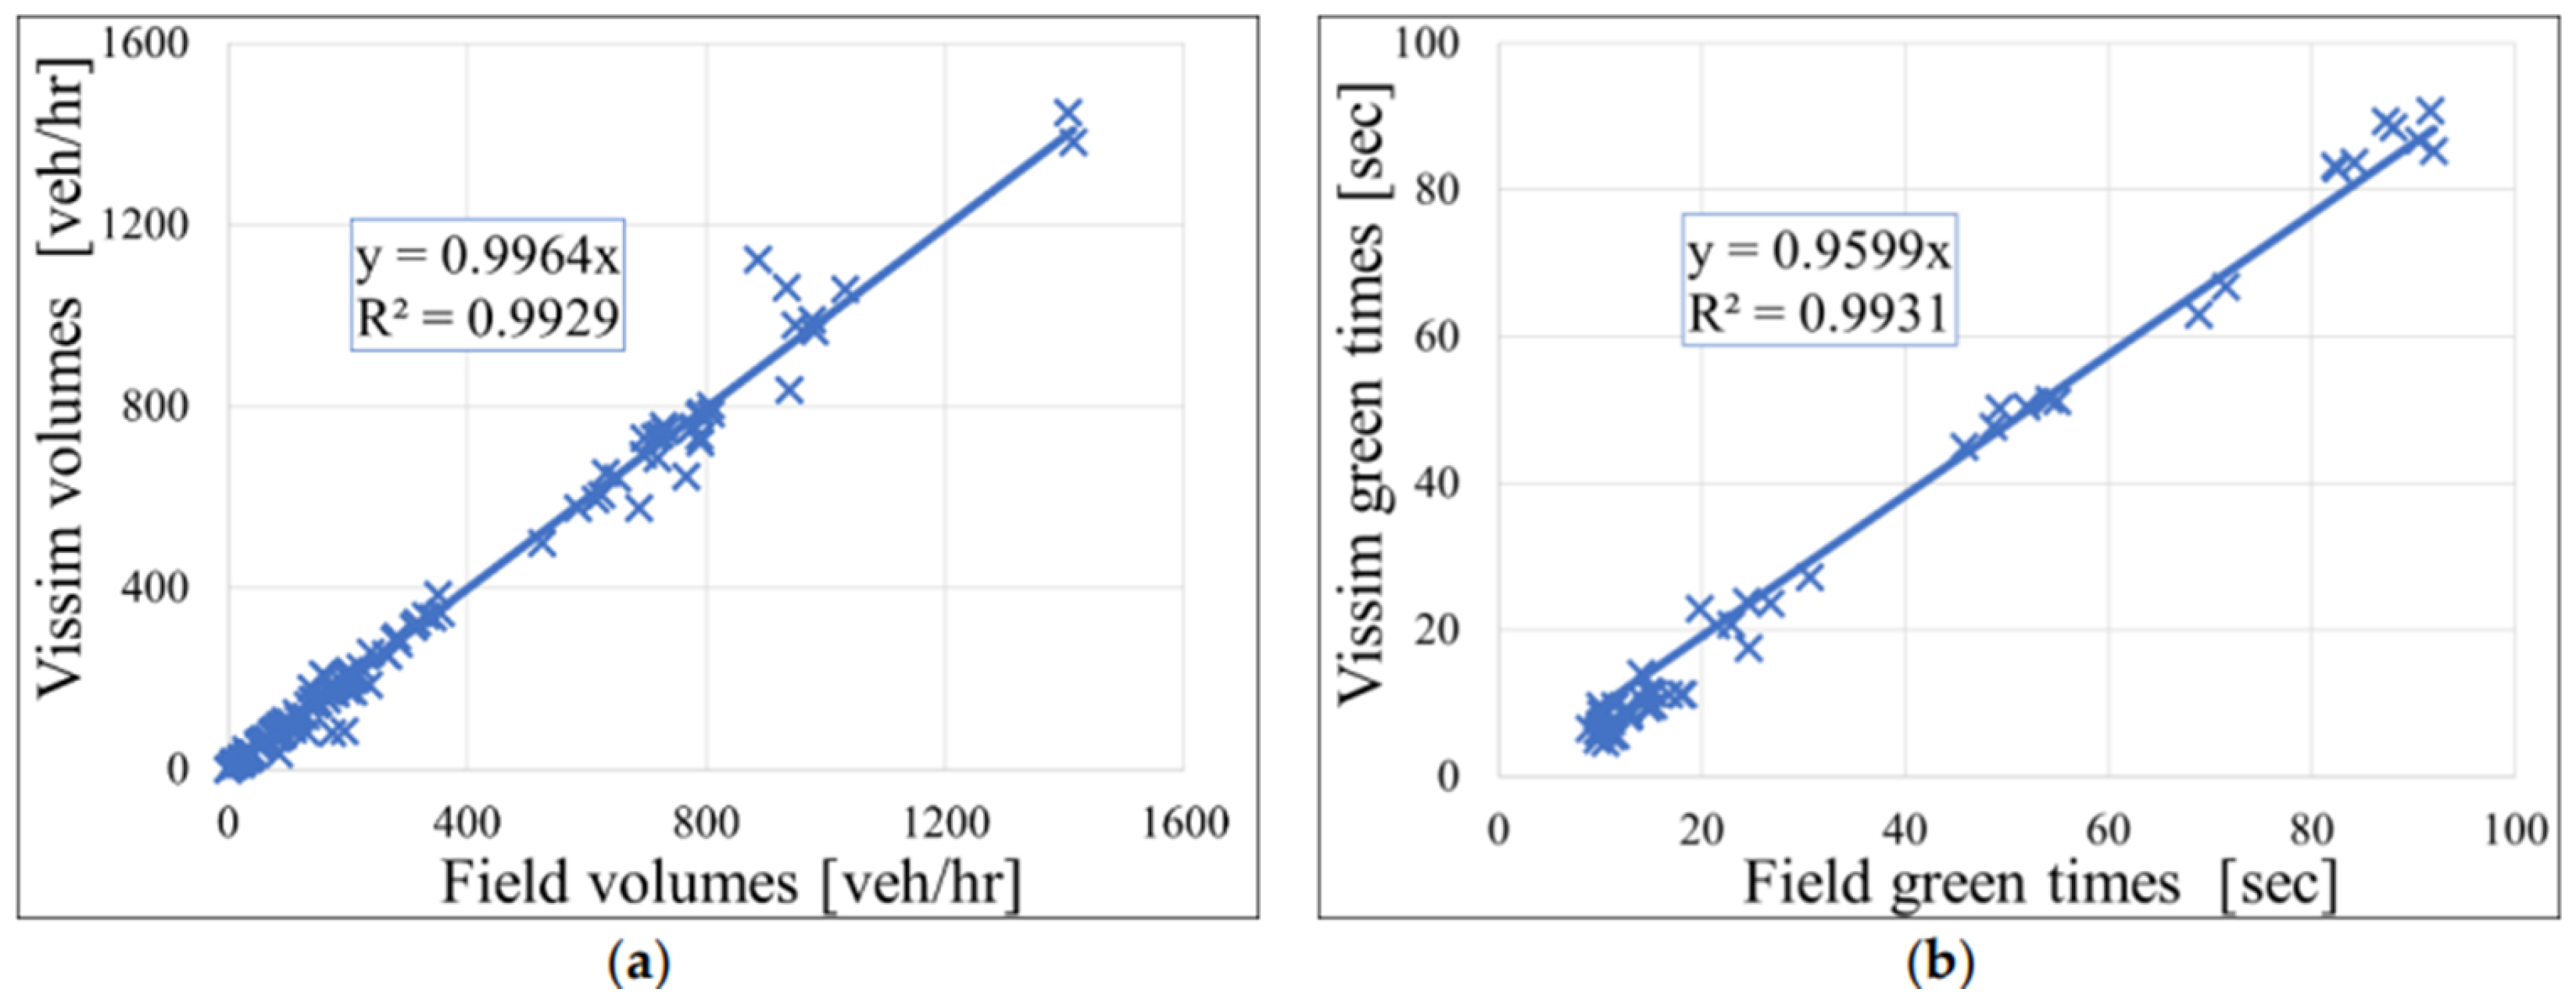
This model was validated and calibrated, and has been applied in several previous studies [30]. The results of the calibration and validation are presented in Figure 3. As observed, the utilized model closely replicates field conditions, exhibiting high values for both traffic volumes and green times per phase.
Figure 3.
Calibration and validation results: (a) traffic volume per movement; (b) average green time per phase.
Modeling red-light runners and arrivals on yellow is not feasible in Vissim without incorporating a driver response model. Within Vissim’s Driving Behavior settings, a section is dedicated to traffic signals, offering two behavioral models for handling the yellow indication. The first, known as the Continuous Check model, is the default. With this driving behavior selected, drivers in Vissim continuously assess whether their vehicle can stop or proceed based on its speed. However, such stop-or-go decisions are typically modeled using statistical formulations [18]. This behavior can alternatively be represented in Vissim using the One Decision setting.
The default One Decision behavior assumes that drivers evaluate the signal state once and maintain that decision until reaching the stop line. The One Decision model employs the logistic regression formulation shown in Equation (2):
In Equation (2), p corresponds to the probability of passing the stop line after yellow onset, v represents the vehicle speed (m/s), and denotes the distance (m) from the vehicle to the stop line. The model includes three parameters, , , and . Larger parameter values make it less likely for a vehicle to stop at a yellow indication. As explained by Hadi et al. [18], these parameters play a crucial role in determining the likelihood of a driver choosing to “stop” or “go”, thereby influencing the probability of a red-light violation.
Considering that one of the objectives of this study is to evaluate safety across various all-red strategies, the microsimulation model was recalibrated to more accurately reflect real-world driver behavior on a yellow signal state. The primary goal of this recalibration was to replicate realistic proportions of red-light running (RLR) events observed under field conditions. Field RLR data were obtained from the Miovision platform, focusing on daytime conditions over a one-year period. These data were available for seven intersections within the study network. Accordingly, the parameters , , and in the One Decision model were iteratively adjusted to achieve comparable RLR percentages between the simulation and field observations, ensuring that the modeled driver behavior realistically represents observed tendencies to stop or proceed during the yellow interval. Table 1 presents the default RLR percentages from the simulation before calibration, after calibration, and from the field observations.
Table 1.
Comparison of RLR percentages before and after calibration.
After multiple iterations, achieving an exact match between simulated and field-observed RLR percentages at every intersection was not feasible. For instance, at Intersections 1 and 9, the field data indicated very low proportions of red-light running, whereas further adjustment of the parameters in the One Decision model could not fully reduce RLR occurrences to that level in the simulation. Nonetheless, the recalibrated model substantially improved the alignment between simulated and field-measured RLR rates across most intersections, particularly at Intersection 3 and 10, thereby enhancing the behavioral realism of the microsimulation.
3.3. Software-in-the-Loop Simulation
The experiments are conducted in SILS using the Q-Free Maxtime Windows emulator. The traffic controller option in Vissim is set to an external controller, and the connection to the Q-Free Maxtime Emulator is established using Dynamic Link Library (.DLL) files provided by Q-Free.
In Maxtime controllers, similar to other NEMA controllers, red clearance (all-red) extension is available. Two steps are required: First, the signal timing plans menu must be opened, and the phases to be modified should be listed. It is possible to add both ‘Red Clearance Extension Passage Time’ and ‘Maximum Red Clearance Time’ to the list. The red clearance (all-red) extension timer is set to this value when a vehicle triggers the all-red extension.
The all-red interval will then be extended until the extension timer expires or the ‘Red Clearance Extension Max’ is reached. If using vehicle detectors with the Red Clearance Extension option, the extension is triggered when any of the assigned Red Clearance Extension detectors is actuated during the red clearance interval. The maximum amount of time that all-red may be extended to accommodate late-arriving vehicles can be as long as the sum of ‘Red Clear’ and ‘Max Red Clear Ext’. For example, if the Red Clearance Time is 1 s and the Max Red Clearance Extension Time is set to 2 s, then the total all-red time would be 3 s.
In the proposed ODAR implementation, the ‘Red Clearance Time’ was set to 0.3 s due to a controller limitation that prevents setting this value to 0 s. The dynamically calculated all-red extension duration is mapped to the controller using the ‘Red Clearance Extension Passage Time,’ which is initially set to 0.3 s and actuated through the Vissim COM interface. When a vehicle arrival during the yellow interval is detected through link-based lane monitoring, the ODAR logic programmatically actuates the assigned red-clearance detectors within the controller using COM-based commands. This detector actuation mimics field detector calls and triggers the Red Clearance Extension functionality in the controller. The controller then maintains the all-red indication until the dynamically calculated extension time expires or the predefined maximum red-clearance extension limit is reached, after which normal signal operation resumes.
Additionally, detectors used for all-red extension should be assigned Maxtime controllers allow detectors to perform multiple tasks, making it possible to use existing detectors for all-red extension. New features can be added to a detector, or a new detector can be assigned for all-red extension via the Vehicle Detector Options menu.
3.4. Experimental Setup
Four all-red methods, as described previously, were tested on the arterial network in Lake County, IL: Fixed All-Red (FAR) interval, Traditional Dynamic All-Red Extension (T-DARE), Dynamic All-Red Interval (DARE) Extension, and On-Demand All-Red (ODAR) Extension.
Furthermore, the T-DARE method was evaluated using two fixed extension settings, 1 s and 2 s. Similarly, the ODAR method was tested with the same two fixed extension time settings, in addition to a dynamic calculation of the necessary all-red time based on the speed of the approaching vehicle with high crash risk (VHCR).
Each scenario was simulated using the calibrated traffic data. Every simulation run included a 900 s warm-up period followed by a 3600 s data collection period. To account for stochastic variability, each scenario was executed under five different random seeds, ensuring statistical robustness of the results. The vehicle trajectory files (.trj) were exported from Vissim and processed in the Surrogate Safety Assessment Model (SSAM) to estimate surrogate safety measures. In addition, traffic signal change logs (.lsa files) were collected to analyze signal operations under various all-red strategies.
Performance Metrics
To assess the impact of various all-red interval methods, we utilized several commonly used performance metrics.
Average vehicular delay () is defined as the sum of each vehicle’s difference between the measured travel time and the free-flow travel time, divided by the total number of vehicles that passed through the intersection during the simulation period, as shown in Equation (3).
where represents the free-flow travel time of vehicle i, is the actual travel time of vehicle i, and N is the total throughput, the number of vehicles that successfully passed through the intersection during the analysis period.
Total throughput refers to the total number of vehicles that pass through the intersection during the simulation period.
The Surrogate Safety Assessment Model (SSAM) was developed to estimate the frequency and severity of various types of conflicts by utilizing simulated vehicle trajectories [31,32]. SSAM is a well-established tool that has been applied in numerous safety studies [33,34,35,36].
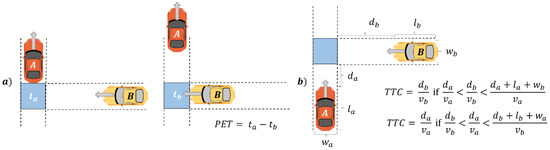
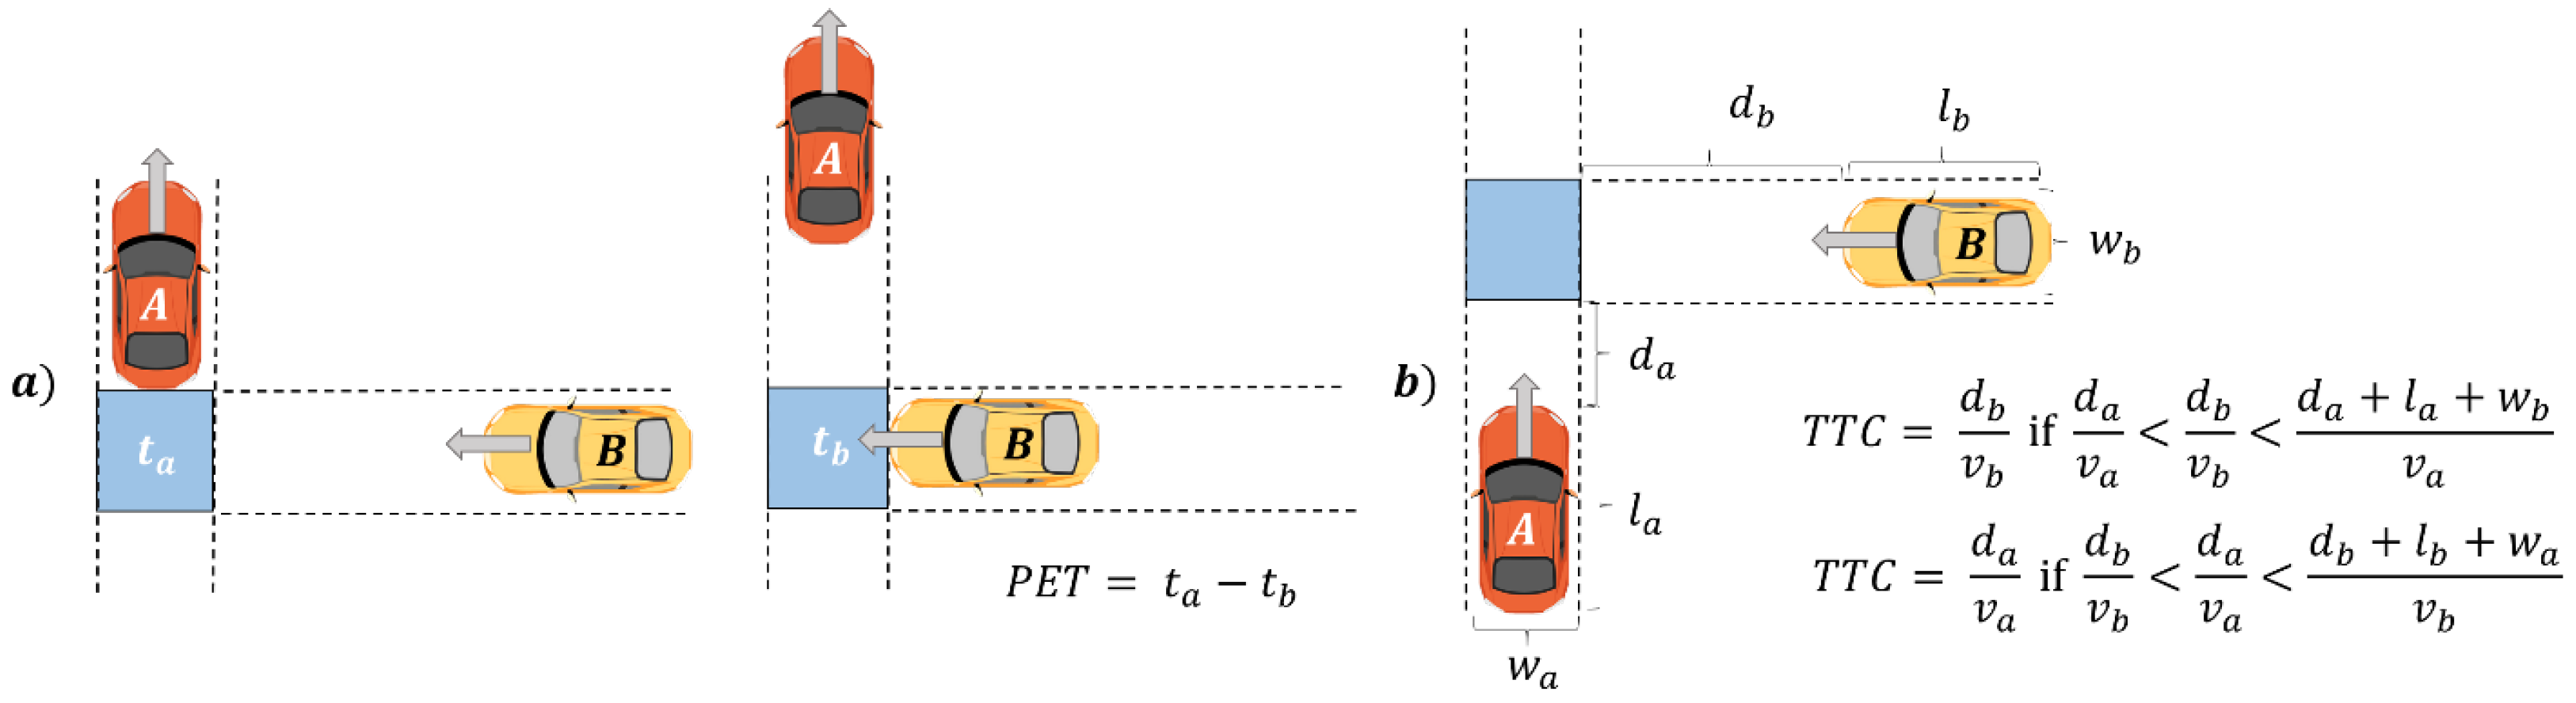
Two key parameters utilized by the model are Post-Encroachment Time (PET) and Time-to-Collision (TTC). PET measures the minimum time interval between when one vehicle leaves a potential conflict point and another vehicle arrives at that same point. If PET values fall below the default threshold in SSAM, there exists a potential risk of collision. Figure 4 illustrates the concepts of PET and TTC.
Figure 4.
(a) Post-encroachment time (PET) and (b) Time-to-collision (TTC).
TTC represents the minimum time remaining before two vehicles would collide if they continued along their current trajectories while maintaining their speeds. Similarly, when TTC values fall below the default threshold in SSAM, the risk of collision increases significantly. SSAM uses default threshold values of 1.5 s for TTC and 5 s for PET. These values have been identified as effective thresholds for high-risk conflict analysis through SSAM [31,35]. Therefore, these thresholds were adopted in this study.
4. Results
The implemented all-red strategies employ distinct mechanisms aimed at mitigating collisions involving vehicles with high collision risk (VHCR). To capture both efficiency and safety, a comprehensive analysis was conducted to reflect a broader traffic context. Accordingly, this section presents an in-depth analysis of the ODAR—a fully dynamic system that eliminates fixed all-red periods and activates and extends the clearance interval adaptively based on real-time VHCRpresence, and a comparison against the traditional FAR—the traditional fixed all-red treatment; and DARE—an approach based on fixed all-red intervals with the potential for extension when a VHCR is detected.
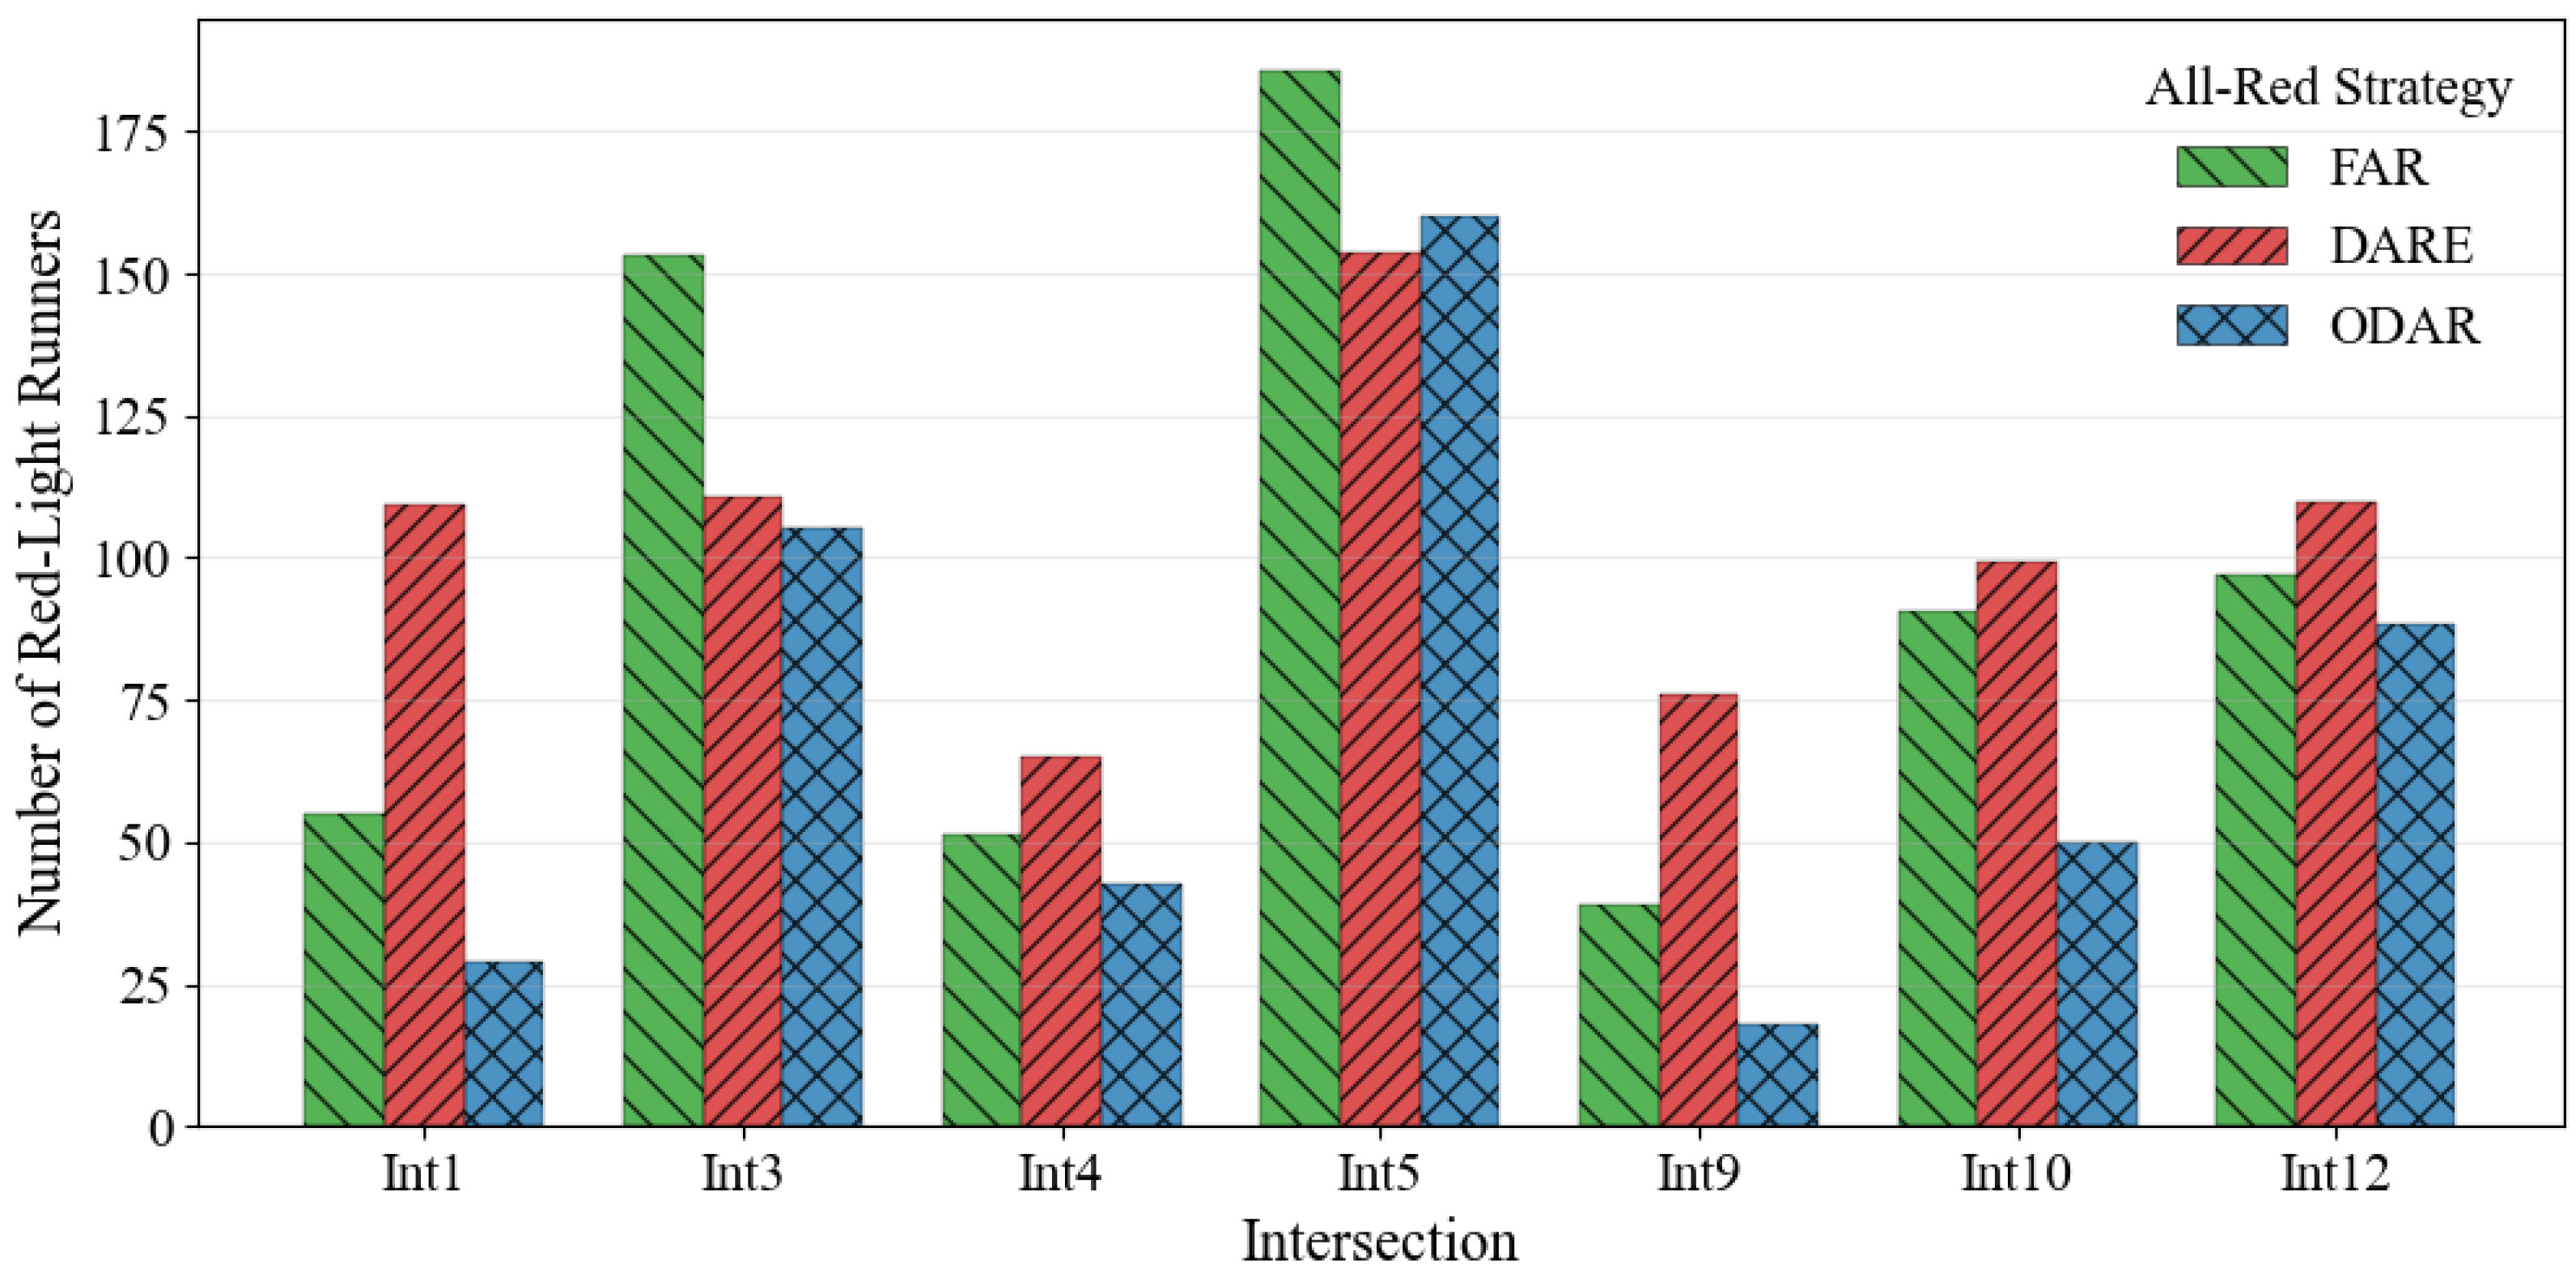
Given that these strategies primarily target potential conflicts arising from red-light running (RLR), the analysis begins with an evaluation of RLR frequency across the study intersections under each all-red strategy. The following figure (Figure 5) summarizes the number of RLR incidents for three representative all-red strategies.
Figure 5.
Number of RLR events across intersections and all-red strategies.
In Figure 5, the all-red strategies demonstrate noticeable variability in their impact on red-light running (RLR) across the study intersections. The ODAR strategy, with its on-demand dynamic all-red extension, resulted in a lower number of RLR events at most of the studied intersections compared with the traditional FAR approach and DARE strategy. No single strategy consistently performs as a strategy that produces the least or the highest number of RLR, indicating that other factors at each intersection influence driver response to yellow and red indications as well.
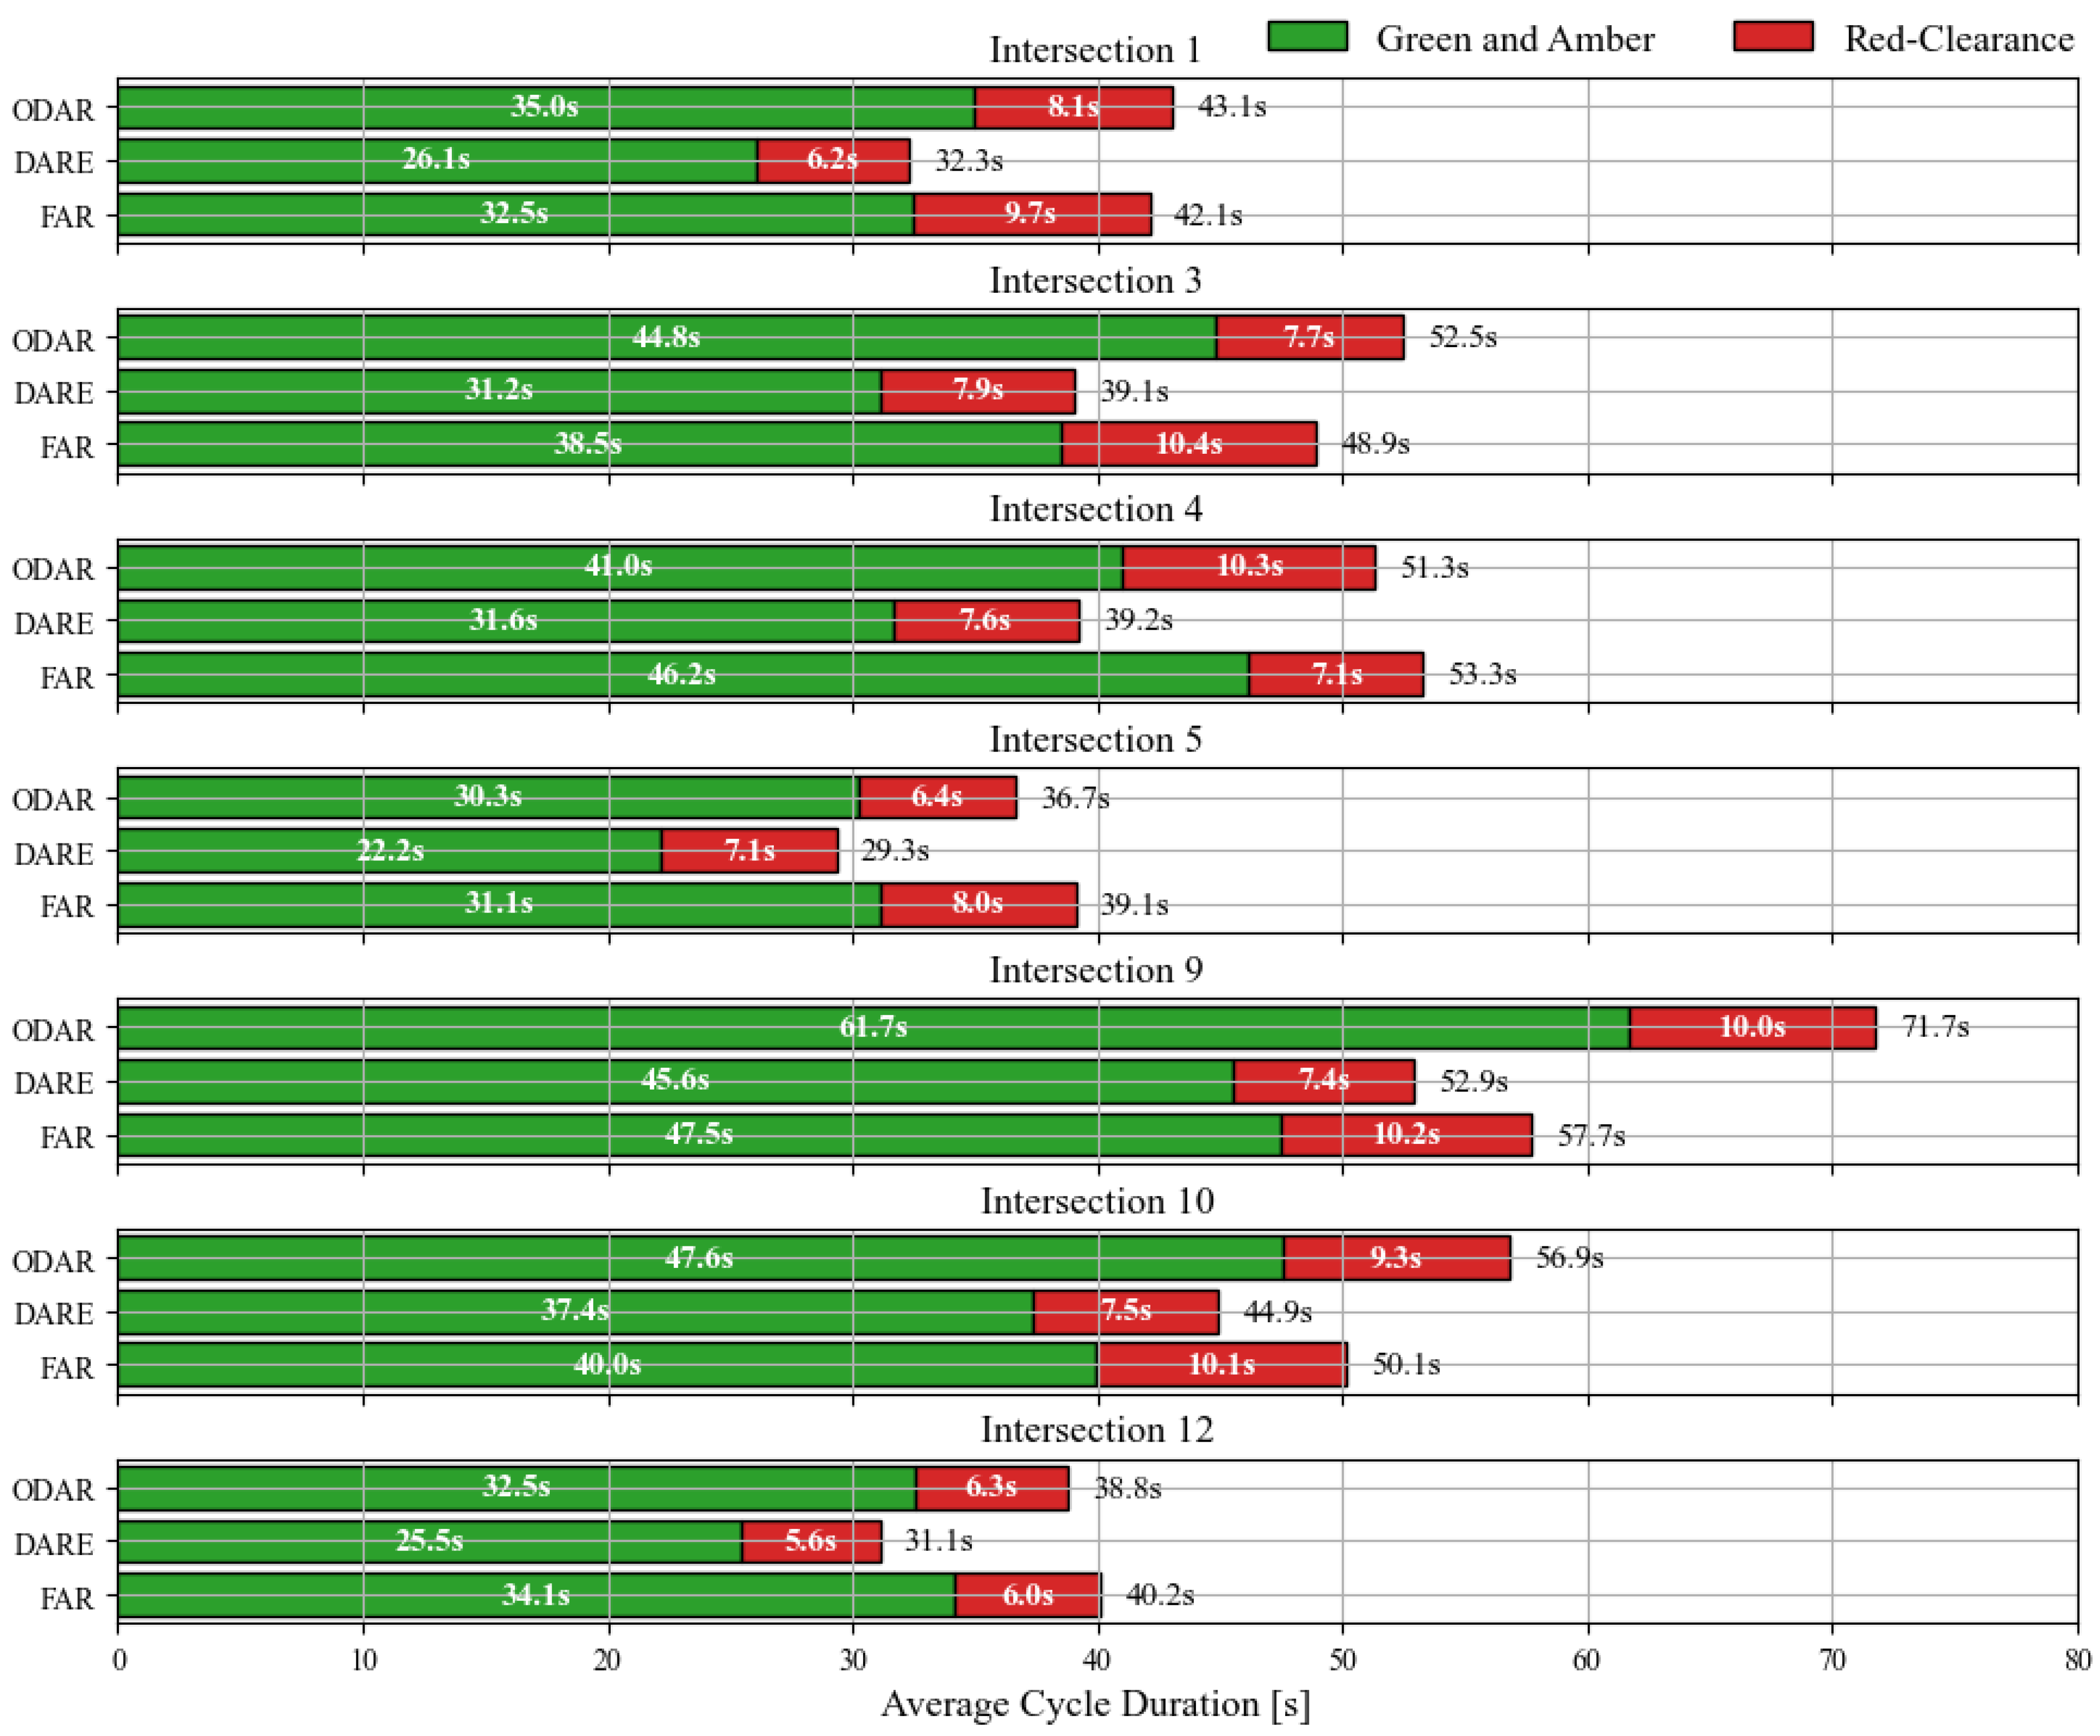
Since each strategy inherently modifies the red-clearance duration and the overall signal cycle length, additional analysis was performed to better understand how these operational differences influence the observed RLR patterns and subsequent results. To gain deeper insight into these underlying mechanisms, the subsequent section evaluates the average cycle length and average all-red duration per cycle for each strategy across all study intersections, Figure 6.
Figure 6.
Average Cycle Length and Average Red Clearance Across study Intersections and all-red strategies.
As shown in Figure 6, even though the initial cycle lengths were set equally for all intersections, the average cycle lengths differed across locations and strategies. The DARE system consistently produced the shortest average cycle lengths. In contrast, the average all-red intervals varied among both strategies and intersections, with no single approach consistently producing the highest or lowest all-red intervals.
Considering that the corridor operates in actuated-free mode, such variability is anticipated, as actuated control inherently produces stochastic arrival patterns that substantially affect both cycle lengths and all-red interval durations. Examining these dynamics at the individual-intersection level provides a more precise evaluation of the performance of each all-red strategy. Nonetheless, due to the absence of comprehensive field data for all intersections, and because the present analysis did not encompass the entire corridor or the interdependence of trajectories across locations, a more exhaustive investigation of these effects is deferred to future work supported by additional field observations.
At Intersection 5, which recorded the highest number of RLR events among all studied locations (Figure 5), all-red strategies corresponded with the shortest average cycle length. In contrast, for example, at Intersection 9, where FAR and ODAR yielded the fewest RLR event among studied intersections, the system produced both the longest average cycle length and the longest all-red interval.
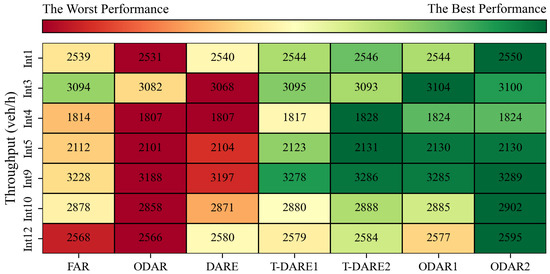
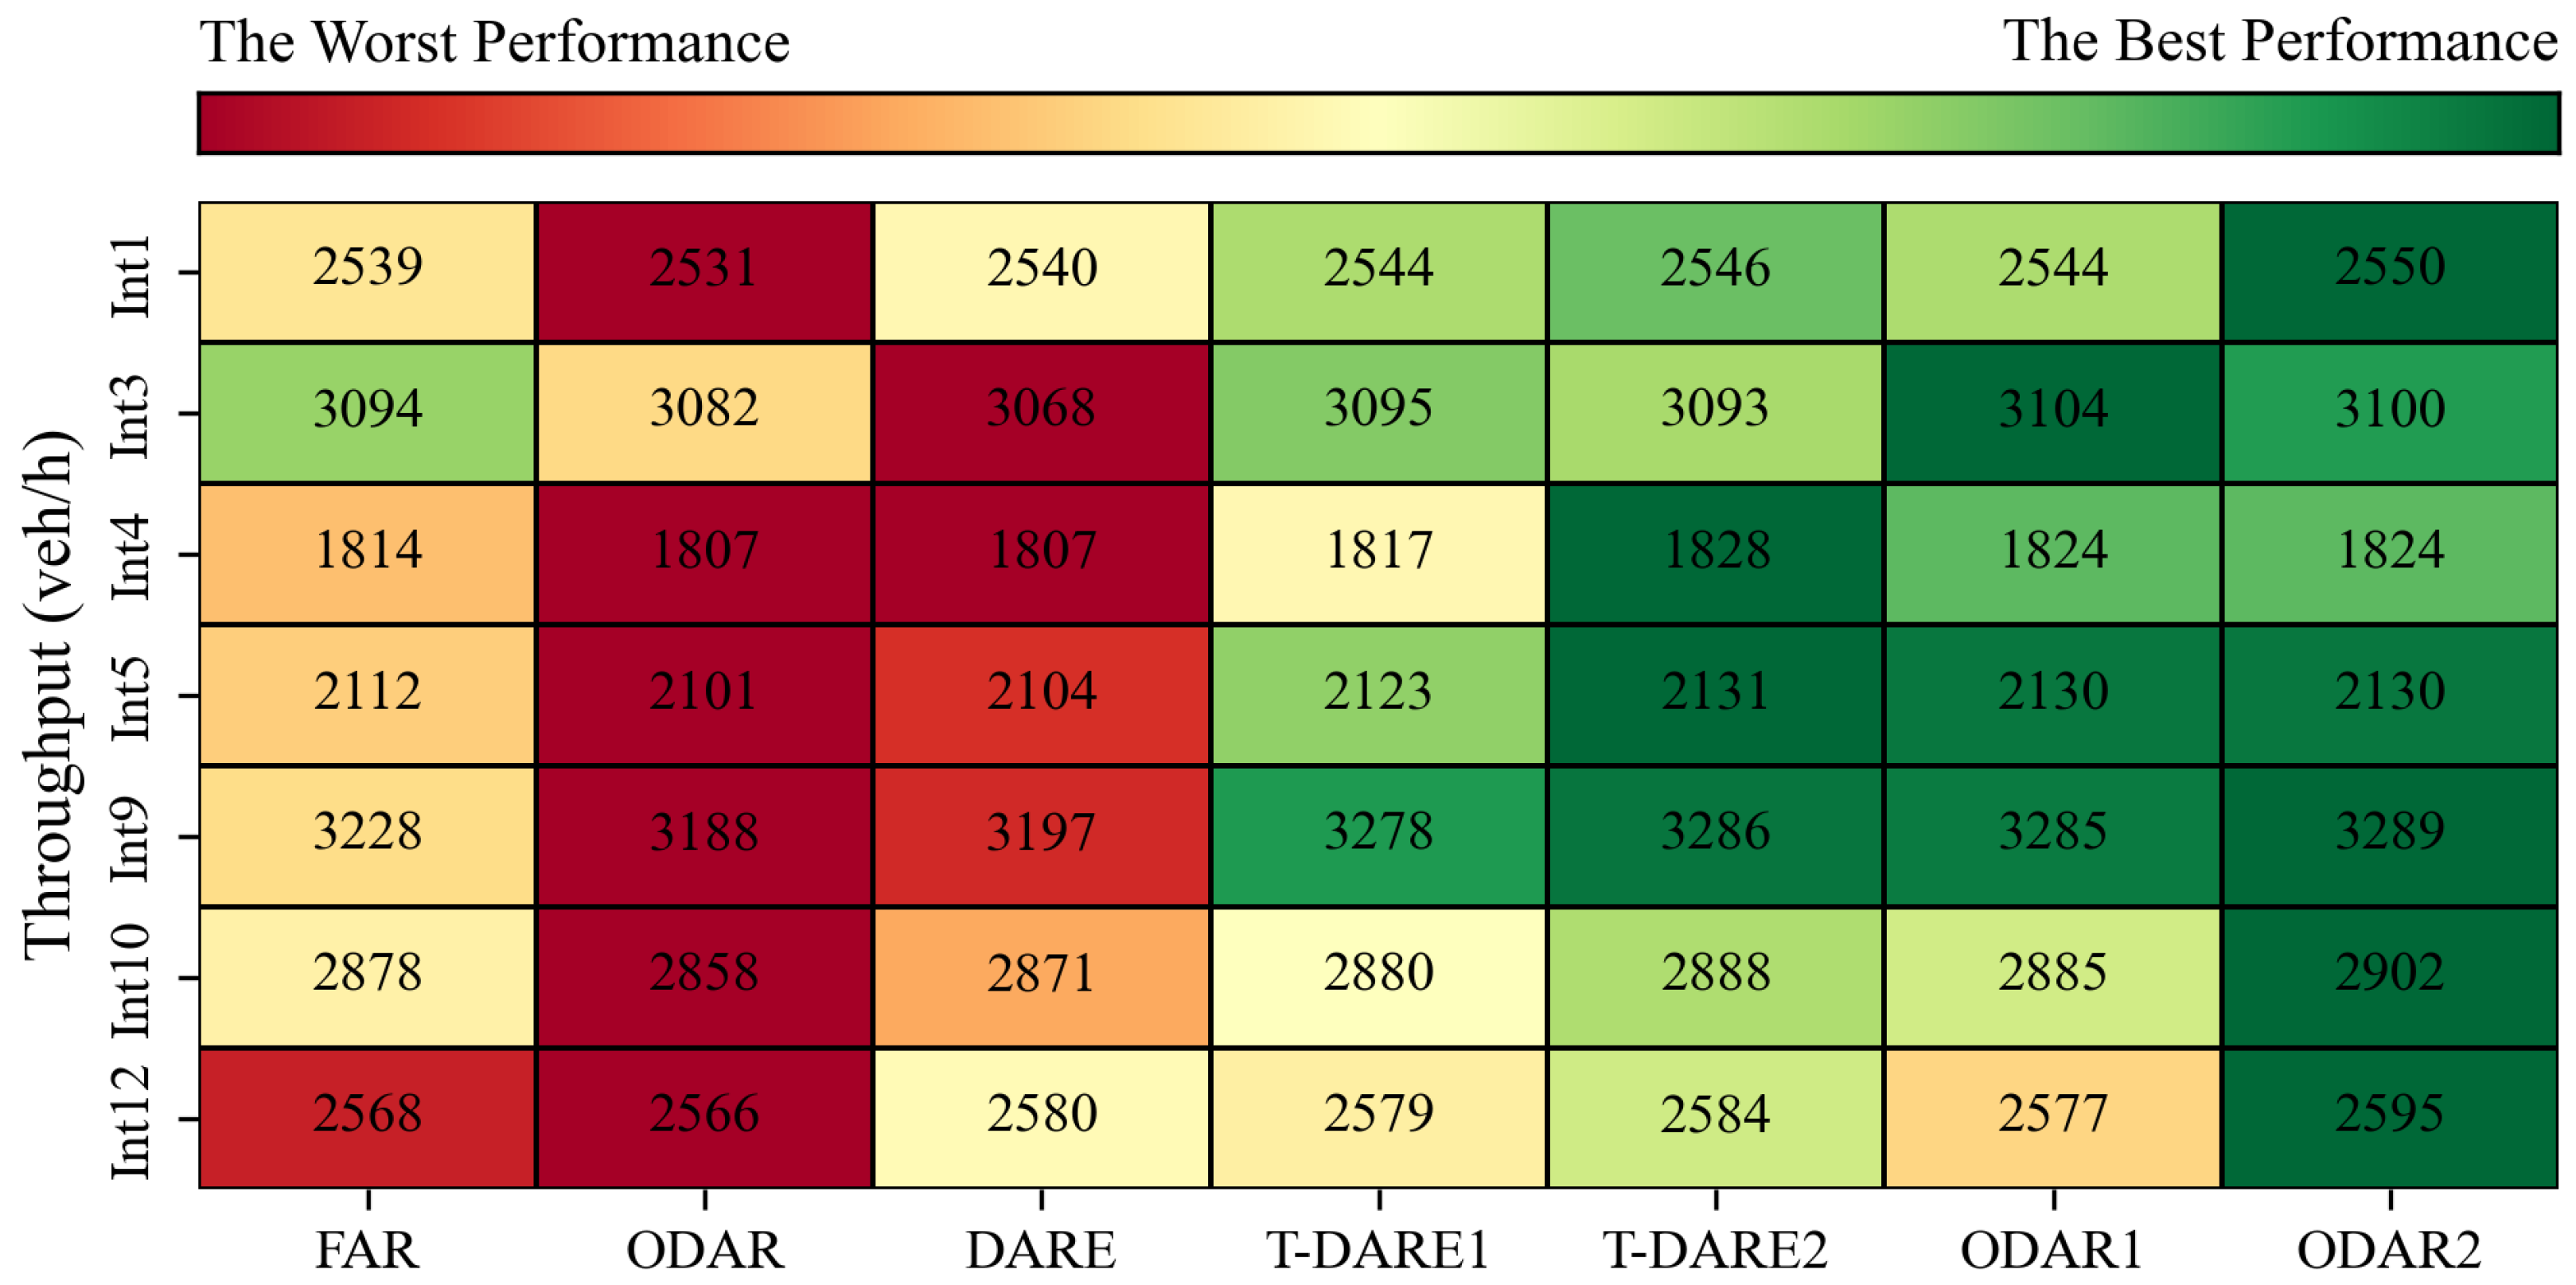
To gain a deeper understanding of the performance differences among the studied intersections, the intersection efficiency analysis begins with an evaluation of throughput across the various all-red strategies. Furthermore, to assess traffic signal control efficiency in greater detail, the analysis was expanded to include all-red extension strategies with fixed durations. Specifically, T-DARE1 and T-DARE2 extend the all-red phase by 1 or 2 s following VHCR detection, while ODAR1 and ODAR2 initially omit the all-red interval and subsequently activate 1- or 2-s extensions upon VHCR detection. Figure 7 presents a heat map table, where the green-colored cells indicate a better-performing all-red strategy for each corresponding intersection.
Figure 7.
Vehicle throughput (veh/h) for each all-red control strategy across intersections. Higher throughput values appear in green, while lower values appear in red.
From a traffic efficiency perspective, strategies with fixed-time extensions yielded the highest throughput across all intersections (Figure 7). In particular, ODAR with a 2 s fixed extension statistically outperformed DARE at every intersection (p < 0.05) and outperformed FAR at most intersections (p < 0.05), with the exceptions of Intersection 3 (p = 0.059) and Intersection 4 (p = 0.084). In contrast, the ODAR with dynamic extensions exhibited the lowest throughput across nearly all intersections, suggesting that excessive adaptive flexibility, allowing extended all-red intervals beyond 2 s may reduce throughput.
Similar patterns were observed with all-red extension strategies that include an initial fixed all-red interval, where the fixed-time strategies (T-DARE1 and T-DARE2) exhibited higher throughput compared to the dynamic all-red extension strategy (DARE).
Intersection 9 exhibited the highest throughput among all intersections, whereas Intersection 4 recorded the lowest (Figure 7). Comparing average cycle lengths and average all-red intervals (Figure 6), the higher traffic volume at Intersection 9 likely generated more detector calls and requests for green extensions, which explains the longer average cycle lengths observed. However, previous research [7] has shown that higher traffic volumes are often positively correlated with increased RLR frequency. This trend was not observed at Intersection 9, where field data (Table 1) indicate a lower driver propensity for red-light-running behavior. In this particular case, eliminating the all-red interval, under conditions with a low probability of RLR events, could potentially improve efficiency in terms of the number of served vehicles.
In this high-demand environment with a low likelihood of RLR events (Intersection 9), the ODAR strategy effectively demonstrated its adaptive capabilities, achieving a reduction in RLR events of more than 50% compared to FAR (Figure 5). Conversely, at intersections with significantly lower traffic demand, such as Intersection 4, ODAR also performed well, achieving a reduction in RLR events but without a significant increase in throughput (Figure 5). Additionally, at intersections with a higher likelihood of RLR events and high traffic demands (e.g., Intersection 3, Table 1), while both all-red extension strategies (DARE and ODAR) reduced the number of RLR events, neither strategy produced a statistically significant improvement in throughput compared to the traditional FAR strategy.
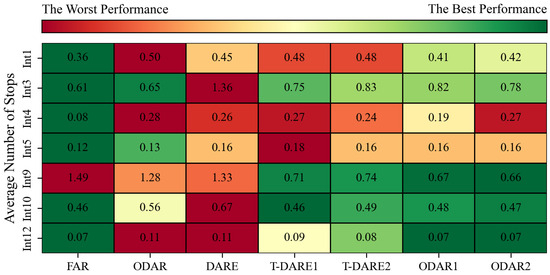
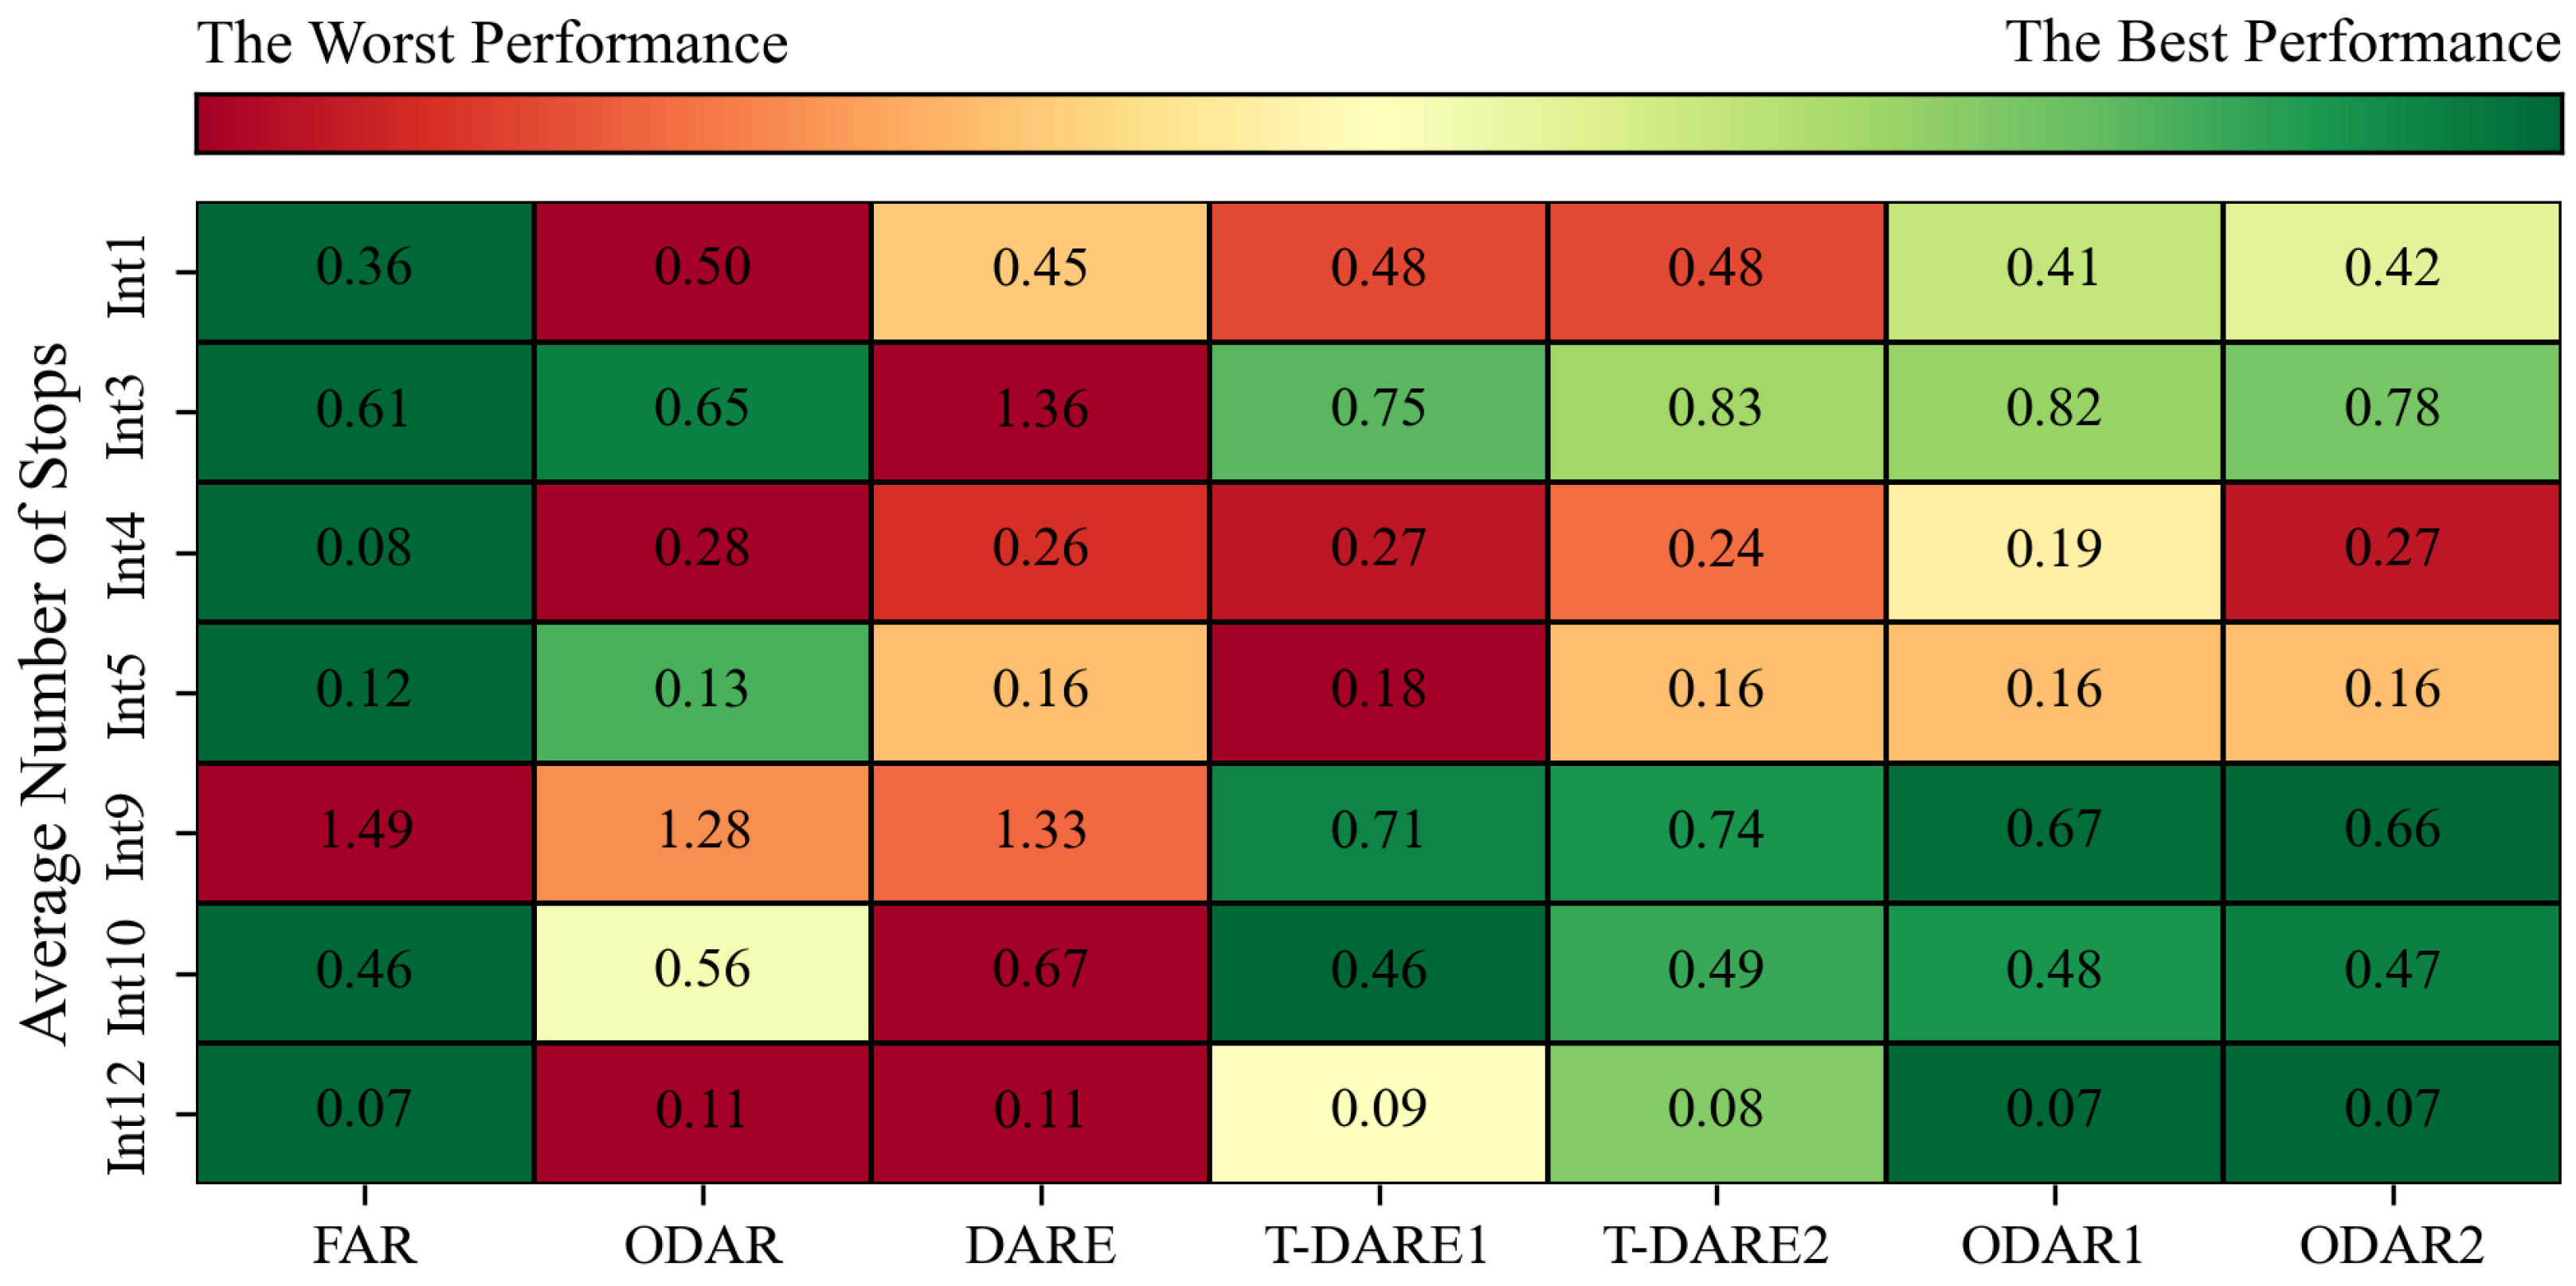
However, despite the throughput benefits of ODAR, its efficiency should be further elaborated from the perspective of number of stops and delays. Accordingly, Figure 8 presents a heat map table showing the average number of stops at each studied intersection across the different all-red strategies.
Figure 8.
Average number of stops for each all-red strategy. Higher stop counts are indicated in red, and lower stop counts are shown in green.
From Figure 8, it can be observed that at the majority of intersections, the all-red extension strategies resulted in an increase in the average number of stops. In addition, the traditional FAR strategy generally performed as the most effective approach for minimizing stops, as seen, for example, at Intersection 4, where the extension-based strategies significantly increased the number of stops compared to FAR (p < 0.05). Conversely, Intersection 9 exhibited the opposite trend, where the fixed-time all-red extension strategies resulted in a significantly lower number of stops (p < 0.05). In this case, the dynamic all-red extension strategies (ODAR and DARE) also led to numerically lower average stops, although the differences were not statistically significant. Also, it is important to note a case at intersection 10 where there was no statistical difference between all-red strategies, where only DARE strategy performed with higher number of stops.
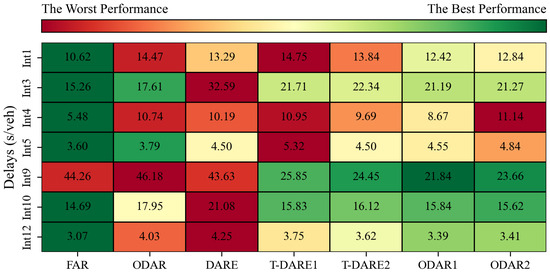
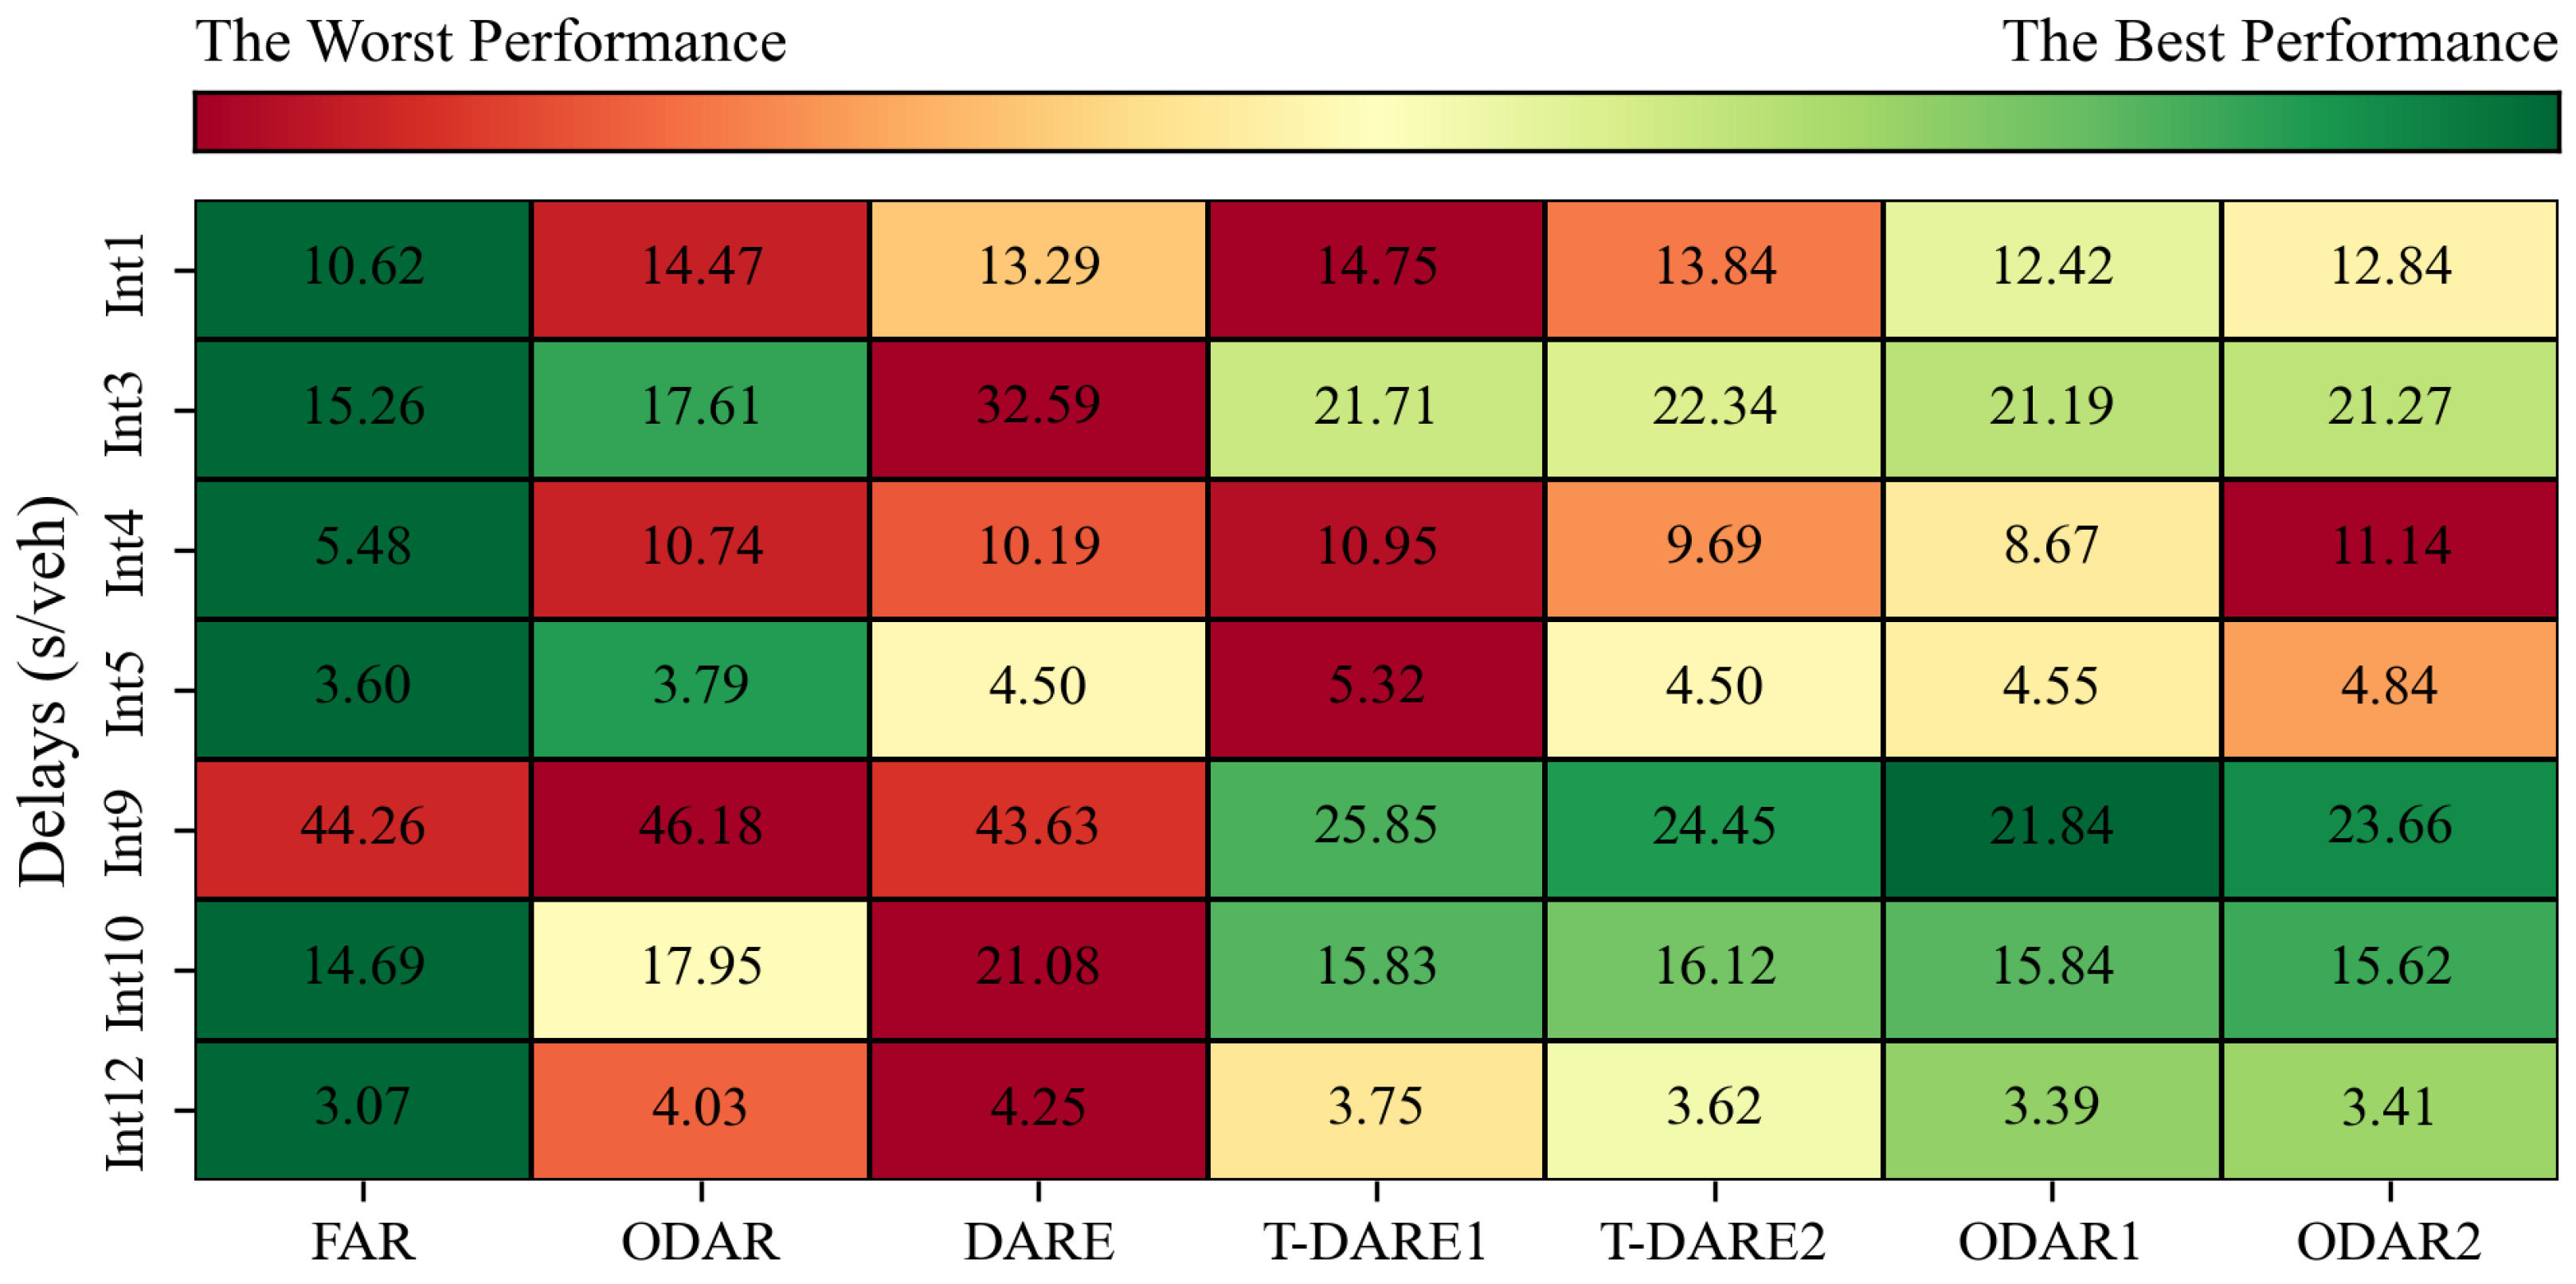
The subsequent analysis focused on delays as the third parameter in the efficiency assessment among the all-red strategies. Figure 9 presents a heat map table illustrating the average vehicular delays at each studied intersection across the different all-red strategies.
Figure 9.
Average vehicular delay (s/veh) for each all-red strategy. Higher delays are shaded red (worse performance), and lower delays are shaded green (better performance).
Similar to the results for the average number of stops, Figure 9 shows that, for the majority of intersections, the all-red extension strategies resulted in increased delays compared to the traditional FAR. At Intersection 3, FAR statistically outperformed all other strategies (p < 0.05). Furthermore, a similar pattern was observed at Intersection 9, consistent with the findings for the number of stops, where ODAR with fixed-time extensions (ODAR1 and ODAR2) and traditional DARE strategies (T-DARE1 and T-DARE2) significantly outperformed both FAR and the dynamic all-red extension strategies (p < 0.05).
Eliminating the all-red phase and activating or extending it based on VHCR detection did not consistently improve efficiency, in terms of number of stops or delays, when compared to strategies with an initial fixed all-red interval (e.g., DARE, T-DARE1, T-DARE2). In most cases, there were no statistically significant differences between the extension strategies that eliminated the all-red phase and those that maintained an initial all-red period. However, as shown in previous analyses, ODAR with a fixed-time extension exhibited notable capabilities, achieving the highest throughput across almost all studied intersections.
Therefore, eliminating the all-red phase does not necessarily improve efficiency across all three performance dimensions (throughput, stops, and delay). The effectiveness of ODAR may depend on contextual factors, for instance, under high traffic demand and low red-light-running (RLR) probability, as observed at Intersection 9, ODAR with a fixed-time extension achieved the highest throughput, the fewest stops, and the lowest delays.
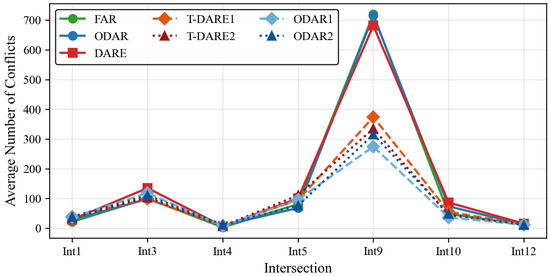
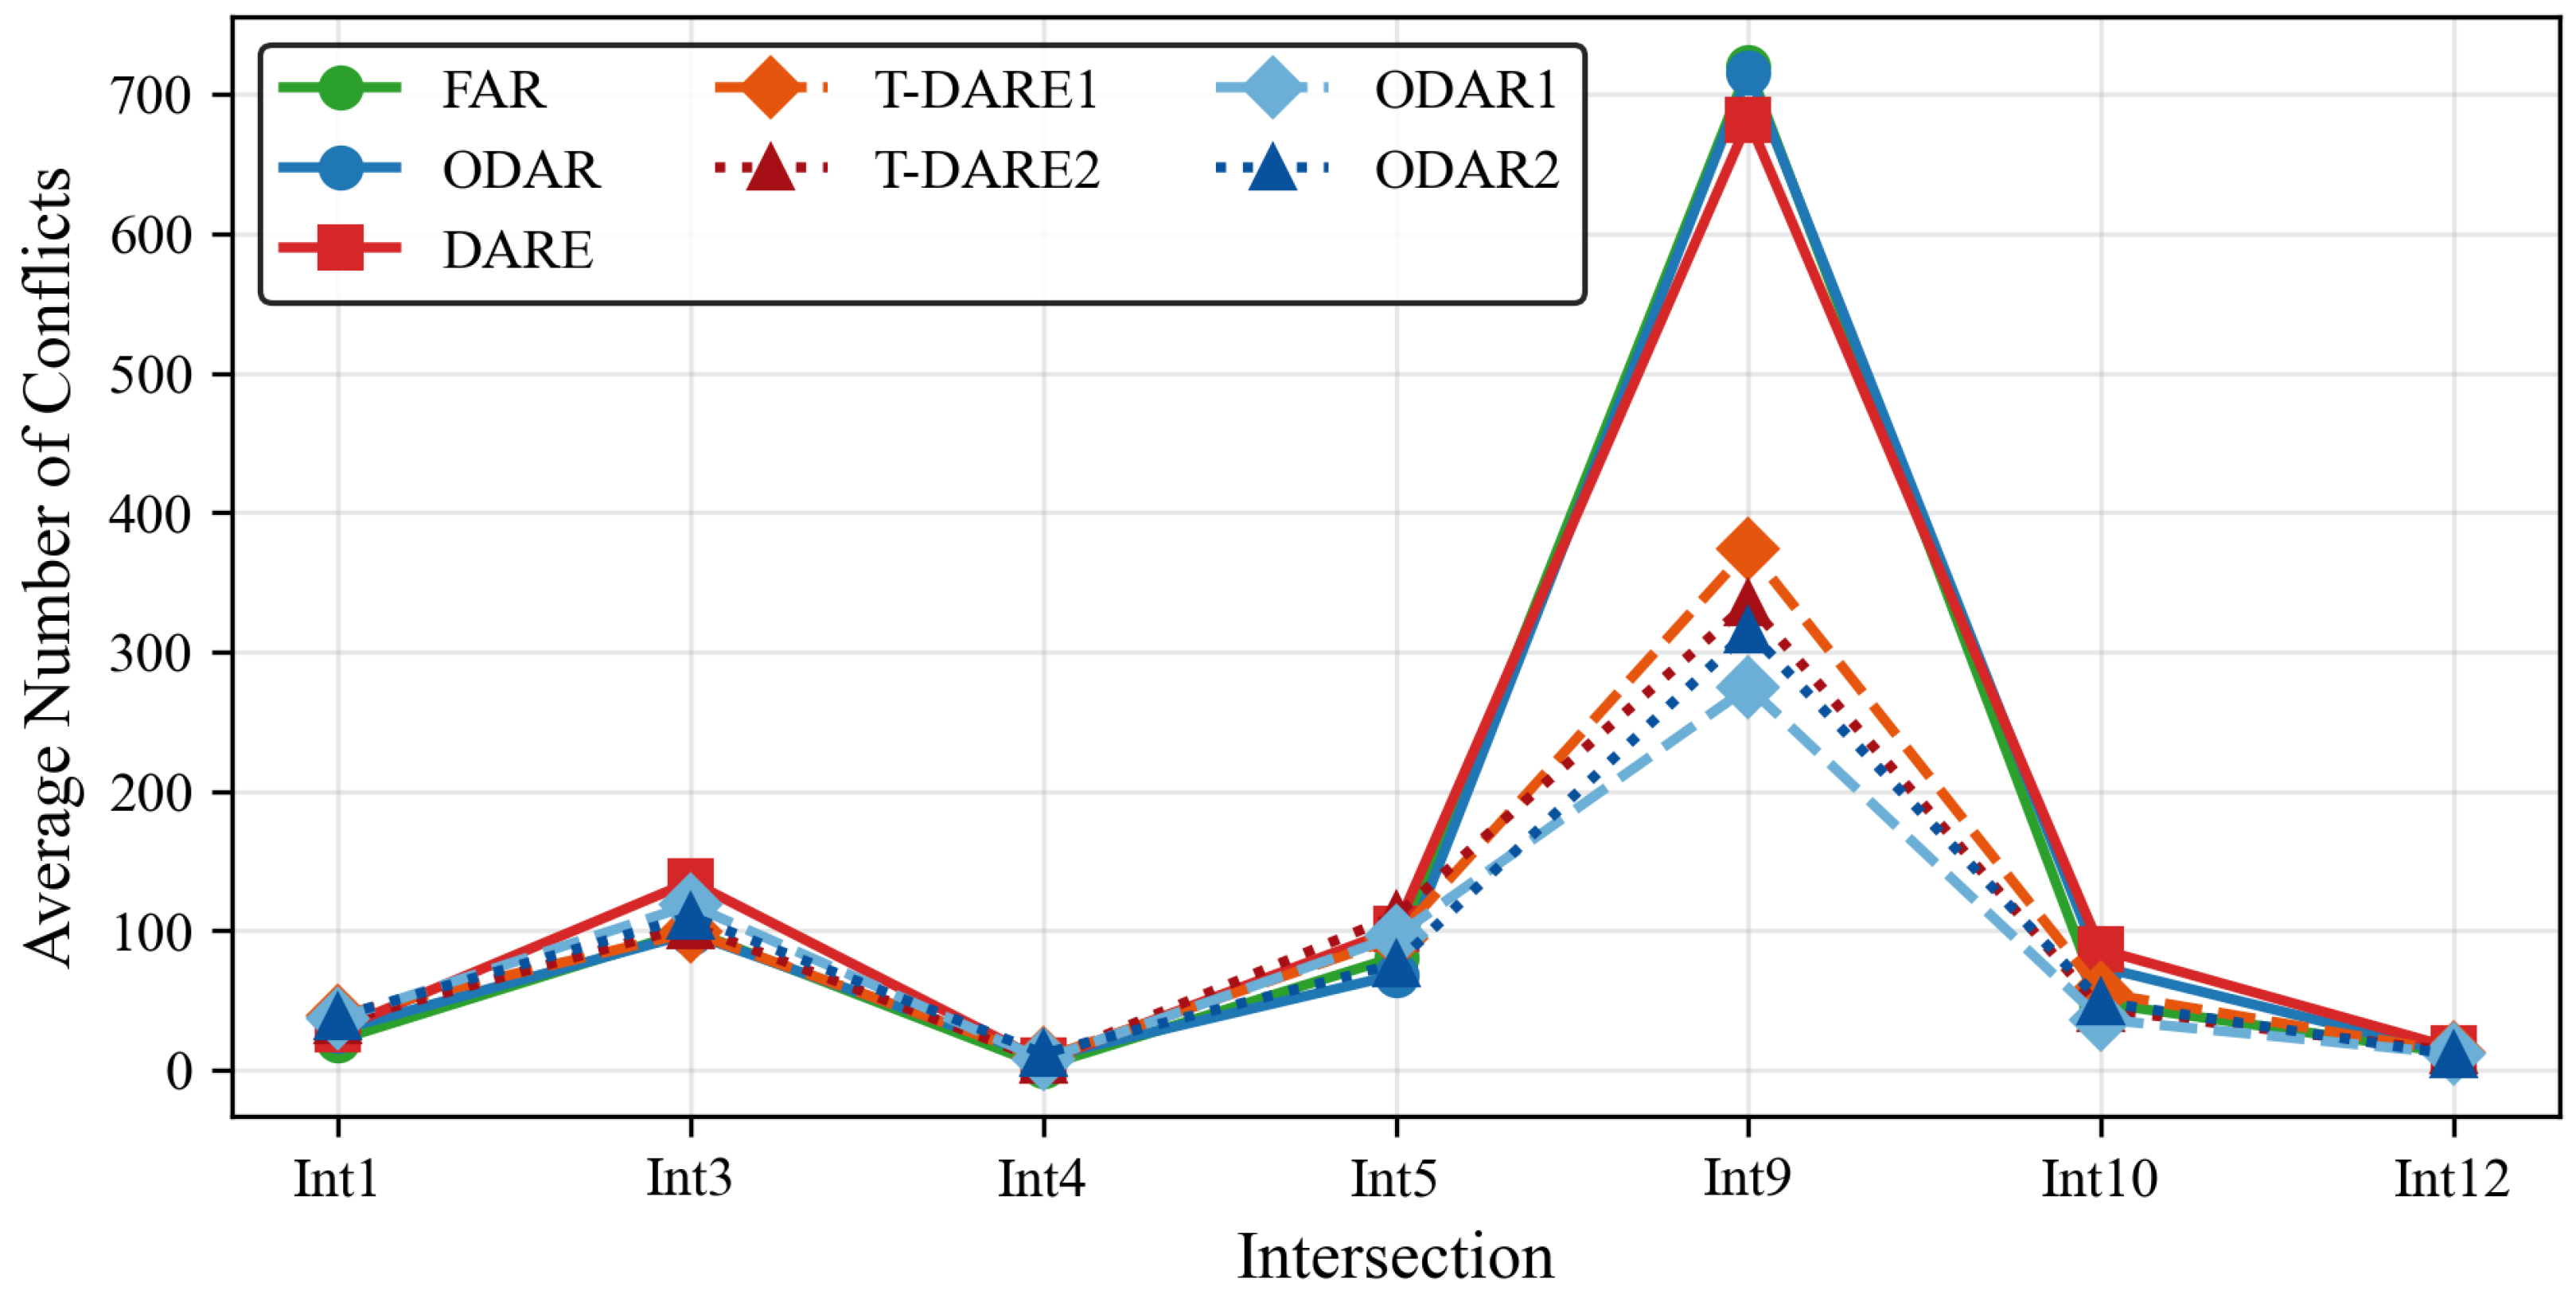
Nevertheless, eliminating the all-red interval raises safety concerns. Consequently, the subsequent analysis focuses on safety outcomes across the seven studied intersections under the different all-red strategies. Specifically, severe conflicts were analyzed, defined as events with TTC < 1.5 s and PET < 5 s thresholds [31,35]. The objective of this analysis is to determine whether the ODAR strategy, by eliminating the all-red phase, produces less safe conditions and a higher number of conflicts, as shown in Figure 10.
Figure 10.
Average number of conflicts for each all-red strategy.
At four of the seven studied intersections shown in Figure 10, there was no statistically significant difference among the all-red strategies in terms of the number of conflicts. A statistically significant difference was observed at Intersection 1, where fixed-time extensions (both with and without all-red elimination) resulted in a significantly higher number of conflicts (p < 0.05). In this case, the dynamic extension strategies (ODAR and DARE) exhibited a numerically higher number of conflicts, although the difference compared to FAR was not statistically significant. In contrast, at Intersections 9 and 10, the results were reversed, fixed-time extension strategies produced a significantly lower number of conflicts compared to both the traditional FAR and the dynamic extension strategies (ODAR and DARE).
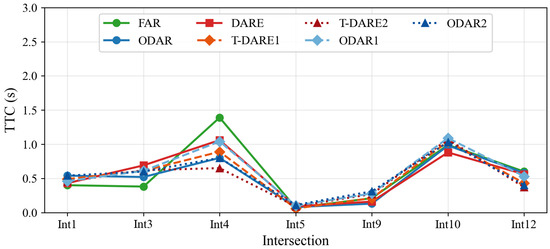
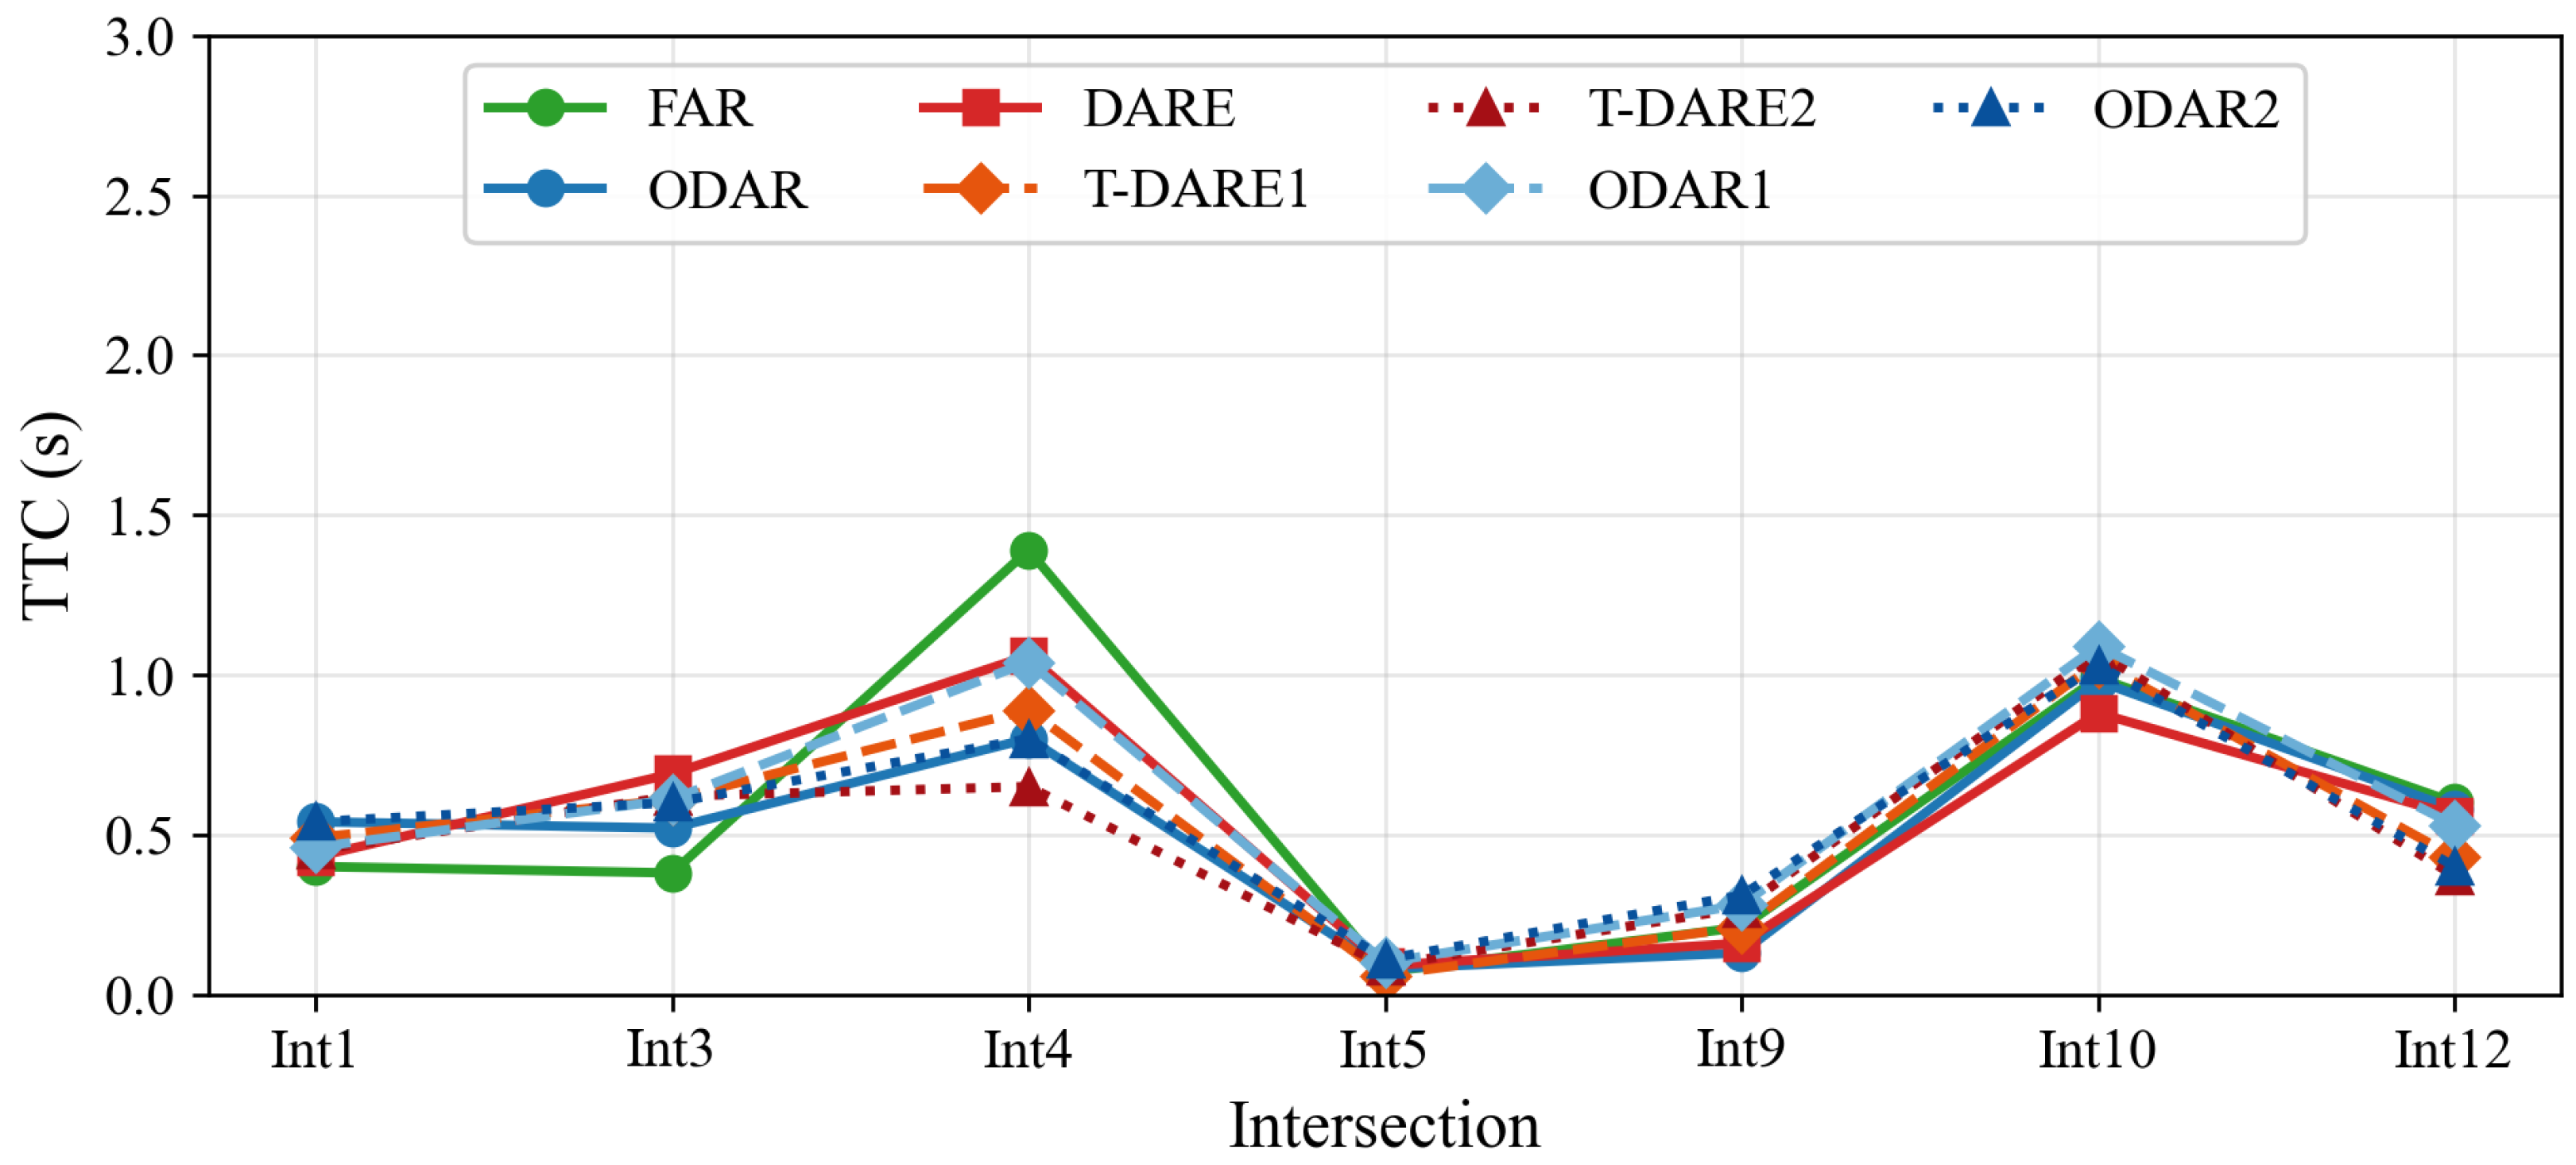
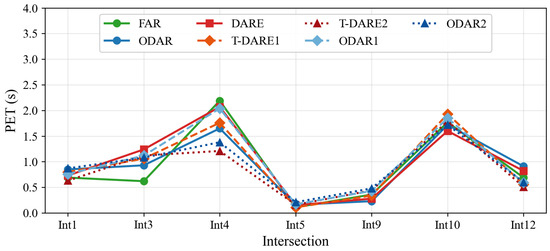
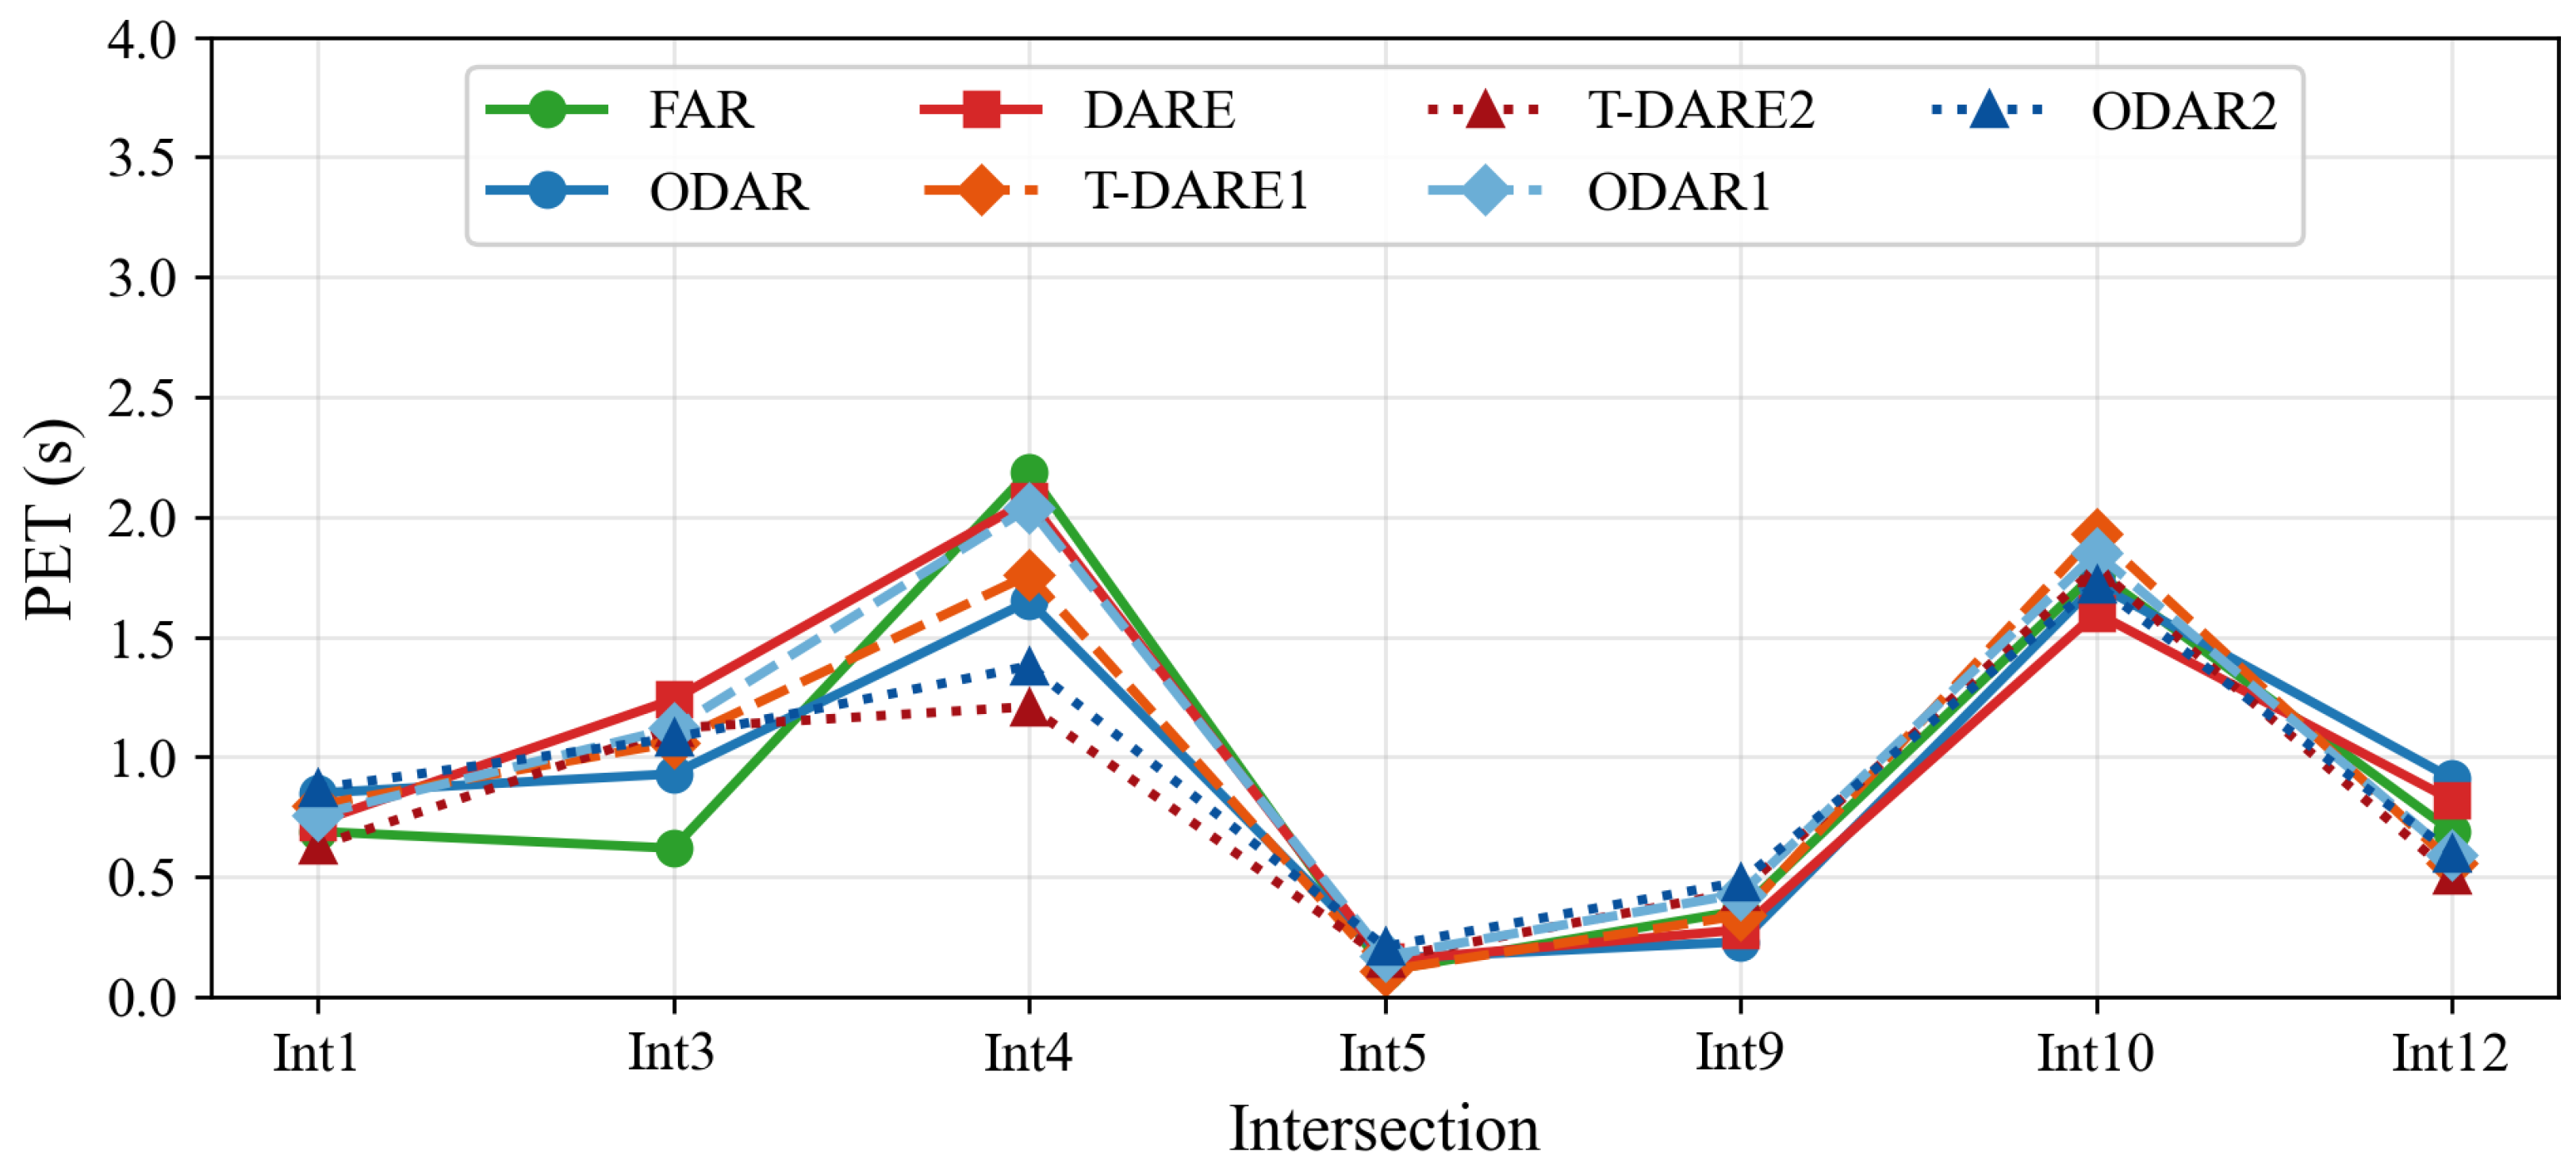
To further elaborate on the safety outcomes and detected conflicts, the subsequent analysis examined whether the all-red strategies influenced the severity of conflicts. Two primary surrogate safety metrics were employed to assess conflict severity: Time-to-Collision (TTC) (Figure 11) and Post-Encroachment Time (PET) (Figure 12).
Figure 11.
Time-to-Collision (TTC) for each all-red strategy.
Figure 12.
Post-Encroachment Time (PET) for each all-red strategy.
From Figure 11 and Figure 12, it can be observed that intersections showing a statistically significant difference in the number of conflicts across the various all-red strategies (Intersections 1 and 10) did not exhibit significant differences in conflict severity based on either TTC or PET criteria. At Intersection 3, the ODAR strategies with fixed-time extensions performed significantly better than the traditional FAR strategy from both the TTC and PET perspectives (p < 0.05). At Intersection 4, although FAR produced the highest average TTC values, the differences compared to ODAR1 and DARE were not statistically significant (p > 0.05). At Intersection 9, the ODAR2 strategy significantly outperformed FAR.
Similar to the efficiency analysis, the all-red strategy alone is not the sole factor determining the level of safety when evaluated through the number of conflicts or conflict severity (TTC and PET). At most intersections, no statistically significant differences were observed among the strategies. Moreover, results derived from the two perspectives—number of conflicts and conflict severity, sometimes revealed contradictory insights. For example, at Intersection 1, the dynamic extension strategies (ODAR and DARE) resulted in fewer conflicts, whereas at Intersection 9, which exhibited higher throughput, the fixed-time extension strategies reduced the number of conflicts by more than 50% compared to FAR and the dynamic extensions. At the same location, the fixed-time extension strategies also achieved better TTC results, with ODAR2 producing the statistically best performance.
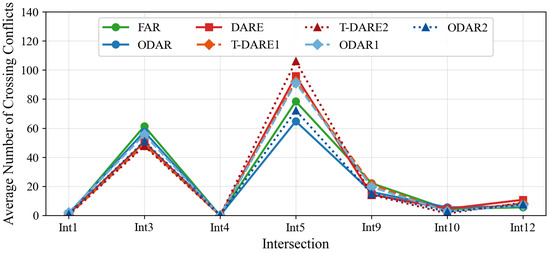
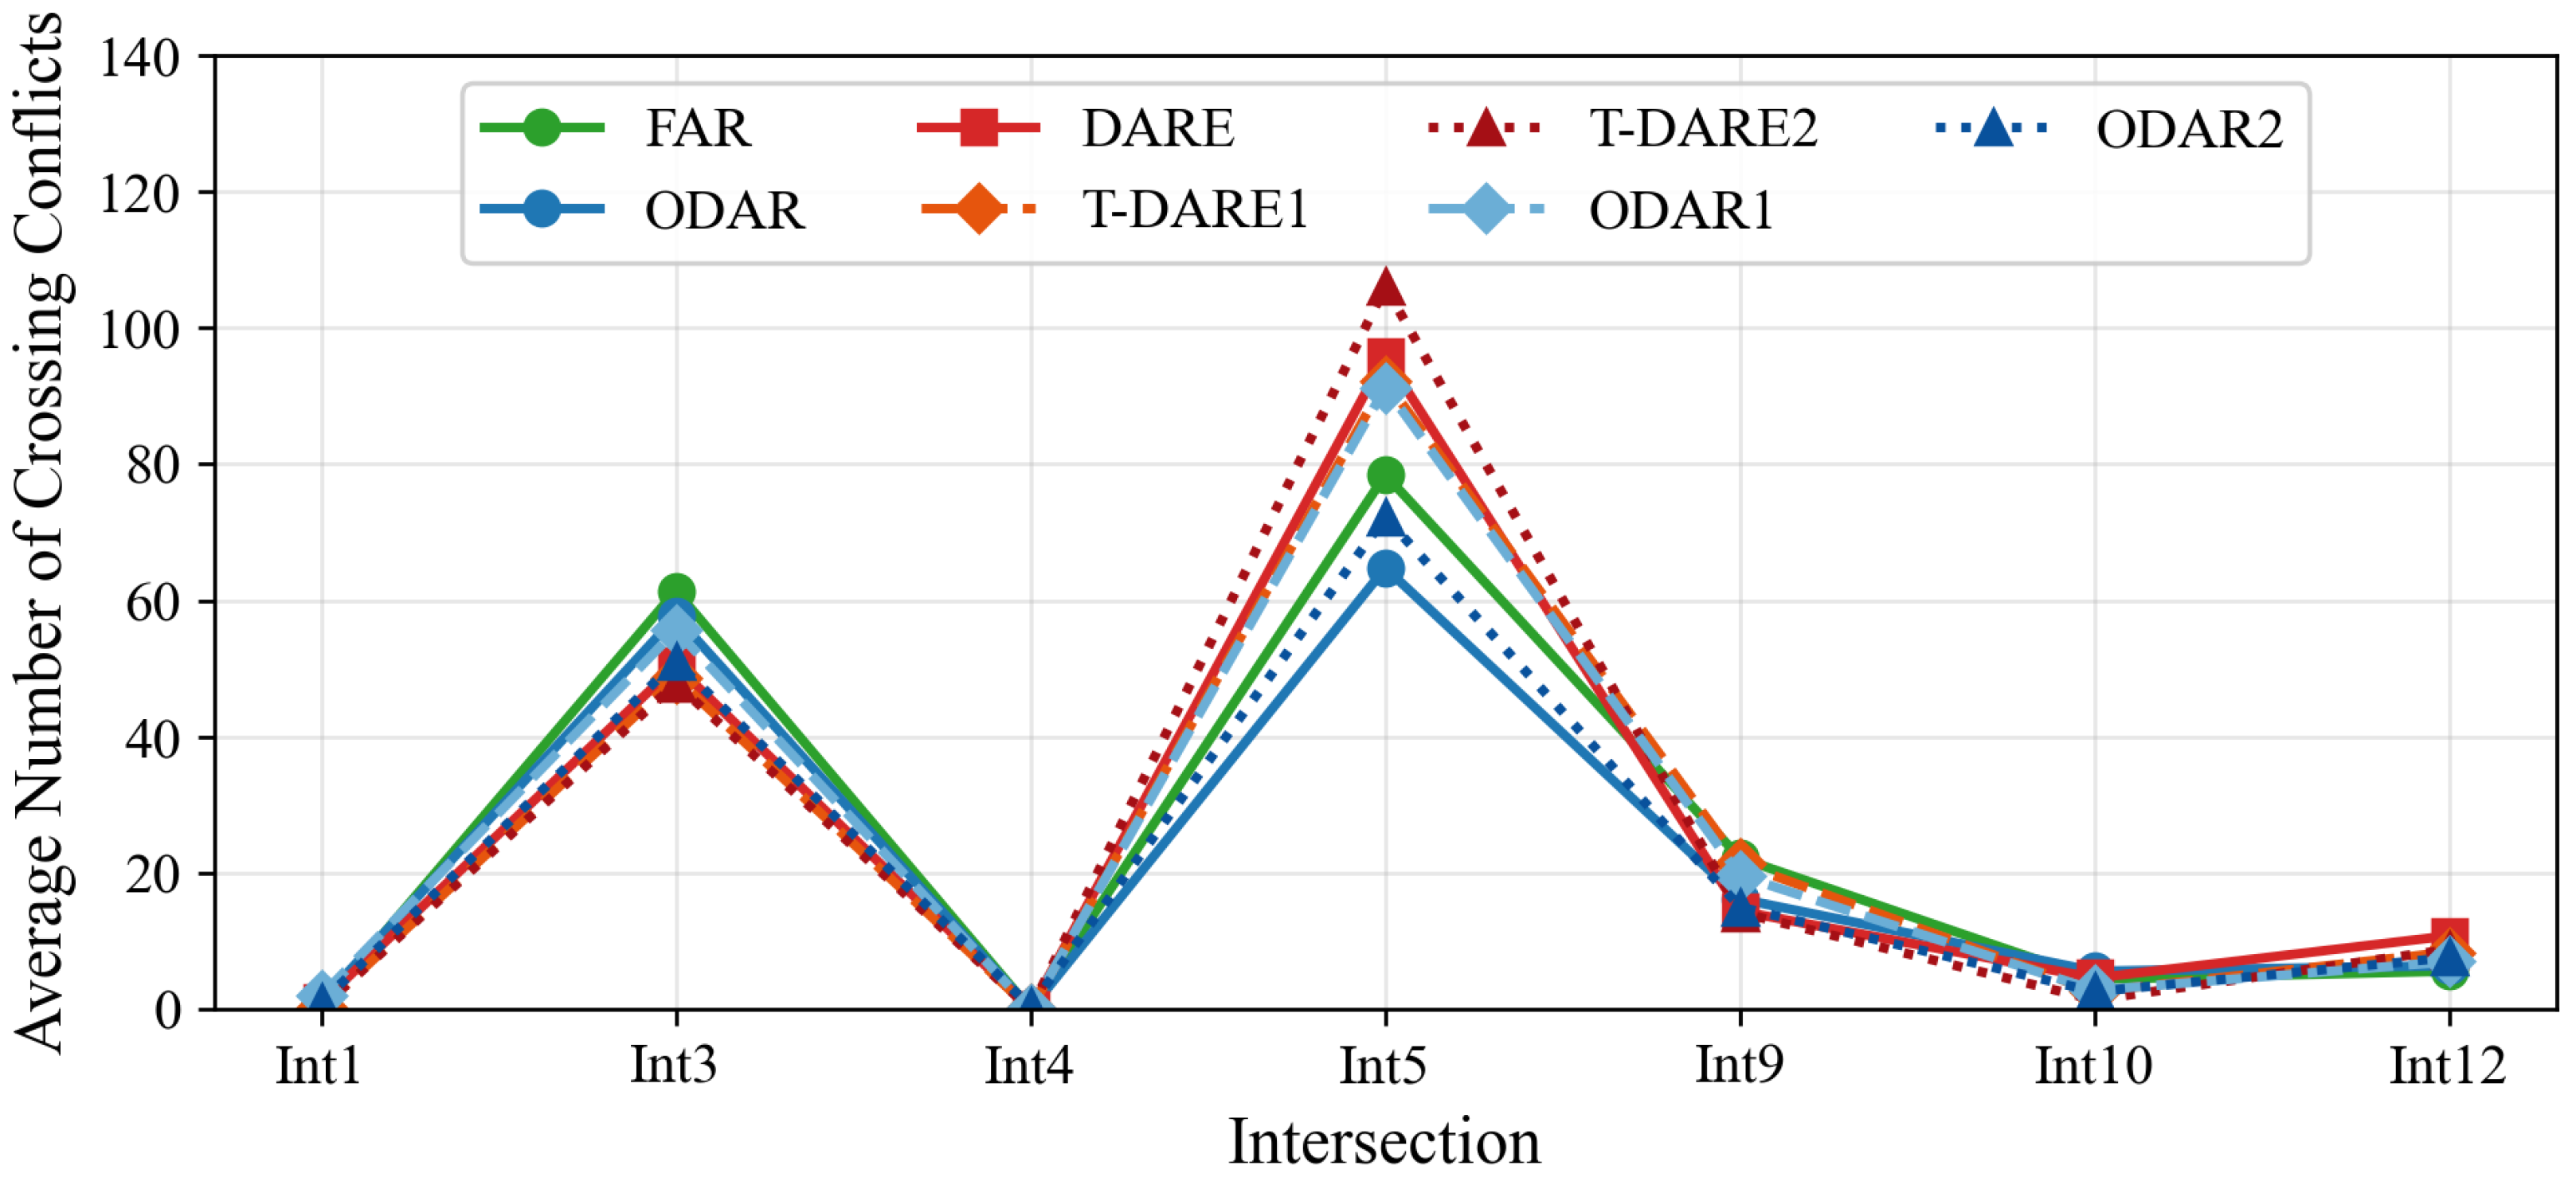
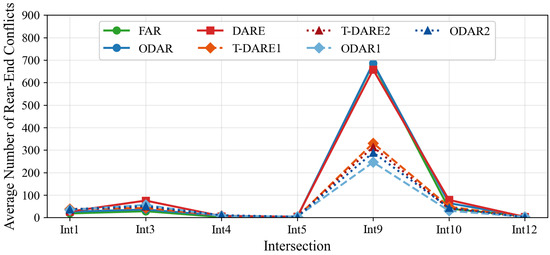
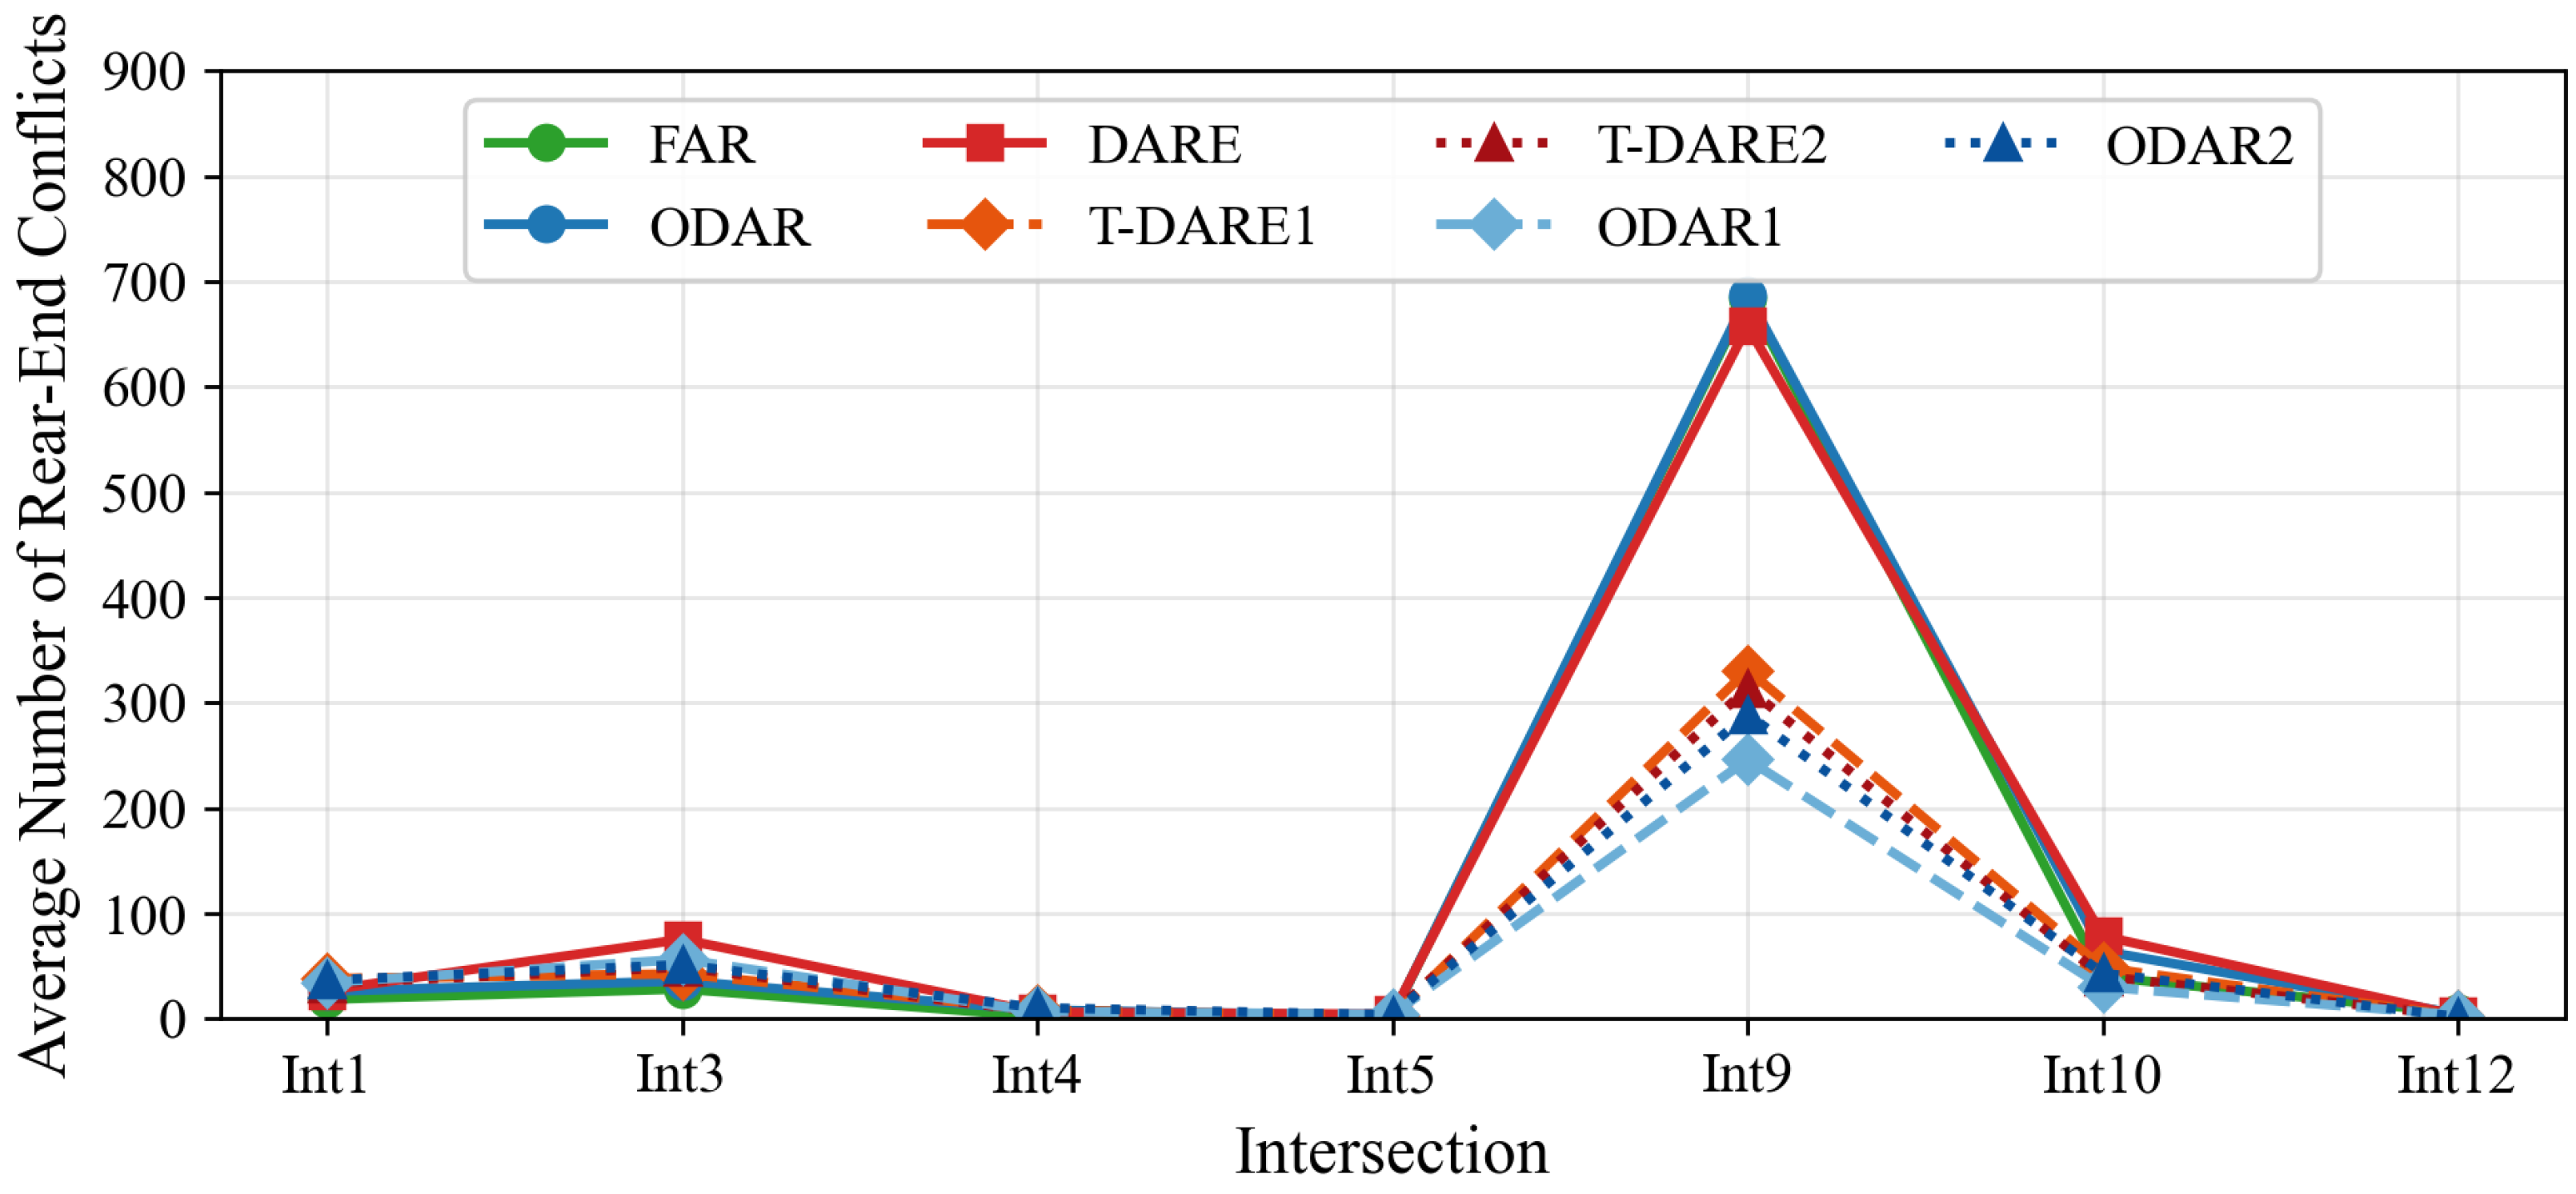
To obtain a broader safety perspective on the effects of the all-red strategies, two specific conflict types that may be directly influenced by all-red interval manipulation were examined: crossing conflicts (Figure 13) and rear-end conflicts (Figure 14).
Figure 13.
Average number of crossing conflicts for each all-red strategy.
Figure 14.
Average number of rear-end conflicts for each all-red strategy.
The results depicted in Figure 13 and Figure 14 indicate that, for the majority of the studied intersections, there were no statistically significant differences among the all-red strategies for either conflict type (p < 0.05). Although numerical differences were observed in the average number of crossing conflicts, these differences were not statistically significant at any intersection. In the case of rear-end conflicts, only Intersections 9 and 10 exhibited statistically significant differences among the strategies (p < 0.05). Specifically, the fixed-time all-red extensions outperformed both the dynamic all-red extensions and the traditional FAR strategy (p < 0.05), a trend consistent with the overall conflict analysis shown in Figure 10.
5. Conclusions
This study proposed the On-Demand All-Red (ODAR) system and evaluated its performance against existing all-red interval strategies at signalized intersections. From a conceptual standpoint, ODAR reframes the all-red interval as an optional, event-triggered safety mechanism rather than a mandatory clearance phase applied in every signal cycle, with the objective of enhancing intersection efficiency while maintaining safety. In ODAR, all-red activation occurs only when a vehicle actually enters the intersection during the yellow interval, relying on observed vehicle behavior rather than predictive intent models. Furthermore, the required clearance duration is computed continuously as a function of vehicle speed and intersection geometry, rather than being constrained to fixed or discretized extension values.
Using a combination of software-in-the-loop simulations and a comprehensive set of performance metrics, we compared the ODAR system against Dynamic All-Red Extension (DARE) and Fixed All-Red (FAR) systems. Our results highlight several key findings that contribute to the understanding of traffic signal all-red strategies and their impacts on intersection safety and efficiency:
- Based on the most common parameters used in the literature to evaluate intersection efficiency and safety, it is challenging to determine which all-red strategy provides the overall best performance. Most results varied among the studied intersections, depending on various interrelated factors such as driver propensity for red-light-running at specific locations, traffic demand, etc.
- Although the majority of results cannot be generalized, at most of the studied intersections, the ODAR strategy with a fixed-time extension achieved the highest throughput, statistically outperforming both FAR and DARE. However, it is important to note that ODAR with dynamic extensions, longer than 2 s, tend to reduce throughput and decrease road capacity.
- In general, at most intersections, delays and stops increased with the application of all-red extensions. Conversely, under conditions of high traffic demand and low RLR occurrence, the ODAR strategy with a fixed-time extension effectively fulfilled its main purpose, omitting the all-red interval when unnecessary, and improved intersection efficiency across all three efficiency measures (Throughput, Delays, and Number of Stops).
- From a safety perspective, the results across red-light-running events, conflict frequency, and conflict severity indicate that no single all-red strategy consistently dominates across all intersections. At a notable number of study locations, there were no statistically significant differences among all-red strategies in terms of either conflict frequency or conflict severity. Where differences did emerge, the safety outcomes were mixed: from a conflict frequency perspective, fixed-time all-red extensions, including fixed-time ODAR variants, often resulted in fewer conflicts, whereas from a conflict severity perspective, dynamic extension strategies tended to produce less severe conflicts as reflected by TTC and PET measures. The ODAR strategy generally reduced the number of red-light-running events relative to FAR and DARE, although the magnitude of this effect varied by intersection and operational context. The observed variability in safety outcomes underscores the importance of intersection-specific characteristics, such as traffic demand, driver behavior (i.e., propensity for red-light running), and signal operations, in shaping the effectiveness of all-red strategies. Overall, these findings suggest that the on-demand elimination of the all-red interval, when combined with event-triggered activation, can maintain intersection safety without introducing systematic adverse safety effects.
While this study employed software-in-the-loop simulations as a powerful platform for evaluating and comparing traffic control strategies, further investigation is needed before deploying the ODAR system under real-world conditions. Future research should examine the system’s potential impacts on driver behavior and intersection safety, potentially through driver-in-the-loop simulation to capture human behavioral responses and perceived safety more accurately. Moreover, subsequent studies should evaluate the ODAR system across a broader range of traffic environments, such as urban corridors with varying speed limits and heterogeneous roadway users, to more fully assess its robustness and adaptability.
The focus of this study was on actuated-free traffic control, aimed at evaluating ODAR performance at an isolated intersection. Future work will expand on this by examining the application of ODAR under different traffic control types, such as actuated-coordinated control, and by investigating the interactions between adjacent intersections, including the impacts of all-red extensions on coordination, green waves, and arrivals during yellow intervals.
Overall, the ODAR system demonstrated promising potential for improving intersection efficiency through dynamic all-red extensions that adapt to real-time traffic conditions. Continued research and development in this area have the potential to enhance intersection management and increase roadway efficiency without compromising safety.
Author Contributions
The authors confirm contribution to the paper as follows: study conception and design: I.G.E., S.G., M.V. and A.S.; data collection: I.G.E. and M.V.; analysis and interpretation of results: I.G.E., S.G., M.V. and A.S.; draft manuscript preparation: I.G.E., S.G., M.V. and A.S. All authors have read and agreed to the published version of the manuscript.
Funding
This research received no external funding.
Institutional Review Board Statement
Not applicable.
Informed Consent Statement
Not applicable.
Data Availability Statement
The data that support the findings of this study are available from the authors upon request. Interested researchers may contact the corresponding author to obtain access to the dataset.
Acknowledgments
The authors gratefully acknowledge Miovision Technologies (Kitchener, ON, Canada) for providing access to field data from the studied intersections in Lake County, Chicago, USA, which enabled the extraction and analysis of red-light-running events used in this research.
Conflicts of Interest
Author Ismet Goksad Erdagi is employed by AECOM. Author Slavica Gavric is employed by Whitman, Requardt & Associates, LLP. The remaining authors declare that the research was conducted in the absence of any commercial or financial relationships that could be construed as a potential conflict of interest.
References
- Yang, C.Y.D.; Najm, W.G. Analysis of Red Light Violation Data Collected from Intersections Equipped with Red Light Photo Enforcement Cameras; Project Memorandum DOT HS 810 580; U.S. Department of Transportation, Research and Innovative Technology Administration, John A. Volpe National Transportation Systems Center: Cambridge, MA, USA; U.S. Department of Transportation, National Highway Traffic Safety Administration: Washington, DC, USA, 2006.
- Mohammed, H.A.; Abadi, M.G.; Hurwitz, D.S. Red-Light Running Violation during Car Following at High-Speed Signalized Intersections. Transp. Eng. 2022, 8, 100110. [Google Scholar] [CrossRef] [Scilit]
- Baguley, C. ‘Running the red’ at signals on high-speed roads. Traffic Eng. Control 1988, 29, 415–420. [Google Scholar]
- Elmitiny, N.; Yan, X.; Radwan, E.; Russo, C.; Nashar, D. Classification Analysis of Driver’s Stop/Go Decision and Red-Light Running Violation. Accid. Anal. Prev. 2010, 42, 101–111. [Google Scholar] [CrossRef] [Scilit]
- Bell, M.C.; Galatioto, F.; Giuffre, T.; Tesoriere, G. Novel Application of Red-Light Runner Proneness Theory within Traffic Microsimulation to an Actual Signal Junction. Accid. Anal. Prev. 2012, 46, 26–36. [Google Scholar] [CrossRef] [Scilit]
- Retting, R.A.; Ulmer, R.G.; Williams, A.F. Prevalence and Characteristics of Red Light Running Crashes in the United States. Accid. Anal. Prev. 1999, 31, 687–694. [Google Scholar] [CrossRef] [Scilit]
- Jalali Khalilabadi, P.; Karimpour, A.; Wu, Y.J. Severity Analysis of Red-Light-Running Behavior at Signalized Intersections. J. Transp. Saf. Secur. 2024, 16, 482–506. [Google Scholar] [CrossRef] [Scilit]
- Bonneson, J.A.; Zimmerman, K.; Brewer, M.A. Engineering Countermeasures to Reduce Red-Light-Running; Technical Report; Texas Transportation Institute, Texas A & M University System College: College Station, TX, USA, 2002. [Google Scholar]
- McGee, H.S.; Moriarty, K.; Gates, T.J. Guidelines for Timing Yellow and Red Intervals at Signalized Intersections. Transp. Res. Rec. 2012, 2298, 1–8. [Google Scholar] [CrossRef] [Scilit]
- Simpson, C.L.; Harrison, M.W.; Troy, S.A. Implementation of a Dynamic All-Red Extension at Signalized Intersections in North Carolina: Evaluation of Driver Adaptation and Operational Performance. Transp. Res. Rec. 2017, 2624, 19–27. [Google Scholar] [CrossRef] [Scilit]
- Simpson, C.L. Dynamic All-Red Extension: An Innovative Safety Countermeasure to Treat Red Light Running Crashes. Transp. Res. Rec. 2023, 2677, 753–762. [Google Scholar] [CrossRef] [Scilit]
- Rahman, M. Dynamic Dilemma Zone Protection System: A Smart Machine Learning Based Approach to Countermeasure Driver’s Yellow Light Dilemma. Ph.D. Thesis, University of South Alabama, Mobile, AL, USA, 2022. [Google Scholar]
- Abadi, M.G.; Hurwitz, D.S.; Marnell, P.; Quayle, S. Evaluation of Red Clearance Extension Designs with Hardware-in-the-Loop Simulation. Transp. Lett. 2019, 11, 264–274. [Google Scholar] [CrossRef] [Scilit]
- Archer, J.; Young, W. Signal Treatments to Reduce the Likelihood of Heavy Vehicle Crashes at Intersections: Microsimulation Modeling Approach. J. Transp. Eng. 2010, 136, 632–639. [Google Scholar] [CrossRef] [Scilit]
- Cesme, B.; Stevanovic, A.; Day, C.; Schroeder, B.; Bonneson, J.; Hale, D. Traffic Signal Change and Clearance Interval Pooled Fund Study: Synthesis Report; Technical Report; Department of Transportation, Federal Highway Administration: Washington, DC, USA, 2023.
- Federal Highway Administration. Manual on Uniform Traffic Control Devices for Streets and Highways; U.S. Department of Transportation, Federal Highway Administration: Washington, DC, USA, 2009.
- Gates, T.J.; Noyce, D.A. A Conceptual Framework for Dynamic Extension of the Red Clearance Interval as a Countermeasure for Red-Light-Running. Accid. Anal. Prev. 2016, 96, 341–350. [Google Scholar] [CrossRef] [Scilit]
- Hadi, M.; Amine, K.; Hunsanon, T.; Arafat, M. Evaluating the Benefits of Red-Light Violation Warning System in a Connected Vehicle Simulation Environment. Transp. Res. Rec. 2021, 2675, 1372–1381. [Google Scholar] [CrossRef] [Scilit]
- Zimmerman, K. Additional Dilemma Zone Protection for Trucks at High-Speed Signalized Intersections. Transp. Res. Rec. 2007, 2009, 82–88. [Google Scholar] [CrossRef] [Scilit]
- Archer, J.; Young, W. Signal Treatments to Reduce Heavy Vehicle Crash-Risk at Metropolitan Highway Intersections. Accid. Anal. Prev. 2009, 41, 404–411. [Google Scholar] [CrossRef] [Scilit]
- Olson, C.S. Safety Effectiveness of Red Light Treatments for Red Light Running; Portland State University: Portland, OR, USA, 2012. [Google Scholar]
- Kang, M.W.; Hossain, M.R.; Rahman, M.; Biswas, P. Speed–Space Analysis and Dynamic All-Red Extension for Red-Light Running Protection at Signalized Intersections on Rural High-Speed Arterials. Transp. Res. Rec. 2025, 2679, 03611981241312214. [Google Scholar] [CrossRef] [Scilit]
- Hurwitz, D.; Abadi, M.G.; McCrea, S.; Quayle, S.; Marnell, P. Smart Red Clearance Extensions to Reduce Red-Light Running Crashes; Technical Report; Oregon Department of Transportation: Salem, OR, USA, 2016.
- Tainter, F.; Christofa, E.; Knodler, M.A. All-Red Clearance Intervals for Use in the Left-Turn Application of Flashing Yellow Arrows. J. Transp. Eng. Part Syst. 2020, 146, 04020008. [Google Scholar] [CrossRef] [Scilit]
- Chen, Y.H.; Park, S.Y.; Chang, G.L.; Kim, M. Preventing Intersection Rear-End Collisions with an Optimized Dynamic Two-Stage Actuated Control. J. Transp. Eng. Part Syst. 2021, 147, 04021049. [Google Scholar] [CrossRef] [Scilit]
- Wang, L.; Zhang, L.; Zhang, W.B.; Zhou, K. Red Light Running Prediction for Dynamic All-Red Extension at Signalized Intersection. In Proceedings of the 2009 12th International IEEE Conference on Intelligent Transportation Systems, St. Louis, MI, USA, 4–7 October 2009; IEEE: New York, NY, USA, 2009; pp. 1–5. [Google Scholar] [CrossRef] [Scilit]
- Wang, L.; Zhang, L.; Zhou, K.; Zhang, W.B.; Wang, X. Prediction of Red-Light Running on Basis of Inductive-Loop Detectors for Dynamic All-Red Extension. Transp. Res. Rec. 2012, 2311, 44–50. [Google Scholar] [CrossRef] [Scilit]
- Zhao, J.; Yu, J.; Zhang, F.; Liu, Y. Mitigation of Signalized Intersection Collision Risks with Trajectory-Based Dynamic Dilemma Zone Protection. Accid. Anal. Prev. 2023, 192, 107288. [Google Scholar] [CrossRef] [Scilit] [PubMed]
- Rakha, H.; El-Shawarby, I.; Setti, J.R. Characterizing Driver Behavior on Signalized Intersection Approaches at the Onset of a Yellow-Phase Trigger. IEEE Trans. Intell. Transp. Syst. 2007, 8, 630–640. [Google Scholar] [CrossRef]
- Alshayeb, S.; Stevanovic, A.; Stevanovic, J.; Dobrota, N. Optimizing of Traffic-Signal Timing Based on the FCIC-PI—A Surrogate Measure for Fuel Consumption. Future Transp. 2023, 3, 663–683. [Google Scholar] [CrossRef] [Scilit]
- Gettman, D.; Pu, L.; Sayed, T.; Shelby, S.G.; Energy, S.; Automation, B.U.I.T.S. Surrogate Safety Assessment Model and Validation: Final Report; Technical Report FHWA-HRT-08-051; Federal Highway Administration: Washington, DC, USA, 2008.
- Gettman, D.; Head, L. Surrogate Safety Measures from Traffic Simulation Models. Transp. Res. Rec. 2003, 1840, 104–115. [Google Scholar] [CrossRef] [Scilit]
- Stevanovic, A.; Stevanovic, J.; Kergaye, C. Optimizing signal timings to improve safety of signalized arterials. In Proceedings of the 3rd International Conference on Road Safety and Simulation, Indianapolis, IN, USA, 14–16 September 2011; Volume 14. [Google Scholar]
- Stevanovic, A.; Kergaye, C.; Haigwood, J. Assessment of surrogate safety benefits of an adaptive traffic control system. In Proceedings of the 33rd International Conference on Road Safety and Simulation, Indianapolis, IN, USA, 14–16 September 2011; pp. 14–16. [Google Scholar]
- Stevanovic, A.; Stevanovic, J.; So, J.; Ostojic, M. Multi-Criteria Optimization of Traffic Signals: Mobility, Safety, and Environment. Transp. Res. Part C Emerg. Technol. 2015, 55, 46–68. [Google Scholar] [CrossRef] [Scilit]
- Alzoubaidi, M.; Zlatkovic, M.; Jadaan, K.; Farid, A. Safety Assessment of Coordinated Signalized Intersections in a Connected Vehicle Environment: A Microsimulation Approach. Int. J. Inj. Control. Saf. Promot. 2023, 30, 26–33. [Google Scholar] [CrossRef] [Scilit] [PubMed]

Disclaimer/Publisher’s Note: The statements, opinions and data contained in all publications are solely those of the individual author(s) and contributor(s) and not of MDPI and/or the editor(s). MDPI and/or the editor(s) disclaim responsibility for any injury to people or property resulting from any ideas, methods, instructions or products referred to in the content. |
© 2026 by the authors. Licensee MDPI, Basel, Switzerland. This article is an open access article distributed under the terms and conditions of the Creative Commons Attribution (CC BY) license.