


Abstract
Computer vision and deep learning are essential in diverse fields such as autonomous driving, medical imaging, face recognition, and object detection. However, enhancing low-light remote sensing images remains challenging for both research and real-world applications. Low illumination degrades image quality due to sensor limitations and environmental factors, weakening visual fidelity and reducing performance in vision tasks. Common issues such as insufficient lighting, backlighting, and limited exposure create low contrast, heavy shadows, and poor visibility, particularly at night. We propose QWR-Dec-Net, a quaternion-based Retinex decomposition network tailored for low-light image enhancement. QWR-Dec-Net consists of two key modules: a decomposition module that separates illumination and reflectance, and a denoising module that fuses a quaternion holistic color representation with wavelet multi-frequency information. This structure jointly improves color constancy and noise suppression. Experiments on low-light remote sensing datasets (LSCIDMR and UCMerced) show that QWR-Dec-Net outperforms current methods in PSNR, SSIM, LPIPS, and classification accuracy. The model’s accurate illumination estimation and stable reflectance make it well-suited for remote sensing tasks such as object detection, video surveillance, precision agriculture, and autonomous navigation.
1. Introduction
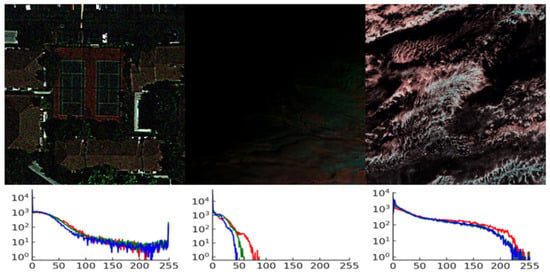
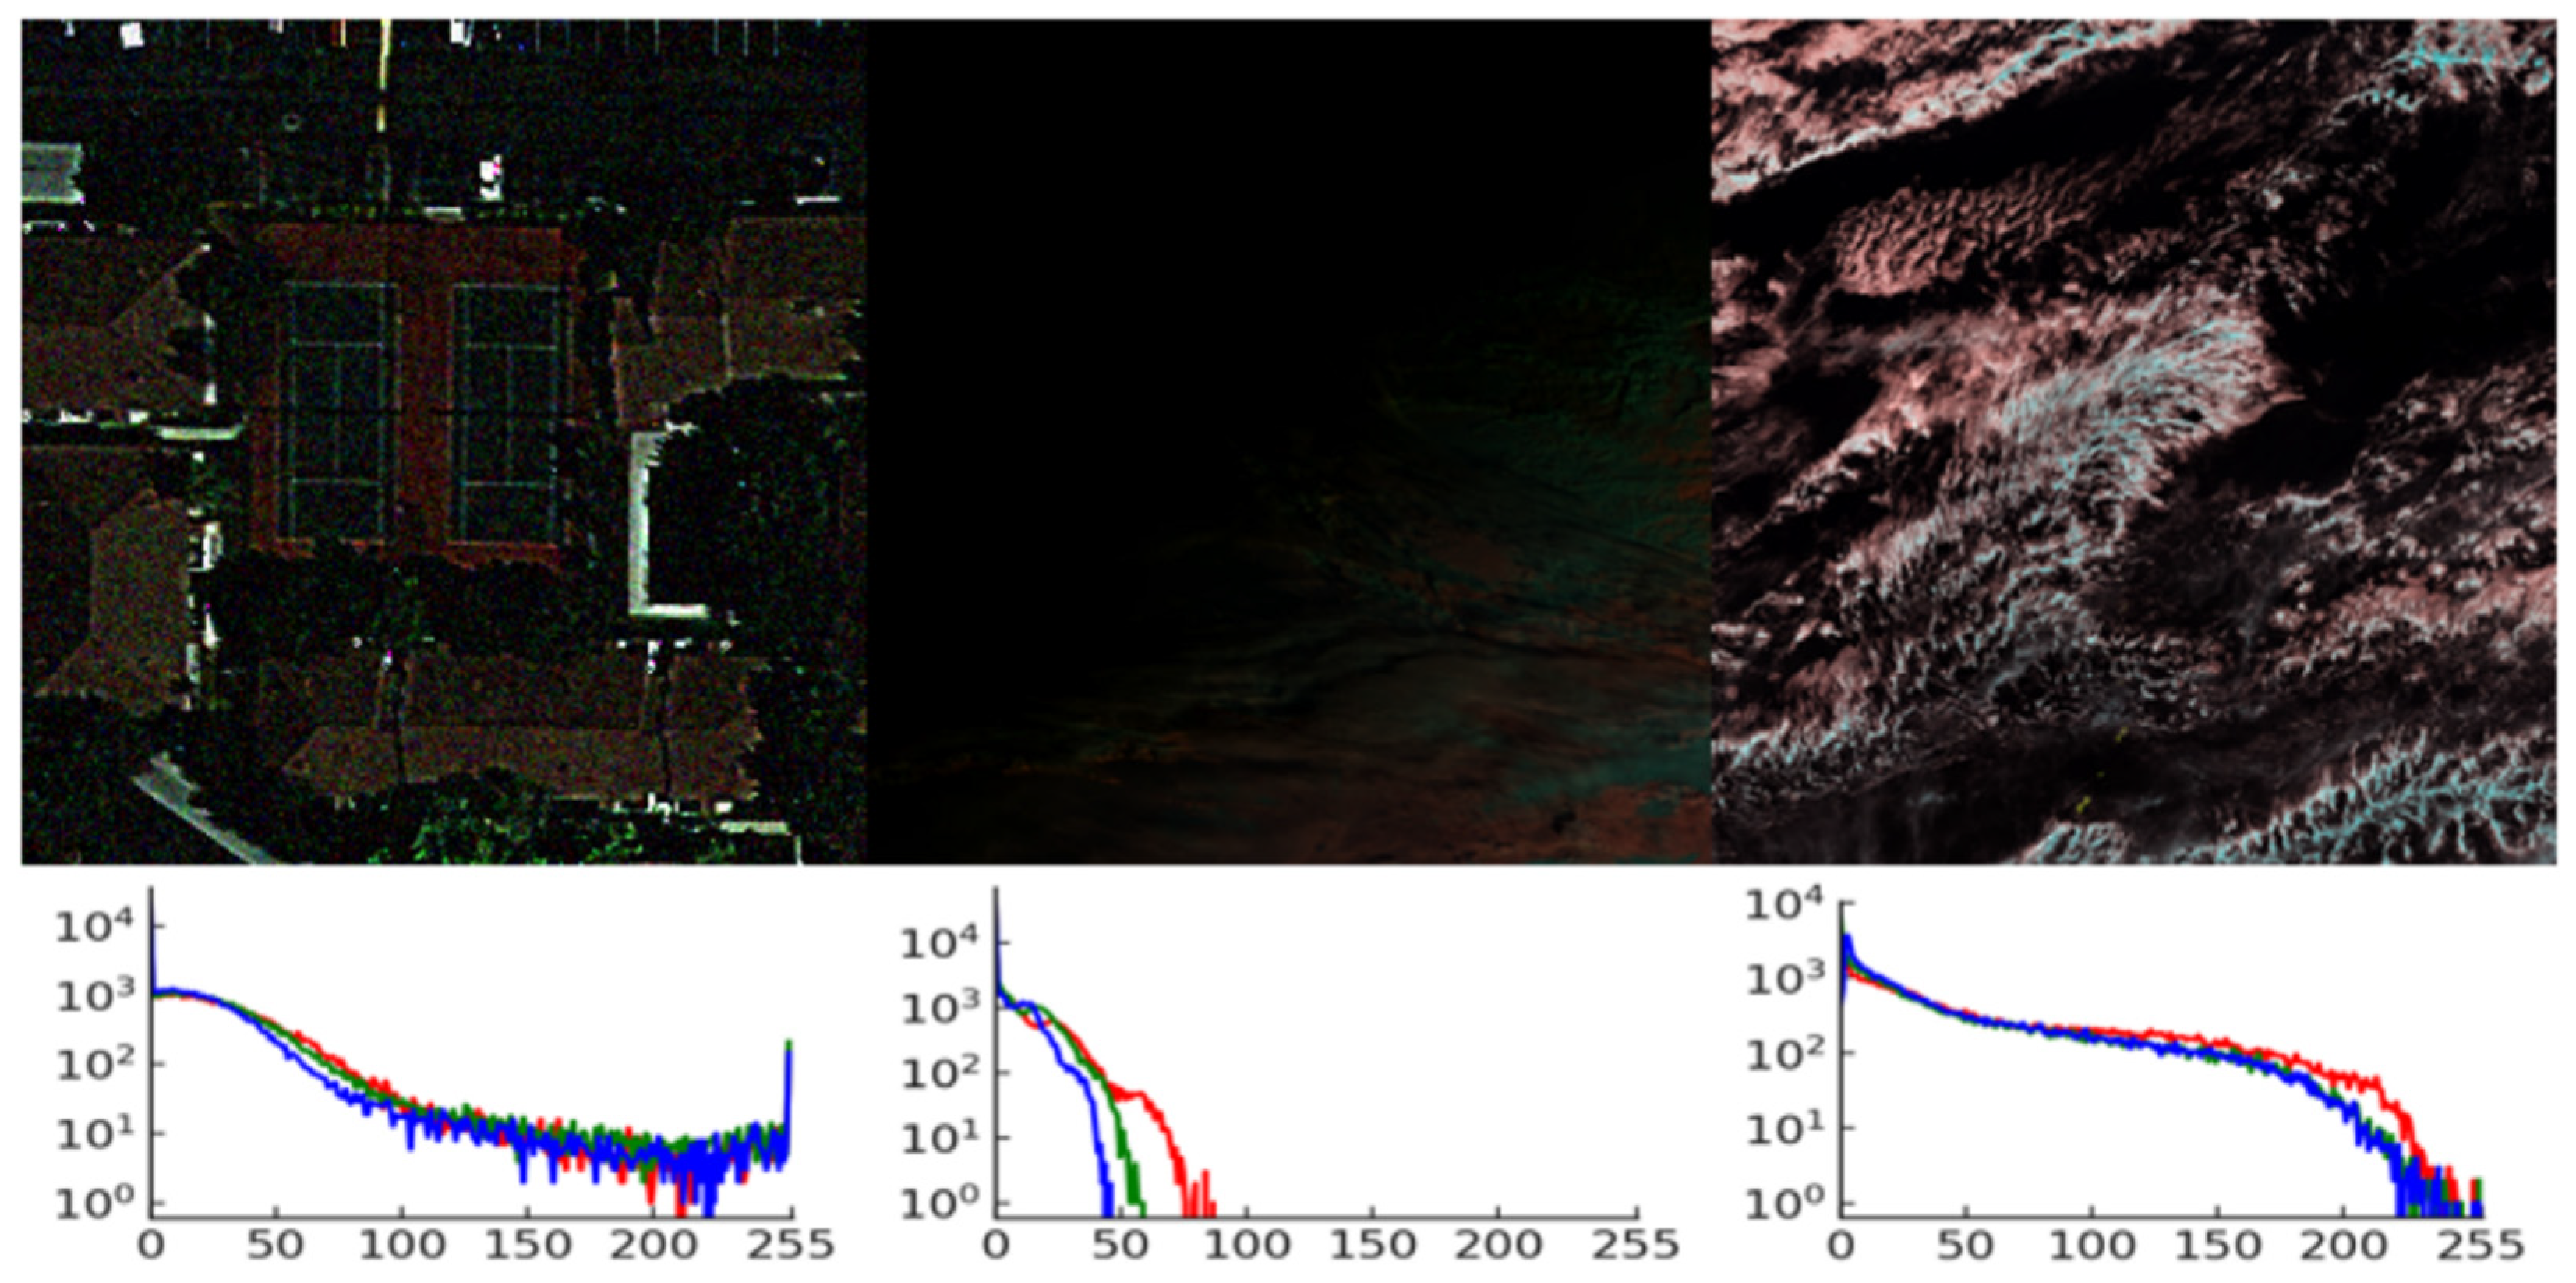
Low-light satellite imagery extends the capabilities of remote sensing by enabling nocturnal observations of Earth’s surface and the analysis of human and natural activities. Nocturnal satellite observation has been used to map urban growth patterns, analyze socioeconomic activity, assess the ecological impacts of light pollution on wildlife, and monitor the consequences of armed conflicts on civilian populations [1,2,3,4,5,6]. However, acquiring high-quality images under limited illumination remains challenging. Nighttime scenes typically exhibit low signal-to-noise ratios, poor contrast, and various artifacts that obscure important surface details [4,7,8,9,10]. Additionally, adverse atmospheric conditions, such as haze, cloud cover, and aerosol particles, combined with inherent sensor limitations further degrade detail visibility and complicate data interpretation. Figure 1 shows examples of low-light remote sensing images alongside their corresponding intensity histograms, illustrating the degradation effects mentioned. Low image quality negatively affects both human visual analysis and automated algorithmic processing, substantially reducing accuracy in downstream tasks such as land cover classification and change detection.
Figure 1.
Representative low-light remote sensing scenes (top row) and their corresponding RGB-channel histograms with color of the histogram representing corresponding channel (bottom row). The log-scale histograms show a high concentration of pixels in the dark range (intensities < 50), characteristic of severely underexposed nighttime images, which present fundamental challenges for enhancement algorithms.
Related weak-signal imaging domains exhibit issues that closely mirror low-light remote sensing. For example, Chen et al. highlight that sonar imagery, which is often used when optical sensing faces limitations, generally shows weak, blurry local details and low-resolution observations. These conditions make it easy for noise and background clutter to mask discriminative cues, making it challenging for learning systems to distinguish visually similar targets when signal strength is low and contrast is poor [11]. This cross-domain parallel aligns with our design goal: enhancement should not just increase overall brightness but also explicitly maintain and reinforce subtle structural details while reducing noise-dominated elements, ensuring that semantic cues stay distinguishable after restoration.
Various low-light image enhancement algorithms have been developed over the years. Early approaches primarily focused on global contrast enhancement, using histogram equalization and its variants [12,13,14]. However, these methods ignore spatial variations in illumination patterns and local image characteristics, leading to over-enhancement, color distortion, and amplification of sensor noise [3,4]. Retinex-based methods have gained prominence by decomposing an observed image into separate illumination and reflectance components [15,16,17,18,19], with advanced models such as LIME demonstrating improved visibility preservation under non-uniform lighting conditions [18]. Nevertheless, traditional Retinex approaches often process the RGB channels independently, leading to color distortion and failing to leverage the natural correlations among color channels [7,20]. Let
denote the observed image, decomposed in the Retinex form
, where
is the reflectance,
is the illumination, and
denotes element-wise multiplication. A key limitation of classical Retinex is that
is not uniquely identifiable, so the recomposition
often satisfies
due to decomposition ambiguity and the approximations imposed during separation [7,17]. This reconstruction error causes loss of fine details, color inconsistencies, and visible artifacts in the improved output. Frequency-domain methods, especially the discrete wavelet transform paired with singular value decomposition, have proven effective by capturing multi-frequency structures [21,22]. Traditional methods struggle to simultaneously achieve sharp detail preservation, accurate color reproduction, and effective noise reduction across various orbital illumination conditions.
Deep learning frameworks have substantially advanced the state of the art. Cai et al. introduced Retinexformer, a transformer-based network that estimates an illumination map and restores details via an Illumination-Guided Transformer, significantly outperforming prior methods [23]. Diffusion models have shown promise, with Jiang et al. proposing DiffLL, a wavelet-based diffusion approach that leverages generative power while using wavelet transforms to accelerate inference [24], and Wang et al. developed Exposure Diffusion, which operates in the RAW domain with a physics-based noise model for improved noise suppression [25]. Specialized techniques for remote sensing have emerged, with Ding et al. combining a lightweight encoder–decoder with a physical-prior-guided diffusion model that achieved superior quality on remote sensing data with roughly 20× faster inference [26]. Efficiency-focused designs include compact architectures that run in real time on edge devices while delivering quality comparable to heavy state-of-the-art models [27]. Makwana et al. introduced LIVENet, a two-stage model that jointly denoises and enhances by replacing the noisy luminance channel with a clean illumination estimate, restoring more natural colors [28]. RetinexMamba combines traditional Retinex decomposition with efficient state-space models, using fused-attention mechanisms and 2D selective scanning to restore details while reducing artifacts [29].
However, directly transferring generic low-light enhancement methods to remote sensing imagery is nontrivial because remote sensing data are affected by sensor-specific noise, atmospheric scattering and path radiance, nonuniform illumination, and mixed nighttime illumination sources (moonlight and artificial lights) at a much larger scene scale than in ordinary photography [30,31].
Low-light conditions in remote sensing arise during nighttime acquisitions and low-illumination scenarios, where radiance is governed by weak natural illumination and/or anthropogenic lighting, and the observed signal is further modulated by atmospheric scattering and sensor acquisition characteristics. Nighttime light remote sensing studies emphasize that the physical formation of nighttime observations and their artifacts differ from daytime optical imagery and consumer low-light photography, motivating dedicated processing strategies and validation protocols [32]. In particular, modern nighttime remote sensing platforms and products enable new applications but are often accompanied by distinct degradations, such as spatially structured noise and radiometric inconsistencies, that can be amplified by naïve enhancement, thereby affecting downstream remote sensing interpretation.
Therefore, research has increasingly concentrated on sensor- and physics-aware restoration methods for low-light remote sensing imagery. for example, Luojia 1-01 nighttime images exhibit a characteristic “glow” around light sources, linked to atmospheric scattering; Bu et al. modeled nighttime scattering using an atmospheric point spread function and used it to restore Luojia 1-01 night-light images [33]. For SDGSAT-1 nighttime light imagery, stripe noise and dark current noise have been explicitly addressed: Zhang et al. proposed a destriping method based on anomaly detection and spectral similarity restoration [34], while Wang et al. introduced panchromatic-guided denoising that removes noise and improves comparability across lunar phases by suppressing moonlight-related perturbations [35]. These studies highlight that remote sensing LLIE commonly requires joint illumination correction and structured-noise suppression while preserving radiometric characteristics relevant for quantitative analysis.
More recently, remote sensing LLIE has incorporated learning-based models tailored to the spatial scale and acquisition characteristics of aerial and satellite imagery. Wang et al. proposed LighterGAN for illumination enhancement of urban UAV imagery, illustrating the viability of adversarial learning under aerial imaging constraints [36]. Yao et al. further emphasized that low-light remote sensing images are typically high-resolution and highly spatially complex, motivating architectures that can model longer-range dependencies efficiently; they proposed a spatial–frequency dual-domain feature fusion network and reported new low-light remote sensing datasets to address the lack of paired training data [37]. In parallel, remote-sensing-specific physical priors are increasingly embedded into end-to-end models: Zhao et al. used an atmospheric scattering model and non-uniform illumination compensation for low-light remote sensing enhancement [38], and Ding et al. combined priors with an end-to-end latent residual diffusion framework designed for low-light remote sensing scenarios [26].
Despite the above progress, existing remote sensing low-light enhancement studies are frequently platform- or sensor-specific, may rely on auxiliary bands/priors tied to a particular instrument, and are often validated on limited scenes or illumination conditions, leaving open challenges in robustness and generalization across diverse remote sensing acquisitions [26]. These limitations motivate the need for a remote-sensing-oriented enhancement approach that can improve visibility under low illumination while suppressing structured sensor noise and avoiding radiometric distortions that may degrade downstream remote sensing tasks.
Despite these advances, several core technical issues remain unresolved. The decomposition ambiguity of Retinex-based methods means that even slight errors in the illumination component estimation significantly distort color fidelity or introduce prominent spatial artifacts [7]. The ill-posed nature of recovering a scene’s appearance under normal lighting from a single low-light image is inherently uncertain and mathematically underdetermined [13,18]. Enhancing severely underexposed regions typically amplifies existing sensor noise and introduces new artifacts, requiring complex denoising procedures that significantly hinder real-time processing or practical onboard satellite deployment [13,18]. Learning biases in supervised models may fail to fully represent the complex diversity of real-world environmental conditions, leading to poor generalization performance. Large transformer- or diffusion-based models risk overparameterization and excessive computational requirements, limiting their practical applicability on resource-constrained platforms such as satellites, UAVs, or mobile devices [23,39].
To address these challenges, we build upon the quaternion Retinex framework, which integrates quaternion algebra with multiscale wavelet transforms to overcome the limitations of traditional Retinex decomposition [40]. This approach treats RGB channels as a unified quaternion entity, enabling the Hamilton product operation to maintain exact, invertible reconstruction while preserving cross-channel dependencies and intrinsic color relationships [41,42,43,44,45,46]. The key contributions of this work are as follows:
- We propose QWR-Dec-Net, a low-light enhancement architecture for satellite imagery that employs quaternion Retinex decomposition to jointly process RGB channels, preserving color fidelity and reducing redundant network parameters.
- We design a wavelet quaternion attention mechanism that adaptively emphasizes informative frequency sub-bands, allowing selective enhancement of texture details and illumination patterns across multiple scales without introducing artifacts.
- We validate QWR-Dec-Net on multiple remote sensing datasets, achieving SSIM scores of 0.710 on LSCIDMR and 0.818 on UCMerced, with corresponding PSNR values of 24.885 dB and 26.541 dB, respectively. The proposed framework also boosts classification accuracy by up to 33.1% over unenhanced images, outperforming existing state-of-the-art techniques.
2. Materials and Methods
2.1. QWR-Dec-Net Architecture
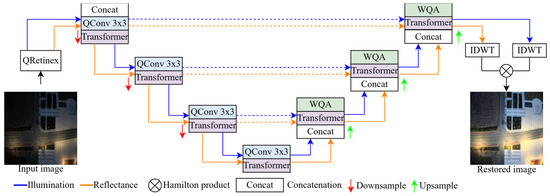
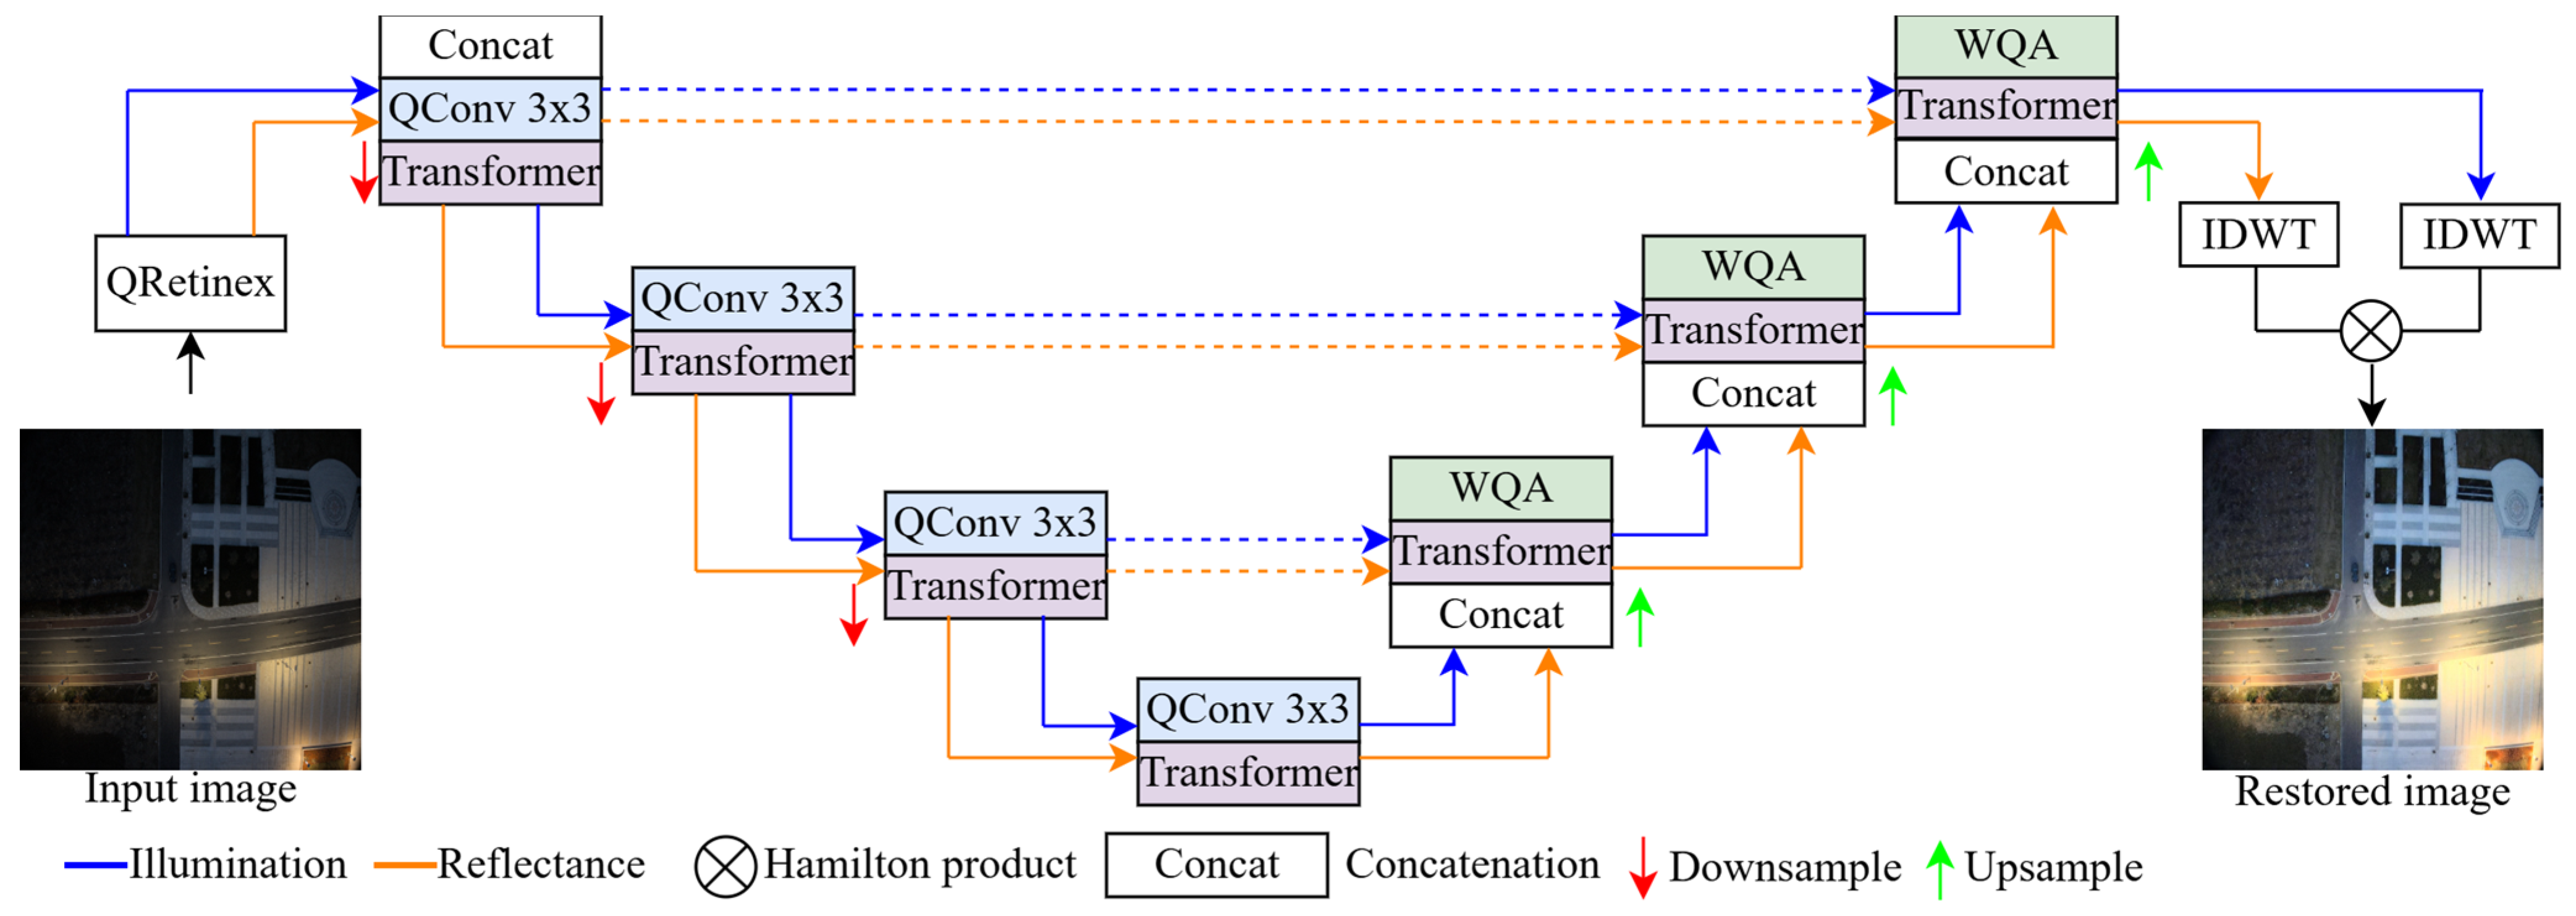
The proposed architecture, illustrated in Figure 2, consists of two principal stages: (i) a decomposition module that factorizes the input into quaternion-valued reflectance and illumination components in the wavelet domain, preserving inter-channel color correlations, and (ii) a refinement module employing a symmetric encoder–decoder structure with multi-scale skip connections, which progressively enhances both components through hierarchical feature fusion and wavelet quaternion attention mechanisms.
Figure 2.
QWR-Dec-Net Overall Architecture. The network processes quaternion-wavelet features with a symmetric U-Net encoder–decoder to simultaneously improve illumination and reflectance. The blue pathway shows illumination processing; the orange pathway shows reflectance. Skip connections maintain spatial details across different scales. Wavelet Quaternion Attention (WQA) modules adaptively weigh frequency bands at each decoder level to reduce noise while preserving structure. The final reconstruction using inverse discrete wavelet transforms (IDWT) and the Hamilton product produces the reconstructed image.
2.1.1. Mathematical Foundations: Quaternion-Wavelet Feature Extraction
Given a low-light RGB image
, we first apply the quaternion Retinex decomposition [40] to obtain initial estimates of the reflectance quaternion
and illumination quaternion
, where
denotes that matrices are quaternion-valued. Each pixel is represented as a pure quaternion (zero real part) [33]:
where
are the quaternion basis elements satisfying
. This representation naturally encodes inter-channel correlations through the non-commutative quaternion multiplication, ensuring that subsequent operations preserve chromatic relationships that would be compromised under independent channel processing [43,47].
To enable multi-scale frequency analysis while maintaining computational efficiency, QRetinex uses a separable 2D Haar discrete wavelet transform (DWT) independently to each quaternion component (real,
,
,
) as an internal representation. For a given component
where
, the transform decomposes it into four frequency-localized sub-bands:
where
captures the coarse approximation (low-frequency content representing gradual illumination variations), while
encode horizontal, vertical, and diagonal high-frequency details (edges, textures, and noise), respectively. The complete wavelet-domain representation consequently contains 16 feature maps per quaternion (4 components × 4 sub-bands). Concatenating both reflectance and illumination quaternions yields a 32-channel feature tensor:
where the spatial dimensions are halved due to the dyadic downsampling inherent in the Haar DWT.
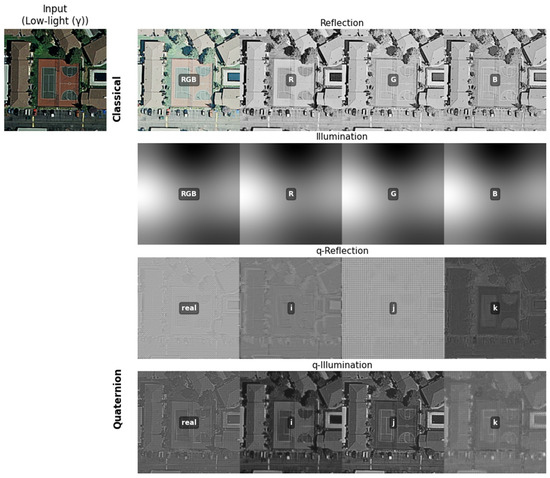
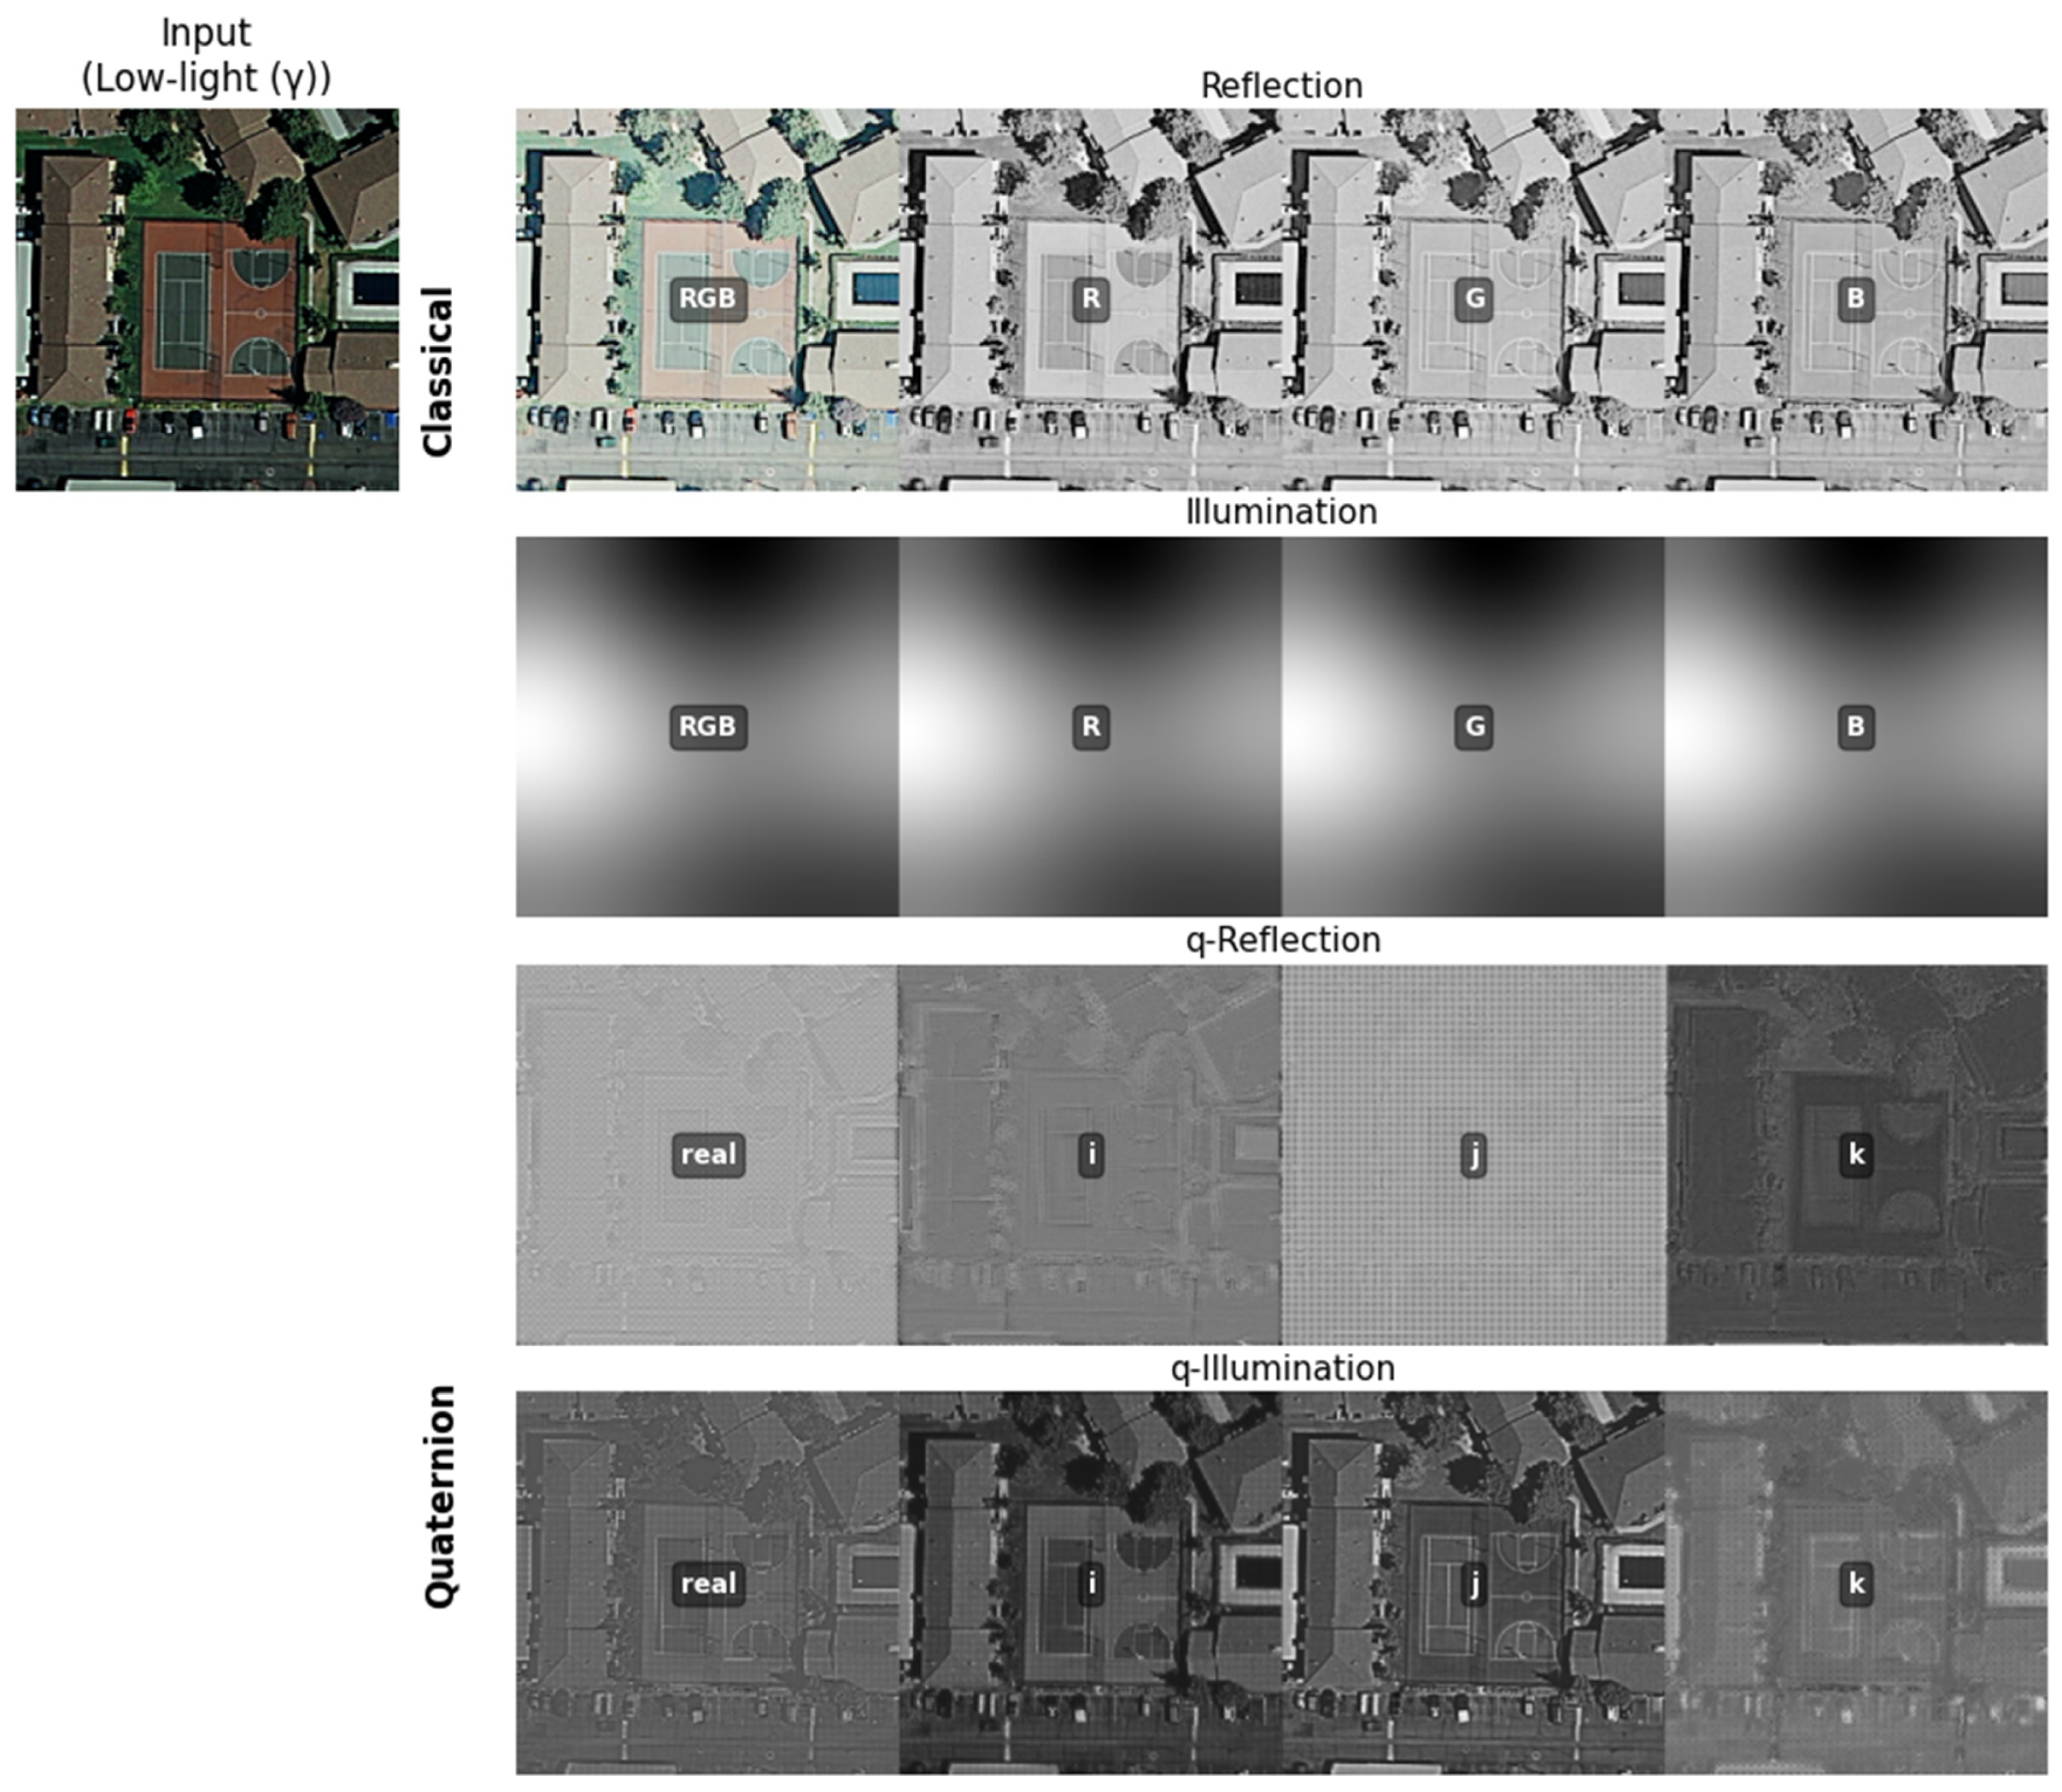
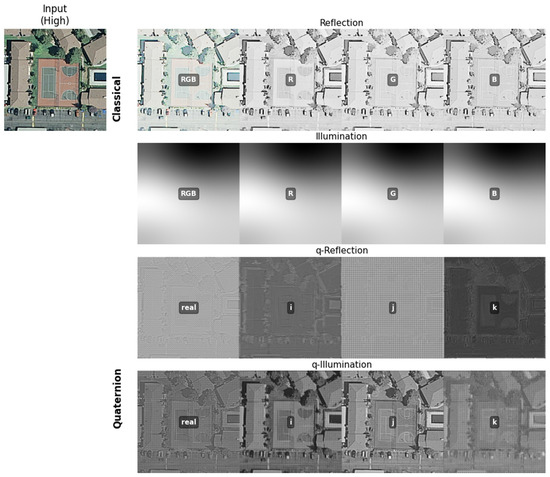
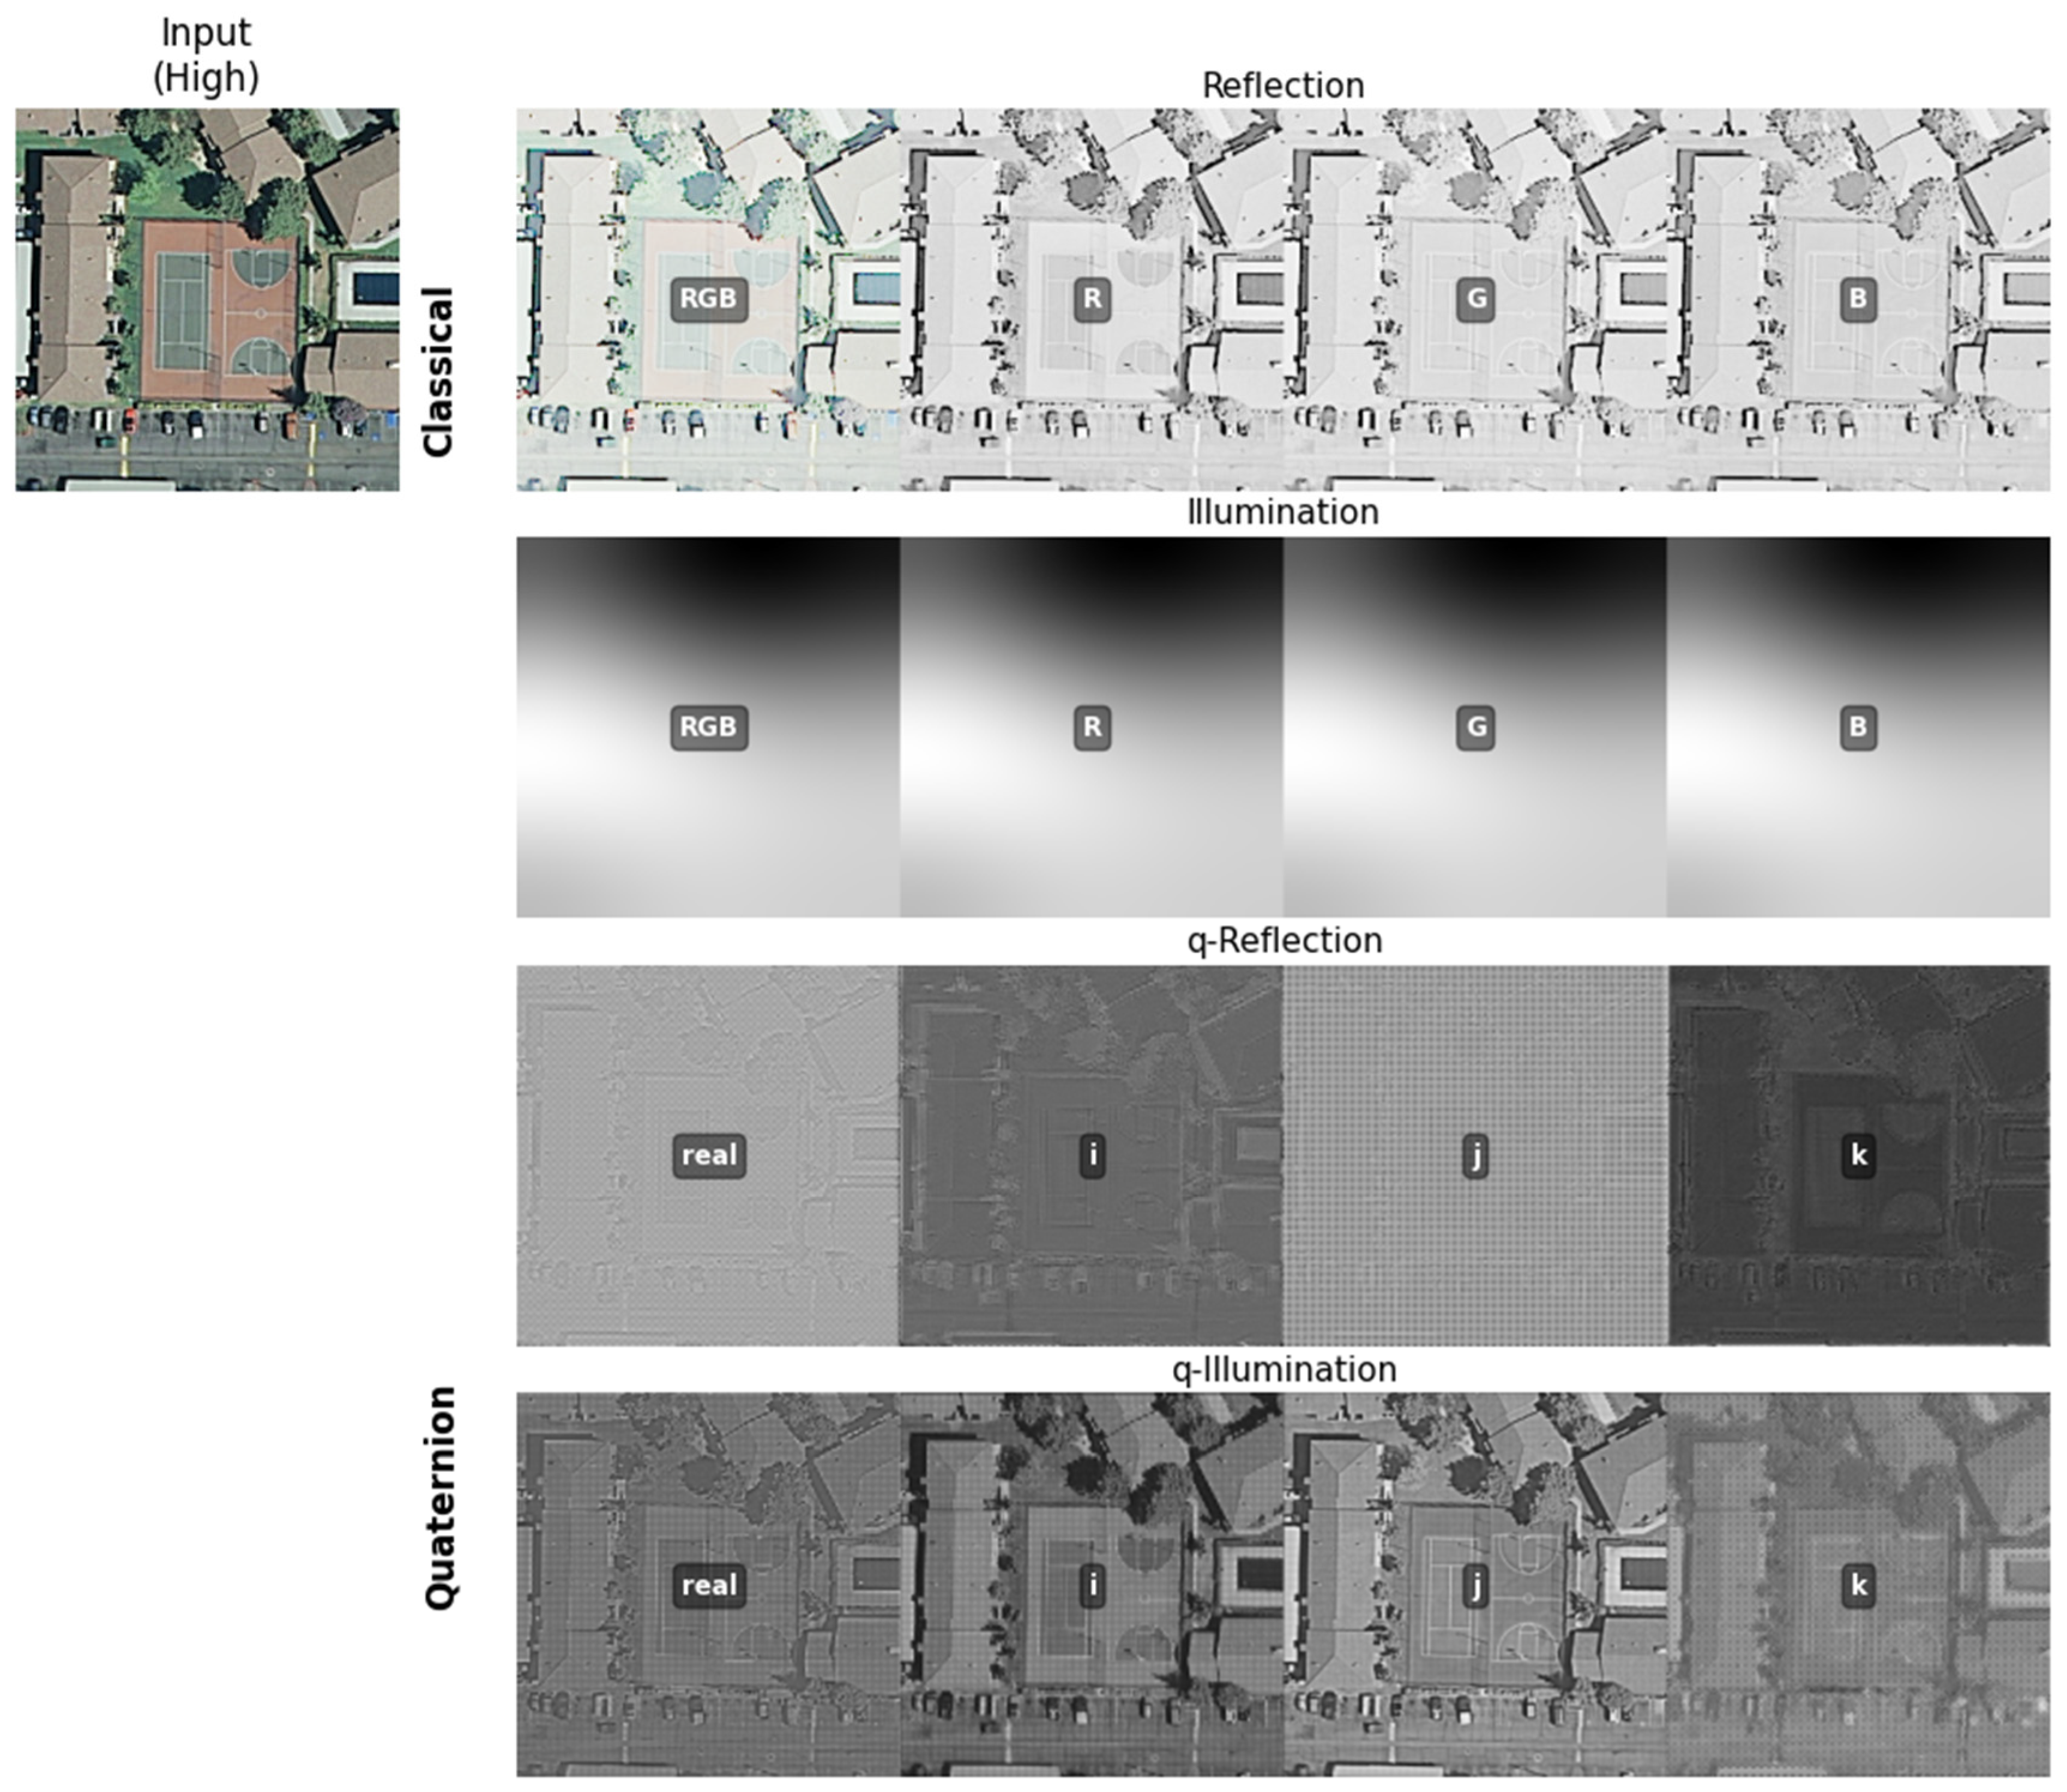
Figure 3 and Figure 4 present a side-by-side comparison of the classical Retinex decomposition and the quaternion-based decomposition applied to the same remote sensing scene under low-light and normal-light conditions, respectively. Both figures illustrate the decomposition of the input image into reflectance and illumination components using each method: the classical approach processes the RGB channels independently, and the quaternion approach treats all channels as a unified entity via real and imaginary quaternion components.
Figure 3.
Comparison of classical Retinex and quaternion-based decomposition for low-light remote sensing imagery. The input low-light image is processed using both classical (first and second rows) and quaternion (third and fourth rows) approaches. Classical decomposition shows individual RGB channel processing with separate reflection and illumination maps, while quaternion decomposition represents the image in unified quaternion form with real and imaginary components (i, j, k) corresponding to RGB channels, demonstrating improved noise resilience and cross-channel consistency.
Figure 4.
Decomposition comparison for high-light conditions using the same remote sensing scene. The quaternion approach maintains consistent reflection properties across varying illumination conditions, exhibiting more stable decomposition characteristics compared to the classical method. The quaternion reflection components (q-Reflection: real, i, j, k) and illumination components (q-Illumination) preserve structural coherence and demonstrate reduced sensitivity to illumination variations, validating the mathematical robustness of the quaternion-based Retinex formulation.
While quaternion wavelet transforms (QWT) [48] offer theoretical advantages for joint scale-phase analysis real-valued Haar DWT is chosen for three practical considerations: (i) computational efficiency—the decimated Haar DWT reduces memory consumption by 8–16× compared to redundant QWT implementations and benefits from optimized GPU kernels in standard deep learning frameworks; (ii) noise localization—real-valued filters prevent the cross-channel noise coupling that occurs in QWT, where noise in one channel can propagate to others through quaternion convolution; (iii) gradient stability—the orthonormal Haar basis ensures perfect reconstruction with well-conditioned gradients during backpropagation, facilitating stable optimization.
2.1.2. Network Architecture
The wavelet-domain feature tensor
is processed through a symmetric U-Net-inspired architecture that simultaneously refines both reflectance and illumination estimates [49]. The encoder comprises
hierarchical levels, each containing three sequential operations:
- Quaternion convolution layer: A quaternion-valued convolution [41] that processes the four quaternion components jointly, preserving rotational equivariance in color space and capturing chromatic dependencies that scalar convolutions would discard;
- Transformer block: Multi-head self-attention [50] for capturing long-range spatial dependencies, particularly critical in low-light images where local neighborhoods may be entirely dark, necessitating information aggregation from distant, well-exposed regions;
- Downsampling operation: Strided convolution ( kernel, stride 2) to reduce spatial resolution by a factor of two, progressively increasing the receptive field.
At each encoder level
, we produce new hierarchical feature representations:
where
denotes the initial feature extraction.
The decoder mirrors this hierarchical structure with symmetric upsampling operations. At each level
, we concatenate encoder features via skip connections to preserve fine-grained spatial details that would otherwise be lost in the bottleneck:
where WQA denotes the Wavelet Quaternion Attention mechanism, applied after each transformer block to enhance informative frequency bands selectively. This encoder–decoder design serves multiple purposes: (i) the hierarchical encoding captures multi-scale contextual information, enabling the network to distinguish between large-scale illumination variations (low frequency) and fine-grained texture/noise (high frequency); (ii) skip connections mitigate the vanishing gradient problem and prevent loss of spatial details in the bottleneck; (iii) symmetric processing of reflectance and illumination ensures that both components receive equal representational capacity, avoiding the common pitfall of over-prioritizing one factor at the expense of the other.
Following multi-scale refinement in the encoder–decoder, the final feature maps are split into separate reflectance and illumination streams:
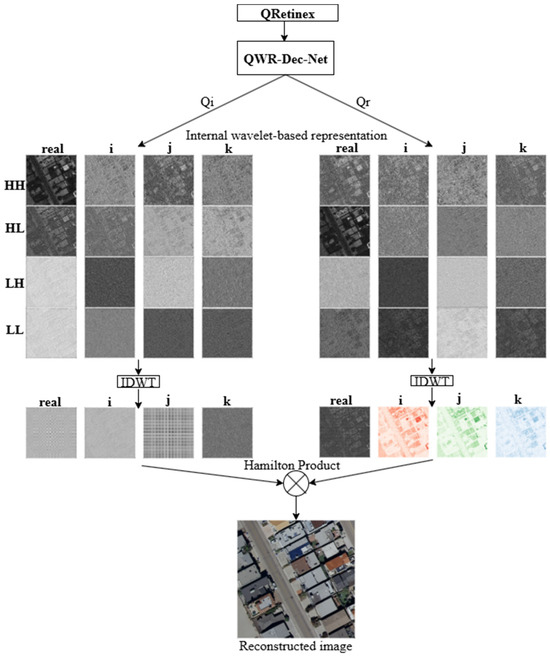
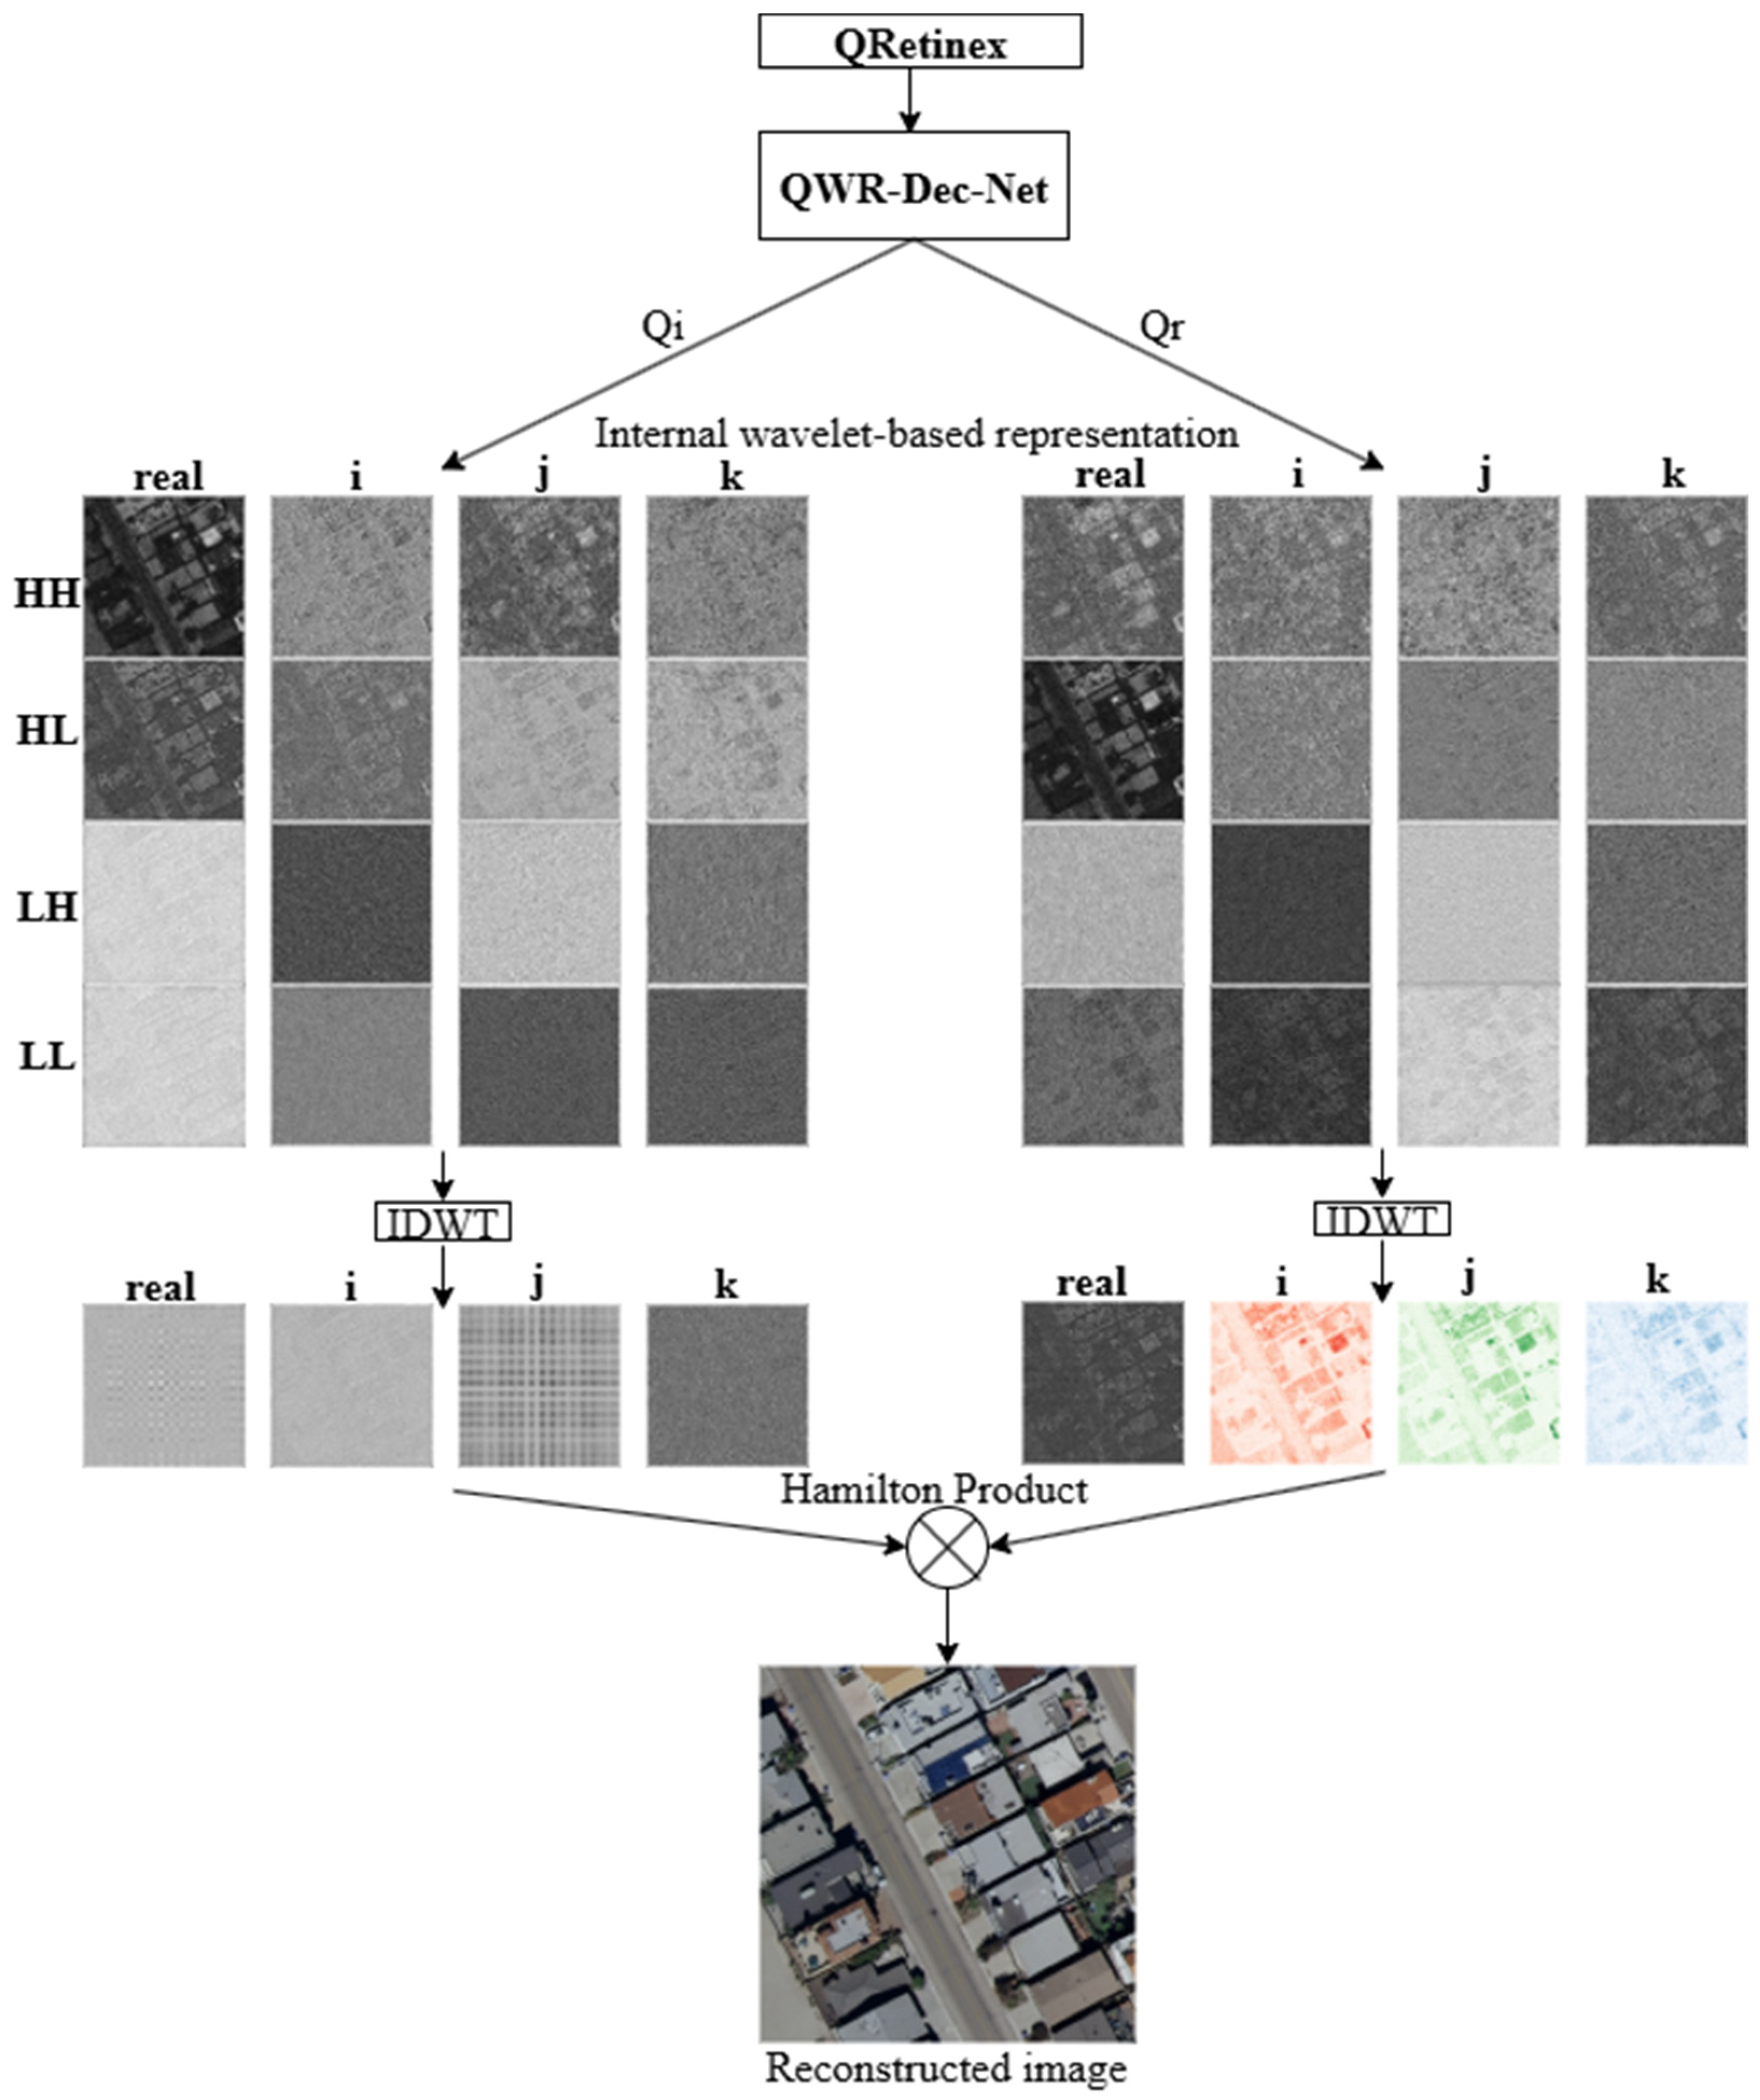
where each component resides in the wavelet domain. We apply the inverse Haar wavelet transform (IDWT) to each quaternion component independently, reconstructing spatial-domain quaternion images:
The final enhanced RGB image is obtained by computing the quaternion Hamilton product at each pixel location:
where
denotes quaternion multiplication defined by the Hamilton product. For two quaternions
and
, the product is computed as:
Although the input RGB pixel is encoded as a pure quaternion with zero scalar (real) part, all internal operations are performed in the full quaternion algebra, so intermediate reflectance/illumination estimates and their Hamilton-product reconstruction may yield a non-zero scalar component. This scalar term is treated as an internal latent and is discarded at the output stage; the final enhanced RGB image is formed only from the imaginary components. The imaginary components
of the resulting quaternion correspond to the enhanced
channels, which are extracted to form the final output. The complete QWR-Dec-Net enhancement pipeline is formalized in Algorithm 1.
| Algorithm 1: QWR-Dec-Net Low-Light Enhancement |
| Input:
Output: |
Stage 1: Quaternion Retinex Wavelet Decomposition
|
This proposed reconstruction pipeline ensures lossless information flow through two mathematical properties: (i) the orthonormal Haar wavelet basis guarantees perfect reconstruction (
); (ii) the Hamilton product is invertible for non-zero quaternions (which is satisfied in practice since illumination components are strictly positive). This invertibility is critical for preserving fine spatial details in severely underexposed regions where conventional enhancement methods would irreversibly lose information.
By integrating quaternion algebra with real-valued wavelet analysis, the QRetinex representation offers a robust, data-driven alternative to traditional Retinex models, achieving superior color fidelity and noise suppression under challenging low-light conditions. Figure 5 illustrates the internal wavelet-based decomposition and final reconstruction pipeline.
Figure 5.
Internal wavelet-based representation and last stage of the QWR-Dec-Net. Estimated reflectance and illumination quaternions are reconstructed via inverse wavelet transform (IDWT), and then recombined using the Hamilton product to form the final enhanced image.
2.1.3. Wavelet Quaternion Attention Mechanism
The goal of an attention mechanism is to help a machine learning model focus on the most relevant parts of the data input while ignoring irrelevant information [51,52]. It works by assigning weights to different input elements, allowing the model to concentrate on the most important features for a specific task, such as translating a word or recognizing objects in an image. This ultimately improves performance, accuracy, and contextual understanding in complex system tasks. To enable adaptive feature selection in the joint quaternion-wavelet domain, we introduce the Wavelet Quaternion Attention (WQA) module (Figure 6). This mechanism operates on feature tensors that simultaneously encode color correlations via quaternion representation, and frequency localization via wavelet decomposition, allowing the network to selectively suppress noise-dominated frequency bands while enhancing structure-preserving components.
Figure 6.
Wavelet Quaternion Attention (WQA) Block. Detailed schematic of the Wavelet Quaternion Attention mechanism. The module operates in three stages: (i) local context extraction via
quaternion convolution, reducing dimensionality from
to
while preserving inter-component relationships; (ii) global channel importance estimation through spatial average pooling followed by a two-layer bottleneck MLP (reduction ratio
) with ReLU and sigmoid activations; (iii) feature recalibration via channel-wise element-wise multiplication (). Tensor dimensions are annotated at each stage. Operating on wavelet-transformed quaternion representations, WQA adaptively suppresses noise-dominated high-frequency sub-bands (e.g.,
diagonal details corrupted by sensor noise) while enhancing structure-preserving low-frequency components (e.g.,
approximations capturing illumination gradients), all while respecting chromatic dependencies encoded in the quaternion domain.
The WQA module consists of three sequential stages:
Stage 1: Local context extraction. Given an input quaternion feature tensor
(where
accounts for the four quaternion components—scalar,
,
,
—across
base channels), we first apply a
quaternion convolution to extract spatially localized context:
This operation reduces the quaternion dimensionality while preserving inter-component relationships through the Hamilton product kernel.
Stage 2: Global channel attention computation. We compute channel-wise global statistics via spatial average pooling:
yielding a compact descriptor
that encodes the global distribution of each channel. This descriptor is subsequently transformed through a two-layer multi-layer perceptron (MLP) with a bottleneck structure:
where
and
implement dimensionality reduction and expansion with reduction ratio
,
denotes the Rectified Linear Unit activation, and
is the sigmoid function producing normalized attention weights in
.
Stage 3: Feature recalibration. The learned attention weights are spatially broadcast and applied via element-wise multiplication:
where
denotes the Hadamard product (element-wise multiplication). The recalibrated features are then reintegrated into the main processing stream via a residual connection:
The WQA module exploits two critical properties of the quaternion-wavelet representation: (i) because
originates from wavelet-transformed features, different channels encode distinct frequency characteristics (e.g.,
approximation vs.
diagonal details); (ii) because features are processed through quaternion convolutions, the attention mechanism operates on color-coupled representations rather than independent RGB channels. Consequently, the learned weights
can simultaneously downweight noise-corrupted high-frequency bands (which exhibit low signal-to-noise ratios in dark regions) and emphasize structure-preserving low-frequency components, all while respecting chromatic dependencies encoded in the quaternion domain. This dual-domain selectivity cannot be achieved by standard channel attention mechanisms operating on conventional RGB feature maps.
2.1.4. Implementation Details
The base channel dimension is set to
at the initial encoder level, progressively expanding to
at the bottleneck (level
) to increase representational capacity in the abstract feature space. Transformer blocks employ 4 attention heads with a per-head dimension
, yielding a total attention dimension of
.
We optimize the network parameters end-to-end by minimizing the Charbonnier loss, a robust variant of the
distance that approximates absolute error while maintaining smoothness and differentiability:
where
denotes the network output,
is the ground-truth well-illuminated reference,
represents the Frobenius norm (summed over all pixels and channels), and
is a small constant that ensures numerical stability near zero.
Compared to the widely used mean squared error (MSE or
loss), the Charbonnier function offers three advantages specific to low-light enhancement: (i) outlier robustness—the square-root term reduces the influence of extreme pixel errors caused by shot noise or hot pixels, preventing the network from over-fitting to noise; (ii) edge preservation—the
-like behavior near zero encourages sparse gradients, producing sharper edges compared to the over-smoothing tendency of
loss; (iii) gradient stability—unlike the non-smooth
loss (which has undefined gradients at zero), the Charbonnier function is continuously differentiable everywhere, facilitating stable gradient descent in regions of high uncertainty (i.e., extremely dark areas where ground truth is ambiguous).
Network parameters are optimized using the AdamW optimizer [53] with momentum parameters
and
, initial learning rate
, and weight decay coefficient set to zero (as quaternion convolutions are inherently parameter-efficient, rendering explicit regularization unnecessary). The learning rate follows a cosine annealing schedule [54] for 200 epochs with minimum learning rate
.
Training images are randomly cropped to
patches and organized into mini batches of size 8. To improve generalization across varying scene geometries and illumination configurations, we apply random horizontal and vertical flips with 0.5 probability, as well as random rotations sampled uniformly from
. No color jittering or photometric augmentation is applied, as such transformations would violate the physical coupling between reflectance and illumination components fundamental to Retinex theory. All experiments are conducted on a single NVIDIA A100 GPU (40 GB VRAM) using PyTorch 2.0.1 with CUDA 11.8.
2.2. Datasets
For the experiments, we employ two datasets: LSCIDMR and UCMerced.
LSCIDMR [55]: It contains 104,390 high-resolution images, covering 10 classes with two different annotation methods: (1) single-label annotation; (2) multiple-label annotation, referred to as LSCIDMR-S and LSCIDMR-M, respectively. The labels are annotated manually, yielding 414,221 multiple labels and 40,625 single labels. First, 10,000 images were selected for the classification task, balanced across the ten cloud classes and randomly split into 80% for training and 20% for testing. The remaining images were filtered to form a separate set of 4000 images for low-light enhancement experiments, distributed evenly across classes and split 80/20 into training and validation sets. In both cases, synthetic low-light images were generated by first applying a gamma transformation:
with
uniformly sampled between 2 and 5, followed by additive Gaussian noise
where
was drawn from a random distribution in the range
. The resulting low-light images were saved alongside their original counterparts to enable paired training for enhancement and to provide both normal-light and degraded test sets for classification.
UC Merced [42]: The UC Merced Land dataset consists of 2100 RGB images, each with a resolution of 256 × 256 pixels, evenly spread across 21 land-use classes. There are 100 images per class. Each class was split into 80% for training and 20% for testing, resulting in a normal-light training set and a paired normal-light and low-light test set. The images were manually extracted from large USGS National Map Urban Area Imagery files for various urban areas across the country. The pixel resolution of this public domain imagery is 1 foot. The same low-light image-generating procedure was applied as for LSCIDMR.
2.3. Metrics
We measure enhancement performance using three standard image-quality metrics: PSNR, SSIM, and LPIPS [56,57]. The peak signal-to-noise ratio (PSNR) measures the fidelity to the original, well-lit image using the mean squared error. It is defined as
where
is the ground truth,
is the enhanced image,
is the maximum intensity, and
represents the mean squared error between the ground-truth image and the enhanced image.
The structural similarity index measure (SSIM) jointly compares luminance, contrast, and structure between a reference image
and its enhanced counterpart
:
with the three comparison functions
Here
,
are the local means;
,
are the local variances;
is the local cross-covariance;
are small positive constants that stabilize the division and
are weighting exponents. Setting
represents the single-fraction form of SSIM.
The Learned Perceptual Image Patch Similarity (LPIPS) metric measures perceptual differences in a deep feature space, capturing subtle variations in texture and color.
ConvNeXt accuracy and Swin-T accuracy report the top-1 classification accuracy of two standard modern backbones ConvNeXt [58] and Swin Transformer [59] evaluated on the enhanced test images, and are included as an indicator of semantic/feature preservation beyond pixel-level metrics.
On unpaired dataset DarkRS, we report no-reference quality metrics BRISQUE, NIQE, and PIQE [60,61,62]. Because NIQE is based on natural-scene statistics, absolute NIQE values may be shifted on remote-sensing imagery; therefore, we interpret NIQE comparatively across methods on the same dataset.
2.4. Compared Methods
We used a representative collection of low-light enhancement methods for comparison. All deep learning-based methods (ZeroDCE [63], RetinexNet [20], RetinexFormer [23], LYT-Net [64], HVI-CIDNet [65], and RetinexMamba [29]) were trained for 200 epochs on 256 × 256 image patches, using a batch size of 8 and a learning rate of
; the rest of their hyperparameters followed the recommended configurations from the respective publications. LIME, the only non-deep-learning method evaluated, was used with its default settings. Together, these methods represent a range of strategies, Retinex-based frameworks, wavelet-based attention mechanisms, transformer architectures, and state-space models, offering a diverse and representative set of low-light enhancement techniques.
- ZeroDCE [63] learns pixel-wise tonal adjustments in a self-supervised manner, enforcing smooth and monotonic enhancement curves without relying on paired images.
- LIME [18] refines an illumination map within a Retinex-based framework to preserve structural details and enhance visibility in dark regions.
- RetinexNet [20] similarly decomposes the image into reflectance and illumination components but employs distinct deep networks for each component, aligned with Retinex theory.
- RetinexFormer [23] integrates a transformer architecture into a one-stage Retinex model, leveraging illumination-guided self-attention to capture long-range dependencies in underexposed areas.
- LYT-Net [64] processes images in YUV space and fuses luminance and chrominance using transformer-based attention blocks to ensure accurate color rendition.
- HVI-CIDNet [65] adopts a custom HVI color transform to separate hue–value from intensity, using a dual-branch network with cross-attention to suppress noise and maintain color consistency.
- DFFN [37] leverages Fourier-domain modeling to capture long-range spatial correlations in high-resolution low-light remote-sensing imagery without the computational overhead of global self-attention. It decomposes enhancement into an amplitude-learning stage for brightness restoration and a phase-learning stage for detail refinement, coupled via an information-fusion affine block to exchange multi-scale features across stages.
3. Results
3.1. Results on LSCIDMR
Table 1 summarizes the quantitative performance of each enhancement method on the LSCIDMR dataset, while Figure 7 provides a visual comparison. ZeroDCE and LIME both demonstrate limited effectiveness in recovering lost detail from severely darkened inputs, as they considerably alter the color balance and produce noticeable noise, as reflected by their lower SSIM values (0.121 and 0.281, respectively) and higher LPIPS values. Visually, in Figure 7, these methods tend to overamplify noise in the sky regions, causing speckled artifacts and unnatural brightness in cloud formations.
Table 1.
Quantitative comparison on the LSCIDMR dataset. Each method is evaluated using SSIM and PSNR (higher is better), and LPIPS (lower is better). Classification accuracy is presented for ConvNeXt and Swin Transformer. “Baseline” refers to the original, well-lit images with no degradation, while “No Enhancement” utilizes the darkened test set without any processing. Bold indicates the best value for each metric among compared methods.
Figure 7.
Visual examples of low-light enhancement for selected LSCIDMR images. The first row shows (from left to right) the ground truth (GT), ZeroDCE result, and LIME result. The second and third rows present outputs from RetinexNet, RetinexMamba, RetinexFormer, LYT-Net, HVI-CIDNet, and the proposed method.
RetinexNet exhibits moderately improved noise characteristics compared to ZeroDCE and LIME, but it still suffers from color distortions. Its mid-range SSIM (0.351) indicates residual color shifts and lost details, with some features remaining heavily saturated. RetinexMamba achieves significantly better overall reconstruction, with an SSIM of 0.704 and PSNR of 24.851; it suppresses much of the high-frequency noise and preserves key cloud contours. RetinexFormer, another decomposition-based method, offers a similar level of perceptual quality, although its classification accuracy dips compared to RetinexMamba, suggesting residual artifacts that hinder the network’s ability to restore clouds in the ocean region. LYT-Net adopts a global adjustment strategy but tends to under-brighten certain ocean and land regions, generating artifacts not presented in the original image or the training dataset. HVI-CIDNet leverages color-space transformations to mitigate noise and preserve color fidelity, achieving higher classification accuracy (0.697 and 0.797) compared to most baseline methods, while also delivering perceptually cleaner enhancements. However, it is still unable to restore small clouds in the ocean.
The proposed QWR-Dec-Net achieves the highest SSIM (0.710) and PSNR scores (24.885), indicating its effective balance of brightness restoration, noise suppression, and color consistency. In the visual examples, the delicate cloud edges are better preserved, and the land-cloud boundaries appear more natural than in competing methods. This improvement extends to classification performance: low-light images yield an accuracy under 0.45 in ConvNeXt, and methods like RetinexNet reach 0.52, QWR-Dec-Net attains 0.776, outperforming RetinexMamba’s 0.774 and other approaches. A similar trend is observed in the Swin Transformer classifier, where the proposed model’s accuracy (0.815) is comparable to RetinexMamba’s (0.816) and surpasses those of RetinexFormer and LYT-Net. These findings indicate that the quaternion-wavelet Retinex decomposition better preserves both low-frequency illumination cues and high-frequency textural details, thereby improving both downstream cloud classification and visual fidelity.
3.2. Results on UCMerced
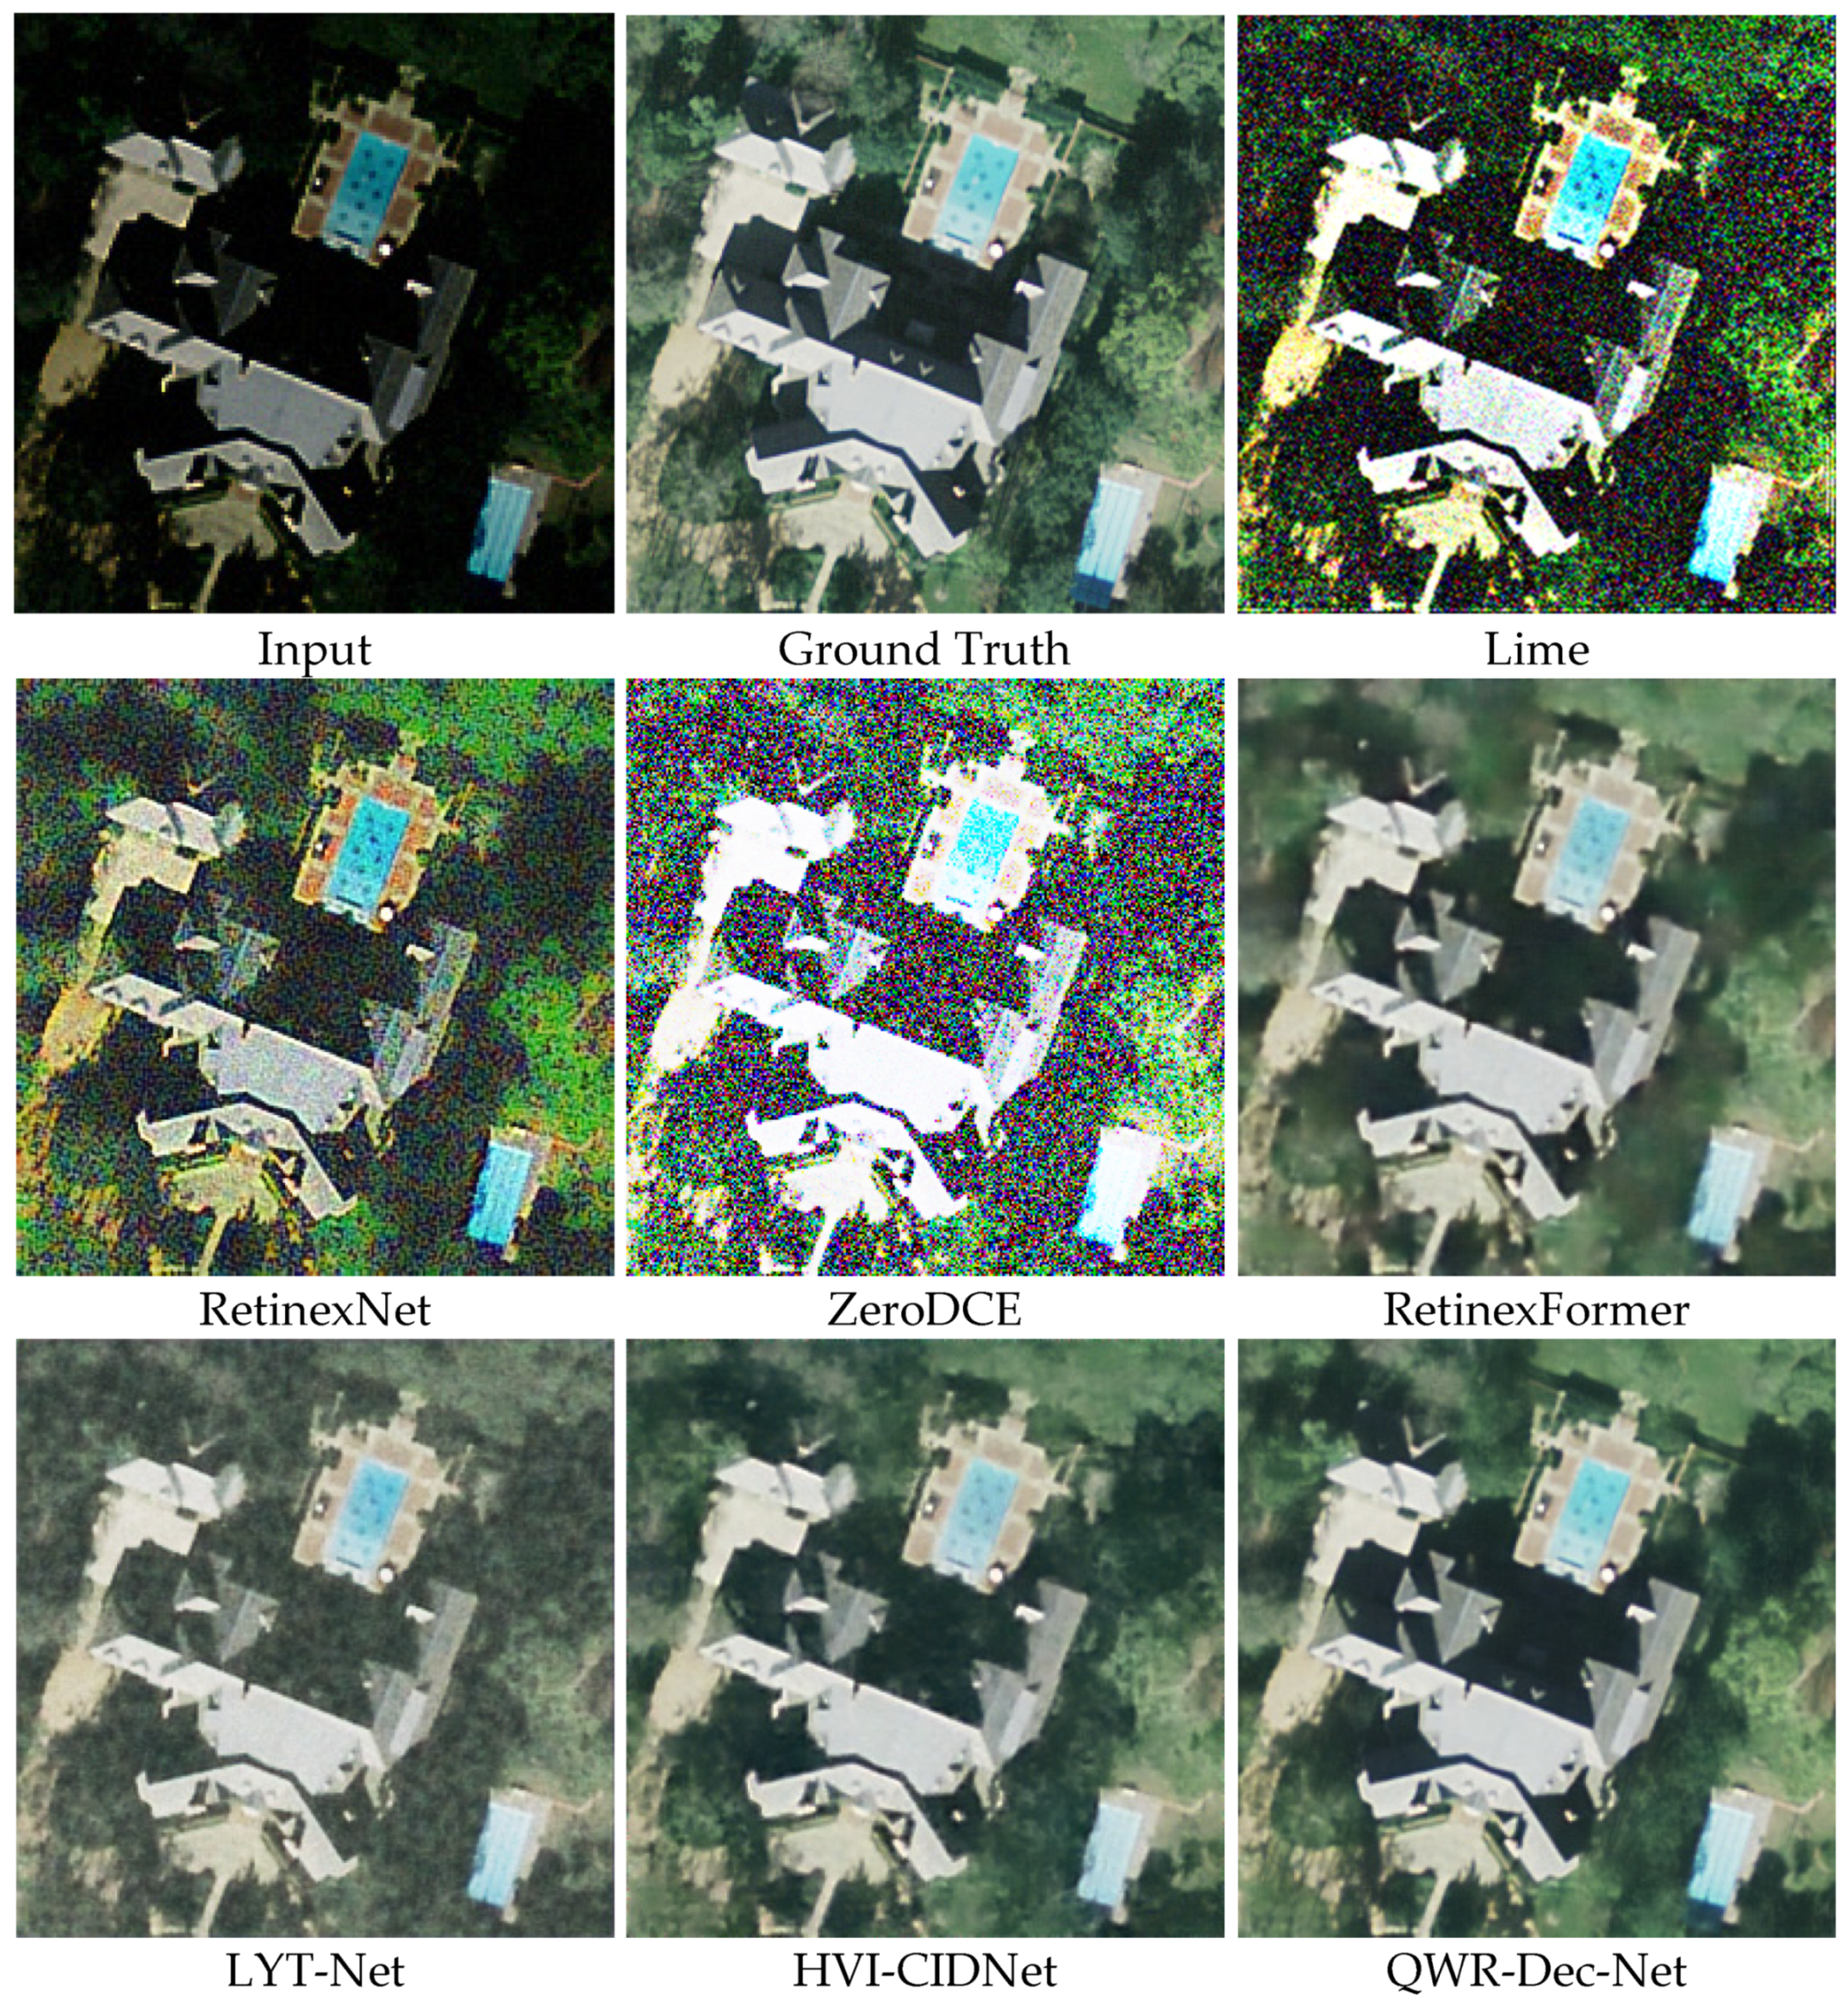
Table 2 presents the quantitative results for low-light enhancement on the UCMerced dataset. Figure 8 illustrates visual results. ZeroDCE and LIME exhibit the same drawbacks seen in the LSCIDMR evaluations, producing intense noise and unnatural brightness in overly dark areas. These artifacts are reflected in their low SSIM (0.290 and 0.282, respectively) and high LPIPS values. RetinexNet (SSIM = 0.423) suppresses some noise, yet its final output retains color distortions and graininess, most evident in the areas around the building rooftop and the pool.
Table 2.
Comparison of performance results on the UCMerced dataset, focusing specifically on low-light conditions. Each method is evaluated using SSIM, PSNR, LPIPS, and classification accuracy, with ConvNeXt and Swin Transformer used. “Baseline” refers to the original, unmodified images, while “No Enhancement” indicates that no correction was made to the degraded input. Bold indicates the best value for each metric among compared methods.
Figure 8.
Representative UCMerced images showcasing enhancement outputs. The top row shows the ground truth (GT), ZeroDCE, and LIME results; the middle row includes RetinexNet, RetinexMamba, and RetinexFormer; and the bottom row presents LYT-Net, HVI-CIDNet, and the proposed QWR-Dec-Net. Note improvements in visual clarity, especially around building roofs and vegetated areas.
By contrast, RetinexMamba demonstrates a strong capacity to recover structure (SSIM = 0.808), with fewer obvious artifacts in dark regions and more balanced tones. The high classification accuracy (0.923 on ConvNeXt and 0.947 on Swin Transformer) further confirms its effectiveness in preserving meaningful features. RetinexFormer delivers visual results on par with RetinexMamba, suppressing much of the background noise and sharpening the edges of objects. It achieves a slightly higher PSNR (25.604) but similar SSIM (0.791), suggesting that its improvements are partly due to enhancing subtle details. However, LYT-Net appears to underenhance certain dark patches, providing a smoother but slightly hazy rendition; its SSIM (0.730) is lower than RetinexFormer, and the residual dimness may also explain the lower classification scores (0.857, 0.864). HVI-CIDNet achieves a decent enhancement with noticeable gains in clarity. Its intermediate SSIM (0.756) and relatively low LPIPS (0.217) align with its strong classification accuracy (0.907, 0.916), indicating that improved color consistency and local contrasts benefit downstream recognition.
The proposed QWR-Dec-Net surpasses alternatives in both fidelity and classification. Its SSIM (0.818) and PSNR (26.541) are the highest among the tested methods, reflecting an optimal balance between noise suppression, brightness restoration, and detail retention. Visually, in Figure 8, fine textures around the structure’s roof and the surrounding vegetation remain crisp, free of color shifts or heavy smoothing. These improvements also translate into superior performance on both classifiers, achieving 0.926 accuracy on ConvNeXt and 0.950 on Swin Transformer, trailing only slightly behind the ideal no-degradation baseline. The results underscore that quaternion-wavelet Retinex decomposition not only mitigates underexposure but also preserves critical structural cues crucial for classification tasks.
3.3. Results on Real Low-Light Remote-Sensing Images
Prior experiments relied on synthetic low-light generation using gamma transformation plus additive noise. To evaluate robustness under realistic acquisition conditions, we additionally test two real-image benchmarks that cover both paired and unpaired settings. All learnable enhancement methods are trained on the iSAID2 training split using paired supervision, then evaluated on two conditions. The first dataset is the iSAID2 validation split, which provides 66 paired samples consisting of low-light inputs and corresponding normal-light ground-truth images, enabling reference-based evaluation using PSNR, SSIM, and LPIPS. The second dataset, DarkRS, contains 86 genuine nighttime UAV images and does not provide ground-truth labels. DarkRS is therefore evaluated using the no-reference metrics BRISQUE, NIQE, and PIQE, and we additionally report the average inference time per image in ms. During inference on DarkRS, all methods process images at a resolution of 1024 × 1024.
All trainable baselines are retrained on iSAID2 under aligned settings where applicable, for 200 epochs, batch size 8, 128 × 128 random patches, and learning rate 1 × 10⁻⁴, rather than relying on natural-image pretrained weights. LIME is applied using its default analytic configuration, and its runtime reflects CPU execution.
Table 3 shows that QWR-Dec-Net achieves the strongest overall performance in both settings. On the paired iSAID2 validation split, QWR-Dec-Net attains PSNR 26.118 dB, SSIM 0.902, and LPIPS 0.194, which are the best values among all compared methods. Relative to the strongest competing baselines, QWR-Dec-Net improves PSNR by 0.581 dB over DFFN, increases SSIM by 0.010 over HVI-CIDNet, and reduces LPIPS by 0.023 compared with DFFN.
Table 3.
Real-image evaluation on iSAID2 and DarkRS. Paired results are reported on the iSAID2 validation set using PSNR and SSIM (higher is better), and LPIPS (lower is better). Real unpaired results are reported on DarkRS using the no-reference metrics BRISQUE, NIQE, and PIQE (lower is better), together with average inference time measured on DarkRS in milliseconds per image. For timing, all DarkRS images are processed at a resolution of 1024 × 1024. All trainable methods are retrained on iSAID2 training data under aligned settings. Bold indicates the best value for each metric.
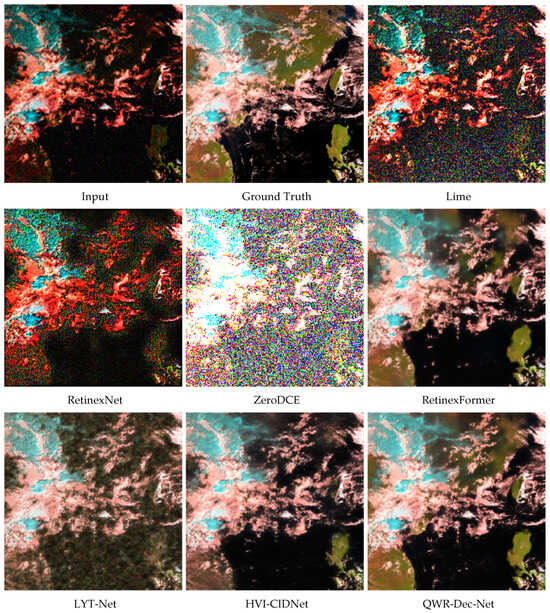
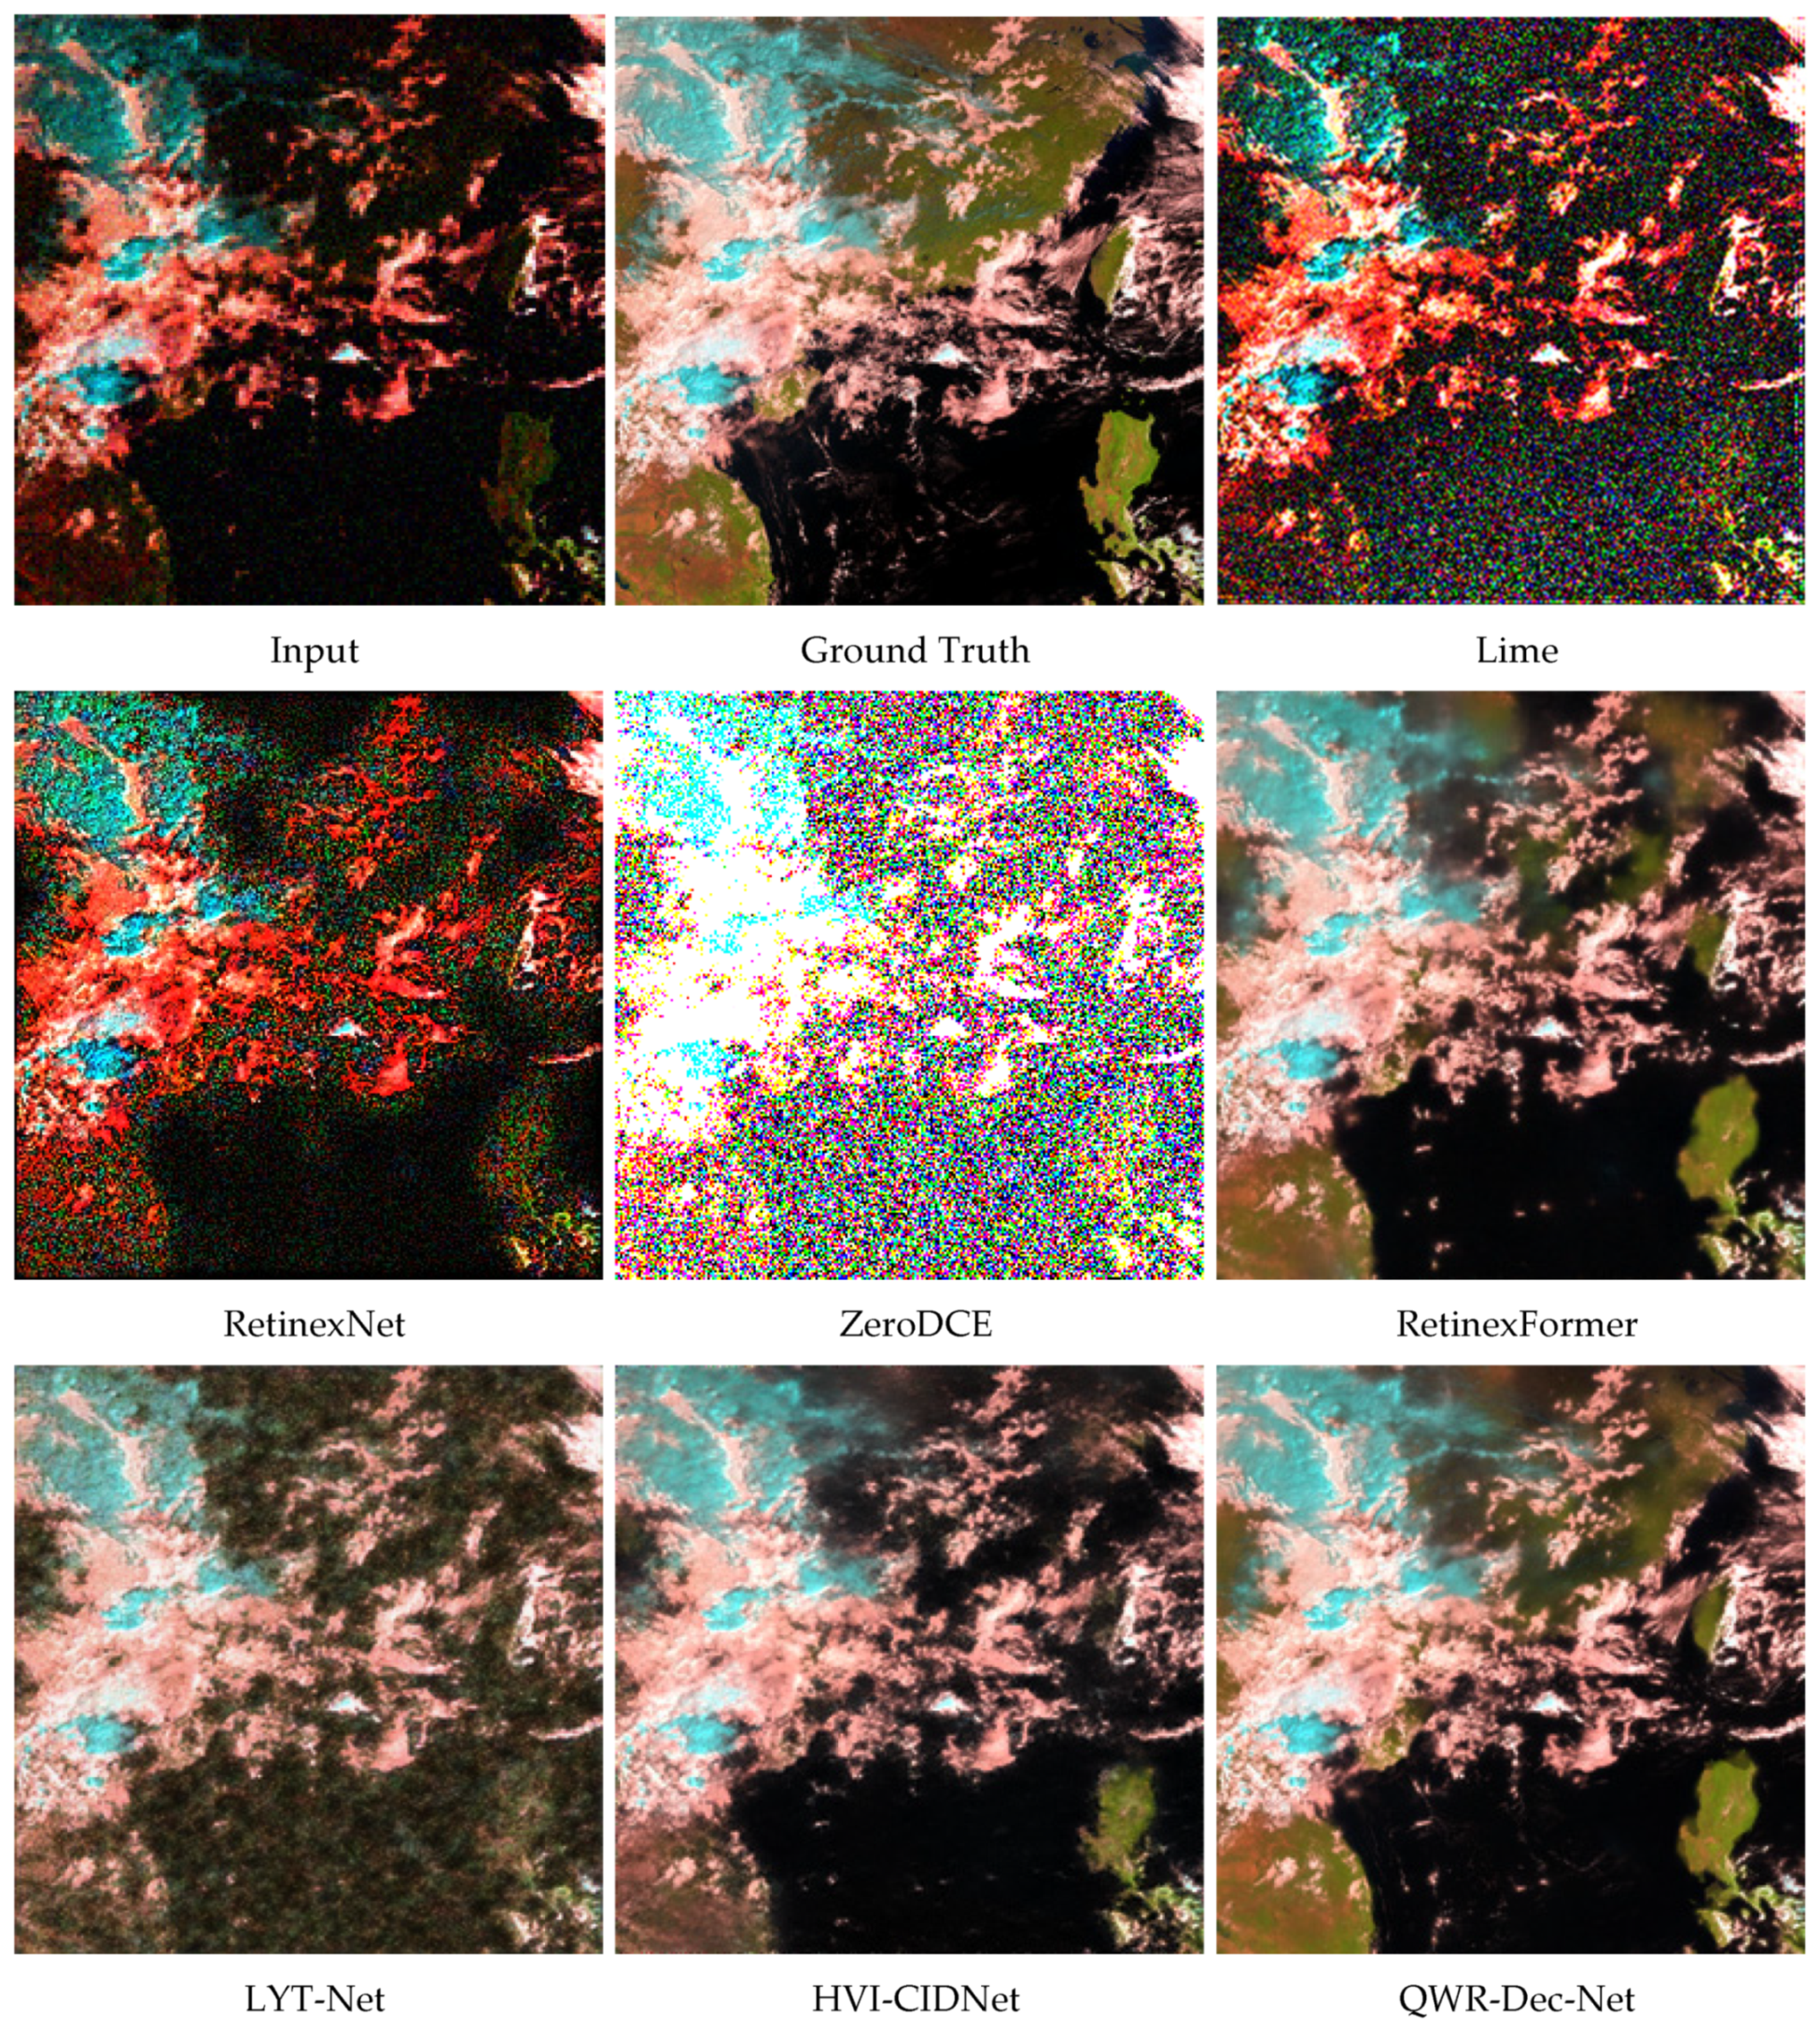
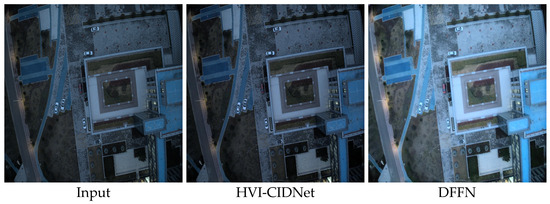
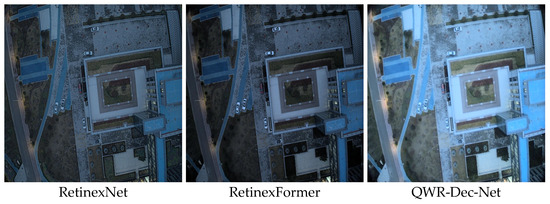
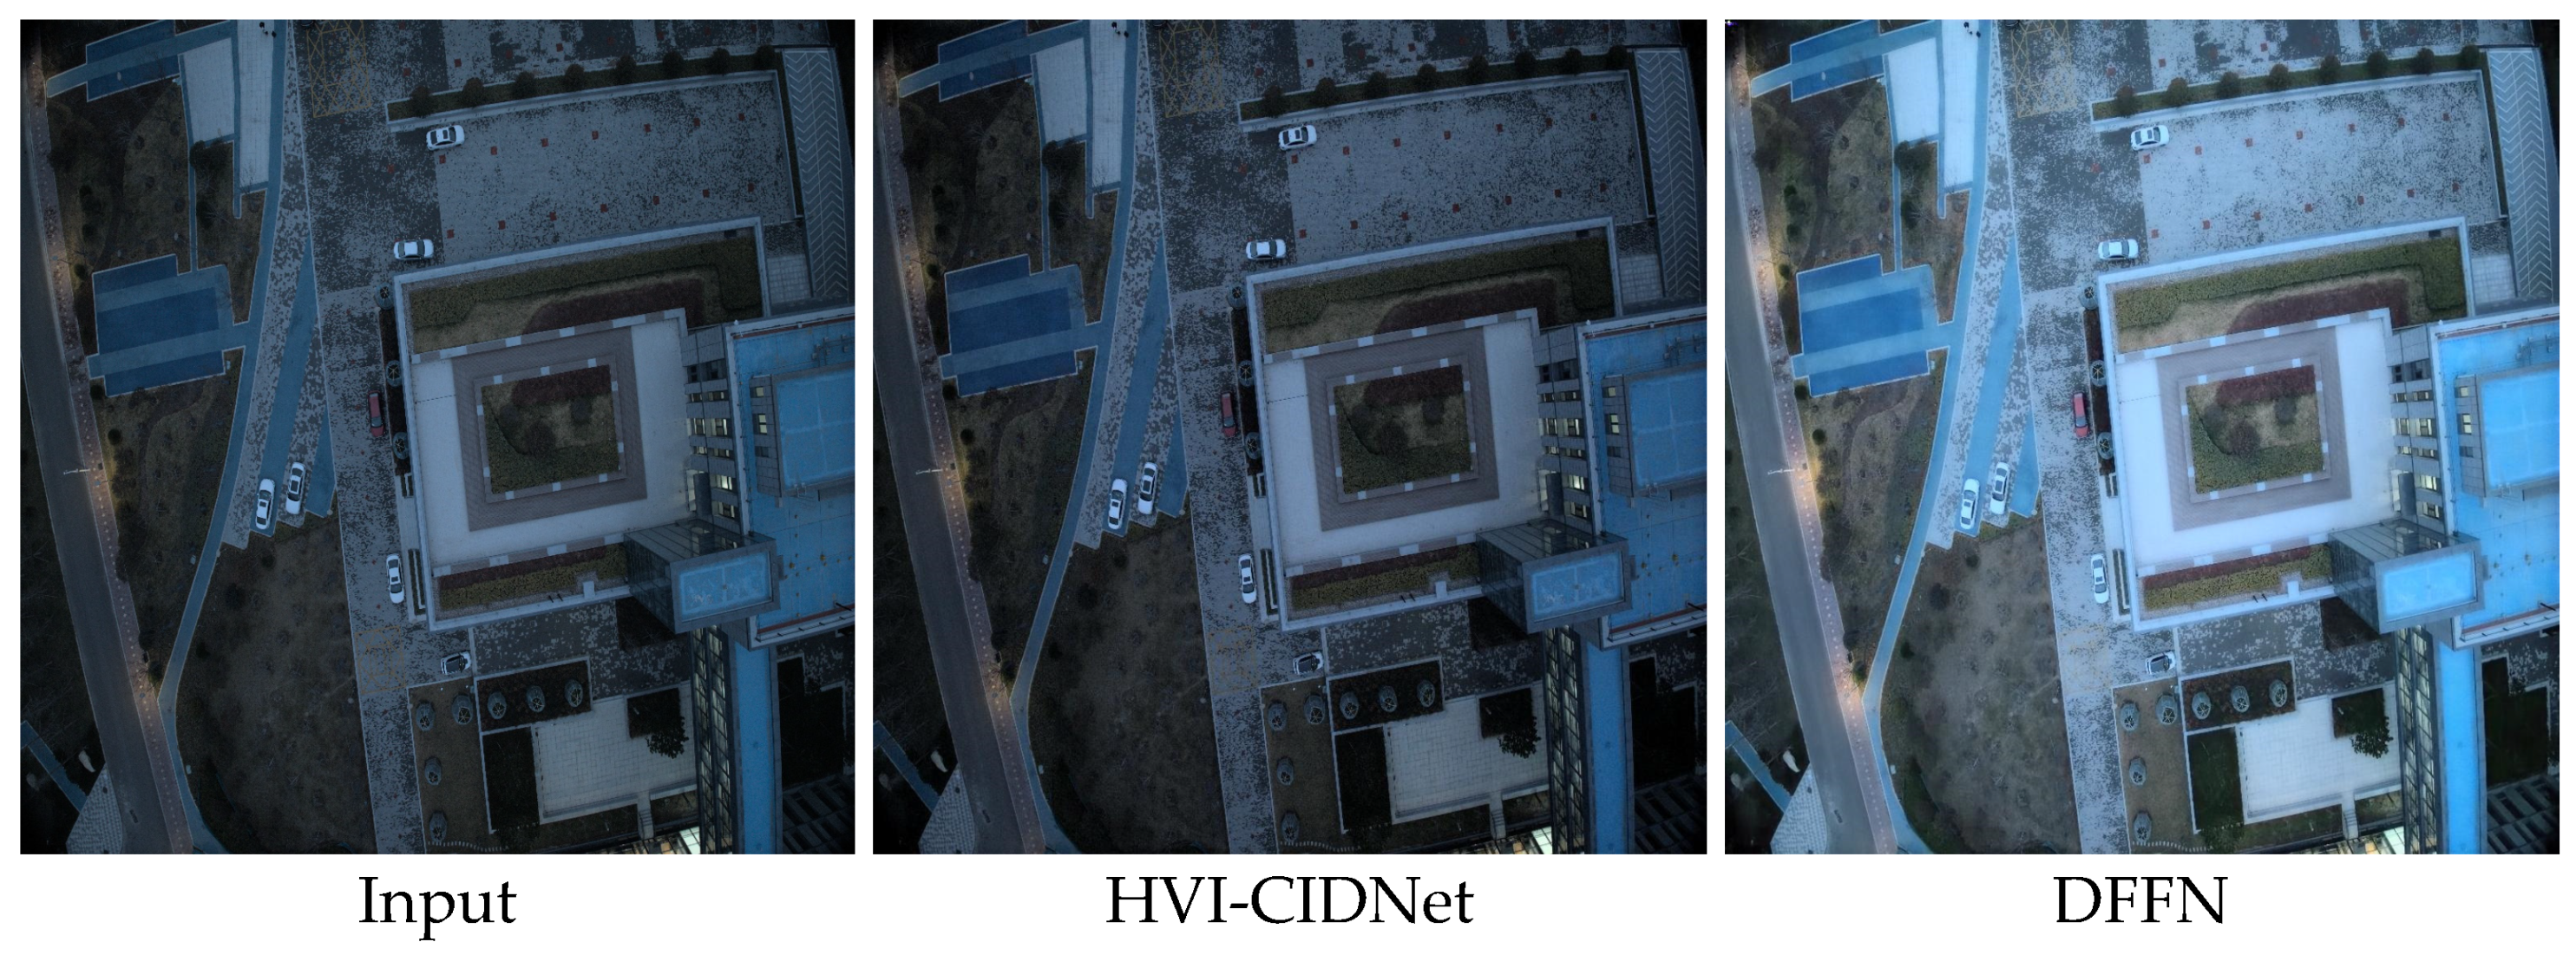
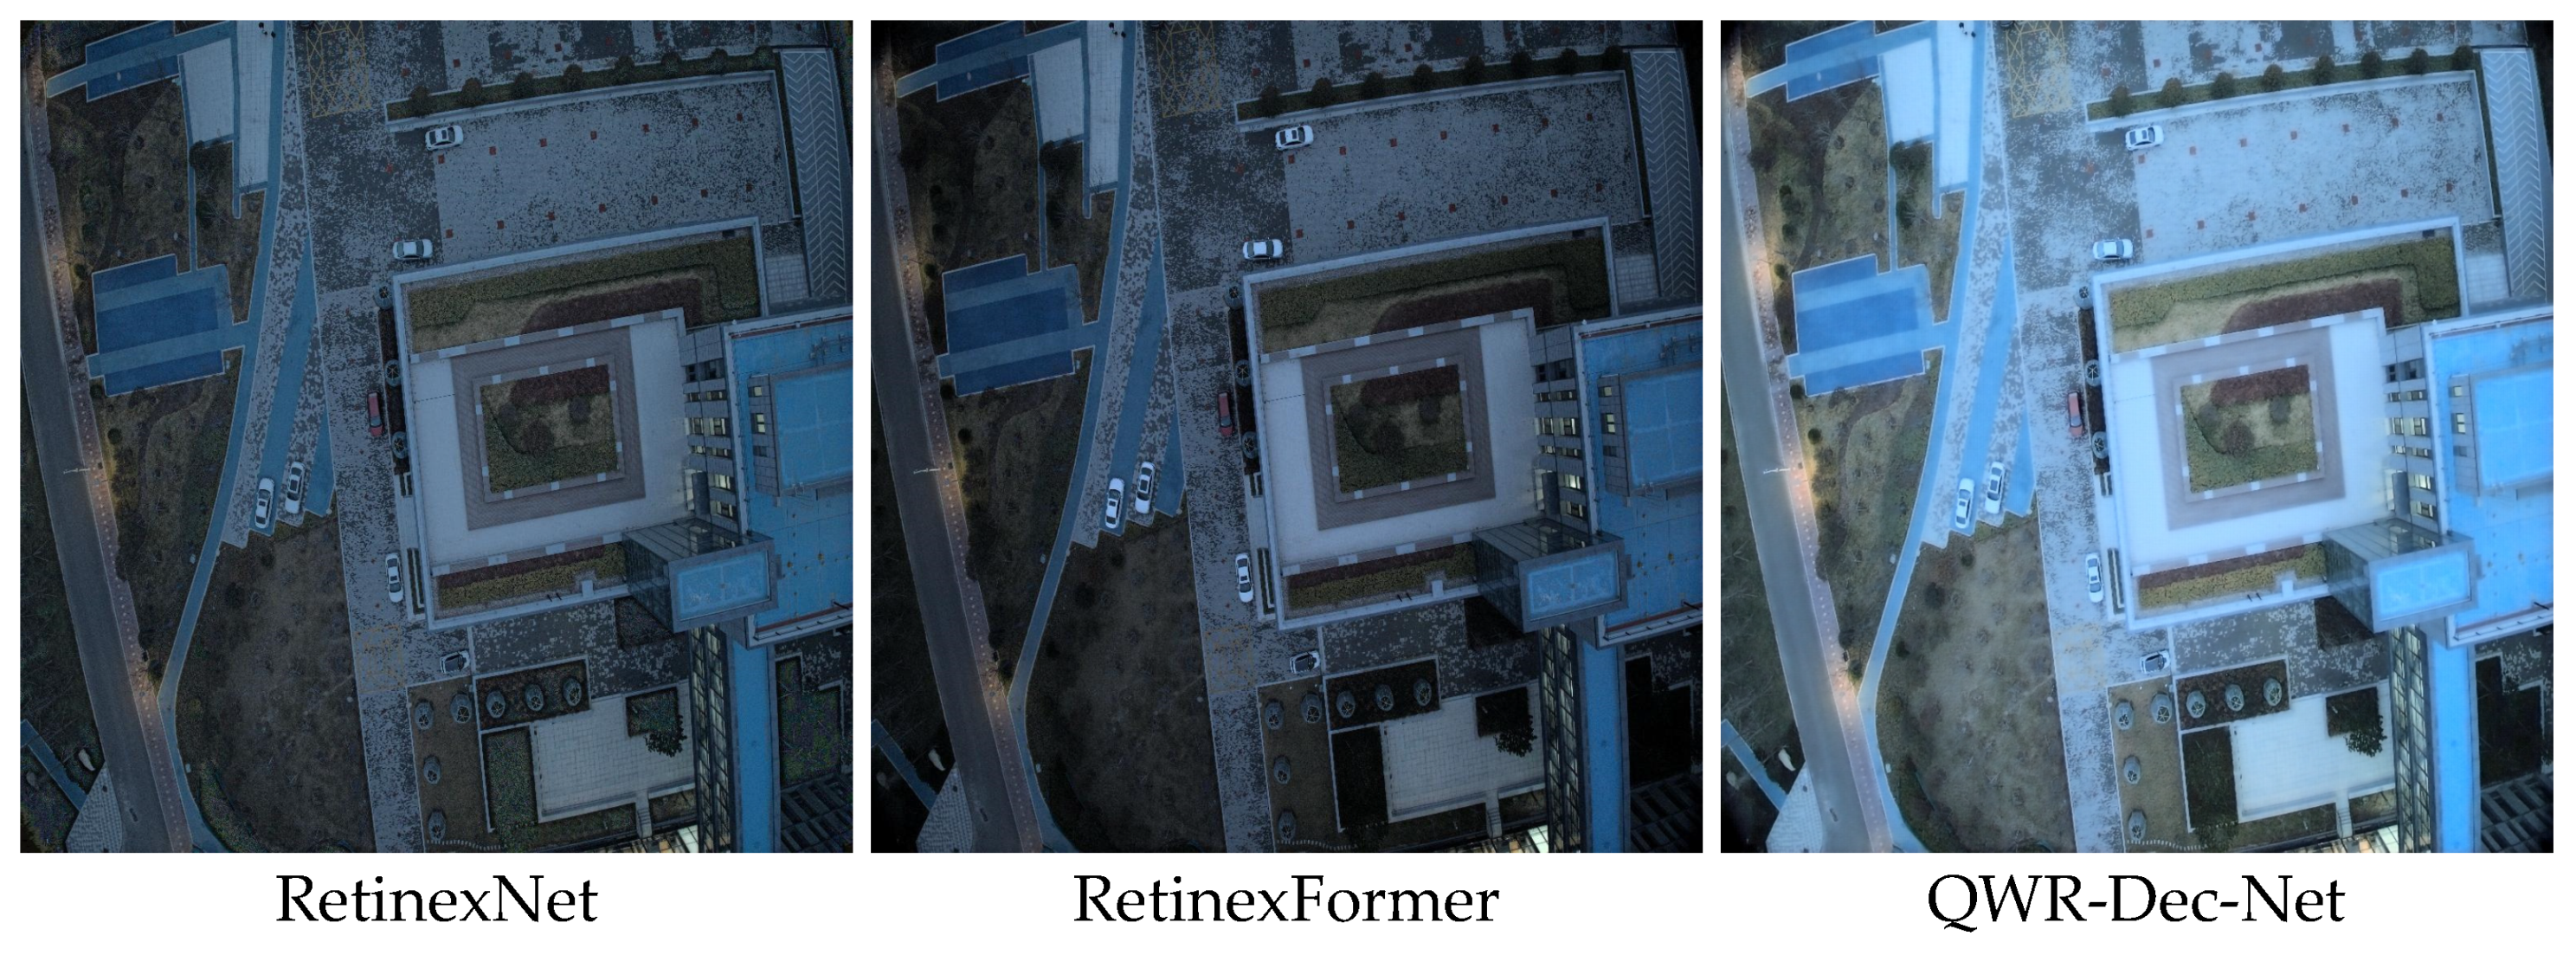
On DarkRS, QWR-Dec-Net also obtains the lowest values across all three no-reference metrics, reaching BRISQUE 14.988, NIQE 4.108, and PIQE 6.383. This consistent advantage across multiple blind quality estimators suggests improved robustness to genuine nighttime degradations and reduced artifact amplification compared with Retinex-based, transformer-based, and frequency-domain alternatives. In terms of efficiency, QWR-Dec-Net runs in 22.58 ms per image on DarkRS at 1024 × 1024 resolution, which is substantially faster than DFFN at 80.47 ms, RetinexFormer at 313.64 ms, and LYT-Net at 952.49 ms, while delivering markedly higher no-reference quality. Figure 9 provides qualitative examples on DarkRS that visually corroborate these trends.
Figure 9.
Qualitative comparison on DarkRS real nighttime UAV remote-sensing images. Top row shows the input image, HVI-CIDNet, and DFFN. Bottom row shows RetinexNet, RetinexFormer, and the proposed QWR-Dec-Net. DarkRS does not provide paired normal-light references, so results are assessed qualitatively and via the no-reference metrics reported in Table 3.
3.4. Ablation Study
To quantify the contribution of each design element in QWR-Dec-Net we disabled one component at a time and reevaluated the network on the LSCIDMR test set.
Table 4 reports the outcomes for three variants, obtained by removing the wavelet decomposition, substituting quaternion convolutions with real convolutions, and bypassing the Retinex-inspired decomposition, together with a fourth variant that omits the wavelet–quaternion attention (WQA). Dropping the wavelet block lowers SSIM from 0.710 to 0.692 and raises LPIPS from 0.201 to 0.227, confirming that multiscale frequency separation is essential for noise suppression and detail retention. Replacing quaternion convolutions with real ones produce the largest degradation, with SSIM falling to 0.667 and ConvNeXt accuracy to 0.721, highlighting the importance of joint color processing for both structural fidelity and downstream recognition. Removing the Retinex module mainly hurts PSNR and both classifier accuracies, indicating that explicit illumination–reflectance modelling stabilizes brightness correction and prevents over-enhancement. Finally, omitting WQA yields a smaller but consistent decline across all metrics, showing that attention in the wavelet–quaternion domain still provides useful guidance. These results demonstrate that wavelet analysis, quaternion processing, Retinex decomposition, and WQA act synergistically; removing any one of them compromises perceptual quality and task performance.
Table 4.
Ablation study on the LSCIDMR dataset. Each row shows how removing or replacing a key component (Wavelet, Quaternion Representation, Retinex-based decomposition, or Wavelet Quaternion Attention) affects SSIM, PSNR, LPIPS, and classification accuracy. The “Full QWR-Dec-Net” row is the complete model, illustrating the combined impact of all modules.
4. Discussion
The experimental results show that QWR-Dec-Net outperforms current leading methods in low-light remote-sensing image enhancement. The superior performance of QWR-Dec-Net stems from addressing fundamental limitations in how low-light enhancement methods handle color information. Traditional approaches treat RGB channels as independent signals, which creates decomposition ambiguities where multiple illumination-reflectance combinations can produce the same degraded image. The quaternion formulation eliminates this ambiguity by enforcing mathematical coupling between channels through Hamilton product operations. This explains why the ablation study shows quaternion convolutions contribute most to performance—removing them forces the network to learn channel relationships implicitly through data, rather than encoding them structurally. The large gap between quaternion and real convolution variants (SSIM difference of 0.043) suggests that even deep networks with sufficient capacity struggle to recover color consistency without proper mathematical constraints. This finding challenges the assumption that purely data-driven approaches can automatically discover optimal color representations.
Existing deep Retinex methods typically estimate illumination and reflectance using real-valued feature processing and implicitly handle RGB coupling, which can increase decomposition ambiguity and lead to chromatic inconsistencies under severe underexposure. QWR-Dec-Net introduces a dual inductive bias: (i) quaternion coupling that explicitly preserves chromatic dependencies through Hamilton-product reconstruction; (ii) wavelet sub-band factorization that separates illumination/structure/noise across frequencies. Building on these representations, our Wavelet Quaternion Attention adaptively reweights frequency sub-bands to suppress noise while preserving structure. Ablations confirm that quaternion processing and wavelet/WQA are complementary; removing either component reduces fidelity and downstream recognition performance.
The classification accuracy improvements reveal that enhancement quality should be measured by feature preservation rather than pixel-level fidelity alone. Methods with similar SSIM scores show divergent classification performance. RetinexFormer achieves SSIM 0.707 but only 0.408 ConvNeXt accuracy, while RetinexMamba reaches 0.774 accuracy with comparable SSIM 0.704. This discrepancy indicates that traditional image quality metrics inadequately capture semantic content preservation. The wavelet decomposition likely contributes by separating semantically important mid-frequency features from both low-frequency illumination and high-frequency noise. Human perception and classification networks both rely on these mid-frequency structural elements. Methods that over-smooth or amplify noise corrupt these frequencies, degrading downstream task performance despite acceptable SSIM values. The strong correlation between wavelet ablation results and classification accuracy supports this interpretation.
The synthetic training data limitation deserves careful consideration. Real nighttime satellite imagery contains sensor-specific noise patterns, atmospheric turbulence, variable light sources, and mixed illumination conditions that gamma transformation cannot replicate. The method’s strong performance on synthetic data may not transfer to operational scenarios. However, the physics-based Retinex decomposition provides some robustness—it constrains the solution space to physically plausible illumination-reflectance combinations regardless of specific degradation patterns. This suggests the framework may generalize better than purely learning-based methods, though empirical validation on real acquisitions is necessary. Future work should establish whether the quaternion-wavelet structure provides sufficient inductive bias to handle distribution shift, or whether domain adaptation techniques are required for operational deployment.
5. Conclusions
This paper presented QWR-Dec-Net, a new low-light image enhancement approach that treats RGB channels as a single quaternion entity, effectively maintaining inter-channel correlations while reducing parameter redundancy. The model combines quaternion representation with multiscale wavelet design to refine illumination and noise components across various frequency bands, producing clearer and better-exposed images in challenging low-light conditions. Tests on the LSCIDMR and UCMerced remote sensing datasets show that QWR-Dec-Net consistently surpasses current state-of-the-art methods in key metrics such as PSNR, SSIM, and LPIPS. The improved images also significantly boost downstream classification accuracy with ConvNeXt and Swin Transformer architectures, demonstrating their practical usefulness for automated remote sensing analysis. Although the computational cost of quaternion operations needs optimization for real-time use, the notable performance improvements underline the promising potential of quaternion-wavelet Retinex frameworks in remote sensing, autonomous systems, and related imaging fields.
Future research will focus on several key directions. The method will be extended to handle hyperspectral and SAR imagery using higher-dimensional representations, such as octonions. Model optimization through pruning, quantization, and knowledge distillation will enable deployment on edge devices. Adaptive processing strategies will be developed for dynamic parameter tuning across varying illumination conditions and sensor characteristics. Additional directions include sensor fusion approaches combining low-light enhancement with thermal or LiDAR data, physics-informed learning to reduce dataset dependency, and video sequence processing for real-time applications. The framework will be extended to quantum imaging and commutative quaternion algebra domains. Finally, the ethical implications of enhanced surveillance capabilities will be assessed to ensure responsible deployment in sensitive applications such as ADAS systems.
Author Contributions
Investigation, computer simulation, testing, and writing—original draft—V.F.; conceptualization and writing—review and editing—S.A.; writing—review and editing—K.P.; analysis of results and writing—review and editing—A.G. All authors have read and agreed to the published version of the manuscript.
Funding
The work is funded by a Google grant, project 7E263-05-02.
Institutional Review Board Statement
Not applicable.
Informed Consent Statement
Not applicable.
Data Availability Statement
The data presented in this study are available in [LSCIDMR] at [https://github.com/Zjut-MultimediaPlus/LSCIDMR], [UC Merced Land Use] at [http://weegee.vision.ucmerced.edu/datasets/landuse.html] and [iSAID2 and DarkRS] at [https://github.com/iijjlk/DFFN] (accessed on 12 November 2025).
Conflicts of Interest
The authors declare no conflicts of interest.
Abbreviations
The following abbreviations are used in this manuscript:
| ADAS | Advanced Driver Assistance Systems |
| CNN | Convolutional Neural Network |
| CUDA | Compute Unified Device Architecture |
| DWT | Discrete Wavelet Transform |
| GPU | Graphics Processing Unit |
| IDWT | Inverse Discrete Wavelet Transform |
| LiDAR | Light Detection and Ranging |
| LIME | Low-Light Image Enhancement via Illumination Map Estimation |
| LPIPS | Learned Perceptual Image Patch Similarity |
| LSCIDMR | Large-Scale Satellite Cloud Image Database for Meteorological Research |
| MLP | Multi-Layer Perceptron |
| MSE | Mean Squared Error |
| PSNR | Peak Signal-to-Noise Ratio |
| QWR-Dec-Net | Quaternion-Wavelet Retinex Decomposition Network |
| QWT | Quaternion Wavelet Transform |
| ReLU | Rectified Linear Unit |
| RGB | Red Green Blue |
| SAR | Synthetic Aperture Radar |
| SSIM | Structural Similarity Index Measure |
| UAV | Unmanned Aerial Vehicle |
| USGS | United States Geological Survey |
| VRAM | Video Random Access Memory |
| WQA | Wavelet Quaternion Attention |
References
- Wang, W.; Wu, X.; Yuan, X.; Gao, Z. An Experiment-Based Review of Low-Light Image Enhancement Methods. IEEE Access 2020, 8, 87884–87917. [Google Scholar]
- Combs, C.L.; Miller, S.D. A Review of the Far-Reaching Usage of Low-Light Nighttime Data. Remote Sens. 2023, 15, 623. [Google Scholar]
- Cao, W.; Wu, S.; Wang, D.; Agaian, S.; Song, Z. Illumination Map Estimation via Sparse Bright Channel for Enhancing Under-Exposed Images. IEEE Trans. Intell. Transp. Syst. 2024, 26, 1344–1350. [Google Scholar]
- Hu, L.; Qin, M.; Zhang, F.; Du, Z.; Liu, R. RSCNN: A CNN-Based Method to Enhance Low-Light Remote-Sensing Images. Remote Sens. 2020, 13, 62. [Google Scholar]
- Kyba, C.; Garz, S.; Kuechly, H.; De Miguel, A.; Zamorano, J.; Fischer, J.; Hölker, F. High-Resolution Imagery of Earth at Night: New Sources, Opportunities and Challenges. Remote Sens. 2014, 7, 1–23. [Google Scholar]
- Nardi, E.; Cohen, O.; Pinhasi, Y.; Haridim, M.; Gavan, J. Weather Forecasting Satellites—Past, Present, & Future. Information 2025, 16, 677. [Google Scholar]
- Rasheed, M.T.; Guo, G.; Shi, D.; Khan, H.; Cheng, X. An Empirical Study on Retinex Methods for Low-Light Image Enhancement. Remote Sens. 2022, 14, 4608. [Google Scholar]
- Bui, T.-A.; Lee, P.-J.; Liang, C.-S.; Hsu, P.-H.; Shiu, S.-H.; Tsai, C.-K. Edge-Computing-Enabled Deep Learning Approach for Low-Light Satellite Image Enhancement. IEEE J. Sel. Top. Appl. Earth Obs. Remote Sens. 2024, 17, 4071–4083. [Google Scholar]
- Talpur, K.; Hasan, R.; Gocer, I.; Ahmad, S.; Bhuiyan, Z. AI in Maritime Security: Applications, Challenges, Future Directions, and Key Data Sources. Information 2025, 16, 658. [Google Scholar]
- Yang, H.; Qiu, S. A Novel Dynamic Contextual Feature Fusion Model for Small Object Detection in Satellite Remote-Sensing Images. Information 2024, 15, 230. [Google Scholar]
- Chen, X.; Tao, H.; Zhou, H.; Zhou, P.; Deng, Y. Hierarchical and Progressive Learning with Key Point Sensitive Loss for Sonar Image Classification. Multimed. Syst. 2024, 30, 380. [Google Scholar] [CrossRef] [Scilit]
- Ibrahim, H.; Sia Pik Kong, N. Brightness Preserving Dynamic Histogram Equalization for Image Contrast Enhancement. IEEE Trans. Consum. Electron. 2007, 53, 1752–1758. [Google Scholar]
- Abdullah-Al-Wadud, M.; Kabir, M.H.; Ali Akber Dewan, M.; Chae, O. A Dynamic Histogram Equalization for Image Contrast Enhancement. IEEE Trans. Consum. Electron. 2007, 53, 593–600. [Google Scholar]
- Trongtirakul, T.; Agaian, S. New Retinex Model-Based Infrared Image Enhancement. In Proceedings of the Multimodal Image Exploitation and Learning 2023; Agaian, S.S., DelMarco, S.P., Asari, V.K., Eds.; SPIE: Bellingham, WA, USA, 2023; p. 5. [Google Scholar]
- Land, E. The Retinex Theory of Color Vision. Sci. Am. 1977, 237, 108–128. [Google Scholar]
- Jobson, D.J.; Rahman, Z.; Woodell, G.A. A Multiscale Retinex for Bridging the Gap between Color Images and the Human Observation of Scenes. IEEE Trans. Image Process. 1997, 6, 965–976. [Google Scholar]
- Fu, X.; Zeng, D.; Huang, Y.; Zhang, X.-P.; Ding, X. A Weighted Variational Model for Simultaneous Reflectance and Illumination Estimation. In Proceedings of the 2016 IEEE Conference on Computer Vision and Pattern Recognition (CVPR), Las Vegas, NV, USA, 26 June–1 July, 2016; pp. 2782–2790. [Google Scholar]
- Guo, X.; Li, Y.; Ling, H. LIME: Low-Light Image Enhancement via Illumination Map Estimation. IEEE Trans. Image Process. 2017, 26, 982–993. [Google Scholar]
- Gasparyan, H.A.; Hovhannisyan, S.A.; Babayan, S.V.; Agaian, S.S. Iterative Retinex-Based Decomposition Framework for Low Light Visibility Restoration. IEEE Access 2023, 11, 40298–40313. [Google Scholar]
- Wei, C.; Wang, W.; Yang, W.; Liu, J. Deep Retinex Decomposition for Low-Light Enhancement; BMVA Press: Newcastle, UK, 2018; p. 155. [Google Scholar]
- Srilekha, G.; Kumar, V.K.; Jyothi, B. Satellite Image Resolution Enhancement Using DWT and Contrast Enhancement Using SVD. Int. J. Eng. Res. Technol. 2013, 2, 1227–1230. [Google Scholar]
- Brindha, S.; Scholar, P.G. Satellite Image Enhancement Using DWT—SVD and Segmentation Using MRR–MRF Model. J. Netw. Commun. Emerg. Technol. 2015, 1, 6–10. [Google Scholar]
- Cai, Y.; Bian, H.; Lin, J.; Wang, H.; Timofte, R.; Zhang, Y. Retinexformer: One-Stage Retinex-Based Transformer for Low-Light Image Enhancement. In Proceedings of the IEEE International Conference on Computer Vision, Paris, France, 2–6 October 2023; pp. 12470–12479. [Google Scholar]
- Jiang, H.; Luo, A.; Fan, H.; Han, S.; Liu, S. Low-Light Image Enhancement with Wavelet-Based Diffusion Models. ACM Trans. Graph. 2023, 42, 238. [Google Scholar]
- Wang, Y.; Yu, Y.; Yang, W.; Guo, L.; Chau, L.-P.; Kot, A.; Wen, B. ExposureDiffusion: Learning to Expose for Low-Light Image Enhancement. In Proceedings of the IEEE/CVF International Conference on Computer Vision (ICCV), Paris, France, 2–6 October 2023; pp. 12404–12414. [Google Scholar]
- Ding, B.; Sun, B.; Sun, X. Low-Light Remote Sensing Image Enhancement via Priors Guided End-to-End Latent Residual Diffusion. Remote Sens. 2025, 17, 3193. [Google Scholar]
- Reis, M.J.C.S. Low-Light Image Enhancement Using Deep Learning: A Lightweight Network with Synthetic and Benchmark Dataset Evaluation. Appl. Sci. 2025, 15, 6330. [Google Scholar]
- Makwana, D.; Deshmukh, G.S.; Susladkar, O.; Mittal, S.; Sai Chandra Teja, R. LIVENet: A Novel Network for Real-World Low-Light Image Denoising and Enhancement. In Proceedings of the IEEE/CVF Winter Conference on Applications of Computer Vision (WACV), Waikola, HI, USA, 26 June–1 July 2024; pp. 5844–5853. [Google Scholar]
- Bai, J.; Yin, Y.; He, Q.; Li, Y.; Zhang, X. Retinexmamba: Retinex-Based Mamba for Low-Light Image Enhancement. In Proceedings of the International Conference on Neural Information Processing, Auckland, New Zealand, 2–6 December 2024; pp. 427–442. [Google Scholar]
- Levin, N.; Kyba, C.C.M.; Zhang, Q.; Sánchez de Miguel, A.; Román, M.O.; Li, X.; Portnov, B.A.; Molthan, A.L.; Jechow, A.; Miller, S.D.; et al. Remote Sensing of Night Lights: A Review and an Outlook for the Future. Remote Sens. Environ. 2020, 237, 111443. [Google Scholar]
- Levin, N. Challenges in Remote Sensing of Night Lights—A Research Agenda for the next Decade. Remote Sens. Environ. 2025, 328, 114869. [Google Scholar]
- Zhao, M.; Zhou, Y.; Li, X.; Cao, W.; He, C.; Yu, B.; Li, X.; Elvidge, C.D.; Cheng, W.; Zhou, C. Applications of Satellite Remote Sensing of Nighttime Light Observations: Advances, Challenges, and Perspectives. Remote Sens. 2019, 11, 1971. [Google Scholar]
- Bu, L.; Xu, Z.; Zhang, G.; Zhang, Z. Night-Light Image Restoration Method Based on Night Scattering Model for Luojia 1-01 Satellite. Sensors 2019, 19, 3761. [Google Scholar]
- Zhang, D.; Cheng, B.; Shi, L.; Gao, J.; Long, T.; Chen, B.; Wang, G. A Destriping Algorithm for SDGSAT-1 Nighttime Light Images Based on Anomaly Detection and Spectral Similarity Restoration. Remote Sens. 2022, 14, 5544. [Google Scholar]
- Wang, N.; Hu, Y.; Li, X.-M.; Lan, Y.; Kang, C.; Yan, L.; Dou, C.; Miao, C. Enhancing SDGSAT-1 Night Light Images Using a Panchromatic Guidance Denoising Algorithm. Int. J. Appl. Earth Obs. Geoinf. 2024, 128, 103748. [Google Scholar]
- Wang, J.; Yang, Y.; Chen, Y.; Han, Y. LighterGAN: An Illumination Enhancement Method for Urban UAV Imagery. Remote Sens. 2021, 13, 1371. [Google Scholar]
- Yao, Z.; Fan, G.; Fan, J.; Gan, M.; Philip Chen, C.L. Spatial–Frequency Dual-Domain Feature Fusion Network for Low-Light Remote Sensing Image Enhancement. IEEE Trans. Geosci. Remote Sens. 2024, 62, 4706516. [Google Scholar]
- Zhao, X.; Huang, L.; Li, M.; Han, C.; Nie, T. Atmospheric Scattering Model and Non-Uniform Illumination Compensation for Low-Light Remote Sensing Image Enhancement. Remote Sens. 2025, 17, 2069. [Google Scholar]
- Yi, X.; Xu, H.; Zhang, H.; Tang, L.; Ma, J. Diff-Retinex: Rethinking Low-Light Image Enhancement with A Generative Diffusion Model. In Proceedings of the Proceedings of the IEEE/CVF International Conference on Computer Vision (ICCV), Paris, France, 1–6 October 2023; pp. 12302–12311. [Google Scholar]
- Agaian, S.; Frants, V. QRetinex-Net: A Quaternion Retinex Framework for Bio-Inspired Color Constancy. Appl. Sci. 2025, 15, 12336. [Google Scholar]
- Parcollet, T.; Morchid, M.; Linarès, G. A Survey of Quaternion Neural Networks. Artif. Intell. Rev. 2020, 53, 2957–2982. [Google Scholar]
- Parcollet, T.; Zhang, Y.; Morchid, M.; Trabelsi, C.; Linarès, G.; De Mori, R.; Bengio, Y. Quaternion Convolutional Neural Networks for End-to-End Automatic Speech Recognition. In Proceedings of the Interspeech 2018 (ISCA), Hyderabad, India, 2–6 September 2018; pp. 22–26. [Google Scholar]
- Chen, Y.; Xiao, X.; Zhou, Y. Low-Rank Quaternion Approximation for Color Image Processing. IEEE Trans. Image Process. 2019, 29, 1426–1439. [Google Scholar]
- Kusamichi, H.; Isokawa, T.; Matsui, N.; Ogawa, Y.; Maeda, K. A New Scheme for Color Night Vision by Quaternion Neural Network. In Proceedings of the 2nd International Conference on Autonomous Robots and Agents, Palmestron North, New Zeland, 13–15 December 2004; Volume 1315. [Google Scholar]
- Wang, M.; Li, C.; Yang, X.; Chu, D.; Zhou, Z.; Lau, R.Y.K. QTU-Net: Quaternion Transformer-Based U-Net for Water Body Extraction of RGB Satellite Image. IEEE Trans. Geosci. Remote Sens. 2024, 62, 5634816. [Google Scholar]
- Zhu, X.; Xu, Y.; Xu, H.; Chen, C. Quaternion Convolutional Neural Networks. In Proceedings of the European Conference on Computer Vision (ECCV), Munich, Germany, 8–14 September 2018; p. 631a647. [Google Scholar]
- Grigoryan, A.; Agaian, S. Quaternion and Octonion Color Image Processing with MATLAB; SPIE: Bellingham, WA, USA, 2018. [Google Scholar] [CrossRef] [Scilit]
- Yin, M.; Liu, W.; Shui, J.; Wu, J. Quaternion Wavelet Analysis and Application in Image Denoising. Math. Probl. Eng. 2012, 2012, 1–21. [Google Scholar]
- Ronneberger, O.; Fischer, P.; Brox, T. U-Net: Convolutional Networks for Biomedical Image Segmentation. In Proceedings of the Medical Image Computing and Computer-Assisted Intervention—MICCAI 2015, Munich, Germany, 5–9 October 2015; Springer International Publishing: Cham, Switzerland, 2015; pp. 234–241. [Google Scholar]
- Vaswani, A.; Shazeer, N.; Parmar, N. Attention Is All You Need. In Proceedings of the Advances in Neural Information Processing Systems 30 (NIPS 2017), Long Beach, California, USA, 4–9 December 2017; Curran Associates, Inc.: Red Hook, NY, USA, 2017; pp. 5998–6008. [Google Scholar]
- Hu, J.; Shen, L.; Sun, G. Squeeze-and-Excitation Networks. In Proceedings of the 2018 IEEE/CVF Conference on Computer Vision and Pattern Recognition, Salt Lake City, UT, USA, 18–22 June 2018; pp. 7132–7141. [Google Scholar]
- Brauwers, G.; Frasincar, F. A General Survey on Attention Mechanisms in Deep Learning. IEEE Trans. Knowl. Data Eng. 2023, 35, 3279–3298. [Google Scholar]
- Loshchilov, I.; Hutter, F. Decoupled Weight Decay Regularization. In Proceedings of the International Conference on Learning Representations (ICLR 2019), New Orleans, LA, USA, 6–9 May, 2019. [Google Scholar]
- Loshchilov, I.; Hutter, F. SGDR: Stochastic Gradient Descent with Warm Restarts. In Proceedings of the International Conference on Learning Representations (ICLR 2017), Toulon, France, 24–26 April 2017. [Google Scholar]
- Bai, C.; Zhang, M.; Zhang, J.; Zheng, J.; Chen, S. LSCIDMR: Large-Scale Satellite Cloud Image Database for Meteorological Research. IEEE Trans. Cybern. 2022, 52, 12538–12550. [Google Scholar]
- Hore, A.; Ziou, D. Image Quality Metrics: PSNR vs. SSIM. In Proceedings of the 2010 20th International Conference on Pattern Recognition, Istanbul, Turkey, 23–26 August 2010; pp. 2366–2369. [Google Scholar]
- Zhang, R.; Isola, P.; Efros, A.A.; Shechtman, E.; Wang, O. The Unreasonable Effectiveness of Deep Features as a Perceptual Metric. In Proceedings of the 2018 IEEE/CVF Conference on Computer Vision and Pattern Recognition, Salt Lake City, UT, USA, 18-22 June 2018; pp. 586–595. [Google Scholar]
- Liu, Z.; Mao, H.; Wu, C.-Y.; Feichtenhofer, C.; Darrell, T.; Xie, S. A ConvNet for the 2020s. In Proceedings of the 2022 IEEE/CVF Conference on Computer Vision and Pattern Recognition (CVPR), New Orleans, LA, USA, 18–24 April 2022; pp. 11976–11986. [Google Scholar]
- Liu, Z.; Lin, Y.; Cao, Y.; Hu, H.; Wei, Y.; Zhang, Z.; Lin, S.; Guo, B. Swin Transformer: Hierarchical Vision Transformer Using Shifted Windows. In Proceedings of the 2021 IEEE/CVF International Conference on Computer Vision (ICCV), Virtuel Conference, 11–17 October 2021; pp. 10012–10022. [Google Scholar]
- Mittal, A.; Moorthy, A.K.; Bovik, A.C. No-Reference Image Quality Assessment in the Spatial Domain. IEEE Trans. Image Process. 2012, 21, 4695–4708. [Google Scholar]
- Mittal, A.; Soundararajan, R.; Bovik, A.C. Making a “Completely Blind” Image Quality Analyzer. IEEE Signal Process. Lett. 2013, 20, 209–212. [Google Scholar]
- Venkatanath, N.; Praneeth, D.; Bh, M.C.; Channappayya, S.S.; Medasani, S.S. Blind Image Quality Evaluation Using Perception Based Features. In Proceedings of the 2015 Twenty First National Conference on Communications (NCC), Mumbai, India, 27 February–1 March 2015; pp. 1–6. [Google Scholar]
- Guo, C.; Li, C.; Guo, J.; Loy, C.C.; Hou, J.; Kwong, S.; Cong, R. Zero-Reference Deep Curve Estimation for Low-Light Image Enhancement. In Proceedings of the 2020 IEEE/CVF Conference on Computer Vision and Pattern Recognition (CVPR), Seatle, WA, USA, 13–19 June 2020; pp. 1780–1789. [Google Scholar]
- Brateanu, A.; Balmez, R.; Avram, A.; Orhei, C.; Ancuti, C. LYT-NET: Lightweight YUV Transformer-Based Network for Low-Light Image Enhancement. IEEE Signal Process. Lett. 2025, 32, 2065–2069. [Google Scholar]
- Yan, Q.; Feng, Y.; Zhang, C.; Pang, G.; Shi, K.; Wu, P.; Dong, W.; Sun, J.; Zhang, Y. HVI: A New Color Space for Low-Light Image Enhancement. In Proceedings of the IEEE/CVF Conference on Computer Vision and Pattern Recognition (CVPR), Nashville, TN, USA, 11–15 June 2025; IEEE Publications: Piscataway, NJ, USA, 2025; pp. 5678–5687. [Google Scholar]



Disclaimer/Publisher’s Note: The statements, opinions and data contained in all publications are solely those of the individual author(s) and contributor(s) and not of MDPI and/or the editor(s). MDPI and/or the editor(s) disclaim responsibility for any injury to people or property resulting from any ideas, methods, instructions or products referred to in the content. |
© 2026 by the authors. Licensee MDPI, Basel, Switzerland. This article is an open access article distributed under the terms and conditions of the Creative Commons Attribution (CC BY) license.