


Abstract
To improve the prediction accuracy of compressor performance for marine gas turbine applications, a data-driven adaptive correction method is proposed. A one-dimensional meanline model is first developed; however, noticeable discrepancies are observed when it is validated against the experimental data of the NASA two-stage compressor. To address this issue, two key gain factors are introduced to correct the deviation angle and total pressure loss models using a data-driven adaptive correction approach. The optimal gain factors, obtained using particle swarm optimization, show clear trends with the flow coefficient and relative rotational speed. A database is then constructed using these operating parameters as inputs and the optimized gain factors as outputs, and a GA-BP neural network is trained to learn this relationship. The gain factors for arbitrary operating conditions are predicted and incorporated into the meanline model to establish an adaptive correction model for the compressor. The proposed method is validated using three public compressor datasets, including the NASA two-stage, 74A (3.5-stage), and NACA8 (8-stage) compressors, with the average relative discrepancies of the predicted performance remaining below 4%. In addition, the single-stage performance and variable stator characteristics of the NASA two-stage compressor are evaluated, showing good agreement with the experimental data. This model provides an efficient framework for accurate and rapid compressor performance prediction in marine gas turbine design and analysis.
1. Introduction
Marine gas turbines have become an important power source for modern ship propulsion systems due to their high power density, rapid start-up capability, and compact structure [1,2]. As a critical component of marine gas turbines, the axial compressor plays a dominant role in determining the overall performance and operating range of the propulsion system [3,4]. It provides high flow capacity while maintaining a relatively compact radial size, making it suitable for high-pressure-ratio applications [5]. However, despite its relatively simple mechanical structure, the aerodynamic design of compressor blades and the associated internal flow field remain highly complex [6]. Under high blade loading, the flow is often accompanied by adverse pressure gradients, endwall flow instability, and even shock wave effects, which significantly influence compressor performance and stability [7].
Although three-dimensional computational fluid dynamics (CFD) methods are widely used in turbomachinery research, their high computational cost limits their application in preliminary design stages and system-level simulations. Therefore, low-dimensional prediction methods are essential for rapid performance estimation over a wide range of operating conditions [8]. Among these approaches, the one-dimensional method is widely used because it provides fast performance prediction with reasonable accuracy. In one-dimensional compressor models, the complex three-dimensional flow field is simplified by representing the flow along a mean streamline. Based on velocity triangle analysis, the airflow angles and velocities at different blade rows can be estimated [9]. Generally, one-dimensional prediction methods mainly include the stage-stacking method and the meanline method [10,11]. The stage-stacking method relies heavily on single-stage performance data and lacks a direct connection with the actual internal flow process. In contrast, the meanline method is more widely adopted in compressor performance prediction. Extensive cascade experiments have provided numerous empirical correlations for blade flow characteristics and loss mechanisms. This significantly improves the accuracy and applicability of the meanline method, which was selected in this study.
The empirical correlations used in meanline models are mainly derived from cascade experiments with different blade geometries. Early flow deviation models were largely based on the experimental data reported in the NASA SP-36 report [12]. Later studies introduced correction correlations to account for a wider range of Mach numbers and axial velocity ratios, improving the prediction of deviation angles under practical operating conditions [13]. Koch [14] proposed a relatively comprehensive loss model within the meanline framework, including blade profile loss, shock loss, endwall loss, and part-span shroud loss. Several parameters related to blade diffusion and boundary-layer characteristics were introduced to establish empirical correlations based on experimental data. Building on this work, Miller [15] and Bloch [16] further extended the loss prediction method to transonic conditions. Using low-dimensional analysis, they estimated the location and intensity of shock formation according to the flow-passage geometry and approximated the shock process using normal shock relations, thereby improving the prediction of shock loss. The empirical models derived from experimental data are directly adopted in this study, with their specific formulations introduced in Section 2.
To improve prediction capability under off-design conditions, Boyer [17] and Aungier et al. [18] introduced additional loss components related to the deviation between the actual incidence angle and the design incidence angle. This modification improved the accuracy of one-dimensional performance predictions for compressors operating away from the design point. However, the increasing number of empirical correlations also introduces additional uncertainty in determining appropriate model parameters for a specific compressor. Therefore, calibration and optimization of empirical model coefficients are required to further improve the reliability of performance predictions. Adam et al. [19] applied the meanline method to evaluate the performance of the PWS31 compressor by introducing calibration coefficients into the off-design and secondary flow loss models, which improved the agreement between predictions and experimental data. Zhang et al. [20] explored more suitable empirical models using the parallel lines method by adjusting model coefficients and analyzing their sensitivity to performance predictions. Both methods directly introduce coefficients into the original model to achieve improved results. At the same time, some scholars have also established databases based on CFD simulations or more extensive experiments to further improve calculation accuracy.
Schnoes et al. [21] performed CFD simulations on NACA65 and DCA cascades under different Mach numbers and incidence angles and used the results to recalibrate loss models for subsonic and transonic compressor performance prediction. Kim et al. [22] established a polynomial correction equation for total pressure loss based on CFD simulations and incorporated it into a one-dimensional model, significantly improving prediction accuracy over a wide range of rotational speeds. Yu [23] improved the meanline method for axial compressors by developing better streamline-stage performance correlations and refining empirical correlations via database analysis.
In other fields focused on improving calculation accuracy, Liu [24] integrated high-resolution real-gas property tables into a meanline method to account for non-ideal thermodynamic effects. As for the further application of this method, Sadagopan [25] integrated it into gas turbine system simulations, supporting the analysis and optimization of marine gas turbine propulsion systems. KOLIAS [26] presented a meanline compressor performance calculation method including choking, which can be fully coupled into engine models and enables accurate simulation of multistage compressors. This study not only investigates the overall performance but also analyzes the single-stage performance and the performance under blade geometric angle adjustment, thereby expanding the application scope of this method.
The studies discussed above mainly focus on improving meanline models through empirical coefficient correction. Although these approaches can enhance prediction accuracy, limitations remain in the selection and applicability of the optimized parameters. Most previous studies mainly correct total pressure loss and deviation angle, while relatively little attention has been paid to the dependence of these correction parameters on operating conditions. Consequently, the consistency between analytical predictions and actual compressor performance remains limited when the compressor operates under different flow conditions.
To address these issues, this study presents the following research and contributions:
(1) An adaptive correction framework is proposed to enhance the predictive capability of the compressor meanline model.
(2) Two gain factors are introduced to modify the calculated deviation angle and total pressure loss. The optimal gain factors at each operating point are identified using the particle swarm optimization (PSO) algorithm by minimizing the deviation between calculated and experimental performance parameters.
(3) A genetic-algorithm-optimized backpropagation neural network (GA-BP) is employed to establish the relationship between the gain factors and operating conditions, enabling adaptive determination of the correction parameters.
The remainder of this paper is organized as follows: Section 2 presents the meanline modeling method for axial compressor performance prediction. The baseline model is evaluated through comparison with experimental data, and its prediction discrepancies under different operating conditions are analyzed. Section 3 introduces the adaptive correction framework, including gain factor identification using the particle swarm optimization (PSO) algorithm and adaptive modeling based on the genetic-algorithm-optimized backpropagation (GA-BP) neural network. Section 4 presents the results and discussion, including comparisons between the adaptive models, as well as validations for stage performance and variable geometry conditions. Finally, Section 5 summarizes the main conclusions of this study. All program computations were performed using MATLAB R2024b on an Intel(R) Core i7-11700K CPU. Data processing and visualization were conducted with Origin 2022 and MATLAB R2024b.
2. Baseline One-Dimensional Meanline Model
The one-dimensional meanline method simplifies the inherently three-dimensional flow in an axial compressor into a quasi-one-dimensional flow along the mean radius, enabling efficient prediction of compressor performance. In this approach, the aerodynamic behavior of each blade row is represented by cascade characteristics at the pitch diameter, while empirical corrections are introduced to account for three-dimensional effects.
The enthalpy rise across the rotor is calculated using the Euler equation (Equation (1)). The outlet parameters of one blade row serve as the inlet conditions for the next row. Starting from the compressor inlet, each stage is solved sequentially, including both the rotor and the stator. The overall compressor performance is then analyzed through stage-by-stage integration.
where h is the specific enthalpy, U is the blade speed, and Ct denotes the tangential component of the absolute velocity. Subscripts 1 and 2 represent the blade inlet and blade outlet, respectively.
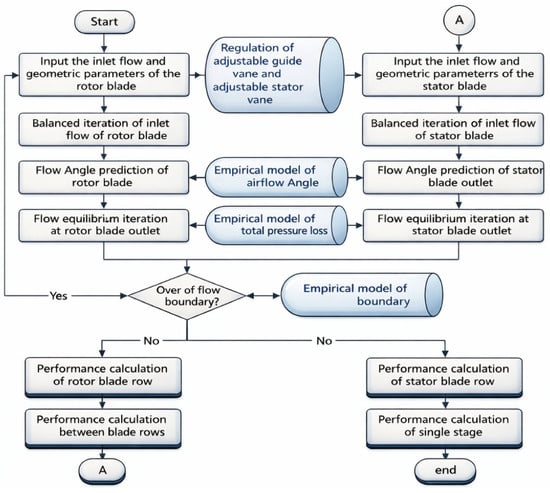
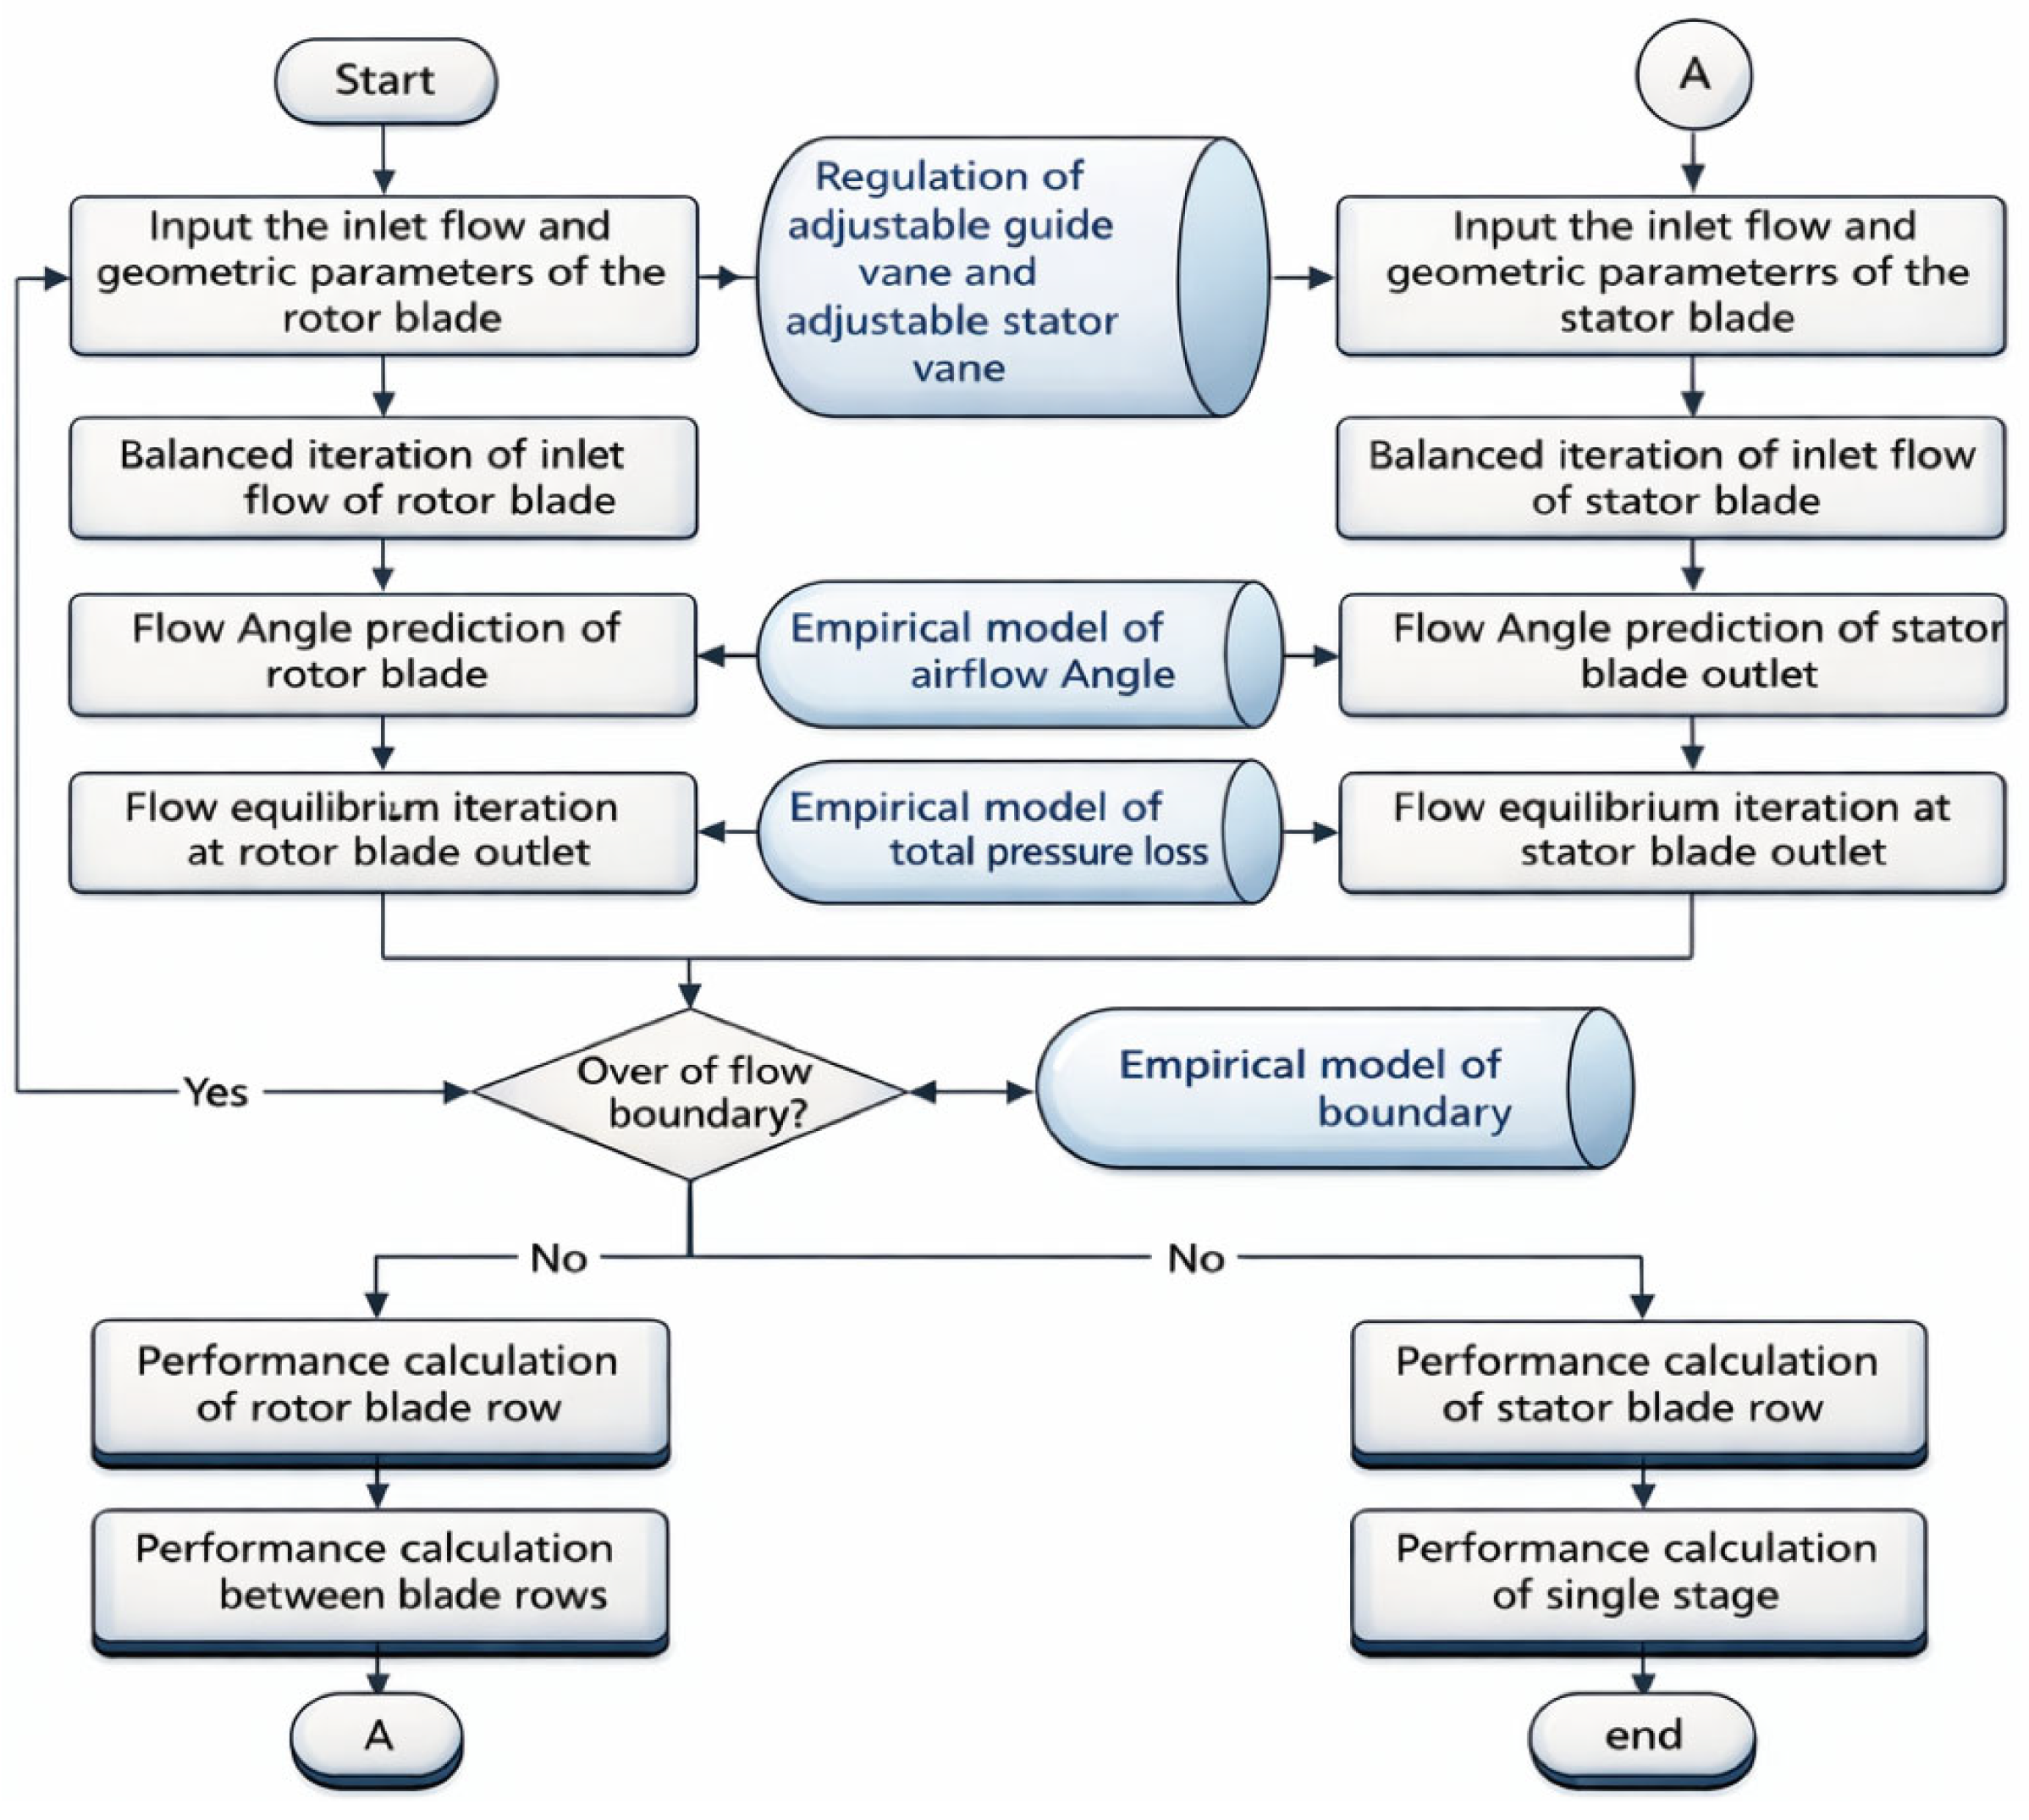
The model requires geometric parameters, including hub and tip radii, chord length, stagger angle, and blade solidity. It also requires inlet aerodynamic conditions, such as mass flow rate, total pressure, total temperature, and flow angle. The calculation procedure for a typical stage is illustrated in Figure 1.
Figure 1.
Flowchart of the one-dimensional performance prediction model of an axial compressor.
The accuracy of the meanline method depends on the adopted empirical sub-models. These include the flow angle model (incidence and deviation), the total pressure loss model, and the stall boundary model [27]. After evaluating convergence, applicability, and computational complexity, classical empirical models derived from experimental data were selected in this study.
2.1. Deviation and Incidence Models
The prediction of the outlet flow angle is essential in meanline calculations. The deviation angle determines the actual flow direction at the blade exit, whereas the incidence angle describes the mismatch between the inlet flow angle and the blade metal angle. Accurate estimation of these two parameters is critical for constructing velocity triangles and predicting compressor performance.
Johnsen et al. established a classical reference incidence angle model based on the NASA SP-36 experiments [14], as given in Equation (2). In this model, the reference incidence angle corresponds to a 10% relative thickness straight blade in the NACA-65 series. It is expressed as a function of the inlet flow angle.
The correction factor Ksh accounts for different airfoil types. It is set to 1.1 for the C-series airfoil, 1.0 for the NACA-65 airfoil, and 0.7 for the double-arc airfoil. The factor Kt corrects the effect of blade relative thickness when it deviates from 10%. The factor n accounts for the influence of camber angle when the airfoil camber is not zero.
Since the original model was developed from low-speed experiments (Ma ≈ 0.1), it is necessary to introduce a Mach number correction for transonic compressor applications. In the present study, the Mach number correction proposed by Aungier [20] was adopted. The corresponding calculation procedure is described in Equations (3)–(7).
where θ is the blade camber angle, γ is the blade setting angle, tmax is the maximum blade thickness, and c is the chord length.
The reference deviation angle model is also derived from the NASA SP-36 database, combined with Carter’s camber correction [28]. Its formulation is similar to that of the reference incidence angle and is given in Equation (8). In this equation, the reference deviation angle corresponds to a 10% relative thickness straight blade in the NACA-65 series.
The reference deviation angle is further corrected to obtain the actual deviation angle. The corrections consider the effects of incidence angle, three-dimensional flow [29], Mach number, and axial velocity ratio [20]. These correction terms are defined in Equations (8)–(12). The final deviation angle is obtained by superimposing all correction terms onto the reference deviation angle.
2.2. Total Pressure Loss Models
The total pressure loss is expressed as the sum of blade profile loss, shock loss, secondary loss, and an off-design correction to the profile loss [19], referred to as off-design loss, as given in Equation (13).
The blade profile loss is calculated using the empirical model proposed by Koch and Smith [16]. This model considers the effects of inlet Mach number, passage height ratio, and Reynolds number. The equivalent suction surface diffusion parameter is obtained by fitting experimental data. A correlation between the form factor H, the momentum thickness ratio , and is then established to determine the reference profile loss at the design incidence angle. The corresponding formulation is given in Equations (14)–(16).
Shock loss is evaluated based on the maximum Mach number within the blade passage. A line normal to the blade leading edge is extended to intersect the suction surface of the adjacent blade. The local Mach number at this intersection is determined using the thermodynamic relationship between the Prandtl–Meyer function and Mach number, and it is taken as the maximum Mach number in the passage. The upstream Mach number for shock loss prediction is then defined as the average of this maximum Mach number and the inlet Mach number. The corresponding shock loss model is presented in Equation (17) [18].
The secondary loss is calculated using the Howell model [12], as shown in Equation (18).
The off-design loss accounts for the deviation between the operating incidence angle and the design incidence angle [30]. It is expressed as a function of the incidence angle difference and is also correlated with the inlet Mach number. The formulation is given in Equation (19).
After the flow field and individual loss components are determined, the total pressure loss coefficient is used to update the total and static pressures at the blade exit. The stage pressure ratio and efficiency are then obtained based on the total loss coefficient as expressed in Equations (20) and (21).
2.3. Surge Boundary Model
Aungier proposed a surge boundary criterion based on the limiting velocity ratio and the length-to-width ratio of a two-dimensional diffuser, derived from experimental data [31]. The correlation between the surge boundary and blade geometric parameters, including blade thickness, solidity, camber, and installation angle, is given in Equation (22). Surge is assumed to occur when the equivalent velocity ratio falls below this critical value.
In this model, the ratio of blade chord length to throat width is treated as the length-to-width ratio of a two-dimensional diffuser. The throat width is approximated using the camber angle and the installation angle. To reduce Mach number effects, the equivalent velocity ratio is evaluated using relative dynamic pressure, as defined in Equation (23).
2.4. Baseline Model Prediction and Discrepancy Analysis
To assess the inherent predictive capability of the baseline meanline model, the well-documented NASA two-stage axial compressor [32] is used as the validation case. Its design parameters are presented in Table 1. Extensive experimental data are available for this configuration, and it has been widely adopted as a case in compressor studies.
Table 1.
Design parameters of the NASA two-stage compressor.
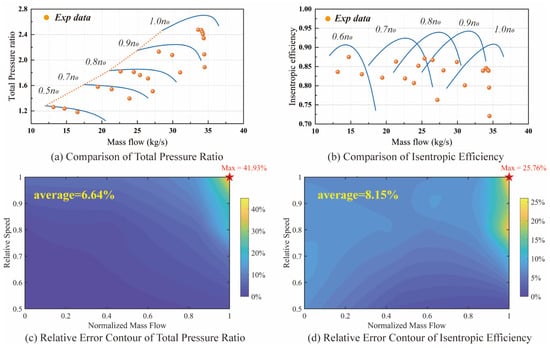
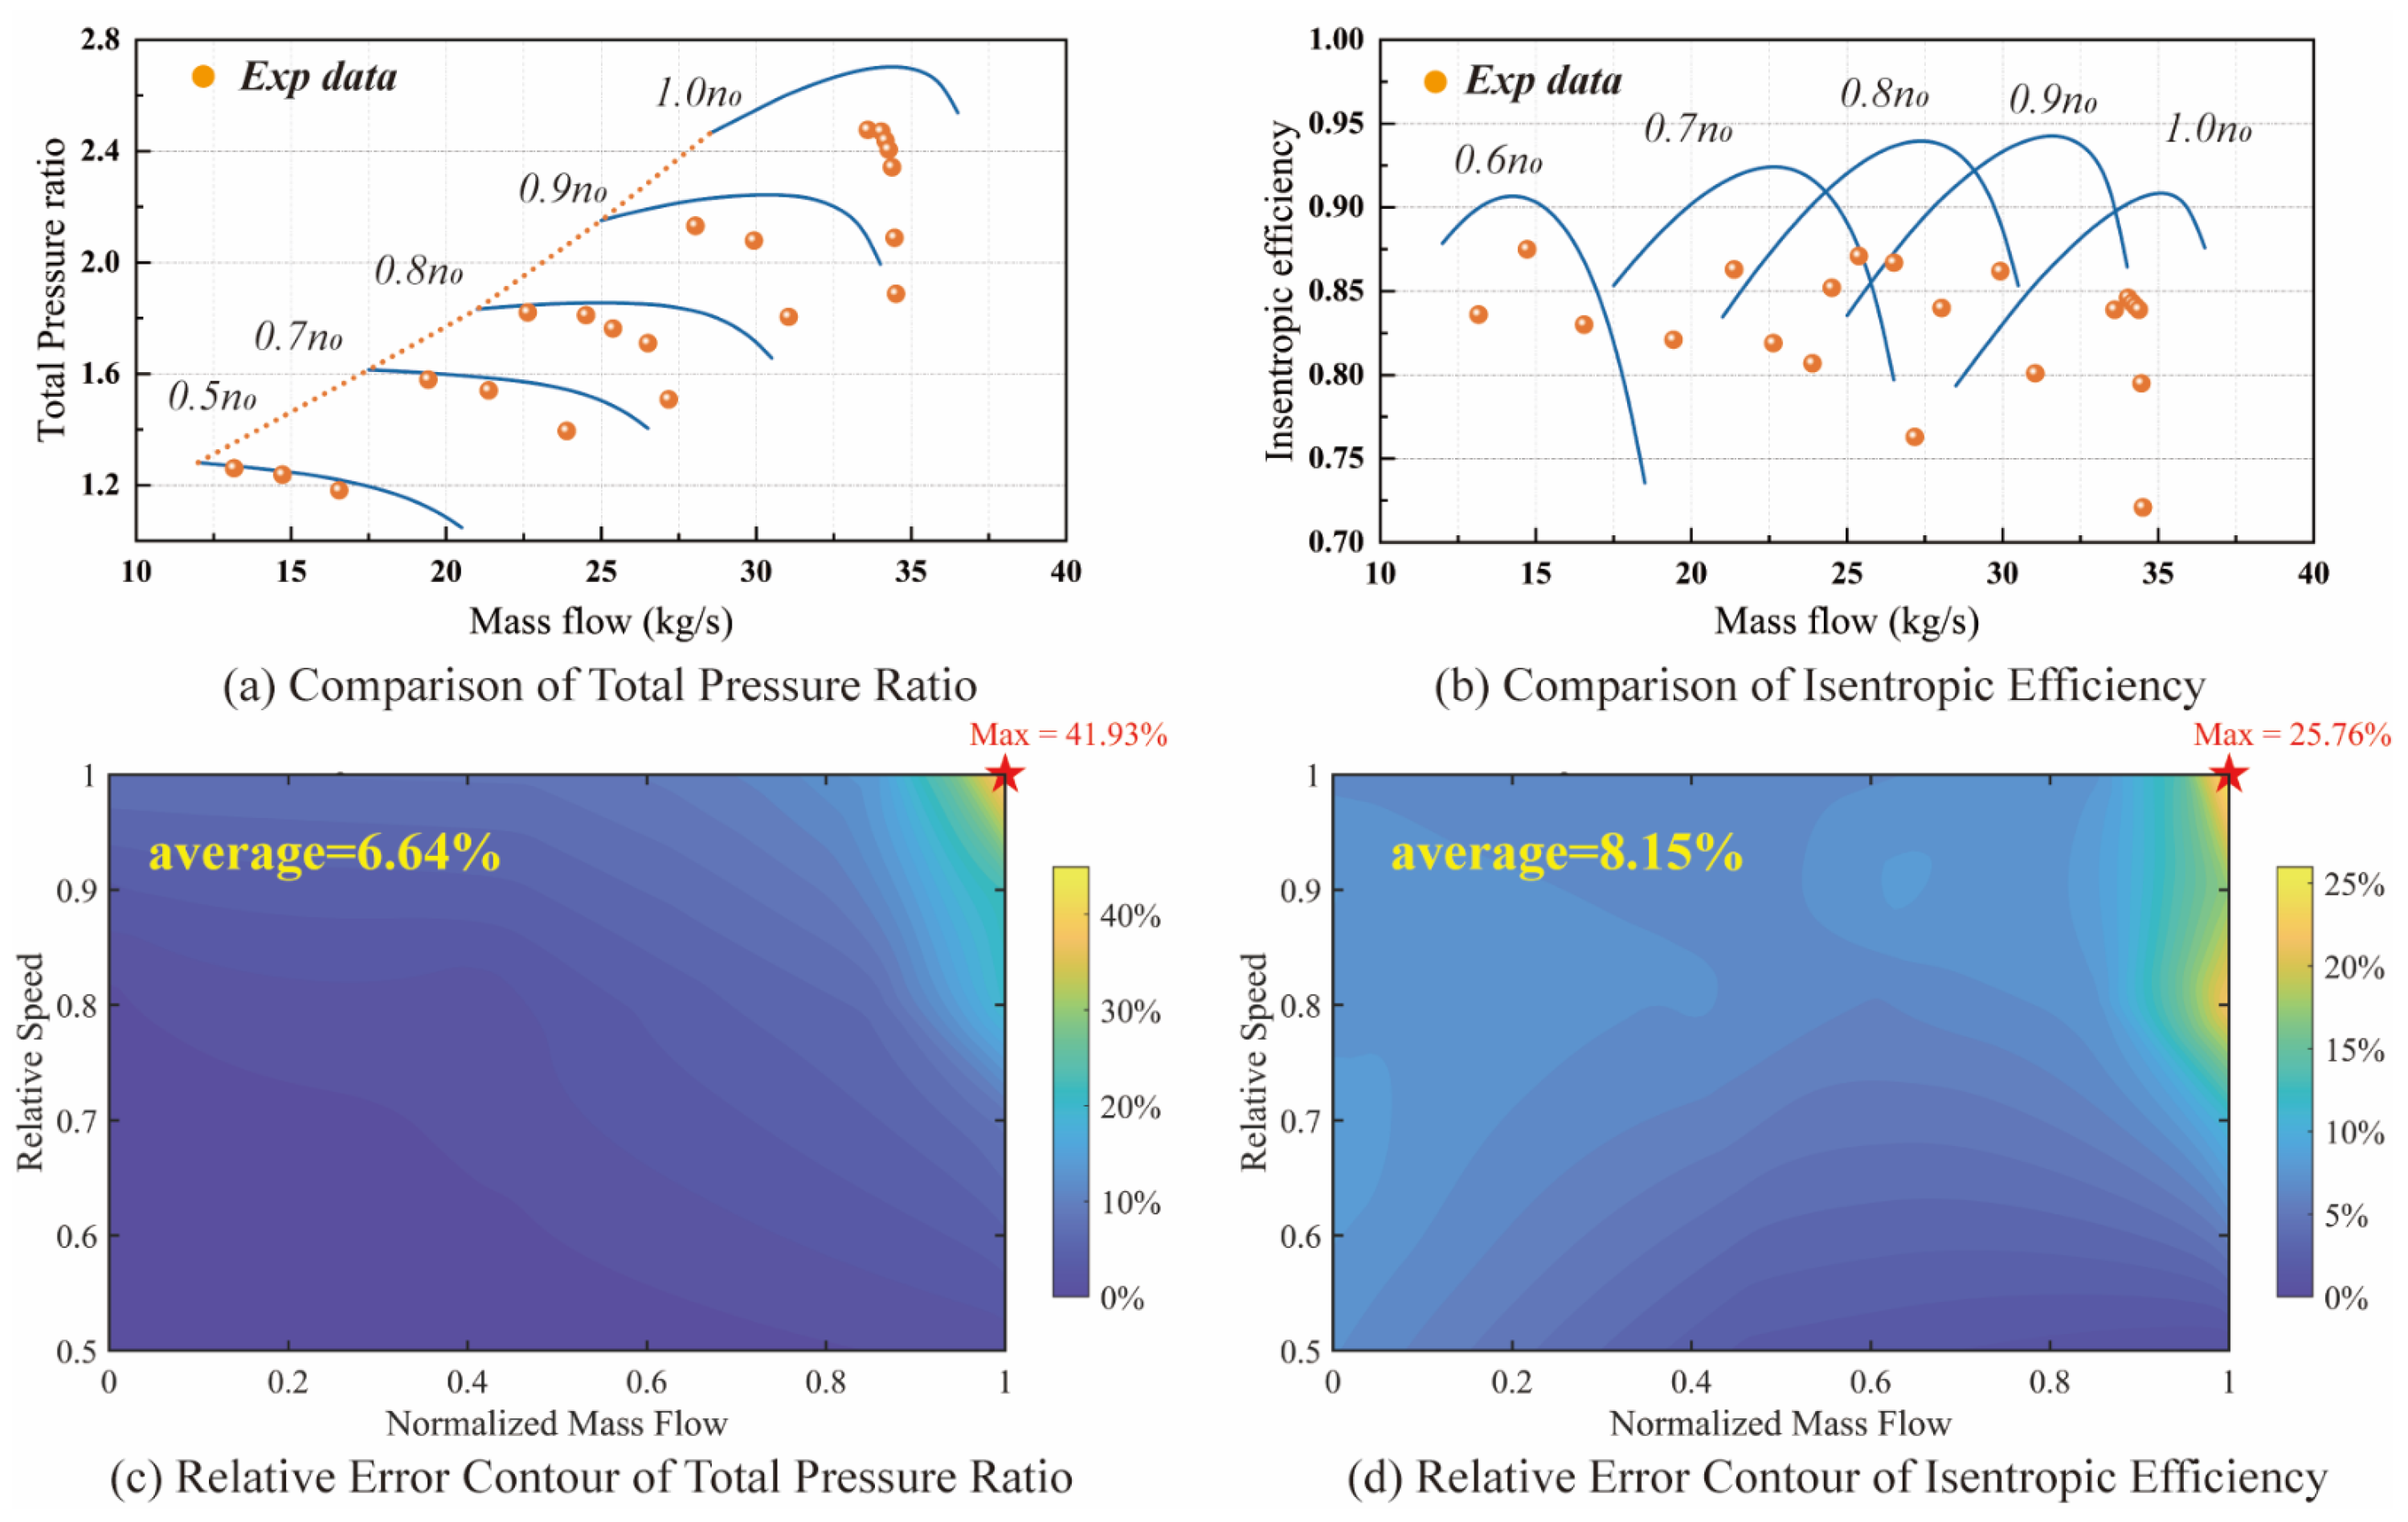
The baseline meanline model reproduces the fundamental characteristics of compressor performance, and the predicted curves exhibit the typical shape of axial compressor maps. The calculated result is compared with experimental data available in the literature. Figure 2a,b show the comparisons of total pressure ratio and isentropic efficiency as functions of mass flow rate at different rotational speeds. The experimental data points are superimposed onto the predicted curves to allow a direct visual evaluation of the model’s accuracy.
Figure 2.
Comparison of the NASA two-stage compressor performance between the baseline meanline model and experiments with discrepancy distribution: (a) comparison of total pressure ratio; (b) comparison of isentropic efficiency; (c) relative discrepancy contour of total pressure ratio; (d) relative discrepancy contour of isentropic efficiency.
Figure 2c,d further illustrate the distributions of relative discrepancies in the two performance parameters over the operating range defined by mass flow rate and rotational speed. In these figures, the mass flow rate is normalized for each rotational speed, where the stall flow rate is defined as 0, and the choke flow rate is defined as 1. This normalization enables the prediction discrepancies at different speeds to be compared within a unified flow range. The relative discrepancies are evaluated by comparing the predicted and experimental values at the same mass flow rate.
The results show that for most operating conditions, the relative prediction discrepancies remain within 10%, indicating that the baseline model provides a reasonable estimate of the overall compressor characteristics. However, the maximum relative discrepancies reach 42% for the pressure ratio and 26% for the efficiency under extreme operating conditions, both occurring at the highest rotational speed and the largest mass flow rate. The relative discrepancies tend to increase with increasing rotational speed. For a given rotational speed, larger discrepancies are typically observed in the near-choke region. These results indicate that the baseline meanline model becomes less accurate under high-speed and high-flow conditions.
It should be noted that these discrepancies do not necessarily indicate deficiencies in the empirical correlations themselves. Most deviation and loss correlations were developed based on specific cascade or compressor experiments and have been successfully applied in many engineering studies. However, due to the wide range of operating conditions encountered in practical compressors, it is difficult for a single set of empirical correlations to maintain optimal accuracy across all operating regimes. Therefore, introducing an appropriate correction strategy to adapt the baseline model to different operating conditions is necessary for improving the overall prediction accuracy.
3. Adaptive Correction Model Based on Neural Network
In the meanline framework, the predicted compressor performance is highly sensitive to the deviation angle and loss correlations, which determine the flow turning and the energy dissipation across the blade rows. Therefore, even small discrepancies in these empirical models may propagate through the stage-by-stage calculation and lead to noticeable deviations in the predicted pressure ratio and isentropic efficiency.
To improve the prediction accuracy while preserving the physical structure of the original model, a correction strategy based on gain factors is introduced for the deviation and loss correlations. The use of gain factors provides a simple and robust way to compensate for systematic discrepancies between the empirical correlations and the actual compressor behavior. The linear gain formulation is adopted because it preserves the fundamental structure and physical consistency of the original empirical correlations while introducing only a small number of additional parameters. This allows the correction to be incorporated into the existing meanline framework without affecting its numerical stability or computational efficiency while effectively adjusting the magnitude of the predicted deviation and loss.
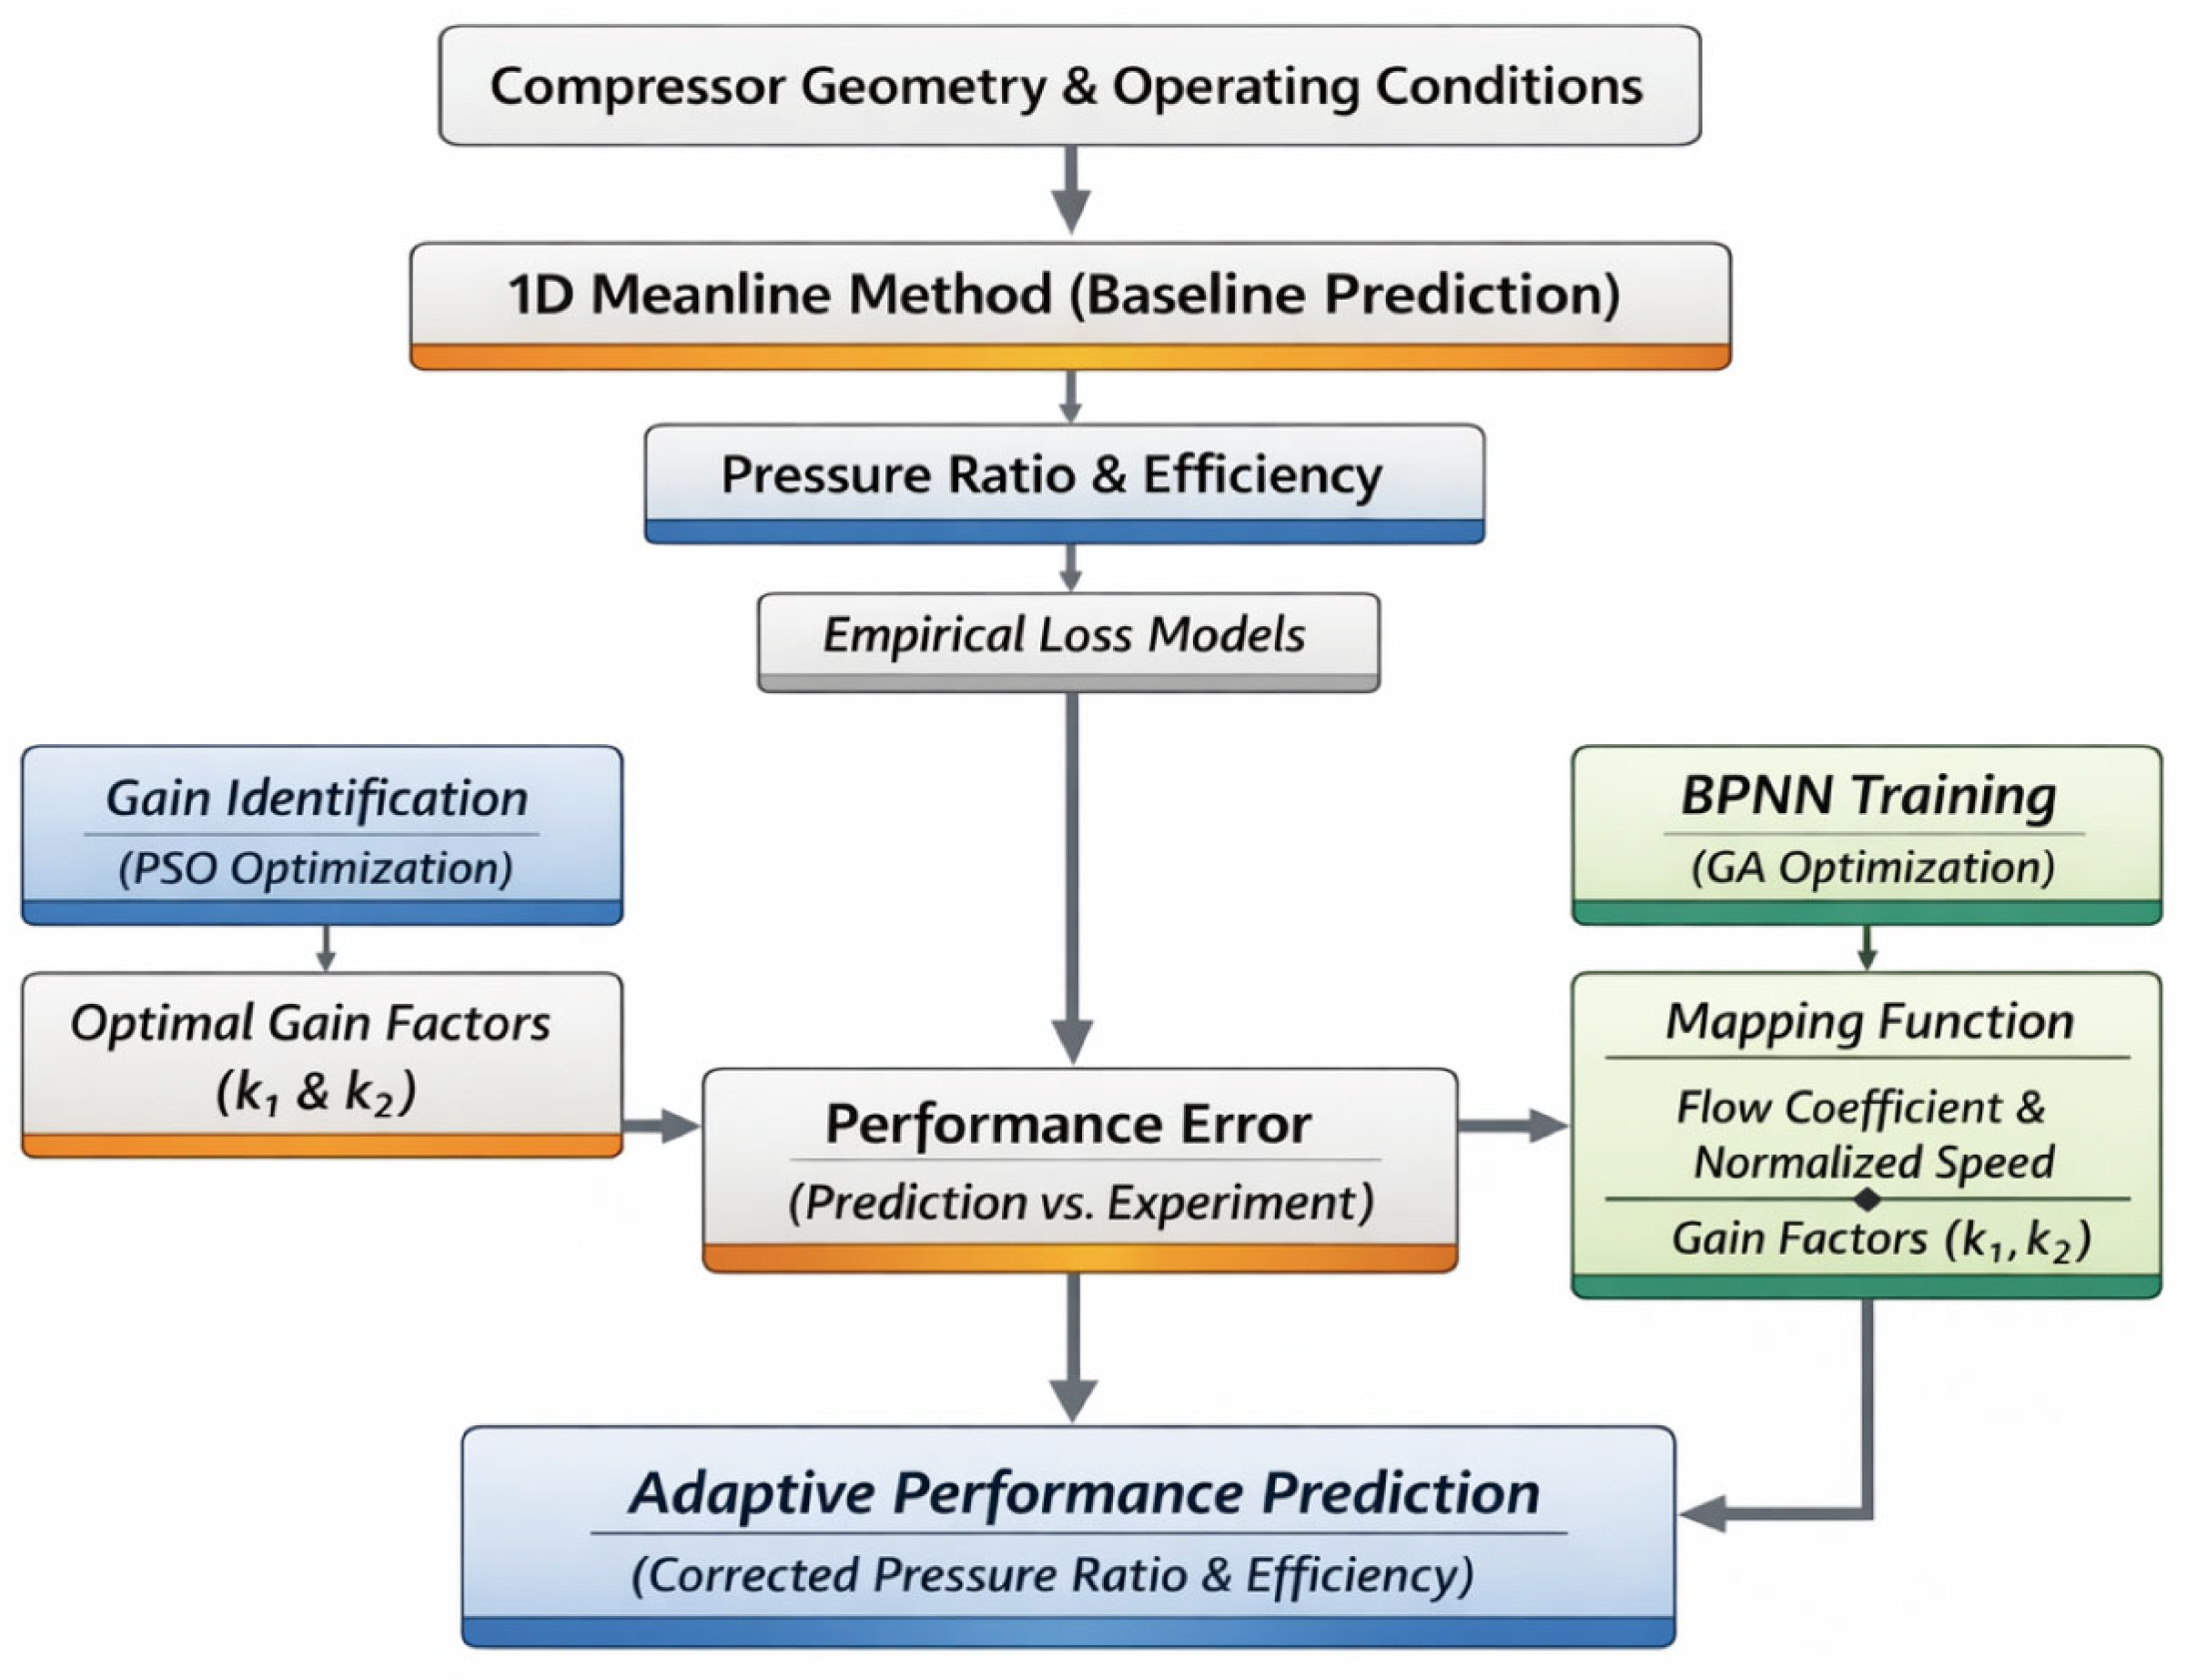
Nevertheless, the magnitude of the prediction discrepancy varies with operating conditions, suggesting that the optimal gain factors are unlikely to remain constant. Instead, they are expected to depend on operating parameters such as rotational speed and flow coefficient. Therefore, a data-driven approach is adopted to learn the relationship between operating conditions and the corresponding gain factors, enabling an adaptive correction of the baseline meanline model. The overall technical framework of the proposed methodology is illustrated in Figure 3.
Figure 3.
Computational flowchart of the hybrid data-driven adaptive correction model for compressor performance prediction.
3.1. Optimal Gain Factor Determination Using PSO
To enhance the predictive accuracy of the meanline model, two linear gain coefficients, denoted as k1 and k2, are introduced to adjust the calculated deviation angle and total pressure loss, as shown in Equations (24) and (25). These coefficients, hereafter referred to as gain factors, are applied directly to the outputs of the corresponding sub-models. Particle swarm optimization (PSO) is employed to search for the optimal gain combination (k1, k2). Each particle represents a candidate pair of gain coefficients, and the fitness value is evaluated using the objective function defined in Equation (26). The particle positions are iteratively updated until convergence is achieved. The gain combination corresponding to the minimum objective function value is selected as the final solution.
After optimization, the calculated total pressure ratio and isentropic efficiency at every operating point agree almost exactly with the corresponding experimental values. Due to this point-wise calibration strategy, the discrepancy between the numerical prediction and the experimental measurement becomes nearly negligible at the optimized conditions. This result indicates that the two gain factors provide sufficient flexibility to compensate for the primary modeling bias locally.
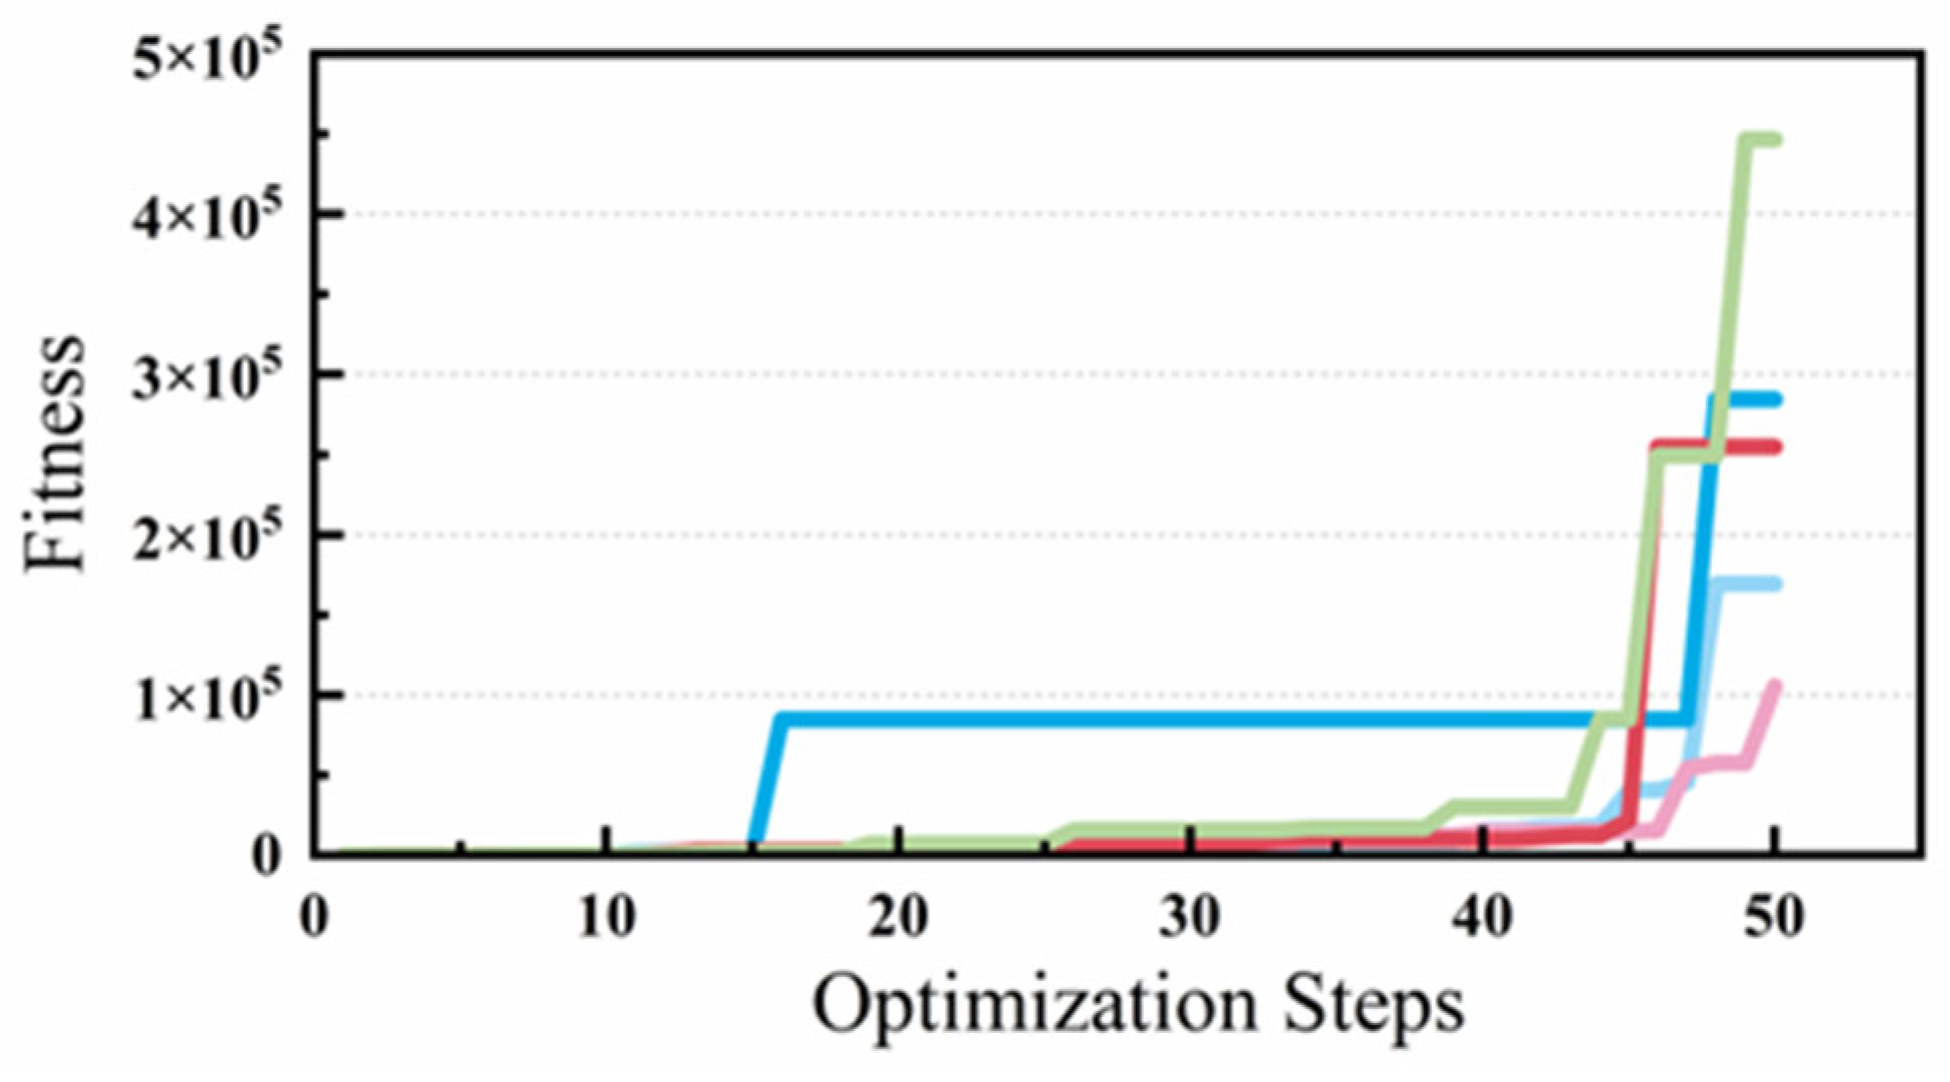
PSO is a stochastic optimization algorithm. Because particle positions and velocities are randomly initialized, repeated runs may give slightly different solutions. In this study, the differences among solutions from multiple PSO runs are on the order of 10−3, which is negligible compared with the parameter magnitude. When the optimization was repeated under the same operating conditions for five runs, the fitness value F was always higher than 105, as shown in Figure 4. This indicates great repeatability of the optimization process and suggests that the reduced parameter space is well-conditioned and likely dominated by a single global optimum. Although the stochastic nature of PSO cannot be fully removed, the two-parameter formulation avoids the ambiguity often seen in high-dimensional optimization and ensures stable calibration results.
Figure 4.
Fitness curves under five repeated optimization runs.
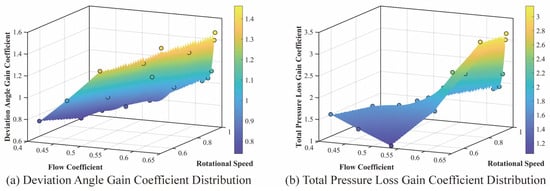
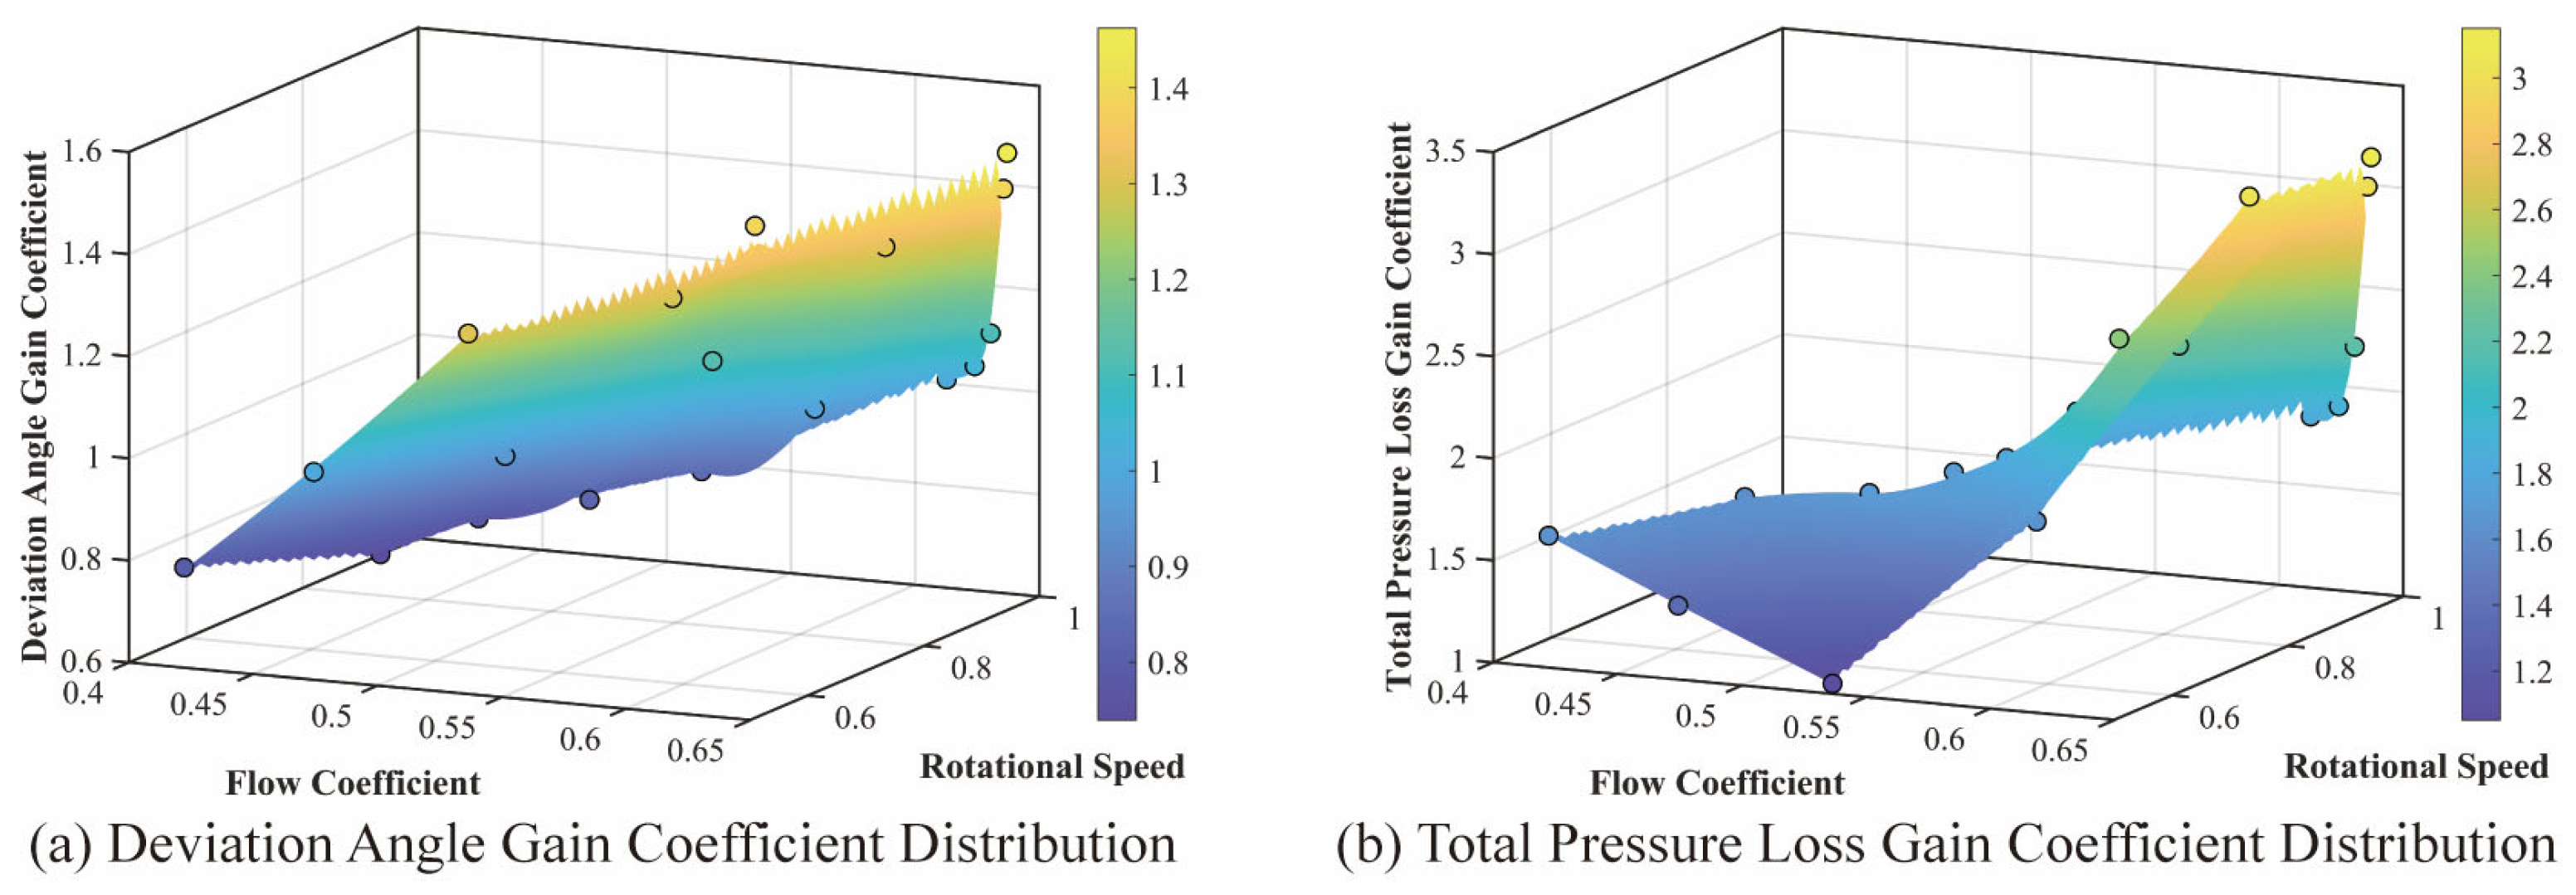
However, the correction strategy should not be judged only by point-wise agreement. To examine the physical consistency of the calibrated parameters, the optimized gain factors over the full operating range were analyzed with respect to the flow coefficient and rotational speed. As shown in Figure 5, both gain factors show continuous and clear trends in the three-dimensional space defined by operating condition and gain magnitude. This behavior suggests that the optimized parameters are not arbitrary fitting values but reflect the deficiencies of the baseline model under different aerodynamic states. Based on this trend, a GA-BP neural network is used to generalize the gain factors over the full operating range, allowing for adaptive correction under arbitrary operating conditions.
Figure 5.
Distribution of the optimized gain factors in the flow coefficient–rotational speed space: (a) deviation angle gain coefficient distribution; (b) total pressure loss gain coefficient distribution.
3.2. GA-BP Neural Network for Gain Factor Prediction
To capture the relationship between operating conditions and the optimal gain coefficients, a GA-BP neural network is employed to learn the mapping between them. Because the number of original operating points is limited, the dataset was expanded from 21 to 75 samples before training to improve generalization.
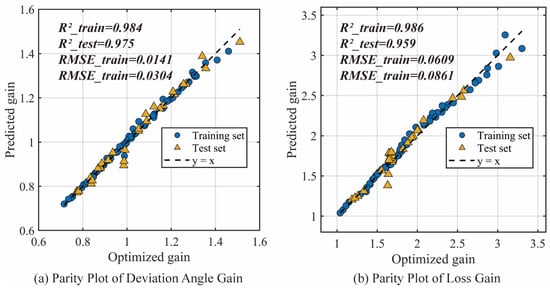
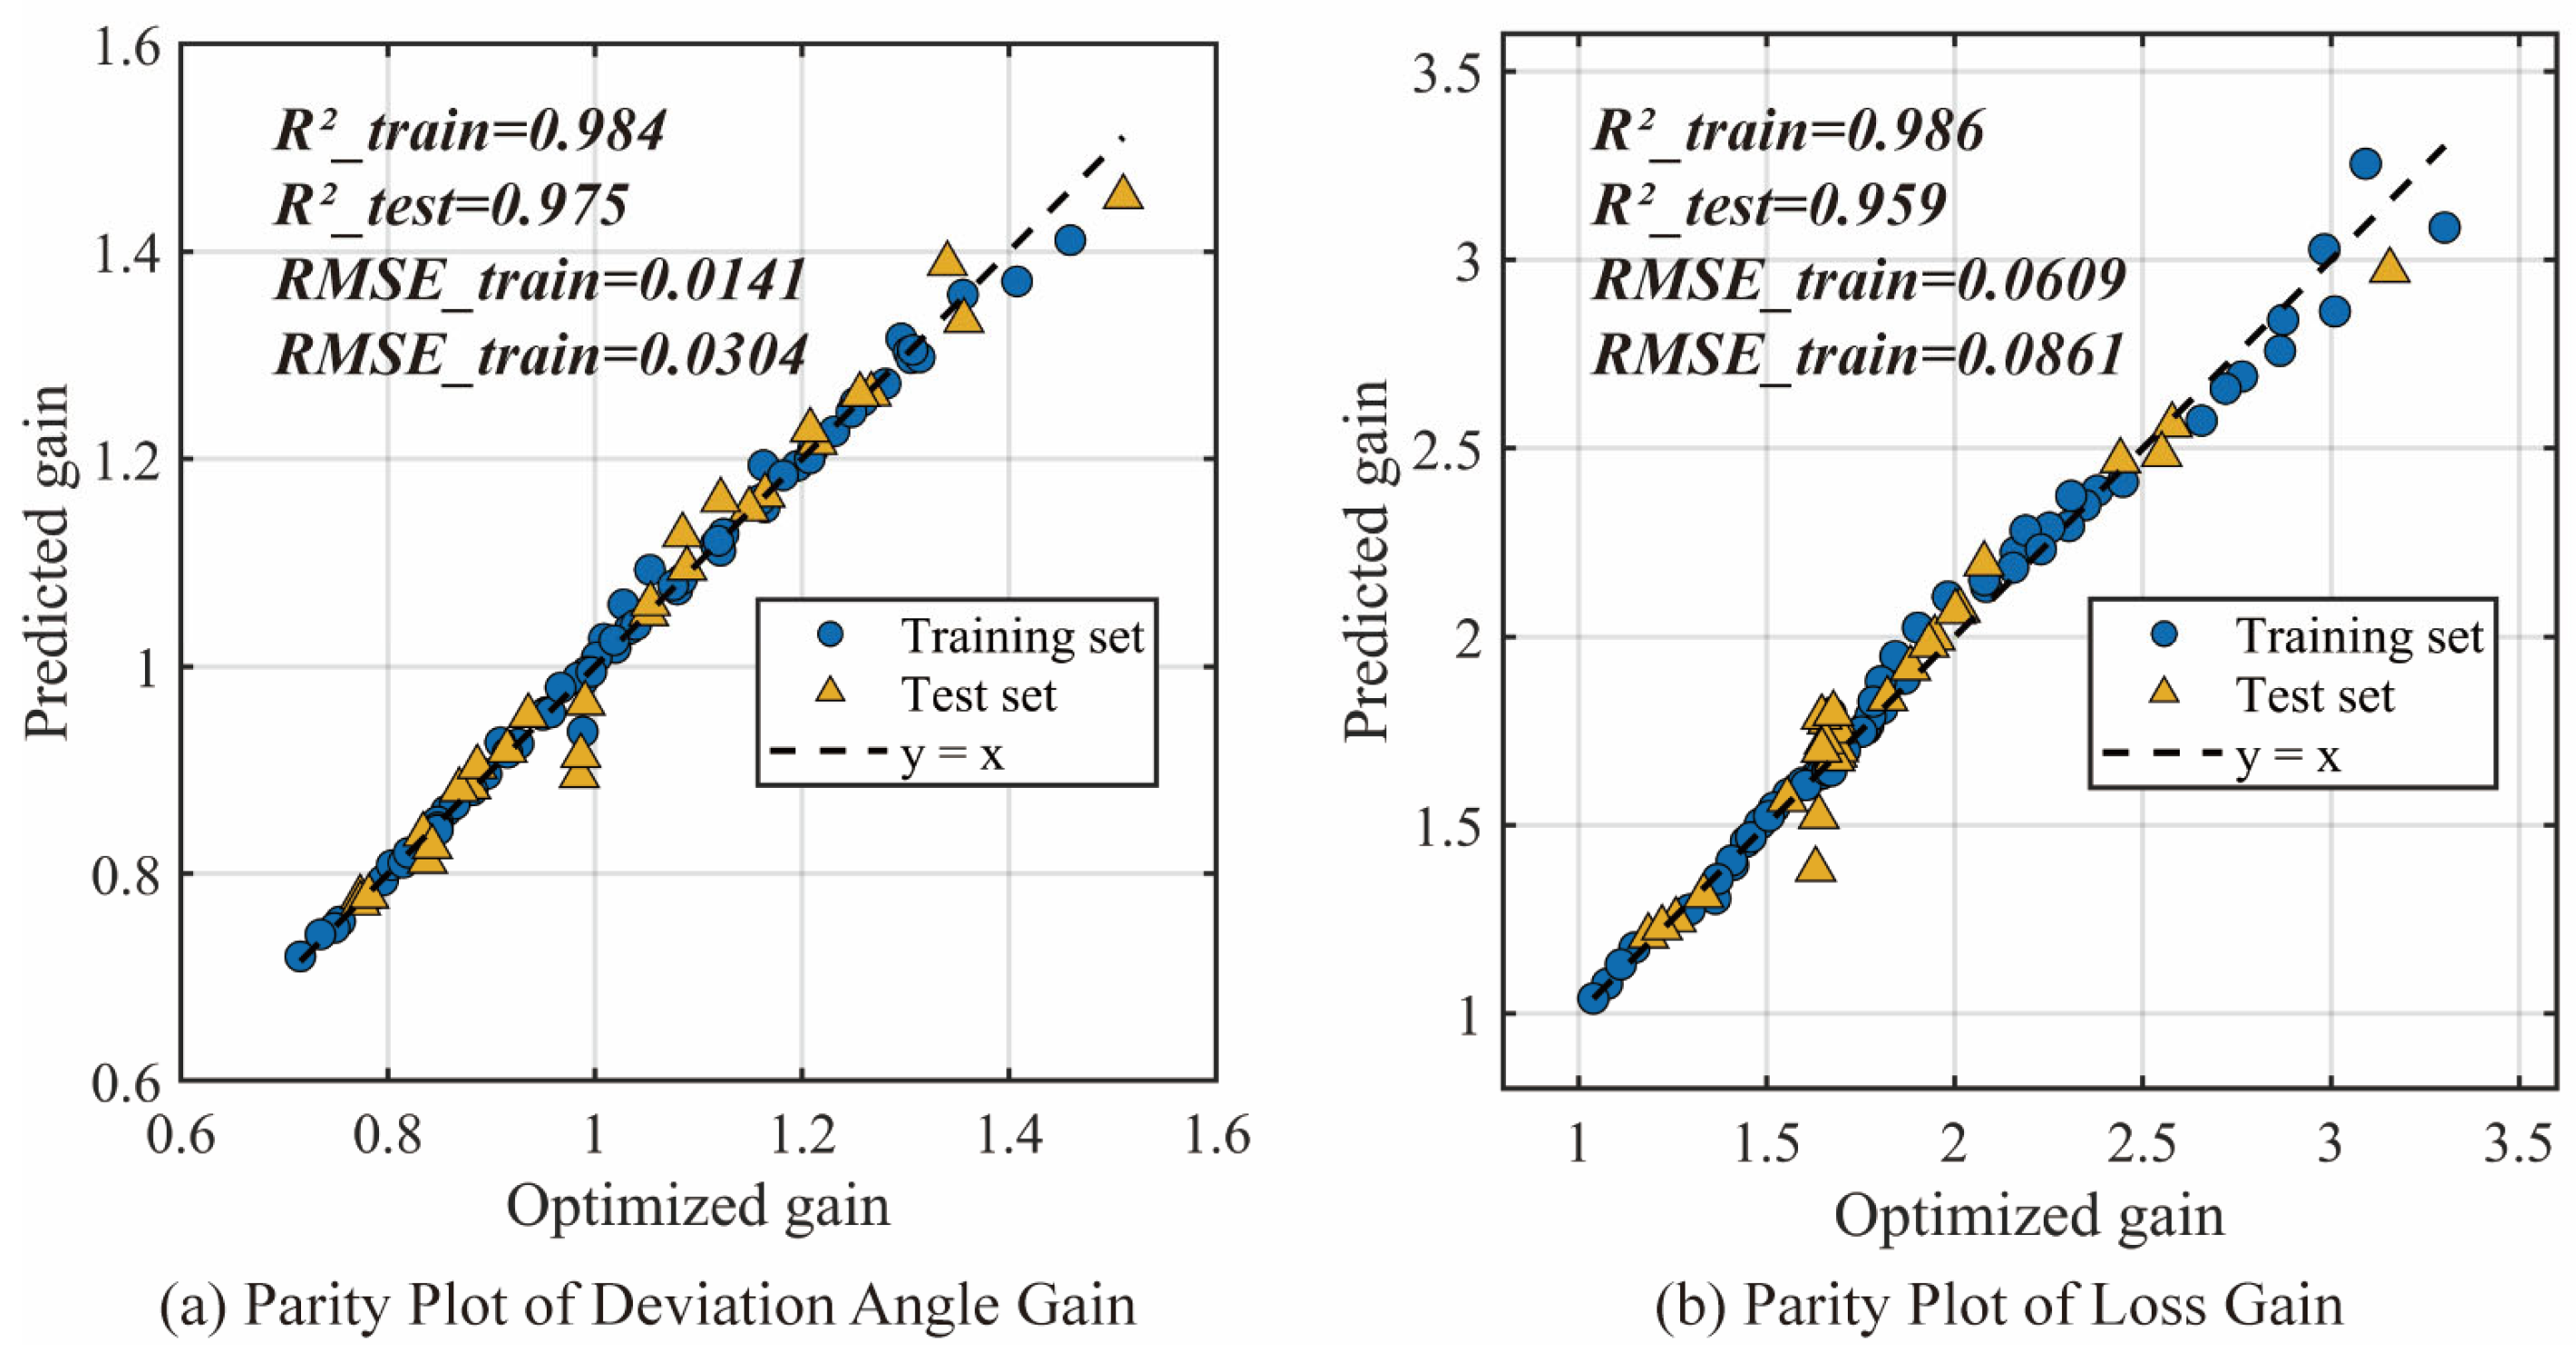
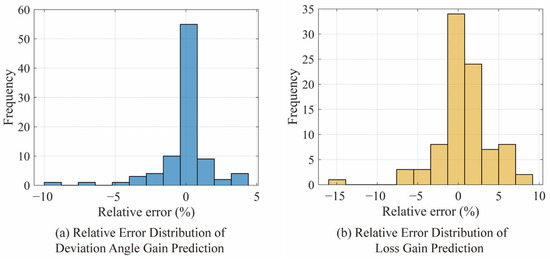
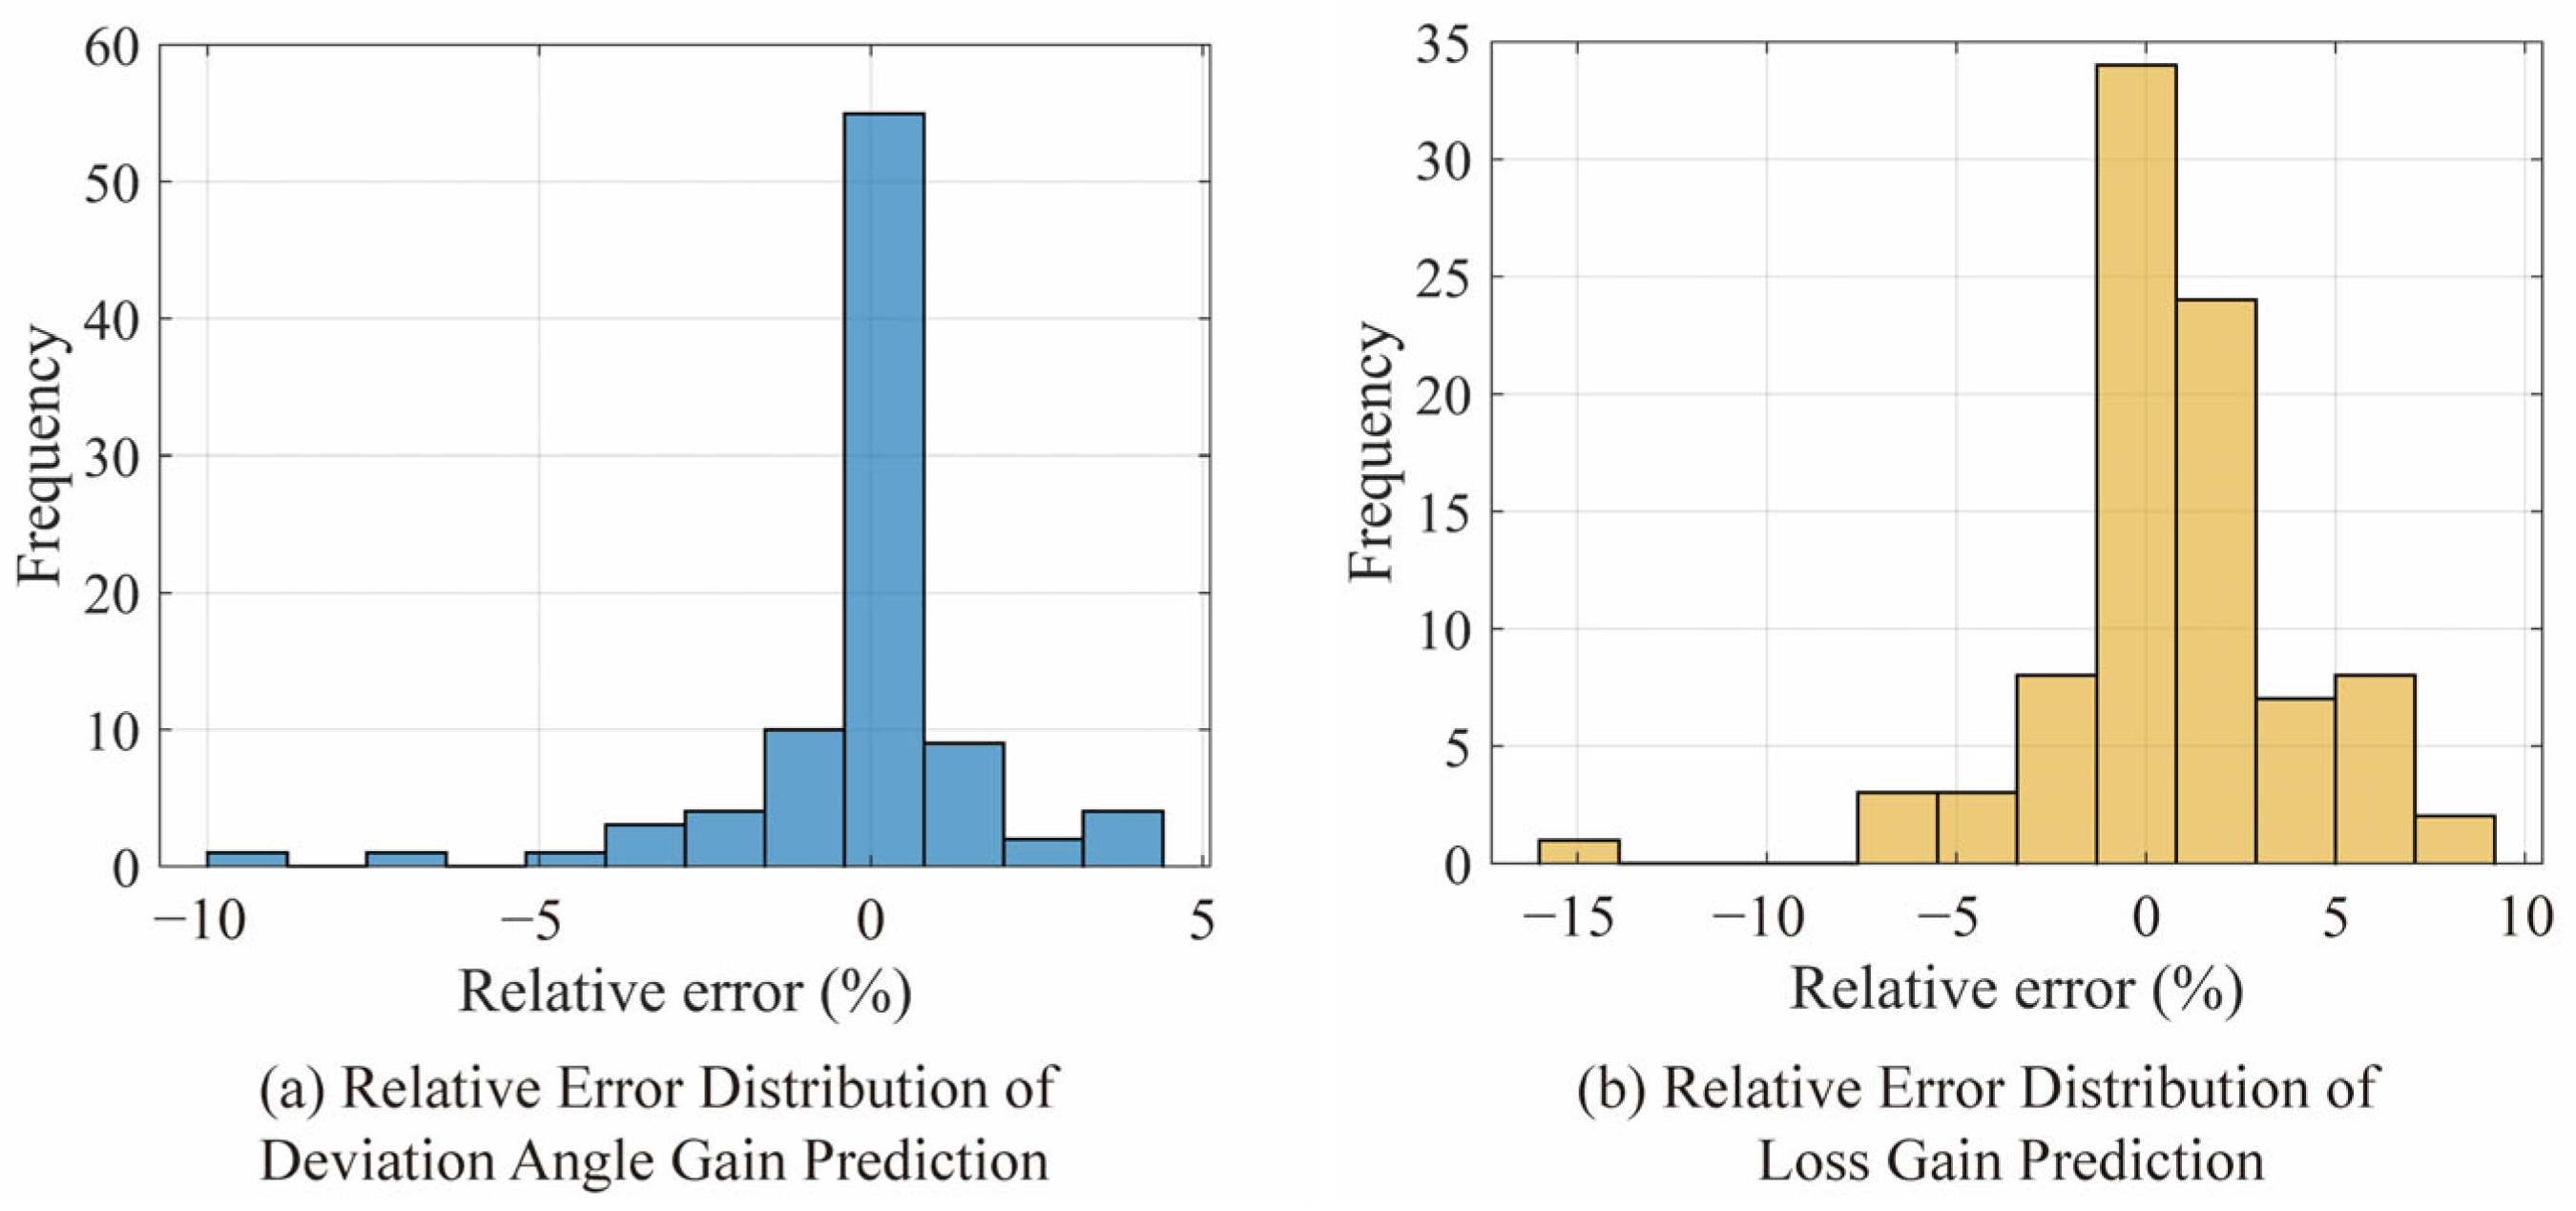
Figure 6a and Figure 7b show the parity plots of the predicted versus optimized gain factors for deviation angle and total pressure loss, respectively. The predicted values closely follow the diagonal line, with R2 exceeding 0.95 and RMSE below 0.1 for both the training and testing datasets. This indicates that the network accurately captures the variation in both gain factors over the operating range, with only minor deviations in regions of high gain factors or high losses. Figure 7 presents the distribution of the prediction errors. Most errors are concentrated around zero, demonstrating that the network provides reliable gain predictions for unseen operating conditions.
Figure 6.
Parity plot of gain factors for the training and test sets: (a) parity plot of deviation angle gain; (b) parity plot of loss gain.
Figure 7.
Histogram of prediction errors for the gain coefficient: (a) relative error distribution of deviation angle gain prediction; (b) relative error distribution of loss gain prediction.
Once the GA-BP network is trained, it can predict gain factors for arbitrary operating conditions. The network uses the flow coefficient and the relative rotational speed as inputs. In the next section, these predicted gains are then applied to the baseline meanline model to obtain corrected predictions of total pressure ratio and isentropic efficiency. Through this framework, the gain coefficients are transformed from fixed empirical parameters into variables that depend on operating conditions. This improves the agreement between analytical predictions and actual compressor behavior while maintaining good computational efficiency.
4. Results and Discussion
4.1. Performance Prediction with Adaptive Correction Model
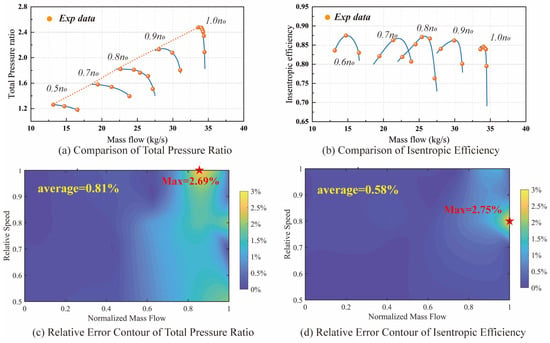
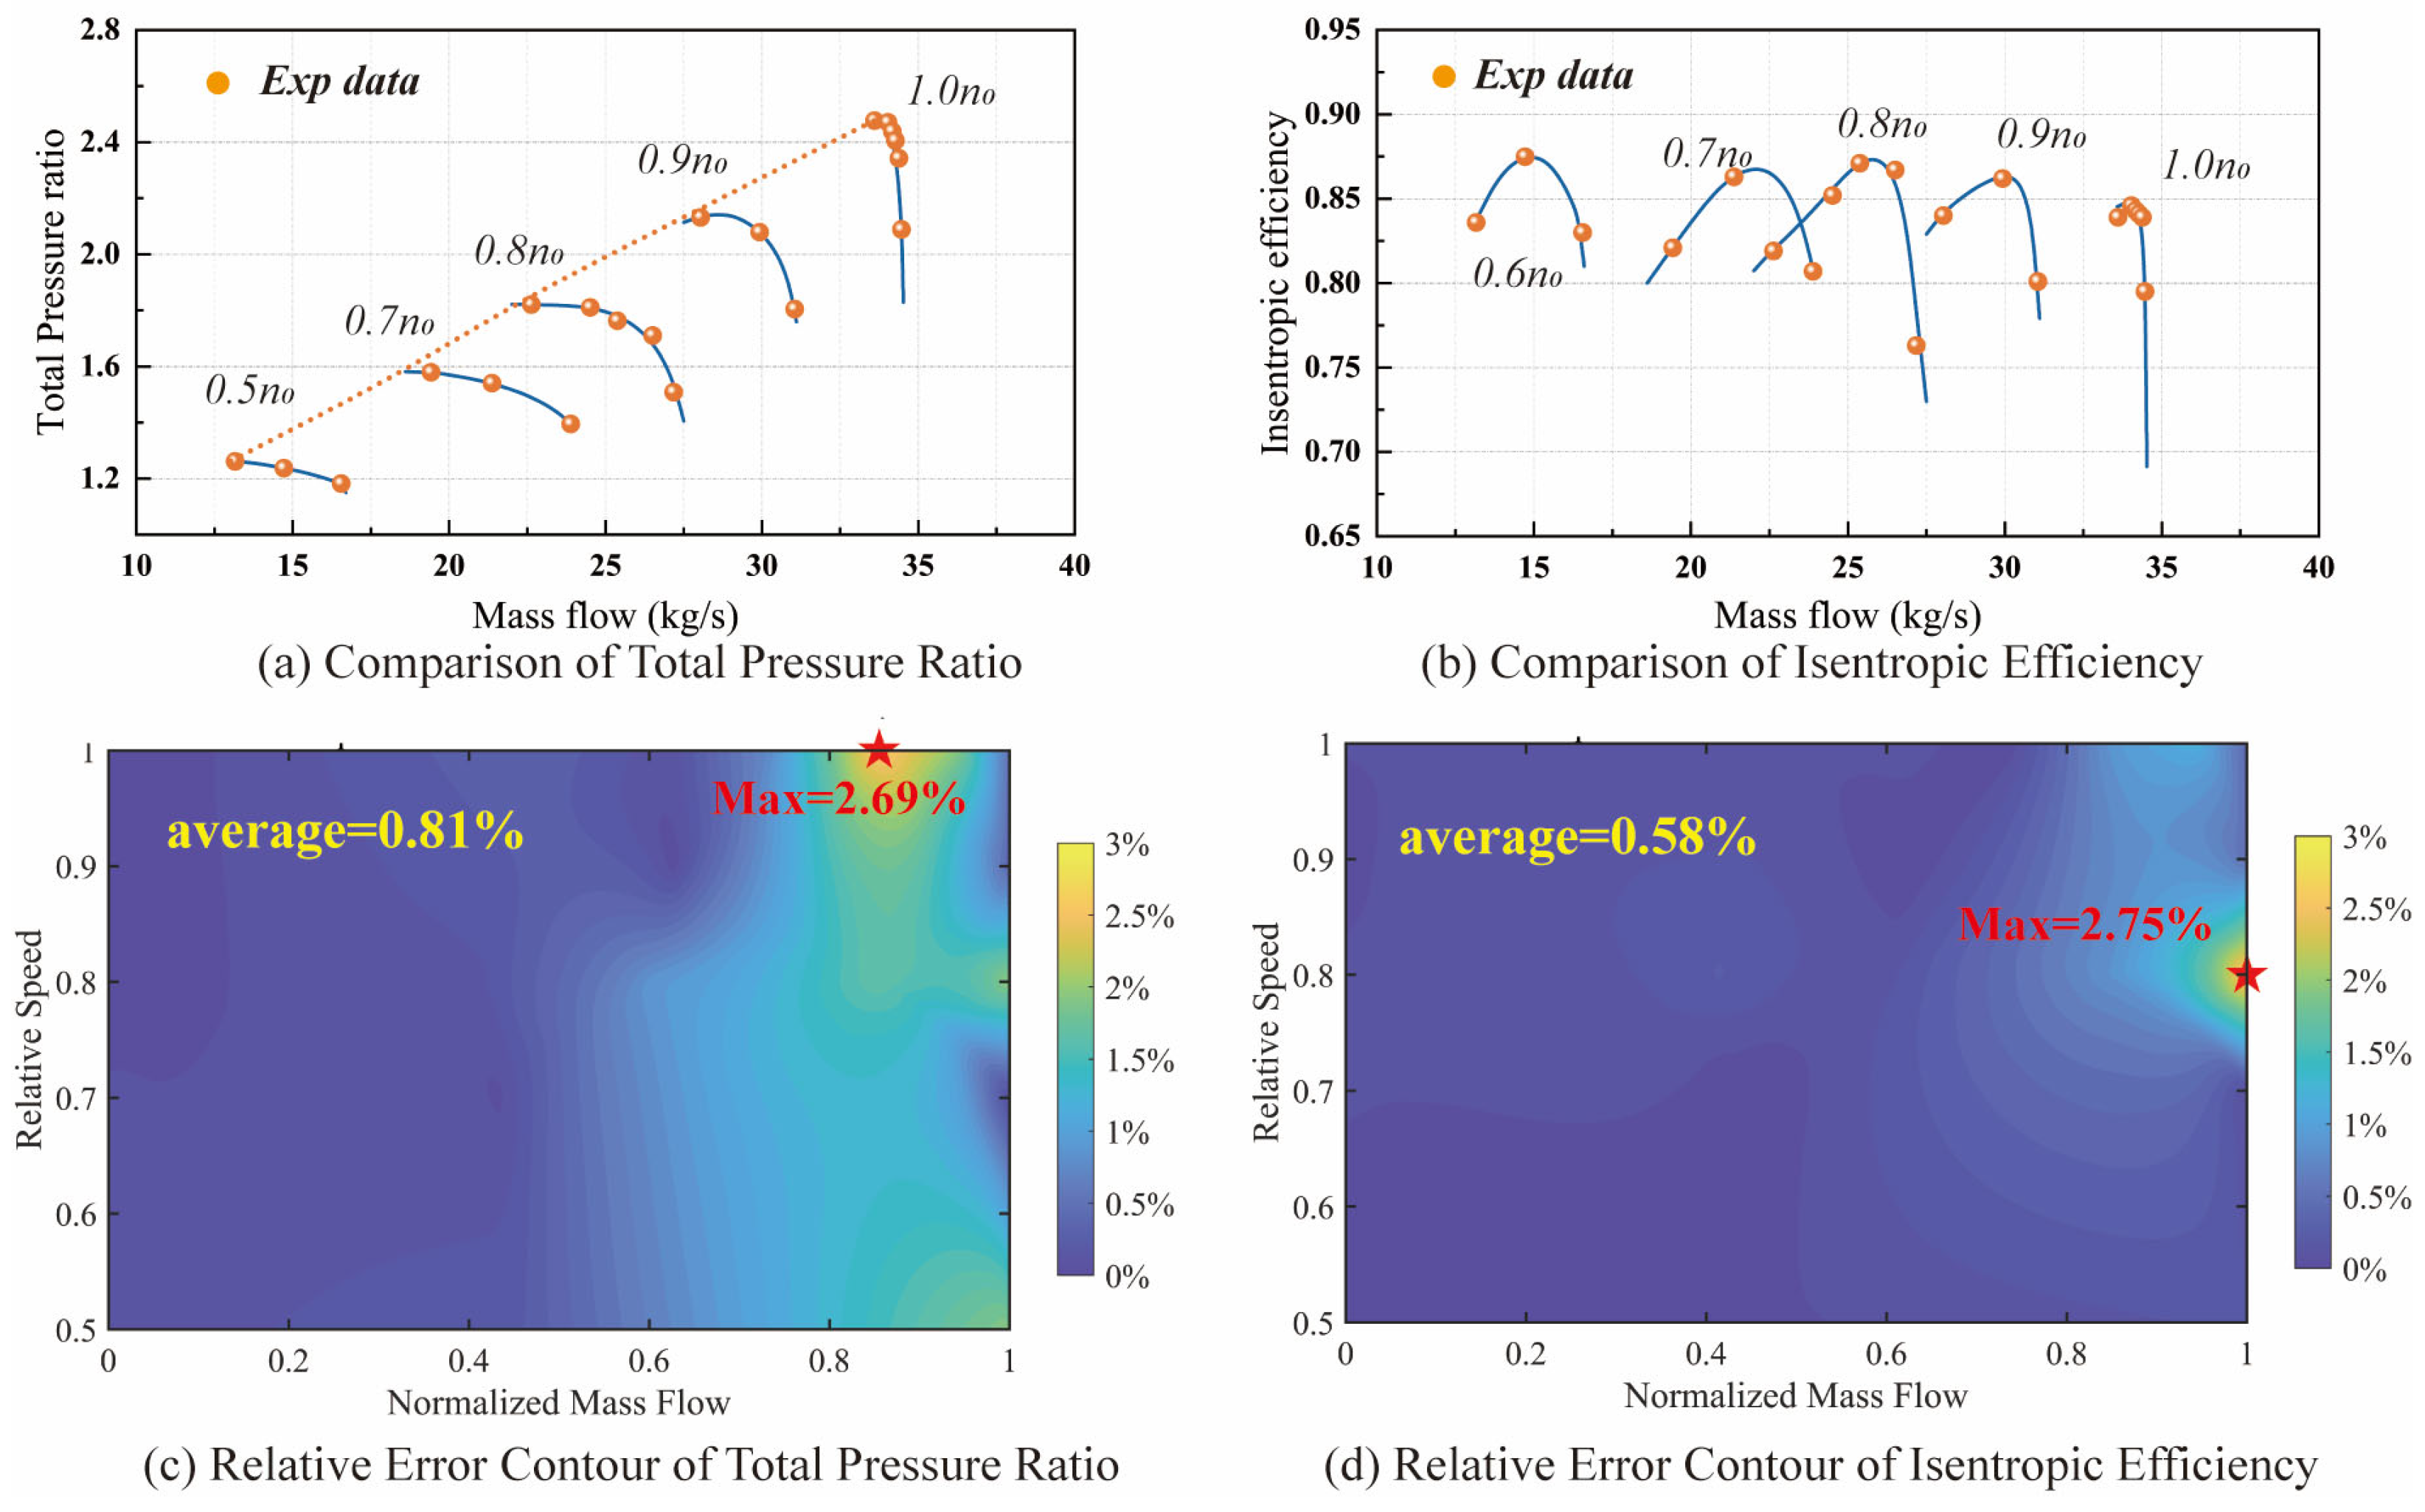
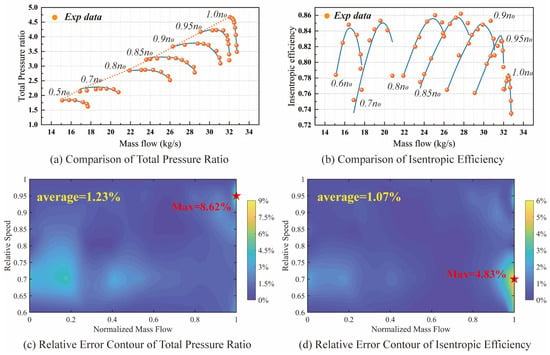
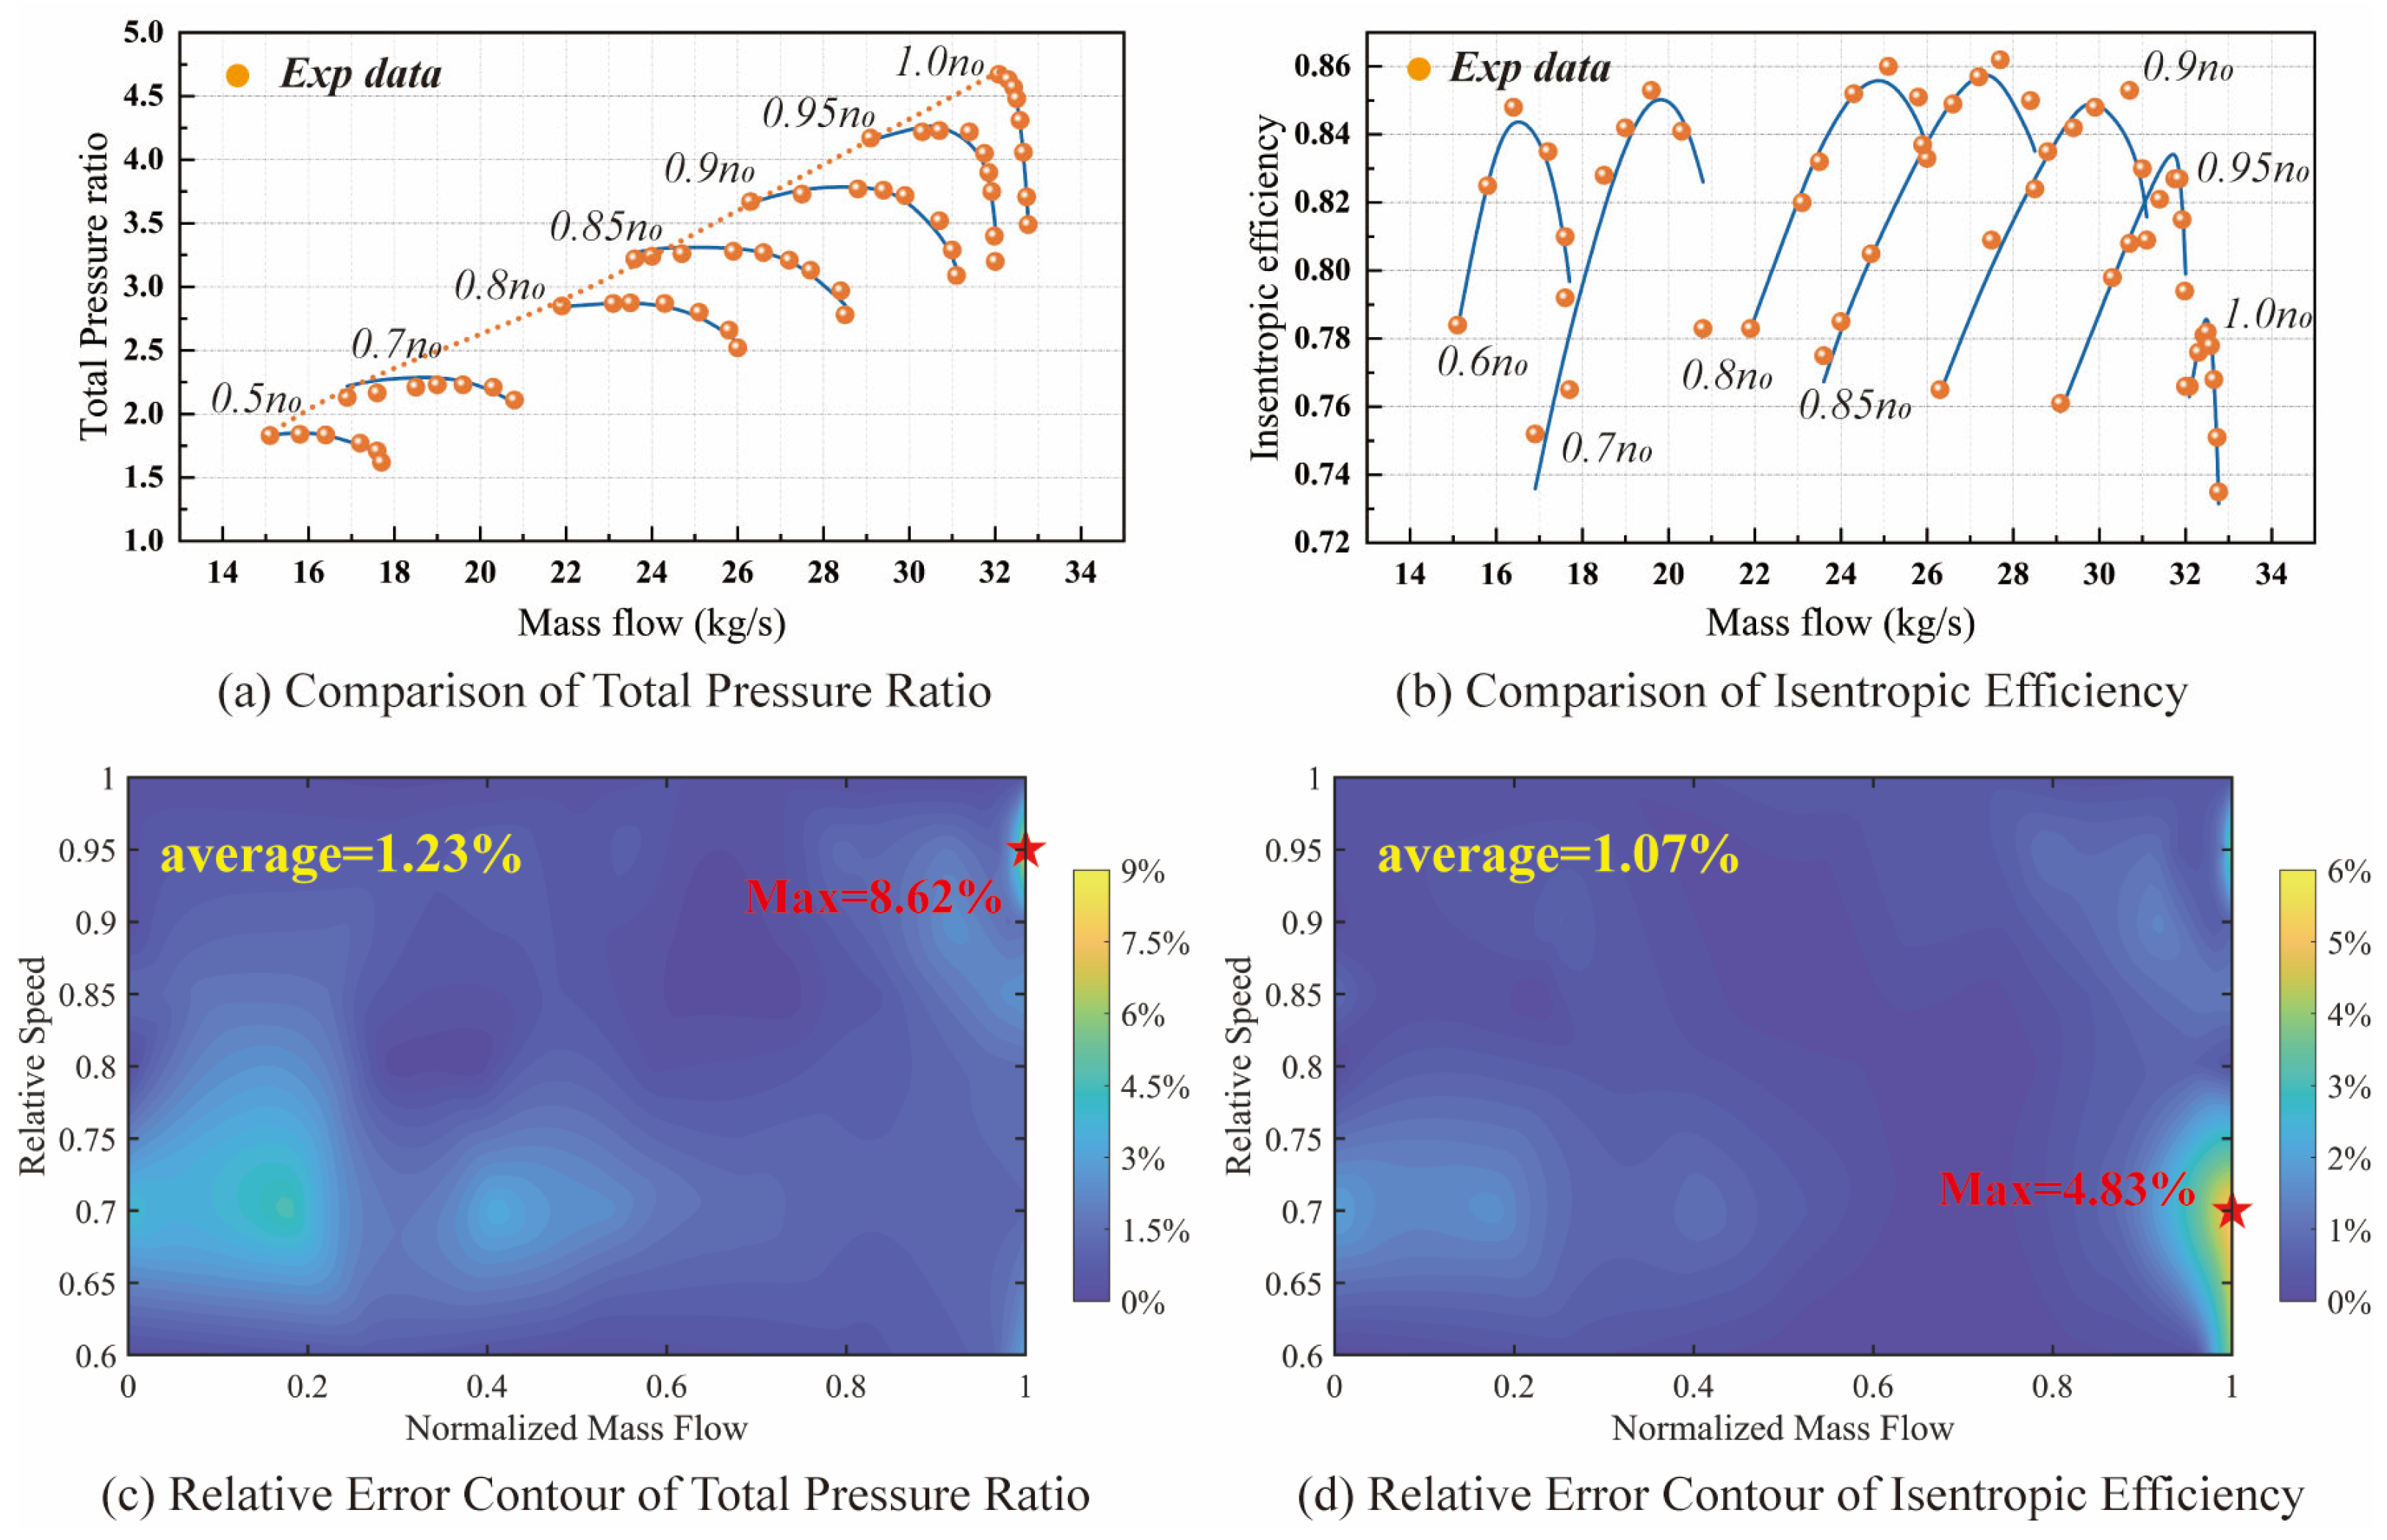
The trained GA-BP neural network was embedded into the baseline one-dimensional meanline program to predict the performance of the NASA two-stage compressor. Figure 8a,b show the total pressure ratio and isentropic efficiency characteristics obtained from the adaptive correction model. Compared with the baseline predictions in Figure 2, the adaptive model exhibits substantial improvement in accuracy across the entire operating range.
Figure 8.
Comparison of the NASA two-stage compressor’s performance between the adaptive correction model and experiments with discrepancy distribution: (a) comparison of total pressure ratio; (b) comparison of isentropic efficiency; (c) relative discrepancy contour of total pressure ratio; (d) relative discrepancy contour of isentropic efficiency.
Figure 8c,d present the corresponding discrepancy heat maps. The maximum relative discrepancies are reduced to below 3%, while the average discrepancies remain under 1.5%. Most prediction discrepancies are concentrated at high rotational speeds or large flow rates, reflecting the intrinsic limitations of one-dimensional modeling and the empirical correlations used in the baseline model.
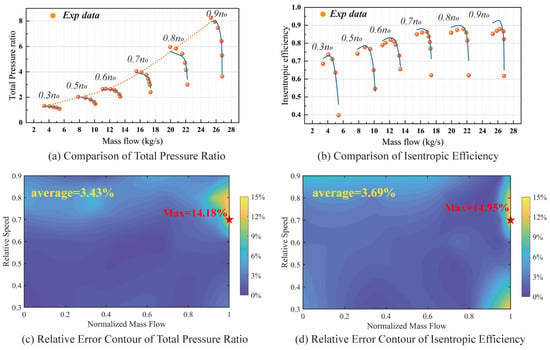
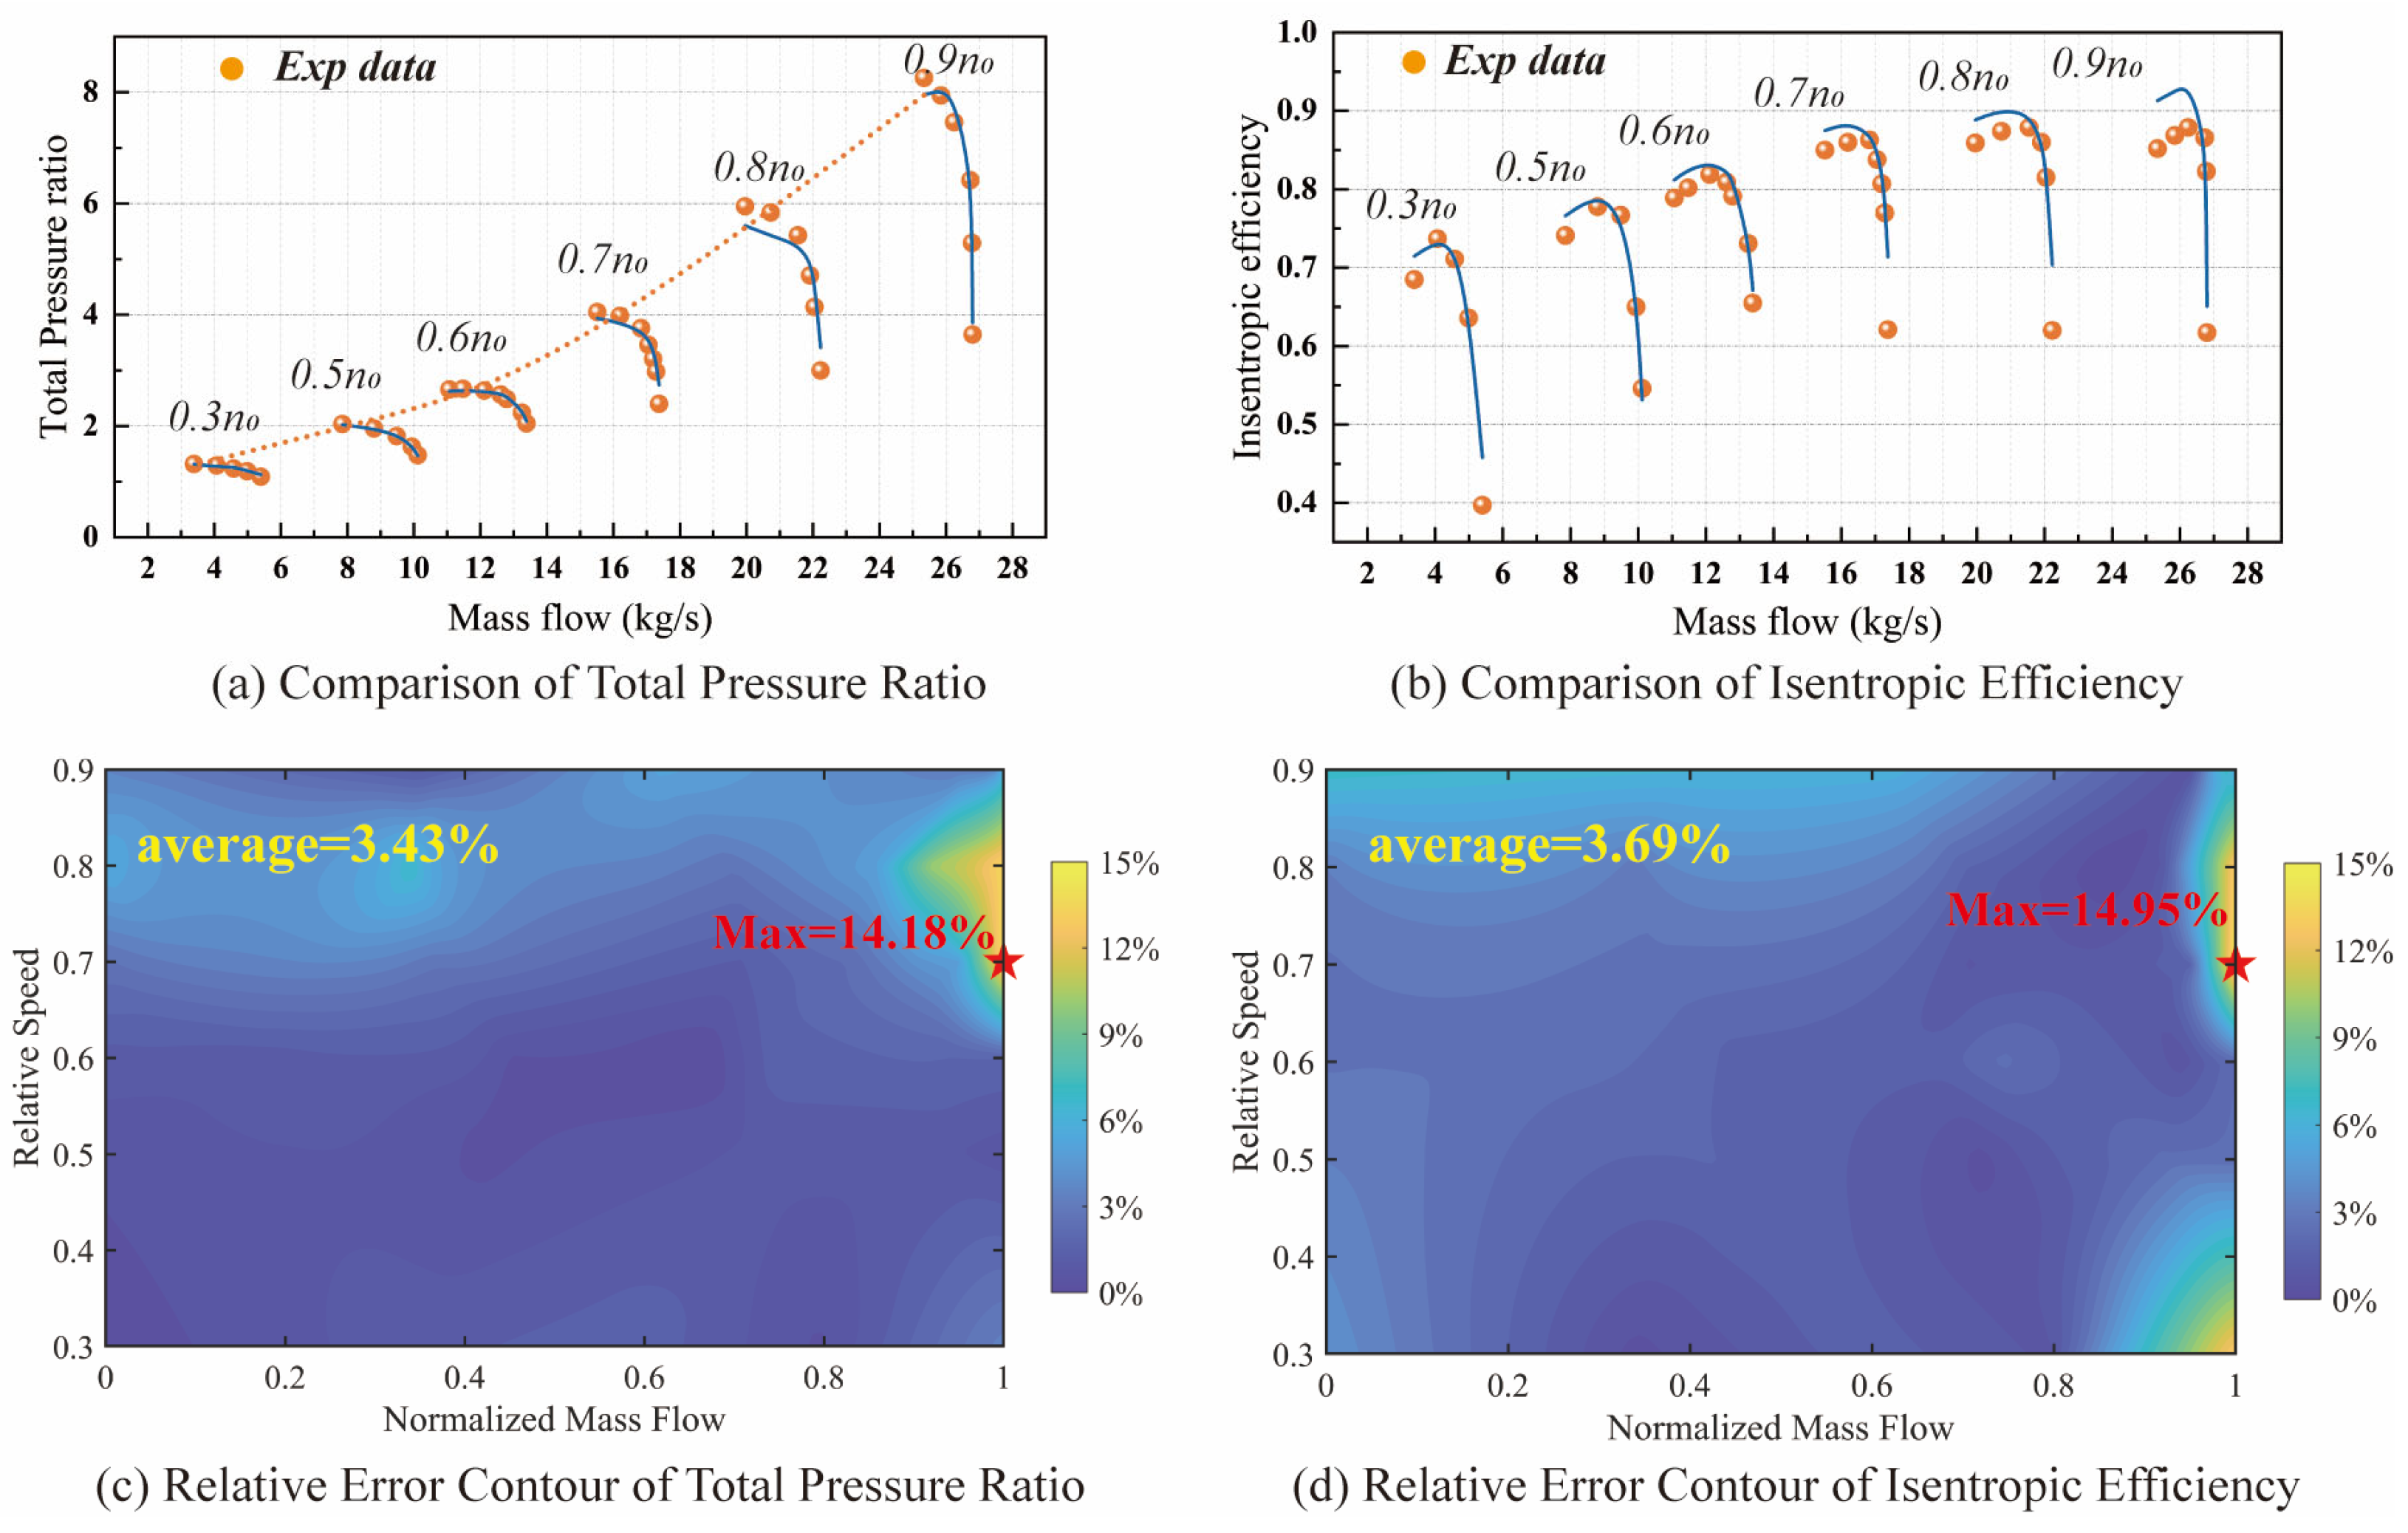
To further demonstrate the generality of the proposed approach, two additional publicly available compressors—the 74A compressor, with 3.5 stages [33], and NACA8, with 8 stages [34,35]—were selected for performance predictions using the same adaptive correction framework. The design parameters of the two compressors are listed in Table 2.
Table 2.
Design parameters of 74A and NACA8 compressors.
The calculated characteristic curves are shown in Figure 9 and Figure 10. The prediction discrepancies tend to increase with the number of compressor stages because the same gain factors are applied across all stages, whereas operating conditions vary between stages. The more stages a compressor has, the more pronounced this discrepancy becomes. Nevertheless, the larger discrepancies occur only at a small number of operating points, and the average relative discrepancies remain below 5%, as indicated by the discrepancy heatmaps.
Figure 9.
Comparison of the 74A compressor’s performance between the adaptive correction model and experiments with discrepancy distribution: (a) comparison of total pressure ratio; (b) comparison of isentropic efficiency; (c) relative discrepancy contour of total pressure ratio; (d) relative discrepancy contour of isentropic efficiency.
Figure 10.
Comparison of the NACA8 compressor’s performance between the adaptive correction model and experiments with discrepancy distribution: (a) comparison of total pressure ratio; (b) comparison of isentropic efficiency; (c) relative discrepancy contour of total pressure ratio; (d) relative discrepancy contour of isentropic efficiency.
4.2. Single-Stage Performance Prediction
In marine gas turbines, accurate stage-level performance prediction is important for the design of control strategies, such as determining bleed locations and stator vane settings. While simple interpolation or direct neural network training can provide reasonable predictions of overall compressor performance, the proposed method offers additional insights into stage-level characteristics.
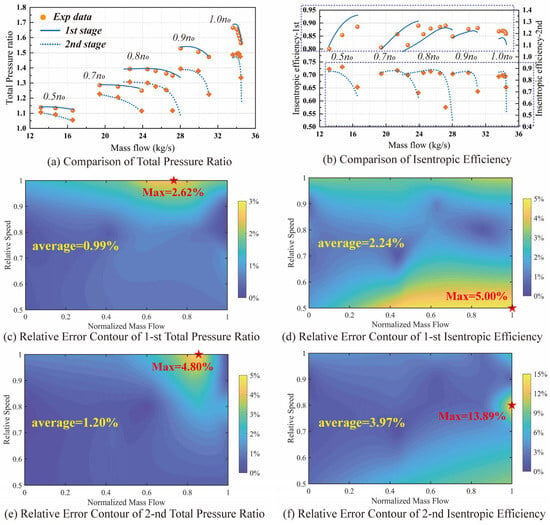
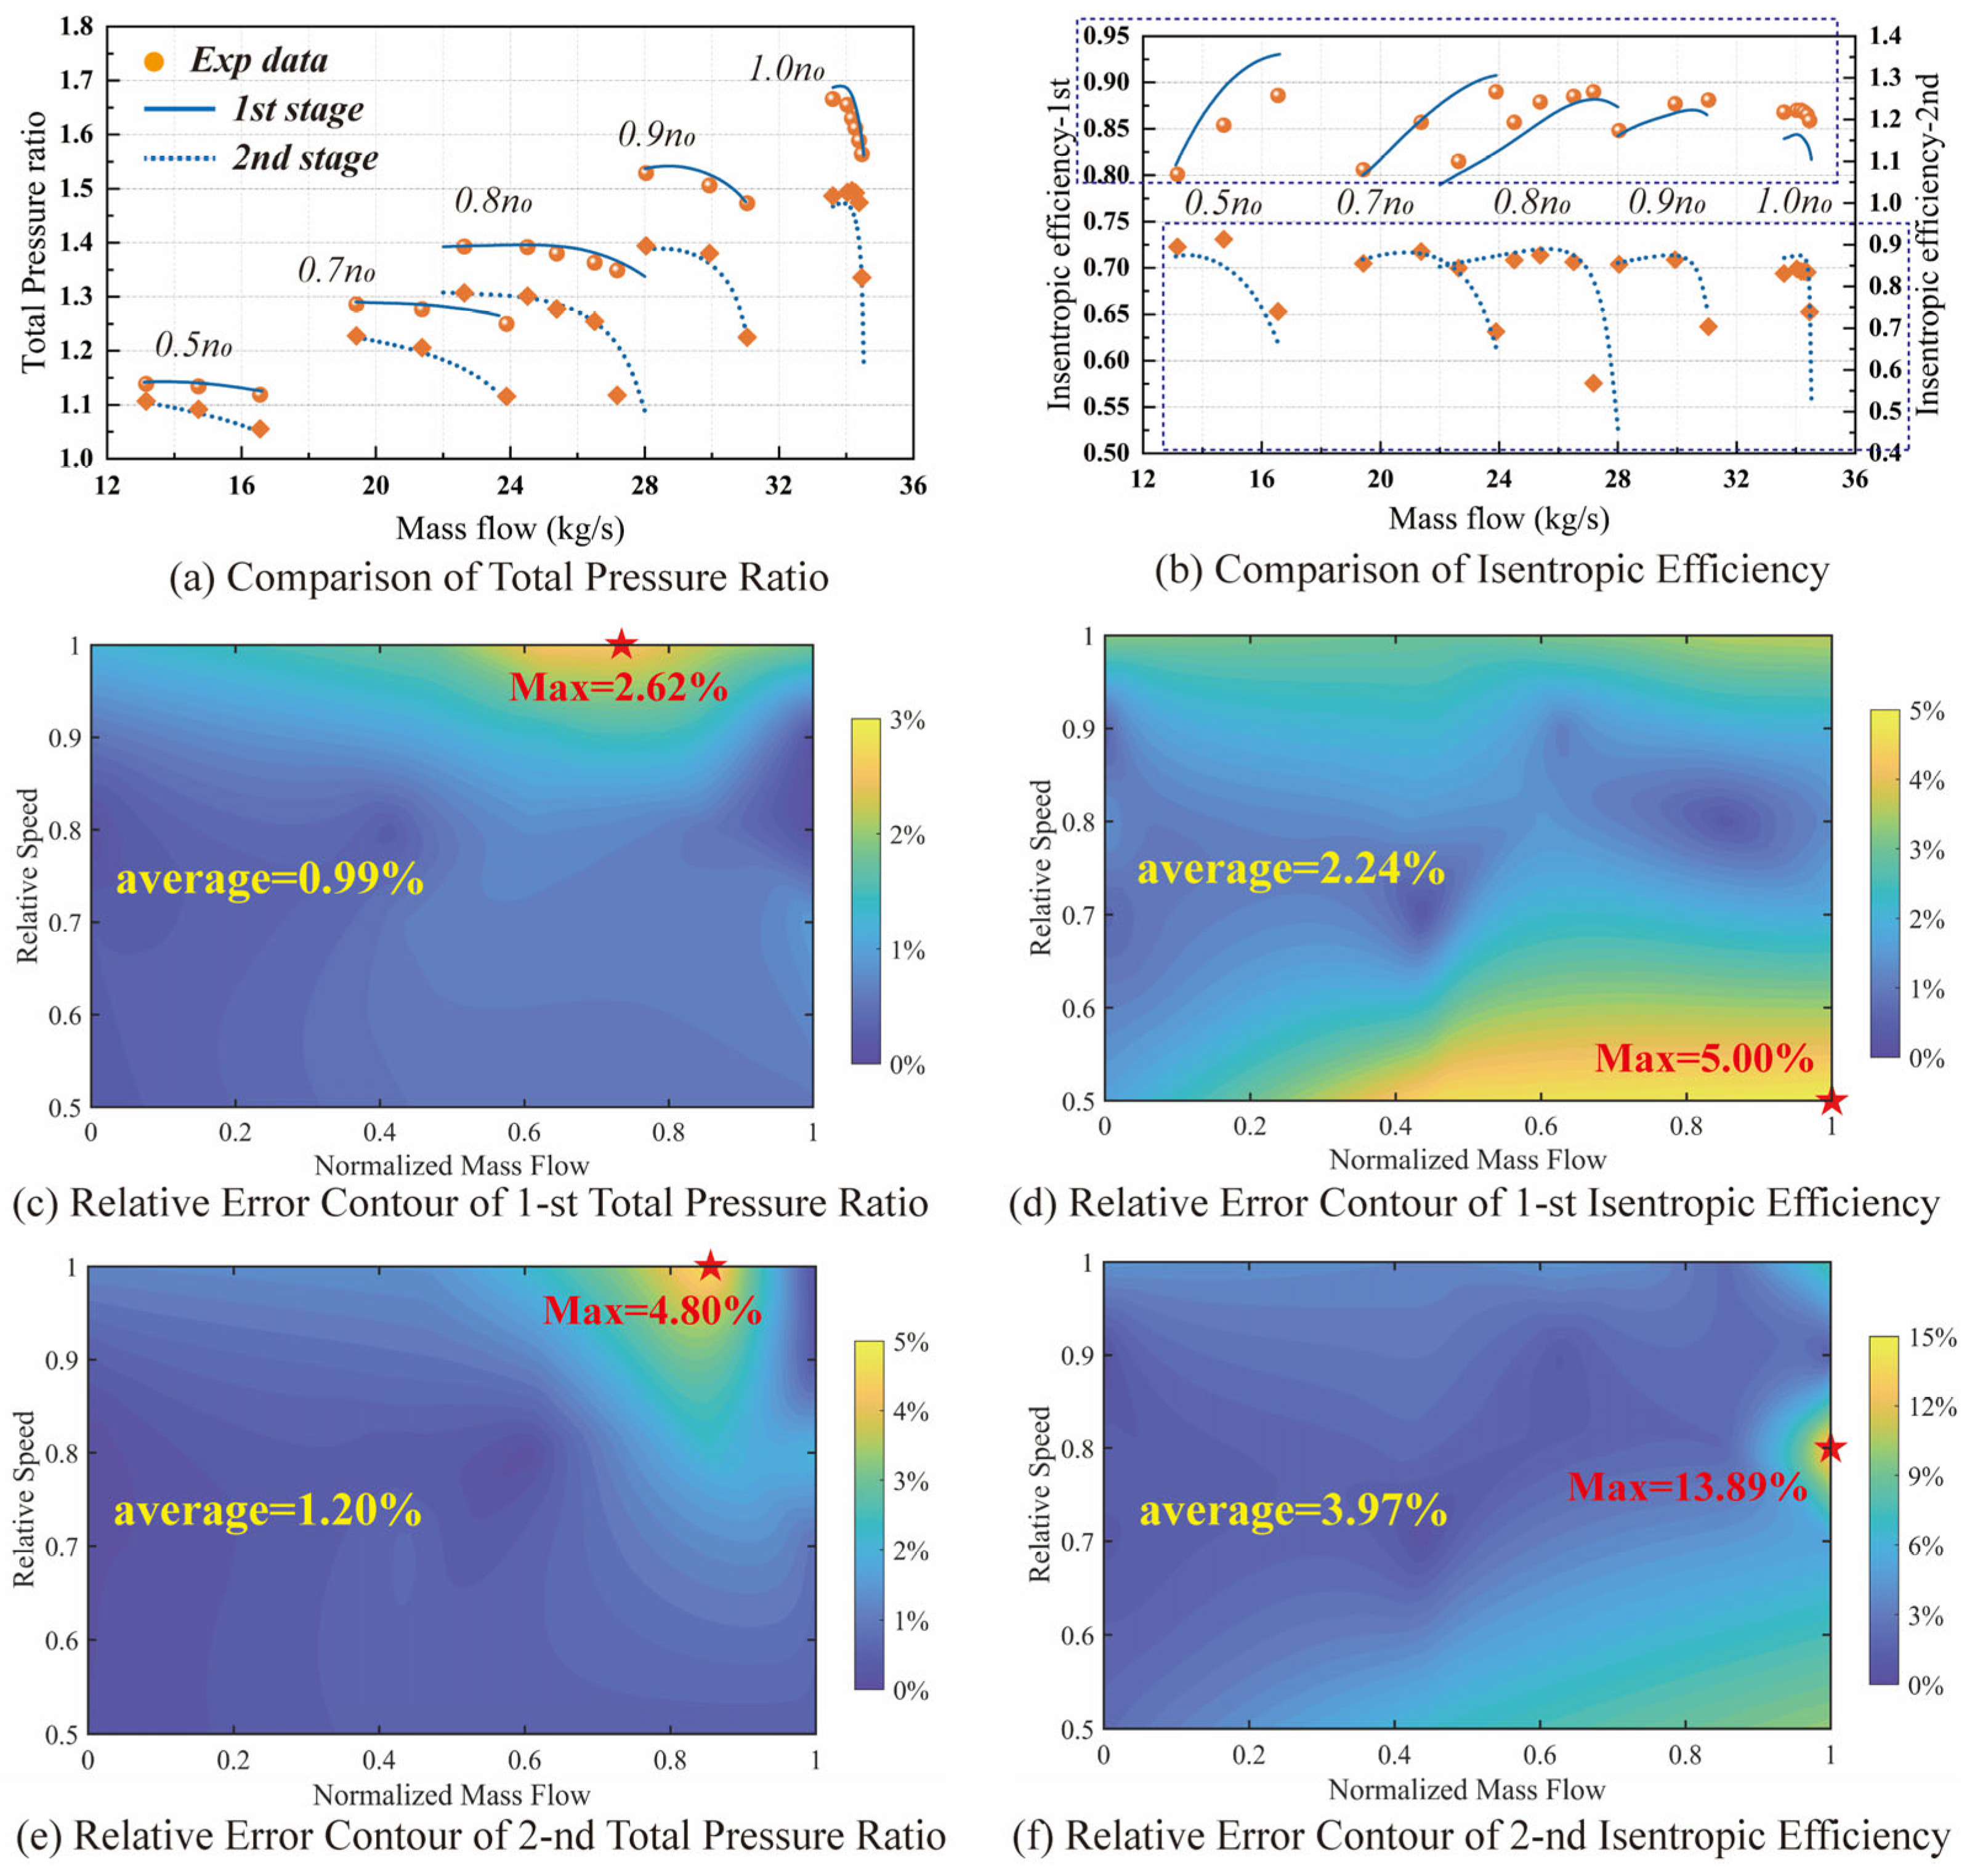
To illustrate this capability, the single-stage performance of the NASA two-stage compressor was extracted and compared with experimental measurements, as shown in Figure 11. The relative discrepancies at the single-stage level are slightly higher than those for the overall compressor, but the average relative discrepancies remain below 4%. This demonstrates that the proposed framework can capture stage-level performance details, which cannot be achieved by conventional interpolation or direct neural network approaches.
Figure 11.
Comparison of the NASA two-stage compressor’s single-stage performance between the adaptive correction model and experiments with discrepancy distribution: (a) comparison of single-stage total pressure ratio; (b) comparison of single-stage isentropic efficiency; (c) relative discrepancy contour of 1st total pressure ratio; (d) relative discrepancy contour of 1st isentropic efficiency; (e) relative discrepancy contour of 2nd total pressure ratio; (f) relative discrepancy contour of 2nd isentropic efficiency.
4.3. Performance Prediction Under Variable Stator Settings
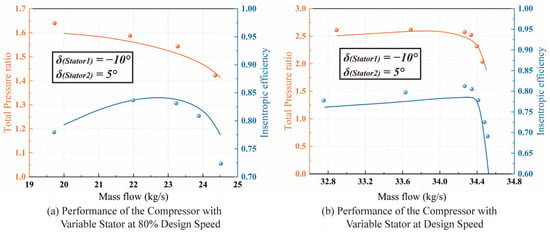
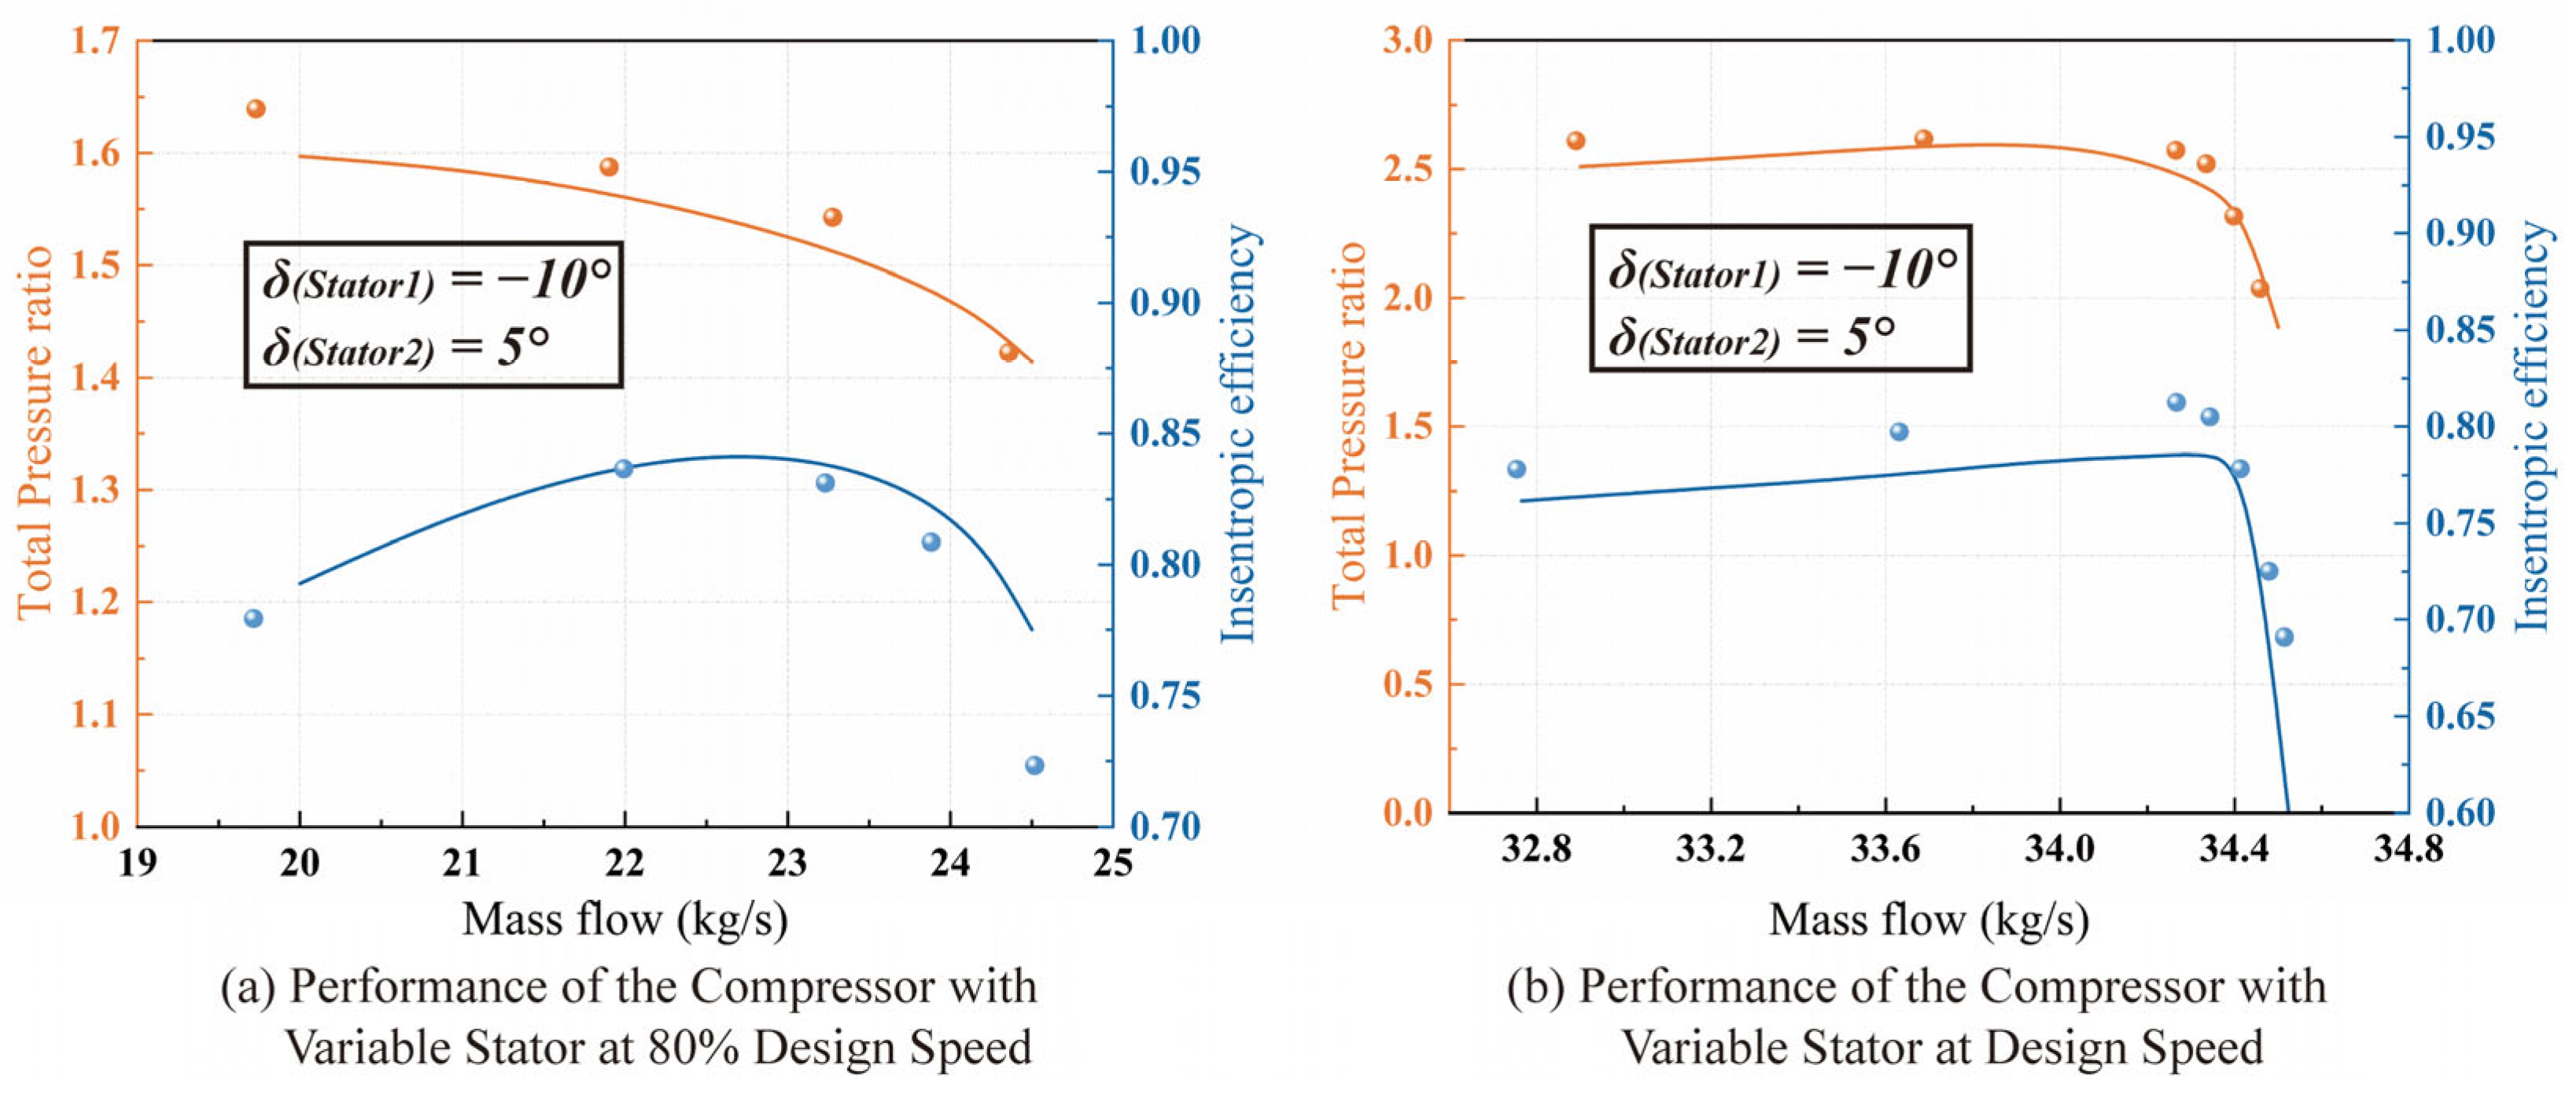
In addition, the proposed method can be applied to estimate compressor performance under variable stator conditions. For the NASA 2-stage compressor, calculations were performed with the first-stage stator set open at 10° and the second-stage stator closed at 5° at 80% and 100% of the design speed, as shown in Figure 12. The results show that the method can capture the impact of variable geometry on performance. Moreover, the average relative discrepancies compared with experimental data remain below 3%, demonstrating a high level of predictive accuracy under variable geometry conditions.
Figure 12.
Performance comparison of the NASA two-stage compressor under stator adjustment: (a) performance of the compressor with variable stator conditions at 80% design speed; (b) performance of the compressor with variable stator conditions at design speed.
5. Conclusions
This study proposes a hybrid modeling framework to improve the predictive accuracy of compressor meanline analysis under varying operating conditions. The approach combines a physics-based meanline model with optimization and machine learning techniques to achieve adaptive correction of deviation angle and loss. The proposed method was validated using three compressors with different configurations, including the NASA two-stage, 74A, and NACA 8 compressors. The main conclusions are summarized as follows:
(1) The baseline meanline model is capable of reproducing the general trends of compressor performance; however, significant quantitative deviations remain under certain operating conditions. The maximum relative discrepancies of pressure ratio and efficiency can exceed 40% and 25%, respectively, indicating the limitations of classical empirical correlations for deviation angle and total pressure loss.
(2) Two gain factors are introduced to correct the deviation angle and total pressure loss models. Particle swarm optimization determines the models’ optimal values at each operating point, allowing the predicted performance to match the experimental data with high accuracy. The optimized gains show clear trends with flow coefficient and rotational speed, indicating systematic model deficiencies. A GA-BP neural network is then used to learn this relationship and predict the gain factors for arbitrary operating conditions. The hybrid framework improves prediction accuracy, reducing the maximum relative discrepancies of the NASA two-stage compressor to below 1%.
(3) To demonstrate the general applicability of the proposed method, performance predictions were also carried out for the 74A and NACA 8-stage compressors, with relative discrepancies within 3%. Considering the strategies of bleed and variable stator control commonly used in marine gas turbine design, the compressor performance under stage-level and variable geometry conditions was further compared. For the NASA two-stage compressor, the average relative discrepancy compared with the experimental data is below 4%. Certainly, there are limitations in the proposed method. The gain factor is assumed to be identical across each stage under one operating condition, which is somewhat debatable. Therefore, future research will attempt to introduce the correlation between the gain factor and different stages to further improve the calculation accuracy.
Overall, the proposed hybrid modeling framework combines the physical interpretability of meanline analysis with the adaptability of data-driven methods. The approach provides an effective and computationally efficient tool for compressor performance prediction and off-design analysis.
Author Contributions
Conceptualization, methodology construction, simulation calculation, and writing—original draft preparation, W.S.; model improvement, manuscript structure optimization, and content revision, W.W.; program debugging, Q.Z.; figure processing, visualization, and language proofreading, X.N. All authors have read and agreed to the published version of the manuscript.
Funding
This research received no external funding.
Data Availability Statement
The data supporting the findings of this study are available from the corresponding author upon reasonable request.
Conflicts of Interest
The authors declare no conflicts of interest.
References
- Alone, D.; Kumar, S.S.; Thimmaiah, S.M.; Mudipalli, J.R.R.; Pradeep, A.M.; Ramamurthy, S.; Iyengar, V.S. Stability management of high speed axial flow compressor stage through axial extensions of bend skewed casing treatment. Propuls. Power Res. 2016, 5, 236–249. [Google Scholar] [CrossRef] [Scilit]
- Conan, F.; Savarese, S. Bleed airflow CFD modeling in aerodynamics simulations of jet engine compressors. In Turbo Expo: Power for Land, Sea, and Air; American Society of Mechanical Engineers: New York, NY, USA, 2001; Volume 78507, p. V001T03A085. [Google Scholar]
- Gummer, V.; Goller, M.; Swoboda, M. Numerical investigation of endwall boundary layer removal on highly-loaded axial compressor blade rows. In Turbo Expo: Power for Land, Sea, and Air; American Society of Mechanical Engineers: New York, NY, USA, 2005; Volume 47306, pp. 281–290. [Google Scholar]
- Wu, C.H. A general theory of three-dimensional flow in subsonic and supersonic turbomachines of axial, radial, and mixed-flow types. J. Fluids Eng. 1952, 74, 1363–1380. [Google Scholar] [CrossRef] [Scilit]
- Horlock, J.H.; Denton, J.D. A review of some early design practice using computational fluid dynamics and a current perspective. J. Turbomach. 2005, 127, 5–13. [Google Scholar] [CrossRef] [Scilit]
- Kolias, I.; Alexiou, A.; Aretakis, N.; Mathioudakis, K. Direct integration of axial turbomachinery preliminary aerodynamic design calculations in engine performance component models. In Turbo Expo: Power for Land, Sea, and Air; American Society of Mechanical Engineers: New York, NY, USA, 2018; Volume 50985, p. V001T01A030. [Google Scholar]
- Carcasci, C.; Piola, S.; Canepa, R.; Silingardi, A. Gas turbine integrated conceptual design approach. In Turbo Expo: Power for Land, Sea, and Air; American Society of Mechanical Engineers: New York, NY, USA, 2015; Volume 56673, p. V003T08A007. [Google Scholar]
- Bolemant, M.; Peitsch, D. An Alternative Compressor Modeling Method Within Gas Turbine Performance Simulations; Deutsche Gesellschaft für Luft-und Raumfahrt-Lilienthal-Oberth eV: Bonn, Germany, 2014; p. 340047. [Google Scholar]
- Tournier, J.M.; El-Genk, M.S. Axial flow, multi-stage turbine and compressor models. Energy Convers. Manag. 2010, 51, 16–29. [Google Scholar] [CrossRef] [Scilit]
- Howell, A.R.; Calvert, W.J. A new stage stacking technique for axial-flow compressor performance prediction. J. Eng. Gas Turbines Power 1978, 100, 698–703. [Google Scholar] [CrossRef] [Scilit]
- Howell, A.R.; Bonham, R.P. Overall and stage characteristics of axial-flow compressors. Proc. Inst. Mech. Eng. 1950, 163, 235–248. [Google Scholar] [CrossRef] [Scilit]
- Bullock, R.O. (Ed.) Aerodynamic Design of Axial Flow Compressors; National Aeronautics and Space Administration: Washington, DC, USA, 1965; Volume 36. [Google Scholar]
- Hearsey, R.M. Program HT0300 NASA 1994 Version; Paper No. D6-81569TN; The Boeing Company: Arlington, VA, USA, 1994. [Google Scholar]
- Koch, C.C.; Smith, L.H., Jr. Loss sources and magnitudes in axial-flow compressors. J. Eng. Gas Turbines Power 1976, 98, 411–424. [Google Scholar] [CrossRef] [Scilit]
- Miller, G.R.; Lewis, G.W., Jr.; Hartmann, M.J. Shock Losses in Transonic Compressor Blade Rows. In ASME Winter Annual Meeting; No. ASME Paper No. 60-WA-77; ASME: New York, NY, USA, 1960. [Google Scholar]
- Bloch, G.S.; Copenhaver, W.W.; O’Brien, W.F. A shock loss model for supersonic compressor cascades. J. Turbomach. 1999, 121, 28–35. [Google Scholar] [CrossRef] [Scilit]
- Boyer, K.M.; O’Brien, W.F. An improved streamline curvature approach for off-design analysis of transonic axial compression systems. J. Turbomach. 2003, 125, 475–481. [Google Scholar] [CrossRef] [Scilit]
- Aungier, R.; Farokhi, S. Axial-flow compressors: A strategy for aerodynamic design and analysis. Appl. Mech. Rev. 2004, 57, B22. [Google Scholar] [CrossRef] [Scilit]
- Léonard, O.; Adam, O. A quasi-one-dimensional CFD model for multistage turbomachines. J. Therm. Sci. 2008, 17, 7–20. [Google Scholar] [CrossRef] [Scilit]
- Zhang, X.; Ju, Y.; Zhang, C. Accuracy and Sensitivity Analysis of Aerodynamic Performance Prediction Models for Transonic Axial-Flow Compressors. In Turbo Expo: Power for Land, Sea, and Air; American Society of Mechanical Engineers: New York, NY, USA, 2020; Volume 84065, p. V02AT32A044. [Google Scholar]
- Schnoes, M.; Nicke, E. Automated calibration of compressor loss and deviation correlations. In Turbo Expo: Power for Land, Sea, and Air; American Society of Mechanical Engineers: New York, NY, USA, 2015; Volume 56635, p. V02AT37A020. [Google Scholar]
- Kim, S.; Kim, K.; Son, C. Equivalent model for an axial compressor used for aero engines based on 1D and 3D analytical models and performance data. Aerosp. Sci. Technol. 2022, 121, 107369. [Google Scholar] [CrossRef] [Scilit]
- Yu, X.; Hao, D.; Wang, R.; Huang, D.; Miao, S.; Liu, B. An improved meanline method for enhancing the prediction accuracy of compressor performance: Some novel perspectives in models and methodology. Phys. Fluids 2025, 37, 096144. [Google Scholar] [CrossRef] [Scilit]
- Liu, C.; Li, W.; Yue, W.; Liu, J.; Yang, J.; Huang, X. Real gas-based mean-line analysis method for axial compressor performance prediction. Phys. Fluids 2025, 37, 116120. [Google Scholar] [CrossRef] [Scilit]
- Sadagopan, A. A design strategy for a 6:1 supersonic mixed-flow compressor stage and its viscous flow-based performance analysis. Aerosp. Sci. Technol. 2019, 87, 265–277. [Google Scholar] [CrossRef] [Scilit]
- Kolias, I.; Alexiou, A.; Aretakis, N.; Mathioudakis, K. Axial compressor mean-line analysis: Choking modelling and fully-coupled integration in engine performance simulations. Int. J. Turbomach. Propuls. Power 2021, 6, 4. [Google Scholar] [CrossRef] [Scilit]
- Wright, P.I.; Miller, D.C. An Improved Compressor Performance Prediction Model; Rolls Royce Company: London, UK, 1992. [Google Scholar]
- Carter, A.D. The Low Speed Performance of Related Aerofoils in Cascade; The Stationery Office: London, UK, 1950. [Google Scholar]
- Peyvan, A.; Benisi, A.H. Axial-flow compressor performance prediction in design and off-design conditions through 1-d and 3-d modeling and experimental study. J. Appl. Fluid Mech. 2016, 9, 2149–2160. [Google Scholar] [CrossRef] [Scilit]
- Carmody, R.H.; Creveling, H.F. Axial Flow Compressor Computer Program for Calculating off Design Performance/Program 4; No. NASA-CR-72427; NASA: Washington, DC, USA, 1968. [Google Scholar]
- Koch, C.C. Stalling pressure rise capability of axial flow compressor stages. J. Eng. Gas Turbines Power 1981, 103, 645–656. [Google Scholar] [CrossRef] [Scilit]
- Urasek, D.C.; Gorrell, W.T.; Cunnan, W.S. Performance of Two-Stage Fan Having Low-Aspect-Ratio First-Stage Rotor Blading; No. E-9237; NASA: Washington, DC, USA, 1979. [Google Scholar]
- Steinke, R.J. Design of 9.271-Pressure-Ratio 5-Stage Core Compressor and Overall Performance for First 3 Stages; No. NAS 1.60: 2597; NASA: Washington, DC, USA, 1986. [Google Scholar]
- Voit, C.H. Investigation of a High-Pressure-Ratio Eight-Stage Axial-Flow Research Compressor with Two Transonic Inlet Stages I: Aerodynamic Design; No. NACA-RM-E53I24; NASA: Washington, DC, USA, 1953. [Google Scholar]
- Thomas, K.D. Blade Row and Blockage Modelling in an Axial Compressor Throughflow Code. Doctoral Dissertation, University of Stellenbosch, Stellenbosch, South Africa, 2005. [Google Scholar]

Disclaimer/Publisher’s Note: The statements, opinions and data contained in all publications are solely those of the individual author(s) and contributor(s) and not of MDPI and/or the editor(s). MDPI and/or the editor(s) disclaim responsibility for any injury to people or property resulting from any ideas, methods, instructions or products referred to in the content. |
© 2026 by the authors. Licensee MDPI, Basel, Switzerland. This article is an open access article distributed under the terms and conditions of the Creative Commons Attribution (CC BY) license.