


Abstract
Borehole instability in weathered granitic seabeds complicates the installation of rock-socketed offshore monopiles. Previous studies have examined construction-related instability and granite disintegration; however, the mechanisms governing borehole instability and its evolution following excavation in weathered granitic seabeds remain incompletely understood. This study combines laboratory testing, constitutive modelling, and coupled finite element analysis to investigate unloading-induced borehole instability. A unified elastoplastic model incorporating soil structure and overconsolidation was calibrated separately for completely and highly decomposed granite (CDG and HDG) using oedometer and drained triaxial tests. The calibrated parameters indicated slower structural degradation and faster loss of overconsolidation in CDG than in HDG. The model captured the principal drained unloading response trends of HDG, including pronounced axial strain accumulation as effective confinement approached zero. The coupled analysis predicted a maximum inward wall displacement of 12.43 mm seven days after unloading, concentrated within the unsupported HDG. Increasing the unsupported length from 4.17 to 8.37 m increased the predicted maximum displacement from 10.30 to 13.72 mm. These findings connect the measured sensitivity to confinement loss with borehole deformation and support limiting unsupported length during monopile installation.
1. Introduction
Large-diameter monopiles are widely used in offshore wind developments, where installation conditions are strongly controlled by seabed geology [1,2]. Along the southeastern coast of China, granitic formations with varying degrees of weathering present particular challenges for rock-socketed monopile construction [2,3]. Where stronger strata impede pile driving, a drive–drill–drive sequence can be adopted to facilitate penetration. Reliable geotechnical design requires consideration of deformation, bearing capacity, and failure mechanisms under the relevant loading conditions [4,5,6]. However, drilling below the pile toe creates an unsupported borehole section during the interval before driving resumes. Equipment changeover and offshore operating conditions may prolong this exposure, allowing wall deterioration and collapse to obstruct subsequent installation [3]. Maintaining borehole stability during this construction stage is therefore essential to installation safety and efficiency.
The engineering behavior of decomposed granite reflects changes in mineral composition, particle characteristics, interparticle bonding, and inherited fabric during weathering [7,8]. Recent investigations have linked mineral alteration and microdefect development to changes in stiffness and mechanical response [9,10], while grain-scale experiments have demonstrated the influence of weathering and environmental conditions on contact behavior [11]. Comparisons of intact and reconstituted specimens reveal the importance of inherited fabric [12], and multistage loading–unloading tests demonstrate the influence of stress history on deformation and strength mobilization [13]. Monotonic and cyclic simple-shear studies further show the need to examine responses beyond conventional triaxial loading [14]. Field investigations also emphasize the effects of sampling disturbance on measured shear strength [15]. Together, these findings support characterizing weathering grades separately and considering both material structure and loading path when interpreting their mechanical responses.
Water-related deterioration introduces additional complexity. Drying–wetting cycles can alter pore structure and reduce shear resistance [16], while immersion-induced disintegration varies with weathering degree [17] and can involve pore-air escape and dissolution of cementing substances [18]. Investigations of tunnel collapse in weathered granite have demonstrated interactions among excavation disturbance, fractures, groundwater, and support conditions [19]. However, confinement reduction introduces a mechanical disturbance that cannot be inferred from wetting tests alone. Experiments on granite residual soil show that initial lateral unloading influences subsequent cyclic deformation [20]. Borehole studies in clay, sand, and poorly cemented granular formations likewise demonstrate the importance of initial stress, overconsolidation, dilation, and interparticle bonding [21,22,23]. These studies provide relevant evidence for excavation sensitivity, although their stress paths, saturation states, and support conditions differ from those of offshore boreholes.
In saturated seabed materials, excavation-induced pore-pressure changes and subsequent redistribution modify the effective stresses carried by the soil skeleton [24]. This response differs from deterioration associated with drying, suction changes, or entrapped air in partially saturated terrestrial soils. Previous offshore construction observations and numerical investigations have identified the influence of granite disintegration, unsupported geometry, and construction delays [5,6]. Nevertheless, the connection between laboratory-observed unloading behavior and the spatial and temporal evolution of deformation around offshore boreholes remains insufficiently understood. In particular, further evidence is needed to determine how confinement loss affects the surrounding weathered material and whether slowing wall deformation is accompanied by stabilization of the local stress state.
This study investigates how confinement loss affects the mechanical response of offshore decomposed granite and the deformation of unsupported borehole walls. Laboratory tests characterize the compression and shear responses of CDG and HDG and provide separate constitutive calibrations, followed by an assessment of HDG under confining-pressure unloading. Coupled finite element analyses then examine the development and spatial distribution of wall displacement and shear strain, together with the influence of unsupported length. This study thereby links material-scale unloading behavior to deformation mechanisms relevant to offshore monopile installation.
2. Materials and Methods
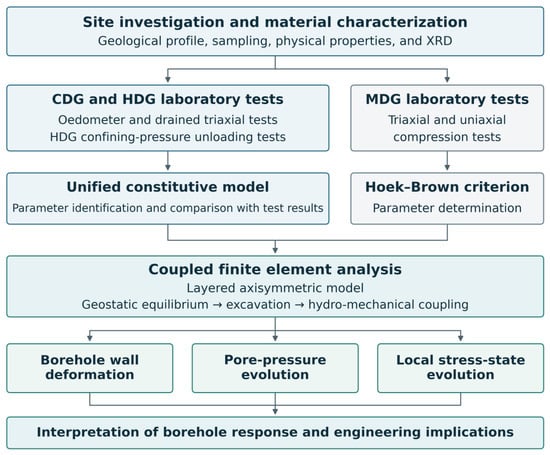
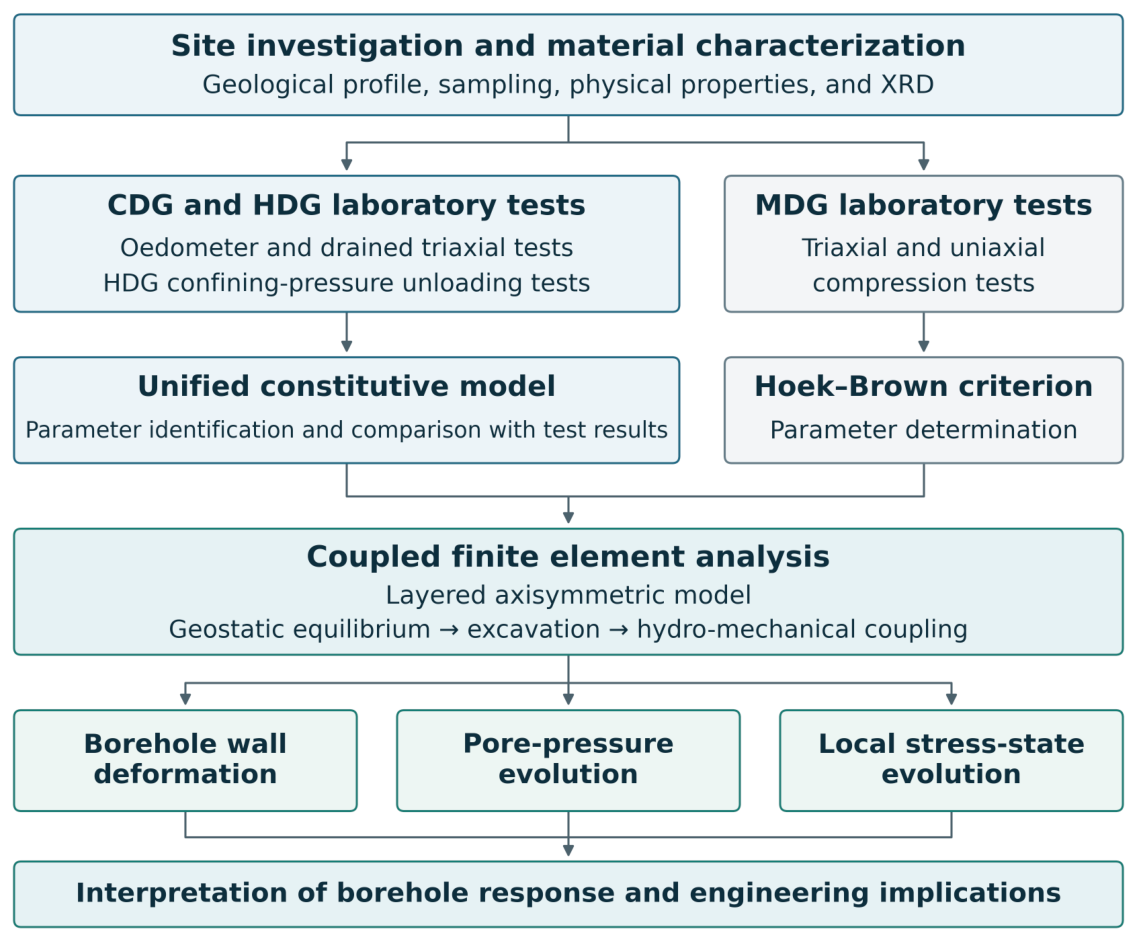
The overall research workflow is illustrated in Figure 1. Site investigation and material characterization provide the basis for laboratory testing, constitutive parameter identification, and comparison between experimental and simulated responses. The constitutive descriptions are subsequently incorporated into a coupled finite element analysis to investigate borehole wall deformation, pore-pressure evolution, and changes in the surrounding stress state. These results inform the interpretation of borehole response and its engineering implications. This section introduces the project site, geological materials, and laboratory testing program.
Figure 1.
Research workflow integrating laboratory testing, constitutive modelling, and coupled numerical analysis.
2.1. Project Site and Geological Materials
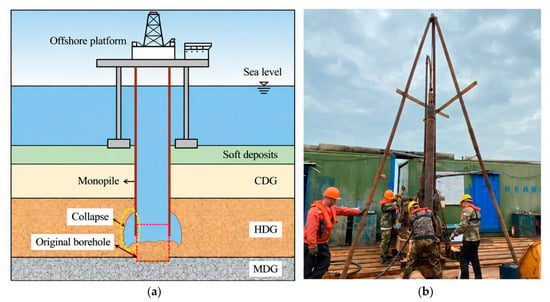
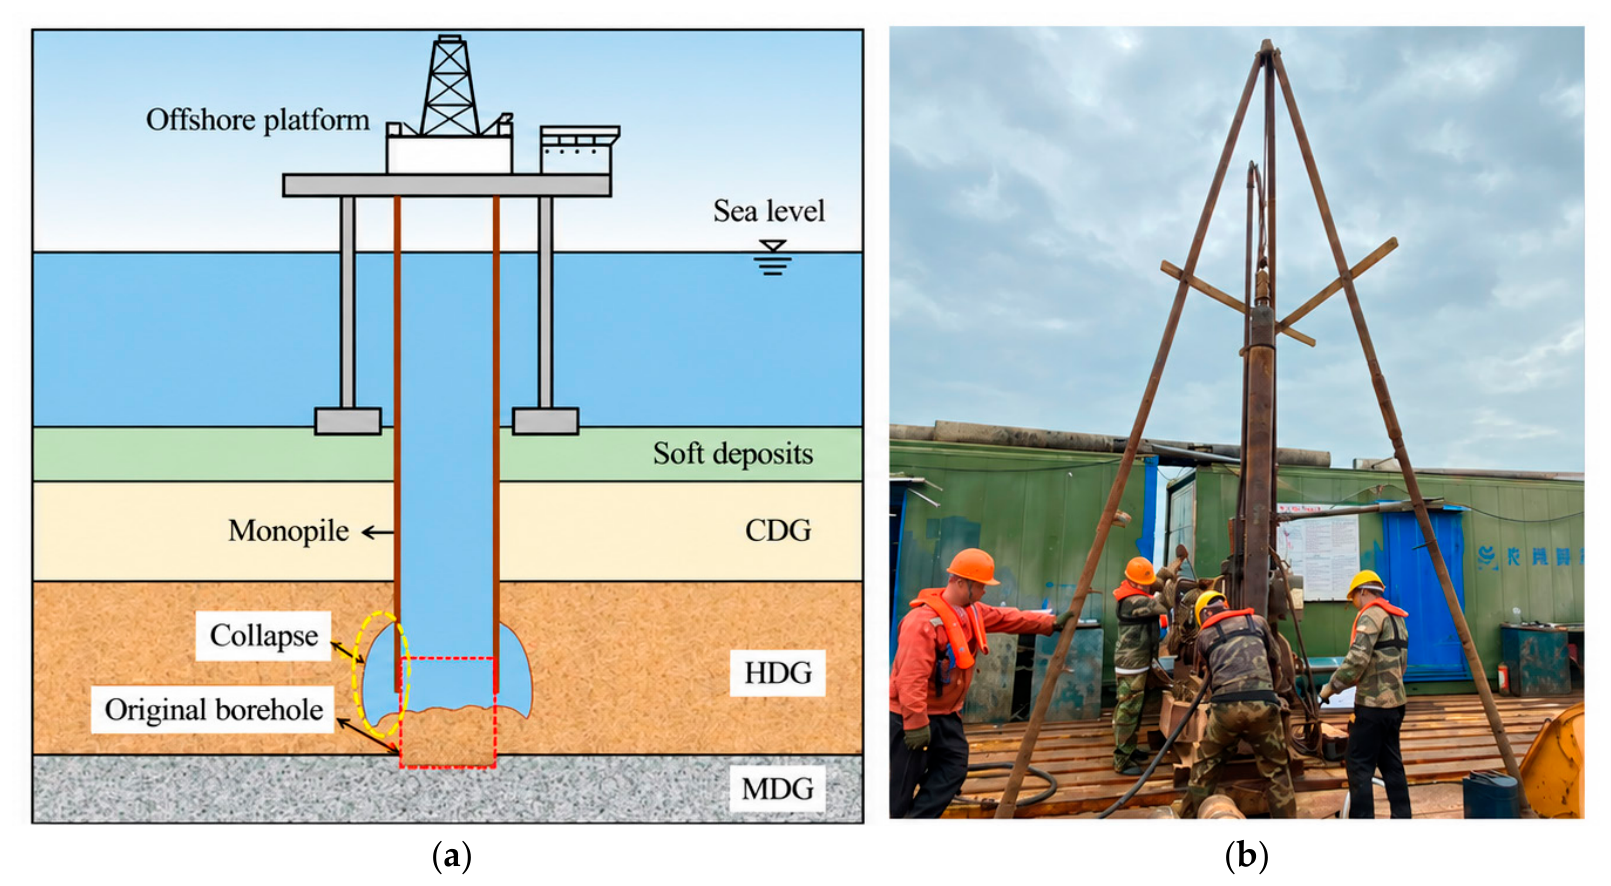
This study is based on the Pinghai Bay offshore wind farm in Fujian Province, southeastern China, where rock-socketed monopiles were installed in a weathered granitic seabed at water depths of approximately 10–20 m. Figure 2a illustrates a representative stratigraphic profile and the borehole configuration during installation. The seabed deposits overlie completely decomposed granite (CDG), highly decomposed granite (HDG), and moderately decomposed granite (MDG), forming a transition from soil-like weathered material to fractured rock.
Figure 2.
Project site and field sampling: (a) schematic stratigraphic profile and monopile borehole; (b) field sampling on the offshore platform.
Monopile installation followed a drive–drill–drive sequence, in which initial pile driving was followed by drilling below the pile toe and subsequent resumption of driving. For the configuration considered here, drilling exposed an uncased borehole section predominantly within HDG, close to the underlying MDG. The resulting reduction in lateral confinement provides the engineering context for investigating the unloading response of the weathered materials and its implications for borehole-wall deformation.
Samples were recovered from boreholes drilled from an offshore working platform (Figure 2b). A double-tube rotary sampler, comprising a rotating outer tube and a stationary inner tube, was used with a biopolymer drilling fluid to limit sampling disturbance and fluid scouring. The recovered samples were wax-sealed and transported to the laboratory in protective boxes. The construction operation involved seawater reverse-circulation drilling, as documented by Sun et al. [2]. This should be distinguished from the biopolymer fluid used during sample recovery, which was intended to limit sampling disturbance. In one representative case, drilling extended 6.25 m below the pile toe, exposing predominantly HDG. Collapse occurred during the subsequent 12-day interval before the arrival of the pile-driving equipment, producing approximately 5 m of accumulated material at the borehole bottom. This case demonstrates the practical significance of maintaining borehole stability during the interval between drilling and subsequent pile driving.
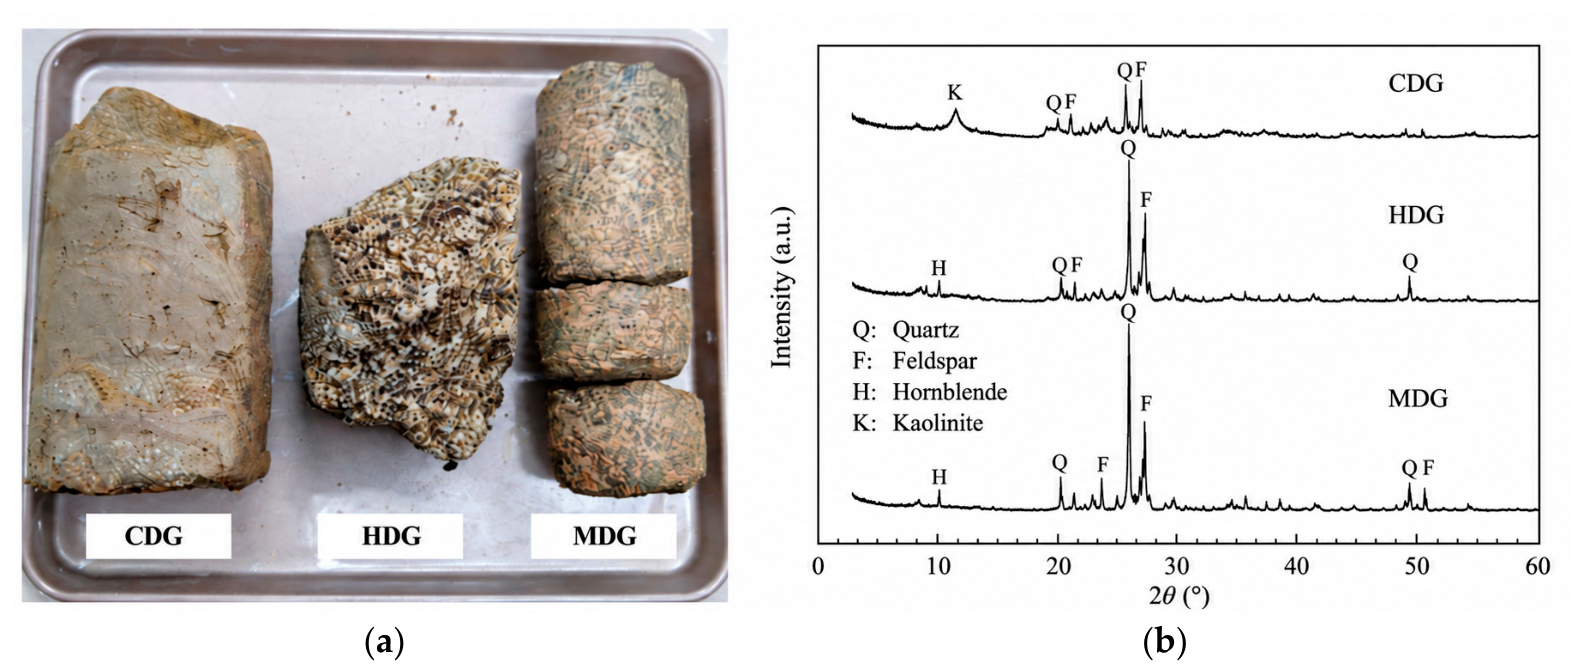
Figure 3a shows representative specimens of the three weathering grades. CDG exhibits a soil-like appearance, with the original rock fabric largely decomposed. HDG retains a recognizable granitic texture but is friable and readily disaggregates into granular material. MDG preserves a more coherent rock fabric and is recovered as fractured core segments. These contrasting appearances provide a basis for distinguishing the materials in the subsequent mechanical characterization and numerical analysis. The basic physical properties of CDG and HDG are summarized in Table 1.
Figure 3.
Representative granite specimens and X-ray diffraction (XRD) patterns: (a) specimens of CDG, HDG, and MDG; (b) corresponding XRD patterns.
Table 1.
Basic physical properties of CDG and HDG.
Mineralogical composition was examined by powder X-ray diffraction (XRD) at Shanghai Jiao Tong University. Representative samples were air-dried, ground, and passed through a 75 μm sieve (200 mesh). The powders were placed in a glass specimen holder and levelled to form a flat surface. Diffraction patterns were collected over a 2θ range of 3–90°, and mineral phases were identified using Jade software by comparison with reference patterns in the Powder Diffraction File database.
The XRD patterns (Figure 3b) and estimated mineral proportions indicate that quartz is the dominant crystalline constituent of all three samples. Its estimated content decreases from 60–70% in MDG to 50–60% in HDG and 40–50% in CDG. MDG also contains biotite (approximately 20%) and other mica-group minerals. HDG contains approximately 30% labradorite and 10% kaolinite, whereas CDG contains mica-group minerals at an estimated proportion of 20–30%, together with kaolinite, which is reported at less than 30%. The presence of kaolinite in CDG and HDG is consistent with the formation of secondary clay minerals through weathering of primary aluminosilicates. These mineralogical observations complement the contrasting specimen appearances in Figure 3a. Mineral composition is considered alongside differences in fabric and initial state when interpreting the compression, shearing, and unloading responses presented in Section 3.
2.2. Laboratory Testing Program
One-dimensional consolidation tests were performed on CDG and HDG using an incremental loading procedure. Each specimen was confined within a rigid ring, with porous stones and filter papers placed at its upper and lower faces. The cell was inundated with water before loading. The applied vertical stress was increased from 12.5 to 1600 kPa by doubling the stress at each stage, followed by stepwise unloading to 12.5 kPa by successive halving. Each loading and unloading stage was maintained for 24 h. Vertical deformation was recorded to establish the compression and unloading curves for constitutive parameter calibration.
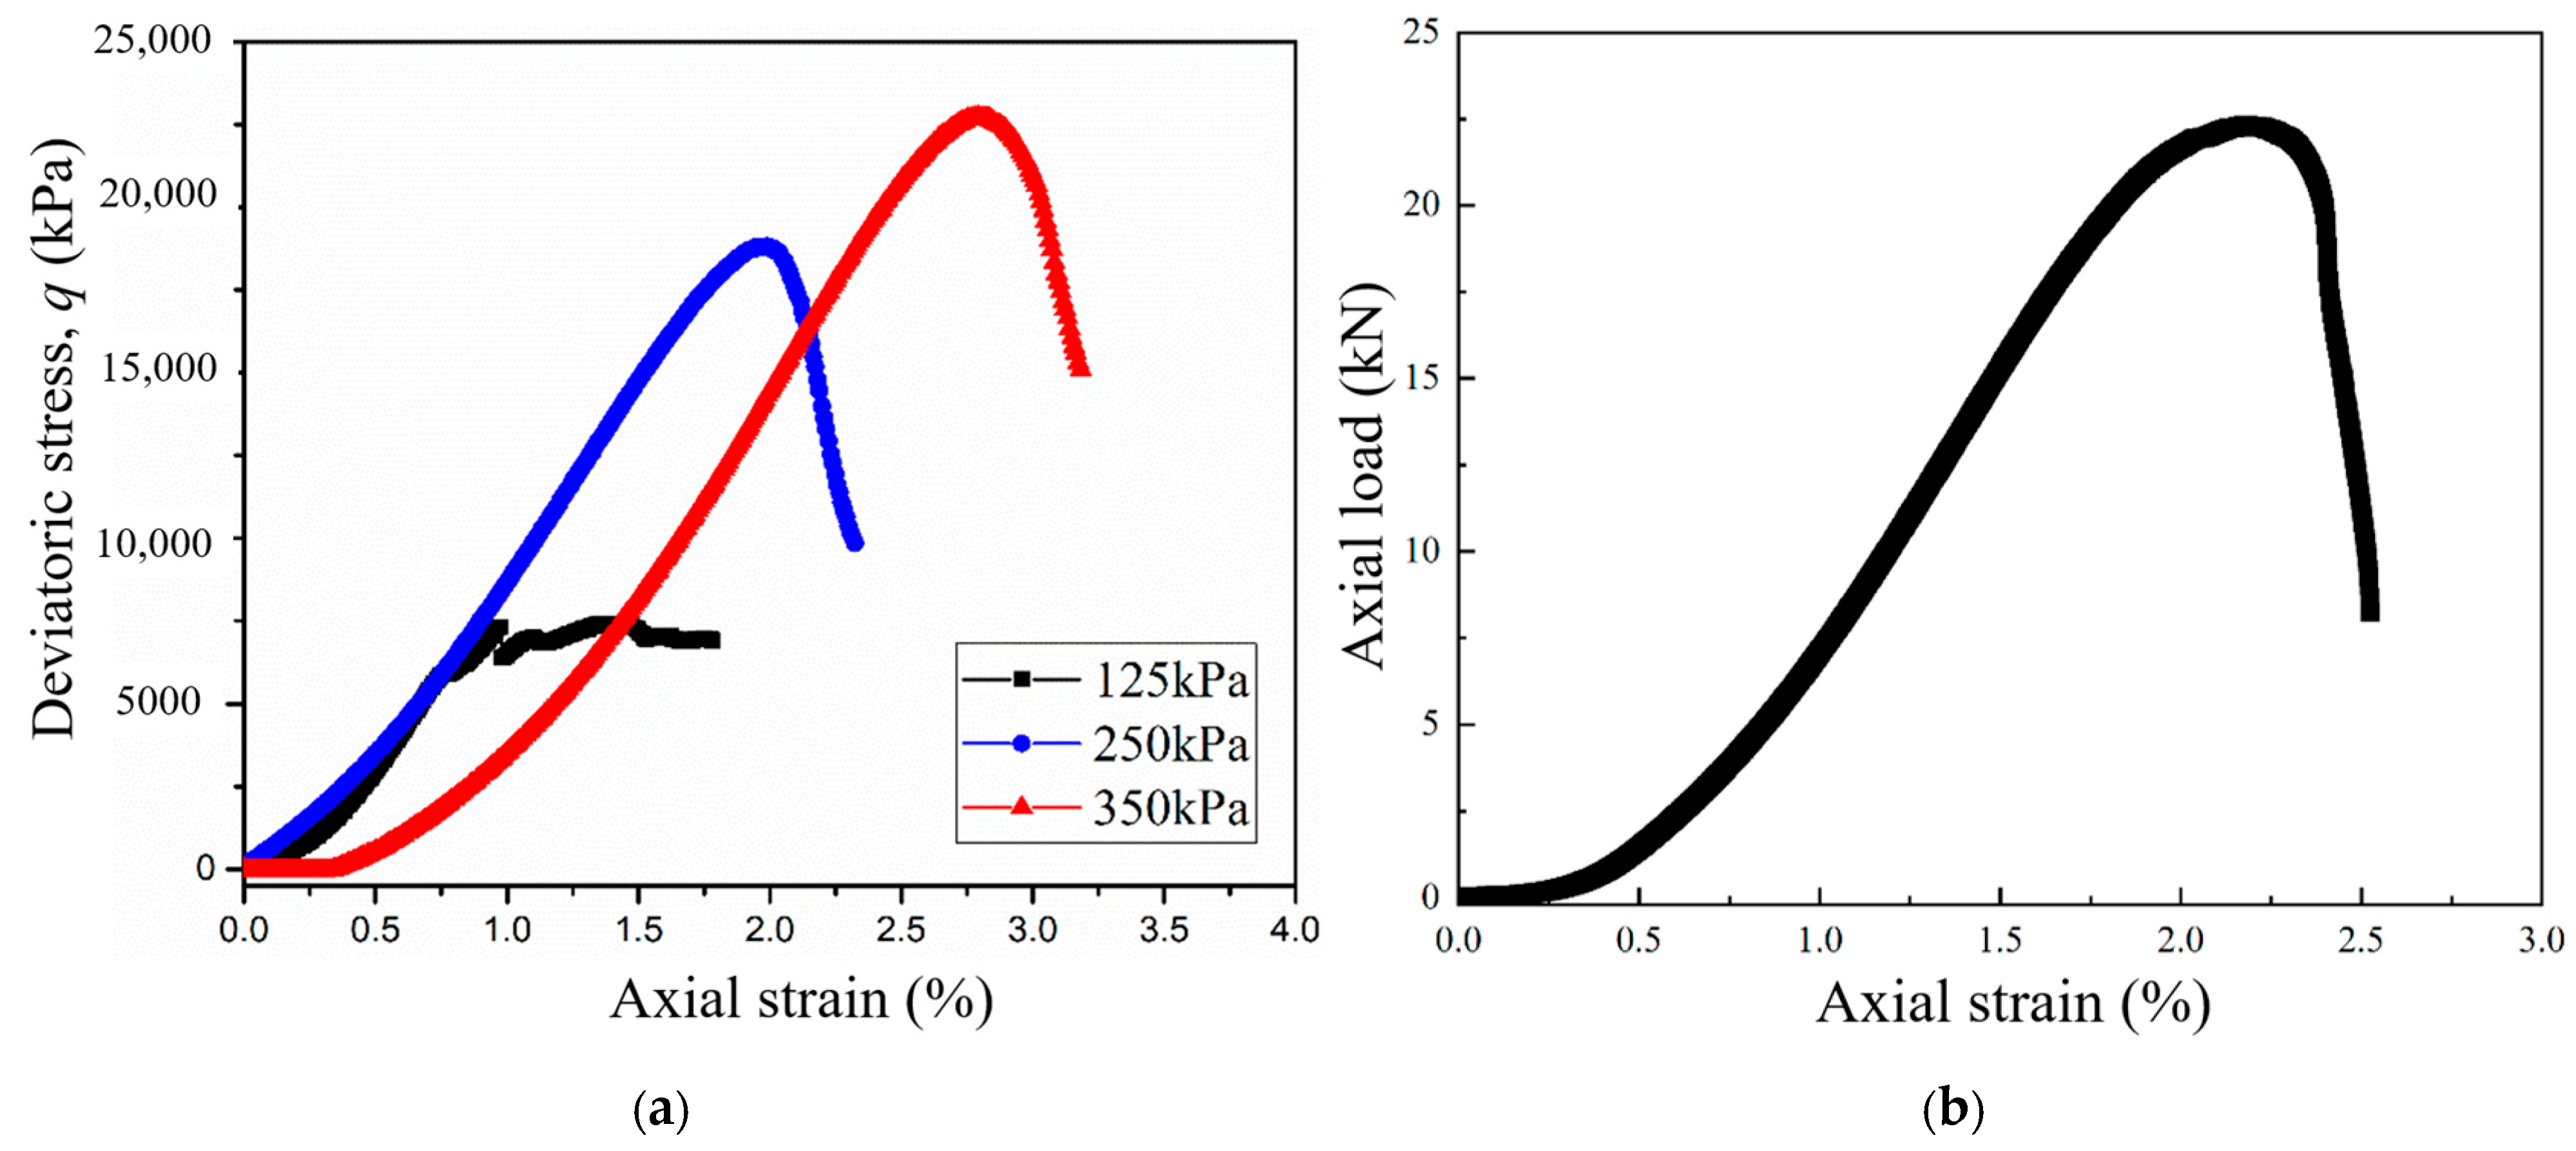
Conventional consolidated drained triaxial compression tests were conducted on CDG, HDG, and MDG. CDG and HDG were tested using a multifunctional triaxial apparatus developed at Shanghai Jiao Tong University, whereas MDG was tested using a GDS triaxial system equipped with a 40 kN load cell. Backpressure saturation was performed by increasing the backpressure and cell pressure in stages, with a final backpressure of at least 100 kPa. The specimens were then isotropically consolidated at effective confining pressures of 50, 100, and 200 kPa for CDG; 65, 130, and 260 kPa for HDG; and 125, 250, and 350 kPa for MDG. Consolidation was completed after the excess pore water pressure had dissipated. Drained shearing was subsequently performed at constant confining pressure under axial displacement control. The displacement rates were 0.025 mm/min for CDG and HDG and 0.04 mm/min for MDG. Axial load and deformation were recorded to obtain the stress–strain responses, together with volumetric measurements for CDG and HDG.
Confining-pressure unloading tests were performed on HDG to examine its response to the reduction in confinement associated with borehole excavation. The tests were conducted under drained conditions at initial effective confining pressures of 150 kPa. A custom control program reduced the confining pressure at a constant rate of 0.2 kPa/min while maintaining the prescribed axial loading condition. The pressure-control procedure was checked using a rubber dummy specimen before testing. Confining pressure and axial deformation were recorded throughout unloading to characterize strain accumulation as confinement decreased.
Supplementary uniaxial compression tests were performed on MDG using a rock-testing machine with a capacity of 100 kN. Specimens were loaded without lateral confinement at an axial displacement rate of 0.1 mm/min. The resulting uniaxial compressive strength, together with the MDG triaxial strength data, supported calibration of the Hoek–Brown parameters described in Section 2.3.
2.3. Constitutive Models and Parameter Identification
2.3.1. Unified Model Parameters for CDG and HDG
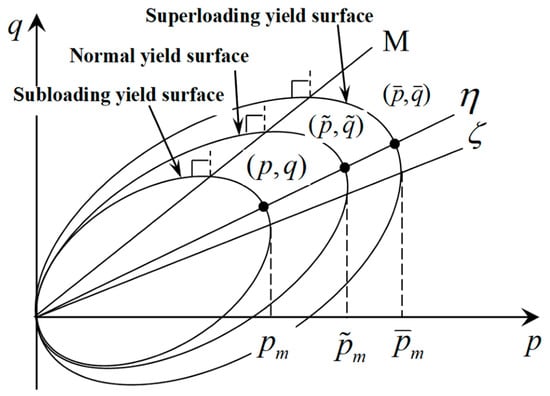
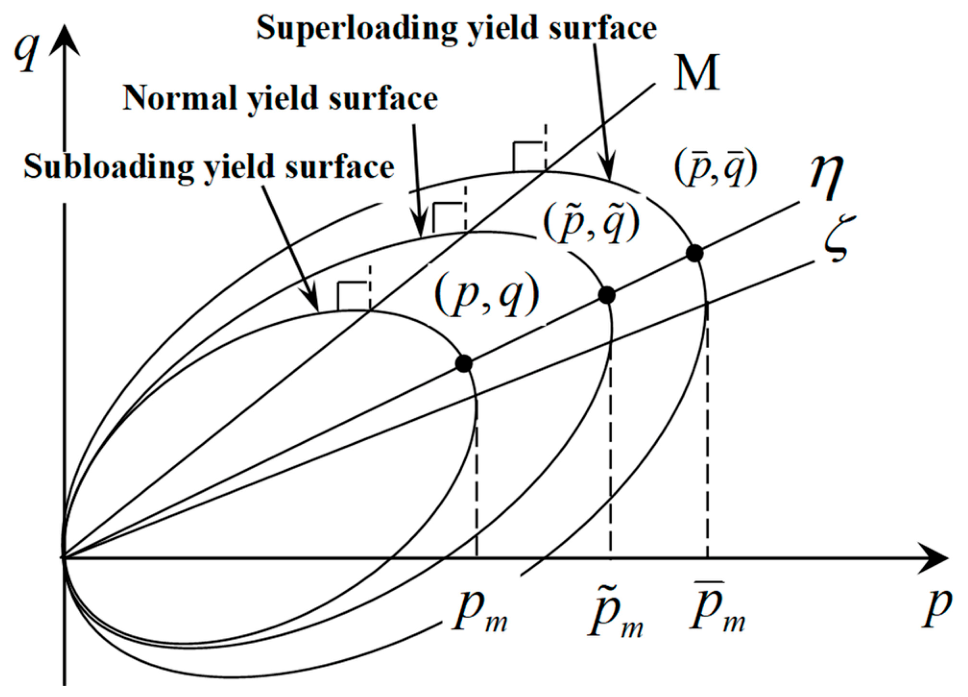
The mechanical responses of CDG and HDG are represented using the unified elastoplastic constitutive model developed by Zhang et al. [25] and subsequently modified by Ye and Ye [26]. The formulation combines the superloading-surface [27] and subloading-surface [28] concepts with stress-induced anisotropy [29] to account for soil structure, overconsolidation, and anisotropic behavior. The description of the yield surfaces is presented in Figure 4.
Figure 4.
Subloading, normal and superloading yield surfaces in the p-q plane.
There are two state variables to define the relationship between yield surfaces: R*, the similarity ratio of the superloading surface to the normal yield surface, and R, the similarity ratio of the superloading surface to the subloading surface. Both R* and R range from 0 to 1, with higher values indicating a weaker soil structure and a lower degree of overconsolidation, respectively. The definition is given as:
where (p, q), () and () represent the current stress state, the corresponding normally consolidated stress state and the structured stress state in the q-p plane, respectively. The present stress state is always located on the subloading surface, which is given by Equation (3). The evolution laws and remaining constitutive relations are provided in Appendix A.
The unified model involves eight material parameters. Five of these, namely the compression index (), swelling index (k), critical-state stress ratio (M), Poisson’s ratio (), and reference void ratio (e0), have the same physical meanings as their counterparts in the Cam-Clay model. The other three parameters are , and , where the parameter controls the collapse rate of the structure, controls the loss rate of over-consolidation and controls the development rate of the stress-induced anisotropy.
The parameters were identified separately for CDG and HDG using the oedometer and consolidated drained triaxial tests. The compression and unloading branches of the oedometer curves were used to constrain and k, while e0, a, and m were calibrated to reproduce the position and shape of the compression curves, particularly the transition through yielding. The triaxial stress–strain and volumetric strain responses were then used to constrain M and br. A single set of material parameters was adopted for each granite type across the oedometer and conventional triaxial simulations; the HDG parameters were subsequently retained for the confining-pressure unloading simulations. The identified material parameters are summarized in Table 2. A detailed description of the parameter identification procedure is available in the authors’ previous study [30,31]. The Unified model uses a consistent set of effective-stress material parameters for a given soil under different drainage conditions, while the initial states and hydraulic conditions are specified for each analysis. Ye and Ye [26] demonstrated this capability through comparisons with consolidation and drained/undrained triaxial tests on Shanghai clays, and Cai et al. [30] provided further comparisons with undrained stress-release tests on soils of varying plasticity.
Table 2.
Unified model parameters for CDG and HDG.
2.3.2. Hoek–Brown Criterion and Parameters for MDG
The mechanical behavior of MDG was described using an elastic–perfectly plastic formulation incorporating the generalized Hoek–Brown criterion [32]. The criterion accounts for the nonlinear influence of confinement on rock-mass strength and is expressed as:
where and are the major and minor effective principal stresses at failure, respectively, with compression taken as positive; is the uniaxial compressive strength of intact rock; and mb, s, and a are dimensionless rock-mass strength parameters. The rock-mass constants mb and s are related to mi, GSI, and D through:
The intact-rock constant mi was evaluated using the uniaxial and triaxial compressive strength data and the intact-rock form of the criterion. In the adopted rock-mass characterization procedure, laboratory uniaxial strength and wave-velocity-based estimates of rock integrity were used to assess the geological strength index (GSI), together with observations of rock structure and discontinuity conditions. The disturbance factor (D) describes excavation-induced damage and stress relaxation, with changes in rock-mass wave velocity providing supporting information for its assessment. The exponent a was set to 0.5 in the adopted formulation, and the elastic response was defined by Young’s modulus (E) and Poisson’s ratio (ν). The parameter values adopted for MDG are summarized in Table 3. The corresponding uniaxial and triaxial compression test results are presented in Appendix B.
Table 3.
Hoek–Brown parameters adopted for MDG.
2.4. Numerical Model and Simulation Procedure
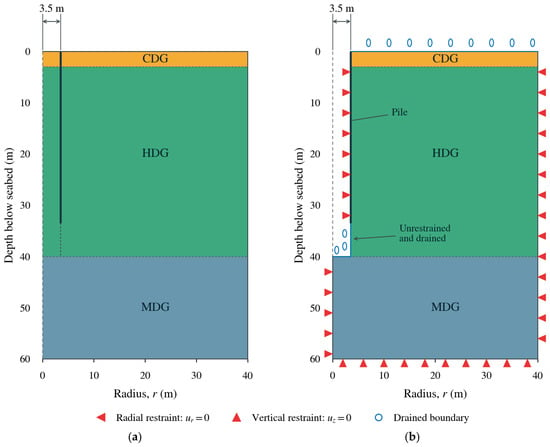
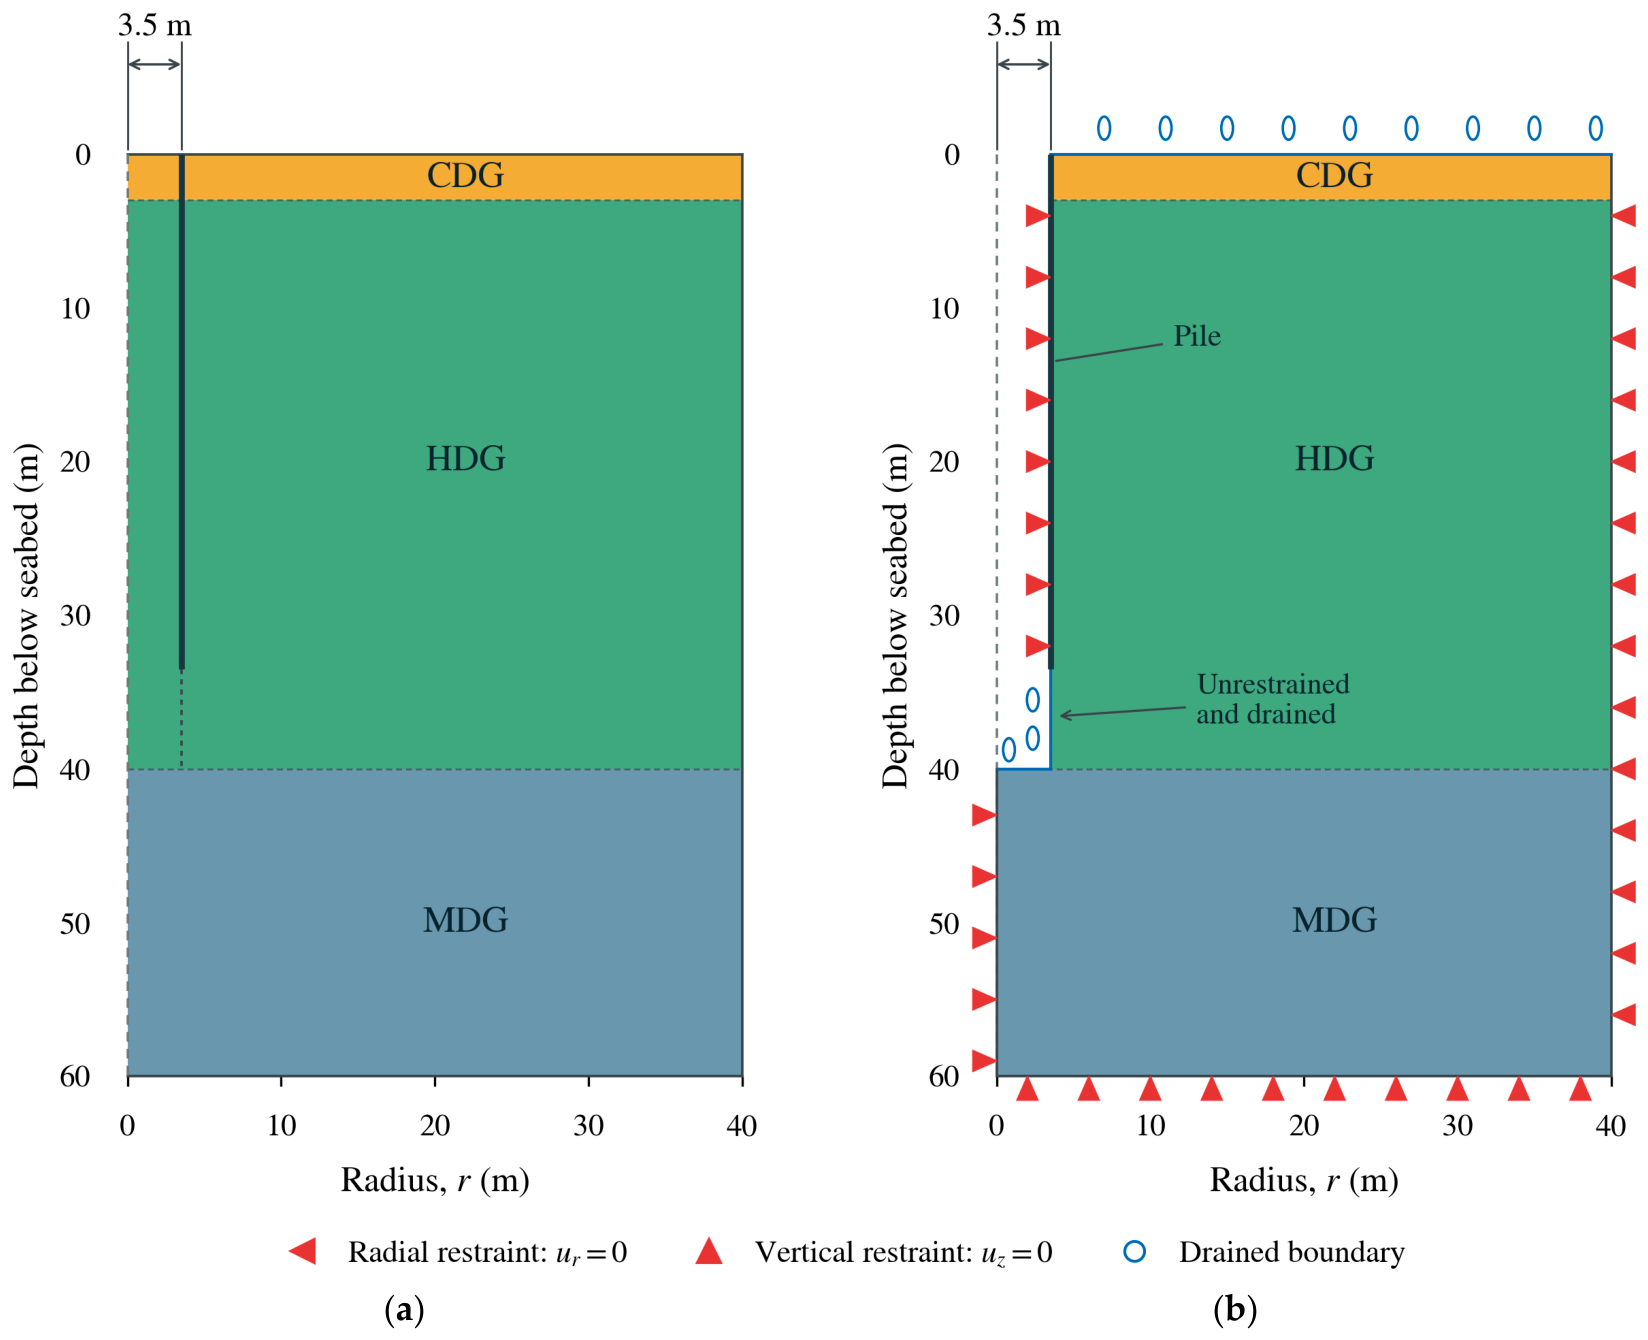
A two-dimensional axisymmetric finite element model was developed in Abaqus/Standard to investigate the response of the borehole wall to excavation and subsequent pore-pressure redistribution (Figure 5). The computational domain extended 40 m radially from the pile axis and 60 m below the seabed. The pile wall was located at a radial distance of 3.5 m, and the excavation extended to the HDG–MDG interface. CDG and HDG were represented by the unified model implemented through a UMAT, using the respective parameter sets identified in Section 2.3. MDG was described by the Hoek–Brown model presented in Section 2.3.2. The initial lateral effective stress coefficients, K0, were set to 0.42, 0.43, and 0.37 for CDG, HDG, and MDG, respectively, based on the empirical relationship (K0 = 1 − sin) for CDG and HDG and the elastic relationship (K0 = ) for MDG. Laboratory permeability tests on HDG specimens recovered from the offshore site yielded a hydraulic conductivity of approximately 1 × 10⁻⁸ m/s, which was adopted in the coupled finite element analysis. Supplementary sensitivity analyses showed that variations in hydraulic conductivity within the examined range had only a minor influence on the predicted borehole response. A spatially uniform hydraulic conductivity was adopted for HDG, and hydraulic heterogeneity was not explicitly considered in this study.
Figure 5.
Axisymmetric numerical model: (a) initial geometry and material assignment; (b) post-excavation geometry and boundary conditions.
The domain was discretized using CAX4P elements, which are four-node axisymmetric quadrilaterals with bilinear interpolation of displacement and pore pressure. A local element size of 0.1 m was adopted near the unsupported borehole wall below the pile toe. The mesh was gradually coarsened toward the outer boundaries, with a maximum element size of 0.5 m, to concentrate spatial resolution around the excavation while limiting computational cost.
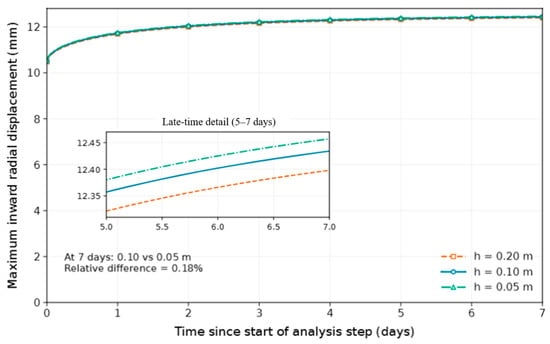
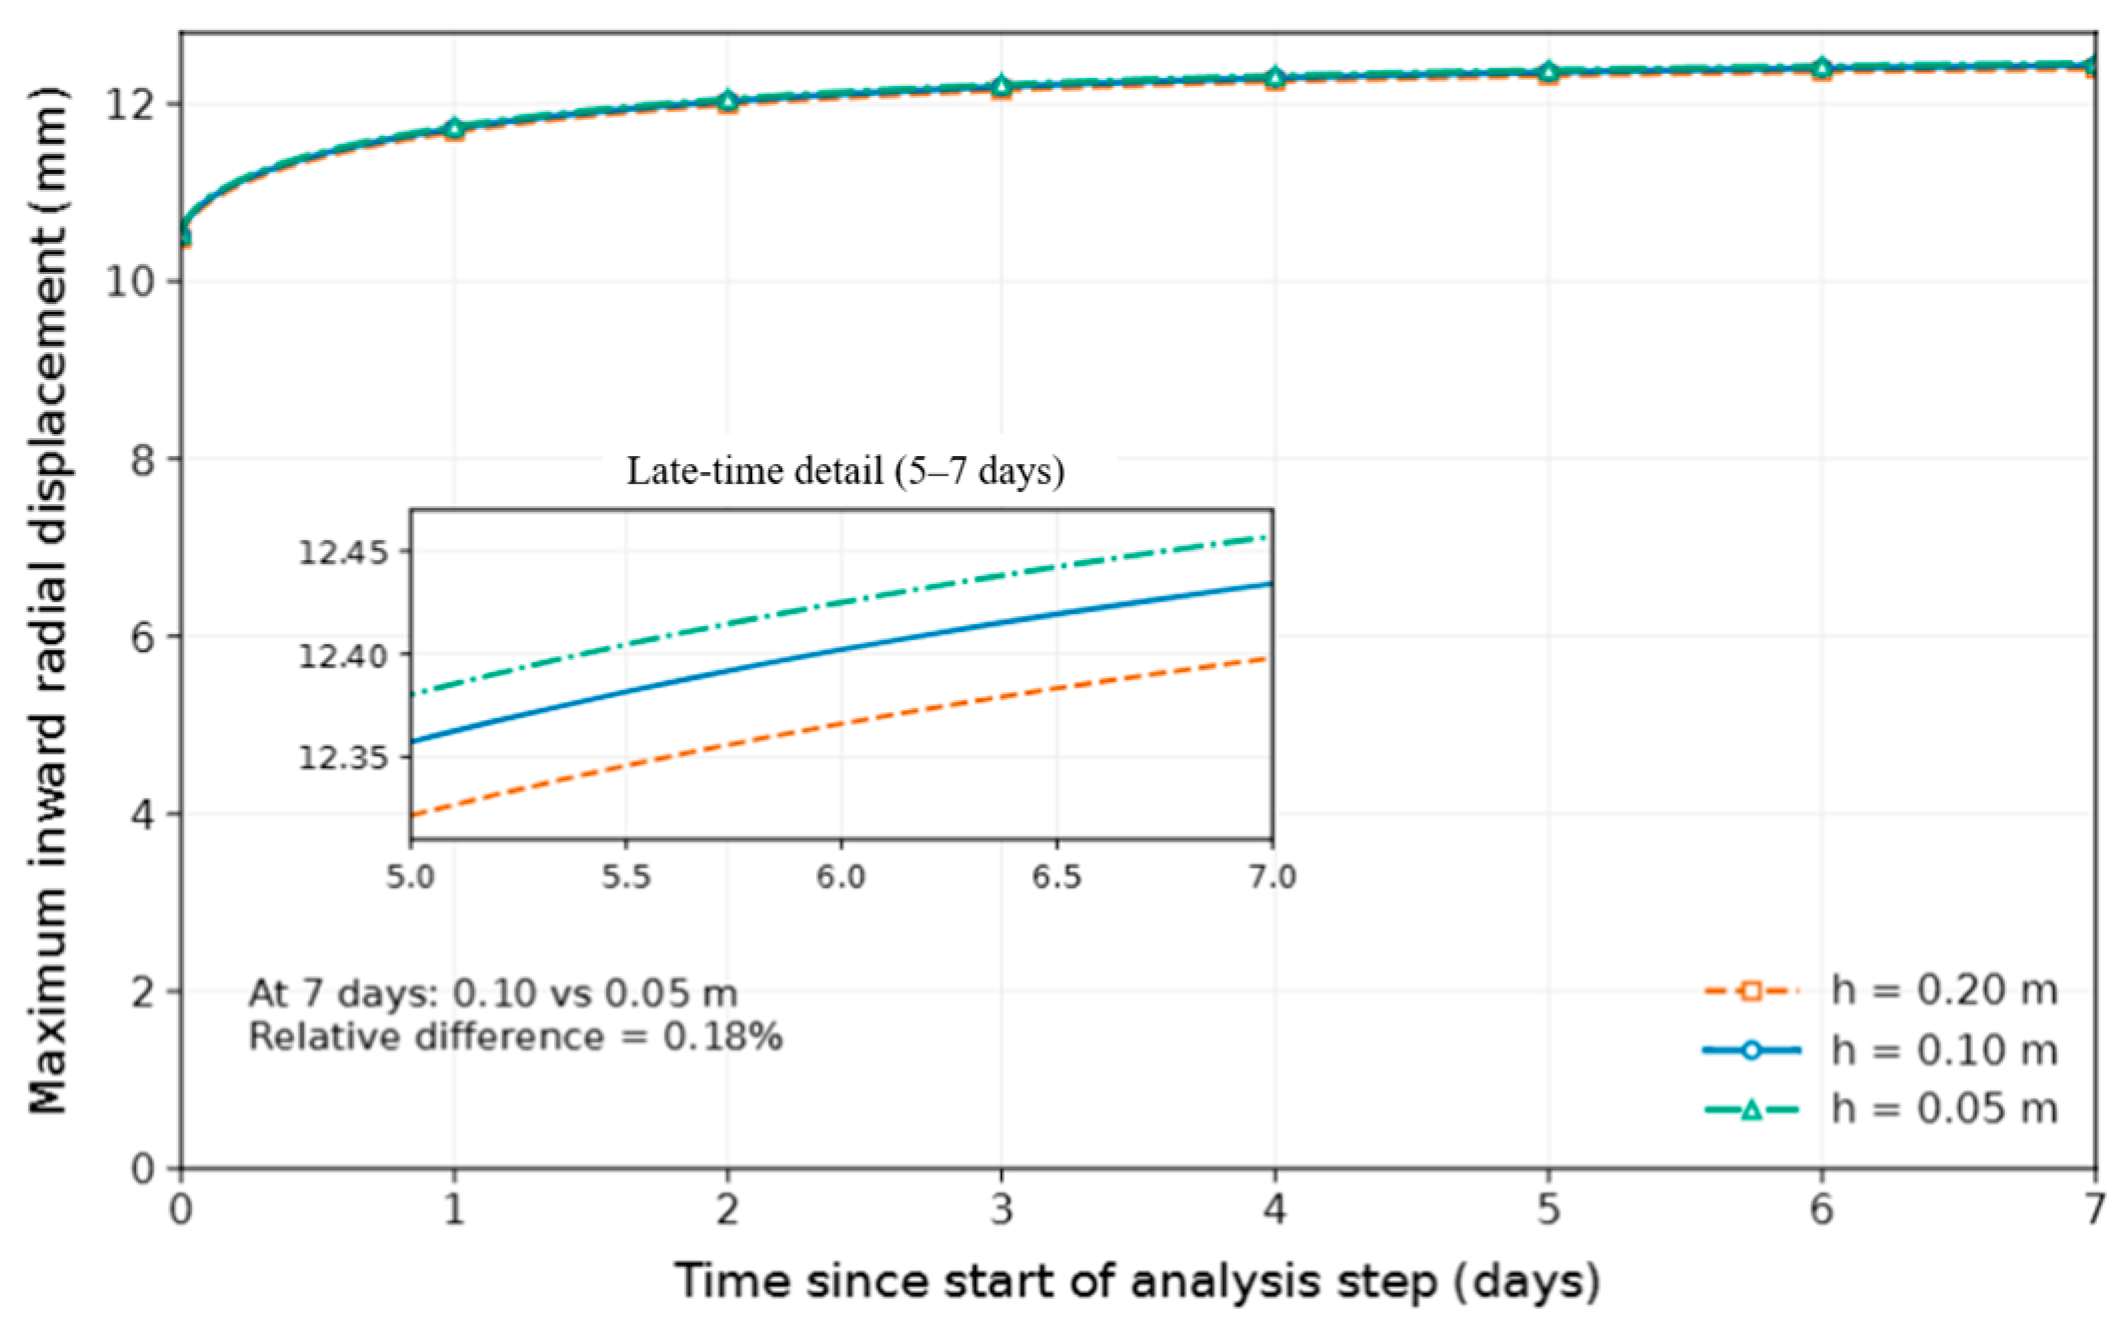
Mesh sensitivity was examined using local element sizes of 0.20, 0.10, and 0.05 m under the same corrected loading and drainage sequence. The corresponding maximum inward wall displacements at 7 d were 12.398, 12.434, and 12.457 mm, respectively (Figure 6). Refinement from 0.10 to 0.05 m changed this displacement by approximately 0.18% relative to the finer mesh. A local element size of 0.10 m was therefore adopted to balance computational accuracy and efficiency.
Figure 6.
Mesh sensitivity of the maximum radial borehole wall displacement following excavation.
Lateral support above the pile toe was idealized by prescribing zero radial displacement along the pile-supported borehole boundary, without imposing a vertical displacement constraint on this segment. The lateral support provided by the pile was idealized by imposing zero radial displacement along the borehole wall above the pile toe. The exposed wall below the toe remained free of displacement constraints. Drained conditions were assigned to the seabed and the exposed excavation surfaces below the pile toe, while all other hydraulic boundaries were treated as impermeable. The retained HDG–MDG interface outside the excavation was idealized as perfectly bonded and hydraulically continuous. Adjacent CAX4P elements shared displacement and pore-pressure degrees of freedom, ensuring displacement compatibility and pore-pressure continuity, while interfacial force equilibrium and fluid mass conservation were enforced through the assembled governing equations. The constitutive response was evaluated separately at the integration points of each material; plastic strains and internal variables were therefore permitted to differ across the interface. Hydraulic properties were assigned separately to the materials, without introducing additional interfacial flow resistance. These internal interface conditions were distinguished from the drainage condition prescribed on the exposed excavation base.
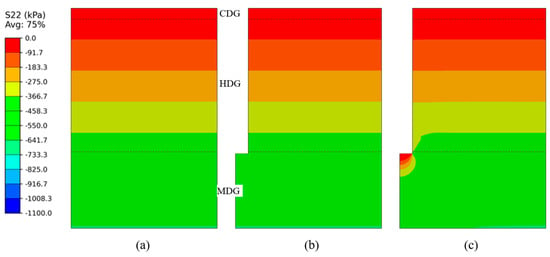
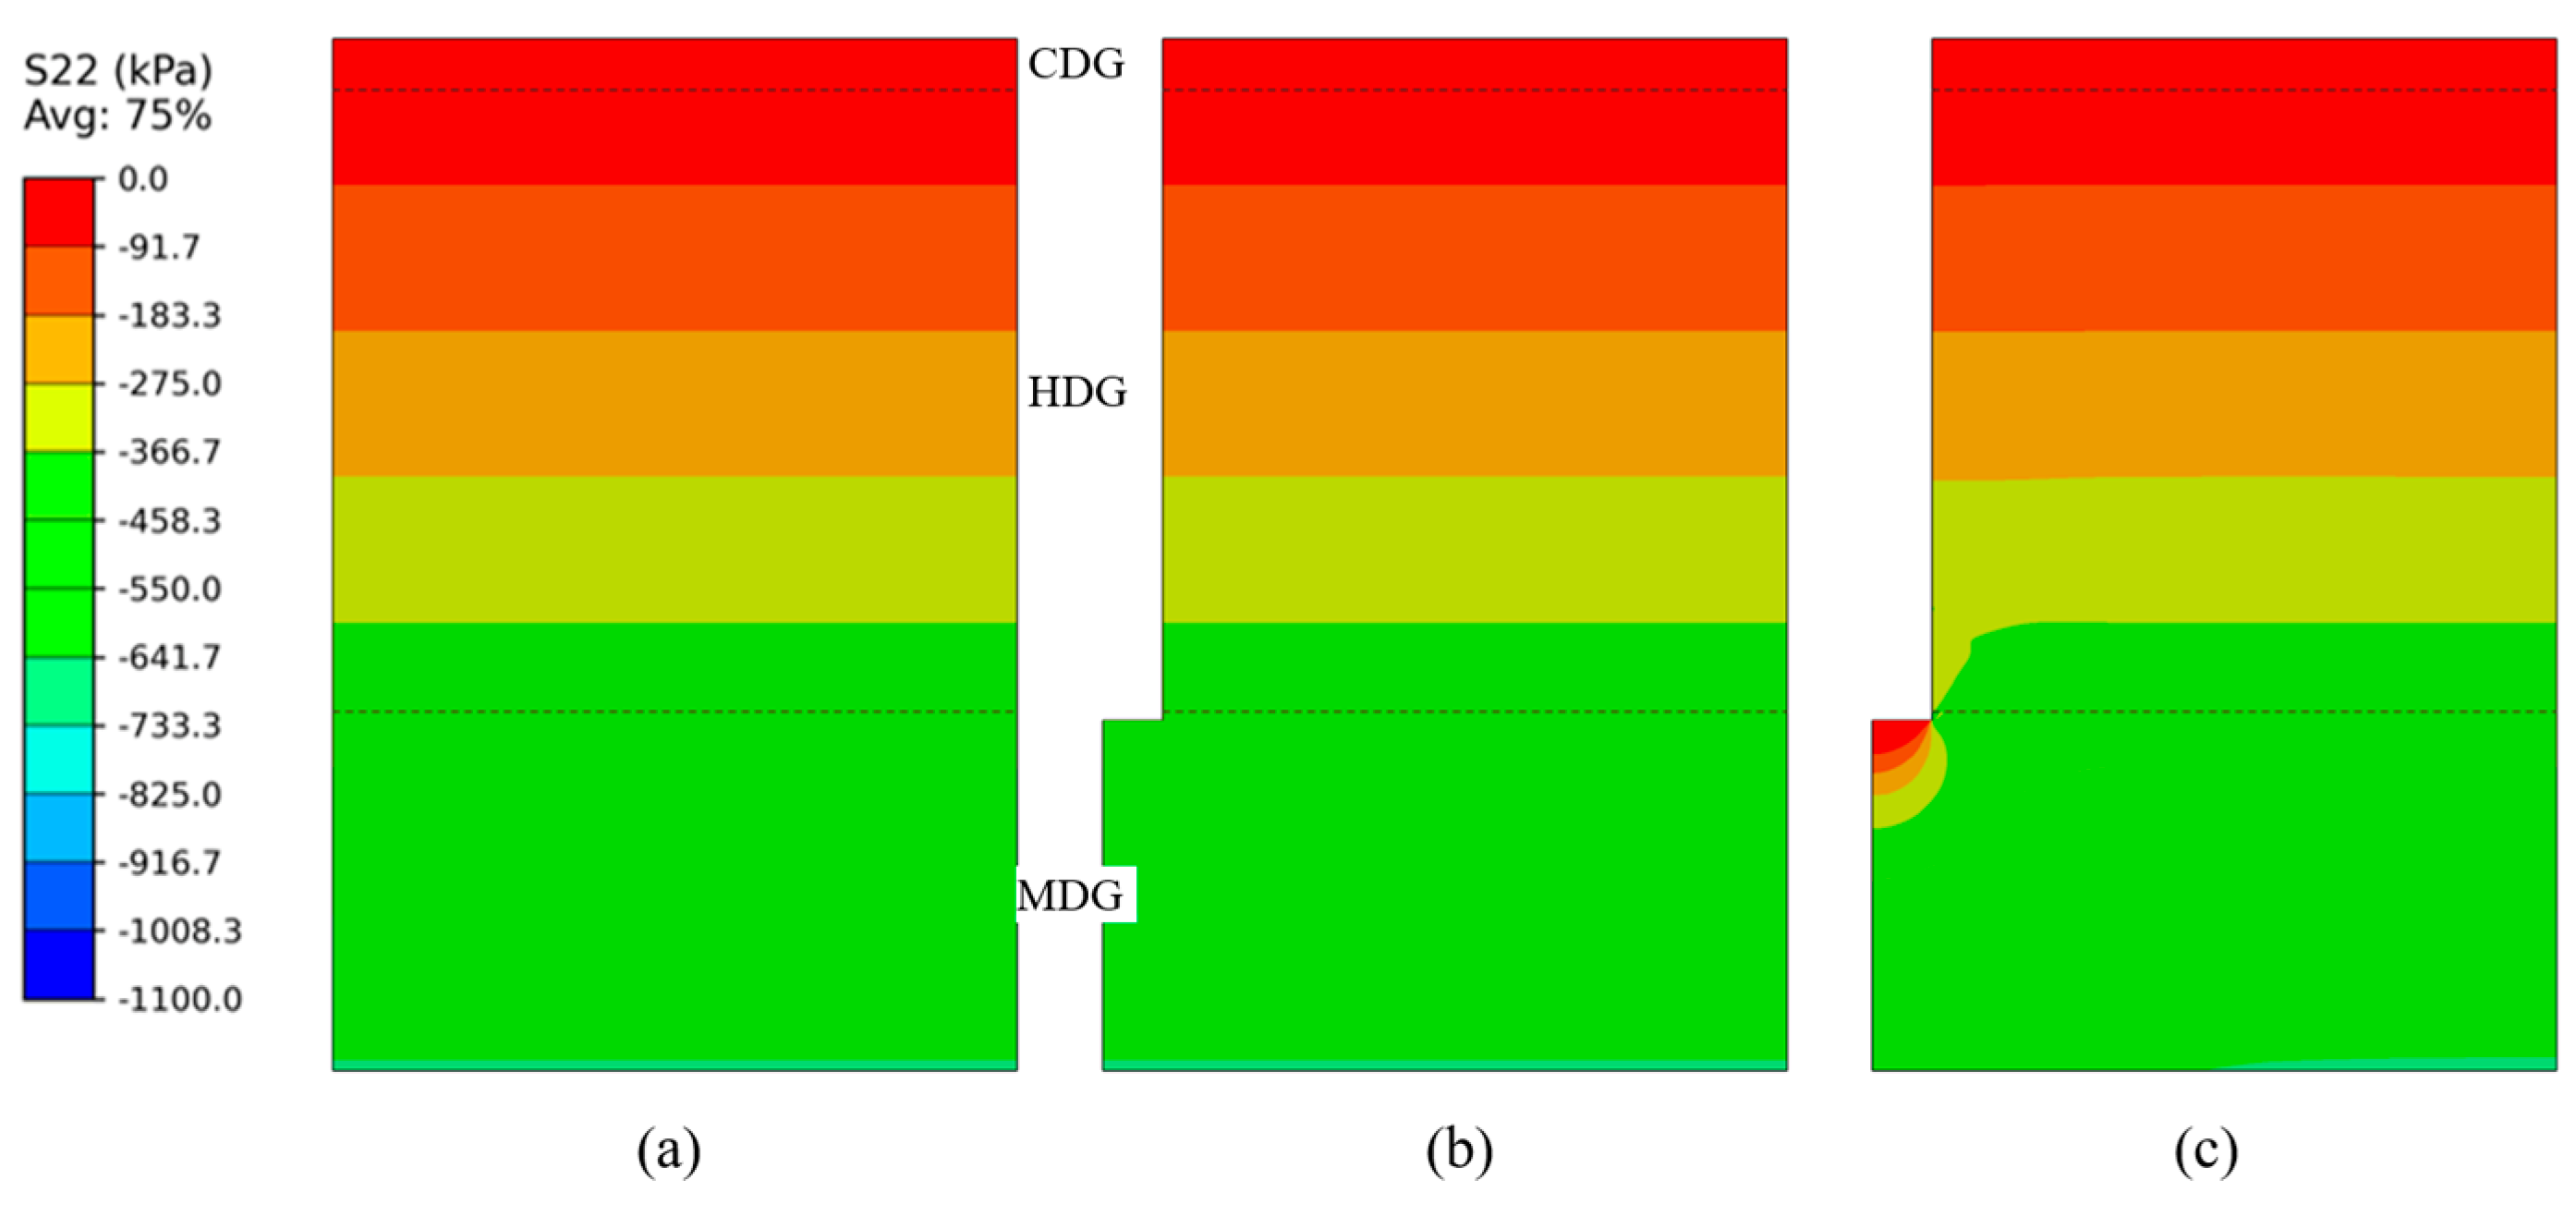
The analysis comprised geostatic initialization, element removal, coupled unloading, and subsequent coupled evolution (Figure 7). Following geostatic equilibrium, the excavated elements were deactivated while temporary constraints on the newly exposed wall and base retained the pre-release configuration. These temporary constraints were then released, and compensating boundary tractions were progressively reduced over a 3600 s coupled unloading step. Zero excess pore pressure was prescribed on the exposed wall and base from the start of coupled unloading and maintained throughout the subsequent 604,800 s (7d) analysis. Both stages solved skeleton deformation and pore-fluid flow simultaneously, without introducing a new drainage condition at their transition. The one-hour interval represents an assumed stress-release duration rather than a reconstruction of the measured drilling rate. The numerical analysis focuses on confinement release and subsequent pore-pressure redistribution during the interval between drilling and pile driving. Detailed drilling-fluid circulation, rheology, and filter-cake development are outside this scope. The adopted simplifications are intended to examine the relationship between the measured unloading response of decomposed granite and the evolution of borehole-wall deformation and effective stress under the specified boundary conditions.
Figure 7.
Numerical simulation procedure: (a) geostatic equilibrium; (b) excavation; (c) coupled fluid–solid analysis.
3. Experimental and Simulation Results
3.1. One-Dimensional Compression Responses
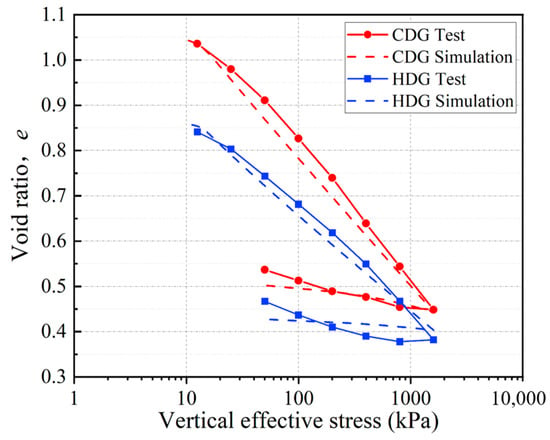
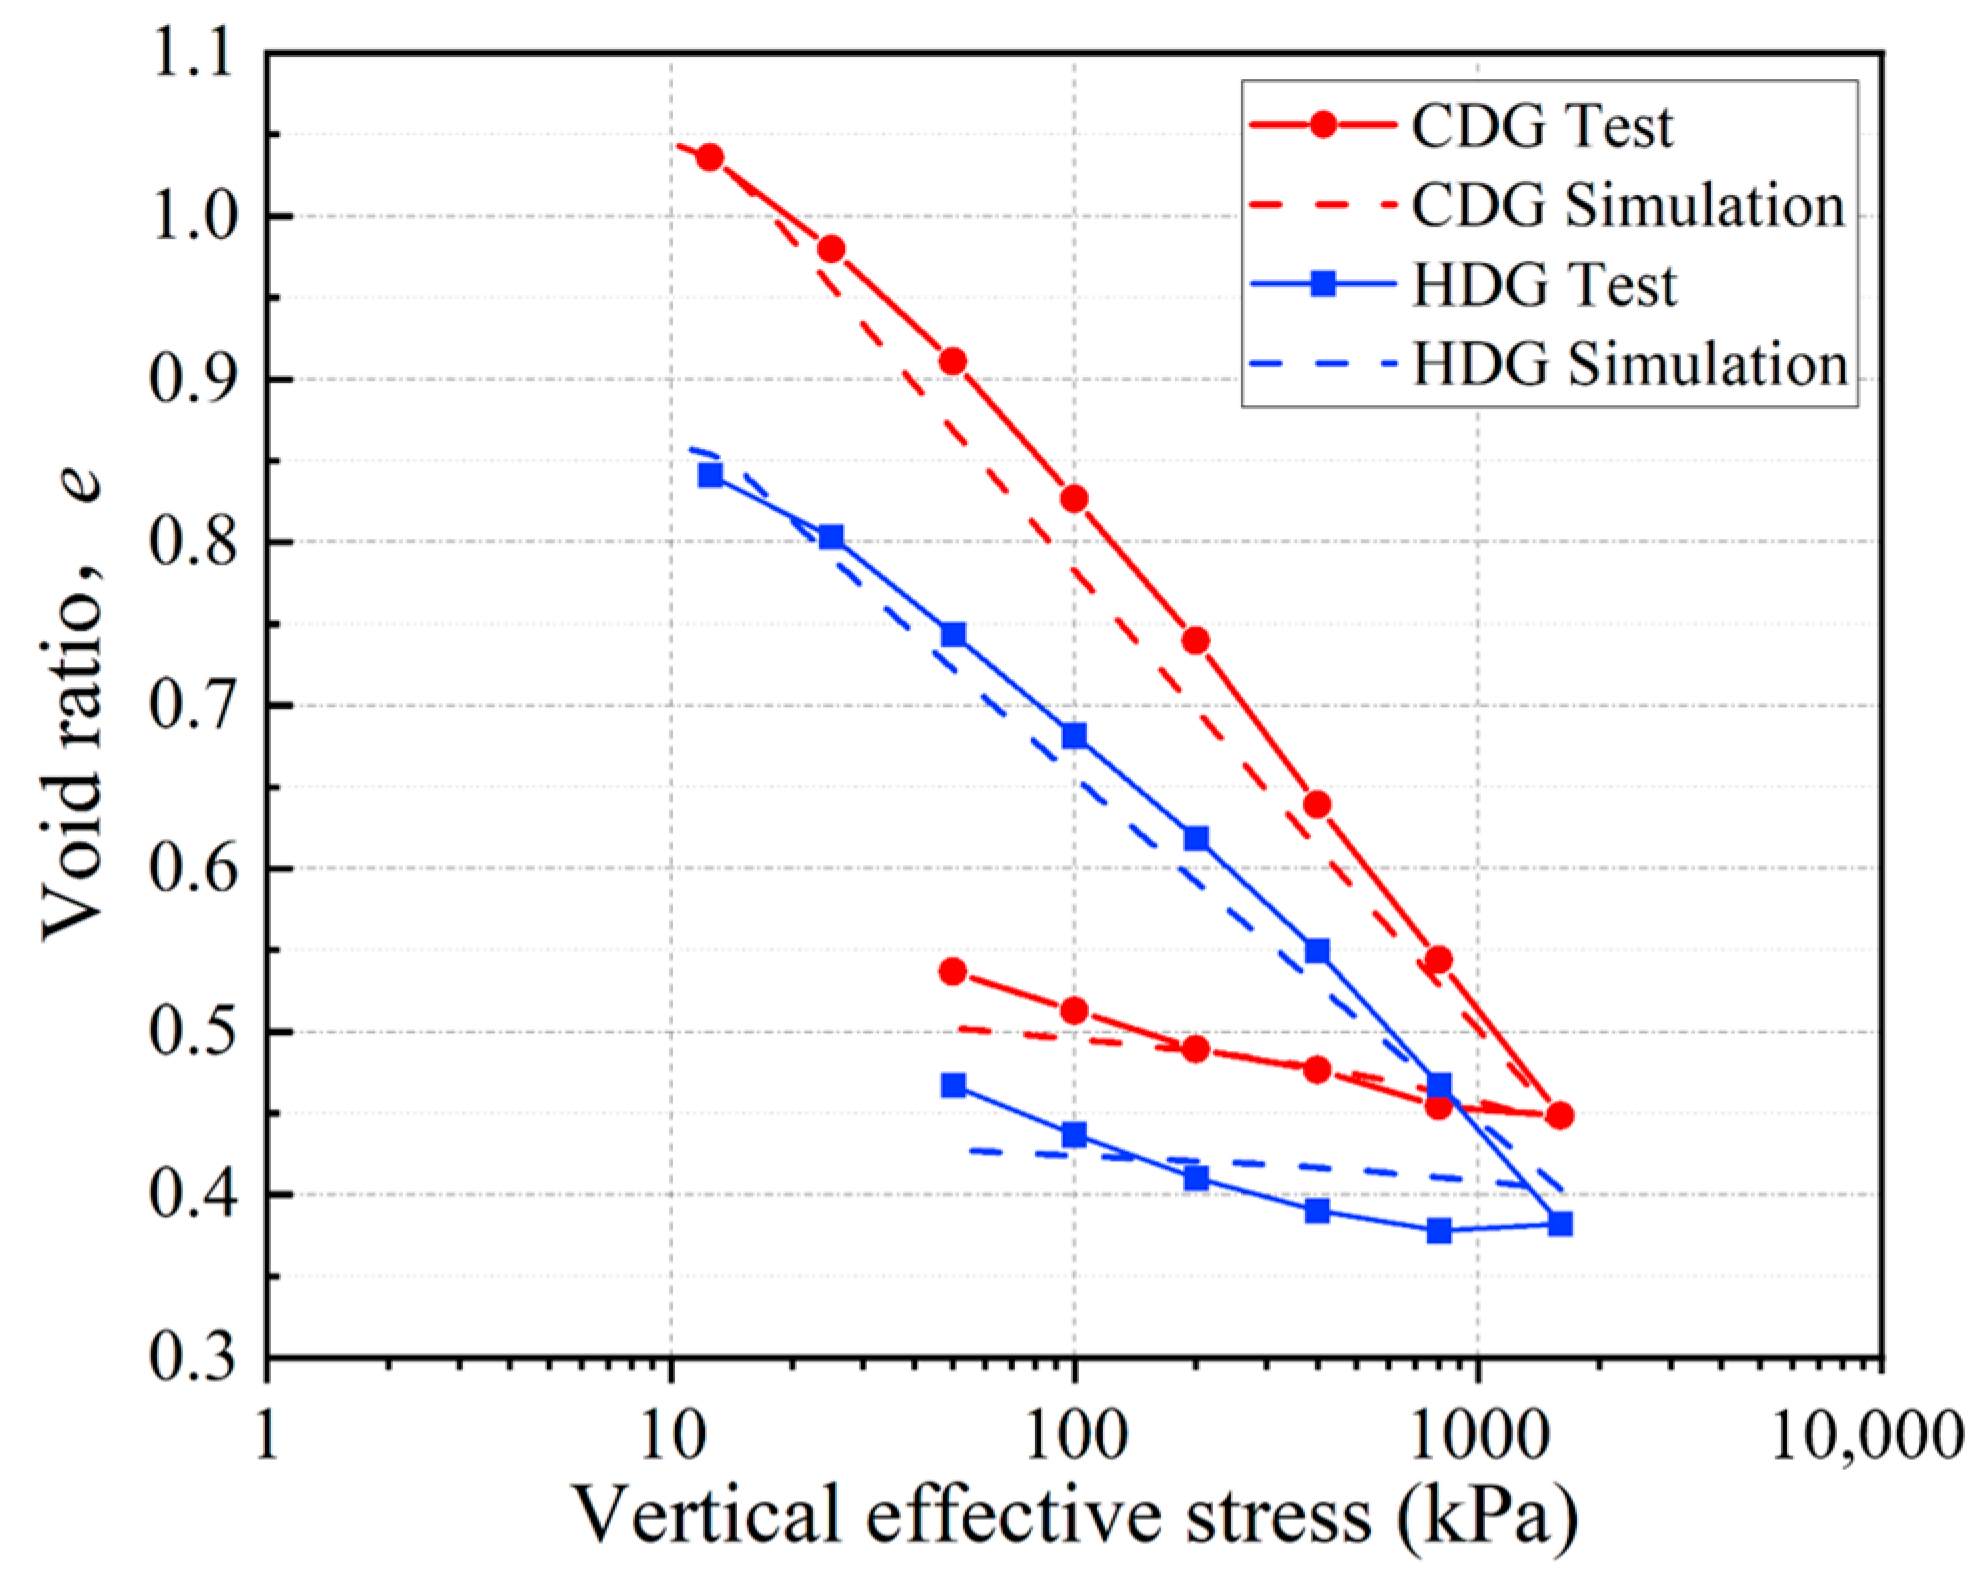
Figure 8 presents the one-dimensional consolidation test results and corresponding simulations for CDG and HDG. Both materials show decreasing void ratio with increasing vertical effective stress. CDG exhibits a higher void ratio and a steeper loading branch than HDG, indicating greater compressibility over the tested stress range. During unloading, both materials exhibit limited rebound, and their void ratios remain lower than those on the loading branch at the same stress.
Figure 8.
One-dimensional consolidation test results and corresponding simulations for CDG and HDG.
The unified model reproduces the overall compression trends of both materials and the relatively small volume recovery during unloading. The simulations also capture the difference in compressibility between CDG and HDG, although some deviations remain in the unloading branches. These comparisons indicate that the model provides a reasonable description of their one-dimensional loading–unloading responses. The parameters (m) and (a), calibrated against the oedometer responses, provide a constitutive interpretation of the differences between HDG and CDG. Within the superloading–subloading framework, sandy soils exhibit relatively slow loss of overconsolidation and rapid structural degradation, whereas clayey soils show the opposite tendency [31,33]. In the present study, HDG was characterized by m = 0.3 and a = 0.5, compared with m = 1.0 and a = 0.4 for CDG. These contrasting parameter trends are consistent with a transition from more sand-like behavior in HDG toward more clay-like behavior in CDG with increasing weathering.
3.2. Drained Triaxial Shear Responses
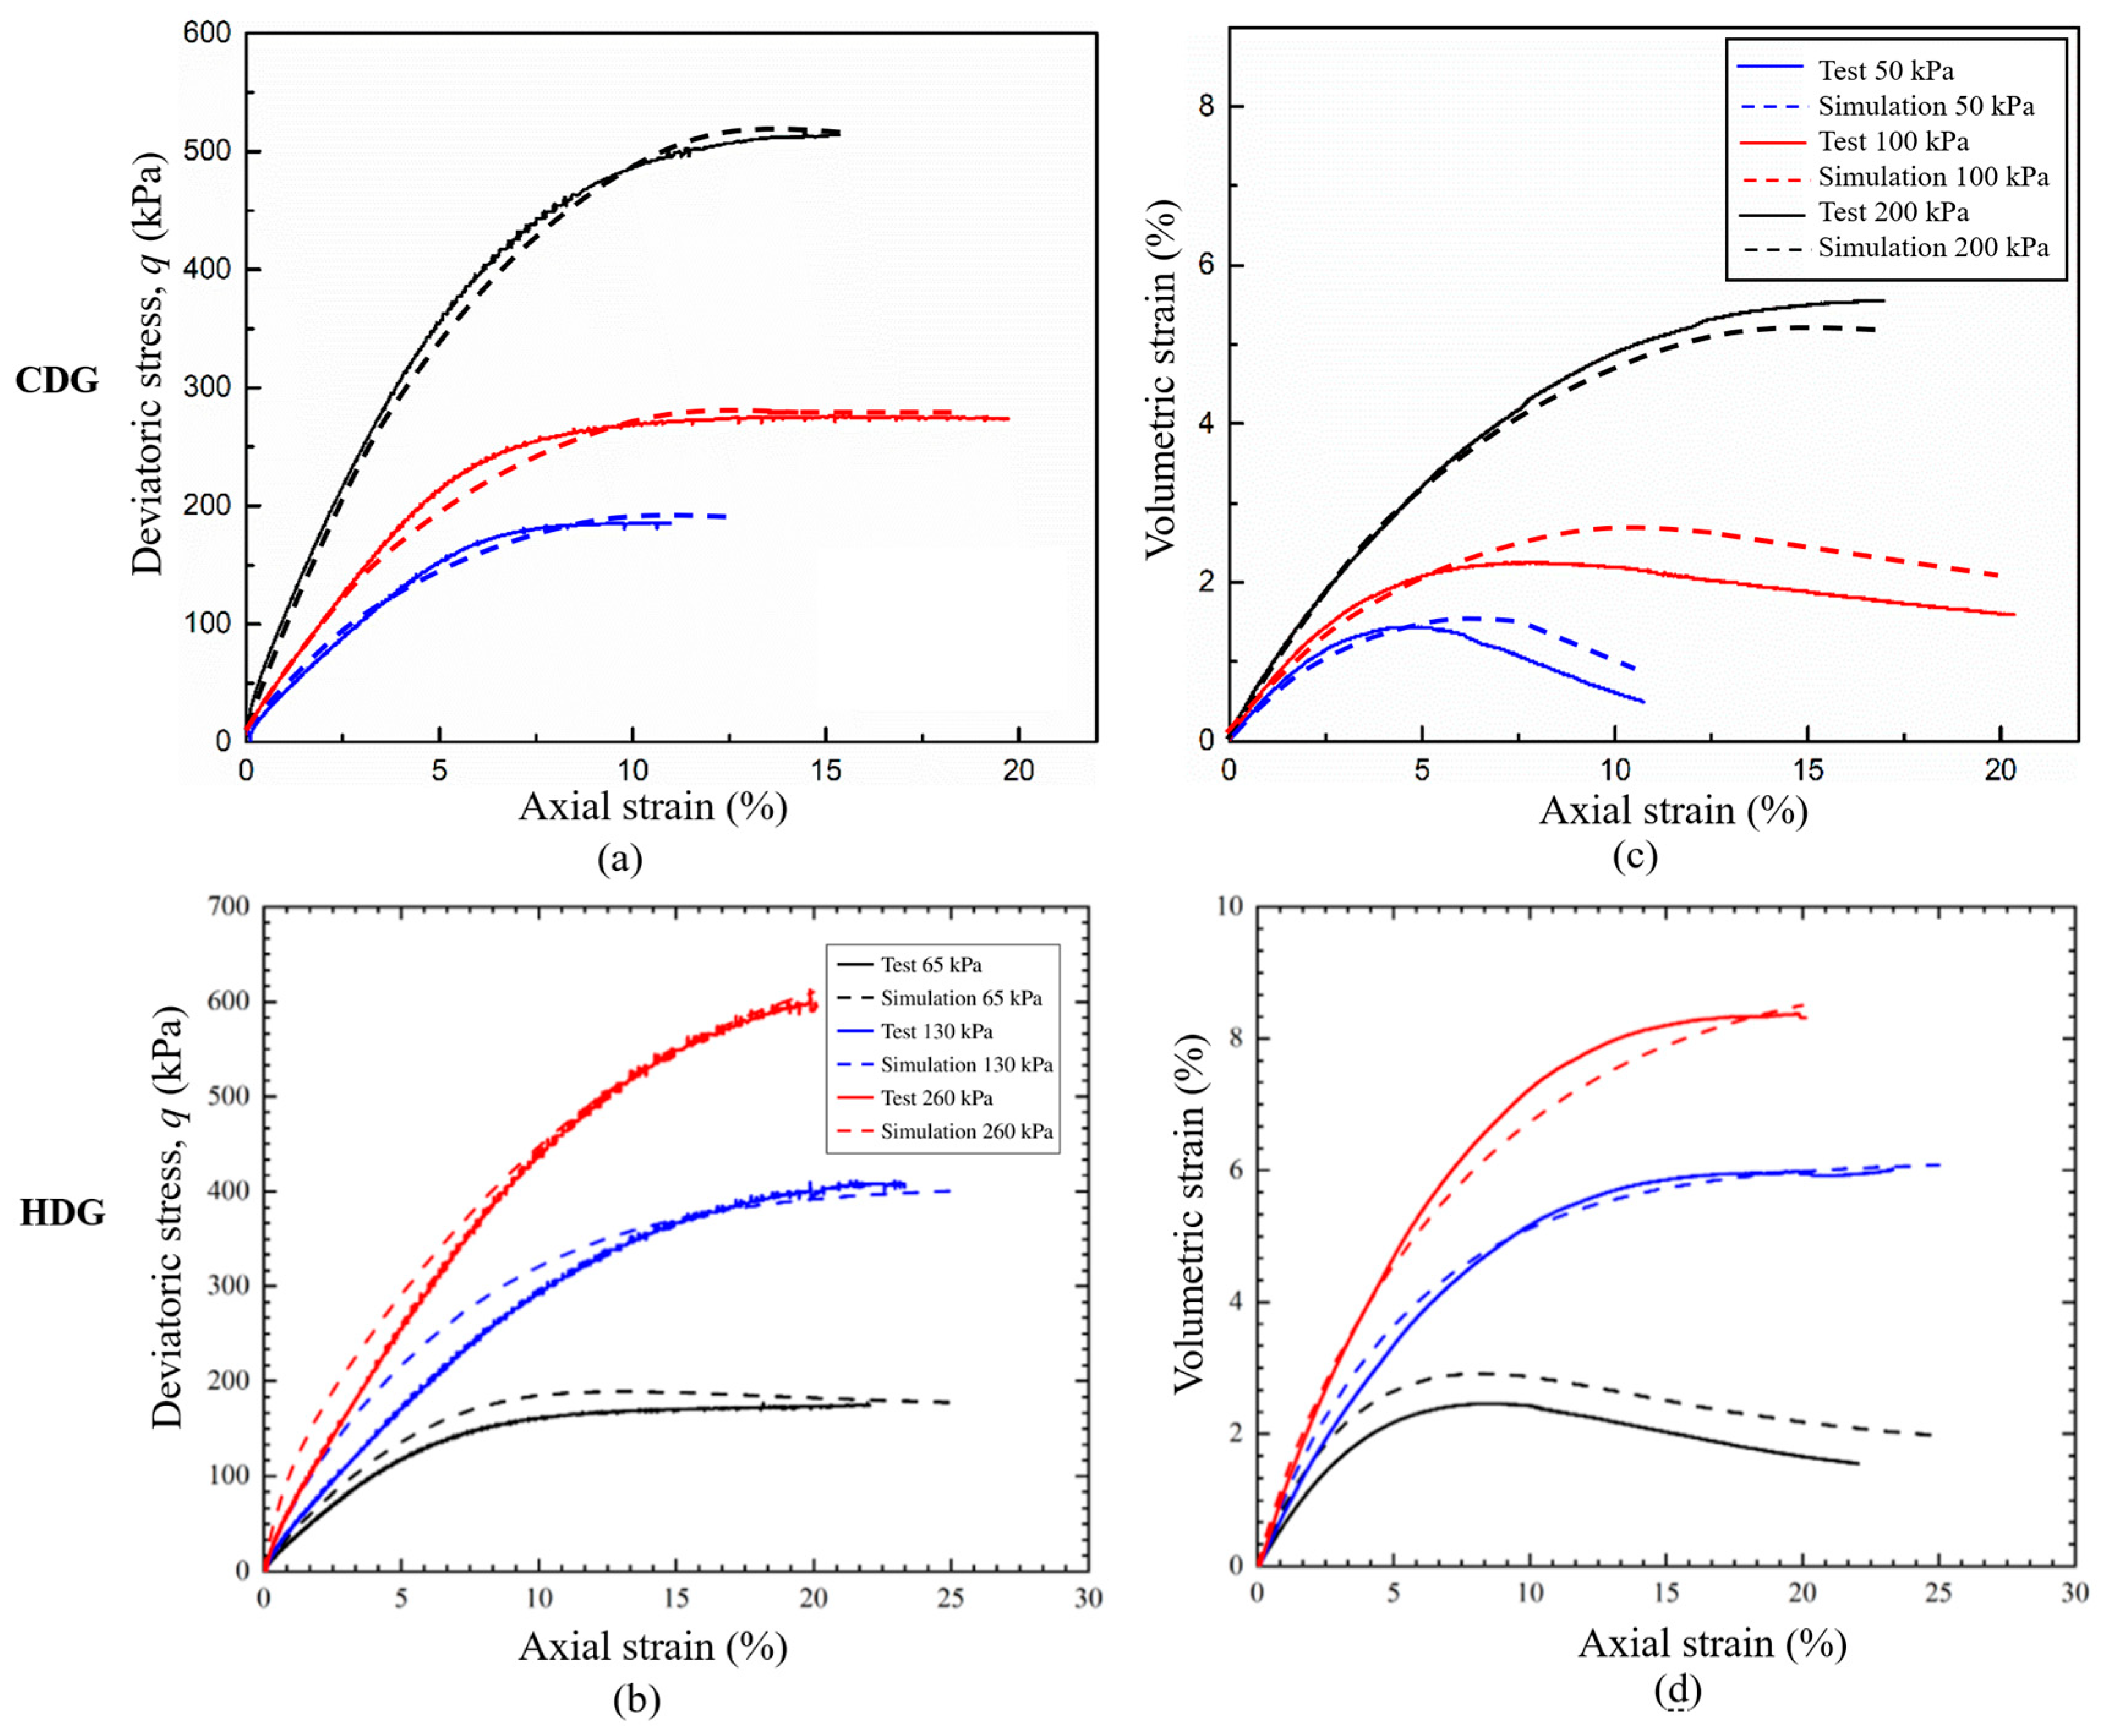
Figure 9 compares the experimental and simulated responses of HDG and CDG under drained triaxial compression. Both materials exhibit nonlinear strain hardening, with deviatoric stress increasing at a progressively decreasing rate as axial strain develops. Higher effective confining pressures lead to greater mobilized shear resistance. Several curves approach stress plateaus at large strains, whereas HDG at 260 kPa continues to harden over much of the recorded strain range. Both materials initially contract during shearing. At low confinement, contraction is followed by dilation, as indicated by the decrease in volumetric strain after its maximum, with compression taken as positive. This behavior is observed for HDG at 65 kPa and CDG at 50 and 100 kPa. At higher confinement, HDG at 130 and 260 kPa and CDG at 200 kPa remain predominantly contractive over the measured strain range.
Figure 9.
Triaxial test results and corresponding simulations for HDG and CDG: (a,b) stress–strain; (c,d) volumetric strain accumulation.
The simulations agree reasonably well with the measured stress–strain curves and reproduce the main volumetric responses, including the transition from contraction to dilation at low confinement. Despite some deviations in volumetric strain, a consistent parameter set for each material captures the principal features observed across the tested confining pressure.
3.3. Response of HDG to Confining-Pressure Unloading
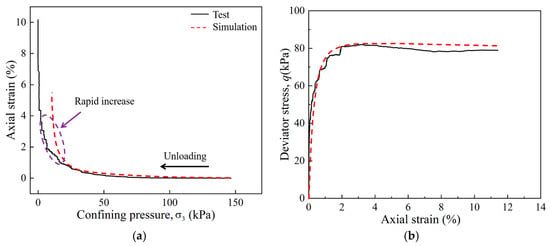
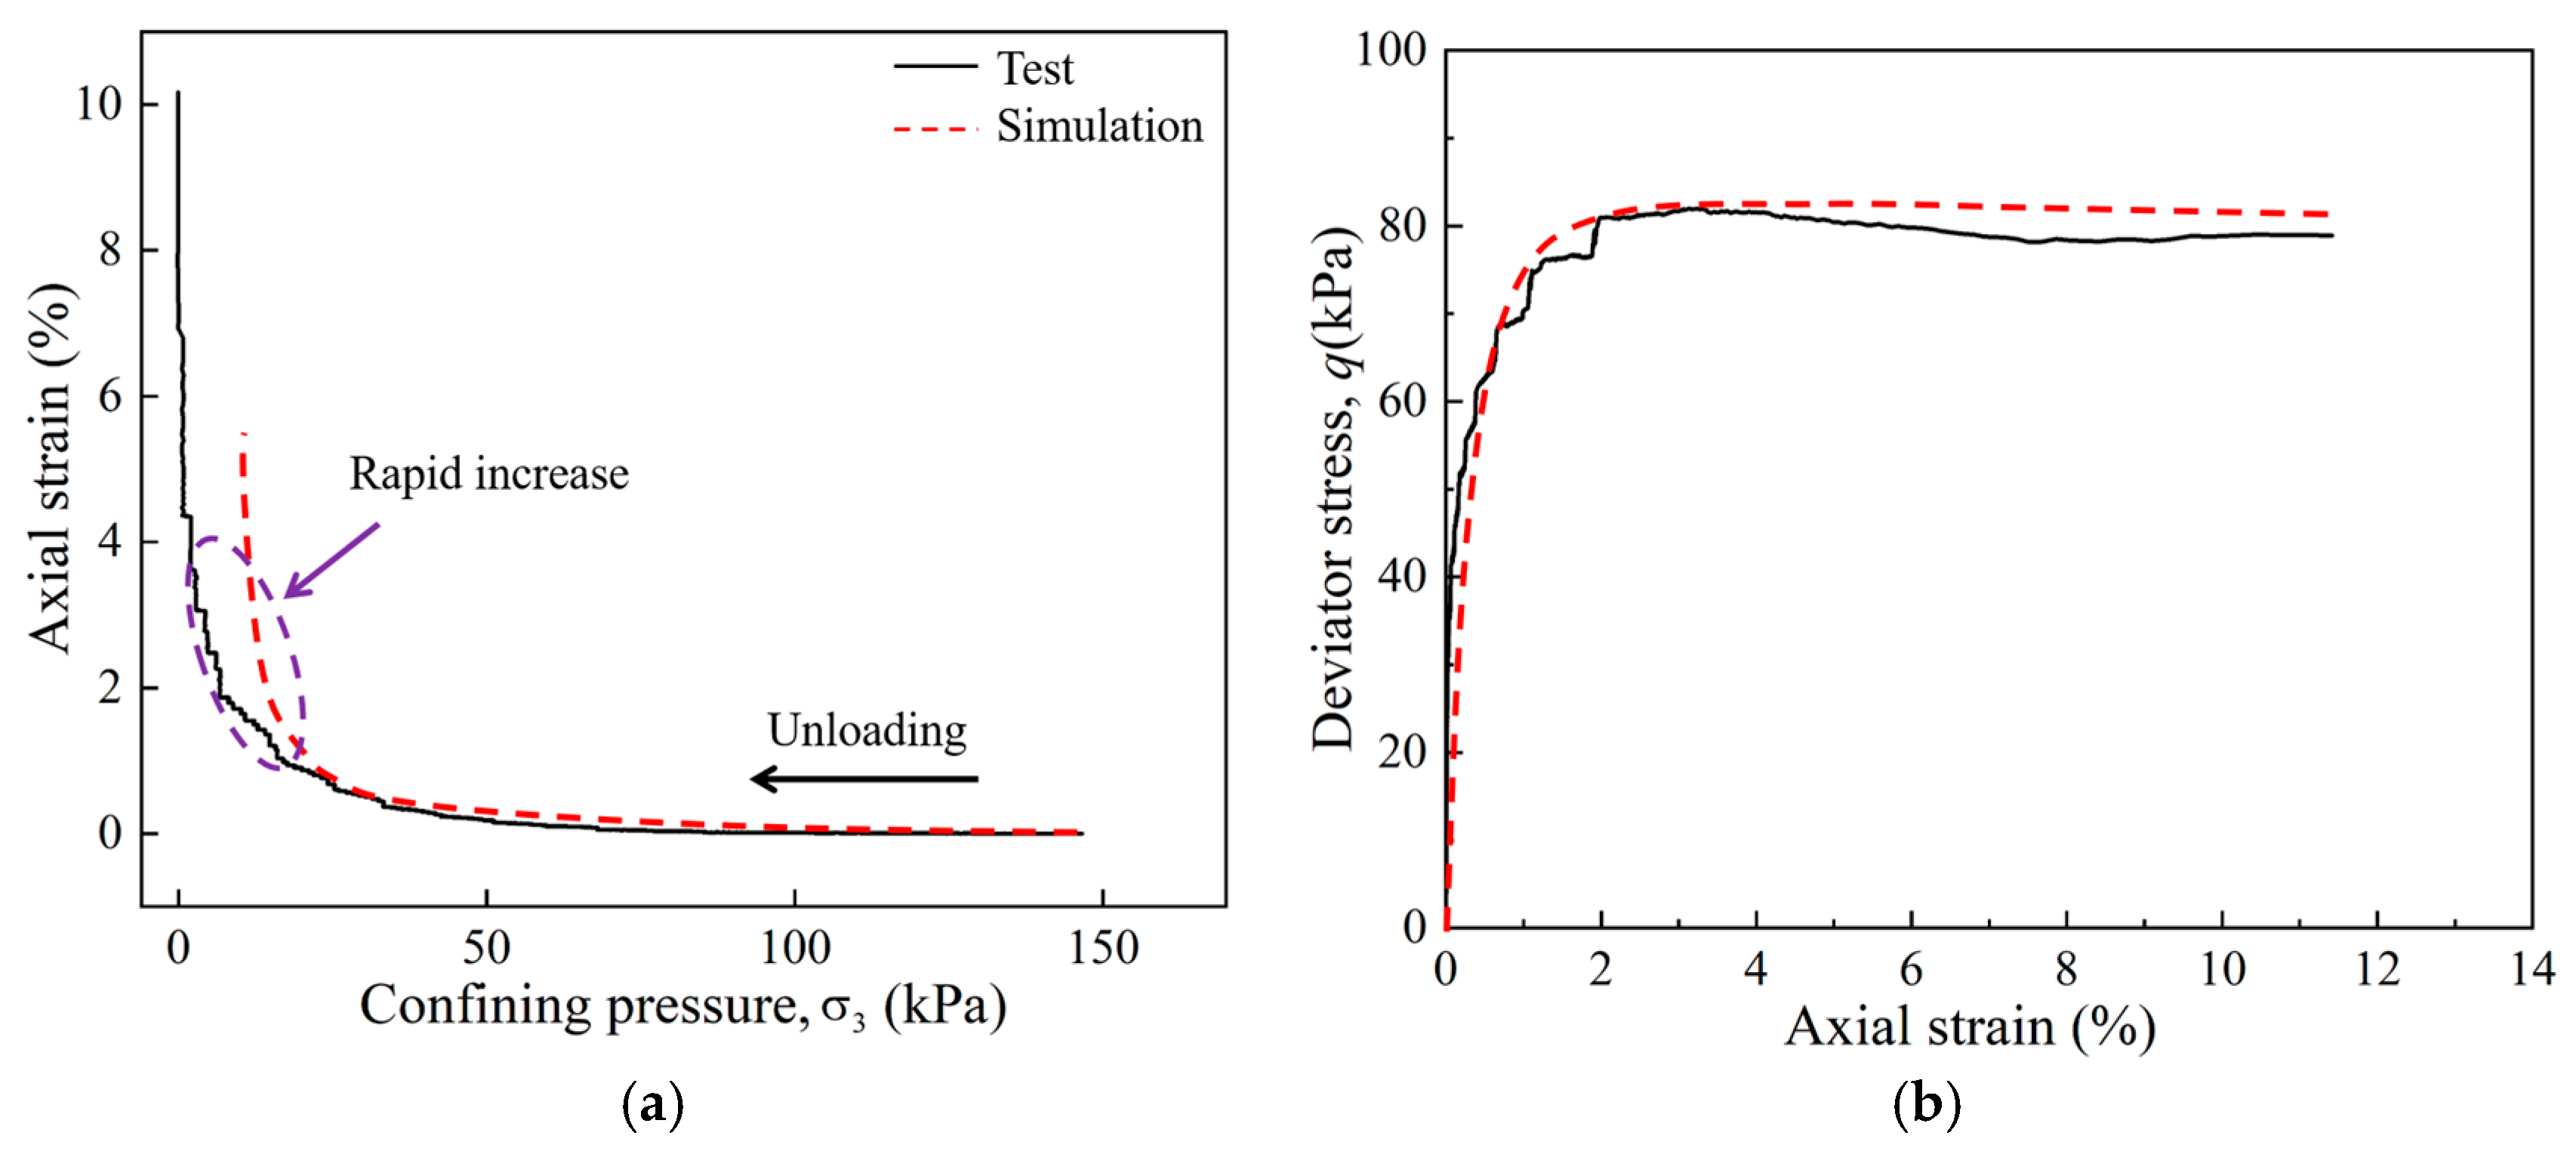
Figure 10 presents the experimental and simulated responses of HDG during confining-pressure unloading. The effective confining pressure was reduced from 150 kPa to approximately zero. The simulation captures the transition to pronounced strain accumulation at an axial strain of approximately 1%, consistent with the experimental response (Figure 10a), although this transition occurs at a somewhat higher remaining effective confining pressure. The measured and simulated maximum deviatoric stresses are approximately 82 and 83 kPa, respectively (Figure 10b), followed by slight softening and a nearly constant stress level. This differs from the predominantly hardening responses observed in the conventional triaxial tests. The peak deviatoric stress under unloading is also lower than the stress levels mobilized in those tests, although the confinement histories differ. These observations show that substantial deformation can develop during stress release at relatively low deviatoric stress, highlighting the importance of considering unloading when assessing the mechanical response of HDG.
Figure 10.
Triaxial confining-pressure unloading test results and corresponding simulations for HDG: (a) axial strain versus confining pressure; (b) deviatoric stress versus axial strain.
Using the HDG parameter set identified in Section 2.3.1, the unified model captures the transition from small initial deformation to pronounced strain accumulation, together with the overall deviatoric stress–axial strain response. The simulation reproduces the principal response trends within the simulated strain range, providing a further assessment of the calibrated model under an unloading stress path.
3.4. Simulation Results
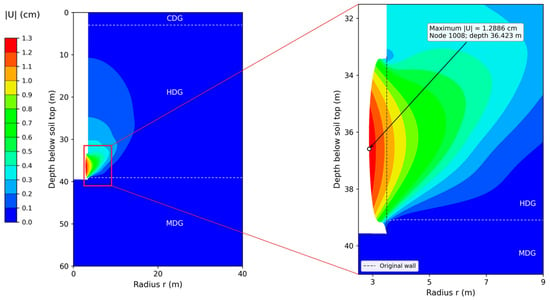
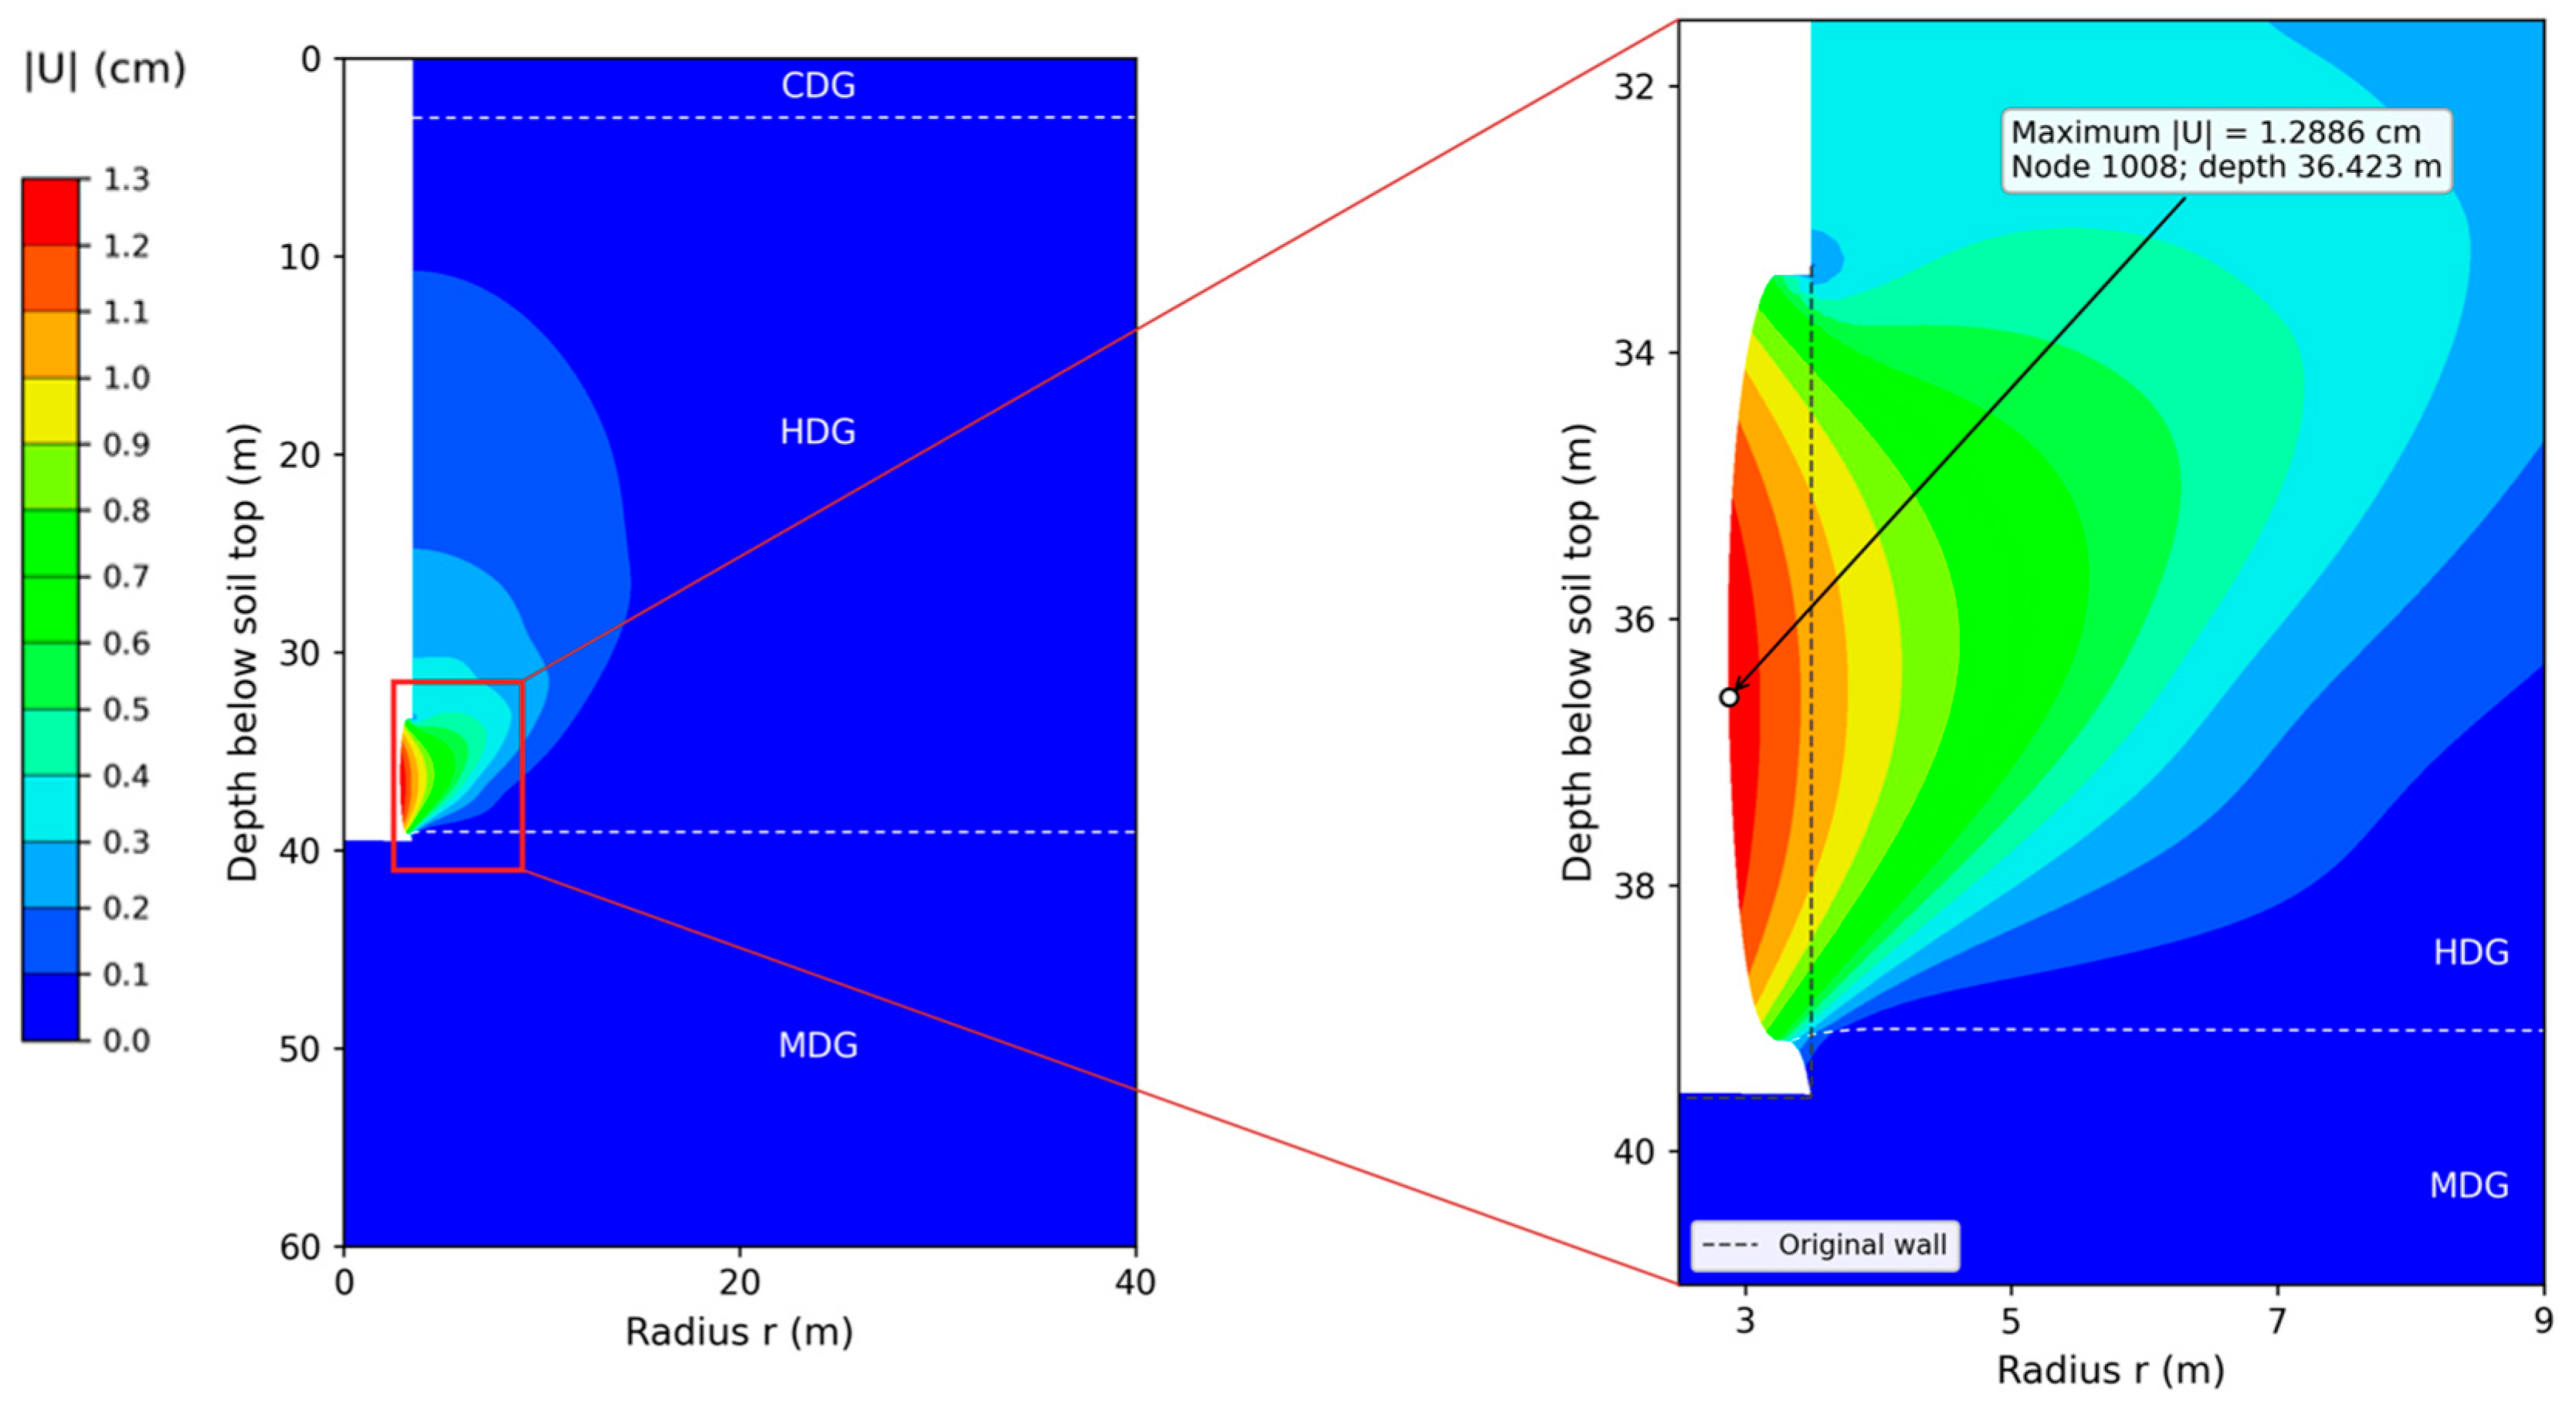
Figure 11 shows that deformation is concentrated around the unsupported borehole wall within the HDG below the pile toe. The maximum displacement magnitude reaches approximately 1.29 cm at a depth of 36.4 m below the seabed, near the middle of the exposed HDG segment. Displacement decreases with radial distance from the borehole wall and remains comparatively small in the underlying MDG. This distribution identifies the unsupported HDG section as the principal deformation zone under the adopted excavation and boundary conditions.
Figure 11.
Borehole displacement distribution at the end of the 7-day coupled analysis.
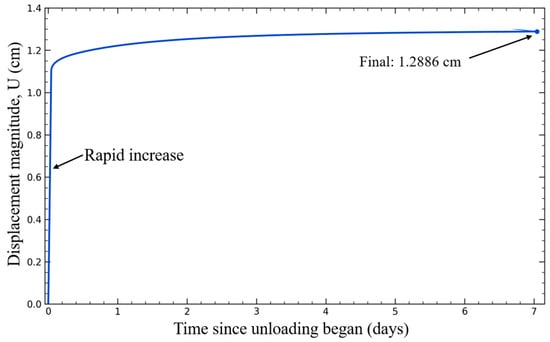
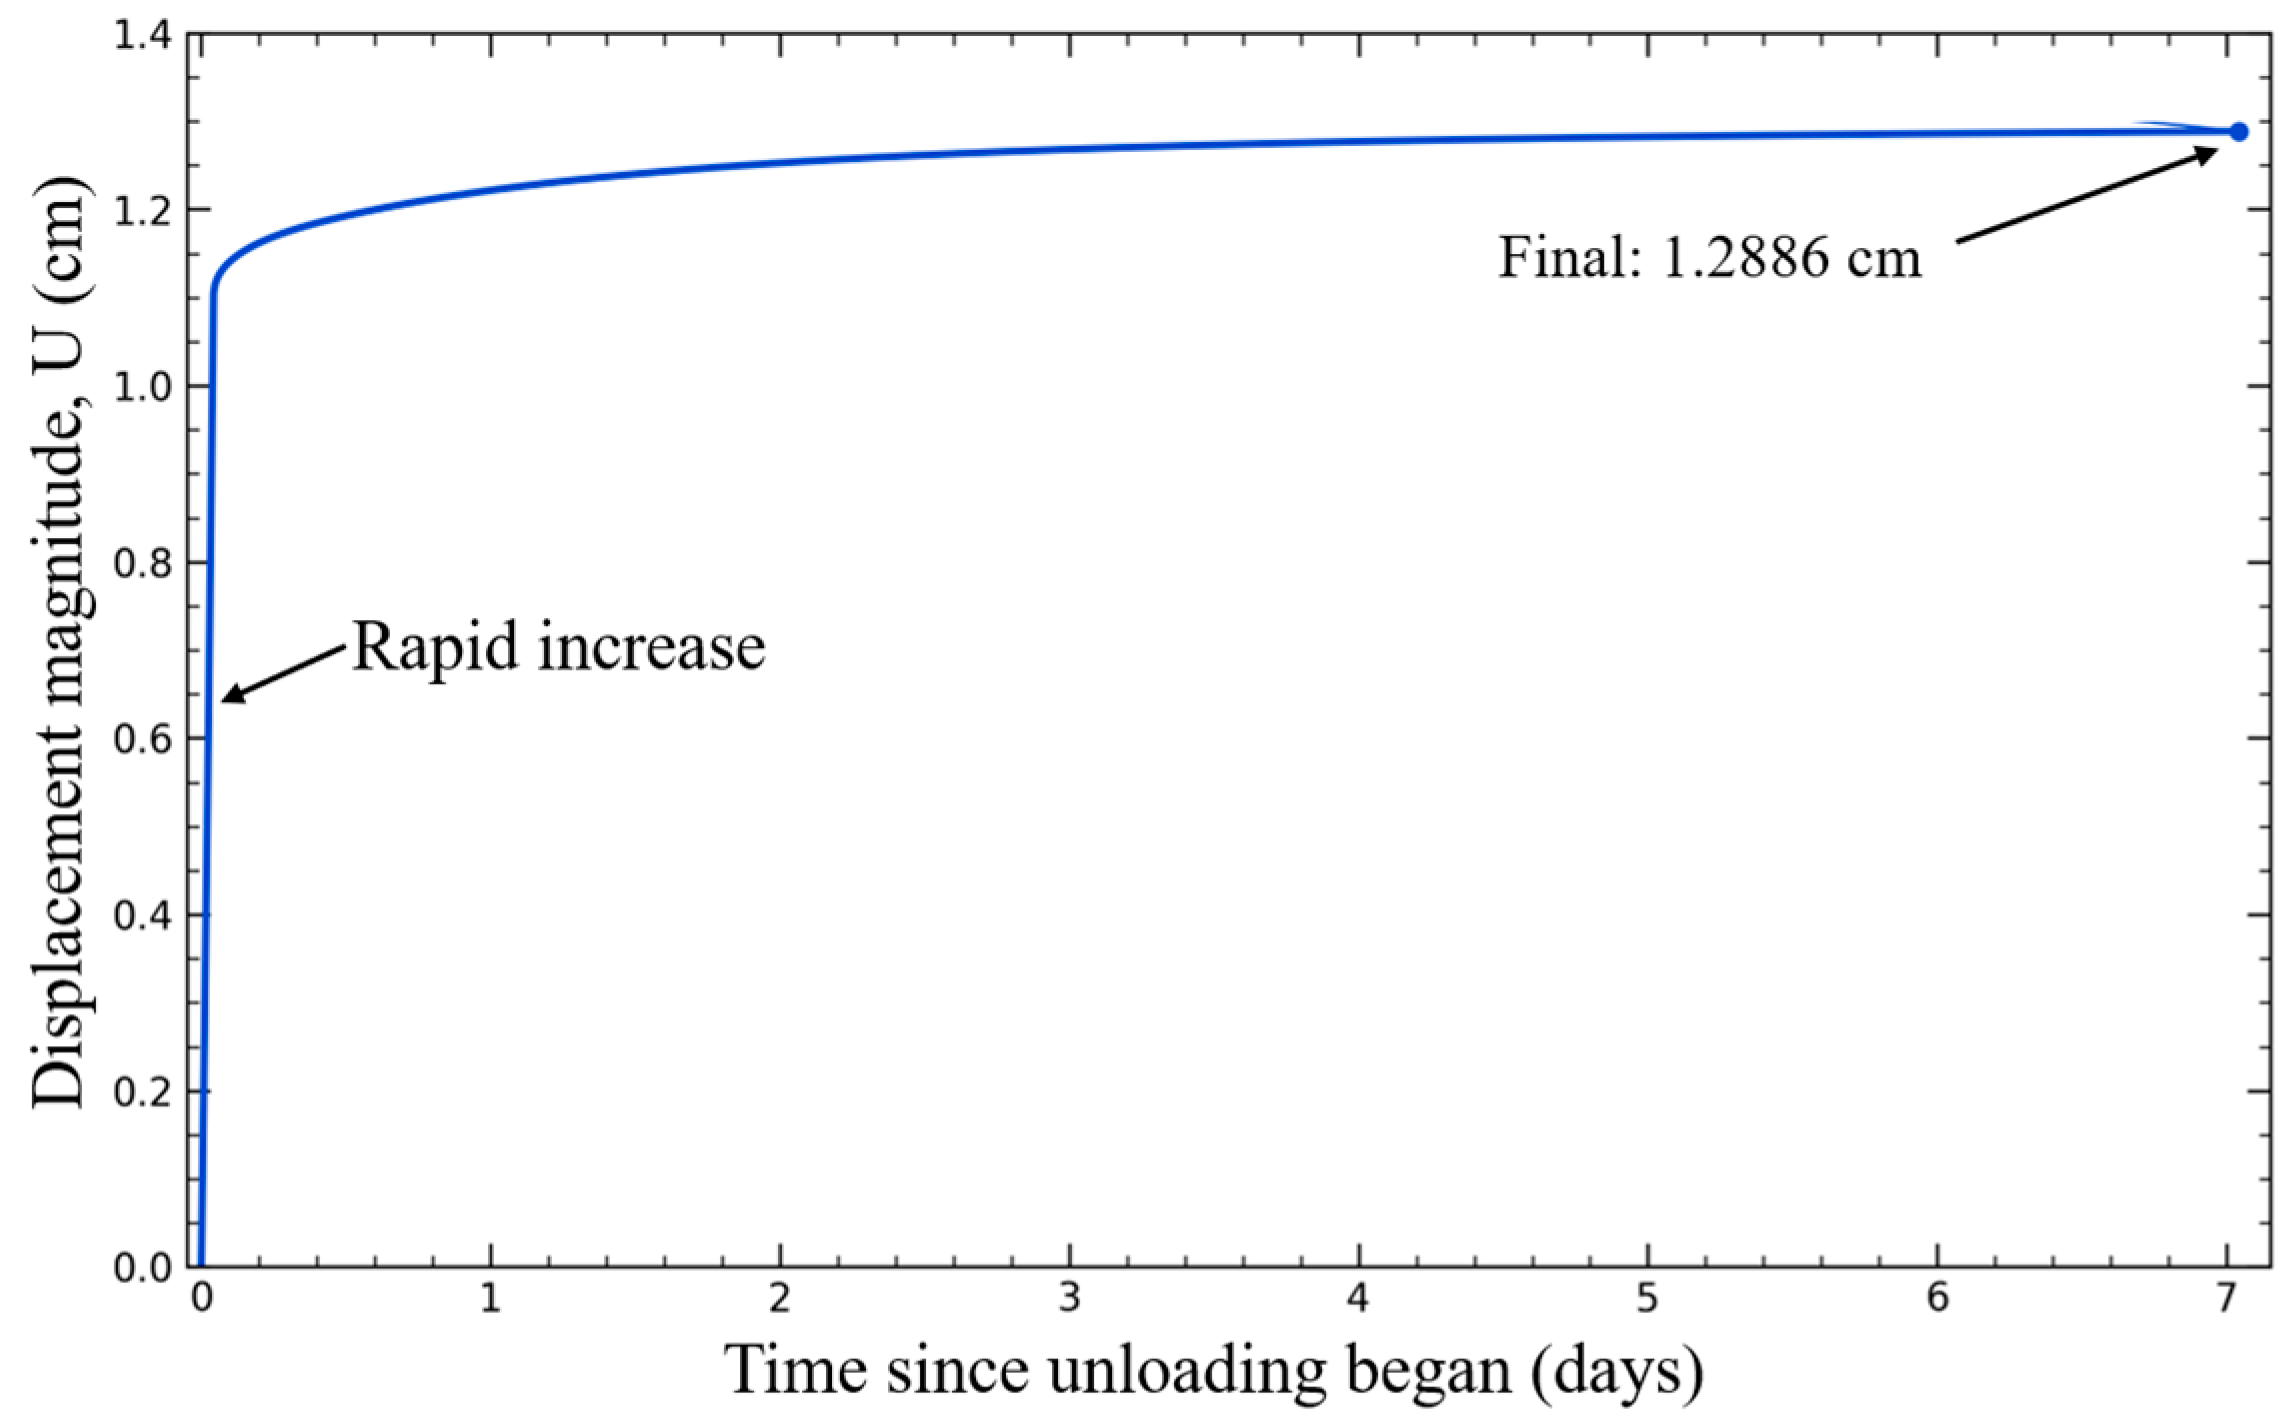
The displacement history in Figure 12 exhibits a rapid initial increase followed by progressively slower growth. Excavation induces an immediate displacement of approximately 1.1 cm, which subsequently increases to approximately 1.22 cm within the first day. By day 7, the displacement reaches 1.2886 cm, with only about 0.07 cm of additional movement developing between days 1 and 7. Approximately 95% of the seven-day displacement therefore accumulates within the first day. These results indicate that borehole wall deformation develops predominantly during excavation and the early post-excavation period, followed by a gradual approach to a stable displacement level over the simulated duration. The rapid development of displacement following excavation is qualitatively consistent with the abrupt strain accumulation observed in the confining-pressure unloading tests. Both responses highlight the sensitivity of HDG deformation to the release of lateral confinement.
Figure 12.
Evolution of borehole wall displacement magnitude during excavation and subsequent coupled analysis.
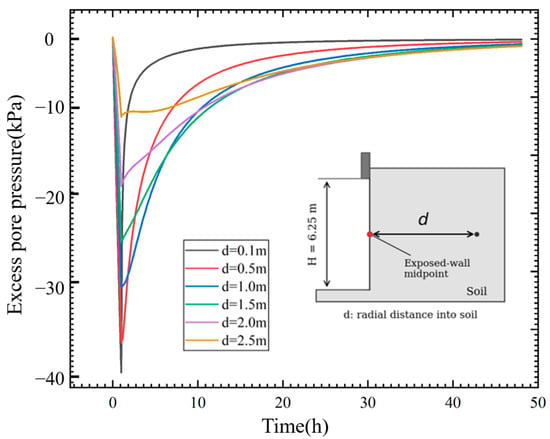
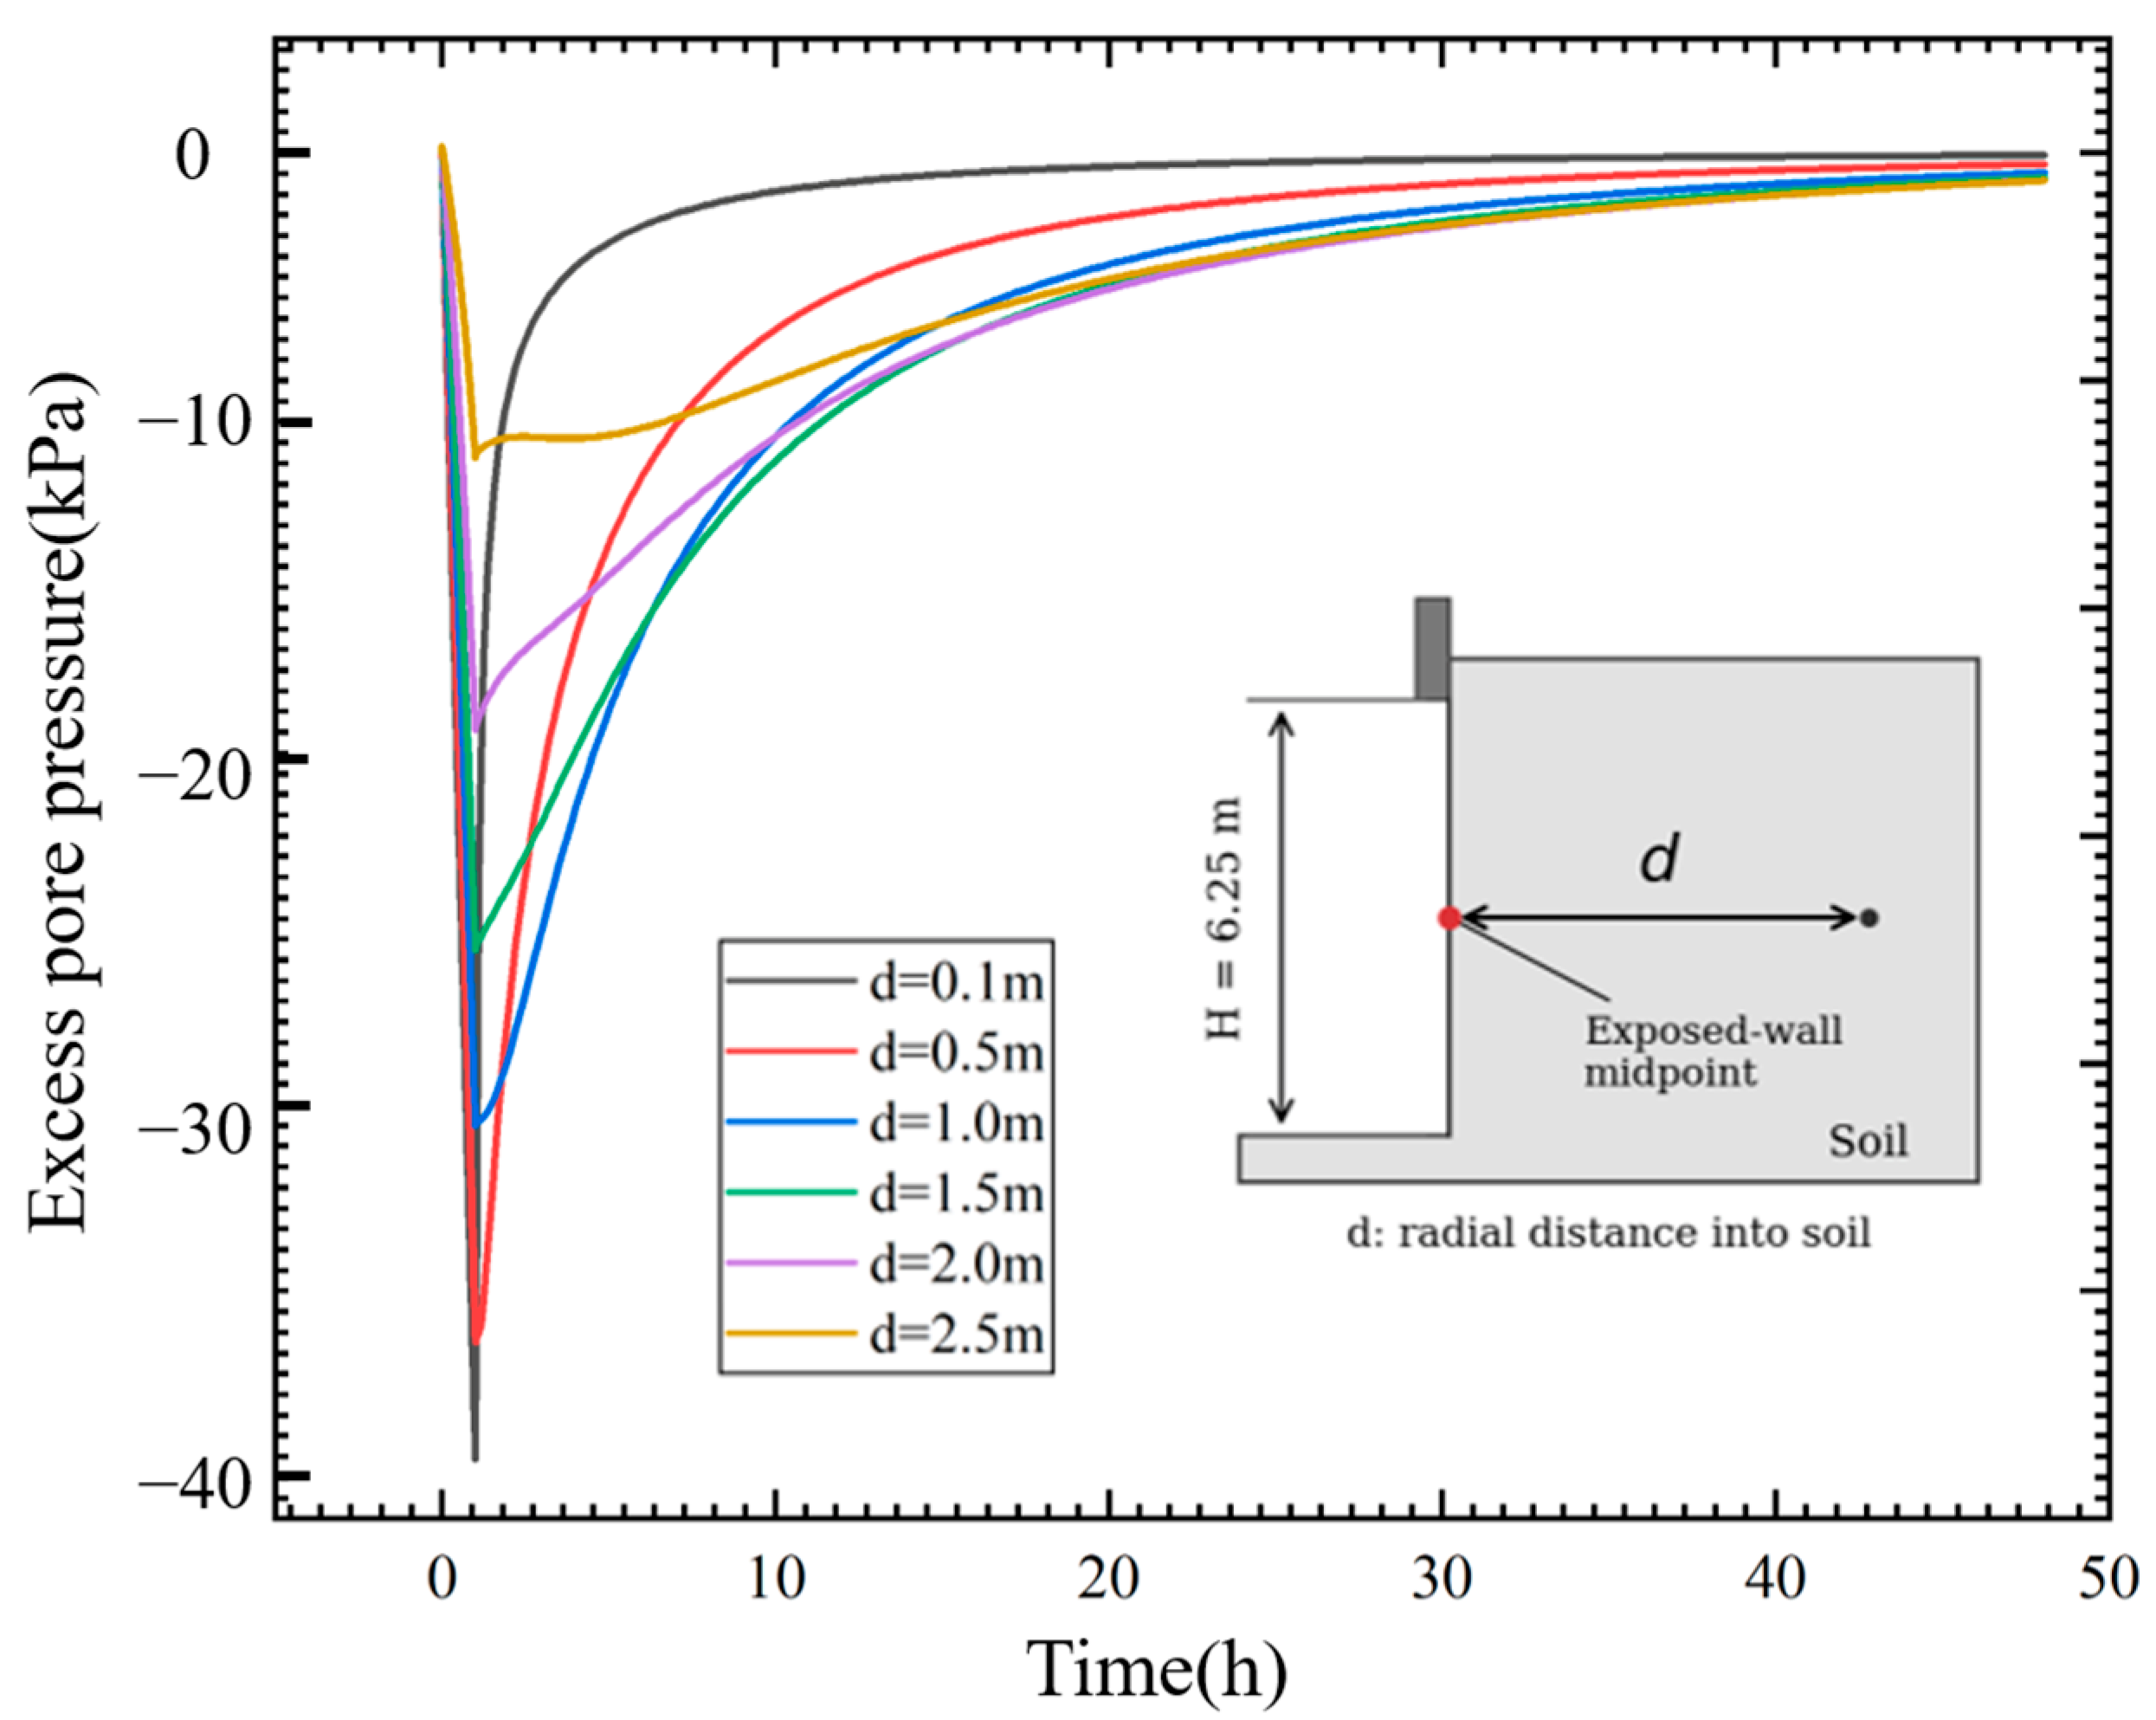
Figure 13 shows the transient excess pore-pressure response under the corrected drainage sequence. Negative excess pore pressures develop during unloading and subsequently dissipate as the surrounding effective stresses redistribute. At the monitoring location 0.10 m from the wall, the minimum value in the 0.10 m mesh is approximately −39.75 kPa. This is a departure from the hydrostatic reference pressure and should not be interpreted directly as tensile absolute water pressure or as an indicator of collapse timing.
Figure 13.
Evolution of excess pore water pressure at different distances from the borehole wall.
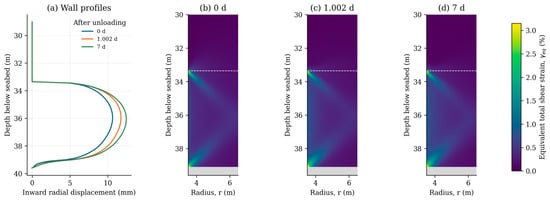
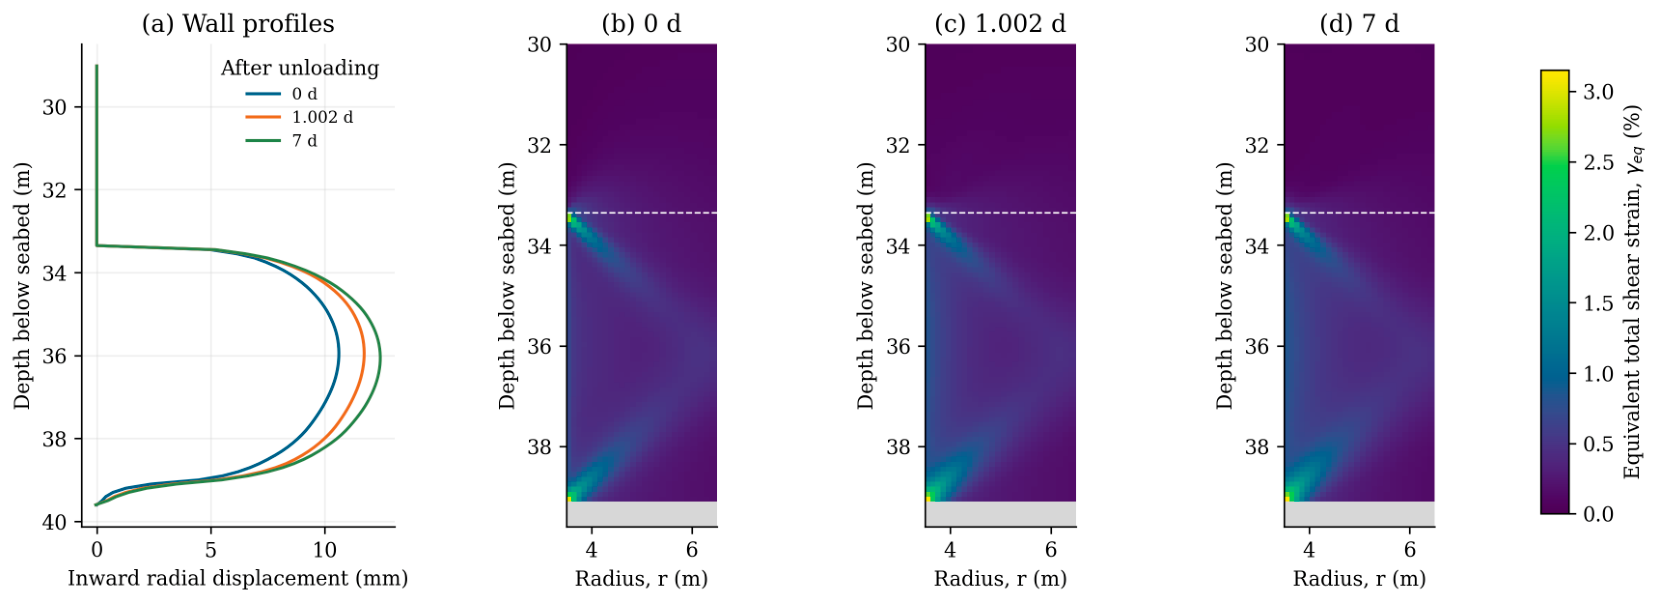
Figure 14 combines wall displacement profiles with equivalent total shear-strain distributions. The largest inward displacement occurs within the exposed HDG segment, whereas elevated shear strains are concentrated near the support termination and excavation base. The displacement and strain fields therefore identify different aspects of the deformation pattern: wall convergence within the unsupported section and stronger local deformation gradients near its ends. The strain contours are used to describe these spatial patterns.
Figure 14.
Evolution of borehole wall deformation and equivalent total shear strain in HDG: (a) inward radial displacement profiles; (b–d) strain distributions at the end of unloading and at approximately 1 d and 7 d after unloading.
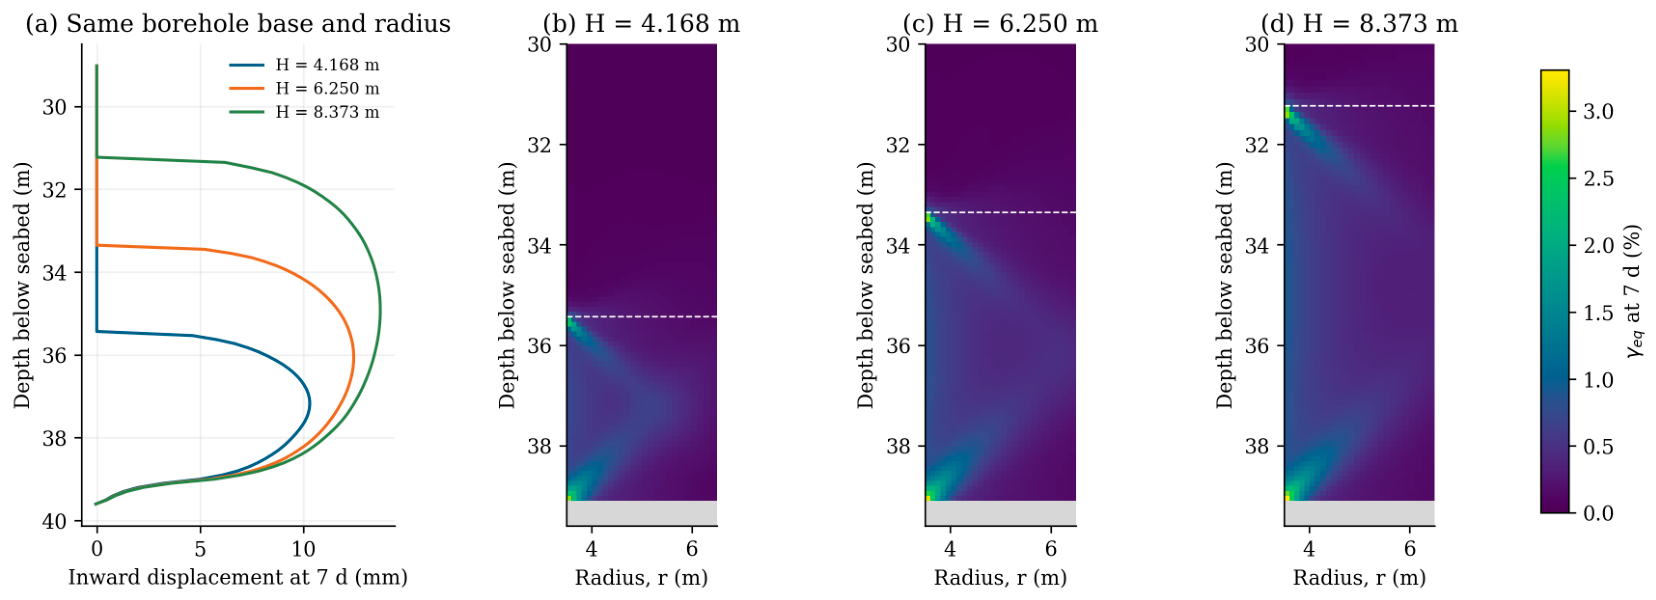
Figure 15 examines the influence of unsupported length at a fixed borehole radius and excavation-base elevation. Increasing H from 4.168 to 6.250 and 8.373 m increases the maximum inward displacement at 7 d from 10.30 to 12.43 and 13.72 mm, respectively. Relative to the reference configuration, shortening H reduces the maximum displacement by approximately 17%, whereas increasing H raises it by approximately 10%. These comparisons provide direct numerical support for limiting unsupported length where installation requirements permit.
Figure 15.
Influence of unsupported length on borehole deformation at 7 d: (a) inward radial displacement profiles; (b–d) equivalent total shear-strain distributions for H = 4.168, 6.250, and 8.373 m, respectively.
4. Discussion
The laboratory results support treating the investigated CDG and HDG as soil-like weathered materials whose responses depend on confinement, inherited structure, and loading history. The unified model provides a common constitutive description of their compression and shear behavior and captures the principal HDG unloading trends using the material parameters established from conventional tests. Its evolving internal variables permit mechanical hardening and softening; the adopted formulation therefore does not assume that the weathered material retains constant shear resistance during deformation. Previous investigations addressed water-induced disintegration [2,3], whereas the present study isolates the mechanical response to confinement release. Chemical alteration and erosion are not represented by the mechanical destructuration law.
The unsupported-length comparison establishes a direct connection between the laboratory-observed sensitivity to confinement loss and a controllable construction parameter. At the investigated borehole radius and base elevation, reducing the unsupported length decreases inward wall deformation. The displacement and strain distributions also distinguish convergence within the exposed segment from concentrated deformation near the support termination and excavation base. These results support maintaining lateral support and limiting unnecessary unsupported exposure. Recommendations concerning smaller drilling diameters, casing, or protective fluids additionally draw on previous studies and construction practice [2,3]; their effectiveness was not quantified by the present length comparison.
The numerical results describe deformation under specified initial stresses, hydraulic properties, and construction boundary conditions. The verification calculations show that maximum wall displacement is less sensitive to mesh refinement than early local pore-pressure extrema and peak shear strain. Accordingly, the strain maps are interpreted as descriptive continuum fields rather than quantitative failure boundaries. The documented field infilling establishes the relevance of the construction problem but does not directly validate radial wall displacement, because detachment and material transport are not simulated. Application to other sites requires local characterization of the weathered materials and construction conditions, while field deformation monitoring and rapid unloading tests would provide further assessment of the numerical predictions.
The approach can inform assessments at other coastal sites with saturated weathered granite, provided that material properties, initial stresses, and construction conditions are characterized locally. The idealized pile restraint, bonded soil–rock interface, and geostatic initial state define the scope of the analysis; preceding pile driving and detailed drilling-fluid processes were not simulated. Hydraulic-conductivity sensitivity analyses showed only minor effects within the examined range, while spatial hydraulic heterogeneity was not represented. Further investigation should prioritize rapid unloading tests, field monitoring of borehole geometry, and explicit soil–pile interaction to evaluate these assumptions and extend the approach to other construction conditions.
5. Conclusions
This study investigated the mechanical responses of decomposed granite through laboratory testing and constitutive simulations, followed by coupled finite element analysis of borehole stability during offshore monopile installation. The main conclusions are as follows:
1. CDG exhibited greater one-dimensional compressibility than HDG, while both materials showed limited rebound during unloading. Drained triaxial shearing produced predominantly strain-hardening responses, with initial contraction followed by dilation at low confinement and predominantly contractive behavior at higher confinement. From HDG to CDG, the calibrated structural degradation parameter (a) decreased from 0.5 to 0.4, whereas the overconsolidation evolution parameter (m) increased from 0.3 to 1.0. These trends indicate slower structural degradation and faster loss of overconsolidation with plastic deformation, consistent with a transition from sand-like toward more clay-like mechanical behavior with increasing weathering.
2. HDG exhibited pronounced sensitivity to the final stage of confinement loss. During unloading from an initial effective confining pressure of 150 kPa, axial strain remained small over most of the unloading path before increasing from approximately 1% to 10% as confinement approached zero. The deviatoric stress peaked at approximately 80 kPa at an axial strain below 5%, followed by slight softening. Retaining the material parameters calibrated from conventional tests reproduced the main unloading trends within the simulated strain range, supporting the model’s applicability to the examined unloading stress path.
3. Under the investigated geometry and corrected loading and drainage sequence, the maximum inward radial wall displacement reached 12.43 mm at 7 d and was concentrated within the unsupported HDG. Elevated shear strains occurred near the support termination and excavation base. These results distinguish wall convergence from local deformation concentration; the strain fields do not define a material-detachment boundary.
4. At a fixed borehole radius and excavation-base elevation, increasing the unsupported length from 4.17 to 8.37 m increased the predicted maximum inward displacement from 10.30 to 13.72 mm. This comparison supports limiting unsupported length during installation where engineering requirements permit. The analyses do not establish a universal safe exposure duration, and application to other sites requires locally characterized material and construction conditions.
Author Contributions
Conceptualization, K.F.; Methodology, Z.H.; Validation, B.S.; Investigation, B.S., Y.Z. and Z.H.; Writing – original draft, H.C.; Writing – review & editing, Y.Z. and K.F.; Funding acquisition, H.C. All authors have read and agreed to the published version of the manuscript.
Funding
This work was supported by the Fundamental Research Funds for the Central Universities (Grant No. B250201159) and Jiangsu Funding Program for Excellent Postdoctoral Talent (Grant No. 2025ZB508).
Data Availability Statement
The original contributions presented in this study are included in the article. Further inquiries can be directed to the corresponding author.
Acknowledgments
This work was supported by the Fundamental Research Funds for the Central Universities (Grant No. B250201159) and Jiangsu Funding Program for Excellent Postdoctoral Talent (Grant No. 2025ZB508). This support is gratefully acknowledged.
Conflicts of Interest
Author Yangpeng Zhang was employed by the company Guangxi Transportation Science and Technology Group Co., Ltd. The remaining authors declare that the research was conducted in the absence of any commercial or financial relationships that could be construed as a potential conflict of interest.
Appendix A. Constitutive Model Formulation
The current stress state on the subloading surface satisfies the following condition:
with
where is the present mean effective stress, = 98.0 kPa is reference stress, is the anisotropic stress tensor, and is an anisotropic state variable. is the deviatoric stress tensor, means the difference between the stress ratio tensor and the anisotropic stress tensor , is a Kronecker function, Cp is a parameter expressed by the compression coefficient , the swelling coefficient is , and is the reference void ratio at a reference stress = 98.0 kPa.
This constitutive model also adopts the associated flow rule, namely:
The compatibility equation for the subloading yield surface is then given by:
In this model, the gradient of critical state line (CSL) is assumed to be invariable, meaning that the CSL in this kind of yield surface does not change with anisotropy. The anisotropic stress tensor is defined by:
where br is a parameter which controls the developing rate of anisotropy, and the plastic deviatoric strain tensor can be calculated by the following equations:
In the original model, the evolution rule for the degree of structure, R*, is a function of the plastic shear strain . However, some experimental studies on natural clays have proved that both the plastic volumetric strain and plastic shear strain can lead to the loss of structure. The new evolution rule proposed by Ye and Ye [26] for the degree of structure, , is defined as:
where a is a parameter controlling the rate of collapse of the structure during shearing,
The changing rate of over-consolidation is assumed to be controlled by two factors, namely, the plastic component of strain and the incremental anisotropy:
where m is a parameter which controls the dissipation rate for over-consolidation, and:
The incremental strain tensor is assumed to be divided into two components, elastic strain and plastic strain, where the elastic component is given by:
Therefore, by substituting Equations (A5) and (A7)–(A11) into Equation (A4), the positive variable can be rewritten as:
where
The loading criteria are given as:
Appendix B. Triaxial and Uniaxial Compression Test Results for MDG
Figure A1.
Triaxial and uniaxial compression test results for MDG: (a) deviatoric stress–axial strain curves at different confining pressures; (b) axial load–axial strain curve under uniaxial compression.
References
- Zhang, J.; Wang, H. Development of offshore wind power and foundation technology for offshore wind turbines in China. Ocean Eng. 2022, 266, 113256. [Google Scholar] [CrossRef] [Scilit]
- Sun, B.; Zhang, Q.; Zhu, W.; Leng, J.; Ye, G. Borehole instability in decomposed granite seabed for rock-socketed monopiles during “drive–drill–drive” construction process: A case study. J. Mar. Sci. Eng. 2023, 11, 990. [Google Scholar] [CrossRef] [Scilit]
- Zhang, Q.; Chai, Y.H.; Zhu, W.X.; Ye, G.L. Numerical study of borehole instability of large diameter monopile during the window period between drilling and pile driving. IOP Conf. Ser. Earth Environ. Sci. 2024, 1330, 012046. [Google Scholar] [CrossRef] [Scilit]
- Yan, B.; Zhu, W.; Gao, B.; Ye, G.; Tian, Y.; Wang, Y. Bearing capacity analysis and mechanism study of shared caisson under multidirectional loading. Ocean Eng. 2024, 301, 117530. [Google Scholar] [CrossRef] [Scilit]
- Yu, X.; Xie, G.; Zhou, H.; Zheng, G.; Hou, Y.; Zhao, J. Calibration of partial factors for the pile efficiency serviceability limit state design in geosynthetic-reinforced and pile-supported embankment. Can. Geotech. J. 2026, 63, 1–21. [Google Scholar] [CrossRef] [Scilit]
- Yu, X.; Zheng, G.; Zhou, H.; Xie, G.; Zhao, J. Reliability analysis for the progressive failure ultimate limit state design in geosynthetic-reinforced rigid pile-supported embankments. Geotext. Geomembr. 2026, 54, 531–548. [Google Scholar] [CrossRef] [Scilit]
- Chiu, C.F.; Ng, C.W.W. Relationships between chemical weathering indices and physical and mechanical properties of decomposed granite. Eng. Geol. 2014, 179, 76–89. [Google Scholar] [CrossRef] [Scilit]
- Rocchi, I.; Coop, M.R. The effects of weathering on the physical and mechanical properties of a granitic saprolite. Géotechnique 2015, 65, 482–493. [Google Scholar] [CrossRef] [Scilit]
- Qiao, J.; Nie, M.; Zhao, Q.; Liu, Q.; Tang, X. The effect of weathering on the mineral grains and macroscale Young’s modulus of granites. Rock. Mech. Rock. Eng. 2024, 57, 5355–5370. [Google Scholar] [CrossRef] [Scilit]
- Wang, Y.; Jia, R.; Li, Y.; Yang, K.; Cui, J.; Shan, Y. Study on the mechanical properties and microscopic evolution mechanisms of weathered granite soil. Sci. Rep. 2024, 14, 24388. [Google Scholar] [CrossRef] [Scilit] [PubMed]
- Sandeep, C.S.; He, H.; Senetakis, K. Experimental and analytical studies on the influence of weathering degree and ground-environment analog conditions on the tribological behavior of granite. Eng. Geol. 2022, 304, 106644. [Google Scholar] [CrossRef] [Scilit]
- Elkamhawy, E.; Wang, H.; Salem, T.N.; Vranay, F.; Zelenakova, M. Soil fabric and transitional behavior in completely decomposed granite: An example of well-graded soil. J. Mar. Sci. Eng. 2021, 9, 1046. [Google Scholar] [CrossRef] [Scilit]
- Zhao, Y.R.; Yang, H.Q.; Huang, L.P.; Chen, R.; Chen, X.S.; Liu, S.Y. Mechanical behavior of intact completely decomposed granite soils along multi-stage loading–unloading path. Eng. Geol. 2019, 260, 105242. [Google Scholar] [CrossRef] [Scilit]
- Liu, X.; Miao, Y.; Zhang, X.; Yin, S. Mechanical behavior of natural granite residual soil in simple shear. J. Geotech. Geoenviron. Eng. 2024, 150, 04024083. [Google Scholar] [CrossRef] [Scilit]
- Yin, S.; Liu, P.; Zhang, X.; He, W.; Yan, P.; Sun, Y. Field testing of shear strength of granite residual soils. J. Rock. Mech. Geotech. Eng. 2024, 16, 3718–3732. [Google Scholar] [CrossRef] [Scilit]
- An, R.; Zhang, X.; Kong, L.; Liu, X.; Chen, C. Drying-wetting impacts on granite residual soil: A multi-scale study from macroscopic to microscopic investigations. Bull. Eng. Geol. Environ. 2022, 81, 447. [Google Scholar] [CrossRef] [Scilit]
- Liu, X.; Zhang, X.; Kong, L.; Wang, G.; Lu, J. Disintegration of granite residual soils with varying degrees of weathering. Eng. Geol. 2022, 305, 106723. [Google Scholar] [CrossRef] [Scilit]
- Liao, L.; Yi, D.; Tan, Y.; Ma, S.; Yang, Y.; Liu, Z. Effect of pore air escape and cement dissolution on granite residual soil disintegration, southeast China. Sci. Rep. 2025, 15, 10422. [Google Scholar] [CrossRef] [Scilit] [PubMed]
- Li, Z.; Lai, J.; Wang, M.; Qiu, J.; Zan, W. Collapse mechanism and treatments of a deep tunnel in the weathered granite fault zone. Tunn. Undergr. Space Technol. 2024, 152, 105891. [Google Scholar] [CrossRef] [Scilit]
- Shu, R.; Kong, L.; Li, T.; Jian, T.; Zhou, Z. Accumulated plastic deformation behavior of granite residual soil under cyclic loading considering the influence of initial unloading. Transp. Geotech. 2023, 41, 101004. [Google Scholar] [CrossRef] [Scilit]
- Abdulhadi, N.O.; Germaine, J.T.; Whittle, A.J. Experimental study of wellbore instability in clays. J. Geotech. Geoenviron. Eng. 2011, 137, 766–776. [Google Scholar] [CrossRef] [Scilit]
- Grubben, T.M.; Koulidis, A.; Bloemendal, M.; Hartog, N.; Muraro, S.; Vardon, P.J. The role of shear dilation in the stability of boreholes in unconsolidated sands. Geomech. Energy Environ. 2026, 48, 100890. [Google Scholar] [CrossRef] [Scilit]
- Hashemi, S.S.; Momeni, A.A.; Melkoumian, N. Investigation of borehole stability in poorly cemented granular formations by discrete element method. J. Pet. Sci. Eng. 2014, 113, 23–35. [Google Scholar] [CrossRef] [Scilit]
- Detournay, E.; Cheng, A.H.-D. Poroelastic response of a borehole in a non-hydrostatic stress field. Int. J. Rock. Mech. Min. Sci. Geomech. Abstr. 1988, 25, 171–182. [Google Scholar] [CrossRef] [Scilit]
- Zhang, F.; Ye, B.; Noda, T.; Nakano, M.; Nakai, K. Explanation of cyclic mobility of soils: Approach by stress-induced anisotropy. Soils Found. 2007, 47, 635–648. [Google Scholar] [CrossRef] [Scilit]
- Ye, G.L.; Ye, B. Investigation of the overconsolidation and structural behavior of Shanghai clays by element testing and constitutive modeling. Undergr. Space 2016, 1, 62–77. [Google Scholar] [CrossRef] [Scilit]
- Asaoka, A.; Nakano, M.; Noda, T. Superloading yield surface concept for highly structured soil behavior. Soils Found. 2000, 40, 99–110. [Google Scholar] [CrossRef] [Scilit] [PubMed]
- Hashiguchi, K. Constitutive equations of elastoplastic materials with elastic-plastic transition. ASME J. Appl. Mech. 1980, 47, 266–272. [Google Scholar] [CrossRef] [Scilit]
- Sekiguchi, H. Induced anisotropy and time dependency in clays. In Constitutive Equations of Soils (In Proceedings of the Ninth International Conference on Soil Mechanics and Foundation Engineering, Tokyo, Japan, July 1977); Japanese Society of Soil Mechanics and Foundation Engineers: Tokyo, Japan, 1977; pp. 229–238. [Google Scholar]
- Cai, H.; Zhu, W.; Zhang, Q.; Ye, G.L.; Shen, Y. Influence of sampling disturbance and laboratory reconsolidation procedures on soils with varying plasticity. J. Rock. Mech. Geotech. Eng. 2026, 18, 7396–7410. [Google Scholar] [CrossRef] [Scilit]
- Cai, H.; Shen, Y.; Ye, G.; Fan, K.; Feng, J. Forthcoming. A Multiscale Experimental and Constitutive Study of Silt-Clay Transition Soils. Int. J. Geomech. 2026, 26, 04026248. [Google Scholar] [CrossRef] [Scilit]
- Hoek, E.; Brown, E.T. The Hoek–Brown failure criterion and GSI–2018 edition. J. Rock. Mech. Geotech. Eng. 2019, 11, 445–463. [Google Scholar] [CrossRef] [Scilit]
- Asaoka, A.; Noda, T.; Yamada, E. An elasto-plastic description of two distinct volume change mechanisms of soils. Soils Found. 2002, 42, 47–57. [Google Scholar] [CrossRef] [Scilit] [PubMed]

Disclaimer/Publisher’s Note: The statements, opinions and data contained in all publications are solely those of the individual author(s) and contributor(s) and not of MDPI and/or the editor(s). MDPI and/or the editor(s) disclaim responsibility for any injury to people or property resulting from any ideas, methods, instructions or products referred to in the content. |
© 2026 by the authors. Licensee MDPI, Basel, Switzerland. This article is an open access article distributed under the terms and conditions of the Creative Commons Attribution (CC BY) license.