


Abstract
Existing coupled fire–structure analyses for ships generally rely on idealised models with regular breaches and uniform material properties, neglecting heat-affected zone (HAZ) degradation at the breach edges (a term used here in a generalised sense), while the coupled stress mechanism remains poorly understood. In this study, large-eddy simulation with the Fire Dynamics Simulator (FDS) is combined with a sequentially coupled thermal–structural analysis in Abaqus. Equal-area breach models with a degraded HAZ band quantify the individual and coupled effects of HAZ degradation and breach-shape irregularity. The HAZ raises the stress concentration factor (Kt) by approximately 16% and shifts the peak stress location from the geometric corners to the weakened annular band. Under equal-area conditions, the combined HAZ and irregular polygon effects elevate Kt by about 71% relative to a rectangular breach without an HAZ, about 8% higher than the multiplicative superposition estimate. This synergy is significant only for highly irregular breaches with sharp re-entrant corners, whereas weakly irregular shapes conform to the independent-product assumption. An approximately linear relation between the shape irregularity index and Kt over nine equal-area shapes supports first-order screening estimates. The findings provide a screening framework for prioritising repair of fire-damaged ship cabins that remain within the elastic regime.
1. Introduction
Ship and offshore structures face a variety of fire hazards throughout their service life, including pool fires in machinery spaces, galley fires, and fires triggered by collision or battle damage. Fire is widely recognised as one of the most severe and least reversible accident scenarios for marine structures because elevated temperatures degrade the stiffness and strength of structural steel and can trigger large deformation or progressive collapse [1,2].
Coupled fire–structure simulation has become the dominant tool for predicting the response of steel structures under fire. Woo and Seo [1] developed a two-way coupled FDS–ANSYS procedure based on the Fire-Thermomechanical Interface (FTMI) model and applied it to an H-section steel member exposed to a propane fire, demonstrating that two-way interaction improves the prediction of non-linear deformation. Prieler et al. [2] established a one-way coupled computational fluid dynamics (CFD)–finite-element framework for virtual fire-resistance testing and applied it to a three-parted steel door tested in a standard fire-resistance furnace, showing that the thermal boundary delivered by the fire model governs the accuracy of the subsequent mechanical analysis. Guo et al. [3] applied a coupled FDS–Abaqus workflow to predict the residual strength and structural response of a full-sized multi-chamber ship cabin under fire for different ignition locations and heat release rates, while Zong et al. [4] combined standard fire-resistance furnace tests of ship bulkhead and deck assemblies with Abaqus thermal–structural simulations to evaluate their fire resistance. Choi et al. [5] developed an integrated FDS–Abaqus thermo-mechanical modelling framework for steel–concrete composite structures in fire and showed that the fidelity of the structural analysis depends on how the discrete fire temperature and heat flux fields are approximated and mapped onto the structural surfaces.
Most existing studies, however, treat structural openings as regular rectangles or circles and apply uniform, undamaged material properties. Zhu et al. [6] combined FDS simulations with full-scale tests to examine bulkhead temperatures in ship compartment fires under different ventilation and fire-power conditions, but their bulkhead openings were represented without local damage or heat-affected zone modelling. Tabri et al. [7] assessed the residual ultimate strength of a hull girder with a grounding breach using nonlinear finite-element analysis and demonstrated that the damaged opening governs the loss of hull-girder capacity, yet the breach was idealised as a regular cut-out. The classical elastic stress-concentration solutions of Kirsch [8], Inglis [9], and Peterson [10] show that the peak edge stress is highly sensitive to local curvature and, by extension, to edge irregularity, but these solutions were derived for isothermal mechanical loading rather than fire.
Battle-damaged or collision-damaged ship structures rarely exhibit regular breach boundaries. Kim et al. [11] tested and numerically analysed perforated plates and stiffened panels with openings of different sizes, shapes, and locations under axial compression, and found that opening geometry significantly affects the buckling and ultimate strength, with sharp-corner openings producing localised collapse and elevated stress concentrations at the opening corners. The material immediately surrounding such a breach is also altered: high-strain-rate penetration and the subsequent fire produce a localised heat-affected zone (HAZ) in which the microstructure and mechanical properties differ from those of the base metal. The term HAZ is borrowed from welding and is used here in a generalised sense to denote the fire- and impact-degraded material adjacent to the breach edge; its physical origin differs from that of a welded HAZ, and the two are contrasted in Section 3.2. Unlike the well-characterised HAZ produced by welding, which has been documented extensively [12,13,14,15], the damage zone bordering an impact breach under fire has received little attention, and no validated model currently accounts for its combined thermal and mechanical degradation.
Accordingly, this study aims to establish a sequentially coupled FDS–Abaqus framework for ship cabins with irregular breaches; to quantify the individual and coupled effects of HAZ material degradation and breach-shape irregularity on the stress concentration factor; and to develop a shape irregularity-based empirical relation, supported by prediction intervals and a clearly defined applicability range, for rapid, screening-level residual strength assessment of elastically responding cabins. The remainder of the paper describes the numerical methods and validation, the finite-element model, the fire and stress results, and the statistical analysis, before drawing conclusions.
2. Numerical Methods
2.1. Fire Dynamics Simulator
The fire-driven fluid flow is simulated using FDS (version 6.7.5), a large-eddy-simulation (LES) model developed and maintained by the U.S. National Institute of Standards and Technology (NIST) [16]. FDS solves the low-Mach-number form of the Navier–Stokes equations and treats combustion through a single-step, mixing-controlled reaction together with an eddy-viscosity subgrid-scale turbulence closure. The governing equations, numerical schemes, and input parameters are documented in the FDS User’s Guide [16] and are not repeated here; only the settings relevant to this study are summarised.
The cabin is modelled as a 3 m × 3 m × 3 m compartment with a 1 m × 1 m square opening centred on the front bulkhead; this configuration serves as the baseline (the shape irregularity index I, defined as P2/(4πA), where P is the breach perimeter and A is its area, equals 1.27 for this square opening; see Section 5.5.1 for details). A 1 m × 1 m n-heptane pool fire is located on the floor centreline, with a specified heat release rate per unit area (HRRPUA) of 1000 kW/m2, and the total simulation time is 300 s. The computational domain is discretised using a uniform 0.10 m grid, based on the grid-independence study summarised in Table 1, giving 27,000 cells within the compartment.
Table 1.
Results of the grid-independence study, reported as the peak centreline gas temperature for the grid-study baseline configuration. The values differ from the fully developed upper-layer temperature discussed in Section 4.1 because the two quantities are sampled at different locations and fire stages.
2.2. Sequential Thermal–Structural Coupling
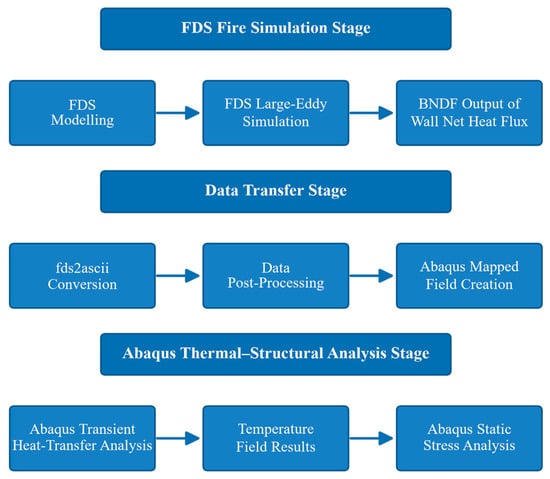
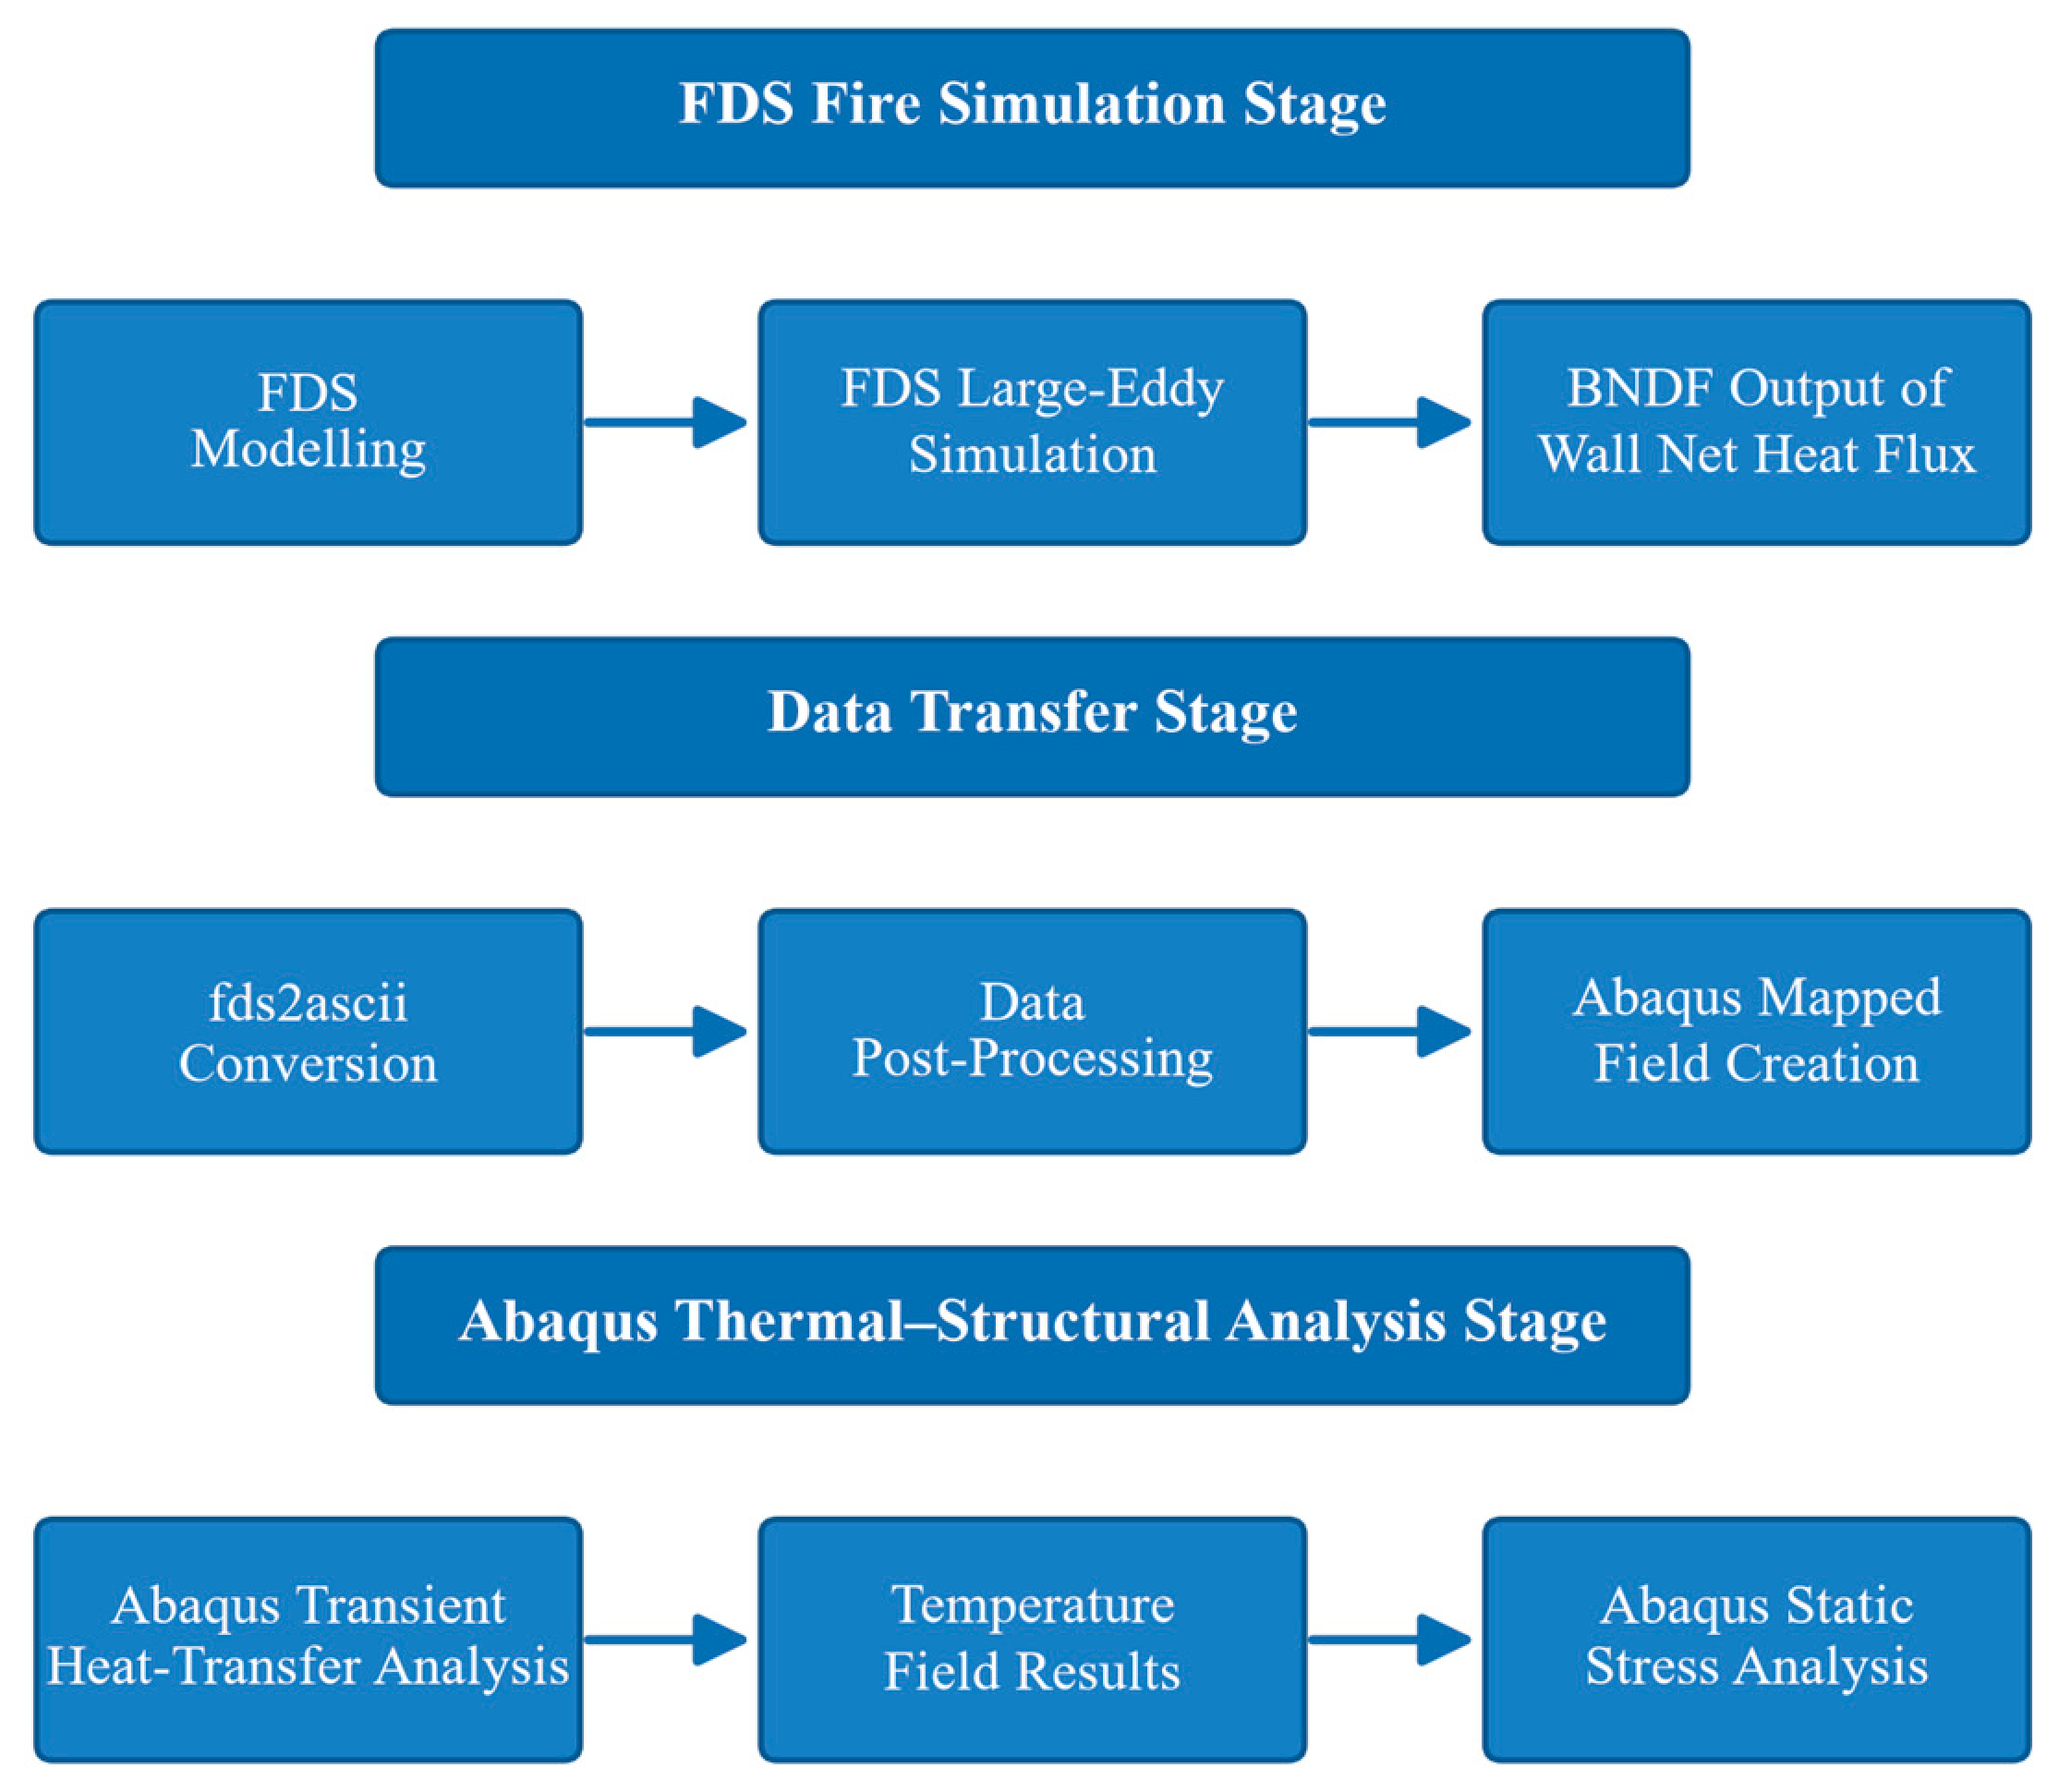
The fire and structural analyses are linked through a one-way sequential (weak) coupling, the workflow of which is shown in Figure 1. FDS first computes the time-resolved temperature and incident heat flux fields; these fields are exported, mapped onto the structural mesh, and used as thermal boundary conditions in the Abaqus heat-transfer analysis; the resulting temperature field is then read into a static stress analysis to obtain the deformation and stress. In this one-way scheme, the structural deformation and the breach opening do not feed back to the fire solver, so the ventilation geometry is held fixed throughout the simulation.
Figure 1.
Workflow of the one-way sequentially coupled FDS–Abaqus analysis.
One-way sequential coupling is appropriate when the structural deformation remains small relative to the compartment dimensions and when the opening area is not appreciably altered during the fire, as is the case for the intact and moderately deformed bulkheads examined here. Benra et al. [17] showed that one-way and two-way partitioned solutions agree closely for small wall deflections but diverge once the deforming boundary changes the flow field.
2.2.1. HAZ Modelling
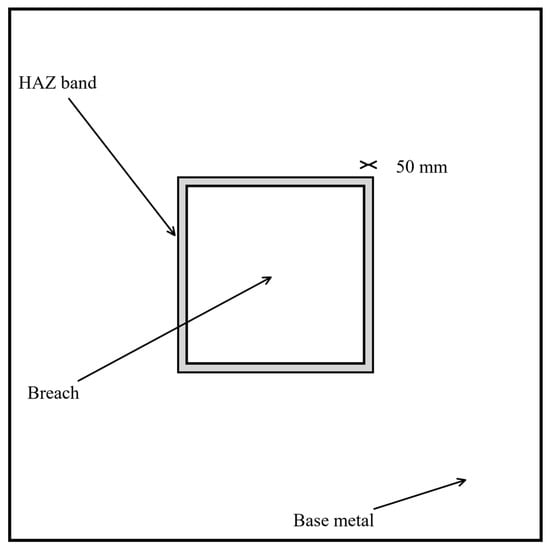
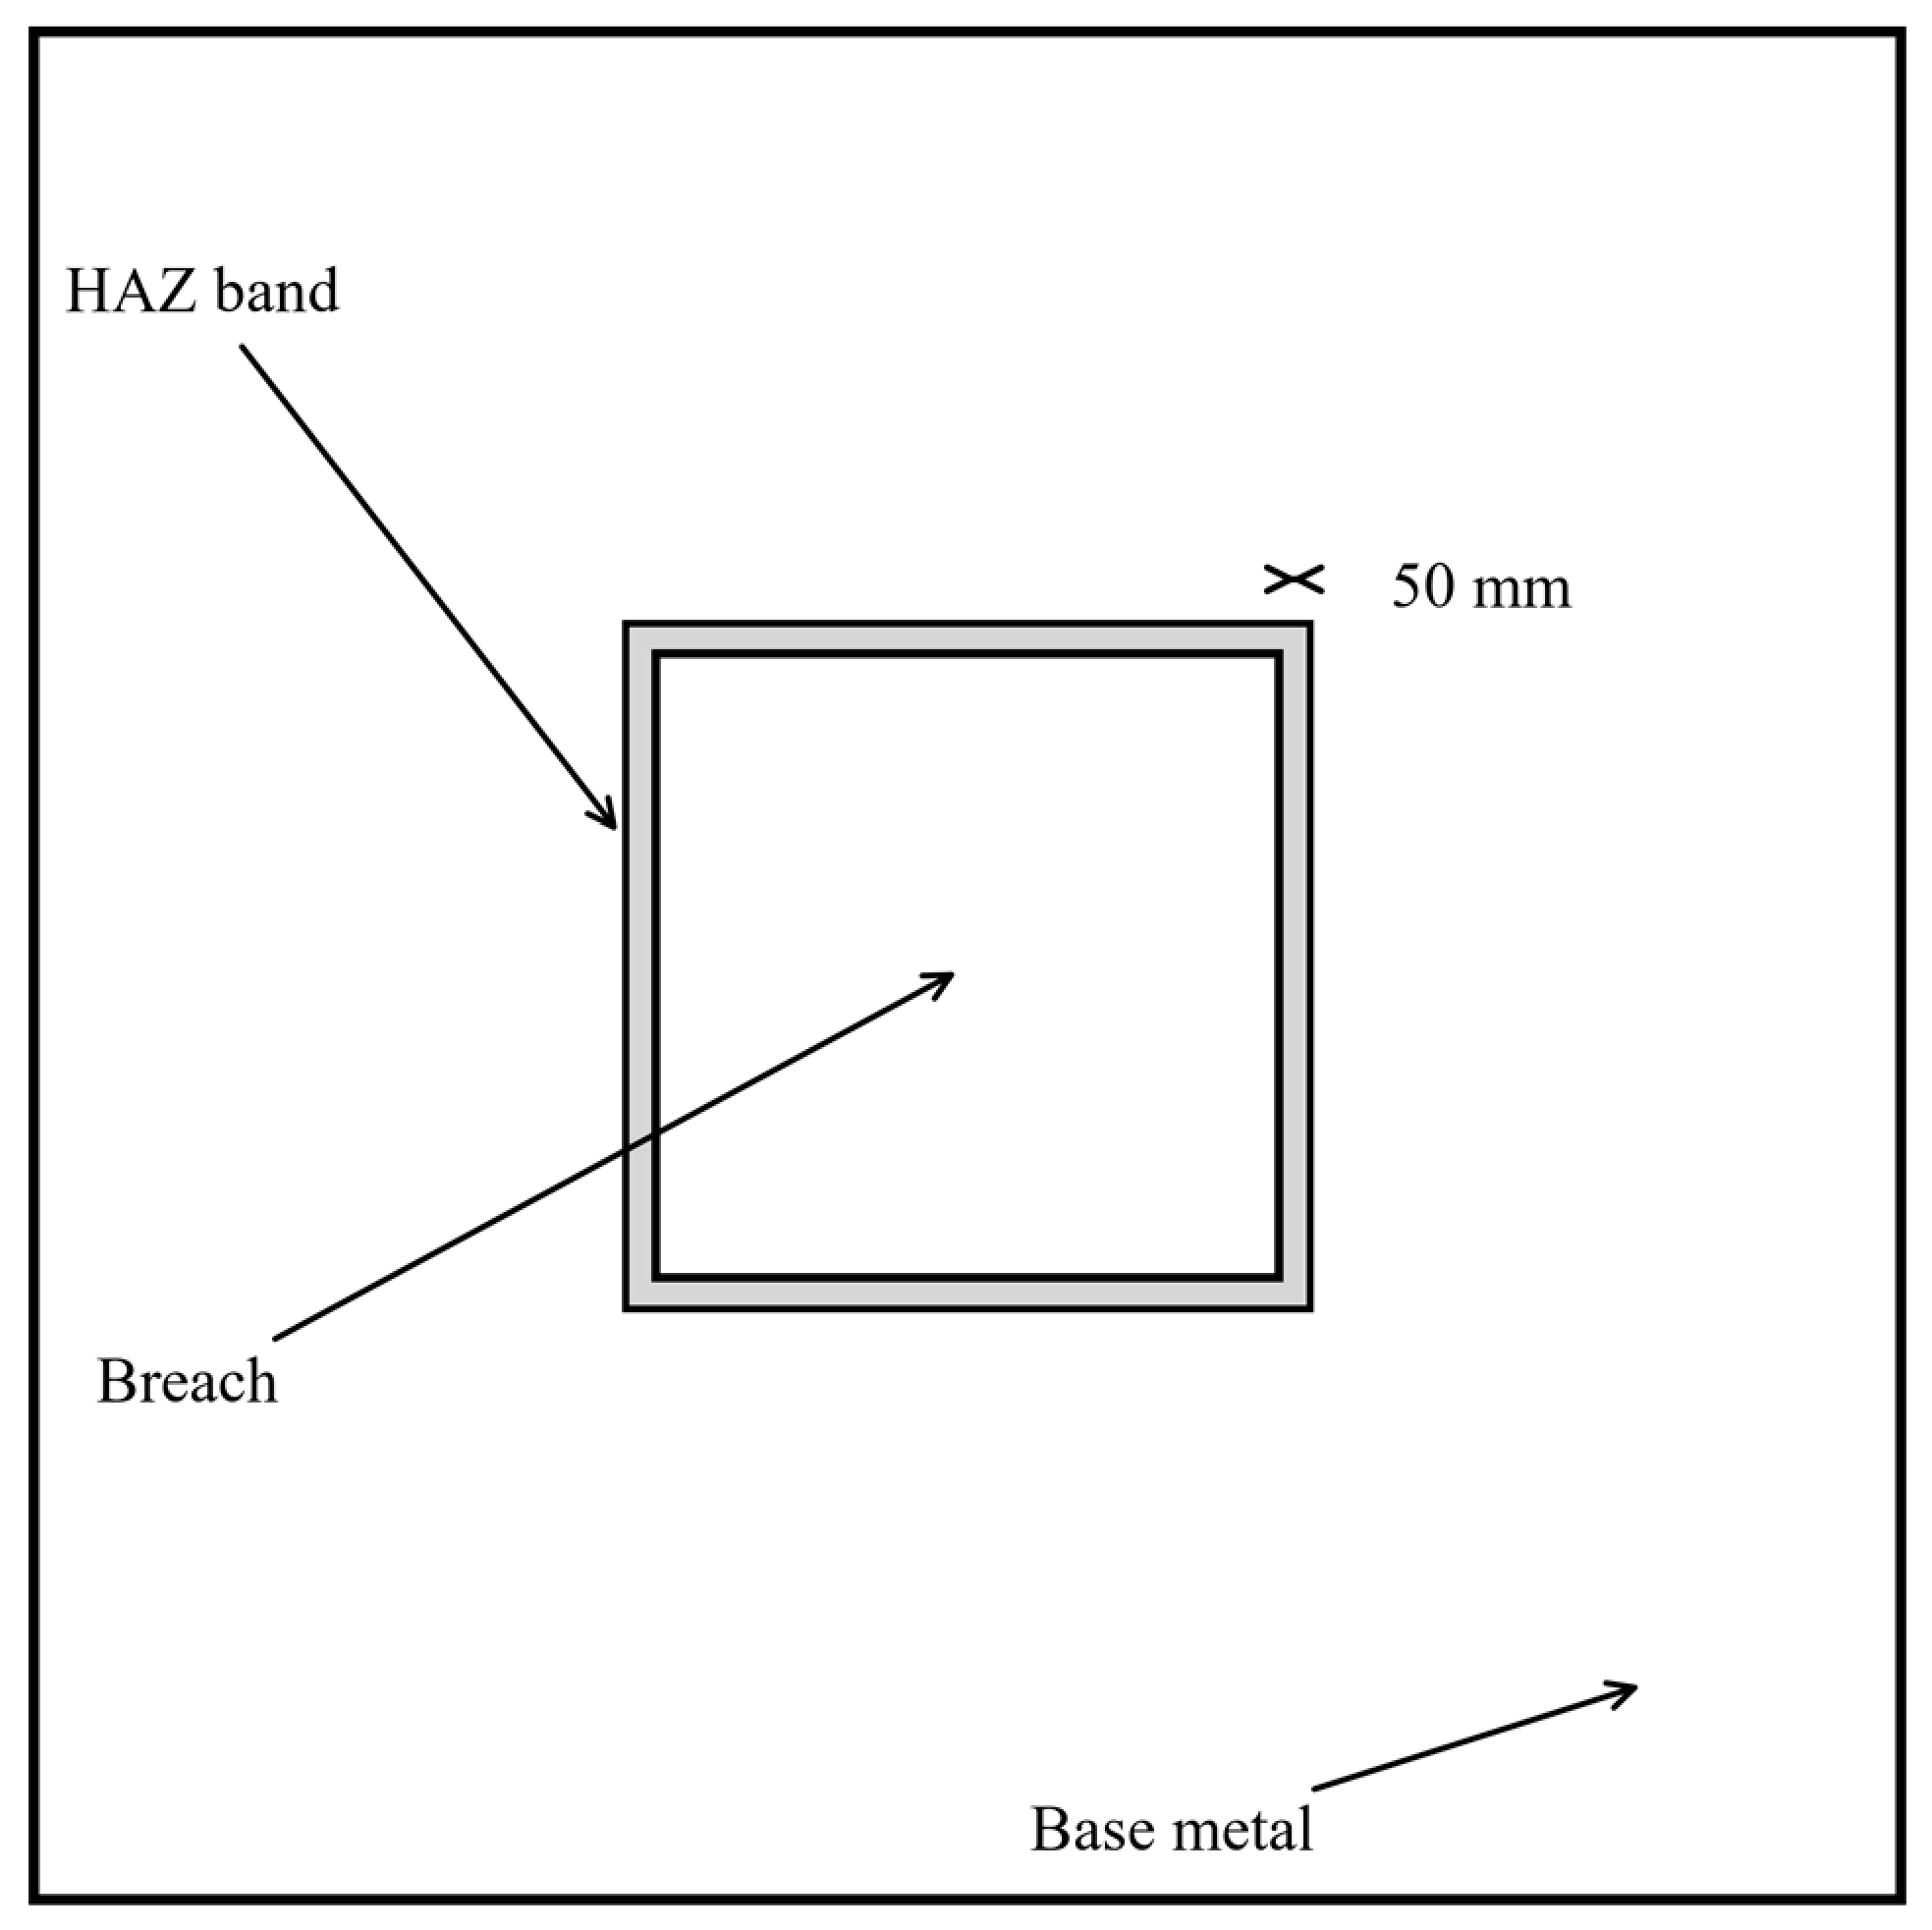
To represent the degraded material bordering a breach, a continuous annular band is created around each opening and assigned a separate material definition. The band is generated in Abaqus (version 2026, Dassault Systèmes, Vélizy-Villacoublay, France) by partitioning the bulkhead face along an offset contour at a constant normal distance from the breach edge, as illustrated in Figure 2. The width of this band is the principal modelling parameter and is discussed below.
Figure 2.
Schematic of the HAZ band surrounding a breach, showing the breach, the 50 mm HAZ band, and the unaffected base metal.
The 50 mm band width is not intended to represent the metallurgical heat-affected zone of a weld. It is defined here as an equivalent damage-envelope width that encloses, in a conservative and computationally tractable manner, the full extent of the material altered by the breach event. Microstructural studies of high-strain-rate penetration indicate that the most intense localised deformation is concentrated in an adiabatic shear band (ASB) only a few tens of micrometres wide. Zatorski [18] examined high-strength bainitic steel perforated by a hard projectile and measured an ASB only 10–40 μm wide, beyond which the material properties returned monotonically toward those of the base material; no distinct heat-affected zone extending over a distance comparable to the plate thickness was detected in the target plate. These measurements show that the metallurgical alteration caused by penetration is highly localised on the micrometre scale; the wider region that governs structural strength is instead controlled by the opening geometry and residual stresses and, in this scenario, by the external fire, which is the principal source of softening in the model. Because the present bulkhead is 10 mm thick and the breach edges are additionally exposed to the external fire, a 50 mm width (five times the plate thickness) is adopted as a conservative engineering envelope covering the opening-adjacent region of residual stresses, geometric irregularity, and fire-induced heating, rather than as a fixed metallurgical width. This choice is examined through a width-sensitivity analysis in Section 5.4.3, which shows that the computed Kt changes by less than 5% for widths between 50 and 100 mm and saturates above 50 mm, confirming that the conclusions are insensitive to the precise envelope width. The 20–100 mm interval examined in that sensitivity analysis therefore brackets the plausible envelope widths without assigning a fixed metallurgical HAZ dimension.
2.2.2. Boundary Conditions
The bulkhead is constrained along its four edges to represent welding to the surrounding structure: all translational degrees of freedom are fixed on the perimeter. These boundary conditions reproduce the high degree of redundancy of a real cabin bulkhead while allowing thermal expansion to develop self-equilibrating stresses.
2.3. Heat Flux Mapping
The incident heat flux and surface-temperature time histories are extracted from FDS using the fds2ascii utility, which samples the fire solution on a regular array of virtual gauges over each solid surface. The sampled data are read into Abaqus through a mapped analytical field and interpolated onto the structural mesh, which is substantially finer than the fire grid. The mapping error, evaluated by comparing the integrated heat flux before and after interpolation, is below 1% for all surfaces. Zhu et al. [6] reported comparable agreement between simulated and measured bulkhead temperatures in full-scale ship fire tests.
2.4. Validation
The numerical framework is validated at three levels: the fire solution, the elastic stress concentration, and the elevated-temperature structural response.
2.4.1. Fire Validation
The FDS model is validated against the full-scale compartment-burn experiments reported in the FDS Validation Guide [19], which include n-heptane pool fires with geometries and ventilation similar to those used here. The predicted upper-layer temperature and heat flux are compared with the experimental envelopes; the peak temperatures fall within ±10% and the time to flashover within ±15%, which is consistent with the accuracy reported for FDS in compartment-fire validation.
2.4.2. Elastic Stress Concentration
The structural model is first validated for isothermal loading against the classical stress-concentration solutions compiled by Peterson [10]. Plates with a circular and a square opening under remote tension are modelled using the same element type and mesh density, and the computed concentration factors (3.02 for a circular hole and 2.55 for a square opening at a width ratio of 0.2) agree with the Kirsch [8] and Peterson [10] reference values within 2%.
2.4.3. Elevated-Temperature Response
The thermal-to-structural transfer is checked in two stages. The predicted member temperature field is compared against the restrained compact steel-member simulations of Yan and Gernay [20], in which a loaded compact steel member was exposed to a localised fire and the steel-temperature evolution was recorded; transferring their thermal field into the structural analysis reproduces the reported temperature evolution and peak temperatures, confirming that the sequential procedure maps the thermal boundary and temperature field onto the structural mesh correctly. For the mechanical response, the development of thermally induced axial restraint force and the loss of stability are compared qualitatively with the 168 hinged-column furnace tests of Rodrigues et al. [21], in which compressed steel bars with four slenderness values, two load eccentricities, and six levels of axial restraint were heated to failure; the simulations reproduce the reported behaviour, in which a restraint force rises during constrained heating and then decays at the critical buckling temperature, including the reduction in the critical temperature with increasing axial restraint stiffness. Because the present cabin model does not include a surrounding restraining frame, the restraint stiffness and end conditions of those tests are not reproduced directly; the comparison verifies only the thermal-to-structural data transfer and the qualitative restrained-buckling response, and the cabin-level conclusions of Section 5 are drawn from relative comparisons between breach configurations with identical boundary conditions.
2.4.4. Transferability of the Validation Cases
The validation cases differ from the cabin-breach problem in geometry, scale, and loading, so their transferability must be qualified rather than assumed. Table 2 compares the validation cases with the cabin model and summarises the assessed transferability.
Table 2.
Geometric and loading differences between the validation cases and the cabin-breach model, and the assessed transferability of the validation evidence.
The stress concentration factor is governed by local edge geometry and is essentially scale-insensitive, so the elastic validation of Section 2.4.2 transfers directly to the breach edges. By contrast, the fire validation represents a localised pool fire on a compact member rather than a post-flashover compartment fire with spatially graded heating, and the structural validation uses well-defined pinned ends rather than the multi-bay continuity of a welded bulkhead; these differences affect the absolute stress magnitude and the post-buckling response but not the Kt–irregularity trend, which is the central result of this study. The interaction between adjacent damaged bays is not covered by the validation cases and is identified as a limitation.
3. Finite-Element Modelling
3.1. Geometry and Breach Shapes
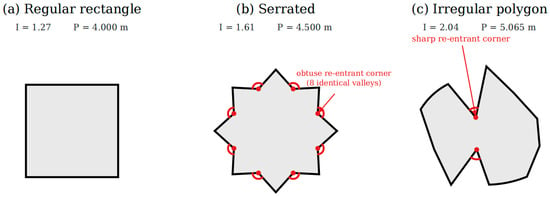
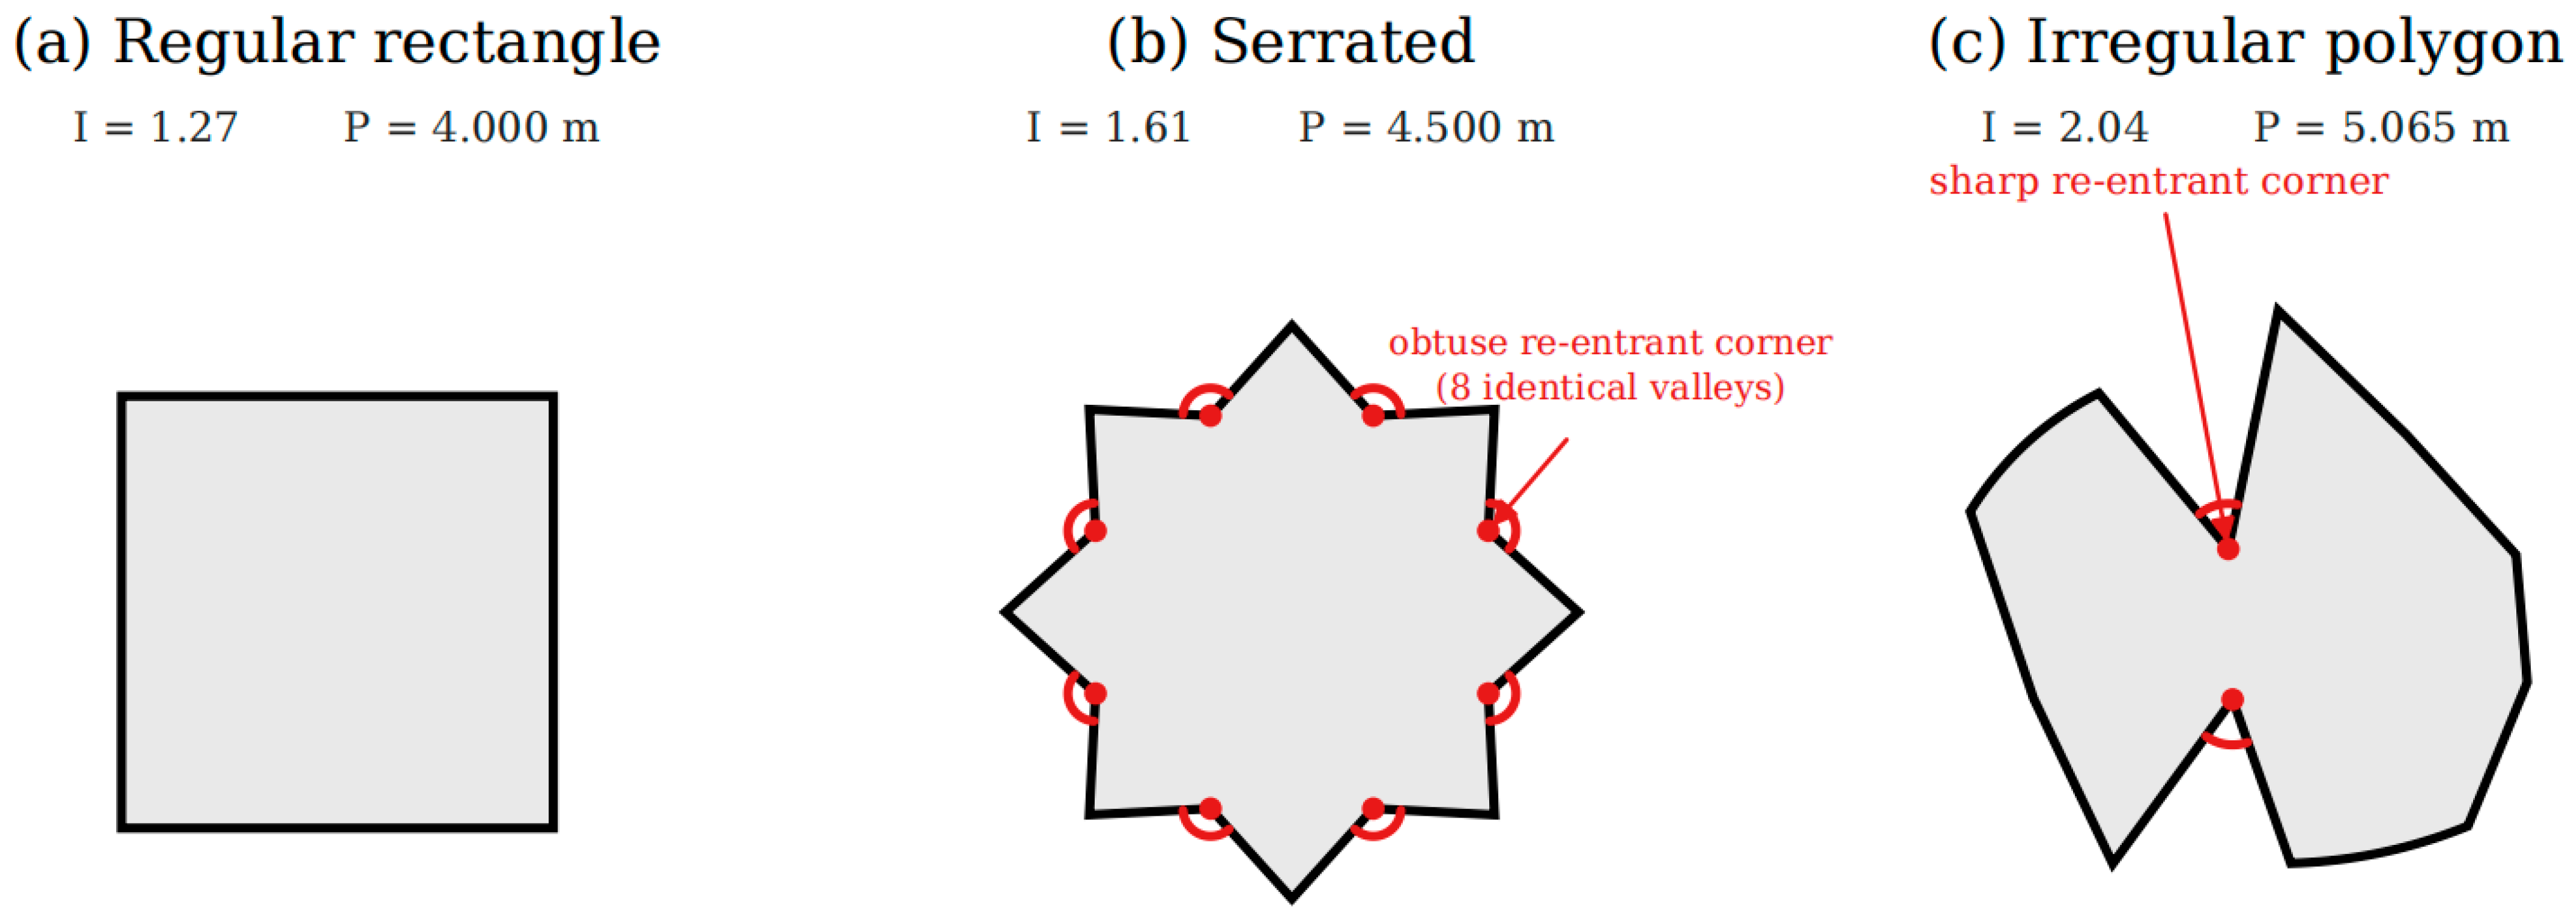
The structural model represents a three-dimensional cabin 3 m long, 3 m wide, and 3 m tall. The bulkhead plate is 10 mm thick. Three principal equal-area breach shapes are cut through the centre of the front bulkhead plate: a regular rectangle, a serrated shape, and an irregular polygon. Their geometric characteristics are listed in Table 3 and shown in Figure 3.
Table 3.
Geometric characteristics of the three principal equal-area breach models.
Figure 3.
The three principal equal-area breach shapes.
All three breaches have the same nominal area (1.0 m2) and are centred at the same location, so the effect of shape can be isolated from that of area. The regular rectangle has four right-angle corners and straight edges; the serrated shape consists of eight periodic triangular teeth with alternating obtuse re-entrant corners; and the irregular polygon has twelve unequal sides, several sharp re-entrant corners, and locally curved edges, reproducing the torn boundary of a real impact breach.
3.2. HAZ Characterisation
The bulkhead is discretised using four-node reduced-integration shell elements (S4R) with a characteristic size of 0.01 m in the breach region, giving 11 section integration points through the thickness to resolve the temperature gradient across the shell. A mesh-sensitivity analysis confirms that refining the breach-edge mesh below 0.01 m changes the peak stress by less than 2%. The HAZ band and the base metal share this mesh so that the temperature and stress fields are continuous across the band boundary.
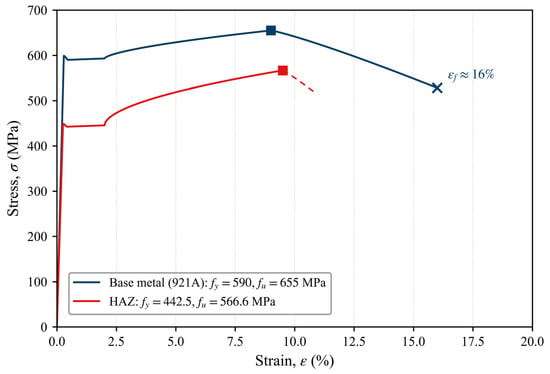
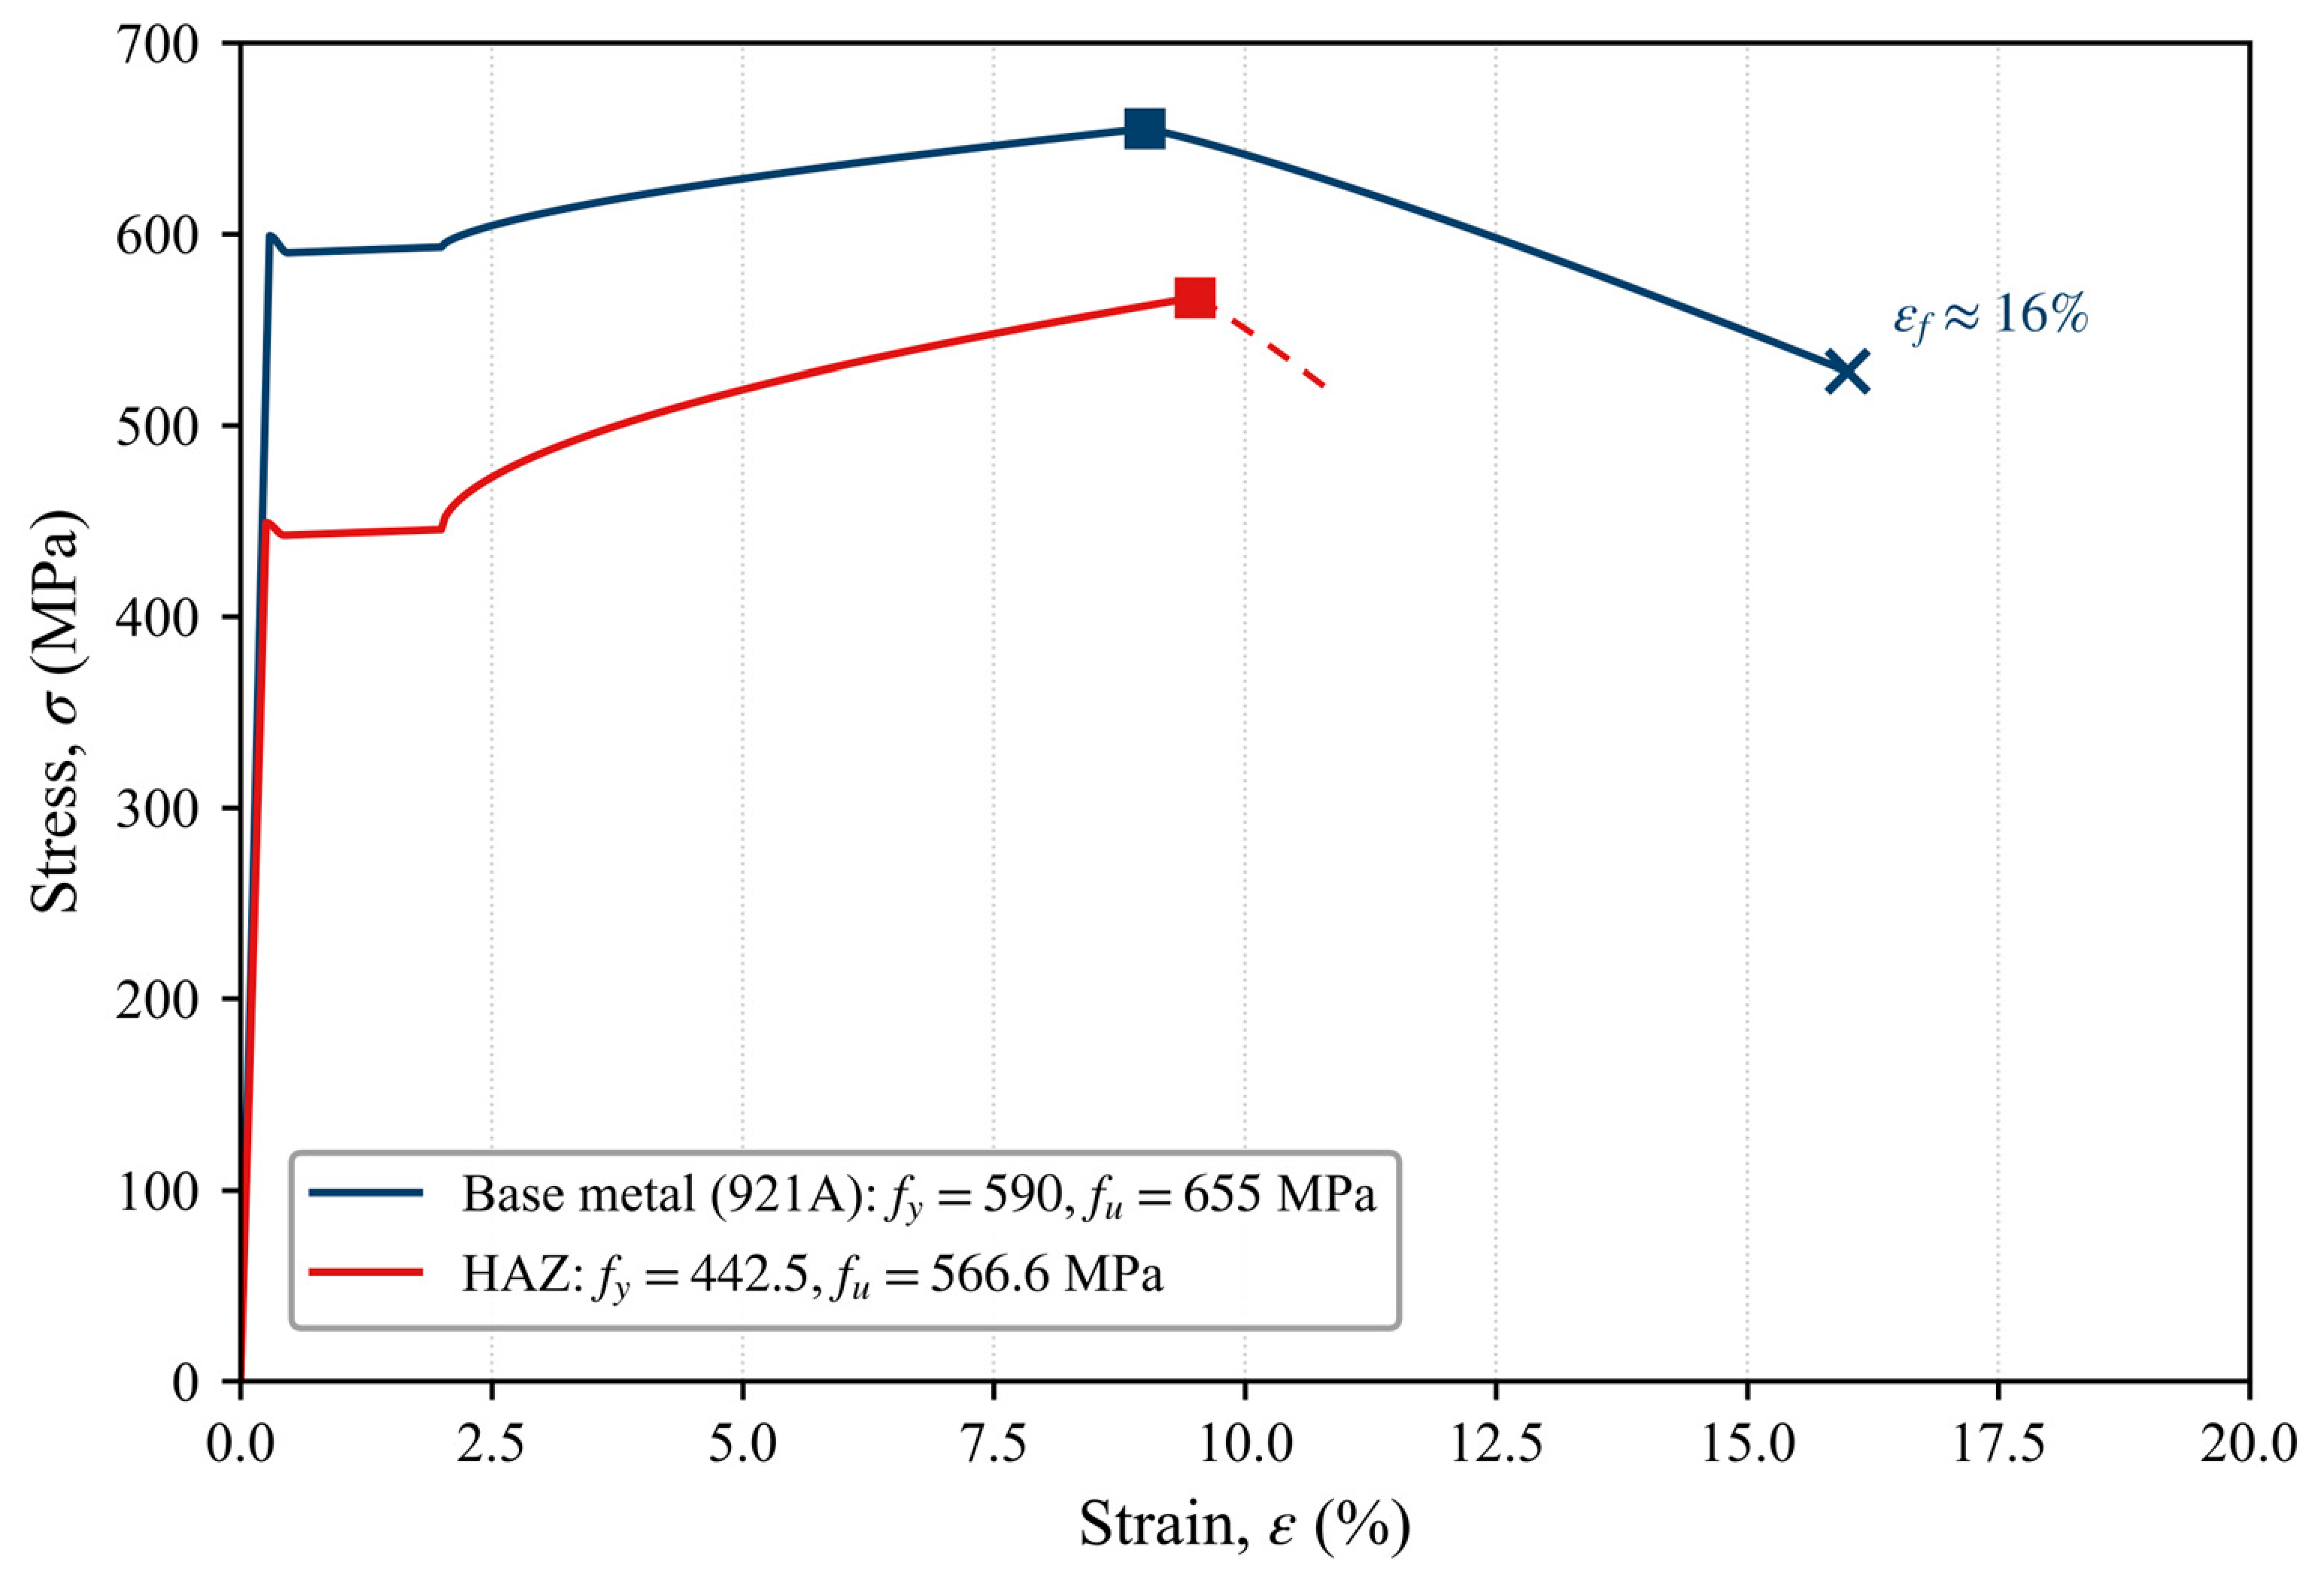
The ambient temperature properties assigned to the base metal and the HAZ band are compared in Table 4, and the corresponding engineering stress–strain curves are plotted in Figure 4. The base metal is ship-grade structural steel (grade 921A, 10CrNi3MoV) with a specified yield strength of 590 MPa and an elastic modulus of 206 GPa [22,23]. The HAZ material is characterised by a yield strength of 442.5 MPa, a tensile strength of 566.6 MPa, and an elastic modulus of 175.1 GPa, corresponding to reductions of 25.0%, 13.5%, and 15.0% relative to the base metal.
Table 4.
Ambient temperature mechanical properties of the base metal and the HAZ band.
Figure 4.
Engineering stress–strain curves of the base metal and the HAZ material at ambient temperature (schematic). The curves are constructed from the ambient temperature properties listed in Table 4 (base metal: fy = 590 MPa, fu = 655 MPa, E = 206 GPa; HAZ: fy = 442.5 MPa, fu = 566.6 MPa, E = 175.1 GPa). Both curves exhibit a slight upper yield point followed by a short yield plateau (Lüders plateau) and then strain hardening, consistent with the measured tensile behaviour of quenched-and-tempered 921A steel. Square markers denote the ultimate tensile strength, and the cross marker denotes the fracture point of the base metal at a fracture strain of approximately 16% . The base-metal fracture strain is taken as approximately 16%, consistent with the minimum percentage elongation after fracture specified for 921A steel (A ≥ 16%, GJB 1663A) [22]. The HAZ curve is shown only up to its ultimate tensile strength, with the subsequent branch indicated by a dashed line because no measured HAZ stress–strain curve is available; no HAZ fracture point is assigned.
The 921A steel is supplied in the quenched-and-tempered condition, and its strength derives from a tempered martensite–bainite matrix with finely dispersed carbides rather than from the alloy chemistry alone; this microstructure is also what sets its thermal stability. For 10CrNi3MoV, tempering between 200 and 600 °C progressively decomposes the martensite–austenite constituents and coarsens the carbides from fine Fe3C to M23C6, so that strength and hardness decrease towards the upper end of this range [24]; in practice the grade is tempered at a higher temperature, and the best combination of strength and toughness is obtained in the 630–660 °C window, while recrystallisation of the matrix sets in at about 720 °C and marks the onset of overheating [25]. Both studies examined laser-deposited and explosively welded material rather than rolled plate, but the carbide sequence and the recrystallisation threshold are governed by the composition of the grade rather than by the processing route, and they are taken here as representative of the plate. Because the plate has itself been tempered at 630–660 °C, exposure well below that temperature produces only a limited continuation of the same tempering reaction and no transformation. Nevertheless, a bound of 600 °C is adopted here as a deliberately conservative limit on the range over which the temperature-dependent reduction factors of Section 3.3 remain valid; above about 720 °C, recrystallisation and the partial austenitisation that begins near the Ac1 temperature of the grade, together with the grain growth and transformation products formed on cooling, would invalidate a reduction-factor approach altogether. The same hierarchy governs the welded HAZ: the coarse-grain sub-zone adjacent to the fusion line experiences peak temperatures well above 1000 °C during welding and coarsens accordingly, so that its strength and ductility differ from those of the parent plate even at room temperature [15].
The degraded properties assigned to the HAZ band are introduced as a conservative engineering representation of the breach-adjacent region rather than as a measured metallurgical width. Microstructural evidence shows that the immediate ASB produced by penetration is narrow, on the order of tens of micrometres, and that no distinct heat-affected zone extending over the plate-thickness scale is formed in the target plate [18]. The justification for a softened envelope therefore comes from the subsequent fire and from the welding literature rather than from the penetration itself. Rogers [26] established that approximately 90% of the work of plastic deformation during high-rate shear is converted to heat, and the external fire further lowers the yield strength and stiffness of the steel around the opening in accordance with its elevated-temperature retention factors [27]. For lower-carbon ship-grade steels, which are less susceptible to martensitic transformation than armour grades, Cho et al. [28] observed only dynamic recovery, with no evidence of phase transformation, in the adiabatic shear bands of HY-100 steel heated to approximately 600 °C; this recovery-dominated, thermally activated response indicates that the breach-adjacent region softens through recovery when subsequently exposed to fire, which supports the softened-envelope assumption adopted here. Surveys around ballistic perforations by Murr and Foltz [29] recorded property variations of up to a factor of two across the deformation zone of thin steel sheets, confirming that the impact-damaged region is mechanically heterogeneous and cannot be represented by uniform base-metal properties. The yield-strength reduction of 25% adopted here falls within the 10–30% range reported for softened HAZs in welded high-strength steel joints [12,30], and the elastic-modulus reduction of 15% is of the same order as the modulus retention factor of structural steel over the 200–300 °C range [27]. The constant-ratio assumption in Equations (1)–(3) is therefore a defensible, deliberately conservative first-order representation of the combined fire-affected and breach-adjacent material, and the three-level sensitivity analysis in Section 5.4 bounds the consequences if the true degradation is milder or more severe.
Although the term HAZ is borrowed from welding, the physical origin of the degraded zone at an impact breach is fundamentally different, and applying a welded-HAZ model without qualification would be misleading. Table 5 contrasts the two processes across the parameters that govern the resulting microstructure and properties.
Table 5.
Comparison of the welded HAZ and the degraded zone at an impact-breach edge across the governing thermal, mechanical, and microstructural parameters.
The comparison shows that the impact-breach edge is dominated by extreme strain rate and ultra-rapid, localised heating rather than the slower, spatially extended thermal cycle of welding; it therefore lacks the distinct fusion and grain-coarsening sub-zones of a weld and exhibits a much steeper property gradient. Because no measured property field is available for the breach edge, the present model uses the annular band as a conservative envelope with uniform degraded properties, which captures the first-order strength reduction but not the microscopic gradient.
3.3. Material Model
Both the base metal and the HAZ are modelled with temperature-dependent elastic–plastic properties. The temperature-dependent yield-strength and elastic-modulus reduction factors adopted for the base metal are engineering values synthesised from the reported elevated-temperature tensile behaviour of quenched-and-tempered ship-grade structural steel, principally the HY-class naval-steel data compiled by Holmquist [31] and the fire-engineering design recommendations of Kirby and Preston [32]; the factors are deliberately taken on the conservative (lower) side of the scattered measured data. The factors used at the three elevated analysis temperatures are denoted ky(θ) and kE(θ) and are listed in Table 6. Because no measured HAZ property–temperature curves exist for a fire-exposed breach edge, the HAZ properties are obtained by applying these same temperature-dependent factors to the corresponding ambient HAZ values; that is, the ambient HAZ-to-base-metal reduction is held constant with temperature. The yield strength, elastic modulus, and tensile strength of the HAZ are defined by Equations (1)–(3).
fy,HAZ(θ) = 442.5 ky(θ) (MPa)
EHAZ(θ) = 175.1 kE(θ) (GPa)
fu,HAZ(θ) = 566.6 ky(θ) (MPa)
Table 6.
Temperature-dependent reduction factors and corresponding properties of the HAZ material.
The constant-ratio assumption in Equations (1)–(3) is a first-order approximation introduced because no measured HAZ property–temperature curves exist for the breach edge. Its error is temperature-dependent and, importantly, its direction can be bounded. At low to moderate temperatures (up to roughly 400 °C), the degraded zone is controlled by the pre-existing strain-hardening state, so a uniform reduction is reasonable and slightly conservative. At elevated temperatures (above about 600 °C), recovery and softening act more strongly on the already strain-hardened, dislocated material than on the base metal, which means that the true HAZ retention factor can fall below the constant-ratio value; post-weld tests on a high-strength thermomechanically rolled steel by Rust and Stroetmann [33] found that, after the welding thermal cycle, the room-temperature tensile strength of the HAZ was reduced by up to 28.4% and its yield strength by up to 38.8%, while the load-bearing capacity of welded T-joints was reduced by up to 16%. These post-weld, room-temperature values are used here as an analogue for the magnitude of HAZ softening that can persist in thermomechanically rolled high-strength steel; adopting the base-metal elevated-temperature retention factor for the HAZ nevertheless tends to overestimate its stiffness and strength at high temperature, i.e., the assumption is non-conservative. The resulting error in Kt is limited because the peak stress in these models develops where the steel is below about 600 °C, but the design margins of Section 5.5 are intended to absorb this uncertainty, and measured HAZ property curves remain the main requirement for a fully quantitative model.
The yield-strength factors adopted here are appreciably lower than the effective yield-strength factors of EN 1993-1-2 [27] over the 200–600 °C range (for example, 25.0% versus 47% at 600 °C); this is consistent with the elevated-temperature coupon data reported in [31,32], in which the elevated-temperature yield point is defined by the 0.2%-proof stress rather than by the stress at 2% total strain used for the effective yield strength in EN 1993-1-2, and adopting these lower factors is intentionally conservative for a residual strength screening assessment. The elastic-modulus factors are engineering values selected from the conservative side of the appreciable scatter reported for the initial tangent modulus of heated structural steel [27,31,32], rather than being read from a single codified table.
4. Fire Simulation Results
4.1. Temperature Field
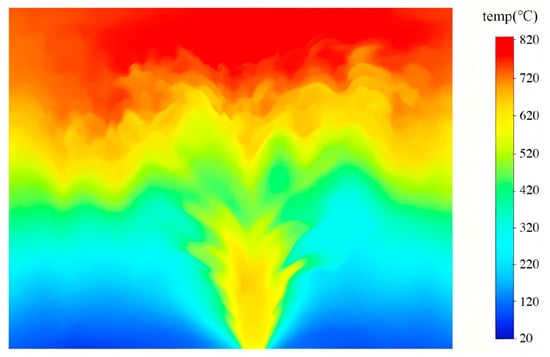
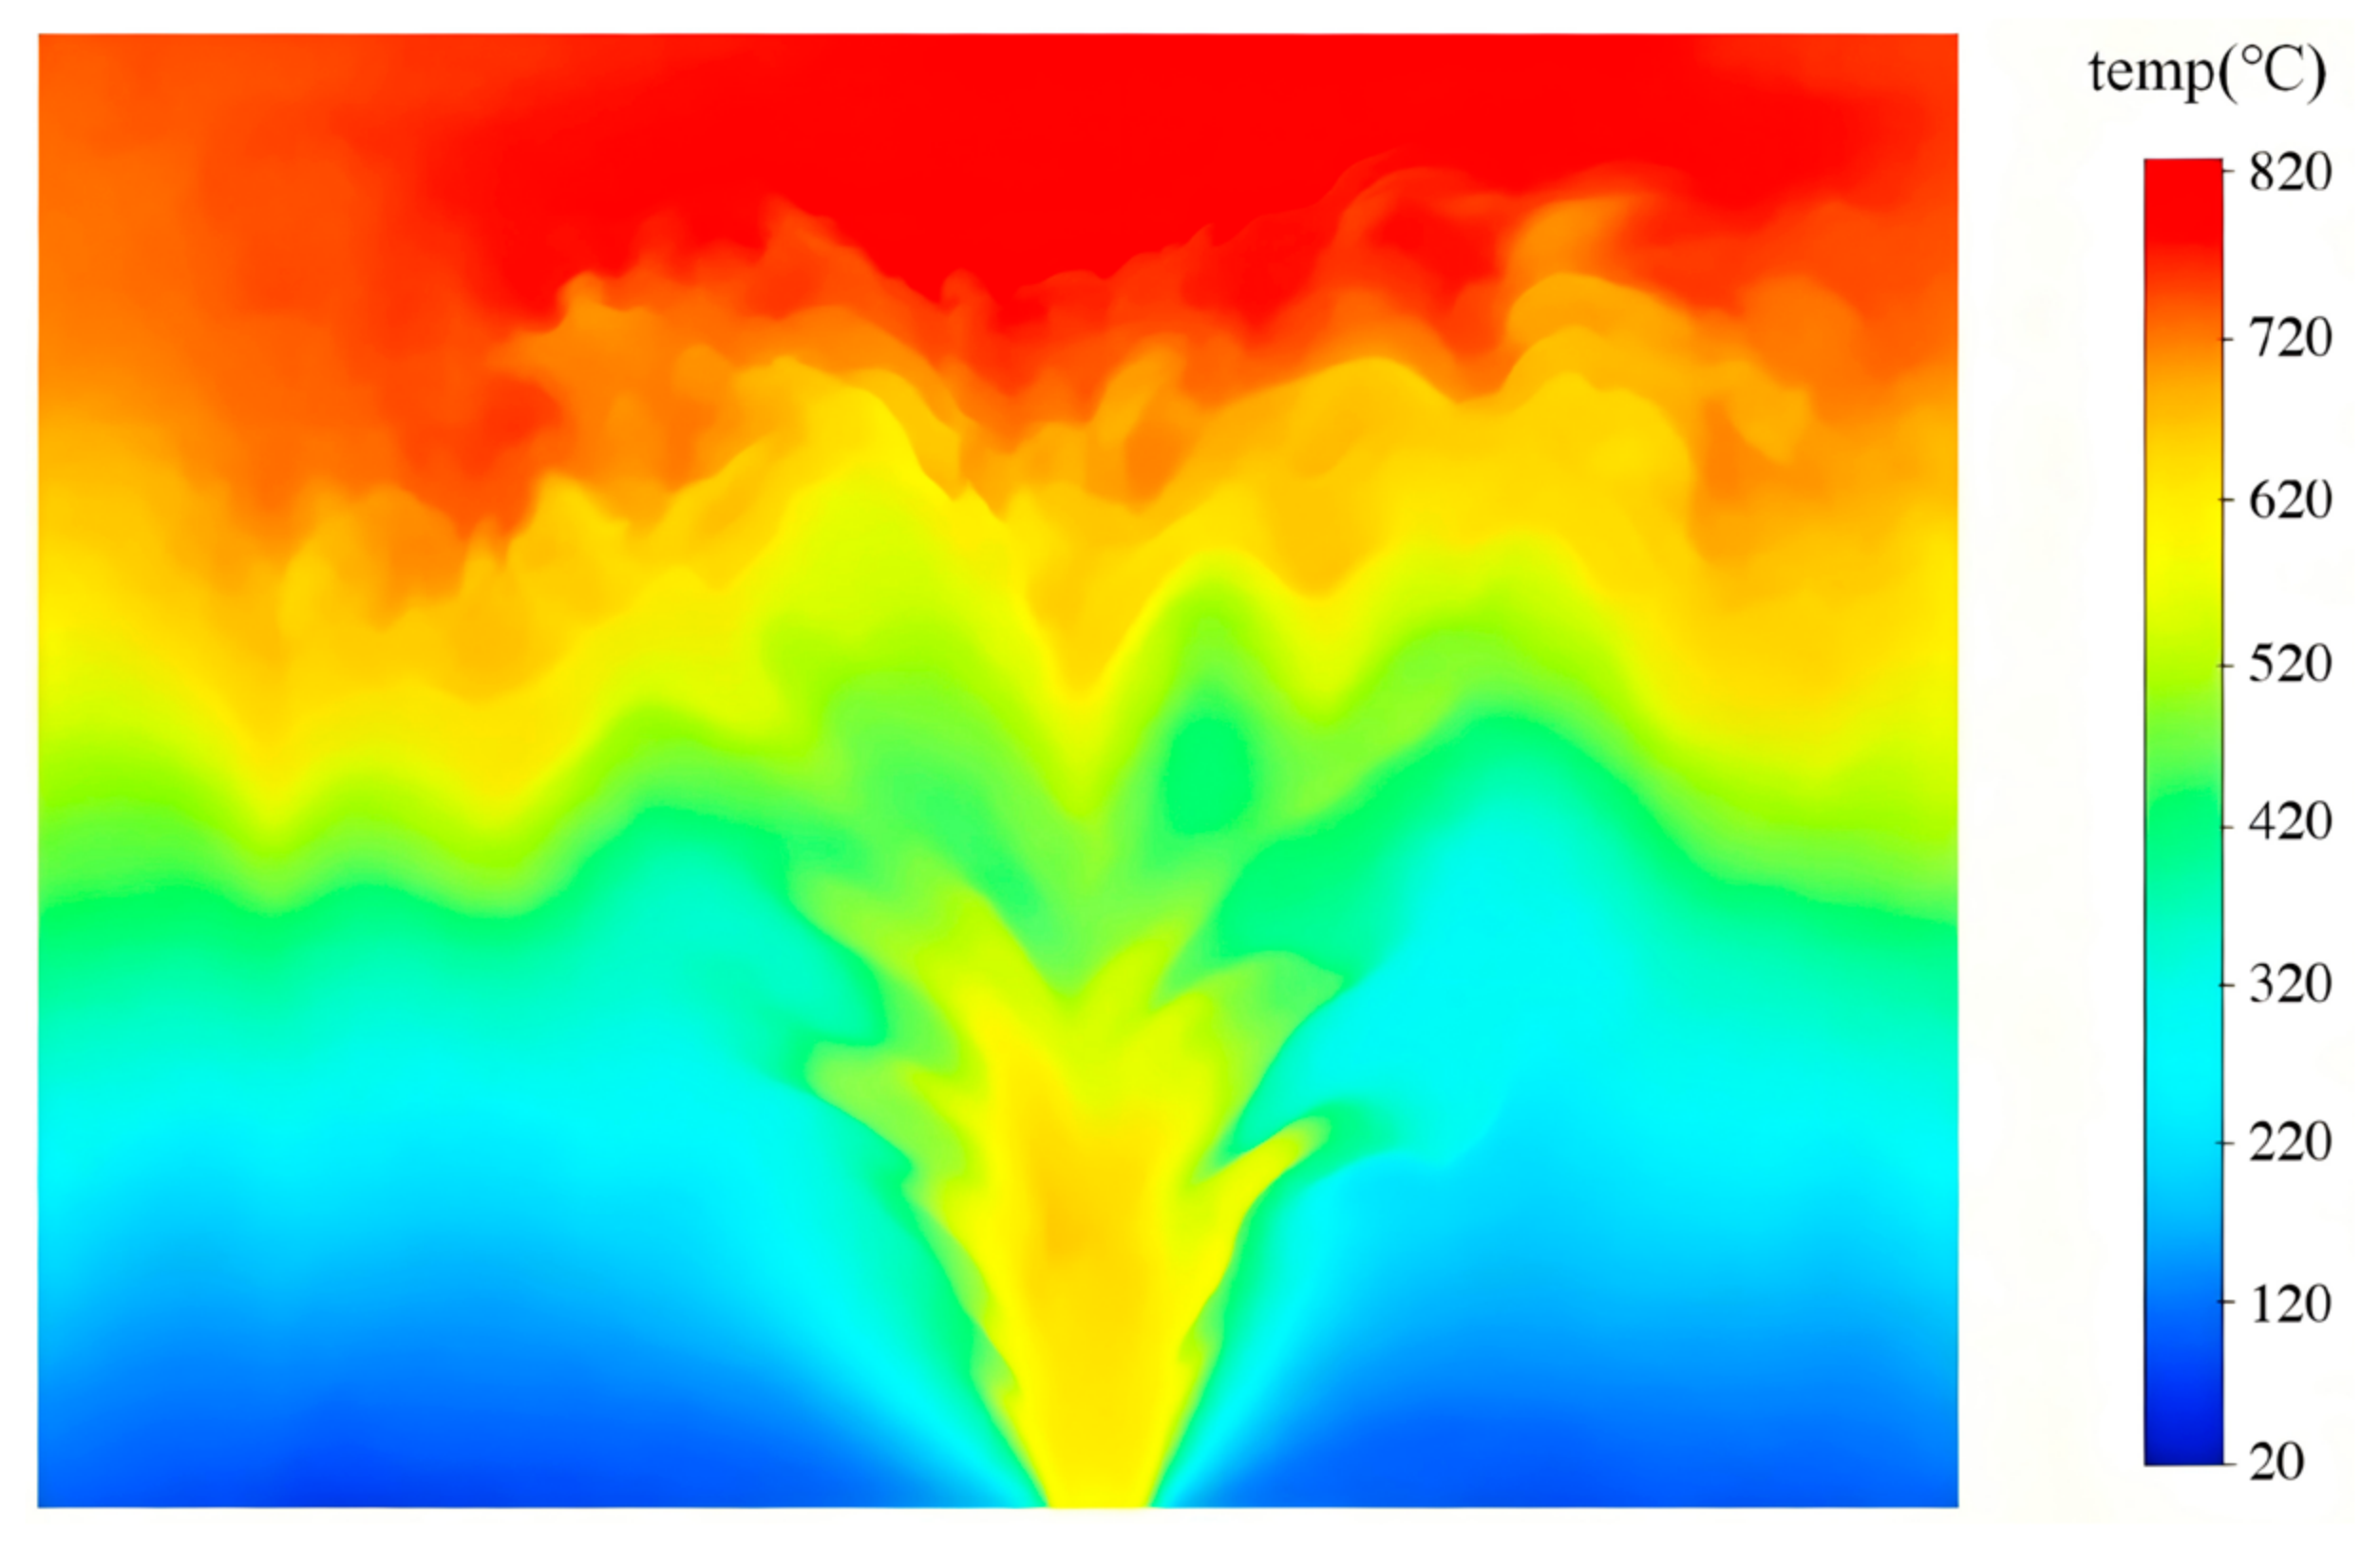
Figure 5 shows the temperature distribution in the cabin 300 s after ignition for the baseline square opening. The hot gases accumulate beneath the ceiling and form a distinct upper layer that descends as the fire develops. The upper-layer temperature reaches approximately 847 °C, while the lower layer remains below 100 °C, giving a strong vertical stratification. The bulkhead surface temperature at the breach edge rises to about 325 °C.
Figure 5.
Temperature contours in the cabin at 300 s for the baseline square opening.
The predicted temperature field is consistent with the full-scale compartment-fire measurements of Steckler et al. [34] and with the roof-vented heptane pool-fire experiments of Li et al. [35] in a compartment of comparable dimensions, which exhibit the same two-layer stratification and upper-layer temperatures of several hundred degrees Celsius for similar fire sizes and ventilation conditions. Jiao et al. [36] further showed that a coupled field–zone–net model gives upper-layer predictions comparable to those of full-field simulations of ship fire smoke spread, confirming that the fire solution is not sensitive to the modelling method.
4.2. Heat Flux Field
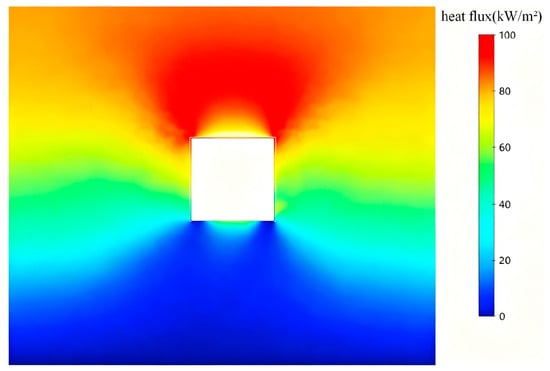
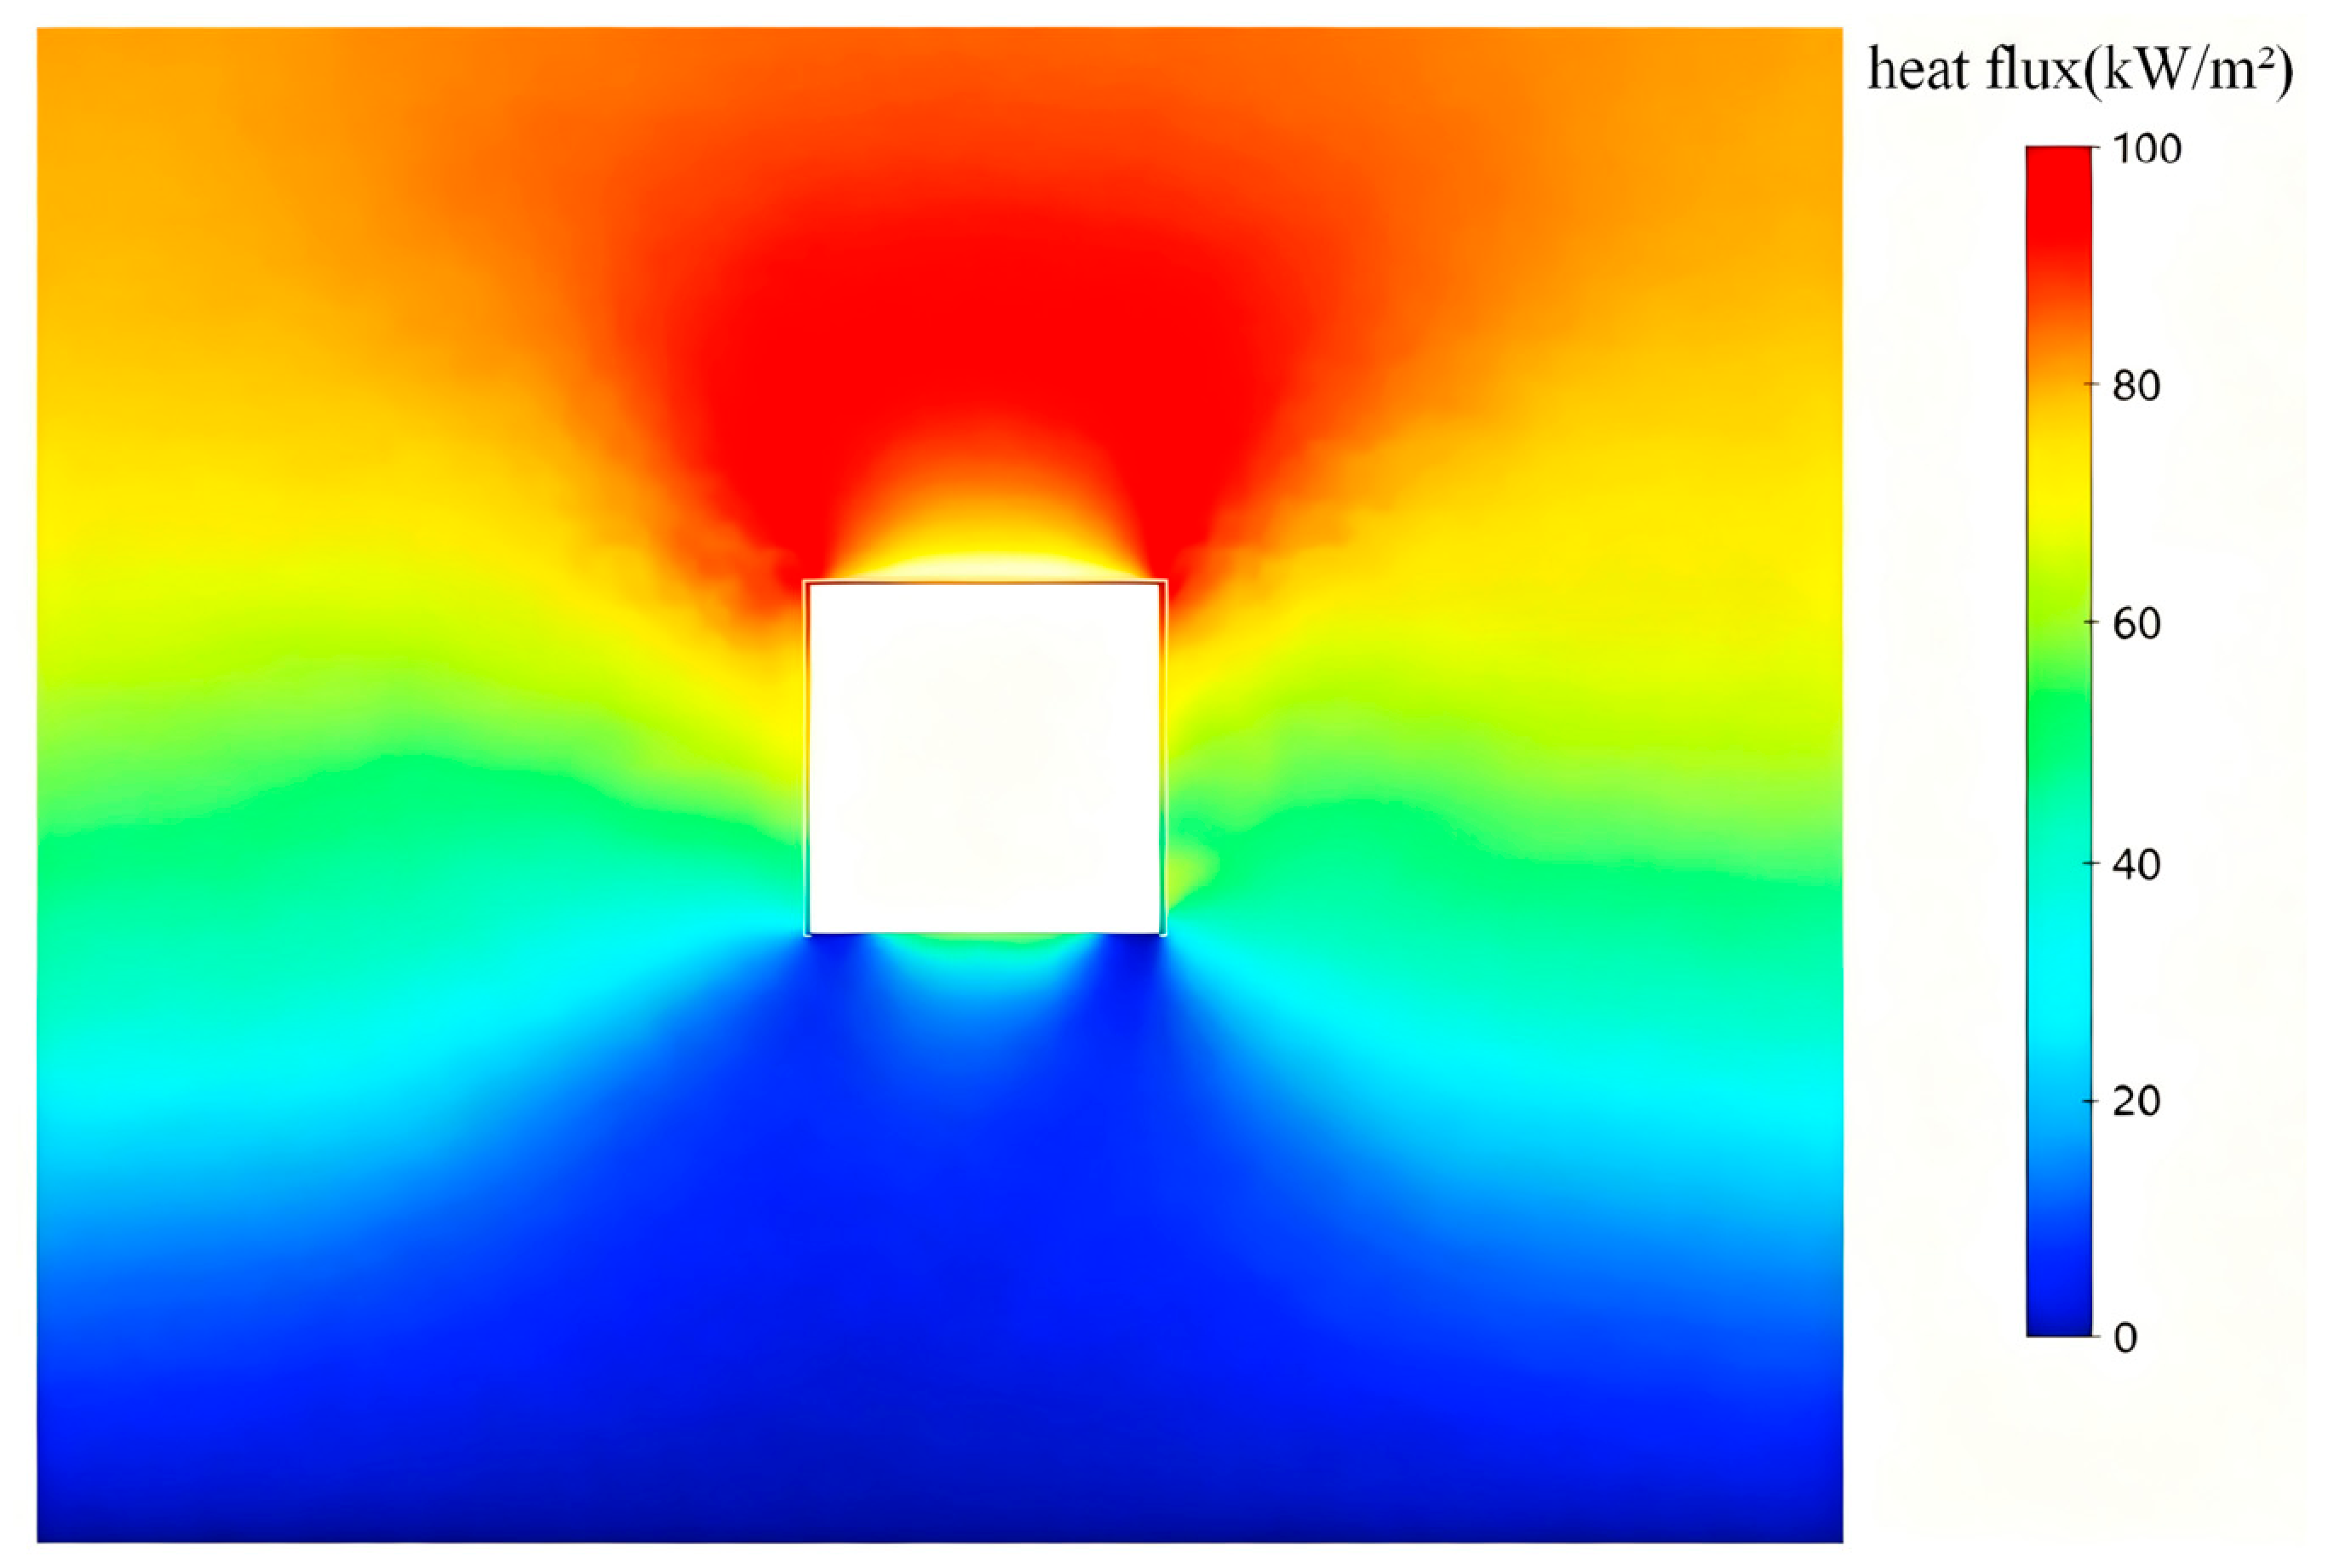
The incident heat flux distribution on the front bulkhead is shown in Figure 6. The heat flux is highest on the upper portion of the bulkhead, directly below the ceiling, where the hot layer impinges on the surface, and decreases towards the floor. The breach edge receives a non-uniform heat flux that is largest at the upper corners and smallest at the lower edge, establishing the spatially graded thermal boundary that drives the stress concentration.
Figure 6.
Incident heat flux contours on the front bulkhead at 300 s.
4.3. Effect of Breach Shape on the Fire Field
Under equal-area conditions, the breach shape has only a minor effect on the global fire field. The peak upper-layer temperatures for the three principal shapes are 847 °C (rectangle), 855 °C (serrated), and 863 °C (irregular polygon), differing by less than 2%, because the global heat balance is governed by the opening area rather than by its detailed geometry. Three of the additional shapes introduced in Section 5.5 (the 2:1 rectangle, the equilateral triangle, and the cross) follow the same trend, with peak upper-layer temperatures of approximately 850 °C, 858 °C, and 861 °C, respectively. The local heat flux around the edge, however, varies appreciably with shape: re-entrant corners and concave segments trap hot gases and locally increase the incident flux, which is the thermal contribution to the shape-dependent stress concentration.
4.4. Flow Regime and Driving-Pressure Analysis
The flow that produces the temperature field above is a buoyancy-driven natural-convection flow, and its regime can be characterised from the properties of the hot layer. Immediately above the pool the plume is laminar over the first few centimetres, but at the present heat release rate it becomes unstable well below the flame tip and breaks into turbulent eddies, and the layer that accumulates beneath the ceiling is a stratified turbulent shear flow rather than a quiescent one. FDS resolves this motion at the large scales through its large-eddy-simulation formulation (Section 2.1): eddies larger than the filter width—here the 0.10 m cell size—are computed explicitly, and only the subgrid scales are represented by the eddy-viscosity closure, so no laminar assumption is made anywhere in the fire region. The gas is treated as an ideal-gas mixture whose viscosity and specific heat vary with temperature, and the resulting density ratio between the ambient air (1.20 kg/m3) and the upper layer at 847 °C (0.32 kg/m3) is about 3.8. It is this ratio, and not any imposed velocity, that sets the strength of the buoyant driving.
Two dimensionless groups quantify the flow regime, and a third checks the resolution of the fire. The Reynolds number of the vent flow is formed with the breach width as the characteristic length, L = 1.0 m, and with the properties of the hot gas at 847 °C, ρ = 0.32 kg/m3 and μ = 4.4 × 10⁻⁵ Pa·s from Sutherland’s law:
Re = ρvL/μ
With the outflow velocity of Equation (7), depth-averaged over the upper half of the opening, v = 3.5 m/s, this gives Re ≈ 2.5 × 10⁴, an order of magnitude above the transition value of about 2 × 10³ for internal flows and therefore fully turbulent. The resolution of the fire itself is checked with the characteristic fire diameter
which for Q· = 1000 kW gives D* = 0.96 m; with a cell size of δx = 0.10 m the ratio D*/δx = 9.6 lies within the range of 4–16 in which FDS large-eddy simulations are regarded as adequately resolved [16]. The Grashof number of the enclosure, evaluated at the film temperature with L = 1 m, is of order 109, above the transition range at which buoyant enclosure flows become turbulent, so the flow is turbulent on both the vent and the enclosure scale.
D* = (Q·/(ρ∞cpT∞√g))2/5
The driving pressure follows from the hydrostatic pressure difference across the opening. Treating the cabin as a two-layer system with the neutral plane at mid-height of the 1 m opening [37], the pressure difference at the top of the opening is
which, with ρ∞ = 1.20 kg/m3, ρ = 0.32 kg/m3 and H = 1.0 m, gives Δp ≈ 4.3 Pa. The Bernoulli relation for a streamline running from the still ambient air to the opening,
then gives a peak outflow velocity of 5.2 m/s at the top of the opening and a depth-averaged velocity of about 3.5 m/s over its upper half. Three qualifications attach to this estimate. The Bernoulli equation assumes an incompressible, inviscid and steady flow along a streamline, whereas the vent flow is turbulent, bidirectional—hot gas leaving above the neutral plane and air entering below it—and unsteady, so the result is used only as an order-of-magnitude check on the velocity scale rather than as a prediction of the flow field. The incompressibility assumption is nevertheless well satisfied, since the Mach number corresponding to 5 m/s in the hot layer is only about 0.008. And the implied mass flux, obtained by applying a discharge coefficient of 0.7 for a sharp-edged vent to the product ρ v (H/2) W, is about 0.39 kg/s of hot gas leaving the upper half of the opening. This is of the same order as the 0.33 kg/s of air required for stoichiometric combustion of a 1 MW heptane fire, confirming that the air supply exceeds the stoichiometric requirement and that the fire is fuel-controlled rather than ventilation-controlled. Because the Bernoulli velocity depends on the pressure difference, and hence on the opening height and the layer temperatures, but not on the perimeter of the opening, an equal-area change in breach shape leaves the global velocity and mass-flux scales essentially unchanged; this is the physical reason for the temperature differences of less than 2% reported in Section 4.3.
Δp = (ρ∞ − ρ)gH/2
v = √(2Δp/ρ)
The flow analysis supports the interpretation of the results in two respects. First, the regime is turbulent at both the vent and the enclosure scale throughout the simulation, so the stress concentration factors of Section 5 are obtained under a buoyancy-driven turbulent thermal load rather than under a laminar or forced-convection idealisation; this is the condition under which the omission of a turbulence model from the structural analysis is justified, since the structural response is driven by the time-averaged heat flux rather than by its fluctuating component. Second, the heat flux at a re-entrant corner is governed by the local flow structure—separated, recirculating hot gas trapped in the concavity—rather than by the global mass exchange, which is why the breach shape changes the edge heat flux and the resulting stress concentration (Section 4.3 and Section 5.2.2) even though it leaves the bulk flow unchanged.
5. HAZ Stress Analysis
5.1. Analysis Scheme
The stress concentration factor is defined as the ratio of the peak local von Mises stress along the breach edge to the nominal membrane stress in the intact bulkhead under the same thermal loading: Kt = σmax/σnom. The nominal stress, evaluated from the intact model at the reference fire stage, is 118 MPa. This thermal definition differs from the classical mechanical Kt, which uses the remote applied stress; here the reference stress is the self-equilibrating thermal stress in the undamaged plate. The same definition is used for all models to ensure comparability.
To separate the effects of geometry and material degradation, three reference models are compared: an intact bulkhead (R1), a bulkhead with a rectangular breach and uniform base-metal properties (R2, no HAZ), and a bulkhead with the same breach and the HAZ band (R3).
5.2. Stress Distribution
5.2.1. Peak Stress and Stress Concentration
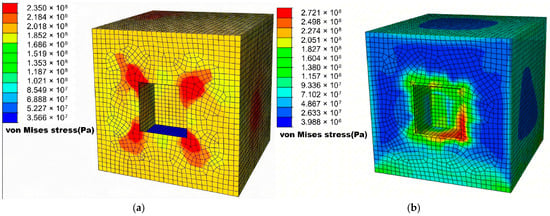
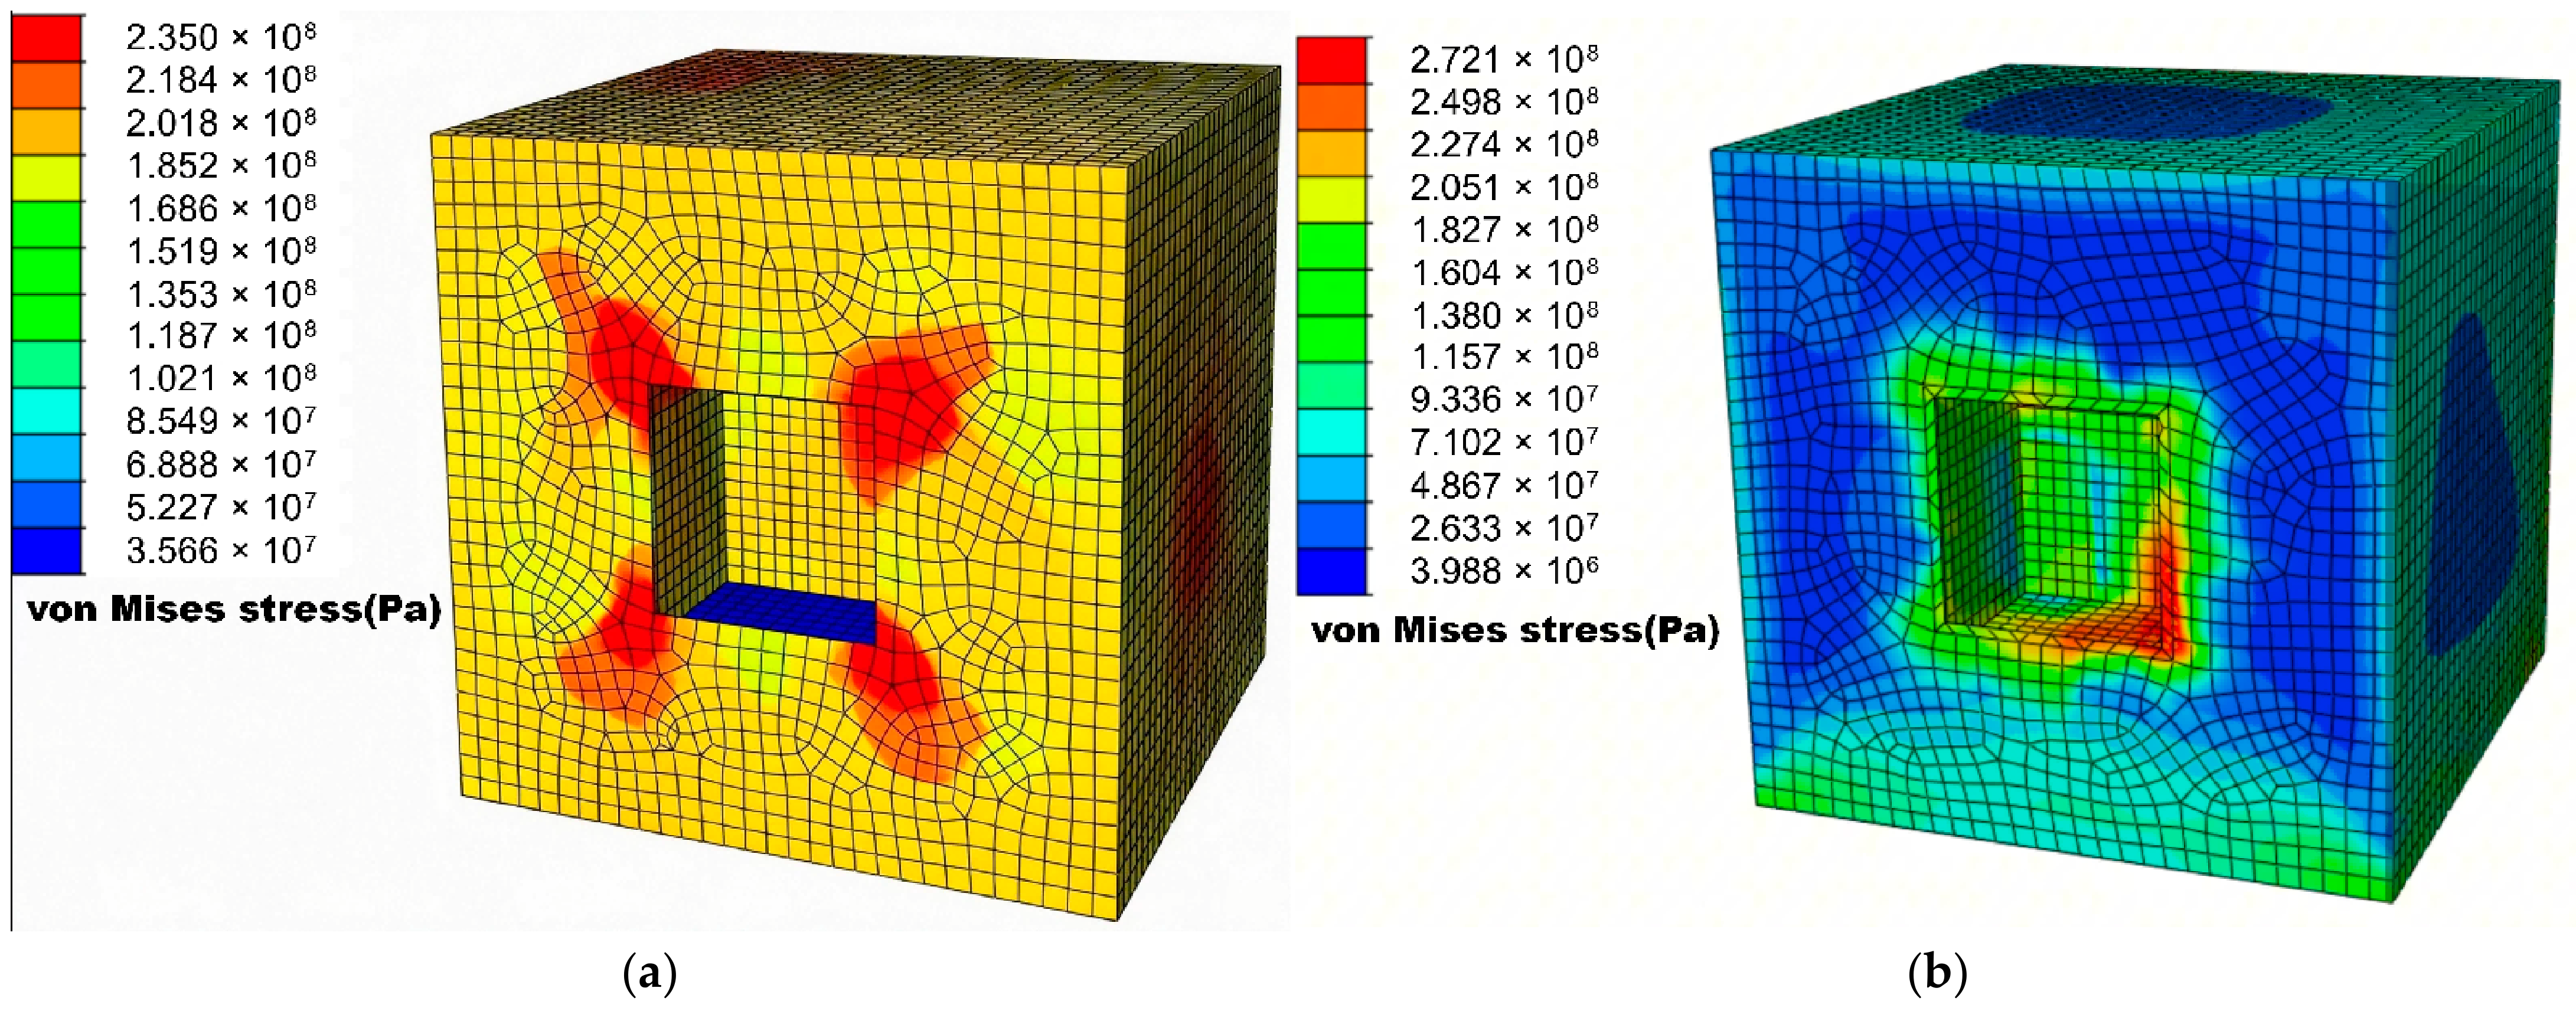
The peak stresses and concentration factors for the three reference models are listed in Table 7, and the von Mises stress contours for R2 and R3 are shown in Figure 7.
Table 7.
Peak von Mises stress, stress concentration factor and peak steel temperature for the three reference models.
Figure 7.
Von Mises stress contours for the rectangular breach: (a) without the HAZ band (R2); (b) with the HAZ band (R3).
The intact bulkhead develops a peak stress of 118 MPa, distributed along the constrained edges, and remains essentially elastic. Cutting the rectangular breach raises the peak stress at the corners to 235 MPa, giving Kt = 1.99. Introducing the HAZ band further raises the peak stress to 272 MPa (Kt = 2.31) and, crucially, moves the peak location from the geometric corners to the annular band of reduced stiffness, where the elastic modulus is reduced to 175.1 GPa. The HAZ thus amplifies the geometric concentration by redistributing strain while also acting as a compliant material zone.
The peak steel temperatures in Table 7 provide the check required by the material model of Section 3.3. Even in the intact plate, where the restraint is highest, the steel reaches only 350 °C, which is about 250 K below the conservative stability limit of 600 °C adopted in Section 3.2, and about 300 K below the tempering temperature of the as-supplied plate; it lies about 370 K below the recrystallisation threshold of 720 °C, at which grain growth and transformation would begin. In the two breached plates the peak is lower still, at 325 °C, because the opening relieves part of the thermal restraint. No significant microstructural transformation, carbide coarsening or grain growth is therefore expected at the 1 MW reference fire, and the temperature-dependent reduction factors remain valid over the whole of the simulated domain. Because the peak steel temperature rises approximately linearly with fire power (Section 5.4.2), the same criterion places the material limit at a fire power of approximately 1.8 MW for 600 °C and 2.1 MW for recrystallisation at 720 °C. That extrapolation errs on the conservative side, since radiative losses grow faster than the linear trend and the true steel temperature at a given power is therefore lower than the linear estimate, and it coincides with the power at which the one-way coupling ceases to be valid (Section 5.4.2). The material model and the coupling scheme thus share a common applicability ceiling of the order of 2 MW, above which a transformation-aware constitutive law and a two-way coupling would both be required.
5.2.2. Stress Mechanism
The stress along the breach edge results from the superposition of two mechanisms. First, the breach interrupts the thermal expansion of the heated plate, forcing the material adjacent to the edge to accommodate the differential expansion through local bending and membrane stresses; this is the thermal-discontinuity component. Second, the geometric discontinuity concentrates stress at the corners and re-entrant features, as in a classical notch. Kim et al. [11] likewise found the stress concentration at the opening edge and corners to dominate the collapse strength of perforated ship panels.
5.2.3. Peak Stress Location
In the no-HAZ model, the peak stress occurs at the four corners of the rectangle, where geometric concentration coincides with the highest incident heat flux. In the HAZ model, the peak shifts to the lower-right margin of the annular band, because the reduced stiffness of the band redistributes elastic strain toward that margin before the base-metal corner reaches its peak elastic stress. This relocation is consistent with the Inglis analysis [9], in which the peak stress follows the point of minimum local radius, and with the measured and simulated bulkhead temperatures of Zhu et al. [6] in full-scale ship fire tests.
5.2.4. Coupled Effect and Interaction Factor
The combined action of geometric concentration and HAZ degradation can be compared with the product of the two independent effects. If the HAZ amplification factor is defined as the ratio of the HAZ to the no-HAZ Kt for the rectangle, its value is 2.31/1.99 = 1.161. The independent-product estimate for a given shape is then Kt,ind = Kt,no-HAZ × 1.161; for the irregular polygon, this estimate is given by Equation (8).
Kt,ind = 2.72 × 1.161 ≈ 3.16
The computed value, however, is 3.41 rather than 3.16, i.e., about 8% higher than the independent-product estimate. This positive interaction, or synergy, arises because the sharp re-entrant corners of the irregular polygon concentrate both the stress and the strain within the already compliant HAZ band, so the geometric and material effects reinforce each other. The interaction factors for the three shapes are summarised in Table 8.
Table 8.
Comparison of the HAZ-amplified stress concentration factor with the independent-product estimate for the three breach shapes.
The synergy is strongly shape-dependent. For the rectangle and the weakly irregular serrated shape, the computed Kt is within about 1% of the independent-product estimate, so the two effects can be treated as multiplicative. For the irregular polygon, which contains sharp re-entrant corners, the deviation reaches 8% and the independent-product assumption is non-conservative. A practical implication is that simple multiplicative superposition is adequate for blunt or weakly irregular breaches but underestimates the peak stress for highly irregular ones.
5.3. High-Stress Region and Strain Distribution
The extent of the high-stress region is as important as its peak value for residual strength assessment. Table 9 lists the area over which the von Mises stress exceeds 200 MPa, without and with the HAZ band.
Table 9.
Area of the high-stress region (σ > 200 MPa) without and with the HAZ band.
The HAZ enlarges the high-stress region by a factor of about 1.65 for all three shapes, because the entire annular band is brought to a comparable elevated elastic stress. The irregular polygon exhibits the largest high-stress area (0.118 m2 with HAZ), reflecting the combination of a long perimeter and multiple re-entrant corners. The equivalent plastic strain is essentially zero for the reference 1 MW fire (PEEQ ≈ 0), indicating that the bulkhead response is fully elastic and that the fire introduces no irreversible damage; the breach-induced elastic stress concentration therefore serves as the appropriate screening indicator of residual capacity at this damage level, whereas cases that develop plasticity at higher fire power (Section 5.4.2) lie outside this range. Kim et al. [11] likewise found only moderate buckling-strength reductions for perforated ship plates with small openings, consistent with the predominantly elastic response of the lightly damaged bulkhead observed here.
5.4. Parametric Analysis
5.4.1. Breach Size
Keeping the square shape and varying the breach area from 0.5 to 1.5 m2 shows that Kt increases modestly with size, from 1.86 to 2.09, because a larger opening removes more load-bearing material and reduces both the ligament width between the breach edge and the plate boundary and the surrounding load-bearing area. Over the practical range of battle damage, however, shape exerts a stronger influence than size, and area is therefore held constant in the shape study.
5.4.2. Fire Power
Varying the fire power from 1.0 to 2.0 MW raises the peak bulkhead temperature and the peak stress approximately linearly while the response remains essentially elastic; beyond about 2 MW, as the heated HAZ loses stiffness, the stress growth slows whereas the strain increases rapidly. Kirby and Preston [32] observed the same trend in the elevated-temperature stress–strain curves of hot-rolled steel, in which a well-defined yield point at low temperature gives way to a rounded, strain-governed response as the temperature increases.
5.4.3. HAZ Width Sensitivity
To test the sensitivity to the assumed damage-envelope width, the HAZ band width for the square breach is varied over 20, 50, and 100 mm. The resulting Kt values are 2.14, 2.31, and 2.41, corresponding to changes of −7.4% and +4.3% relative to the 50 mm baseline. Above 50 mm, the response saturates because the added outer annulus lies outside the region of high stress gradient. This confirms that the 50 mm width is a robust choice and that the uncertainty in the envelope width contributes less than about 5% to Kt, which is smaller than the shape effect. Rodrigues et al. [30], in numerical simulations of mismatched high-strength steel welds, likewise identified the ratio of softened-zone width to plate thickness (lHAZ/t, varied over 1/6–1) as a governing parameter of the joint strength, with the effect of widening the softened band diminishing as this ratio approaches unity; this is qualitatively consistent with the saturation observed here above 50 mm, although the range they studied did not exceed unity.
5.4.4. HAZ Property Reduction Sensitivity
Because the HAZ property reductions are the most consequential assumed parameters in this study, a three-level sensitivity analysis is conducted over the range of degradation reported in the impact-damage and welded-HAZ literature; the results of Section 5.4 are intended as screening-level parametric trends that bound the response over plausible HAZ assumptions rather than predict a single deterministic capacity. The levels are defined as mild (yield −10%, modulus −5%), moderate (yield −25%, modulus −15%; the baseline), and severe (yield −40%, modulus −25%). The mild bound corresponds to the lower end of the softening reported for welded high-strength steel joints [12,30]; for the quenched-and-tempered 921A-type steel used in the present bulkhead, the softened envelope is adopted as a deliberately conservative premise for screening-level assessment. The severe bound approaches the maximum room-temperature yield-strength reduction (38.8%) obtained from thermo-physical simulations of the welding thermal cycle in high-strength steel by Rust et al. [33], who separately measured up to a 16% reduction in the load-bearing capacity of welded T-joints; it is used here only as an upper screening value. The three levels therefore bracket the range reported in the literature rather than define independent damage grades, and the corresponding Kt values are sensitivity bounds on the screening estimate rather than separate design cases. The resulting Kt values for the rectangular breach are summarised in Table 10.
Table 10.
Sensitivity of the rectangular-breach Kt to the HAZ property reduction level. The three levels are the lower bound, the baseline and the upper bound of the reduction range reported in the welding and impact-damage literature: mild corresponds to the lower end of the softening reported for welded high-strength steel joints (yield strength −10%, elastic modulus −5%) [12,30]; moderate is the baseline adopted throughout this study (−25% and −15%; Section 3.2); and severe approaches the maximum room-temperature yield-strength reduction of 38.8% obtained from welding-thermal-cycle simulations (−40% and −25%) [33].
Across the three levels, Kt increases monotonically from 1.99 (no HAZ) through 2.06 (mild) and 2.31 (moderate) to 2.50 (severe), corresponding to HAZ amplification factors of 1.03, 1.16, and 1.26, respectively. The growth is sub-linear: relative to the no-HAZ case, the mild, moderate, and severe levels raise Kt by about 3%, 16%, and 26%, and the increment diminishes from the mild-to-moderate step (about 12%) to the moderate-to-severe step (about 8%), because the increasing compliance of the band redistributes strain and load to the surrounding base metal. The peak stress location remains within the HAZ annular band at all three levels, and the shape-dependent synergy of Section 5.2.4 persists. Its magnitude scales approximately with the amplification factor, reaching roughly 9% for the irregular polygon under severe degradation, compared with 8% at the baseline. Even at the severe level, the central conclusions are unchanged: the HAZ elevates Kt, relocates the peak stress into the weakened band, and amplifies the effect of sharp re-entrant corners. The screening-level design margins of Section 5.5 (a factor of 1.13 on the fitted HAZ Kt) are therefore adequate to cover the uncertainty in HAZ property reduction across the full literature range.
5.5. Shape Irregularity Statistical Analysis
5.5.1. Shape Irregularity Index
To quantify breach shape by a single scalar, the shape irregularity index is defined as the ratio of the squared perimeter of the breach to the squared perimeter of a circle with the same area: I = P2/(4πA), where P is the breach perimeter and A is its area. The index is unity for a circle and increases as the boundary becomes more convoluted; it is independent of scale and combines the effects of edge length and tortuosity.
5.5.2. Design of Nine Equal-Area Breach Shapes
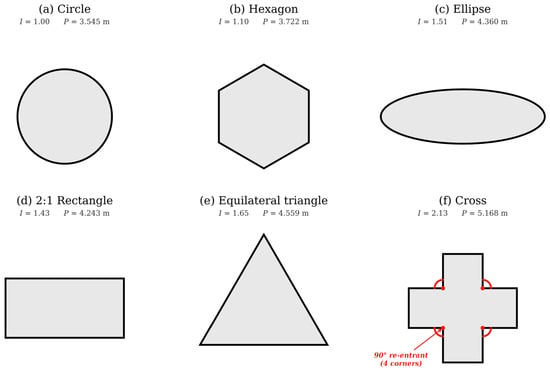
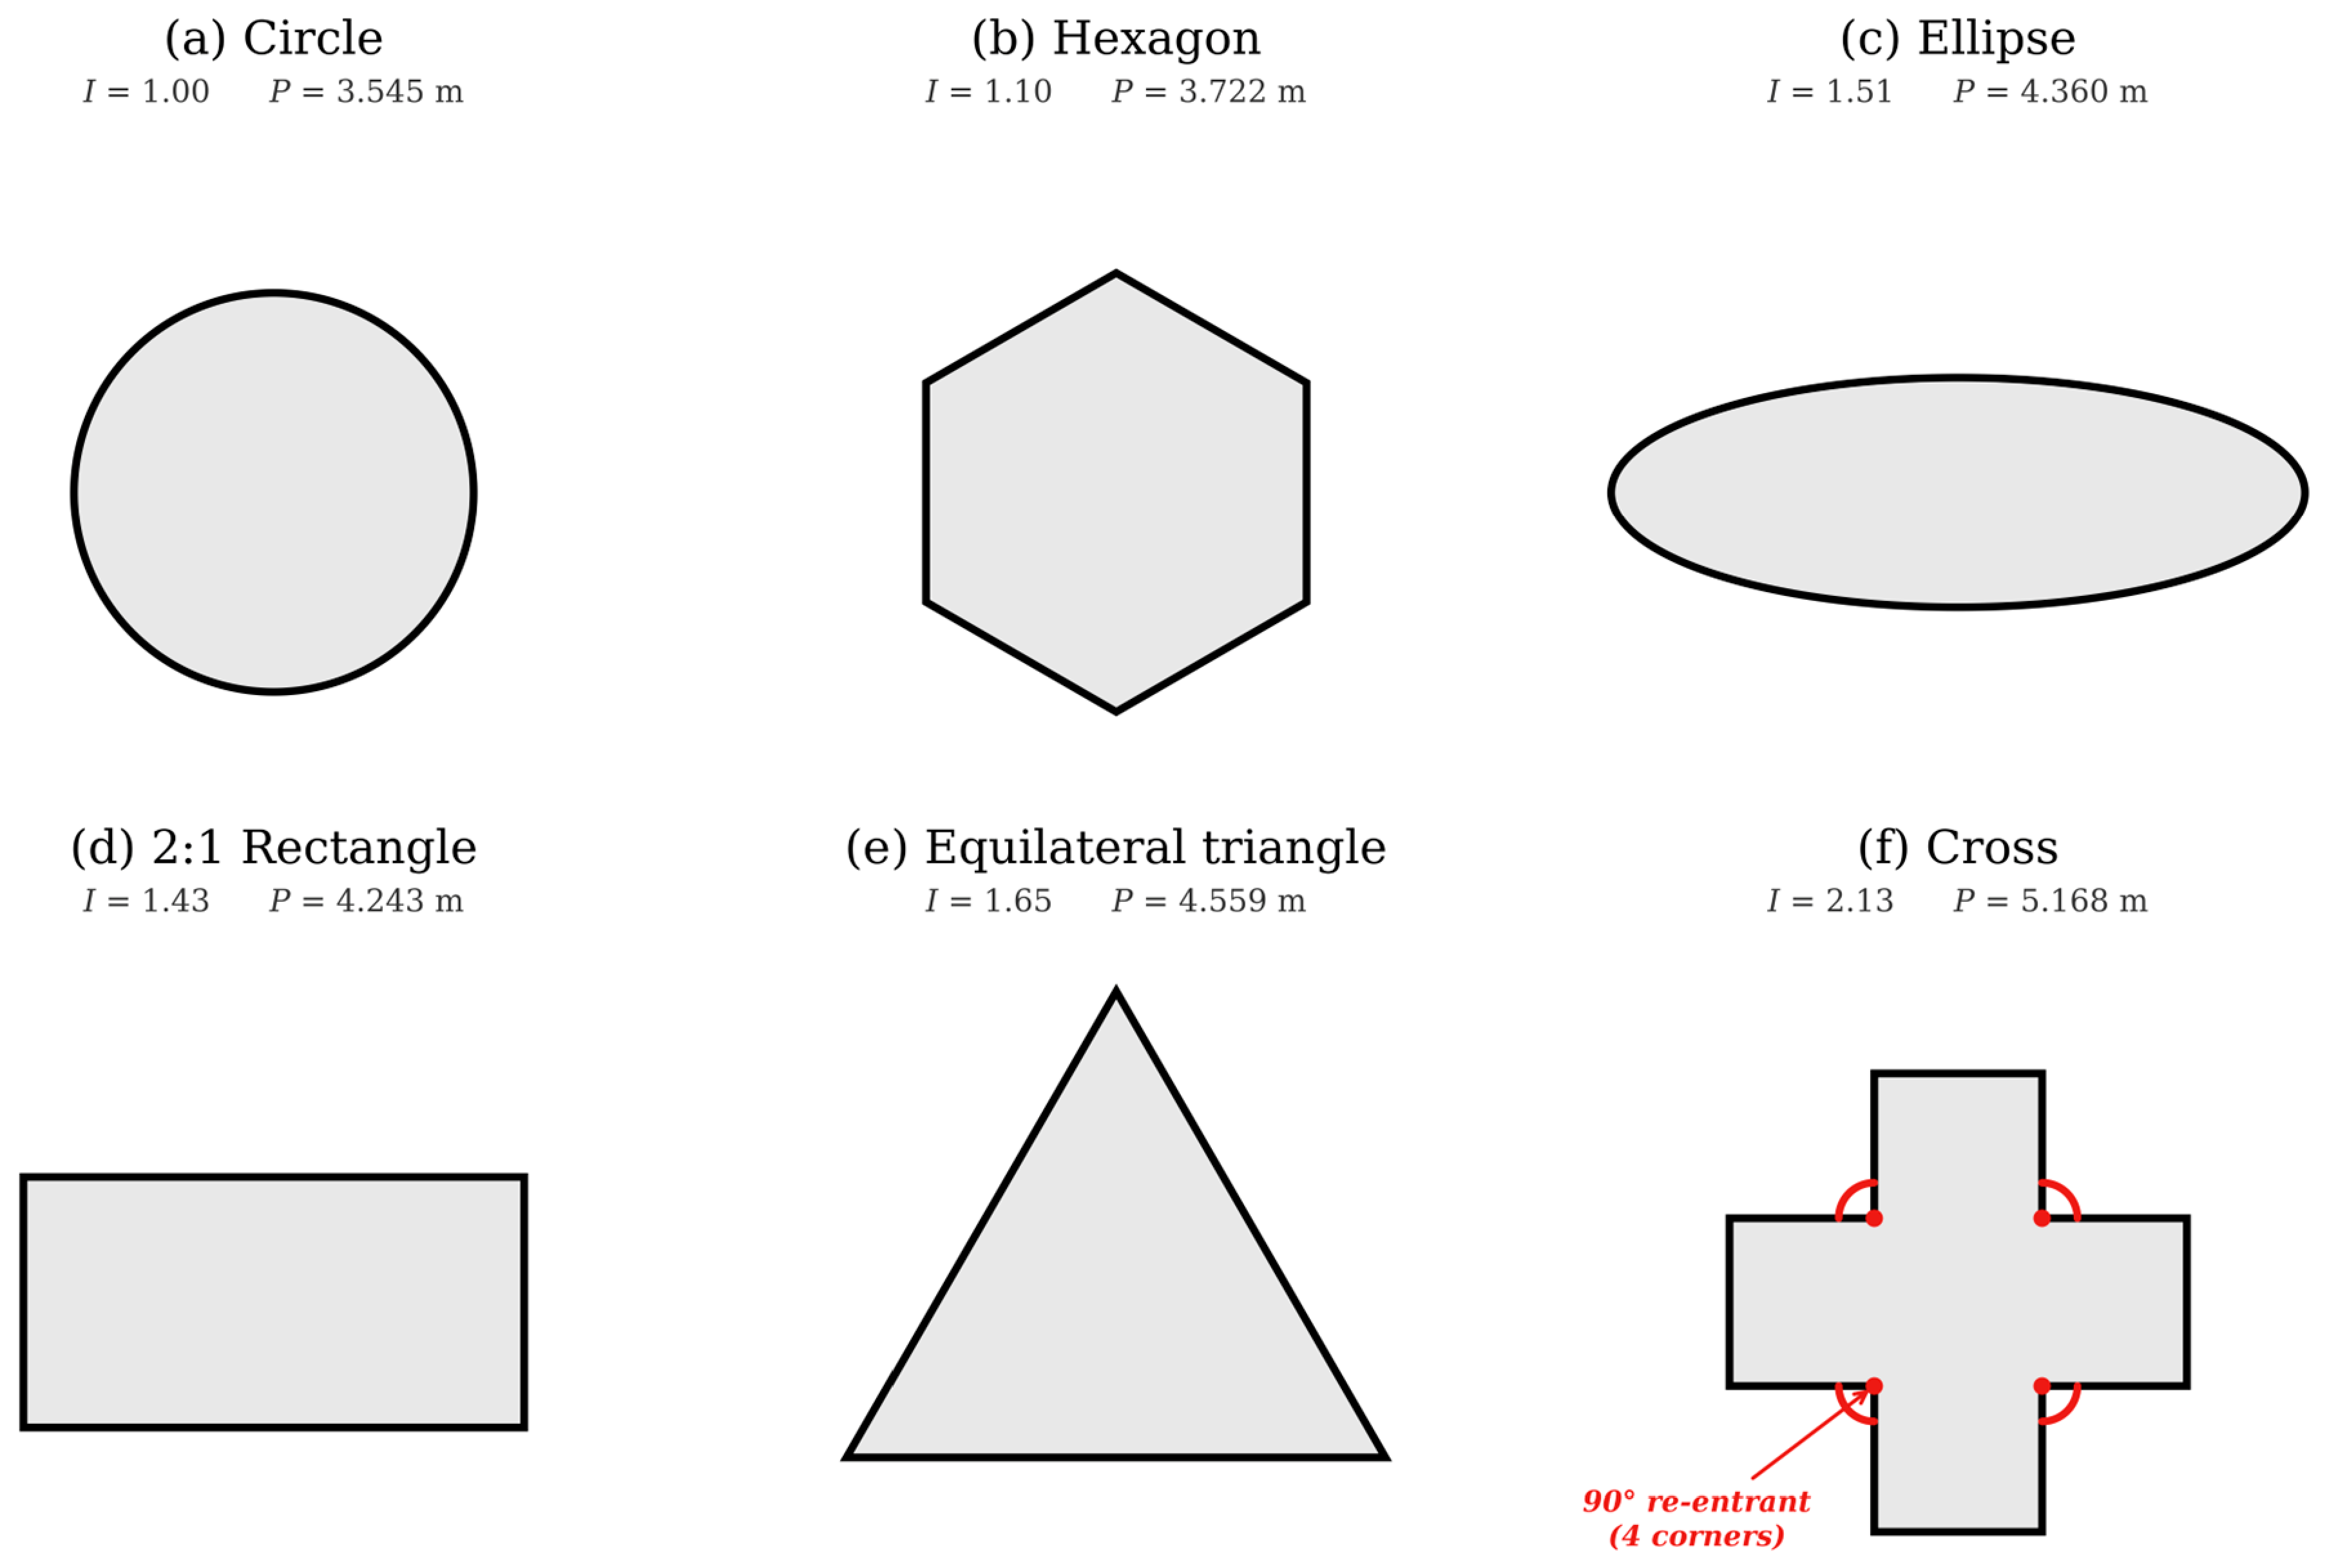
To test the generality of the Kt–irregularity relation and to improve the coverage of the three principal shapes, nine equal-area breach shapes are constructed, spanning the practical range from a smooth circle (I = 1.00) to a cross (I = 2.13). Their geometric parameters are listed in Table 11 and shown in Figure 8.
Table 11.
Perimeter, area, and shape irregularity index for the nine equal-area breach shapes.
Figure 8.
The intermediate equal-area breach shapes.
The added shapes are chosen to provide distinct combinations of perimeter and corner type: the 2:1 rectangle isolates the effect of aspect ratio with blunt corners, the equilateral triangle introduces three acute corners without a long perimeter, and the cross combines re-entrant corners with a long perimeter, extending the indexed range beyond the irregular polygon. The rectangle and the triangle fill the sparsest part of the original six-shape set (circle, hexagon, square, ellipse, serrated shape, and irregular polygon): they reduce the largest gap between adjacent irregularity indices from 0.43 (between the serrated breach and the irregular polygon) to 0.39 (between the triangle and the polygon), while the cross lies at I = 2.13, beyond the polygon. The nine-shape set thus provides denser but not perfectly uniform coverage, and the residual non-uniformity is reflected in the influence diagnostics of Section 5.5.5.
5.5.3. Computed Stress Concentration Factors
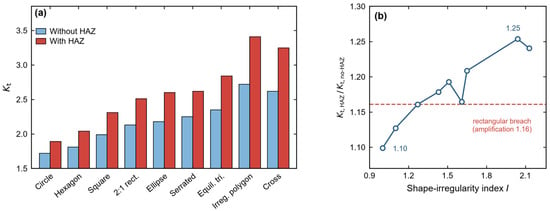
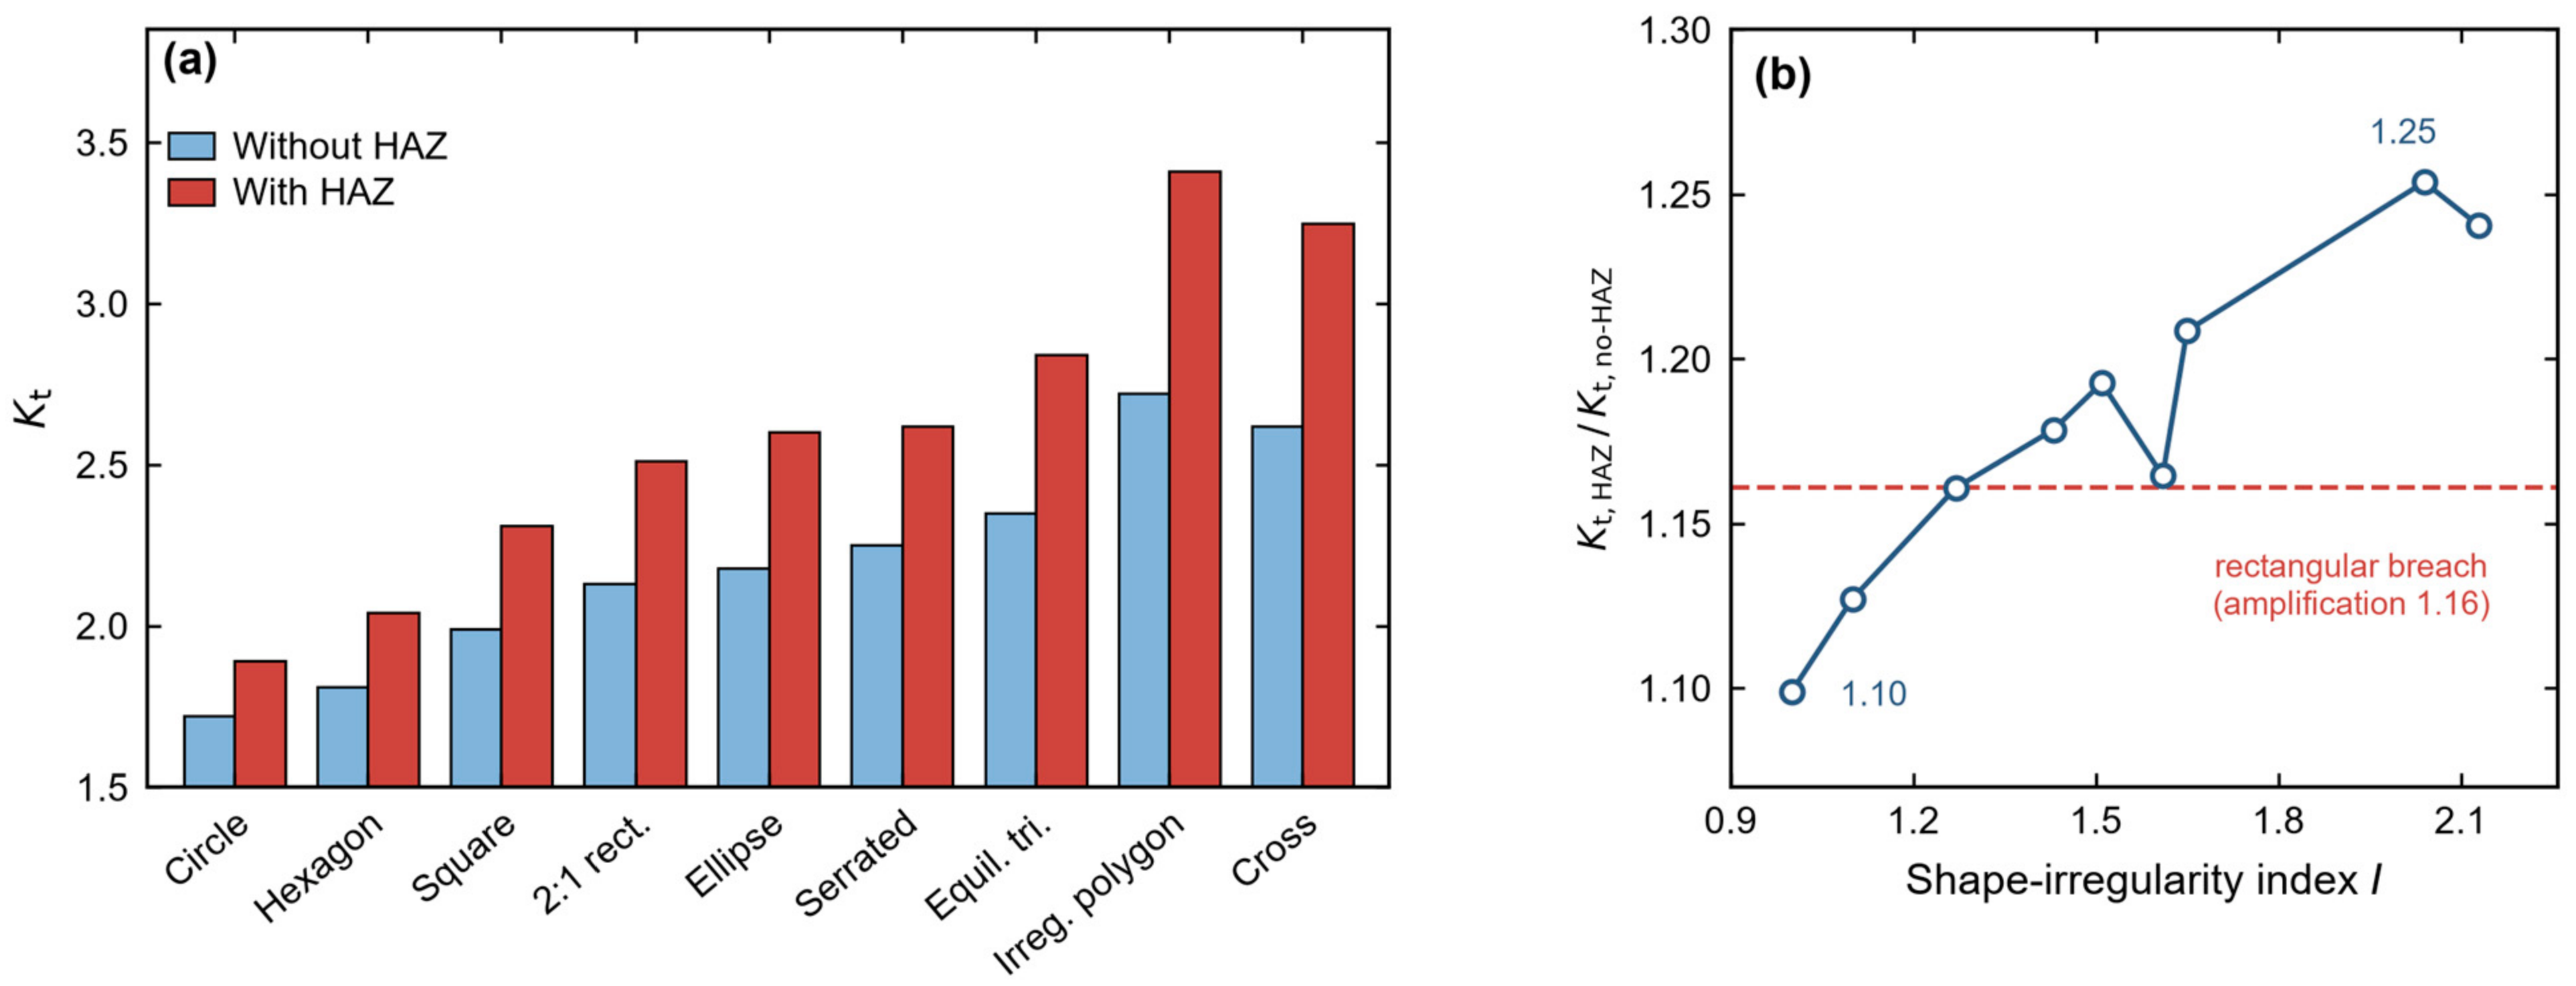
The Kt values for all nine shapes, without and with the HAZ band, are listed in Table 12. Both quantities increase overall, but not strictly monotonically, with the irregularity index: the irregular polygon (I = 2.04) gives the highest Kt, whereas the cross (I = 2.13) gives slightly lower values, so the two most irregular shapes invert in rank. The HAZ amplification factor likewise increases overall, from 1.10 for the circle to 1.25 for the irregular polygon.
Table 12.
Stress concentration factors without and with the HAZ band and the corresponding amplification factors for the nine equal-area breach shapes.
Figure 9 summarises the nine-shape results. Panel (a) compares the two sets of Kt values with the shapes ordered by increasing irregularity, and panel (b) shows the corresponding HAZ amplification factor. Three features are visible. The no-HAZ Kt rises from 1.72 for the circle to 2.72 for the irregular polygon, an increase of about 58%, and the HAZ case rises from 1.89 to 3.41, or about 80%, so the degraded band amplifies rather than smooths the geometric effect. The amplification factor grows in the same direction, from 1.10 for the circle to 1.25 for the irregular polygon, which means that material degradation and geometric concentration reinforce each other; a single amplification of 1.16 taken from the rectangular breach—the value that Figure 7 illustrates—would underestimate the most irregular shapes by up to 8%. The rank inversion between the cross (I = 2.13, Kt = 3.25) and the irregular polygon (I = 2.04, Kt = 3.41) shows that the index captures the length and tortuosity of the boundary but not the sharpness of the individual re-entrant corners, and it is the reason why the fitted relations are presented with prediction intervals and influence diagnostics rather than as exact laws.
Figure 9.
Computed stress concentration factors for the nine equal-area breach shapes: (a) Kt without and with the HAZ band; (b) HAZ amplification factor as a function of the shape irregularity index.
5.5.4. Linear Fitting and Prediction Intervals
Ordinary least-squares regression of Kt on I over the nine shapes gives the linear relations of Equations (9) and (10) for the no-HAZ and HAZ cases.
Kt = 0.865 I + 0.876
Kt = 1.292 I + 0.634
The fits explain 97.92% (no HAZ) and 97.28% (HAZ) of the variance, with root-mean-square errors (RMSEs) of 0.052 and 0.089 and overall F-statistics of F(1,7) = 330 (p = 3.8 × 10⁻⁷) and F(1,7) = 250 (p = 9.8 × 10⁻⁷). Leave-one-out cross-validation gives prediction errors of 0.071 and 0.117, somewhat larger than the in-sample RMSE because the cross and the irregular polygon carry greater leverage; the fits are therefore interpreted as screening-level parametric trends over the sampled geometries rather than as geometry-independent predictive laws. The 95% confidence intervals are [1.10, 1.49] for the HAZ slope and [0.33, 0.94] for the intercept; a bootstrap analysis (10,000 resamples) gives comparable intervals of [1.12, 1.45] for the slope and [0.42, 0.91] for the intercept.
Because a regression fit alone does not bound the error of a new prediction, 95% prediction intervals are computed and translated into conservative engineering design values in Table 13. For the HAZ case, the upper prediction bound is about 1.13 times the fitted value at low irregularity and about 1.07–1.10 times that value over the remainder of the sampled range; adopting Kt,design = 1.13 Kt,fit therefore covers the prediction interval across the full range, with a corresponding factor of about 1.09 for the no-HAZ case. These factors provide an explicit engineering margin for rapid, screening-level estimation without re-running the finite-element model; they are not a substitute for a case-specific simulation.
Table 13.
Fitted HAZ stress concentration factor, 95% prediction interval, and recommended design value (Kt,design = 1.13 Kt,fit) at representative irregularity indices.
5.5.5. Linear Versus Quadratic Models
A quadratic model, Equation (11), is fitted to test whether the Kt–irregularity relation contains significant curvature.
Kt = a2 I2 + a1 I + a0
The quadratic coefficient is not statistically significant for either case, and the improvement in explained variance is small, as summarised in Table 14; the linear model is therefore retained on the grounds of parsimony as a compact description of the parametric trend. Adding the intermediate shapes reduces Cook’s distance for the irregular polygon from 2.89 (no HAZ) and 2.54 (HAZ) in the six-shape fits to 0.81 and 0.88 in the nine-shape fits, but the cross, which extends the indexed range to I = 2.13 and whose computed Kt lies slightly below that of the polygon, becomes the most influential point, with Cook’s distances of 2.04 and 1.48; both the cross and the polygon remain above the conventional 4/n = 0.44 influence threshold. The fitted lines and the design values derived from them should consequently be used as screening-level trends over the sampled shapes, together with the prediction intervals, rather than as geometry-independent design laws.
Table 14.
Comparison of linear and quadratic regression models over the nine shapes. The F- and p-values test whether adding the quadratic term significantly reduces the residual sum of squares.
To place the computed factors in a wider context, they are compared in Table 15 with the classical elastic reference solutions for openings, which are the most widely used quantitative benchmarks.
Table 15.
Quantitative comparison of the computed stress concentration factors with classical elastic reference solutions. The reference values apply to isothermal remote-tension loading and bound rather than directly reproduce the thermally driven, constrained case.
The thermally driven, constrained Kt values (1.72–3.41) are of the same order as, but not identical to, the isothermal reference values. The circular and square breaches fall below the Kirsch and Peterson factors (by roughly 20–43%) because the thermal reference stress and the constrained, non-uniform heating differ from remote uniform tension, whereas the most irregular shapes (the cross and the irregular polygon, with Kt values of about 3.25–3.41) exceed the single-opening benchmarks owing to their sharp re-entrant corners. The classical solutions are therefore best regarded as sanity bounds on the geometric component rather than as direct predictions of the fire case; the agreement in magnitude supports the credibility of the finite-element results.
Several limitations define the scope of these relations. First, the one-way sequential coupling neglects the feedback of deformation to the fire; Benra et al. [17] showed this feedback to be negligible for small deflections but important once the opening geometry changes, consistent with the present finding that the 2 MW case, in which the breach deformation becomes appreciable, lies outside the validated range. Second, the HAZ properties are assumed rather than measured, and the model represents a single isolated breach in a flat bulkhead, excluding multiple adjacent breaches and dynamic blast loading. The constitutive description also assumes a thermally stable quenched-and-tempered microstructure, which restricts the material model to steel temperatures below about 600 °C, that is, to fire powers of roughly 1.8 MW or less (Section 5.2.1). The empirical relations should therefore be used only within 1.0 ≤ I ≤ 2.13, for 10 mm ship-grade steel plates under post-flashover compartment fires, and together with the stated prediction intervals and margins.
5.6. Implications for Regulatory Fire Safety Assessment
The present results are not a compliance check against a classification rule, but they can be placed within the regulatory framework that governs ship fire safety. Structural fire protection is addressed principally by SOLAS Chapter II-2 [38], which subdivides the ship by fire-resisting boundaries and prescribes the fire integrity of bulkheads and decks, and by the IMO Fire Test Procedures (FTP) Code [39], which defines the furnace tests through which that integrity is demonstrated. Where an arrangement falls outside the prescriptive tables, SOLAS Regulation II-2/17 allows an engineering analysis to be substituted for the prescriptive requirement, provided that the alternative design achieves an equivalent level of safety; field-model-based fire simulation combined with structural analysis is the usual vehicle for such a demonstration, and Salem et al. [40] have recently illustrated its use at ship level with a comparison of zone-model and FDS predictions framed explicitly within Regulation II-2/17.
The Kt-based screening developed here is complementary to that framework rather than a substitute for it. The factor of 1.13 applied to the fitted HAZ Kt (Section 5.5.4) is a prediction-interval margin covering the model uncertainty of the correlation; it is not a code-specified partial safety factor, and a compliance demonstration would still require the case-specific analysis that Section 5.5.4 recommends.
6. Conclusions
This study combined FDS fire simulation with a sequentially coupled thermal–structural analysis in Abaqus to quantify the effects of HAZ material degradation and breach-shape irregularity on the structural stress in ship cabins. The principal conclusions are as follows.
- The HAZ band raises the stress concentration factor along breach edges by approximately 16%, from 1.99 to 2.31 for a rectangular breach, and shifts the peak stress location from the geometric corners to the weakened annular band; the high-stress region expands by a factor of about 1.65.
- Under equal-area conditions, the combined HAZ and irregular polygon effects raise Kt by approximately 71% relative to the regular rectangular breach without HAZ. This is about 8% higher than the independent-product estimate, demonstrating a positive, shape-dependent synergy that is significant only for highly irregular breaches with sharp re-entrant corners, whereas blunt or weakly irregular shapes conform to multiplicative superposition.
- A predominantly linear relation between the shape irregularity index and Kt is found over nine equal-area shapes (Kt = 0.865 I + 0.876 without HAZ; Kt = 1.292 I + 0.634 with HAZ), with R2 values of 0.979 and 0.973. A quadratic term is not statistically significant, but the cross and the irregular polygon remain influential points (Cook’s distances up to 2.04); the relations are therefore presented as screening-level parametric trends over the sampled geometries rather than as predictive design laws.
- The regression is accompanied by 95% prediction intervals and conservative engineering margins: a design factor of 1.13 on the fitted HAZ Kt (1.09 without HAZ) covers the prediction interval across the sampled range, enabling rapid, bounded, screening-level estimation without new simulations, subject to the stated applicability limits.
- The one-way sequential coupling is valid for the small deformations associated with the reference 1 MW fire; at higher power levels, the deformation alters the ventilation and the one-way assumption breaks down; together with the 600 °C limit on the material model established in Section 5.2.1, this defines a practical applicability ceiling of the order of 2 MW.
These findings provide a screening-level, parametric basis for residual strength assessment and repair prioritisation of elastically responding, lightly damaged fire-damaged ship cabins; their quantitative use should be confined to the stated geometry, material, and irregularity range (1.0 ≤ I ≤ 2.13) and made in conjunction with the prediction intervals and margins, and operational decisions should be confirmed by case-specific simulation.
7. Future Perspectives
Several directions follow from the limitations of this study. First and most importantly, the assumed HAZ properties should be replaced by measured property–temperature curves obtained from material extracted around impact breaches, including the spatial gradient from the ASB to the base metal; such tests would also allow the constant-ratio assumption and the 50 mm envelope width to be verified directly.
Second, although the shape library comprises nine shapes, its statistical foundation remains relatively limited; these empirical relationships can be considered fully validated only after additional geometric configurations (particularly asymmetric and multi-notch geometries) are simulated with the complete FDS–Abaqus workflow and incorporated into the analysis. Furthermore, physical model tests on bulkhead panels featuring irregular notches would provide the most robust validation evidence.
Third, the one-way coupling should be upgraded to a two-way fire–structure analysis for scenarios involving large deformation or opening area change, and the model should be extended to include adjacent damaged bays and the combined action of blast and fire. Addressing these items would convert the present screening-level framework into a general tool for the post-fire assessment of warship and commercial-ship structures.
Author Contributions
Conceptualization, Z.P. and J.M.; methodology, Z.P. and F.Y.; software, Z.P. and Y.T.; validation, Z.P.; formal analysis, Z.P. and F.Y.; investigation, Z.P.; resources, J.M.; data curation, Z.P.; writing—original draft preparation, Z.P.; writing—review and editing, J.M. and Y.H. ; visualization, Z.P. and Y.T.; supervision, J.M. and Y.H.; project administration, J.M. and Y.H. All authors have read and agreed to the published version of the manuscript.
Funding
This research received no external funding.
Data Availability Statement
The data supporting the findings of this study are available within the article (Table 1, Table 2, Table 3, Table 4, Table 5, Table 6, Table 7, Table 8, Table 9, Table 10, Table 11, Table 12, Table 13, Table 14 and Table 15 and Figure 1, Figure 2, Figure 3, Figure 4, Figure 5, Figure 6, Figure 7, Figure 8 and Figure 9). The underlying simulation input files and raw output data are available from the corresponding author upon reasonable request.
Acknowledgments
During the preparation of this manuscript, the authors used DeepSeek (version 4.1; DeepSeek, Hangzhou, China) solely for English language polishing and grammatical correction. The AI tool was not used for study design, data analysis, interpretation of results, or drafting of the scientific core content. The authors have thoroughly reviewed and edited the output and take full responsibility for the content of this publication.
Conflicts of Interest
The authors declare no conflicts of interest.
Abbreviations
The following abbreviations are used in this manuscript:
| ASB | Adiabatic shear band |
| CFD | Computational fluid dynamics |
| FDS | Fire Dynamics Simulator |
| FTMI | Fire-Thermomechanical Interface |
| FTP | Fire Test Procedures |
| HAZ | Heat-affected zone |
| HRRPUA | Heat release rate per unit area |
| Kt | Stress concentration factor |
| LES | Large-eddy simulation |
| NIST | National Institute of Standards and Technology |
| PEEQ | Equivalent plastic strain |
| RMSE | Root-mean-square error |
| S4R | Four-node reduced-integration shell element |
| SOLAS | International Convention for the Safety of Life at Sea |
References
- Woo, D.; Seo, J.K. Numerical validation of the two-way fluid-structure interaction method for non-linear structural analysis under fire conditions. J. Mar. Sci. Eng. 2021, 9, 400. [Google Scholar] [CrossRef] [Scilit]
- Prieler, R.; Gerhardter, H.; Landfahrer, M.; Gaber, C.; Schluckner, C.; Eichhorn-Gruber, M.; Schwabegger, G.; Hochenauer, C. Development of a numerically efficient approach based on coupled CFD/FEM analysis for virtual fire resistance tests—Part B: Deformation process of a steel structure. Fire Mater. 2020, 44, 704–723. [Google Scholar] [CrossRef] [Scilit]
- Guo, Z.; Ma, C.; Liu, Y.; Li, F.; Li, C. Residual strength prediction and structural response of a multi-chamber cabin to a fire. J. Mar. Eng. Technol. 2023, 22, 294–303. [Google Scholar] [CrossRef] [Scilit]
- Zong, S.; Liu, K.; Qiu, W.; Gao, Z.; Wang, J. Numerical and experimental analysis of fire resistance for bulkhead and deck structures of ships and offshore installations. J. Mar. Sci. Eng. 2023, 11, 1200. [Google Scholar] [CrossRef] [Scilit]
- Choi, J.; Kim, H.; Haj-Ali, R. Integrated fire dynamics and thermomechanical modeling framework for steel-concrete composite structures. Steel Compos. Struct. 2010, 10, 129–149. [Google Scholar] [CrossRef] [Scilit]
- Zhu, X.; Zhong, C.; Yang, Z. Effects of ventilation and fire power on bulkhead damage by temperature simulation model and experiment analysis. In Proceedings of the 2012 Sixth International Conference on Internet Computing for Science and Engineering (ICICSE), Zhengzhou, China, 21–23 April 2012; IEEE: New York, NY, USA, 2012; pp. 70–75. [Google Scholar] [CrossRef] [Scilit]
- Tabri, K.; Naar, H.; Kõrgesaar, M. Ultimate strength of ship hull girder with grounding damage. Ships Offshore Struct. 2020, 15, S161–S175. [Google Scholar] [CrossRef] [Scilit]
- Kirsch, G. Die Theorie der Elastizität und die Bedürfnisse der Festigkeitslehre. Z. Ver. Dtsch. Ing. 1898, 42, 797–807. (In German) [Google Scholar]
- Inglis, C.E. Stresses in a plate due to the presence of cracks and sharp corners. Trans. Inst. Nav. Archit. 1913, 55, 219–241. [Google Scholar]
- Peterson, R.E. Stress Concentration Factors; Wiley: New York, NY, USA, 1974. [Google Scholar]
- Kim, U.-N.; Choe, I.-H.; Paik, J.K. Buckling and ultimate strength of perforated plate panels subject to axial compression: Experimental and numerical investigations with design formulations. Ships Offshore Struct. 2009, 4, 337–361. [Google Scholar] [CrossRef] [Scilit]
- TWI. The Significance of Softened HAZs in High Strength Structural Steels. Available online: https://www.twi-global.com/technical-knowledge/published-papers/the-significance-of-softened-hazs-in-high-strength-structural-steels-may-2003 (accessed on 8 October 2026).
- Souza, E.R.S.; Weber, R.P.; Monteiro, S.N.; de Sant’Ana Oliveira, S. Microstructure effect of heat input on ballistic performance of welded high strength armor steel. Materials 2021, 14, 5789. [Google Scholar] [CrossRef] [Scilit] [PubMed]
- Kou, S. Welding Metallurgy, 2nd ed.; Wiley: Hoboken, NJ, USA, 2003. [Google Scholar]
- Xu, L.; Zhan, P.; Yi, T.; Zhang, S.; He, J.; Li, M. Research on the constitutive relationship of the coarse-grained heat-affected zone in ship thick-plate welded joints of ship structures. J. Mar. Sci. Eng. 2025, 13, 1260. [Google Scholar] [CrossRef] [Scilit]
- McGrattan, K.; Hostikka, S.; McDermott, R.; Floyd, J.; Weinschenk, C.; Overholt, K. Fire Dynamics Simulator (Version 6.7.5): User’s Guide, 6th ed.; NIST Special Publication 1019; National Institute of Standards and Technology: Gaithersburg, MD, USA, 2020. [Google Scholar] [CrossRef] [Scilit]
- Benra, F.-K.; Dohmen, H.J.; Pei, J.; Schuster, S.; Wan, B. A comparison of one-way and two-way coupling methods for numerical analysis of fluid-structure interactions. J. Appl. Math. 2011, 2011, 853560. [Google Scholar] [CrossRef] [Scilit]
- Zatorski, Z. Ballistic penetration response of high strength bainitic steel. J. Phys. IV 2000, 10, Pr9-571–Pr9-576. [Google Scholar] [CrossRef] [Scilit]
- McGrattan, K.; Hostikka, S.; McDermott, R.; Floyd, J.; Weinschenk, C.; Overholt, K. Fire Dynamics Simulator (Version 6.7.5): Technical Reference Guide Volume 3, Validation, 6th ed.; NIST Special Publication 1018-3; National Institute of Standards and Technology: Gaithersburg, MD, USA, 2020. [Google Scholar]
- Yan, X.; Gernay, T. Numerical modeling of localized fire exposures on structures using FDS-FEM and simple models. Eng. Struct. 2021, 246, 112997. [Google Scholar] [CrossRef] [Scilit]
- Rodrigues, J.P.C.; Cabrita Neves, I.; Valente, J.C. Experimental research on the critical temperature of compressed steel elements with restrained thermal elongation. Fire Saf. J. 2000, 35, 77–98. [Google Scholar] [CrossRef] [Scilit]
- GJB 1663A-2005; 921A (10CrNi3MoV) Steel Plate. Chinese Military Standard. Commission of Science, Technology and Industry for National Defense: Beijing, China, 2005. (In Chinese)
- Zhu, B.; Wu, G. Numerical simulation on truncated oval-nosed projectile penetrating into stiffened plate. Chin. J. Ship Res. 2022, 17, 244–251. (In Chinese) [Google Scholar] [CrossRef]
- Cheng, Q.; Zhang, H.; Guo, N.; Chen, W.; Zhang, X.; Pang, Y. Effects of tempering temperature on microstructure evolution and mechanical properties of high-strength low-alloy steel prepared by underwater laser melting deposition. Mater. Charact. 2026, 239, 116623. [Google Scholar] [CrossRef] [Scilit]
- Ye, C.; Lu, G.; Ni, L.; Liu, Q.; Hou, S.; Tong, H.; Yao, Y.; Zhou, J. Effects of heat treatment on microstructure and mechanical properties of explosive welded 10CrNi3MoV steel–304L stainless steel. Mater. Lett. 2020, 262, 127053. [Google Scholar] [CrossRef] [Scilit]
- Rogers, H.C. Adiabatic plastic deformation. Annu. Rev. Mater. Sci. 1979, 9, 283–311. [Google Scholar] [CrossRef] [Scilit]
- EN 1993-1-2:2005; Eurocode 3: Design of Steel Structures—Part 1–2: General Rules—Structural Fire Design. European Committee for Standardization CEN: Brussels, Belgium, 2005. Available online: https://eurocodes.jrc.ec.europa.eu/EN-Eurocodes/eurocode-3-design-steel-structures (accessed on 8 October 2026).
- Cho, K.; Lee, S.; Nutt, S.R.; Duffy, J. Adiabatic shear band formation during dynamic torsional deformation of an HY-100 steel. Acta Metall. Mater. 1993, 41, 923–932. [Google Scholar] [CrossRef] [Scilit]
- Murr, L.E.; Foltz, J.V. A terminal ballistics application of transmission electron microscopy: The anatomy of a bullet hole. J. Mater. Sci. 1970, 5, 63–81. [Google Scholar] [CrossRef] [Scilit]
- Rodrigues, D.M.; Menezes, L.F.; Loureiro, A.; Fernandes, J.V. Numerical study of the plastic behaviour in tension of welds in high strength steels. Int. J. Plast. 2004, 20, 1–18. [Google Scholar] [CrossRef] [Scilit]
- Holmquist, T.J. Strength and Fracture Characteristics of HY-80, HY-100, and HY-130 Steels Subjected to Various Strains, Strain Rates, Temperatures, and Pressures; NSWC TR 88-252; prepared for the Naval Surface Warfare Center; DTIC Accession No. ADA233061; Armament Systems Division, Honeywell Inc.: Brooklyn Park, MN, USA, 1987; Available online: https://scispace.com/pdf/strength-and-fracture-characteristics-of-hy-80-hy-100-and-hy-3zjyxj77z1.pdf (accessed on 12 October 2026).
- Kirby, B.R.; Preston, R.R. High temperature properties of hot-rolled structural steels for use in fire engineering design studies. Fire Saf. J. 1988, 13, 27–37. [Google Scholar] [CrossRef] [Scilit]
- Rust, B.; Stroetmann, R.; Neumann, M.; Hälsig, A.; Hensel, J. Experimental investigation of the influence of the HAZ on the strength of welded T-joints made of HSS. Steel Constr. 2025, 18, 209–222. [Google Scholar] [CrossRef] [Scilit]
- Steckler, K.D.; Quintiere, J.G.; Rinkinen, W.J. Flow Induced by Fire in a Compartment; NBSIR 82-2520; National Bureau of Standards: Washington, DC, USA, 1982. Available online: https://fire.nist.gov/bfrlpubs/fire82/PDF/f82022.pdf (accessed on 11 October 2026).
- Li, Q.; Zhang, J.; Lu, S. Influence of roof opening on gas temperature rise in an enclosure. Procedia Eng. 2013, 62, 194–201. [Google Scholar] [CrossRef] [Scilit]
- Jiao, Y.; Wang, J.-H.; Xiao, M.-J.; Xu, T.; Chen, W.-J. Development of field-zone-net model for fire smoke propagation simulation in ships. In Proceedings of the 2014 7th International Conference on Intelligent Computation Technology and Automation (ICICTA), Changsha, China, 25–26 October 2014; IEEE: New York, NY, USA, 2015; pp. 190–193. [Google Scholar] [CrossRef] [Scilit]
- Karlsson, B.; Quintiere, J.G. Enclosure Fire Dynamics; CRC Press: Boca Raton, FL, USA, 2000. [Google Scholar]
- International Maritime Organization. Chapter II-2: Construction—Fire Protection, Fire Detection and Fire Extinction. In International Convention for the Safety of Life at Sea (SOLAS); IMO: London, UK, 2020; Available online: https://www.imo.org/en/About/Conventions/Pages/International-Convention-for-the-Safety-of-Life-at-Sea-(SOLAS),-1974.aspx (accessed on 8 October 2026).
- International Maritime Organization. International Code for Application of Fire Test Procedures (FTP Code), MSC.307(88); IMO: London, UK, 2010; Available online: https://www.imo.org/en/About/Conventions/Pages/List-of-Codes.aspx (accessed on 8 October 2026).
- Salem, A.; Mauro, F.; Vassalos, D. The role of zone models in the numerical prediction of fire scenario outcomes onboard passenger ships. J. Mar. Sci. Eng. 2024, 12, 26. [Google Scholar] [CrossRef] [Scilit]

Disclaimer/Publisher’s Note: The statements, opinions and data contained in all publications are solely those of the individual author(s) and contributor(s) and not of MDPI and/or the editor(s). MDPI and/or the editor(s) disclaim responsibility for any injury to people or property resulting from any ideas, methods, instructions or products referred to in the content. |
© 2026 by the authors. Licensee MDPI, Basel, Switzerland. This article is an open access article distributed under the terms and conditions of the Creative Commons Attribution (CC BY) license.