


Abstract
Double-line ship mooring (DLSM) can allow an outer feeder vessel to be handled alongside an inner mainline vessel and thereby enable direct ship-to-ship container transshipment. The aim of this study is to determine whether, and under what modeled conditions, a static one-to-one DLSM arrangement can improve berth and quay-crane planning while enabling direct transfer. A normative formulation represents berth sharing, vessel-length compatibility, temporal containment, terminal-wide crane capacity, and the lower productivity of a cross-over quay crane. The executable framework addresses a restricted decision space: particle swarm optimization (PSO) searches berth assignments, deterministic rules generate quay-crane counts and DLSM pairs, and a constructive scheduler produces and evaluates service times. Performance is assessed through a two-by-two FCFS/PSO and SLSM/DLSM ablation on 45 synthetic instances, supplemented by 20 independent runs of each PSO scheme on nine prospectively selected representative instances. PSO-DLSM reduced the composite objective by 49.27% relative to PSO-SLSM in the repeated-run analysis (two-sided paired t-test, Holm-adjusted p < 0.001; Cohen’s dz = 2.27), whereas PSO-SLSM did not significantly outperform FCFS-SLSM. Sensitivity analyses further show that DLSM performance is conditional on cross-over handling efficiency, the penalty assigned to indirect transshipment, and binding quay-crane capacity. The evidence therefore attributes the observed improvement to the complementarity between berth search and DLSM-enabled direct transfer rather than to PSO alone. An independent-feeder-arrival stress test showed that the benefit can disappear when compatible overlaps are scarce. The framework therefore supports conditional planning-level screening, not a general performance guarantee.
1. Introduction
1.1. Operational Background
Container hub terminals coordinate mainline services, feeder connections, and transshipment flows under finite berth frontage and quay-crane capacity. Berth allocation determines where and when a vessel receives service, while quay-crane deployment governs handling time and equipment availability during overlapping calls. The two decisions are operationally coupled. Under single-line ship mooring (SLSM), vessels assigned to the same berth are served sequentially. Double-line ship mooring (DLSM) instead allows an eligible outer vessel to berth alongside an inner vessel, relaxing the spatial exclusivity of a conventional berth plan. When the vessels share a transshipment connection, overlapping service may permit direct ship-to-ship transshipment rather than yard-mediated handling. The value of DLSM therefore depends on berth occupancy, vessel pairing, temporal compatibility, crane capacity, and cross-over handling efficiency.
1.2. Literature Review
Quayside-planning research has moved beyond isolated berth allocation toward models that coordinate berth allocation, quay-crane assignment, and quay-crane scheduling. The foundational reviews classify this work by berth layout, arrival pattern, crane policy, objective, and solution method, while a survey of uncertainty explains how uncertain vessel arrivals and operations motivate proactive, reactive, and combined planning [1,2,3]. A recent JMSE systematic review confirms the continuing shift toward integrated BAP, QCAP, and QCSP formulations with richer operating conditions [4]. Recent models add operational detail through continuous or discretized quay space, specific and time-varying crane assignments, crane ranges and non-crossing requirements, and crane travel and setup times [5,6,7]. JMSE studies further extend combined berth-crane planning to hybrid uncertainty and multi-quay settings [8,9]. Robust and distributionally robust formulations address arrival uncertainty [10,11], while broader coordination models connect berth decisions with yard allocation, cooperation among terminals, green technologies, shore power, and tug scheduling [12,13,14]. The field is thus moving toward quayside plans that account for physical executability, multiple resources, and the operating context.
Research on double-bank, parallel, and double-line berthing remains smaller in volume, but it addresses a fundamental departure from the conventional one-vessel-per-quay-position assumption: service of an outer vessel depends on an inner vessel. One parallel-berthing formulation jointly optimizes berth and quay-crane allocation when two feeder vessels share a berth and explicitly represents the parallel-berthing relationship and safety distance [15]. A related double-berth mooring model coordinates berth allocation with vessel and one-way-channel scheduling; its results link the benefit of parallel mooring to navigation sequence, preparation time, safe distance, and arrival density [16]. Nonconventional mooring therefore cannot be represented by a simple increase in nominal berth capacity. Its feasibility rests on additional spatial, temporal, and operational conditions.
A related line of research coordinates transshipment connections with berth planning. Direct ship-to-ship transshipment requires connected vessels to coincide in space and time, whereas indirect transshipment routes containers through intermediate yard storage. Dynamic berth planning with ship-to-ship connections shows that the direct-versus-indirect transfer decision should be coordinated with the berthing plan rather than imposed as an exogenous yard flow [17]. BACAP-STS models add specific quay-crane assignment and use a bi-objective formulation to balance vessel service performance against crane deployment [18]. Dynamic double-line multi-ship mooring goes further by combining inner–outer berthing, quay-crane operations, direct transshipment, and feeder replacement within one optimization framework [19]. DLSM and direct transshipment have consequently progressed from separate berth-planning extensions to coupled decision settings.
1.3. Research Gap, Research Questions, and Contributions
These advances leave a narrower research question than a general claim that DLSM, quay-crane allocation, and direct ship-to-ship transshipment have not been studied together [15,16,17,18,19]. The issue considered here is how a static asymmetric DLSM arrangement performs when an outer feeder must share the berth of its designated inner mainline vessel, remain within the mainline service interval, satisfy vessel-length compatibility, and draw on a terminal-wide crane pool. Answering that question also requires separating the effect of berth search from the effect of enabling DLSM. A comparison between an optimized DLSM schedule and an FCFS-SLSM baseline alone would confound those effects.
Accordingly, the study addresses three research questions. RQ1: How can static asymmetric DLSM be represented while accounting for shared berths, designated mainline–feeder relations, temporal containment, vessel-length compatibility, and differentiated quay-crane productivity? RQ2: Within the implemented two-stage framework, what are the separate effects of the berth-search policy and DLSM availability on the composite planning objective? RQ3: How do cross-over handling efficiency, the indirect-transshipment penalty, and terminal-wide quay-crane capacity delimit the observed benefit of DLSM?
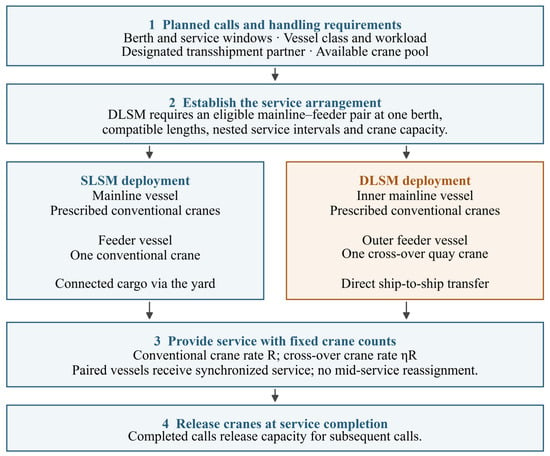
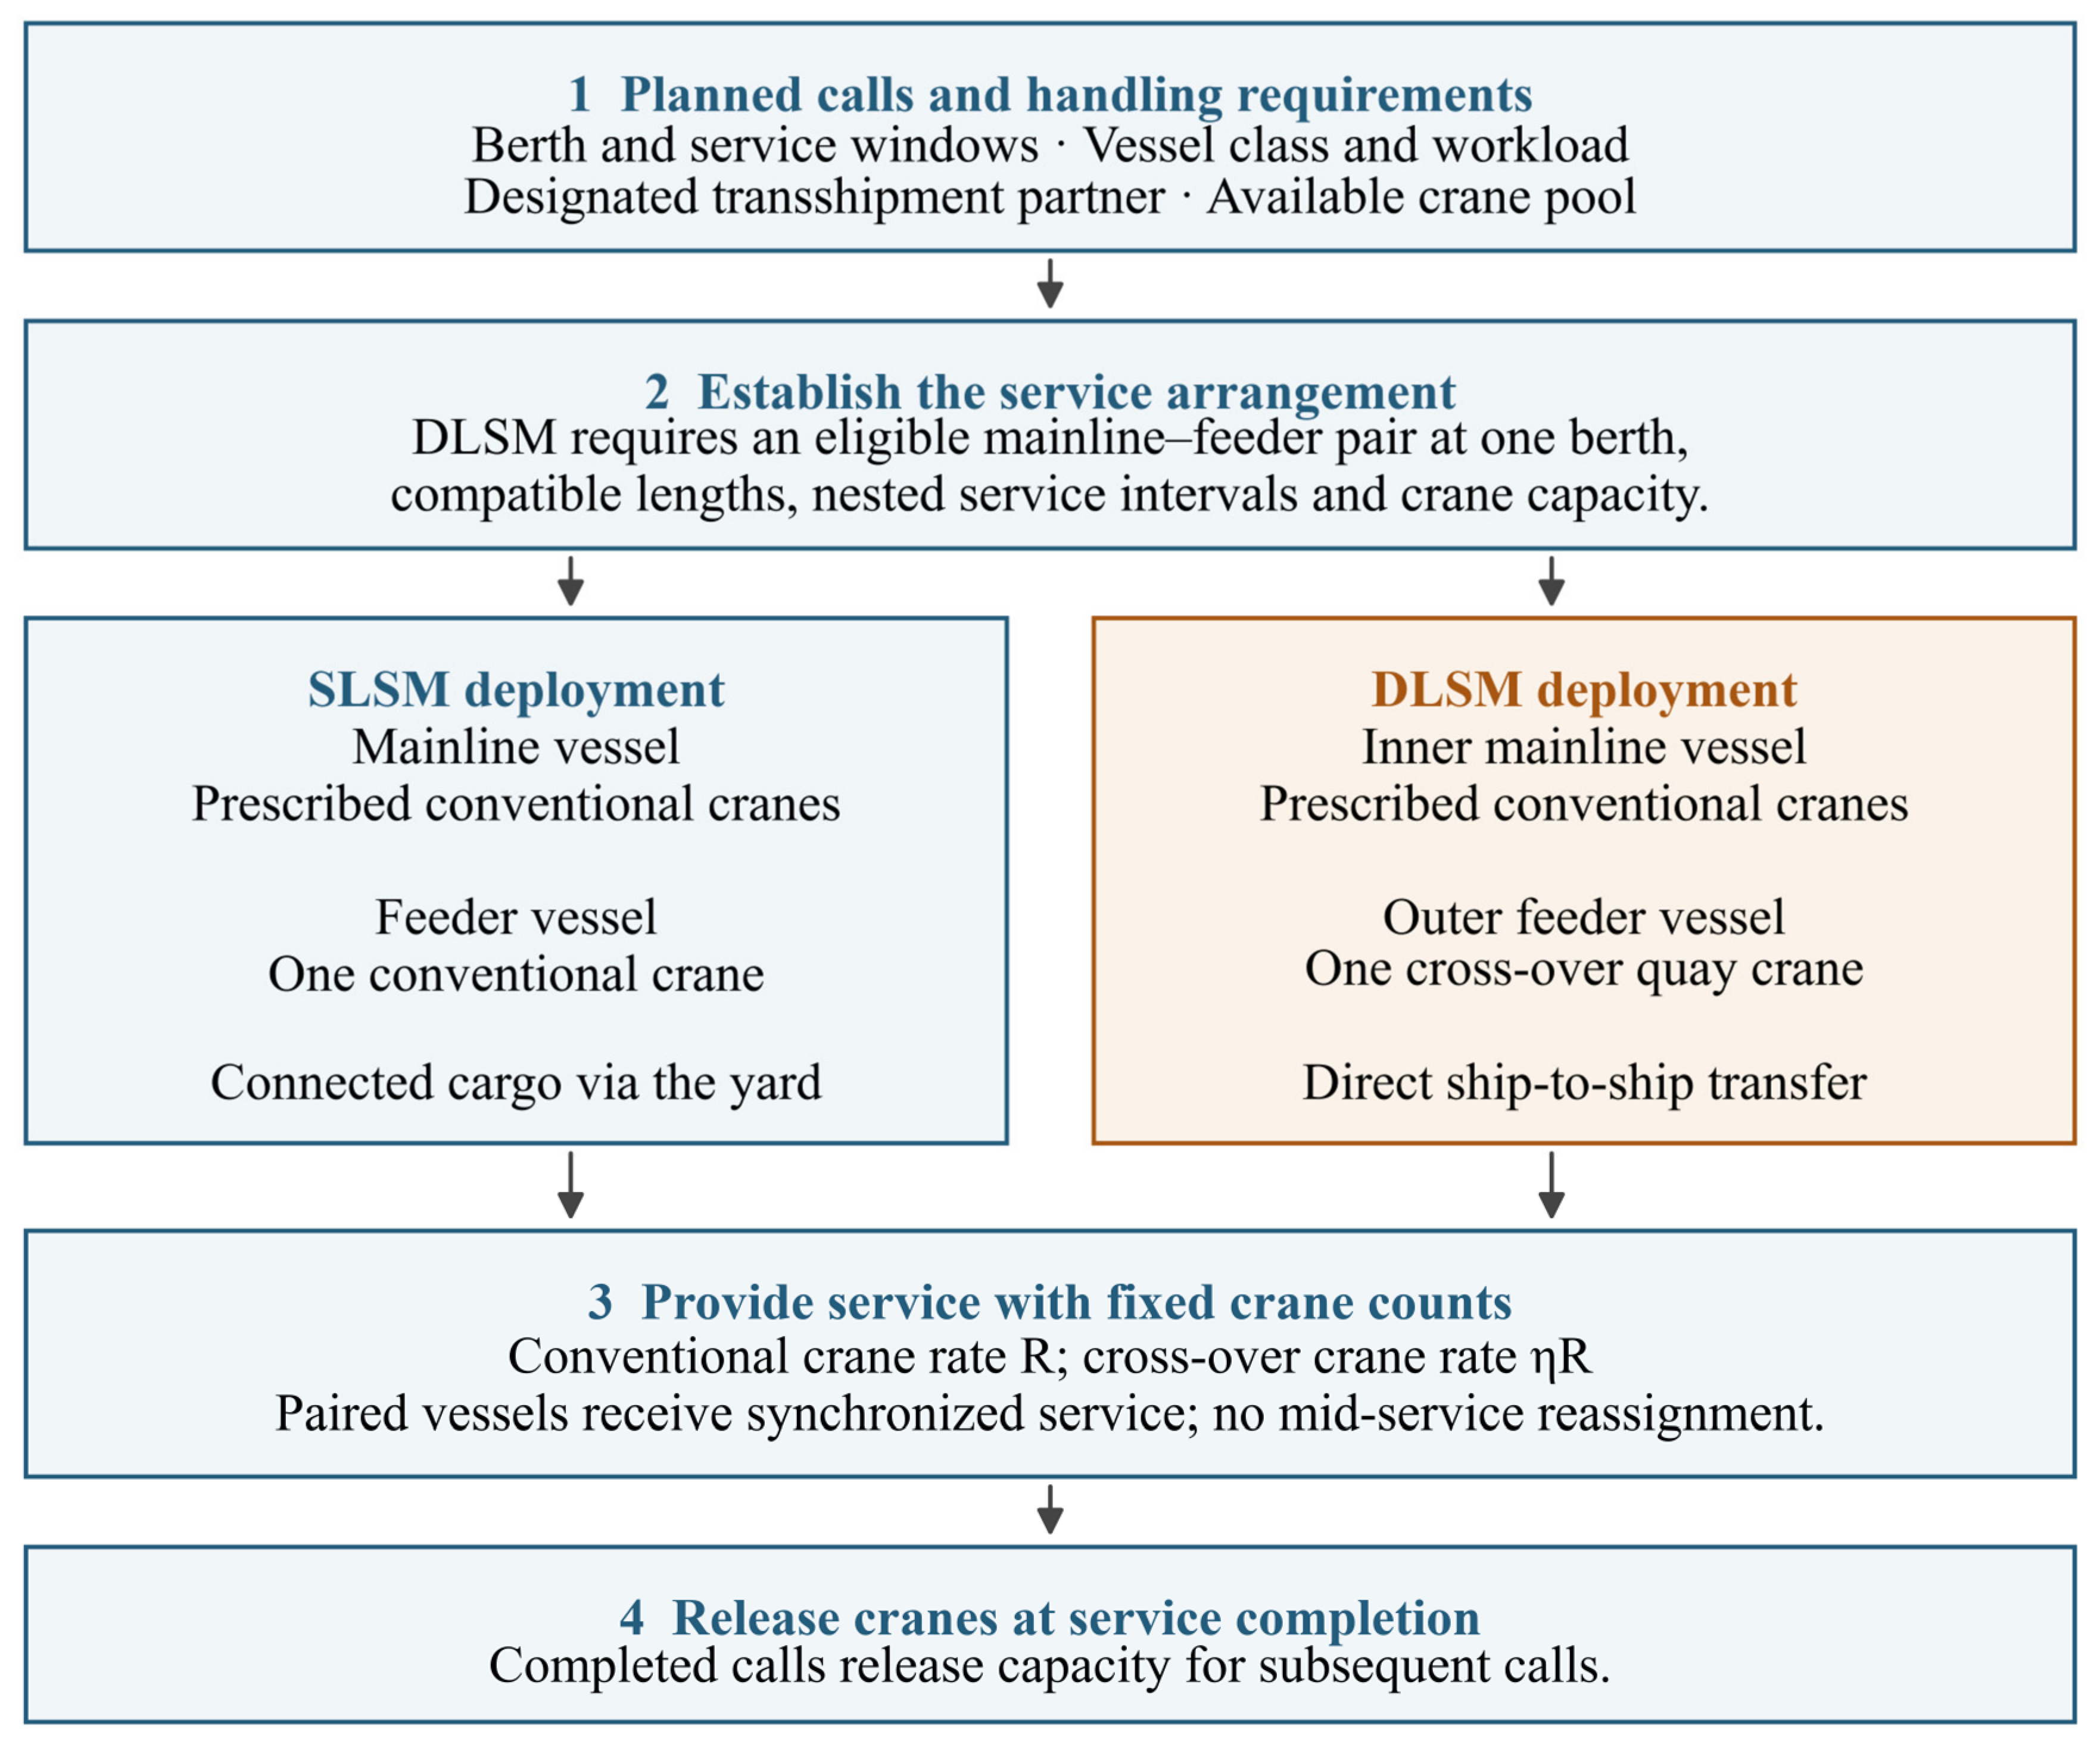
A normative berth-crane-DLSM formulation organizes the full planning space, while a restricted implementation provides the executable solution procedure. PSO only searches vessel-berth assignments. A rule-based completion stage assigns conventional and cross-over quay-crane requirements, generates eligible one-to-one DLSM pairs, and constructs service start and completion times. The scheduler checks the implemented conditions for water depth, berth closing, vessel length, service containment, pairing uniqueness, and quay-crane capacity at every service-start and service-completion event. Its objective combines vessel time in port and delay with a penalty for transshipment routed through the yard. The experiments evaluate FCFS-SLSM, FCFS-DLSM, PSO-SLSM, and PSO-DLSM on the same synthetic instances and add repeated runs, an implementation-space enumeration benchmark, and parameter sensitivity analyses. Figure 1 outlines the operational deployment of conventional and cross-over quay cranes for planned SLSM and DLSM services.
Figure 1.
Operational quay-crane deployment for planned vessel calls under SLSM and DLSM. Conventional cranes serve mainline vessels and SLSM feeders; one cross-over quay crane serves each paired outer feeder. Counts remain fixed during service, and capacity is released at completion. The diagram represents the modeled operating process, not crane trajectories or the optimization algorithm.
The contribution has four parts. The study represents the operational asymmetry of synchronized service between an inner mainline vessel and an outer feeder vessel under static DLSM. The normative constraints describe same-berth use, vessel-length compatibility, temporal containment, one-to-one pairing, and crane capacity, while designated-partner eligibility is enforced by the constructive scheduler. The framework links direct ship-to-ship transshipment to berth occupancy and to the different handling rates of conventional and cross-over quay cranes. Finally, the FCFS/PSO by SLSM/DLSM design, together with the sensitivity analyses, separates the effects of search policy and mooring mode and identifies conditions under which DLSM is useful. These contributions apply to the modeled setting and constructive scheduler; PSO itself is not presented as a methodological contribution.
1.4. Organization of the Paper
The remainder of the paper is organized as follows. Section 2 defines the operational setting, normative formulation, implemented search space, constructive scheduler, and experimental design. Section 3 reports the benchmark, ablation, repeated-run, and sensitivity results. Section 4 interprets the findings in relation to previous berth-planning, parallel-berthing, and ship-to-ship-transshipment research and discusses applicability and limitations. Section 5 presents the conclusions and future research directions.
2. Materials and Methods
2.1. Operational Setting and Problem Definition
The planning problem concerns a container hub terminal over a finite planning horizon. The quay is divided into discrete berths, each with specified opening and closing times and water depth. Mainline and feeder vessels arrive during the horizon; each vessel must be assigned to one berth and receive sufficient quayside handling capacity.
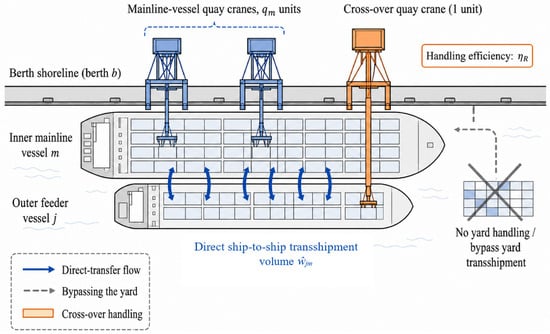
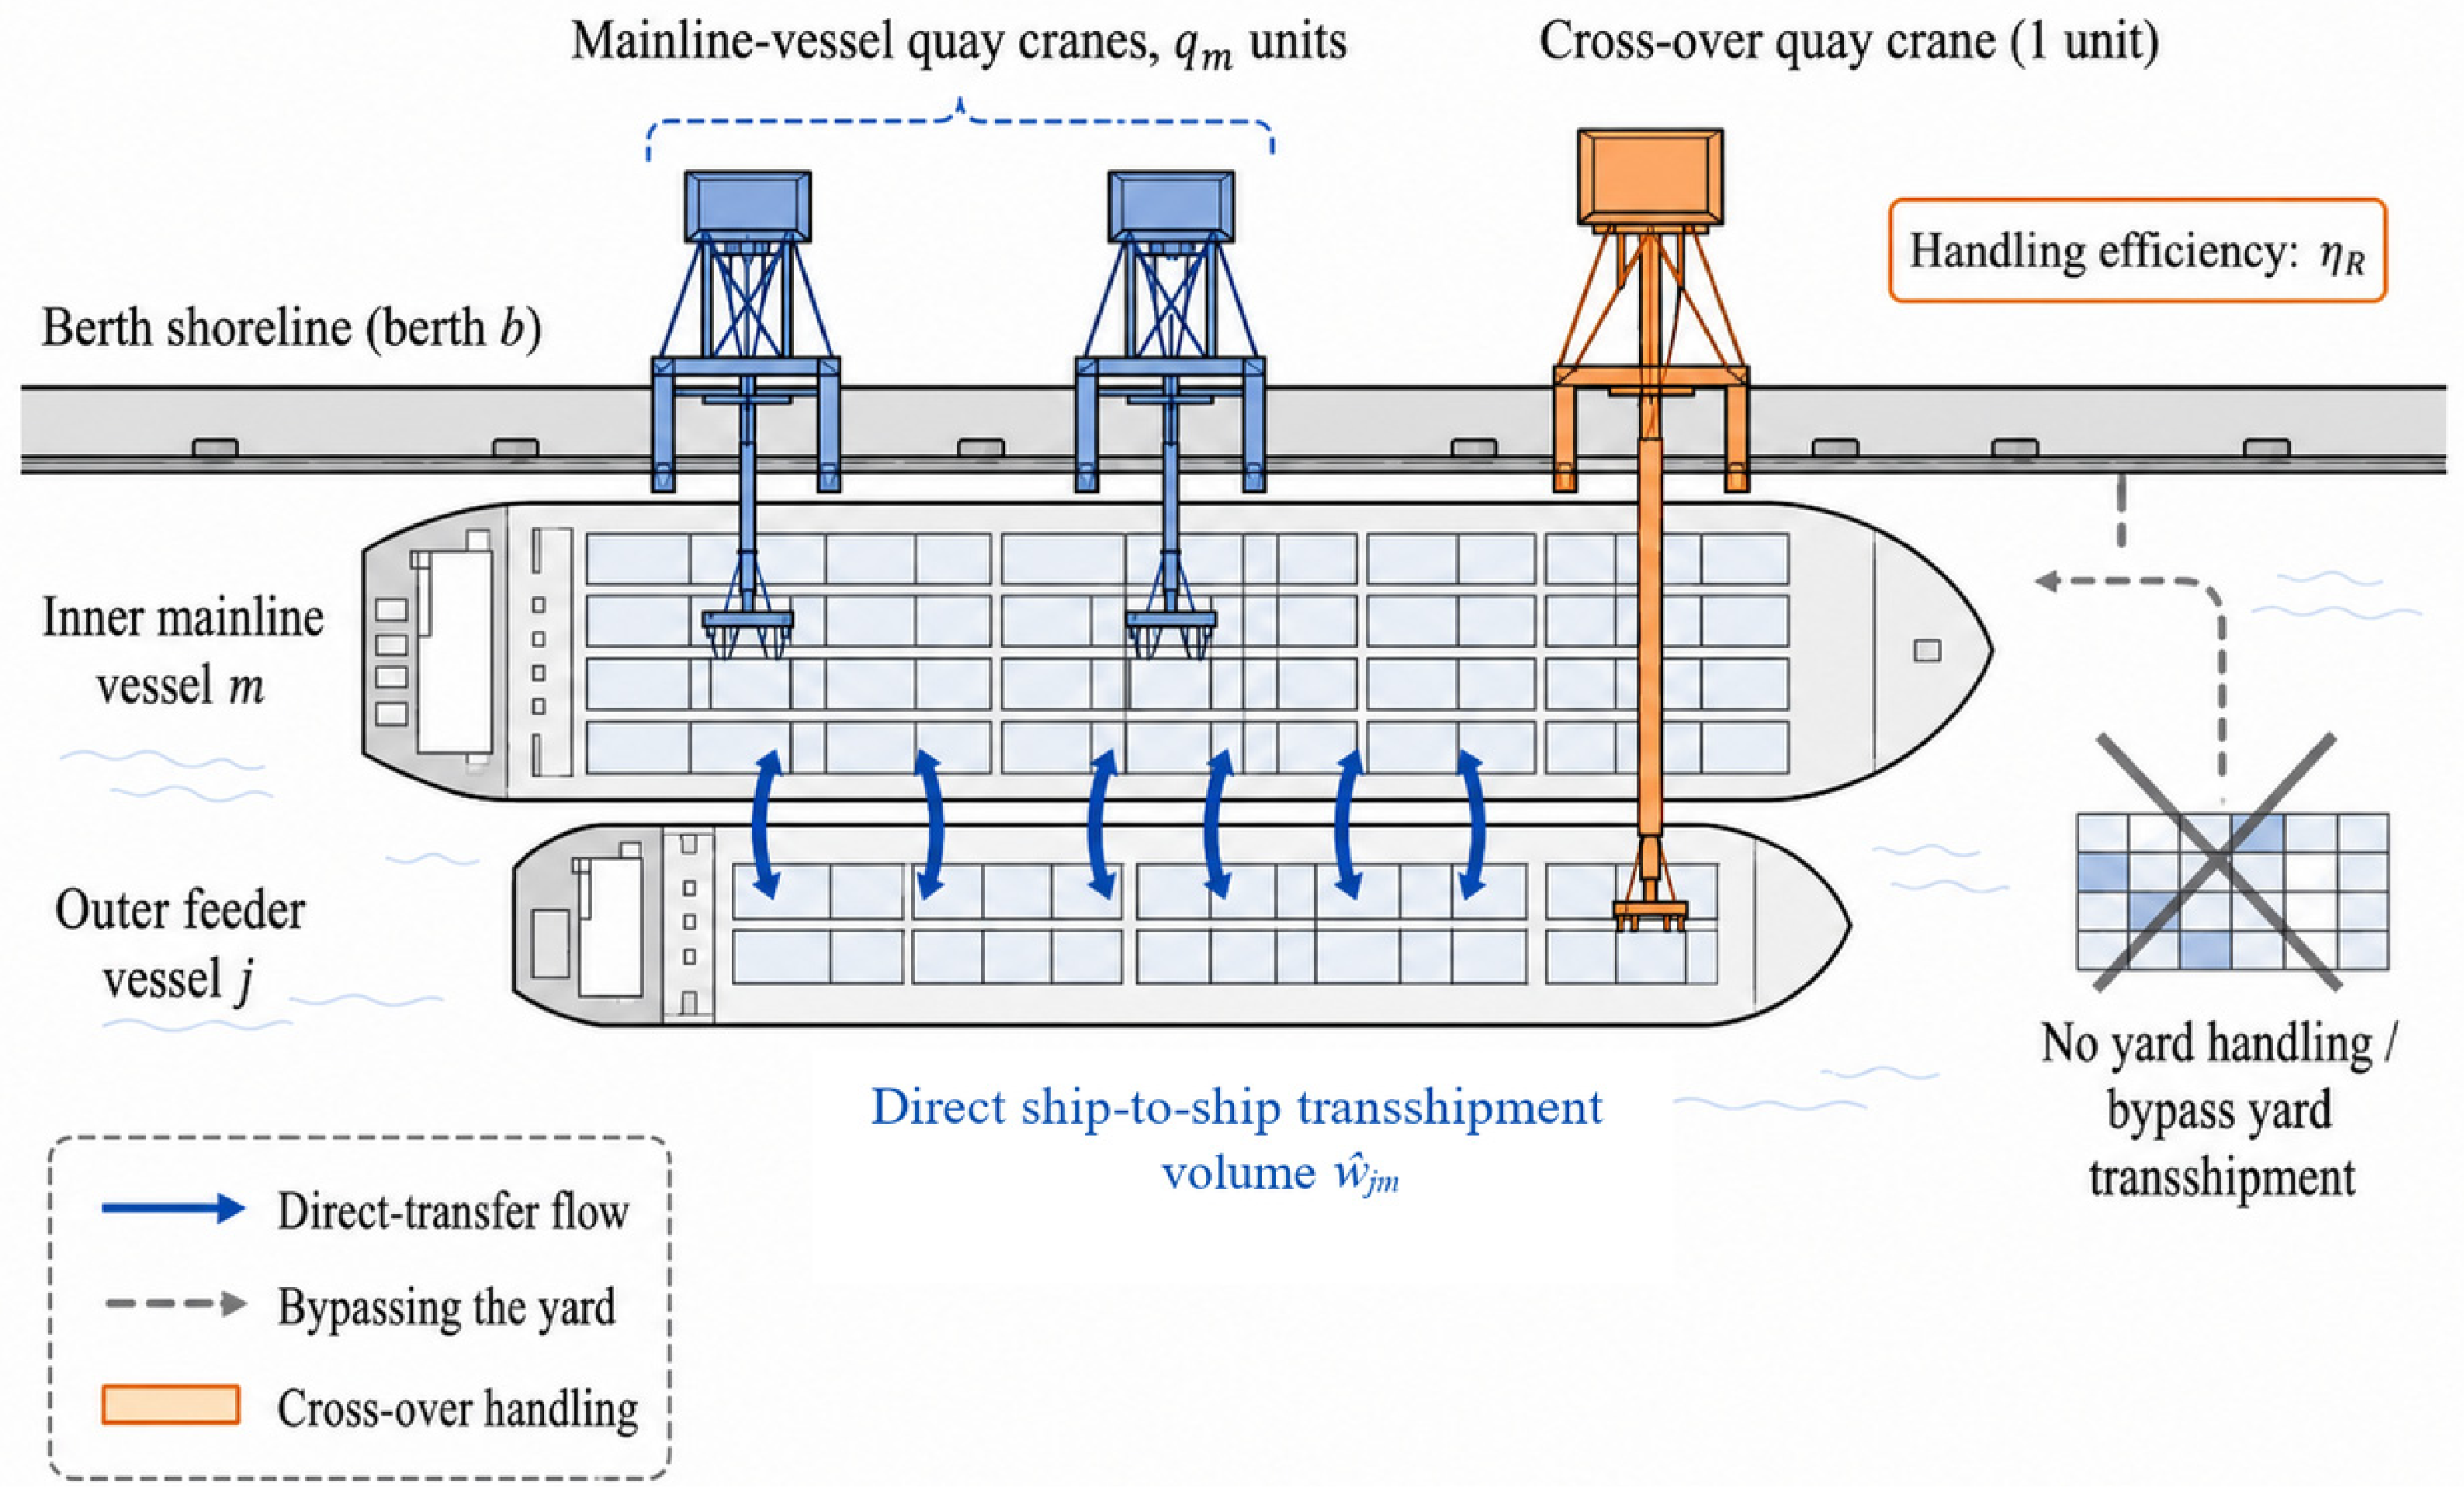
Under single-line ship mooring (SLSM), vessels assigned to the same berth are handled sequentially. Under double-line ship mooring (DLSM), an eligible feeder vessel may occupy the outer position beside a mainline vessel at the same berth. One cross-over quay crane serves this outer feeder at the reduced handling rate ηR, while conventional quay cranes continue to serve the inner mainline vessel. Containers in the paired sea–sea transshipment connection can then undergo direct ship-to-ship transshipment rather than pass through the yard.
The normative formulation contains berth-assignment, quay-crane-count, vessel-sequencing, DLSM pairing, service-timing, delay, and service-state variables. The executable framework searches only the berth-assignment variables with PSO. Deterministic rules generate quay-crane counts and candidate DLSM pairs, after which the constructive scheduler derives service start times, handling times, completion times, delays, and implicit berth sequences. Other auxiliary states are either implied by the constructed schedule or absent from the code. Section 2.2.4 and Section 2.3 formalize this distinction, and Figure 2 depicts the inner- and outer-vessel arrangement.
Figure 2.
Operational setting under double-line ship mooring.
2.2. Normative Mathematical Representation
2.2.1. Modeling Assumptions
- Vessel arrivals are deterministic and equal their scheduled times; the model excludes arrival uncertainty. This assumption follows the deterministic planning setting used in foundational berth-allocation and quay-crane studies and distinguished from uncertain-arrival models in the relevant reviews [1,2,3].
- A mainline vessel’s handling time depends on its container handling volume and assigned quay-crane count, consistent with berth-crane formulations that link service duration to assigned crane capacity [5,6,7]. Mainline vessels receive two to four quay cranes within their admissible bounds, while each feeder vessel uses one quay crane.
- The quay-crane count remains fixed throughout each vessel’s service. This is a tactical simplification relative to models with time-varying or crane-specific assignments [6,7]; dynamic crane reassignment is excluded.
- When DLSM is enabled, one cross-over quay crane serves the outer feeder at rate ηR, where 0 < η ≤ 1. Cross-over handling does not affect the handling rate of the inner mainline vessel.
- The simultaneous crane demand of all vessels in service cannot exceed the terminal-wide quay-crane capacity Q, as in integrated berth-crane planning [5,7,8]. Service occupancy uses the half-open interval [Si, Ci): a vessel releasing cranes at Ci does not overlap a vessel starting at the same time. Capacity is evaluated at every start and completion event; demand is constant between events under fixed deployment.
- A valid DLSM pair must use the same berth and comprise a feeder vessel and its designated mainline transshipment partner. The mainline vessel must satisfy the vessel-length compatibility condition, and the feeder’s service interval must fall within the mainline vessel’s service interval. Pairing is one-to-one. These assumptions abstract the spatial, temporal, and pairing dependencies emphasized in parallel- and double-line-berthing studies [15,16,19].
- Sea–sea transshipment containers in a valid DLSM pair undergo direct ship-to-ship transshipment and incur no non-direct-transshipment penalty. All other connected containers pass through the yard and incur the penalty defined in the objective, consistent with the direct-versus-yard-mediated distinction in ship-to-ship transshipment planning [17,18,19]. Table 1 lists the sets, parameters, and decision variables.Table 1. Symbols and descriptions.
2.2.2. Objective Function
The composite objective contains total vessel time in port, vessel-specific delay penalties, and penalties for sea–sea transshipment containers that are not transferred directly. Total vessel time in port has unit weight; the delay and indirect-transshipment coefficients set the relative weights of the remaining components. The objective is
The first term measures total vessel time in port, and the second penalizes completion after scheduled departure. The third applies the indirect-transshipment weight to the transshipment volume whenever feeder vessel j and mainline vessel m do not form a valid DLSM pair; the term is zero when direct ship-to-ship transshipment occurs. Because relative weights combine quantities with different operational interpretations, the objective value is a composite score rather than a monetized operating cost.
2.2.3. Constraints
Constraints (2)–(23) provide a normative representation of berth assignment and compatibility, service timing, quay-crane bounds and terminal-wide capacity, berth sequencing, DLSM eligibility, vessel-length screening, service-window containment, pairing uniqueness, and variable domains. The representation is not a closed standalone MINLP because several logical links, including designated-partner eligibility, are implemented procedurally by the constructive scheduler, as specified in Section 2.2.4.
Constraint (2) assigns each vessel to one berth, and Constraint (3) imposes water-depth compatibility. Constraints (4) and (5) prevent service from starting before the vessel arrives or the berth opens. Constraint (6) defines completion time; Constraint (7) requires completion before the berth closes.
Constraints (8)–(10) impose workload lower bounds on handling times for mainline vessels, feeder vessels under SLSM, and outer feeder vessels under DLSM. Constraint (11) bounds the quay-crane count assigned to each mainline vessel. Constraints (12) and (13) define nonnegative delay as completion time beyond scheduled departure. With the positive-integer duration domain in Constraint (23), the scheduler selects the smallest integer hour count that satisfies the applicable workload bound. Start and completion times remain continuous.
Constraint (14) limits the combined number of quay cranes used simultaneously by mainline vessels, feeder vessels under SLSM, and cross-over quay cranes under DLSM to Q.
Constraints (15) and (16) enforce berth sequencing unless two vessels form an eligible DLSM pair. Constraint (17) imposes the same-berth requirement on a paired feeder and mainline vessel; it does not by itself encode designated-partner eligibility, which is applied by the scheduler.
Constraint (18) imposes vessel-length compatibility, while Constraints (19) and (20) contain the outer feeder’s service interval within that of the mainline vessel. Constraints (21) and (22) enforce one-to-one pairing; Constraint (23) specifies the variable domains.
2.2.4. Implemented Decision Space
The normative representation has a mixed-integer nonlinear programming (MINLP) structure because handling time depends on the product of quay-crane count and service duration, while sequencing and DLSM eligibility involve logical conditions. Its decision space is broader than that of the executable heuristic. PSO searches only vessel-berth assignments; rules generate mainline-vessel quay-crane counts and DLSM pairs; and the constructive scheduler derives service start times, handling times, completion times, delays, and implicit service order. The code neither searches the formulation’s sequencing, service-state, and DLSM-exemption variables nor represents quay-crane non-crossing, crane travel, or dynamic reassignment. The formulation should therefore be read as a normative problem description, not as the exact decision space searched by PSO. In particular, the written representation does not include complete algebraic links from the service-state variables to service start and completion times, from the DLSM sequencing-exemption variables to the pairing variables, or from pairing variables to designated-partner eligibility. These relations are enforced procedurally in the executable scheduler. Service occupancy is defined on [Si, Ci], so an immediate crane handover at a completion time is not counted as simultaneous use. Accordingly, the equations should not be interpreted as a closed standalone MINLP until the missing links are added and verified.
2.3. PSO-Based Berth Search and Rule-Based Schedule Construction
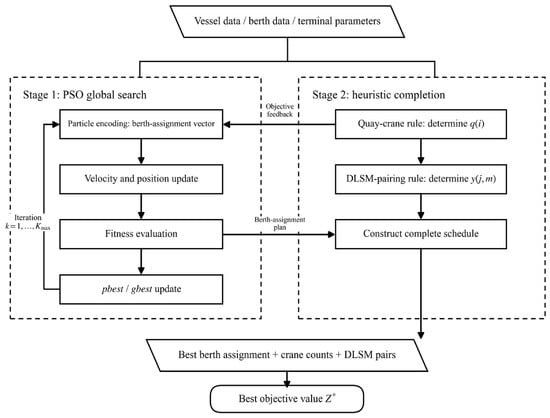
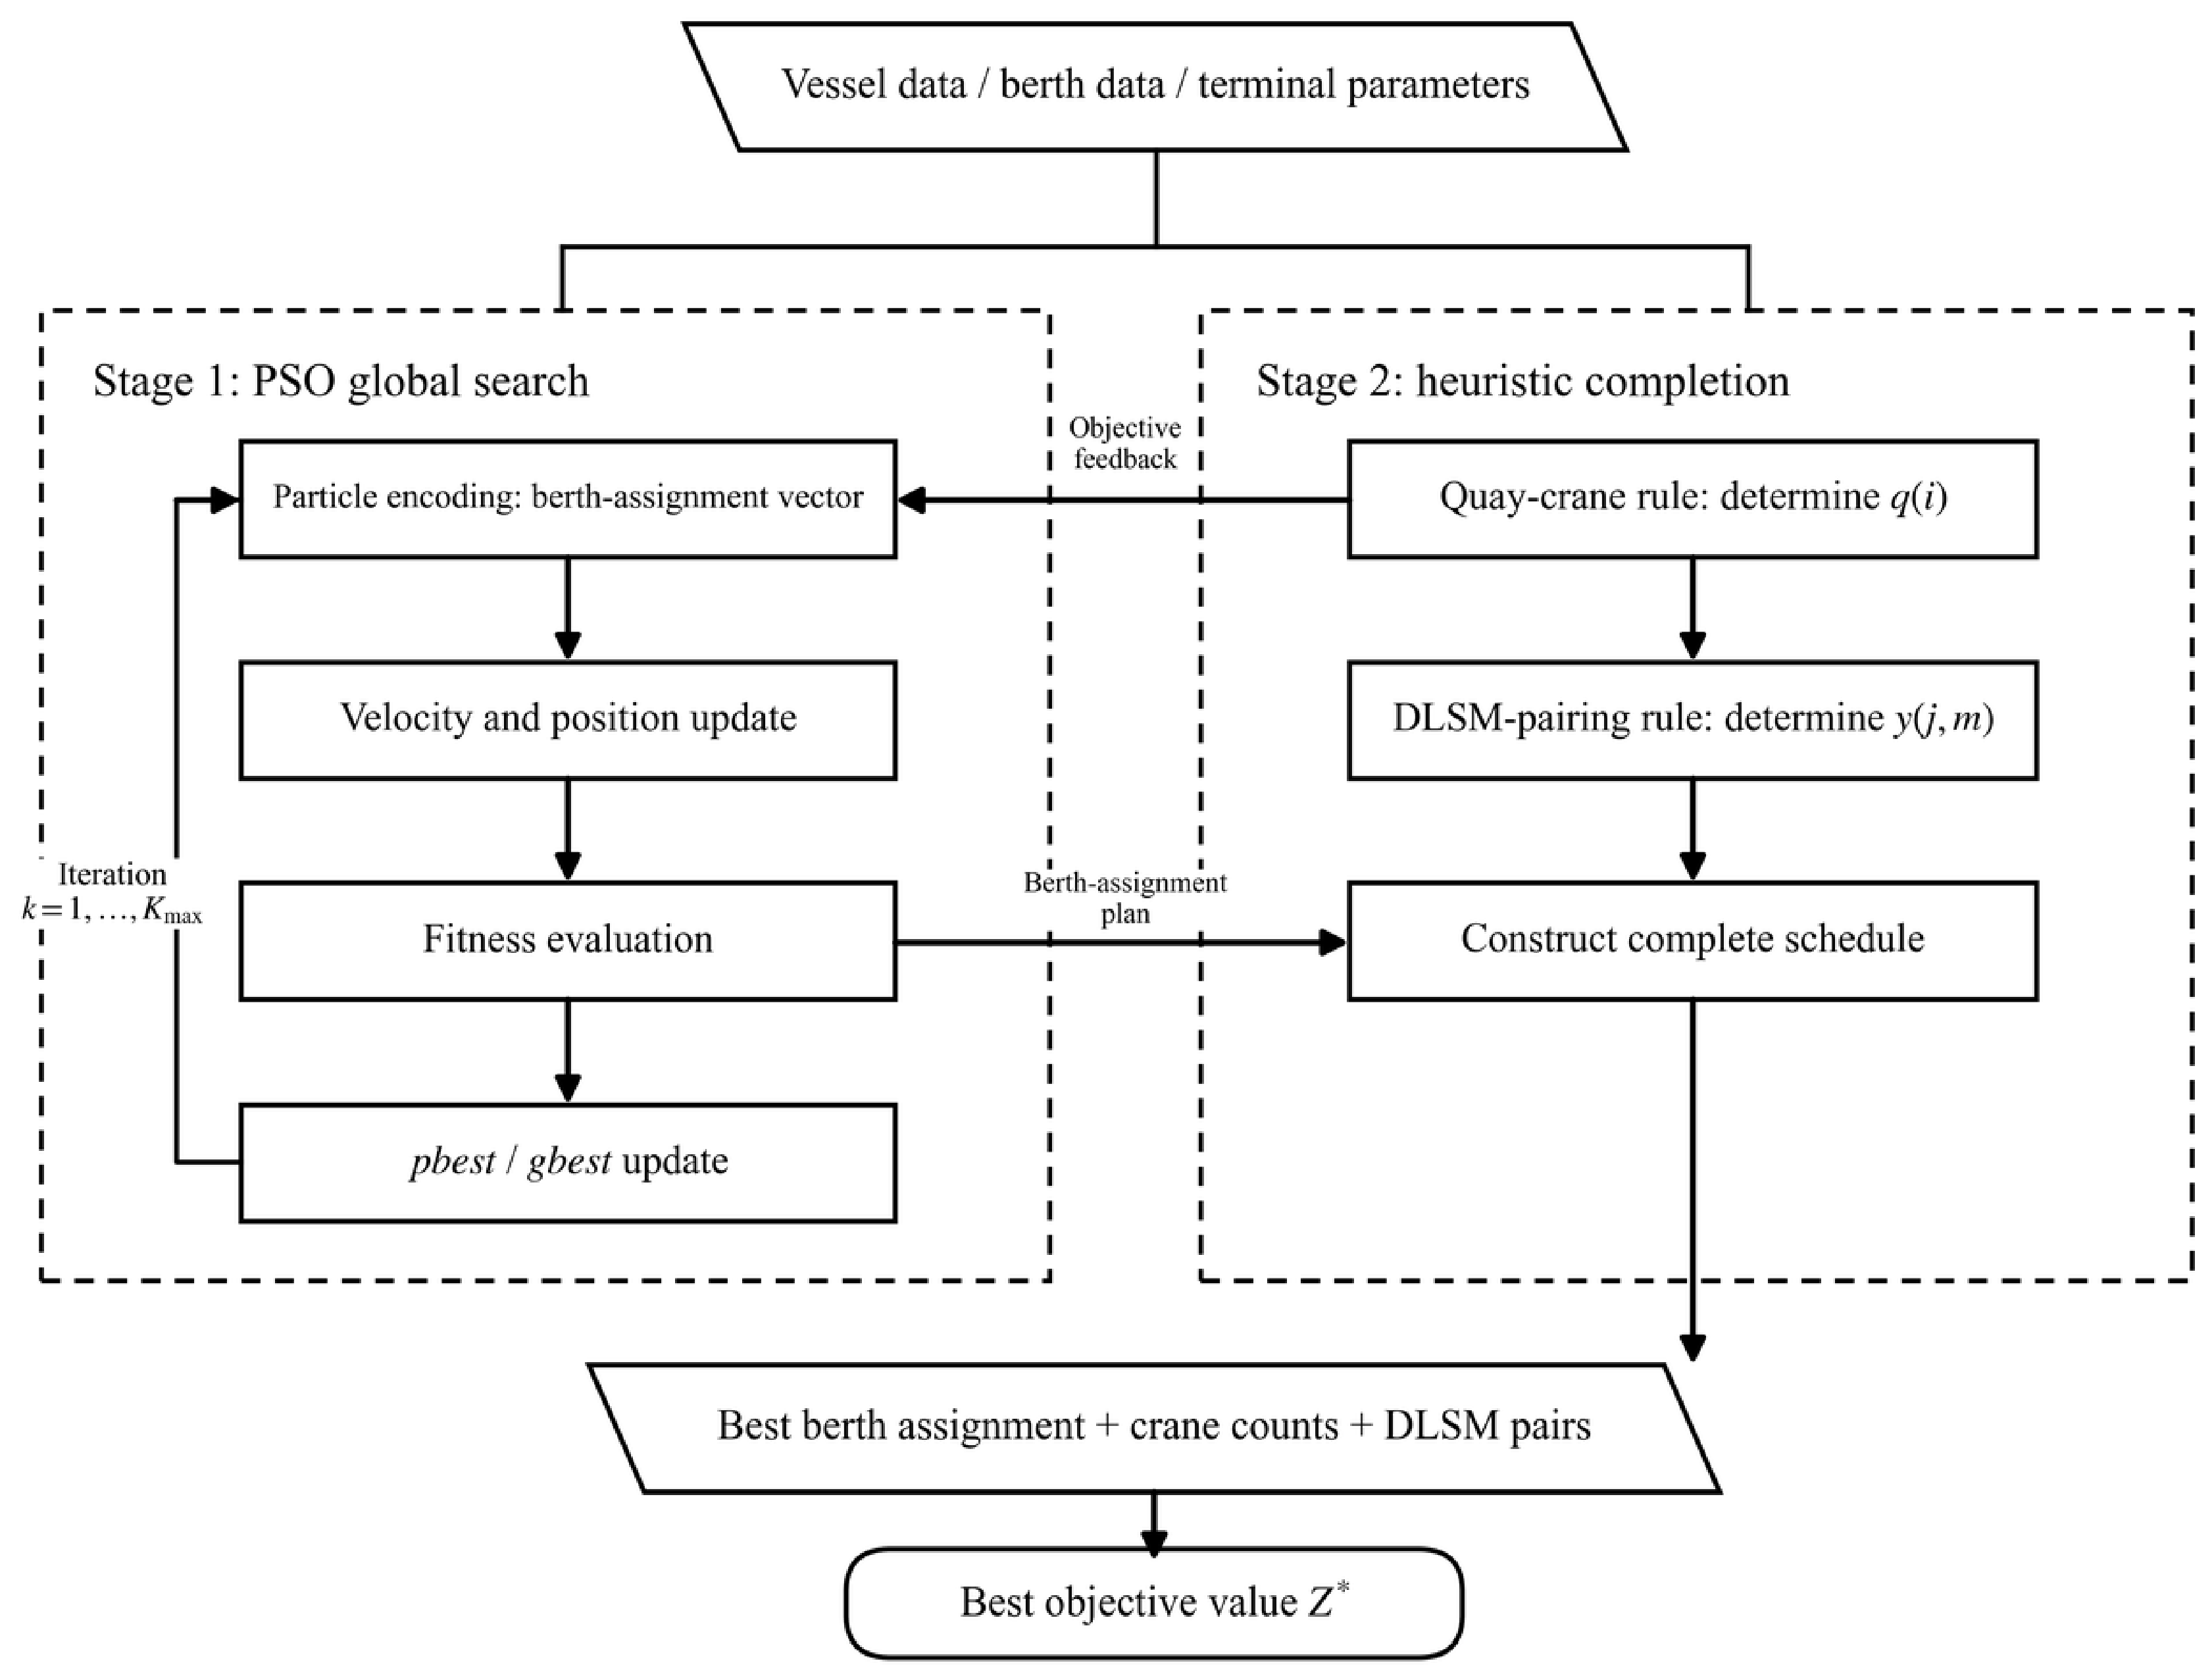
The implementation follows the two-stage framework shown in Figure 3. Stage 1 uses PSO to search vessel-berth assignments. Stage 2 applies deterministic rules for quay-crane deployment and DLSM pairing, constructs service times and implicit berth sequences, checks the implemented feasibility conditions, and returns the composite objective as particle fitness. Constructive schedule evaluation therefore coordinates berth search with rule-generated crane deployment and pairing, but it does not jointly optimize every variable in the normative formulation.
Figure 3.
Berth-search, quay-crane-deployment, DLSM-pairing, and schedule-evaluation framework. The asterisk denotes the best objective value retained by the search.
2.3.1. PSO Encoding and Berth Decoding
Each particle contains one real-valued component per vessel. Initial positions are sampled uniformly between zero (inclusive) and the number of berths (exclusive); initial velocities range from the negative to the positive number of berths. The decoder takes the integer part of each component and applies a modulo operation based on the number of berths. Positions and velocities are clipped to their respective bounds. Personal-best and global-best values are updated with independently sampled random coefficients at every iteration, following the classical PSO velocity-position equations [20,21].
2.3.2. Rule-Based Quay-Crane Deployment and DLSM Pairing
For each mainline vessel, the deployment rule adds one to the integer midpoint of the admissible lower and upper quay-crane bounds and caps the result at the upper bound. With the bounds used here, the rule selects the upper limit. Every feeder vessel uses one quay crane. These crane counts are deterministic outputs, not PSO variables. The pairing rule then scans feeder vessels in input order. A feeder becomes a DLSM candidate when it has a designated mainline transshipment partner, both vessels share a berth, and that mainline vessel has not already been paired. Thus, the decoded berth plan and scan order induce DLSM pairing; PSO does not search pairings directly. During schedule evaluation, the scheduler checks water depth, vessel length, temporal containment, berth closing, pairing uniqueness, and terminal-wide quay-crane capacity. Any candidate that violates an implemented condition receives infinite fitness.
2.3.3. Schedule Construction and Fitness Evaluation
Vessels are processed in nondecreasing arrival order, with mainline vessels preceding feeder vessels when arrival times tie. This fixed rule determines the berth sequence implicitly; PSO does not search the sequencing variables in the normative formulation. An SLSM vessel starts at the later of its arrival time and berth-availability time. An outer feeder starts at the later of its own arrival and the start of its paired mainline vessel, and it must finish before the mainline vessel completes service. Handling time is the workload divided by the applicable rate and rounded upward to an integer number of hours. The rate is the assigned conventional-crane count times R for a mainline vessel, R for an SLSM feeder, and ηR for a DLSM feeder. Service start times are not rounded; completion is the start time plus this integer duration. The rounded feeder duration is used in the service-containment test. The scheduler then derives delay from the completion time. It then checks water depth, the same-berth requirement, vessel length, temporal containment, berth closing, pairing uniqueness, and terminal crane use. At a service transition, occupancy follows the half-open convention [Si, Ci); therefore, a vessel completing at time t releases its cranes before a subsequent vessel starting at t is counted. Capacity is checked at every service-start and service-completion event. With fixed crane counts between events, this enforces aggregate capacity throughout each service interval. The FCFS constructor applies the same event-based capacity convention. A schedule that violates any implemented condition receives infinite fitness. PSO uses 40 particles and 150 iterations, a linearly decreasing inertia weight from 0.9 to 0.4, and acceleration coefficients of 2.0. The computational environment used Python 3.12.14, NumPy 2.5.2, SciPy 1.18.1, statsmodels 0.14.6, and Matplotlib 3.11.1 under Windows 10 (10.0.19045). The runtime reported an Intel64 Family 6 Model 158 Stepping 13 processor with eight physical and eight logical processors and 15.81 GiB RAM. Final schedules are recovered by decoding the stored best particle, including when the initial best value is never improved. The decoded objective is checked against the stored best fitness. Rerun wall-clock times include concurrent execution and are descriptive rather than controlled hardware benchmarks.
2.4. Computational Experiments
2.4.1. Instance Generation and Parameter Settings
The test set contains nine configurations with 6, 12, or 20 vessels and three mainline–feeder compositions at each scale. Five instances per configuration were generated with seeds 1–5, yielding 45 common instances. The planning horizon is 120 h; Table 2 lists the numbers of vessels, berths, and quay cranes.
Table 2.
Instance configurations.
Mainline-vessel arrivals are sampled at integer hours from [0, 59]; handling volumes from [600, 1499] TEU; lengths from [280, 399] m; drafts from [9, 14] m; and delay coefficients from [11, 15]. Feeder handling volumes, lengths, drafts, and delay coefficients are sampled from [80, 219] TEU, [80, 159] m, [8, 10] m, and [4, 7], respectively. Each feeder vessel receives a mainline transshipment partner with probability 0.60, and its sea–sea transshipment volume equals 30–60% of its handling volume. For a connected feeder, the generator deliberately samples arrival time within the partner’s nominal service window and adjusts it when needed to permit completion at the baseline cross-over handling rate. This conditional procedure creates instances with DLSM opportunities; it does not reproduce an unconditional arrival process. Berth depths are sampled from [14, 17] m. The quay-crane handling rate is 30 TEU/h, the baseline value of η is 0.85, and the baseline non-direct-transshipment weight is 1.0 per TEU.
2.4.2. Benchmark, Ablation Schemes, and Performance Measures
All four schemes use the same 45 instances: FCFS-SLSM, FCFS-DLSM, PSO-SLSM, and PSO-DLSM. FCFS processes vessels by arrival time, assigns each vessel to the earliest available berth, and applies the common quay-crane-count rule. Both SLSM schemes prohibit DLSM pairing. FCFS-DLSM first constructs the FCFS berth and quay-crane decisions, then applies the common DLSM pairing rule; an infeasible DLSM construction reverts to the feasible FCFS-SLSM schedule. The two PSO schemes use identical PSO settings and differ only in whether DLSM pairing is enabled.
The matched small-instance benchmark enumerates all 64 berth-assignment vectors for each six-vessel, two-berth instance. Every vector passes through exactly the same crane-count rule, designated-partner pairing rule, service order, event-based capacity checks, and objective evaluator used by PSO-DLSM. Neither crane counts nor pairings are independently enumerated. Table 3 therefore measures berth-search quality within the common decoder-defined decision space, not global optimality for the full normative formulation. This replaces the earlier broader enumeration with differing crane and pairing choices. Each PSO scheme was run 10 times per instance in the 45-instance ablation. For instance seed s and zero-based repeat r, the NumPy seeds were 10,000s + 2r + 1 for PSO-SLSM and 10,000s + 2r + 2 for PSO-DLSM.
Table 3.
Matched decoder-space enumeration and PSO-DLSM results for three seeds per configuration. Each instance has 64 berth-assignment vectors; crane counts, pairings, order, and timing follow the shared decoder.
Reported measures include the composite objective, relative objective reduction, enumeration gap for small instances, computation time, number of DLSM pairs, and the mean and sample standard deviation across repeated PSO runs. Relative reduction is calculated as 100 , and the enumeration gap as 100 .
Paired comparisons use instance-level mean objective values. Because many paired differences are zero and no distributional assumption is made, the analysis applies an exact one-sided paired sign test after treating absolute objective differences no greater than 1 × 10⁻⁹ as numerical ties and removing them. The alternative hypothesis states that the reference scheme has the larger objective value, with α = 0.05. These comparisons separate berth-search and DLSM effects only within the implemented constructive scheduler.
2.4.3. Repeated-Run and Statistical Analysis
PSO stochasticity was assessed on nine prospectively selected representative instances, one from each S1–L3 configuration. Instance seed 3, the midpoint of the available range 1–5, was fixed before execution. PSO-SLSM and PSO-DLSM were each run independently 20 times per representative instance with 40 particles and 150 iterations. NumPy seeds followed 190,000 + 1000c + 2r + k, where c denotes the configuration index (1–9), r the zero-based repeat index (0–19), and k equals 1 for PSO-SLSM and 2 for PSO-DLSM. The deterministic FCFS variants were evaluated once per instance.
Reported statistics comprise the best, mean, sample standard deviation, worst, coefficient of variation, and wall-clock runtime. The instance, not the individual stochastic run, forms the inferential block. Shapiro–Wilk tests assess the distribution of paired instance-level differences. When normality is not rejected, the analysis uses a two-sided paired t-test with Cohen’s dz; otherwise, it uses a two-sided Wilcoxon signed-rank test with matched-pairs rank-biserial correlation. The six pairwise p-values are adjusted by Holm’s method. The four-scheme omnibus comparison uses the Friedman test with Kendall’s W, followed by Holm-adjusted Wilcoxon post hoc tests. Error bars in the new figures denote SD. For the principal relative improvement, a percentile bootstrap interval uses 10,000 resamples of the nine instance blocks (seed 221,009), not individual runs.
The quay-crane-capacity experiment uses M2 seed 3, Q levels 8, 10, 12, 14, and 16, and 10 common-seed runs per level (NumPy seed 390,000 + r). Efficiency and indirect-transshipment-weight sensitivity each use five M2 instance seeds and 20 independent PSO runs per seed-setting cell, totaling 700 and 600 runs, respectively. The seed rule is 1,000,000 + 10,000s + r, with r = 0, …, 19; common seeds are used across parameter settings. Reported between-instance SD is calculated across five cell means; within-cell SD is reported separately in Supplementary File S1. An additional stress test independently resamples all feeder arrivals uniformly over 0–80 h using RandomState (700,000 + s), retaining vessel attributes, connections, and each departure allowance. Both PSO modes use 20 runs on each of these five M2 instances; the FCFS modes are deterministic. This hypothetical arrival test is not historical-terminal validation. All revised computational tables use event-based capacity checks. Supplementary_Material_File S1_round2.pdf and jmse-14-01897-File S2_round2_code_data.zip provide the correction record, raw schedules, inputs, seeds, and code.
3. Results
3.1. Small-Instance Diagnostic and Runtime Evidence
PSO-DLSM matched the best enumerated value in all nine small instances under the identical decoder and event-based capacity evaluator. Each case enumerated 64 berth assignments; mean and maximum gaps were zero (Table 3). This verifies the observed search outcome for these small decoder-defined spaces, not optimality of the full mathematical formulation. The earlier comparison mixed independently chosen crane counts and pairings with PSO rule-generated decisions and is superseded by this matched benchmark.
For M2-1, the event-validated single run retained the objective value of 97.92. All reruns used 40 particles and 150 iterations. The source-data package records per-run timings and the computational environment. Concurrent execution affects these timings, so they support reproducibility but not controlled speed comparisons, an asymptotic scalability claim, or a convergence threshold.
3.2. Comparative and Ablation Results
The 45-instance ablation produced mean objectives of 386.85 for FCFS-SLSM, 374.65 for FCFS-DLSM, 379.67 for PSO-SLSM, and 181.70 for PSO-DLSM. Berth search under SLSM reduced the objective by 2.28% on average, without a significant one-sided sign-test result (p = 0.088). Enabling DLSM under FCFS yielded a 4.42% mean reduction, with six improvements and 39 numerical ties (unadjusted p = 0.016). Under PSO, enabling DLSM improved all 45 instance-level means by 53.29% on average (p < 0.001). The complete PSO-DLSM pipeline improved on FCFS-SLSM by 54.35% (p < 0.001). These comparisons support the combined pipeline rather than attributing its full benefit to PSO alone. Table 4 reports the exploratory sign tests; Section 3.6 reports the multiplicity-adjusted nine-block analysis.
Table 4.
Four-scheme ablation over 45 instances. Values are means of 10 runs for each PSO scheme; sign-test p-values are one-sided and unadjusted. Absolute differences up to 1 × 10⁻⁹ are treated as ties.
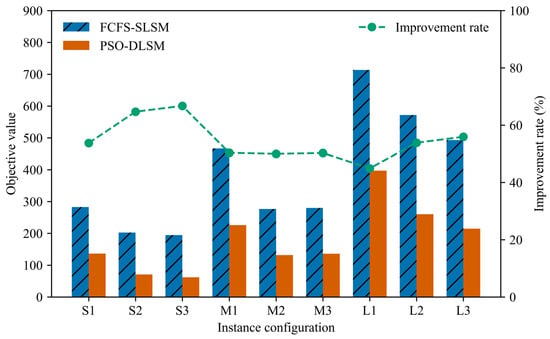
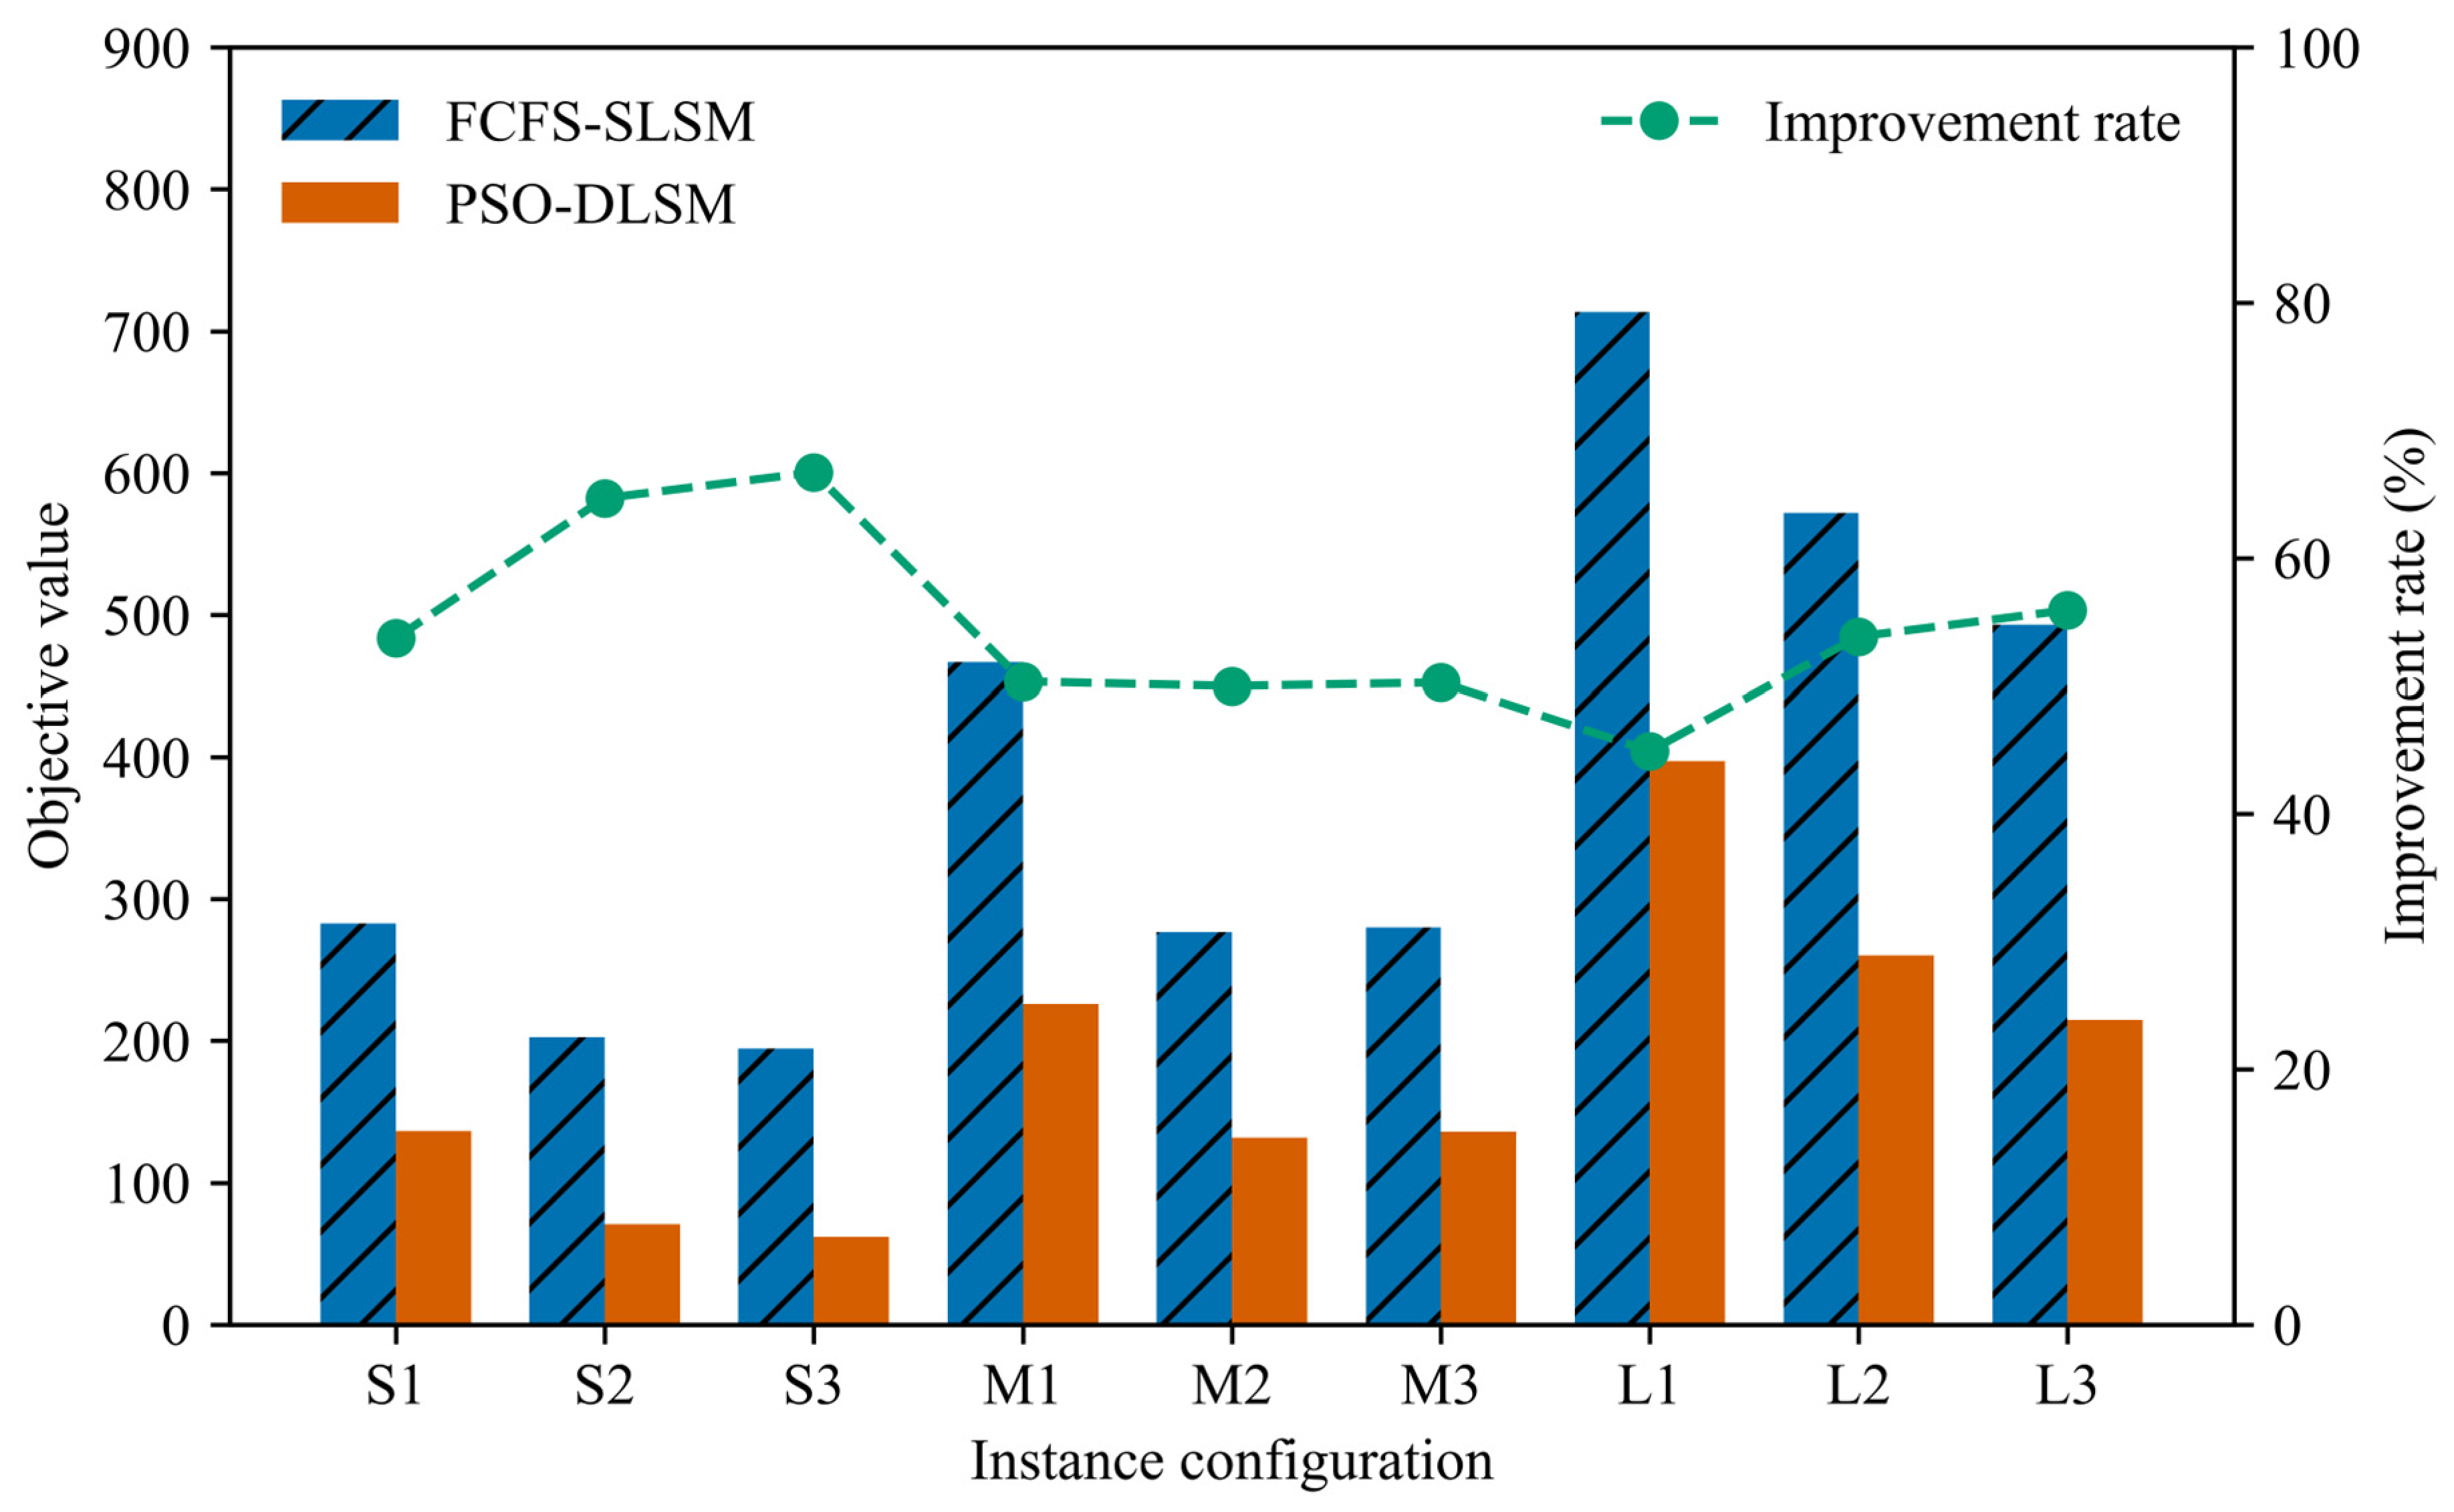
In the event-validated single-run comparison, PSO-DLSM returned a lower objective than FCFS-SLSM in every instance. The mean reduction was 54.49%, with configuration means from 44.92% to 66.71%. These values describe complete-scheme performance because both search policy and mooring mode change. Table 5 and Figure 4 report the revised configuration-level results.
Table 5.
Event-validated multi-scale comparison of PSO-DLSM and FCFS-SLSM. Five instances per configuration; SD describes variation in percentage improvement across instances.
Figure 4.
Comparison of PSO-DLSM and FCFS-SLSM across the nine instance configurations.
Schedule reconstruction identified an output-recording error: when PSO retained its initialization-best particle, the former reporting path could return an empty schedule and count it as zero pairs. Decoding the final best particle corrected the mean pair counts for S1, S2, and S3 to 1.8, 1.8, and 1.6. Event-based capacity validation changed Table 5 single-run outcomes for S2 seed 3 and M1 seed 2. The former S2 result violated aggregate capacity; the former M1 final schedule remained feasible, but rejecting capacity-violating intermediate candidates changed the finite-budget PSO search path under the same random inputs. Supplementary File S1 reconciles all 45 original and revised instance results. In the revised S1 means, vessel time, weighted delay, and indirect-transfer penalty are 45.22, 0.00, and 91.00 for PSO-DLSM, versus 49.79, 3.36, and 229.40 for FCFS-SLSM. For S2 the corresponding values are 54.24, 0.00, and 16.60 versus 56.26, 10.73, and 135.80. The reduced penalty is therefore supported by verified pairs, not inferred from the aggregate objective. Per-instance decompositions and the correction audit appear in Supplementary File S1.
3.3. Performance Across Instance Characteristics
Mean improvement rates were 61.71% for the small configurations, 50.20% for the medium configurations, and 51.56% for the large configurations. Performance did not vary monotonically with scale. Within the large group, improvement increased from 44.92% in L1 to 53.85% in L2 and 55.92% in L3 as the proportion of mainline vessels increased; this is a descriptive association within the sampled configurations.
3.4. Operational Mechanism: Instance M2-1
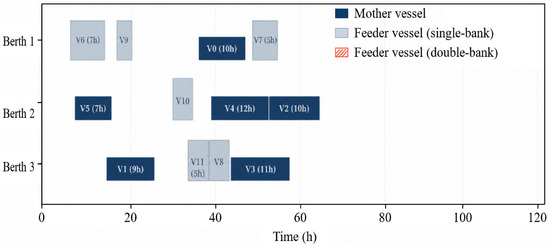
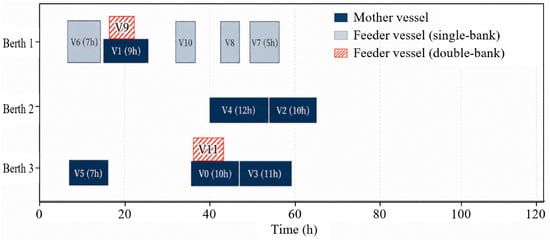
For M2-1, FCFS-SLSM returned an objective value of 207.74 and PSO-DLSM returned 97.92, a reduction of 52.86% that is close to the M2 group mean of 49.99%. Two mainline–feeder pairs with sea–sea transshipment demand used DLSM at Berths 1 and 3. Cross-over quay cranes transferred the associated containers directly between the paired vessels, reducing the non-direct-transshipment penalty to zero. The revised berth plan also shortened queues for part of the vessel set. Together, these changes account for the lower composite objective. Figure 5 and Figure 6 compare the FCFS-SLSM and PSO-DLSM berth-time schedules.
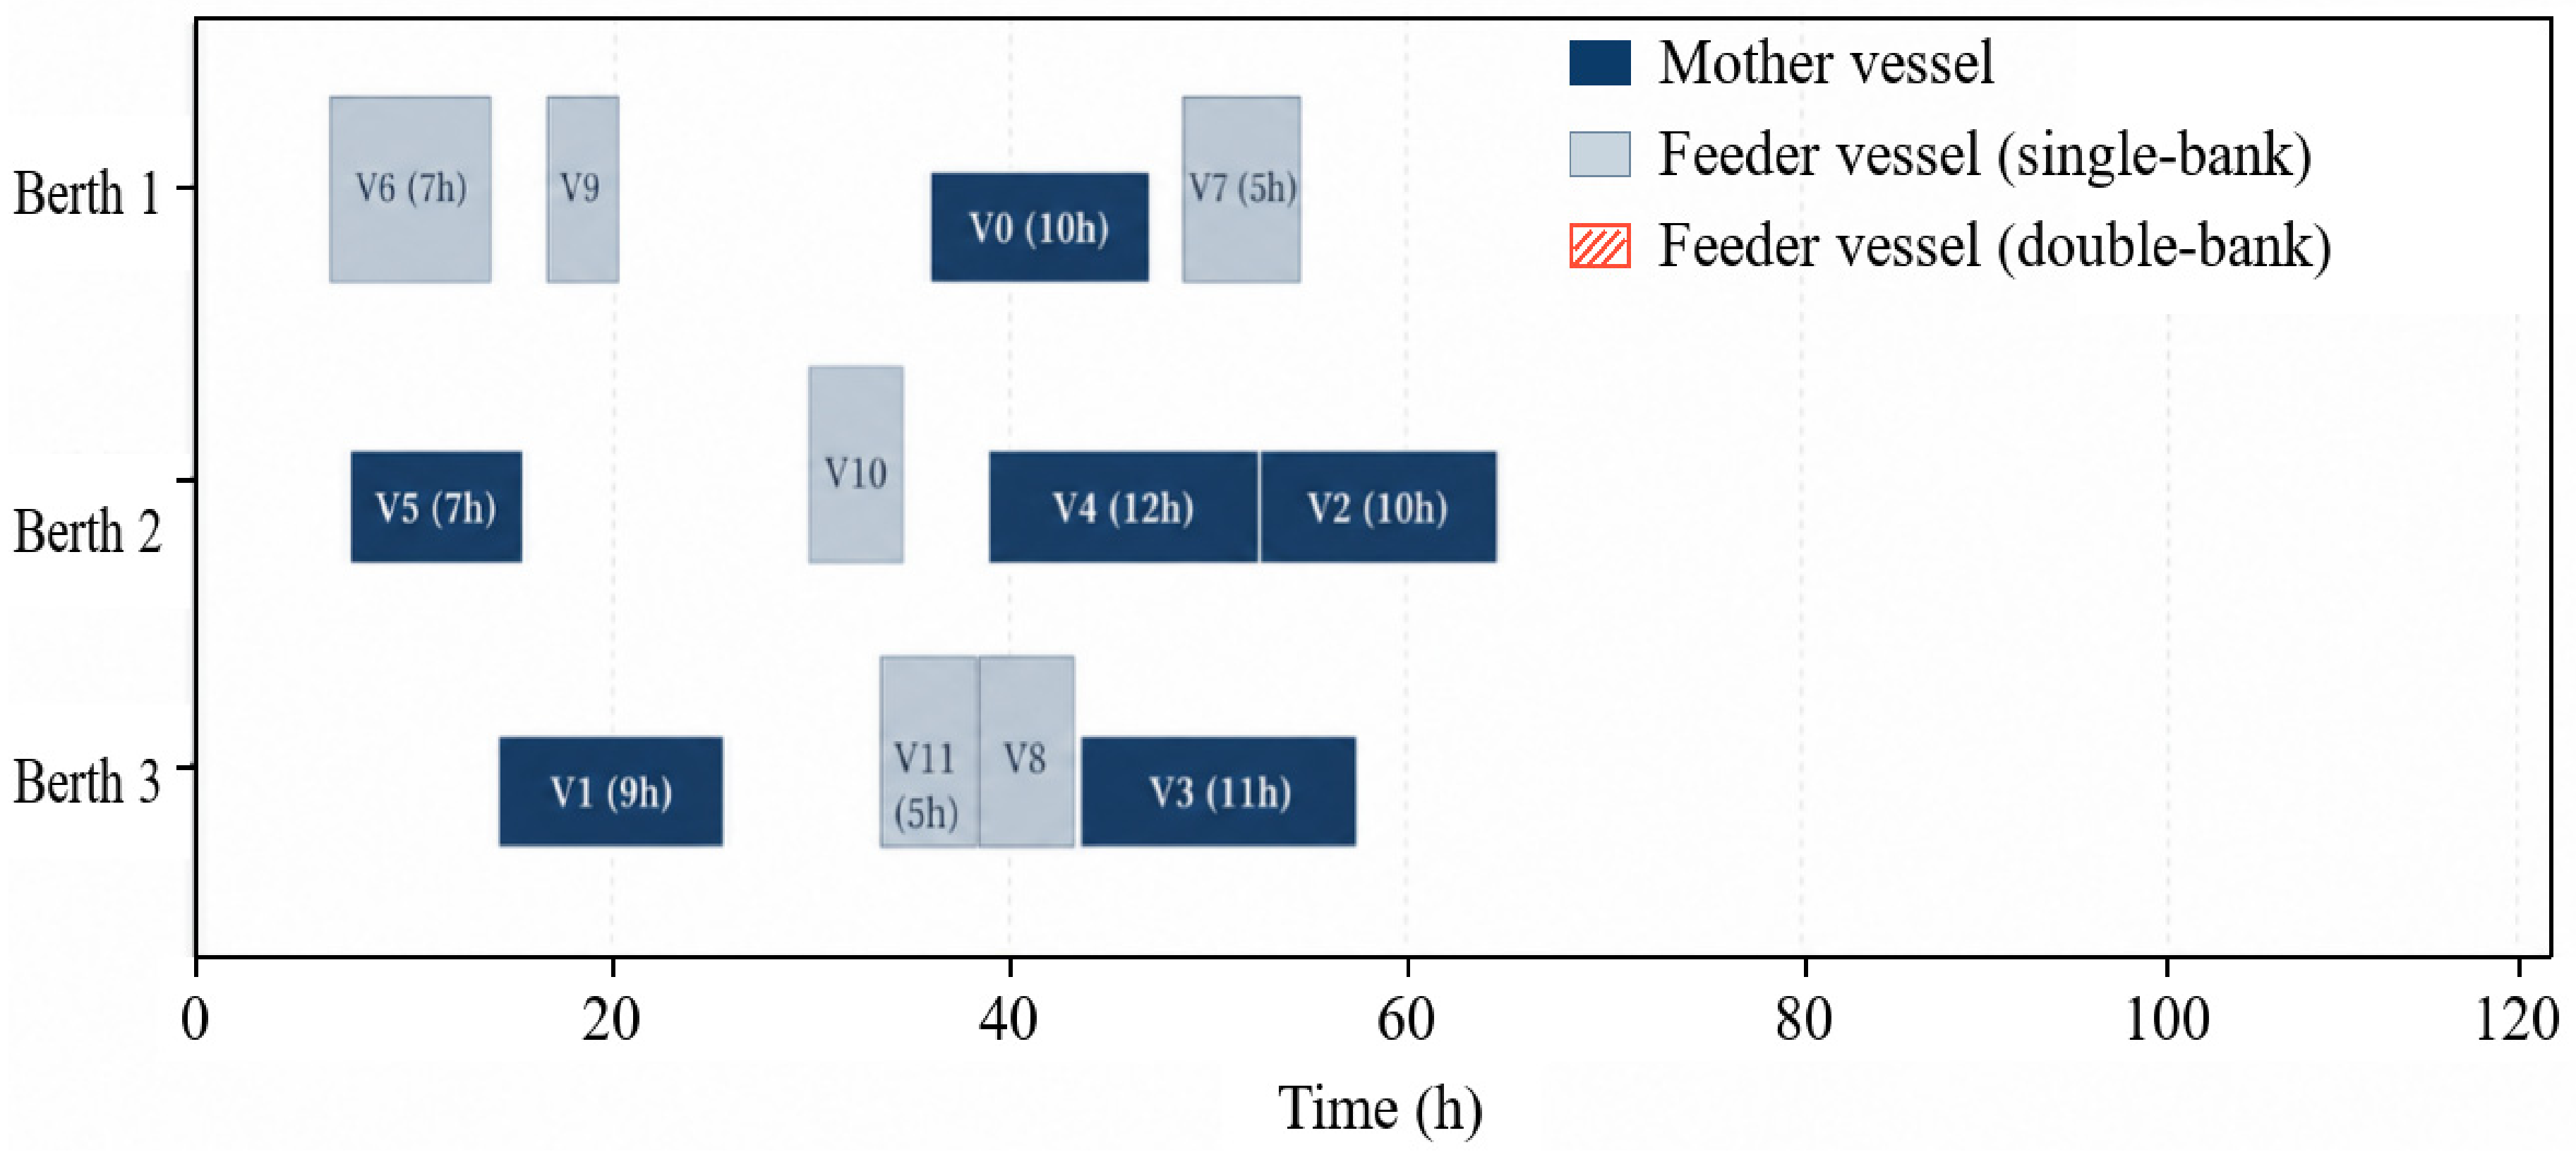
Figure 5.
FCFS-SLSM berth-time diagram for instance M2-1.
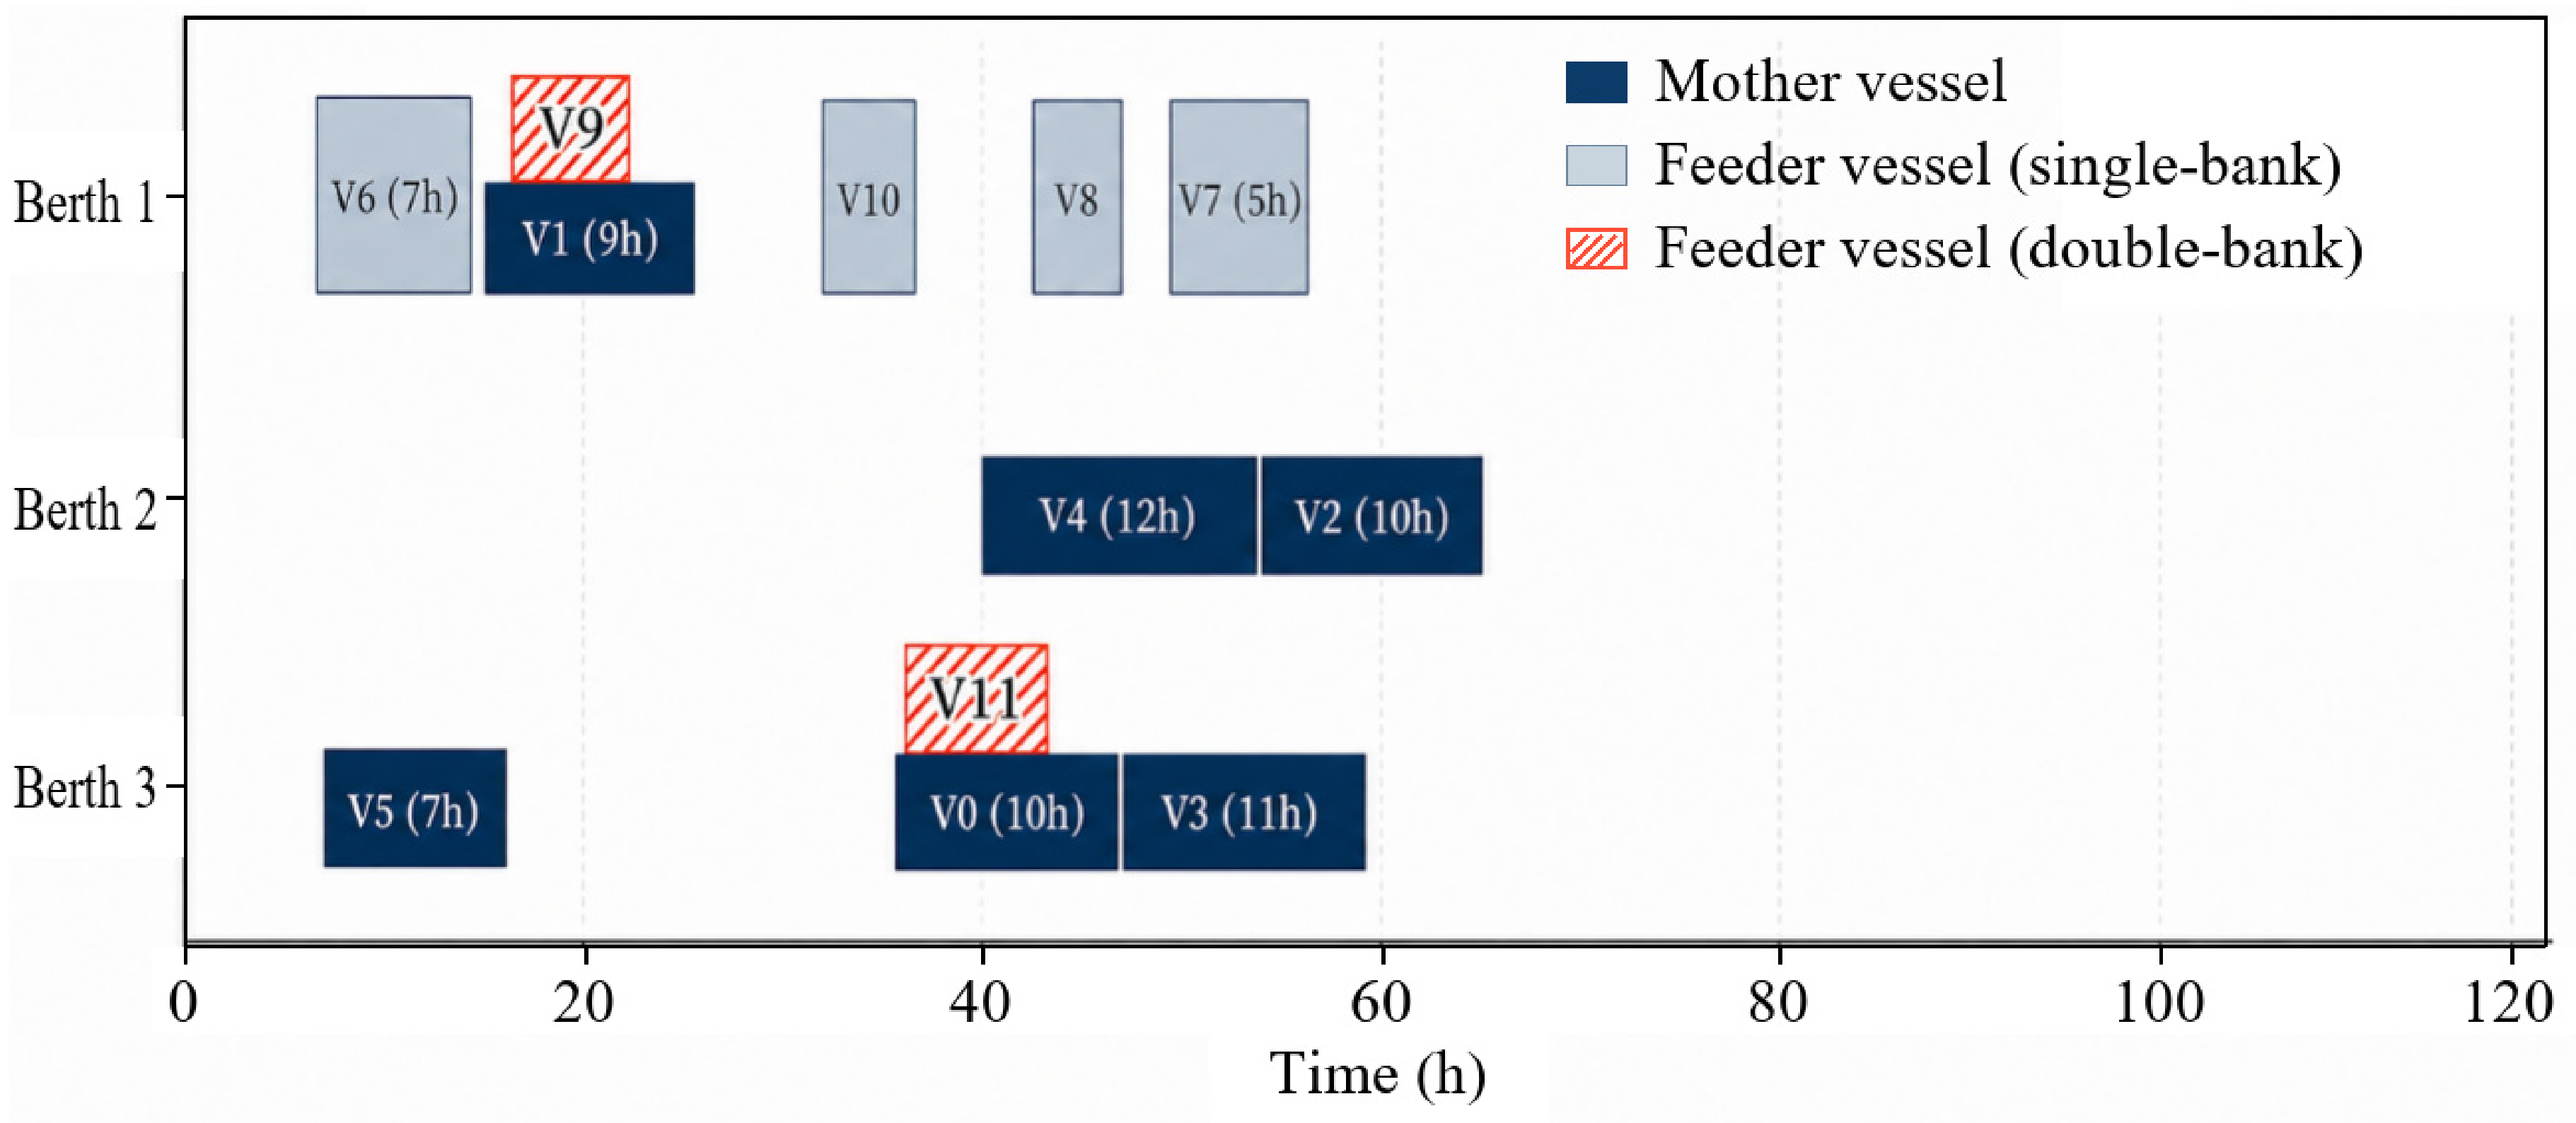
Figure 6.
PSO-DLSM berth-time diagram for instance M2-1.
3.5. Sensitivity Analysis
3.5.1. Cross-Over Handling Efficiency
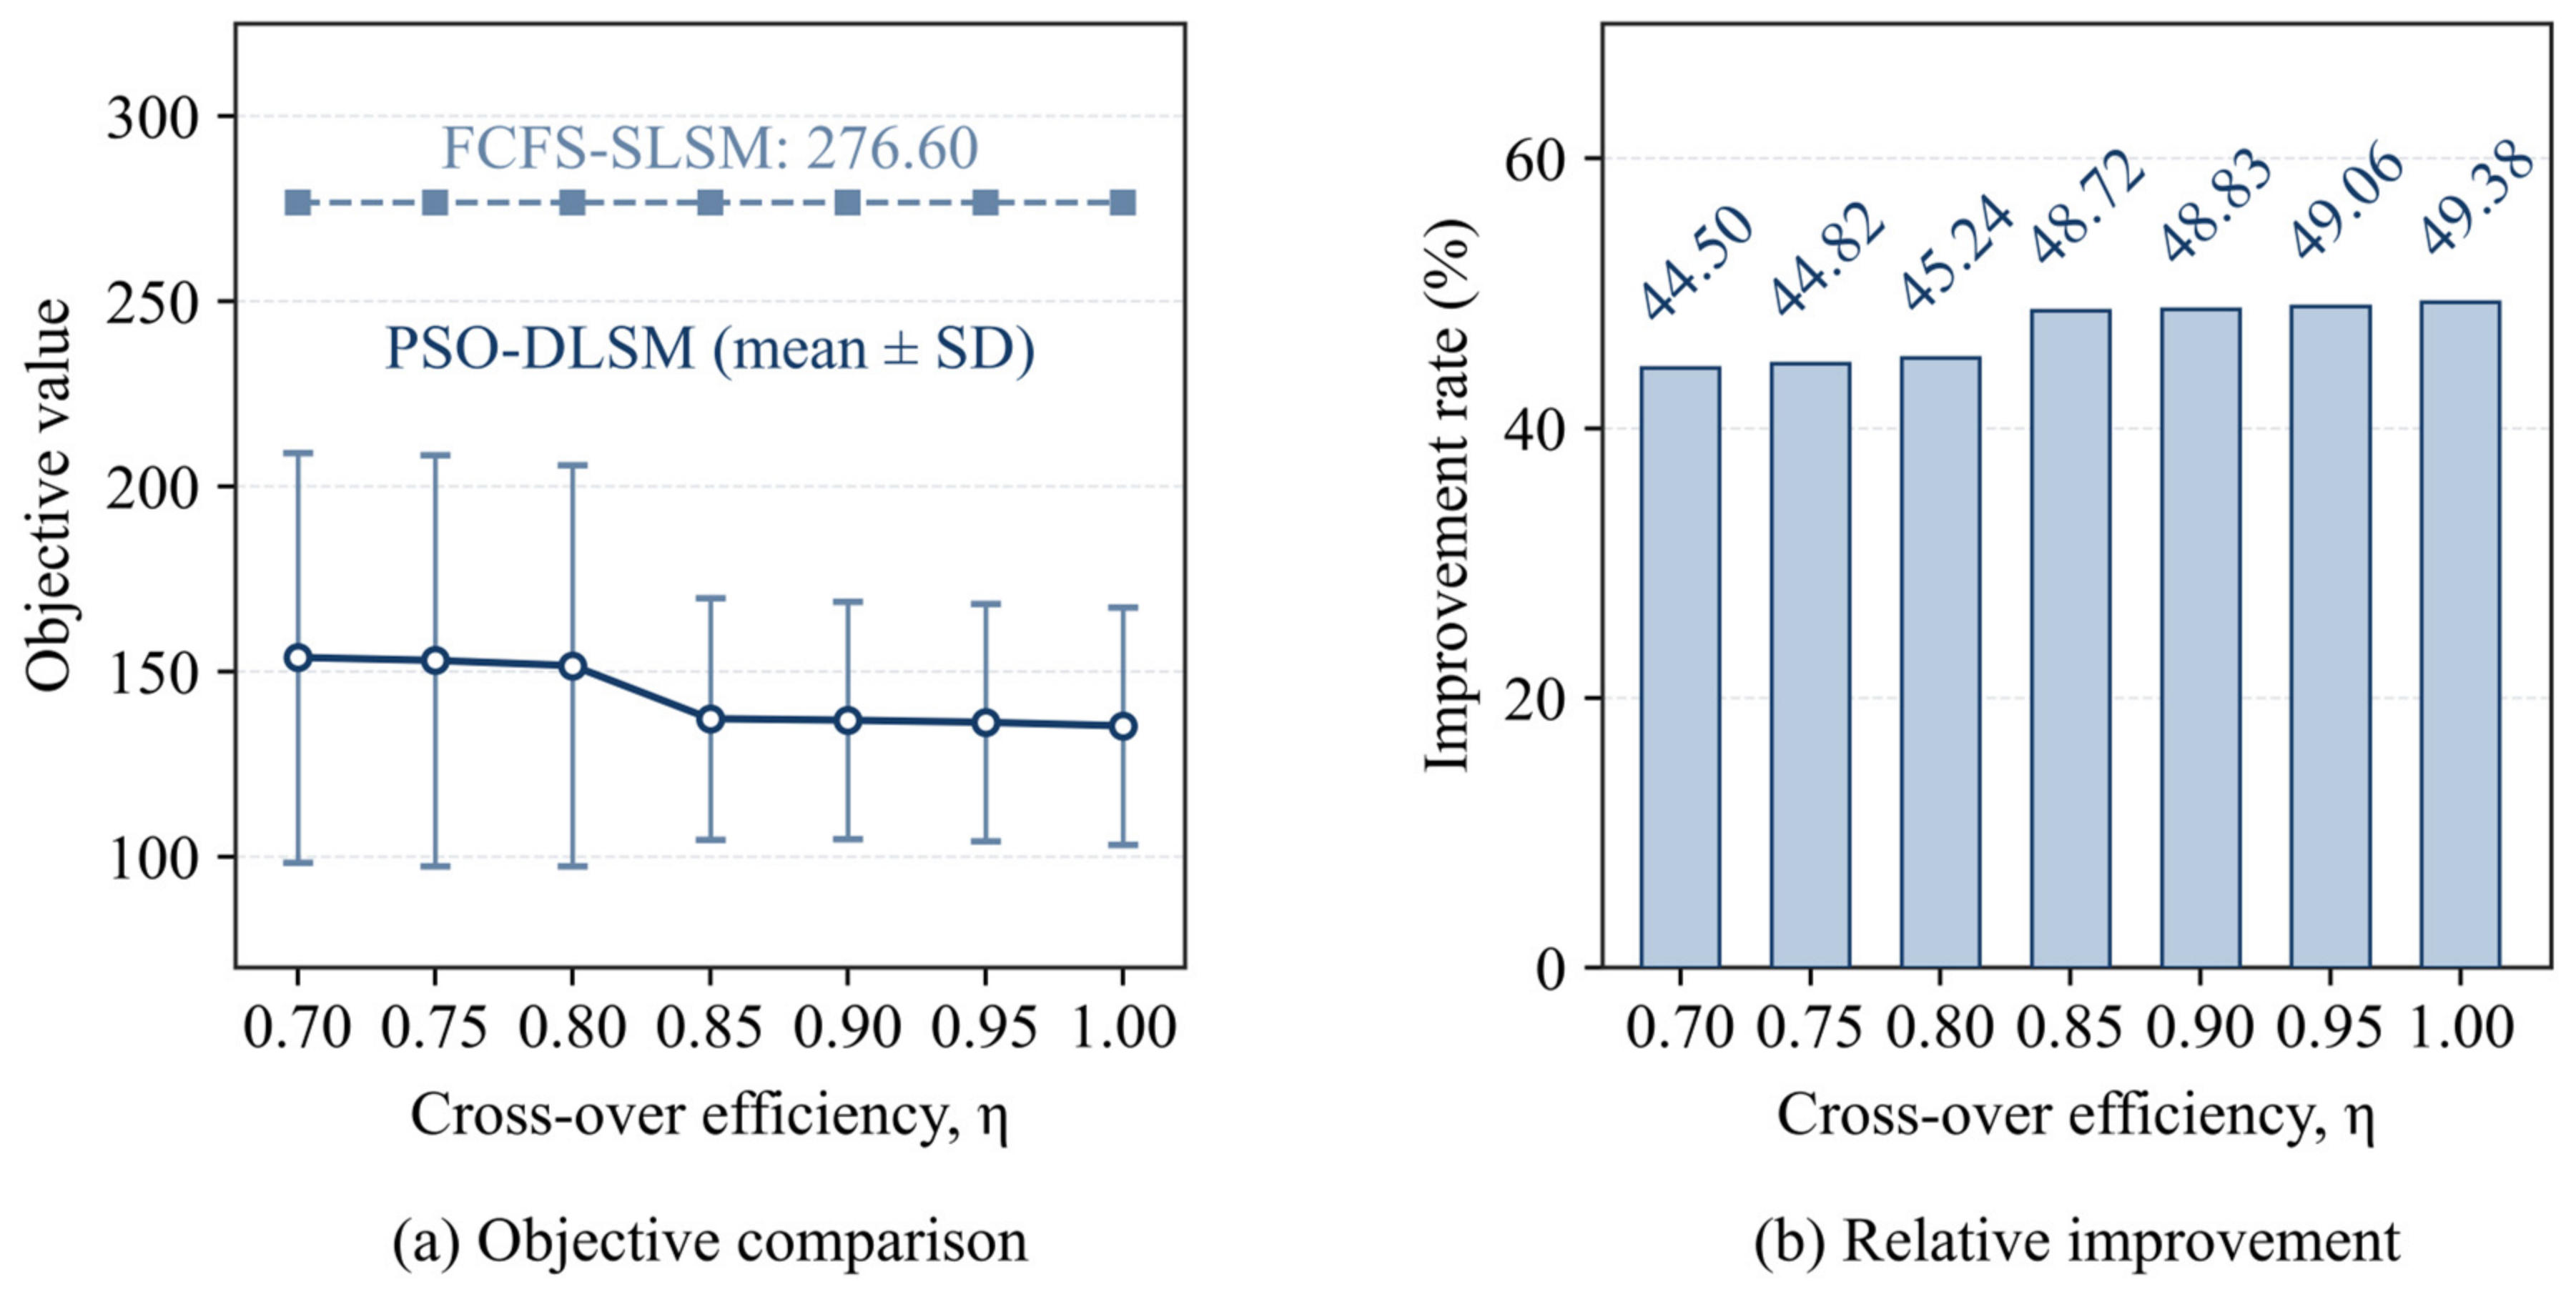
The efficiency analysis used seven η levels, five M2 instances per level, and 20 PSO-DLSM repetitions per instance-setting cell. The mean relative reduction over FCFS-SLSM ranged from 44.50% at η = 0.70 to 49.38% at η = 1.00. Between η = 0.80 and 0.85, the reduction increased from 45.24% to 48.72% and the mean pair count from 1.92 to 2.10. Table 6 and Figure 7 summarize the five instance-level means; Supplementary File S1 reports within-cell dispersion separately.
Table 6.
Efficiency sensitivity with 20 runs per cell and five instances per setting. PSO SD is the sample SD of five instance means, not within-run uncertainty.
Figure 7.
Efficiency sensitivity. Each PSO point summarizes five instance means, each based on 20 runs. Error bars indicate between-instance SD. Relative improvement is averaged across instances; no threshold significance test is claimed.
3.5.2. Non-Direct-Transshipment Penalty
The non-direct-transshipment penalty represents the additional objective contribution incurred when sea–sea transshipment containers cannot undergo direct ship-to-ship transshipment and must pass through the yard. It gives the model an incentive to form feasible DLSM pairs. No generally applicable economic value is available because yard, labor, and internal-transfer costs vary by port; the experiment therefore varies the penalty from 0.2 to 10.0 for the M2 configuration. Five instance seeds were evaluated at each of six settings with 20 independent runs per cell, yielding 600 PSO-DLSM runs.
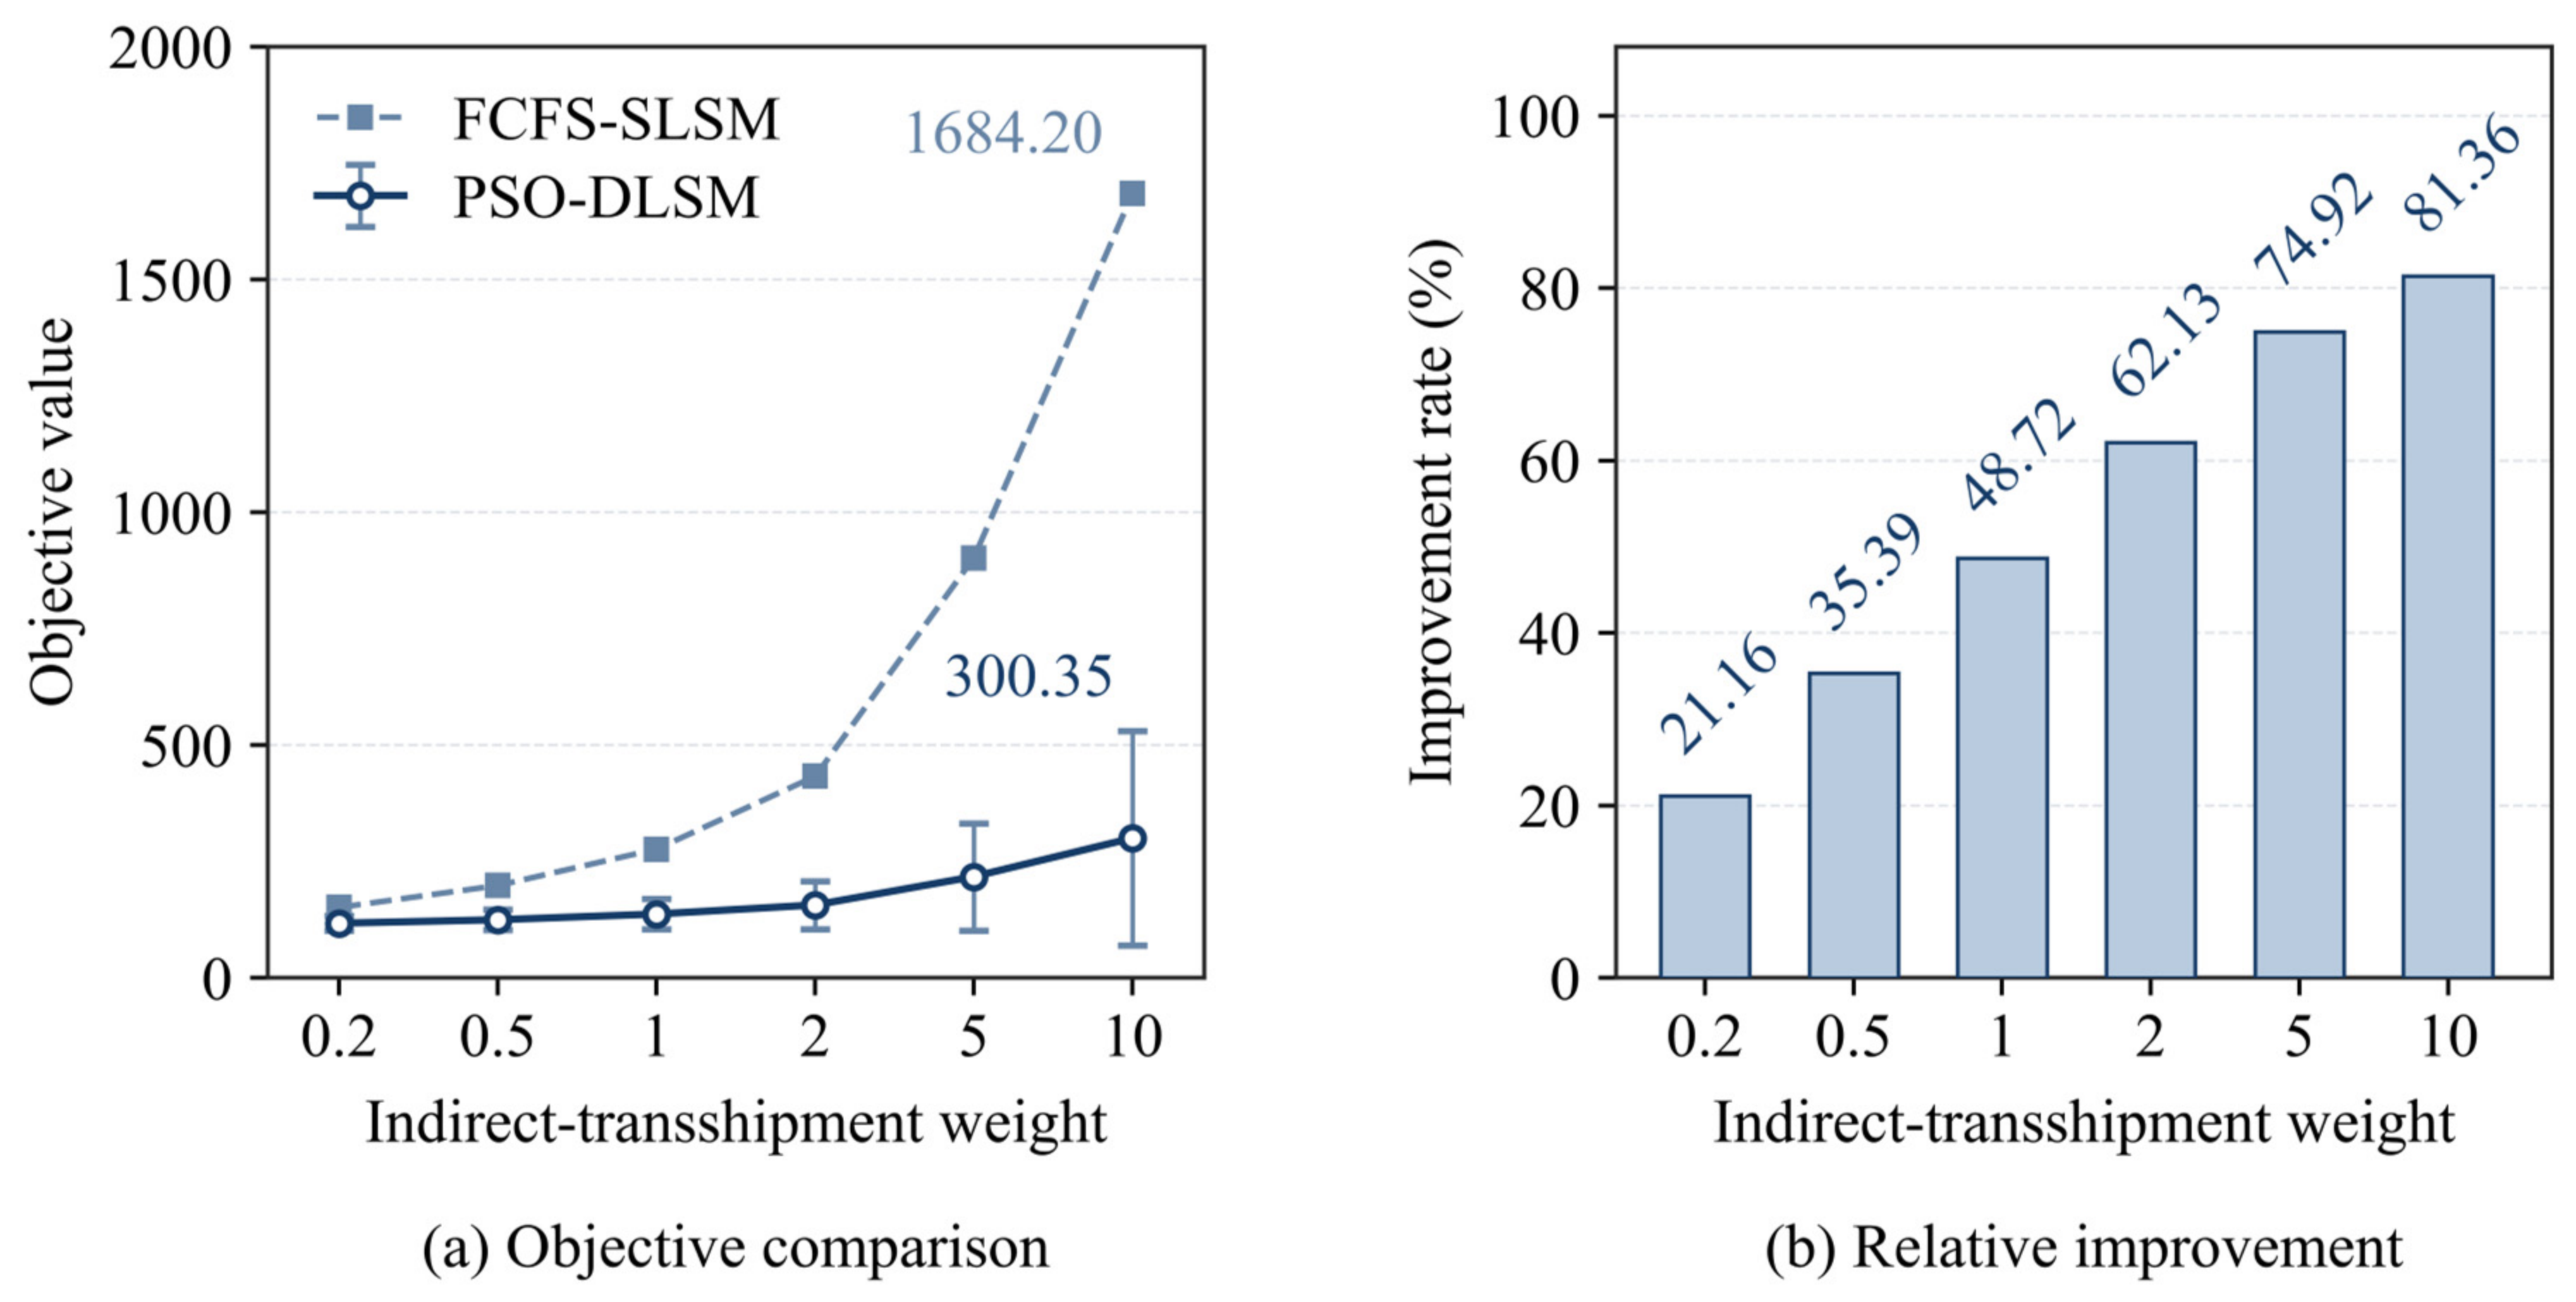
The mean pair count varied only modestly, from 2.00 at weight 0.2 to 2.18 at weight 10.0, while the mean relative reduction rose from 21.16% to 81.36%. The corresponding FCFS-SLSM means were 151.48 and 1684.20; PSO-DLSM means were 117.57 and 300.35. Thus, much of the rising percentage reflects the objective weight rather than a proportional increase in paired vessels. Table 7 and Figure 8 report the repeated-run results.
Table 7.
Indirect-transshipment-weight sensitivity with 20 runs per cell and five instances per setting. PSO SD is the sample SD of five instance means.
Figure 8.
Indirect-transshipment-weight sensitivity. PSO means aggregate five instance means, each from 20 runs; error bars indicate between-instance SD. The weight is not a calibrated monetary cost.
3.6. Twenty-Run Stability and Paired Statistical Evidence
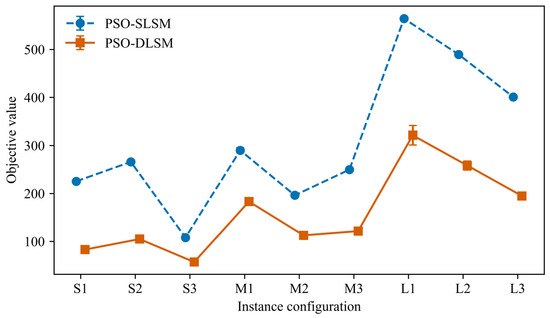
Table 8 summarizes 20-run stability. Across 20 runs per scheme and representative instance, the PSO-DLSM coefficient of variation ranged from 0 to 6.26%. The four-scheme Friedman test gave χ2(3) = 20.61, p < 0.001, and Kendall’s W = 0.76. Holm-adjusted Wilcoxon post hoc comparisons favored PSO-DLSM over each alternative (adjusted p = 0.023; rank-biserial r = 1.00). For PSO-SLSM versus PSO-DLSM, the paired differences did not reject normality (Shapiro–Wilk p = 0.805); the mean relative reduction was 49.27% (95% instance-block bootstrap interval 44.24–54.60%), t(8) = 6.80, Holm-adjusted p < 0.001, and Cohen’s dz = 2.27. PSO-SLSM did not significantly outperform FCFS-SLSM (Wilcoxon p = 0.578; Holm-adjusted p = 1.000). These tests support the implemented pipeline on the nine blocks, not a general advantage of PSO.
Table 8.
Twenty-run stability of the two stochastic schemes on nine representative instances (mean ± SD, lower objective values are better).
3.7. Exploratory Quay-Crane-Capacity Sensitivity
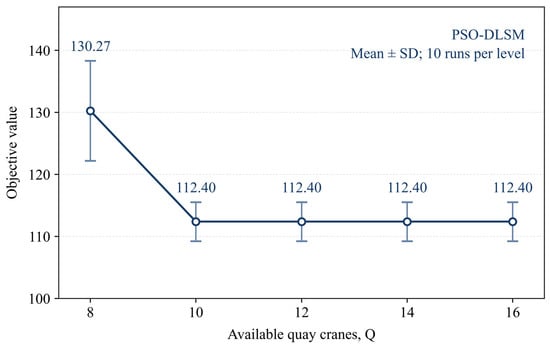
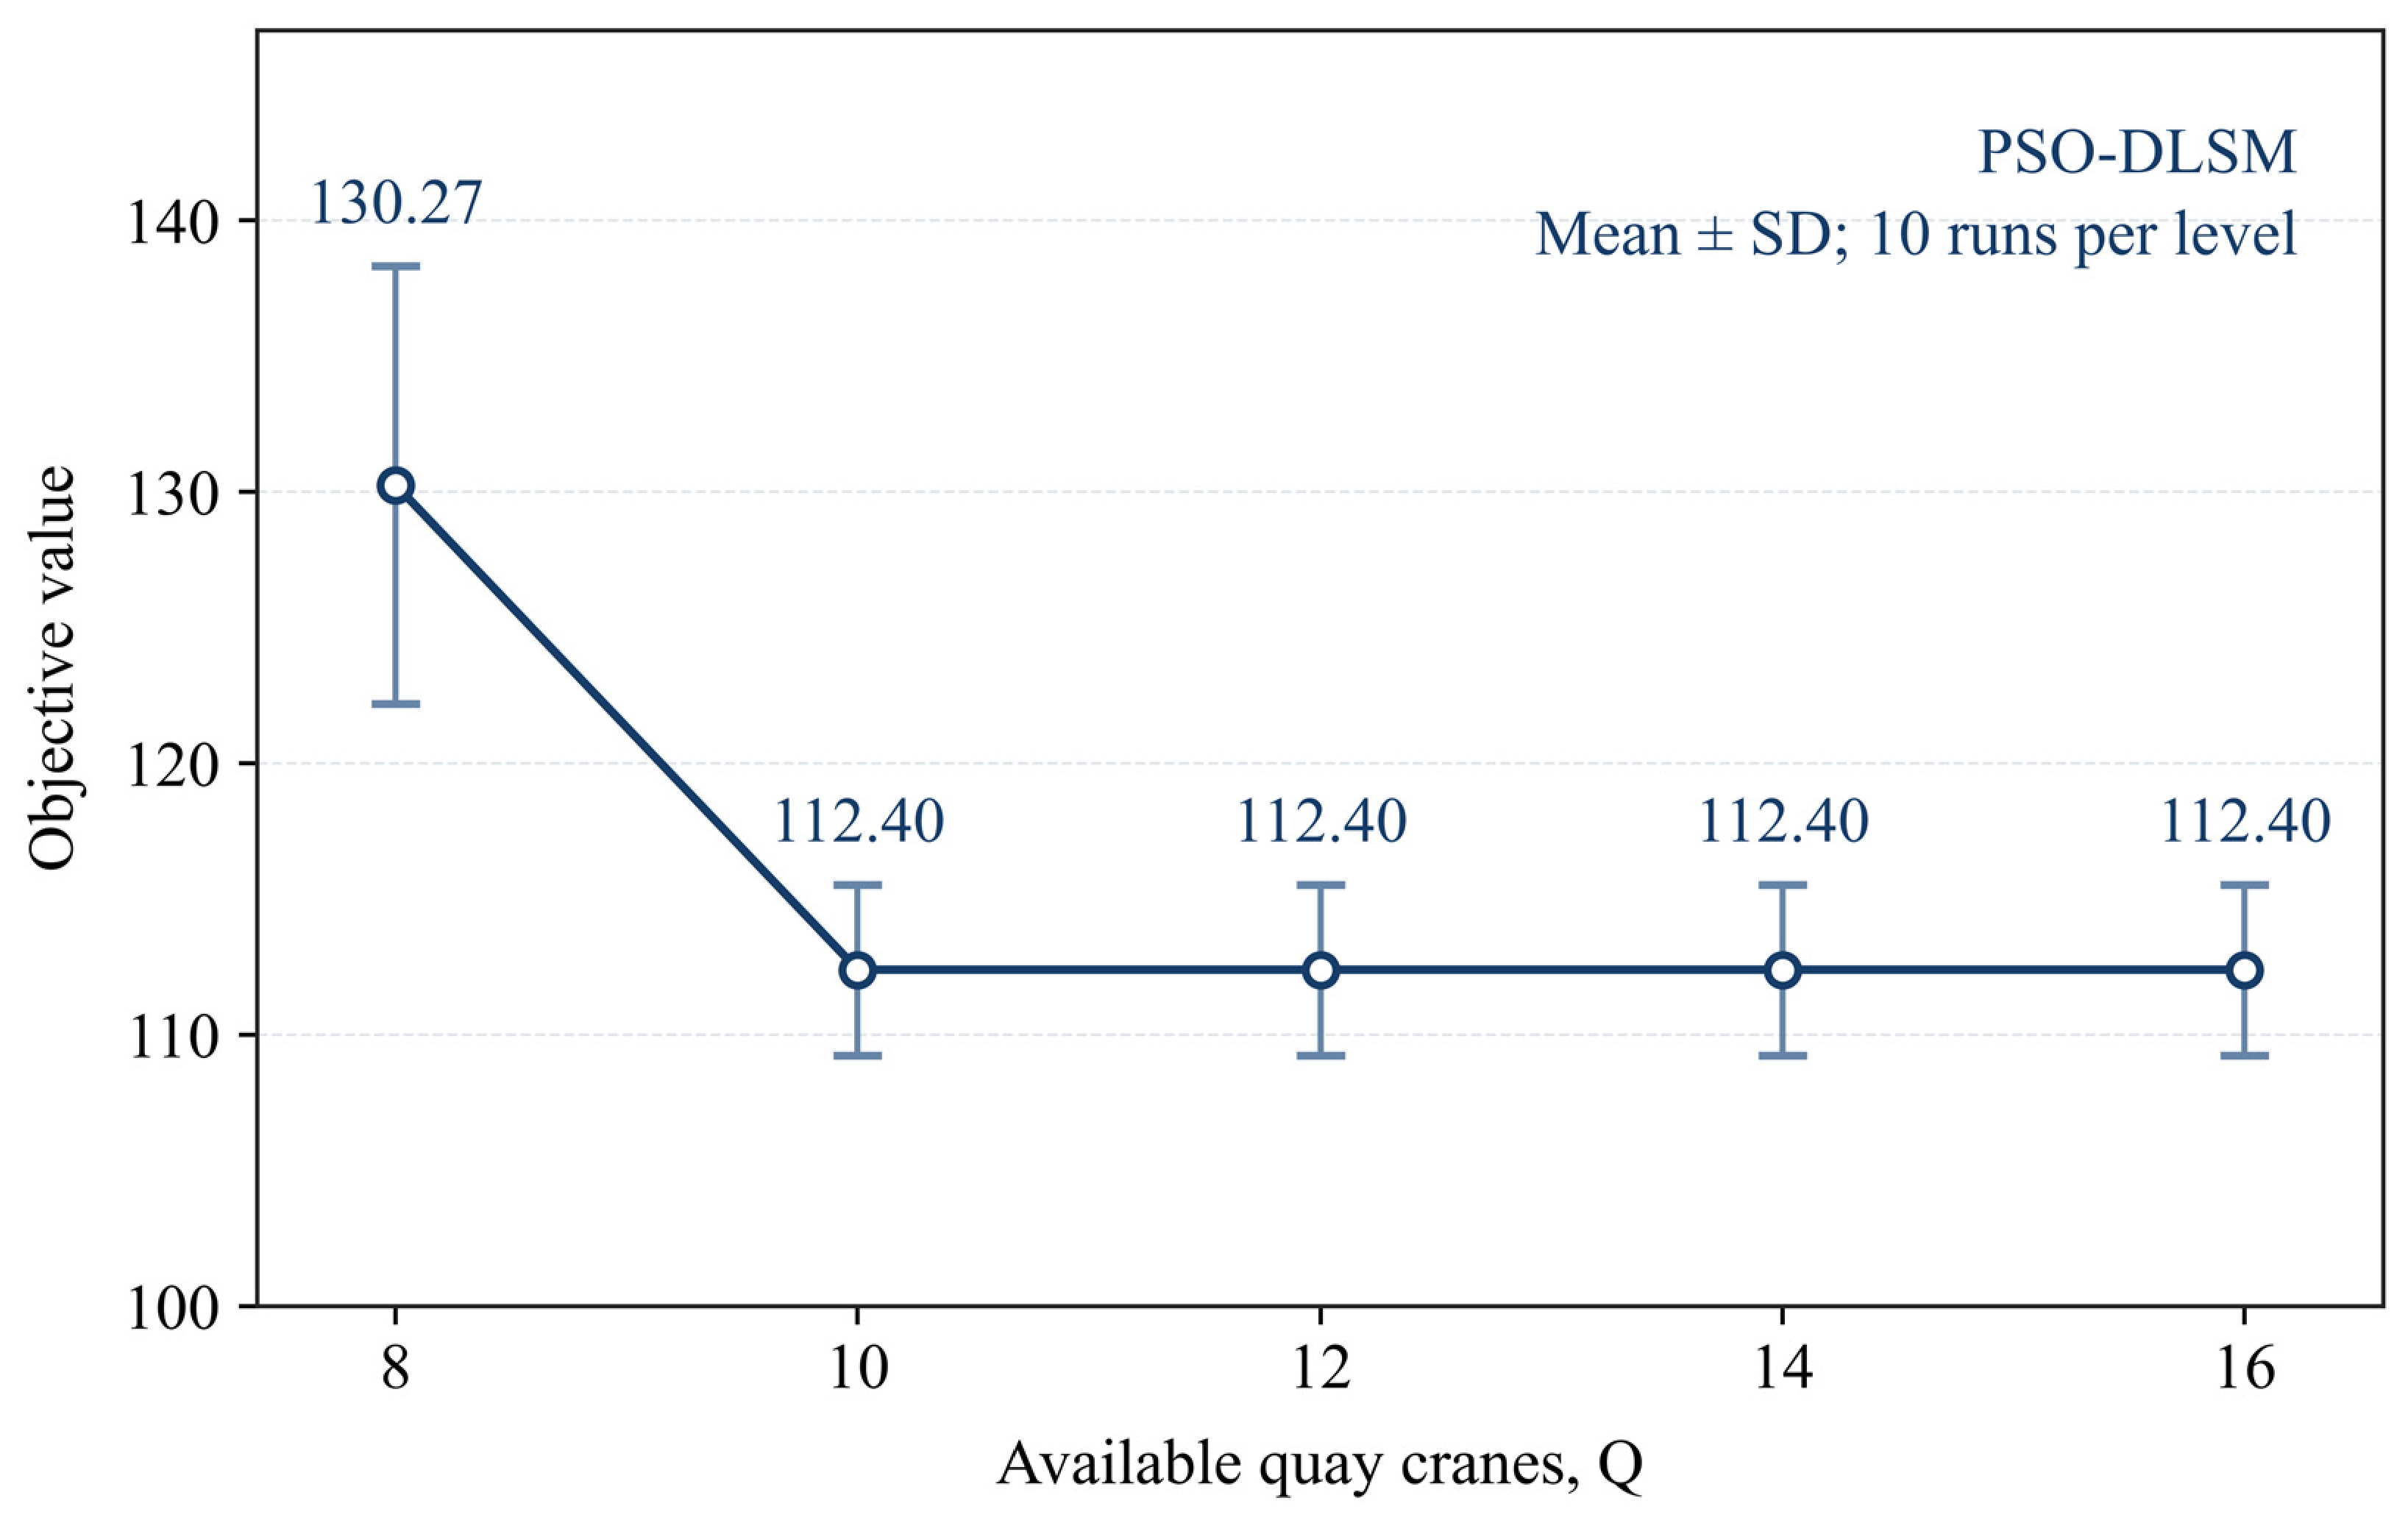
For M2 seed 3, limiting the terminal to Q = 8 raised the mean PSO-DLSM objective to 130.27 (SD = 8.07). With Q = 10, 12, 14, or 16, the common-seed mean was 112.40 at every level (SD = 3.14). These exact ties indicate a plateau under the fixed quay-crane-deployment rule, not continued improvement as more cranes become available. The five-level Friedman test was significant (χ2(4) = 40.00, p < 0.001), but evidence from one instance supports only a binding threshold in that case; a general monotonic relationship remains unverified.
4. Discussion
4.1. Principal Findings
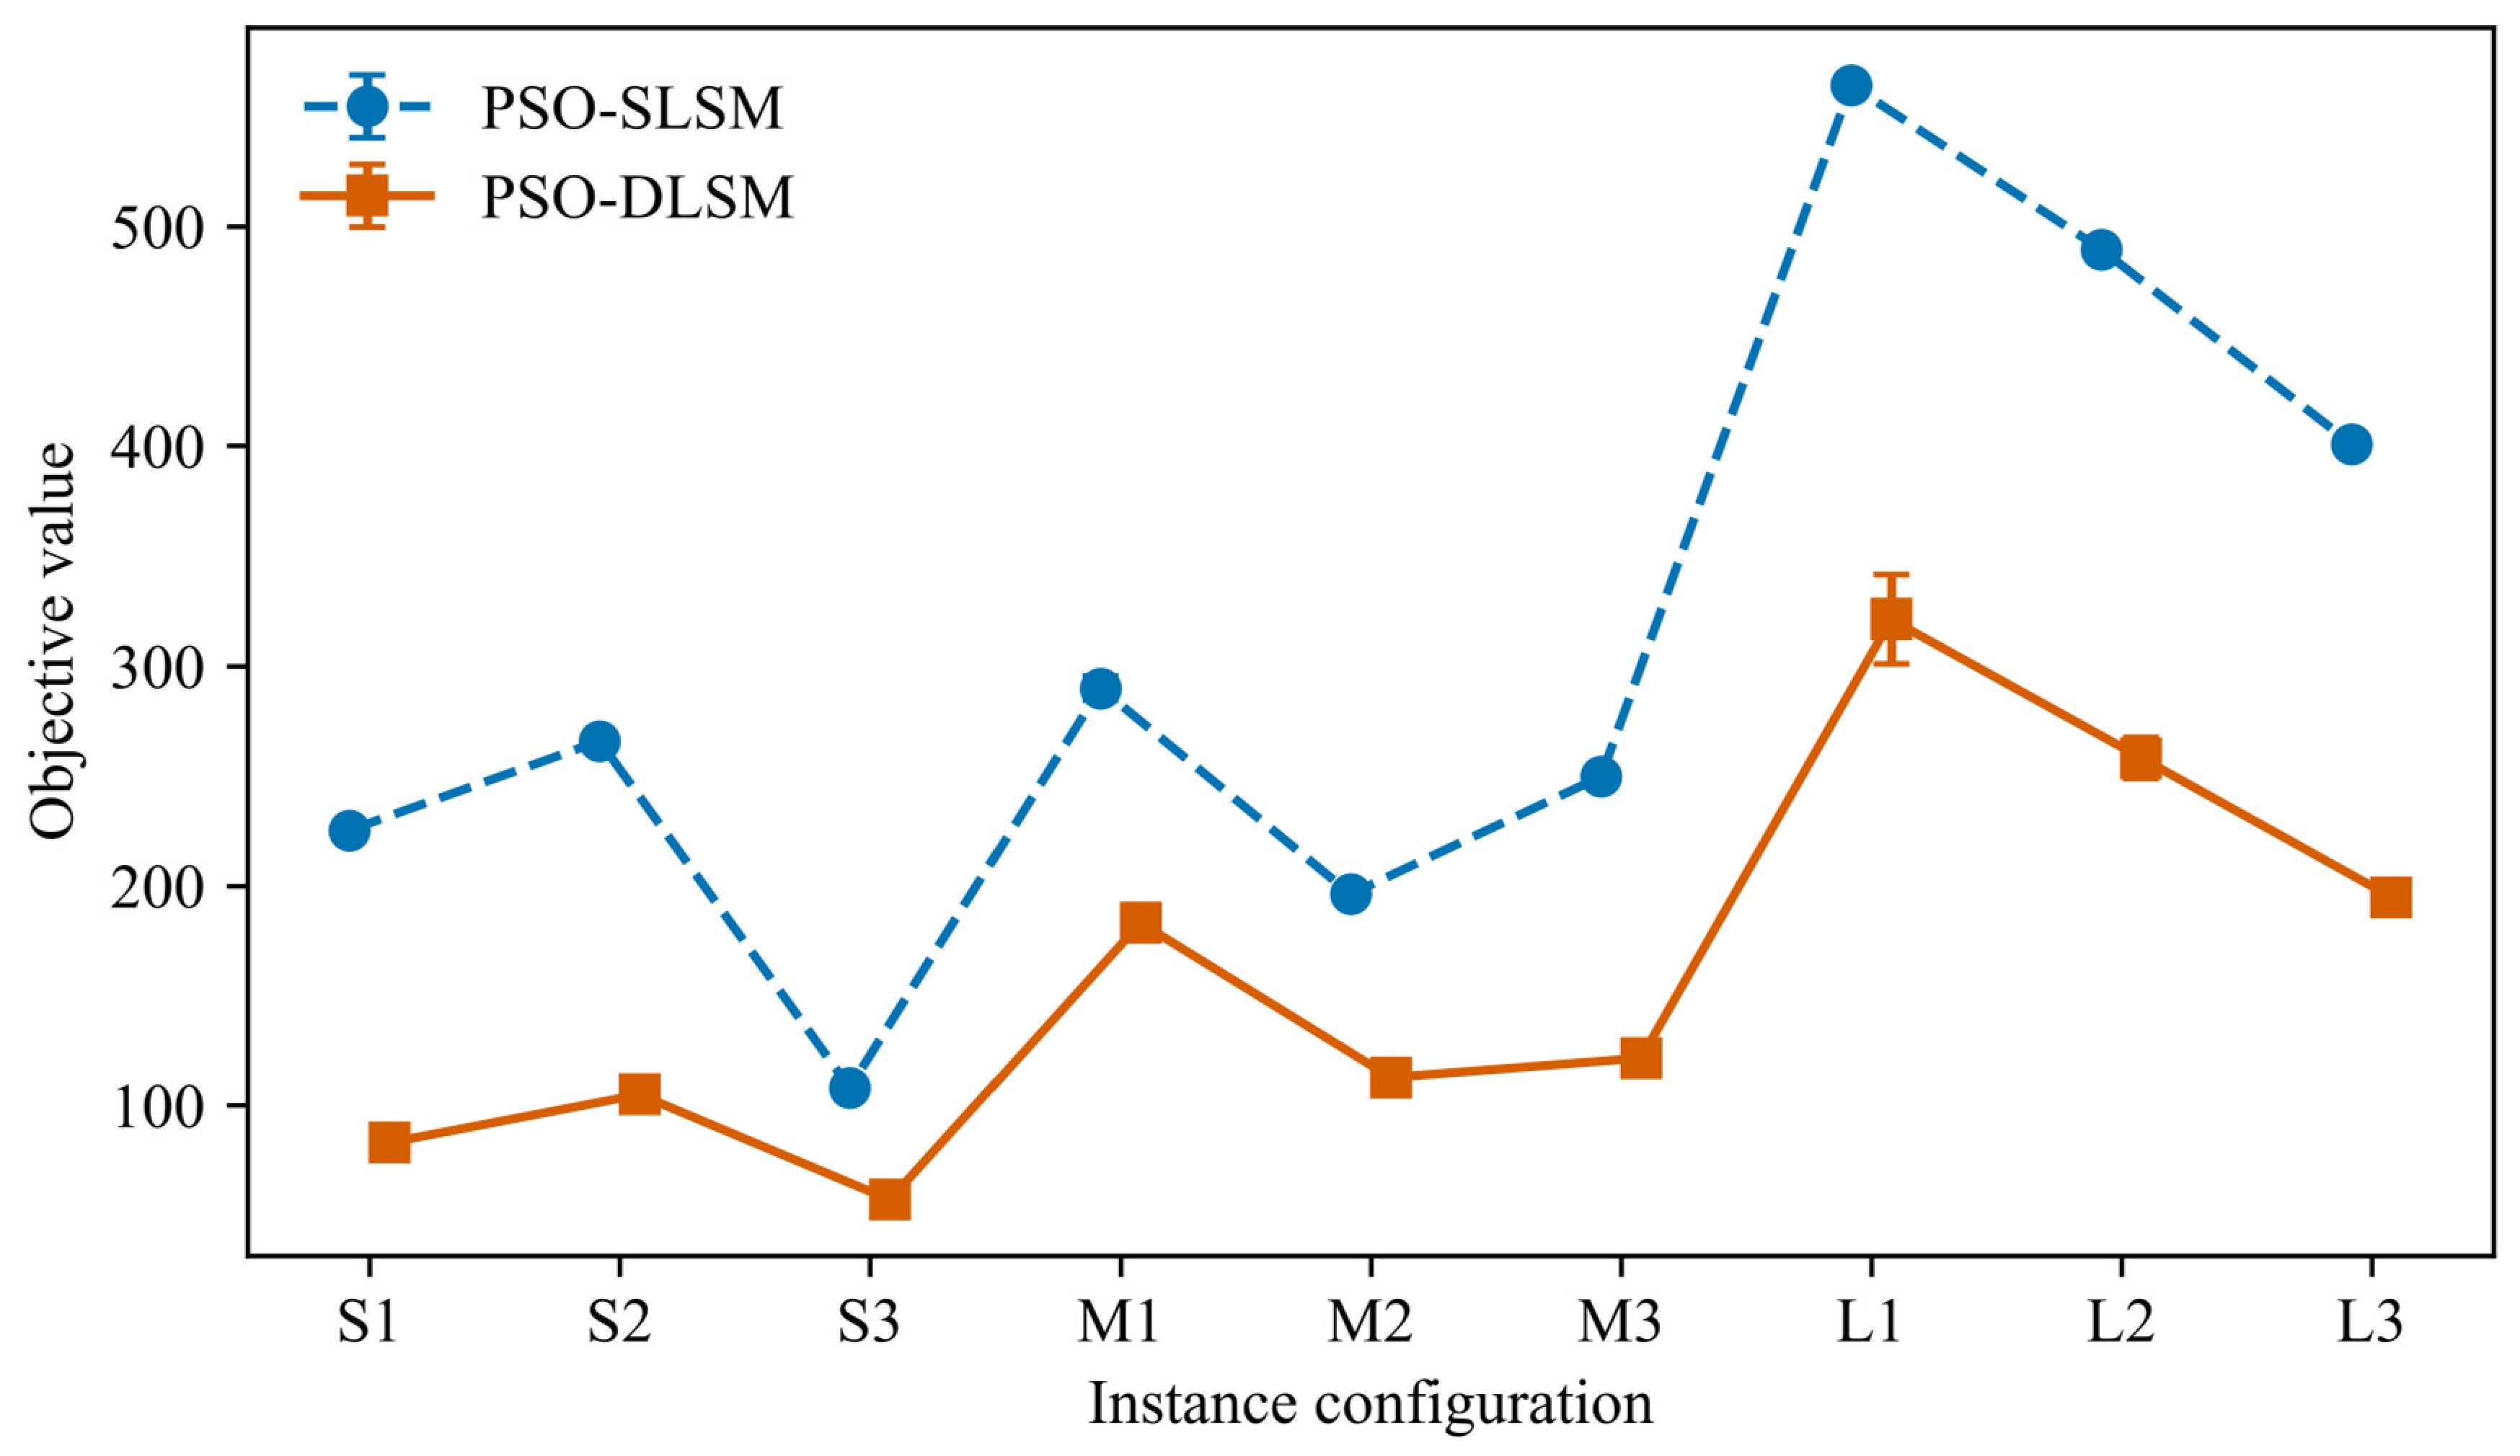
The performance gain observed here arose from compatibility between berth search and the DLSM operating rule, not from berth search alone. PSO-DLSM outperformed PSO-SLSM on every instance in the 45-instance ablation (Table 4), and the independent-run analysis confirmed the difference across the nine representative instance blocks with a large paired effect (Table 8 and Figure 9). PSO-SLSM, by contrast, was not statistically distinguishable from FCFS-SLSM after multiplicity correction. The mechanism is that berth search can place connected vessels at a common berth and create temporal overlap, after which the deterministic pairing and scheduling rules decide whether that opportunity becomes a feasible direct transfer. This interpretation applies to the present decoder and synthetic instances; it is neither a general claim about PSO nor a causal interaction estimate from a fitted factorial model.
Figure 9.
Objective values from 20 independent runs of each PSO scheme on nine representative instances. Points show means and error bars show SD; instance seed 3 was used for all configurations. Pairwise inference used instance-level means, not the 20 runs as independent blocks.
The substantive contribution lies in representing asymmetric synchronous service. Figure 2 illustrates the outer-feeder and inner-mainline arrangement. Constraints (17)–(22) describe same-berth use, vessel-length compatibility, temporal containment, and one-to-one pairing, while designated-partner eligibility is enforced procedurally by the scheduler rather than by those equations alone. The objective and handling-time relations connect feasible DLSM pairing to avoided yard transfer and the lower productivity of a cross-over quay crane. This is consistent with parallel- and double-berthing studies in treating nonconventional mooring as conditional on spatial and temporal compatibility [15,16], and with ship-to-ship-transshipment models in coupling direct transfer to the berth plan [17,18,19]. The present study differs by isolating a static one-to-one setting and using a two-dimensional ablation to distinguish berth-search effects from DLSM availability. Its safety and crane representation is correspondingly less complete than models with explicit crane movement, non-crossing, or navigation constraints [6,7,16].
4.2. Separate Effects of Optimization and DLSM
The two-dimensional ablation prevents attribution of the complete-scheme result to one component. Switching from FCFS to PSO under SLSM produced a small descriptive reduction in Table 4 and no statistically significant advantage in the nine-block repeated-run analysis. Enabling DLSM under FCFS likewise produced no difference after multiplicity correction. PSO-DLSM, however, outperformed each alternative in the Friedman post hoc comparisons. This pattern is consistent with complementarity: berth assignment can create eligible mainline–feeder overlaps, but the DLSM rule must convert those overlaps into direct-transshipment opportunities before they affect the objective. Because quay-crane counts and DLSM pairs are deterministic outputs, the comparison evaluates the combined search–rule–scheduler pipeline rather than a jointly optimized berth-crane solution.
Repeated runs also change the interpretation of algorithmic stability. Under the fixed particle and iteration budgets, Table 8 records no variation for several small cases but wider dispersion for larger instances. A discrete berth search coupled to rule-based completion can access more than one outcome as the instance grows, so best-run values alone would overstate reproducibility for some configurations. The reported coefficients of variation describe nine instances under the stated settings; they do not provide a distribution-free reliability guarantee.
4.3. Mechanisms Underlying Performance Improvement
Space sharing, temporal containment, and substitution of the transfer path jointly produce the operational benefit. In the M2-1 schedules (Figure 5 and Figure 6), the berth plan places connected vessels together and nests feeder service within mainline service. Verified pairs permit direct transfer and remove the associated indirect-transshipment penalty. The component audit for S1 and S2 confirms that avoided indirect transfer explains much of their improvement, correcting the earlier zero-pair reporting error (Supplementary File S1). This mechanism is consistent with models coupling berth timing and ship-to-ship transfer [17,18,19]. It remains conditional on compatible service intervals, vessel length, one-to-one pairing availability, and aggregate crane capacity.
Cross-over handling efficiency moderates this benefit. The repeated-run response changes between adjacent η settings, because faster outer-vessel handling can make an additional nested service interval feasible. Twenty repetitions per cell distinguish search variability from differences among the five instances. However, η has not been calibrated against terminal observations, so the observed transition is not a general engineering threshold.
4.4. Sensitivity and Applicability Conditions
The sensitivity analysis identifies applicability conditions rather than a universal response curve. Pair counts in Table 7 increase only modestly as the indirect-transshipment weight increases, whereas relative objective reductions rise strongly. Compatibility constrains pairing, and part of the apparent percentage benefit follows mechanically from increasing the weight on avoided yard transfer. Repeated runs document this computational behavior but do not turn an uncalibrated weight into a monetary cost or establish an economic break-even point.
Quay-crane availability affects the solution only while it binds the fixed deployment rule. In the single M2 seed-3 case, the lowest capacity produced a worse outcome, while every higher level returned an identical common-seed mean (Table 9 and Figure 10). Once the rule-generated assignments fit within the crane pool, unused capacity cannot improve a search that encodes berth assignments only. This threshold-and-plateau pattern applies to that instance; it does not establish a monotonic relation between crane stock and terminal performance. Operational assessment should therefore consider peak overlapping demand and the deployment rule, not nominal crane totals alone.
Table 9.
Exploratory Q sensitivity for M2 seed 3 (10 common-seed PSO-DLSM runs per level).
Figure 10.
PSO-DLSM objective sensitivity to quay-crane availability for M2 seed 3. Points show means and error bars show SD over 10 common-random-number runs per Q level. The Friedman test was used as an exploratory paired comparison; the result is not generalized beyond this instance.
4.5. Managerial Implications
Terminal managers should treat DLSM as a screened operating option rather than blanket berth expansion. A planning workflow can proceed in four steps. First, identify feeder-mainline connections with material sea–sea transshipment demand. Second, eliminate candidates that fail the common-berth, vessel-length, nested-service-window, or one-to-one pairing conditions. Third, compare SLSM and DLSM schedules under plausible cross-over productivity and inspect peak crane demand rather than nominal crane stock. Fourth, retain DLSM only when the advantage persists without relying on an uncalibrated penalty weight. The M2 seed-3 experiment illustrates why this must be instance-specific: Q = 8 was binding, whereas Q = 10–16 produced the same mean under the fixed deployment rule; it does not establish a universal crane threshold.
The ablation cautions against evaluating an optimization tool separately from the operating rules it supports. Berth search did not yield a reliable advantage under SLSM, whereas its combination with DLSM produced the strongest evidence. A decision-support interface should therefore report the enabled vessel pairs, the rule-generated crane deployment, the binding feasibility condition, and the three objective components for each candidate schedule. Raising the indirect-transshipment weight or nominal crane capacity cannot create spatial or temporal compatibility. Before operational authorization, terminal staff would still need to verify current arrivals, tide and weather, equipment reach and interference, mooring approval, regulatory clearance, and emergency-release arrangements. The framework remains a planning aid, not an autonomous dispatch system or a source of validated financial savings.
4.6. Limitations and Future Research
External validity remains limited. Arrivals are deterministic and the main instances are conditional on connected-feeder arrivals on mainline service windows. In the additional five-instance independent-feeder-arrival stress test, the mean PSO-DLSM reduction relative to PSO-SLSM fell to 5.82%: two cases tied, two improved, and one was 0.14% worse. Three cases produced no DLSM pairs. This supports treating overlap availability as an applicability condition rather than assuming a universal benefit. The test uses hypothetical arrivals, not historical records; terminal call data, uncertain-arrival evaluation, and operational validation remain necessary.
The resource and safety representation remains simplified. Aggregate capacity is now checked at every service event with half-open occupancy, which prevents the between-sample overload identified during revision. This does not model individual crane identities, non-crossing, interference, crane travel, setup time, dynamic reassignment, detailed work sequences, longitudinal berth positions, or mooring and navigation safety. Those constraints require crane- and terminal-specific information beyond the count-based planning representation. The schedules are feasible for the implemented constraints, not certified executable terminal plans.
The solution claim remains restricted. PSO searches berth assignments rather than jointly optimizing crane counts, pairings, sequences, and service times. The revised enumeration uses the same decoder and capacity evaluator, but certifies only the best enumerated result in that restricted space. Completing the algebraic links and developing a joint encoding or matheuristic would be necessary for full-model solution-quality assessment. Cross-over productivity still requires operational calibration. Neither the present benchmark nor the synthetic experiments establish global optimality for the normative model.
5. Conclusions
We examined berth allocation and quay-crane deployment for a static DLSM setting in which an outer feeder vessel receives synchronized service beside its designated inner mainline transshipment partner. The normative representation connects berth sharing, vessel-length compatibility, temporal containment, one-to-one pairing, direct transshipment, and differentiated crane productivity; designated-partner eligibility is imposed procedurally by the scheduler. The implemented method remains narrower than this formulation: PSO searches berth assignments, deterministic rules generate crane counts and DLSM pairs, and a constructive scheduler produces and checks service times.
Four conclusions follow within that scope. First, the asymmetric inner-mainline/outer-feeder representation makes DLSM feasibility contingent on explicit spatial, temporal, and resource conditions. Second, direct ship-to-ship transshipment depends on the berth plan and cross-over handling efficiency rather than entering the model as an exogenous yard-flow choice. Third, the FCFS/PSO by SLSM/DLSM ablation attributes the strongest performance to the complete PSO-DLSM pipeline: the nine-block repeated-run analysis found a large paired effect relative to PSO-SLSM, while PSO-SLSM did not significantly outperform FCFS-SLSM. Finally, the sensitivity evidence bounds the benefit by cross-over handling efficiency, the indirect-transshipment weight, and binding crane capacity. Synthetic experiments and the reported statistical tests support these conclusions; field deployment does not.
For terminal managers, the analysis supports planning-level computational screening of candidate DLSM pairs against their transshipment relation, common berth, vessel lengths, nested service windows, pairing availability, and peak crane demand before revising a berth plan. It does not justify blanket adoption of DLSM, a general claim that PSO is superior, or an estimate of financial savings, nor does it show that the complete berth-crane-pairing model was solved exactly or to global optimality. The small-instance enumeration is only a benchmark for the implemented constructive decision space. The independent-arrival stress test further shows that gains may vanish when compatible overlaps are absent.
Future research should validate the mechanism with terminal records and uncertain arrivals, calibrate cross-over handling efficiency, and represent dynamic crane reassignment, non-crossing, travel, and operational safety conditions. A broader encoding or matheuristic could coordinate the full berth, crane, pairing, sequencing, and timing decisions and support validation against a closed full-model formulation.
Supplementary Materials
The following supporting information can be downloaded at https://www.mdpi.com/article/10.3390/jmse14201897/s1, Supplementary File S1: Computational verification and correction record (Tables S1–S6); Supplementary File S2: Code, inputs, raw schedules, and reproducibility archive.
Author Contributions
Conceptualization, M.S. and Y.W.; methodology, M.S. and Y.W.; software, M.S. and Y.W.; validation, L.M., J.S. and X.Z.; formal analysis, M.S. and Y.W.; investigation, L.M., J.S. and X.Z.; resources, M.S. and Y.W.; data curation, L.M., J.S. and X.Z.; writing—original draft preparation, M.S.; writing—review and editing, M.S. and Y.W.; visualization, M.S. and Y.W.; supervision, Y.W.; project administration, M.S.; funding acquisition, M.S. All authors have read and agreed to the published version of the manuscript.
Funding
This research was funded by the Basic Scientific Research Project for Higher Education Institutions of the Education Department of Liaoning Province, grant number LJ212513207003.
Institutional Review Board Statement
Not applicable.
Informed Consent Statement
Not applicable.
Data Availability Statement
The accompanying files Supplementary_Material_S1_round2.docx and jmse-14-01897_round2_code_data.zip contain the computational correction record, revision inputs, per-run schedules, random seeds, raw results, analysis scripts, and the event-validated implementation. The archive includes a README and a SHA-256 file manifest for navigation and integrity checking.
Acknowledgments
During the preparation of this manuscript, the authors used OpenAI Codex (ChatGPT-5.6 model, CLI version 0.156.0) for basic language editing, minor code assistance and workflow documentation. The authors confirm that no scientific content, analysis, or conclusions were generated or modified by these tools. All computational outputs were independently verified by the authors, who take full responsibility for the manuscript.
Conflicts of Interest
The authors declare no conflicts of interest. The funders had no role in the design of the study; in the collection, analyses or interpretation of data; in the writing of the manuscript; or in the decision to publish the results.
References
- Bierwirth, C.; Meisel, F. A survey of berth allocation and quay crane scheduling problems in container terminals. Eur. J. Oper. Res. 2010, 202, 615–627. [Google Scholar] [CrossRef] [Scilit]
- Bierwirth, C.; Meisel, F. A follow-up survey of berth allocation and quay crane scheduling problems in container terminals. Eur. J. Oper. Res. 2015, 244, 675–689. [Google Scholar] [CrossRef] [Scilit]
- Rodrigues, F.; Agra, A. Berth allocation and quay crane assignment/scheduling problem under uncertainty: A survey. Eur. J. Oper. Res. 2022, 303, 501–524. [Google Scholar] [CrossRef] [Scilit]
- Makhado, N.; Paepae, T.; Sejeso, M.; Harley, C. Berth Allocation and Quay Crane Scheduling in Port Operations: A Systematic Review. J. Mar. Sci. Eng. 2025, 13, 1339. [Google Scholar] [CrossRef] [Scilit]
- Tang, M.; Ji, B.; Fang, X.; Yu, S.S. Discretization-Strategy-Based Solution for Berth Allocation and Quay Crane Assignment Problem. J. Mar. Sci. Eng. 2022, 10, 495. [Google Scholar] [CrossRef] [Scilit]
- Correcher, J.F.; Perea, F.; Alvarez-Valdes, R. The berth allocation and quay crane assignment problem with crane travel and setup times. Comput. Oper. Res. 2024, 162, 106468. [Google Scholar] [CrossRef] [Scilit]
- Thanos, E.; Toffolo, T.; Santos, H.G.; Vancroonenburg, W.; Vanden Berghe, G. The tactical berth allocation problem with time-variant specific quay crane assignments. Comput. Ind. Eng. 2021, 155, 107168. [Google Scholar] [CrossRef] [Scilit]
- Wang, Z.; Cheng, J.; Hu, H. A Proactive-Reactive-Based Approach for Continuous Berth Allocation and Quay Crane Assignment Problems with Hybrid Uncertainty. J. Mar. Sci. Eng. 2024, 12, 182. [Google Scholar] [CrossRef] [Scilit]
- Aslam, S.; Michaelides, M.P.; Herodotou, H. Optimizing Multi-Quay Combined Berth and Quay Crane Allocation Using Computational Intelligence. J. Mar. Sci. Eng. 2024, 12, 1567. [Google Scholar] [CrossRef] [Scilit]
- Rodrigues, F.; Agra, A. An exact robust approach for the integrated berth allocation and quay crane scheduling problem under uncertain arrival times. Eur. J. Oper. Res. 2021, 295, 499–516. [Google Scholar] [CrossRef] [Scilit]
- Wang, C.; Liu, K.; Zhang, C.; Miao, L. Distributionally robust chance-constrained optimization for the integrated berth allocation and quay crane assignment problem. Transp. Res. Part B Methodol. 2024, 182, 102923. [Google Scholar] [CrossRef] [Scilit]
- Guo, L.; Zheng, J.; Du, J.; Gao, Z.; Fagerholt, K. Integrated planning of berth allocation, quay crane assignment and yard assignment in multiple cooperative terminals. Transp. Res. Part E Logist. Transp. Rev. 2024, 183, 103456. [Google Scholar] [CrossRef] [Scilit]
- Yu, J.; Tang, G.; Voß, S.; Song, X. Berth allocation and quay crane assignment considering the adoption of different green technologies. Transp. Res. Part E Logist. Transp. Rev. 2023, 176, 103185. [Google Scholar] [CrossRef] [Scilit]
- Wang, Y.; Zou, T. Optimization of Berth-Tug Co-Scheduling in Container Terminals under Dual-Carbon Contexts. J. Mar. Sci. Eng. 2024, 12, 684. [Google Scholar] [CrossRef] [Scilit]
- Li, Z.; Fan, H.; Yue, L. Integrated Optimization of Berth Allocation and Quay Crane Assignment Under the Parallel Berthing Mode at Container Terminals. Transp. Res. Rec. 2025, 2679, 174–192. [Google Scholar] [CrossRef] [Scilit]
- Mo, J.; Hu, H.; Yang, X.; Sun, Z.; Xi, Y. Integrated optimization of berth allocation and vessel scheduling under double-berth mooring mode. Transp. Res. Part E Logist. Transp. Rev. 2026, 215, 105072. [Google Scholar] [CrossRef] [Scilit]
- Al Samrout, M.; Sbihi, A.; Yassine, A. An improved genetic algorithm for the berth scheduling with ship-to-ship transshipment operations integrated model. Comput. Oper. Res. 2024, 161, 106409. [Google Scholar] [CrossRef] [Scilit]
- Sbihi, A.; Al Samrout, M.; Yassine, A. Adaptive NSGA-III for a tactical bi-objective optimization of integrated berth and quay crane assignment in transshipment operations. J. Heuristics 2026, 32, 23. [Google Scholar] [CrossRef] [Scilit]
- Gan, C.; Tan, C.; He, J.; Wang, Y. Dynamic double-line multi ship mooring mode for berth and quay crane allocation in a container terminal. Comput. Ind. Eng. 2026, 220, 112236. [Google Scholar] [CrossRef] [Scilit]
- Eberhart, R.; Kennedy, J. A new optimizer using particle swarm theory. In Proceedings of the Sixth International Symposium on Micro Machine and Human Science, Nagoya, Japan, 4–6 October 1995; IEEE: Piscataway, NJ, USA, 1995; pp. 39–43. [Google Scholar]
- Shi, Y.; Eberhart, R. A modified particle swarm optimizer. In Proceedings of the IEEE International Conference on Evolutionary Computation, Anchorage, AK, USA, 4–9 May 1998; IEEE: Piscataway, NJ, USA, 1998; pp. 69–73. [Google Scholar] [CrossRef] [Scilit]

Disclaimer/Publisher’s Note: The statements, opinions and data contained in all publications are solely those of the individual author(s) and contributor(s) and not of MDPI and/or the editor(s). MDPI and/or the editor(s) disclaim responsibility for any injury to people or property resulting from any ideas, methods, instructions or products referred to in the content. |
© 2026 by the authors. Licensee MDPI, Basel, Switzerland. This article is an open access article distributed under the terms and conditions of the Creative Commons Attribution (CC BY) license.