


Abstract
Offshore wind power cables may experience drag and lift loading where submarine landslides or related density flows cross a cable corridor. To prioritise conditions for detailed analysis, a leakage-controlled ensemble-learning workflow was developed from multi-source submarine landslide–pipeline/cable impact data and evaluated by source-grouped cross-validation. Separately predicted peak drag and peak lift were converted to empirical percentile ranks and averaged to form a dataset-relative peak-load severity index. The resulting Low–Extreme categories achieved accuracy of 0.748, macro F1 of 0.690 and High/Extreme recall of 0.758; binary High/Extreme identification achieved accuracy of 0.903, F1 of 0.800 and ROC-AUC of 0.947. Missingness analyses gave four-category accuracy of 0.717–0.771 across full, low-missingness and complete-case settings, whereas weight and threshold changes showed that category boundaries remain calibration choices rather than universal limits. Scenario and feature-group results indicate combined associations with hydrodynamic forcing, cable geometry, rheology and exposure/cover conditions. The output is intended to rank candidate conditions for computational fluid dynamics, physical modelling or structural verification. It is not a design load, a code check or a full risk estimate, which would additionally require occurrence probability, cable vulnerability, consequence and project-specific validation.
1. Introduction
Offshore wind power depends on export and inter-array submarine power cables that connect turbines, offshore substations and onshore grids. After installation, these long distributed assets are difficult to inspect and repair. Cable failures can interrupt power export and require costly marine repair operations, making reliability a central design concern for offshore wind farms [1]. Technology development for floating offshore wind has further increased attention to submarine power cable systems and their long-term performance [2]. Recent cable-focused studies have also discussed repair implications and failure pathways [3].
Cable planning is closely linked to route selection, burial-depth assessment and construction constraints. Burial-depth assessment provides a practical route-level control on exposure and external interference [4,5]. Route optimisation and burial-machine interaction also affect where cables can be installed and protected efficiently [6,7]. Additional route-specific constraints arise from anchor dragging and broader marine geotechnical interpretation of seabed conditions and geohazards for offshore infrastructure [8,9,10].
Among the geohazards relevant to offshore cable corridors, submarine landslides, mud flows, debris flows and turbidity currents can impose complex mechanical actions on cables and pipelines. Debris-flow impact experiments by Zakeri et al. showed that dense submarine flows can generate substantial drag and lift forces on pipelines [11,12]. Subsequent numerical and material-point-method studies extended this problem to submarine landslide loading and pipeline response under different boundary and soil-flow conditions [13,14]. Suspended-pipeline and soil-flow interaction studies further clarified that uplift, lateral displacement and local soil-flow mechanisms can be important in addition to drag [15,16]. Recent work on hydrodynamic landslide loading and high-speed turbidity-current impact confirms that velocity, density contrast, rheology, cable or pipe diameter, exposure and burial state are key descriptors for load appraisal [17,18]. Reviews of gravity-flow interaction with offshore pipelines place these mechanisms in a broader process context [19,20].
Physical model testing and computational fluid dynamics (CFD) simulations provide detailed insight into cable–flow and pipeline–flow interaction mechanisms. For selected high-consequence cases, they remain standard tools for final design verification [11,15,16,18]. During early offshore wind project development, however, detailed CFD or physical testing is not practical for every candidate route segment, burial condition and geohazard scenario. Between geohazard interpretation and final verification, a staged workflow needs an appraisal tool that can compare many possible conditions and identify the cases that deserve detailed CFD, physical modelling or structural verification.
Multi-source experimental and numerical datasets provide an opportunity to build data-driven surrogate models for this intermediate stage. The global dataset of submarine-landslide impact forces on pipelines and cables compiled by Liu et al. [21] demonstrates that published experiments and simulations can be reorganised into actual force targets suitable for comparative engineering analysis. In geotechnical engineering, surrogate modelling has already been used to reduce the cost of repeated numerical analysis [22]. Broader reviews confirm that machine learning can support geotechnical assessment when validation strategy and data limitations are made explicit [23,24]. Physics-informed machine learning direction papers further clarify how domain knowledge can be combined with data-driven models [25]. Recent multi-source environmental analyses have likewise used Random Forest to identify nonlinear driver–response patterns in heterogeneous datasets, illustrating the broader interpretive value of ensemble learning [26]. For cable-route geohazard appraisal, strict leakage control and cross-source validation are essential: without them, source identifiers, force-derived coefficients or target-related variables can create an optimistic but non-transferable estimate of performance.
Existing data-driven studies have rarely translated actual drag and lift evidence into a source-transfer-tested severity measure for offshore cable appraisal. In this context, geohazard occurrence concerns whether, where and how often a submarine landslide or density flow may affect a corridor; mechanical load severity concerns the relative drag and lift demand conditional on a specified flow–cable interaction; and full risk additionally combines occurrence probability, cable vulnerability and consequence. A source-transfer-tested appraisal of the middle layer is therefore needed to identify conditions with high peak-load severity relative to the compiled evidence for detailed verification.
To address this gap, the compiled submarine landslide–pipeline/cable impact data are reorganised into actual drag and lift load targets that are directly relevant to route and protection assessment. Leakage control and source-grouped validation test whether the learned relationships transfer across independent source studies. Peak drag and peak lift are then combined into a composite peak-load severity index. Feature-group analysis, response maps and representative offshore cable scenarios relate the resulting categories to hydrodynamic forcing, rheology, cable geometry and exposure/cover state, providing a basis for selecting priority cases for CFD, physical modelling or structural verification.
2. Materials and Methods
2.1. Dataset and Engineering Load Targets
The modelling table draws on the global dataset of submarine-landslide impact forces on pipelines and cables compiled by Liu et al. [21]. Experimental and numerical cases in the dataset cover submarine landslides, mud flows, debris flows and turbidity currents interacting with cylindrical pipeline and cable structures. For the present appraisal, the compiled records are reorganised into actual drag and lift load targets, leakage-controlled input variables and source-grouped validation folds.
The published dataset supplies common fields and units for the pooled records: velocity in m/s, density in kg/m3, pipeline/cable diameter and roughness in mm, rheological stress in Pa (shear strength in kPa), and drag/lift forces in N. Drag is defined along the landslide run-out direction and normal to the cable axis, whereas lift is normal to both the cable axis and run-out direction; peak and sustained values follow the component labels reported in the source dataset. The present analysis retained these standardised fields and did not infer missing time histories or reclassify a source-specific value when the original study did not support a common peak or sustained component. Ambient density was retained as supplied by the published compilation, including its documented 1000 kg/m3 assumption when a source did not report it.
The appraisal used four actual engineering load targets: peak drag force , sustained drag force , peak lift force and sustained lift force . Peak drag and peak lift form the load-severity index because they represent upper-tail horizontal-impact and uplift modes. Sustained drag and sustained lift were retained as auxiliary diagnostics: the former had stronger average rank metrics but failed the upper-tail scenario transfer check, and the latter had weak cross-source error metrics. Dataset availability and target-level sample coverage are reported in Table 1.
Table 1.
Dataset summary and target availability for actual offshore cable load targets. “Missing” denotes absence of that response target among the 864 compiled records; it is not the fraction of missing predictor cells.
Target-level data gaps in Table 1 reflect the compiled nature of the dataset: different source studies reported different force components and physical descriptors. Within the modelling pipeline, numerical predictors were median-imputed, and categorical descriptors were handled through one-hot encoding. Section 3.5 examines whether data-availability patterns influence the results. In this form, the dataset supports the cross-source appraisal of load-severity patterns.
Residual heterogeneity remains after field-level standardisation. The 864 records are unevenly distributed among 24 sources and four flow labels (426 debris-flow, 396 mud-flow, 31 turbidity-current and 11 block-sliding records), while the target-specific subsets are dominated by mud-flow observations. Experimental and numerical configurations, scale, boundary conditions, force extraction procedures and reporting completeness also differ among sources. These imbalances are not treated as event frequencies and limit transfer to an unrepresented process or project. Source-grouped folds test whether relationships transfer between contributing studies, but they do not remove these residual biases.
2.2. Overall Appraisal Workflow
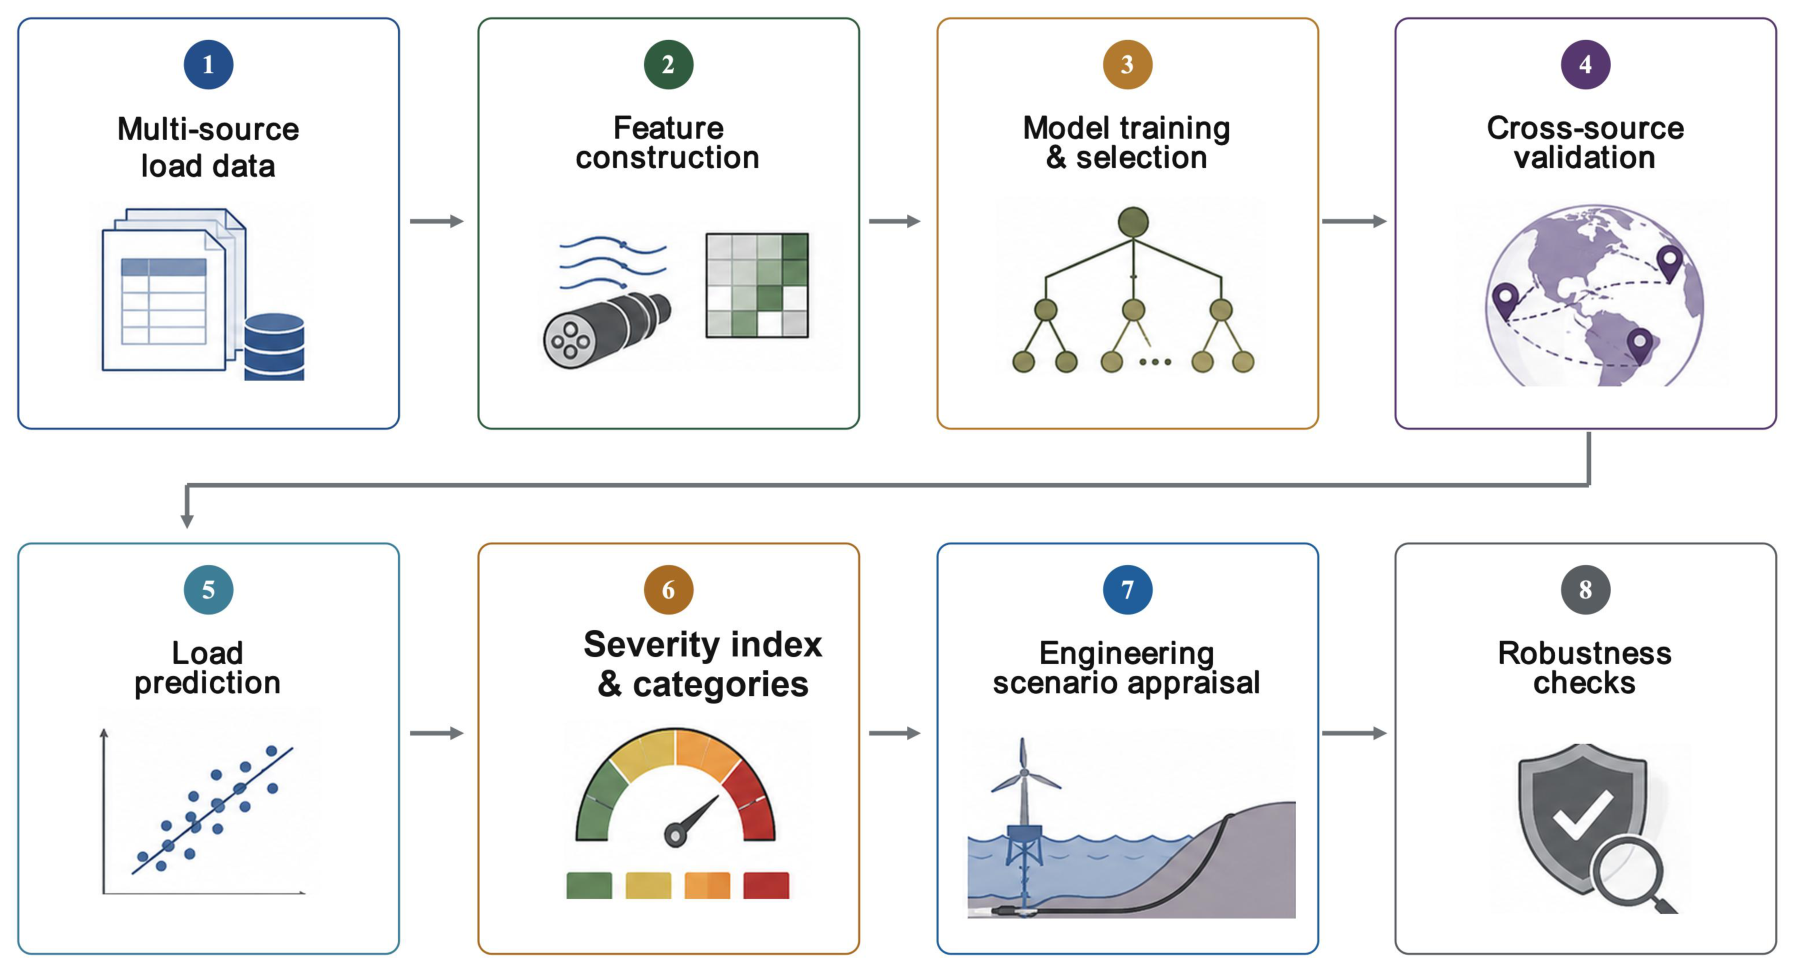
Figure 1 shows the overall appraisal workflow. Multi-source cable-impact data are linked to leakage-controlled feature construction, source-grouped validation, composite peak-load severity categorisation and scenario-based route appraisal. For early-stage route appraisal, the workflow provides relative load-severity prioritisation indicators before CFD simulations, physical model tests or structural verification are undertaken.
Figure 1.
Engineering appraisal workflow for offshore wind cable impact-load severity under submarine landslide and related density-flow actions.
2.3. Feature Construction and Leakage-Controlled Validation
Input variables represent engineering descriptors that may be available during preliminary offshore cable assessment. They include the flow type, impact velocity, density contrast, rheological variables, cable diameter, exposure or cover-related variables and roughness descriptors. Derived variables, including logarithmic velocity, logarithmic diameter, density ratios and relative roughness terms, capture nonlinear load-response behaviour without introducing target information.
The final input inventory contained 38 pre-encoding predictors: 37 numeric fields and one categorical flow-type field. It comprised the original physical descriptors and deterministic transformations (logarithms, density ratios, relative roughness and regime indicators). After fold-specific median imputation, missing-indicator construction and one-hot encoding, the dimension ranged from 44 to 67 depending on the target and training fold.
Strict leakage control preceded model training. All force targets, force coefficients and direct force-value fields were excluded from the input feature set. The source identifier was used only for grouping and never as a model input. By construction, the validation test discouraged learning source-specific shortcuts in place of transferable engineering relationships.
No derived predictor used a force, force coefficient, target value, source identifier or statistic calculated from a held-out fold. Imputation values, missing indicators, scaling parameters and one-hot categories were fitted on the training portion of each fold only.
GroupKFold validation grouped the records by source study. Under this design, the model performance reflects the transfer across independent source studies rather than interpolation within a single source. Table 2 summarises the final validation settings.
Table 2.
Candidate models, target transformations and leakage-controlled validation settings used for cable-impact load appraisal.
Five folds were used for every target. Depending on target availability, held-out folds contained 19–119 samples for , 51–119 for , 37–119 for and 13–119 for ; each held-out source was absent from the corresponding training subset. This is a cross-source internal validation of the compiled dataset, not validation on an independent offshore project.
2.4. Target Transformation and Candidate Models
Actual cable-impact loads are strongly skewed and may span several orders of magnitude. Both raw-scale and transformed targets were evaluated. For , and , the analysis considered raw and transformations. For , it considered raw and signed- transformations to allow signed lift values.
The candidate set was intentionally compact: mean baseline, Ridge regression, Random Forest, ExtraTrees and GradientBoosting. XGBoost and LightGBM entered the comparison only when available in the computing environment, and the study did not rely on them. Numerical variables used median imputation, categorical variables used one-hot encoding, and all random processes used a fixed random seed. The objective was to establish whether a simple ensemble-learning workflow can support preliminary engineering assessment, without turning the study into a hyperparameter search.
The reported analysis used Python 3.9.6, NumPy 2.0.2, pandas 2.3.3, SciPy 1.13.1 and scikit-learn 1.6.1. XGBoost and LightGBM were not installed and therefore did not enter the reported selections. The fixed seed was 42. Random Forest used 300 trees and minimum leaf size 3; ExtraTrees used 500 trees, minimum leaf size 2 and max_features = 0.8; GradientBoosting used 250 trees, learning rate 0.04 and maximum depth 3; Ridge used . The remaining estimator settings were the archived scikit-learn 1.6.1 values.
For log-transformed targets, inverse-transformed predictions were clipped to the minimum and maximum response observed in the corresponding training fold. This safeguard prevents exponential inversion from producing values outside the response range available to that fitted fold; it does not provide a physical extrapolation model or a prediction interval.
2.5. Model Selection and Performance Metrics
Model selection treated each load target separately. The first filter removed invalid or catastrophic predictions, including non-finite predictions, excessive prediction-to-observation magnitude ratios and extreme variance-based failures. The remaining candidates were ranked by Spearman rank correlation, factor-of-two accuracy, mean absolute error (MAE) and .
Operationally, a candidate failed the first stage if it produced any invalid prediction, a prediction-to-observation maximum ratio above 10, mean , or mean MAE above ten times the target-specific median candidate MAE. Passing candidates were sorted lexicographically by mean Spearman correlation (descending), factor-of-two accuracy (descending), MAE (ascending), (descending), model name and target-transformation name. Thus, the selection and all ties were deterministic.
Model ranking combined rank-order performance, order-of-magnitude agreement and absolute error, represented by Spearman correlation, factor-of-two accuracy and MAE. is retained as a conventional diagnostic, but early-stage cable-route appraisal was not based on this metric alone.
2.6. Composite Peak-Load Severity Index and Load-Severity Categories
Load-severity categorisation used the peak-load targets and . For each target, the analysis calculated an empirical percentile rank over the available load cases. The primary composite peak-load severity index was defined as the mean of the two percentile ranks:
where denotes the empirical percentile rank. A conservative severity definition was also evaluated:
The peak-mean index was selected as the primary severity index because it provided better four-category and binary high-severity condition identification performance. As a conservative sensitivity definition, the peak-maximum index was retained for cases dominated by one high peak component. Percentile-index thresholds define the Low, Moderate, High and Extreme categories, which are dataset-relative impact-load severity categories obtained from the compiled load data.
After all five source-grouped folds were completed, the separately predicted peak-drag and peak-lift values were pooled over the 258 out-of-fold overlap samples. Empirical percentile ranks were calculated separately within these pooled out-of-fold predictions and then averaged to obtain the primary predicted severity index. The index was not trained as an independent regression target. Observed categories were calculated analogously from the paired observed peak loads in the same overlap set. The peak-maximum index used the larger of the two component ranks and was retained only as a conservative sensitivity definition.
2.7. Robustness, Feature-Group Interpretation and Engineering Response Analysis
Robustness analysis retained source-grouped folds throughout. Missingness was assessed using all 38 predictors with fold-specific median imputation, subsets restricted to predictors with whole-table missingness no greater than 20% (32 predictors) or 10% (23 predictors), complete cases on the 32-predictor set, and models with or without imputer-generated missing indicators. The index sensitivity crossed drag/lift weights of 0.4/0.6, 0.5/0.5 and 0.6/0.4 with lower (0.45/0.70/0.875), primary (0.50/0.75/0.90) and upper (0.55/0.80/0.925) category thresholds; the peak-maximum definition was retained as a separate conservative check. Source-cluster bootstrap resampling (1000 replicates, seed 42) quantified the variation attributable to the mix of contributing studies. Feature-group ablation used flow type, hydrodynamic, rheological, cable-geometry, exposure/cover and roughness groups. Eight scenarios were constructed from training-data quantiles, and applicability checks used min–max, P1–P99 and P5–P95 ranges.
The computational cases are arranged in the same order as the Results section, from load-target profiling to scenario-based route appraisal (Table 3).
Table 3.
Computational cases and settings used in the impact-load severity appraisal.
The response maps varied two variables while holding every other predictor at a median or modal condition. They are conditional slices through fitted tree ensembles, which can represent nonlinear interactions, but they do not isolate causal effects or exhaust all higher-order combinations. The maps were therefore interpreted together with grouped ablation and only within the sampled applicability domain.
3. Results
3.1. Load Components and Upper-Tail Severity Characteristics
Actual load components have different values for offshore cable route and protection appraisal under submarine landslide-flow action. Four targets describe the main response modes of an offshore cable. Peak drag captures short-duration along-flow impact that may drive lateral movement or disturb armour, mattresses or rock protection. During the longer passage of a mud flow, debris flow or turbidity current, sustained drag represents persistent horizontal action relevant to progressive displacement and repeated disturbance of the protection layer. Peak lift concerns upward forcing, local loss of embedment, shallow-burial failure, exposure and possible free-span initiation. Sustained lift remains an auxiliary target because its multi-source stability is limited, despite its physical relevance during longer flow stages.
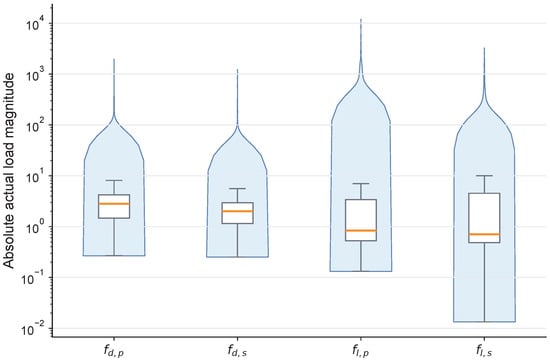
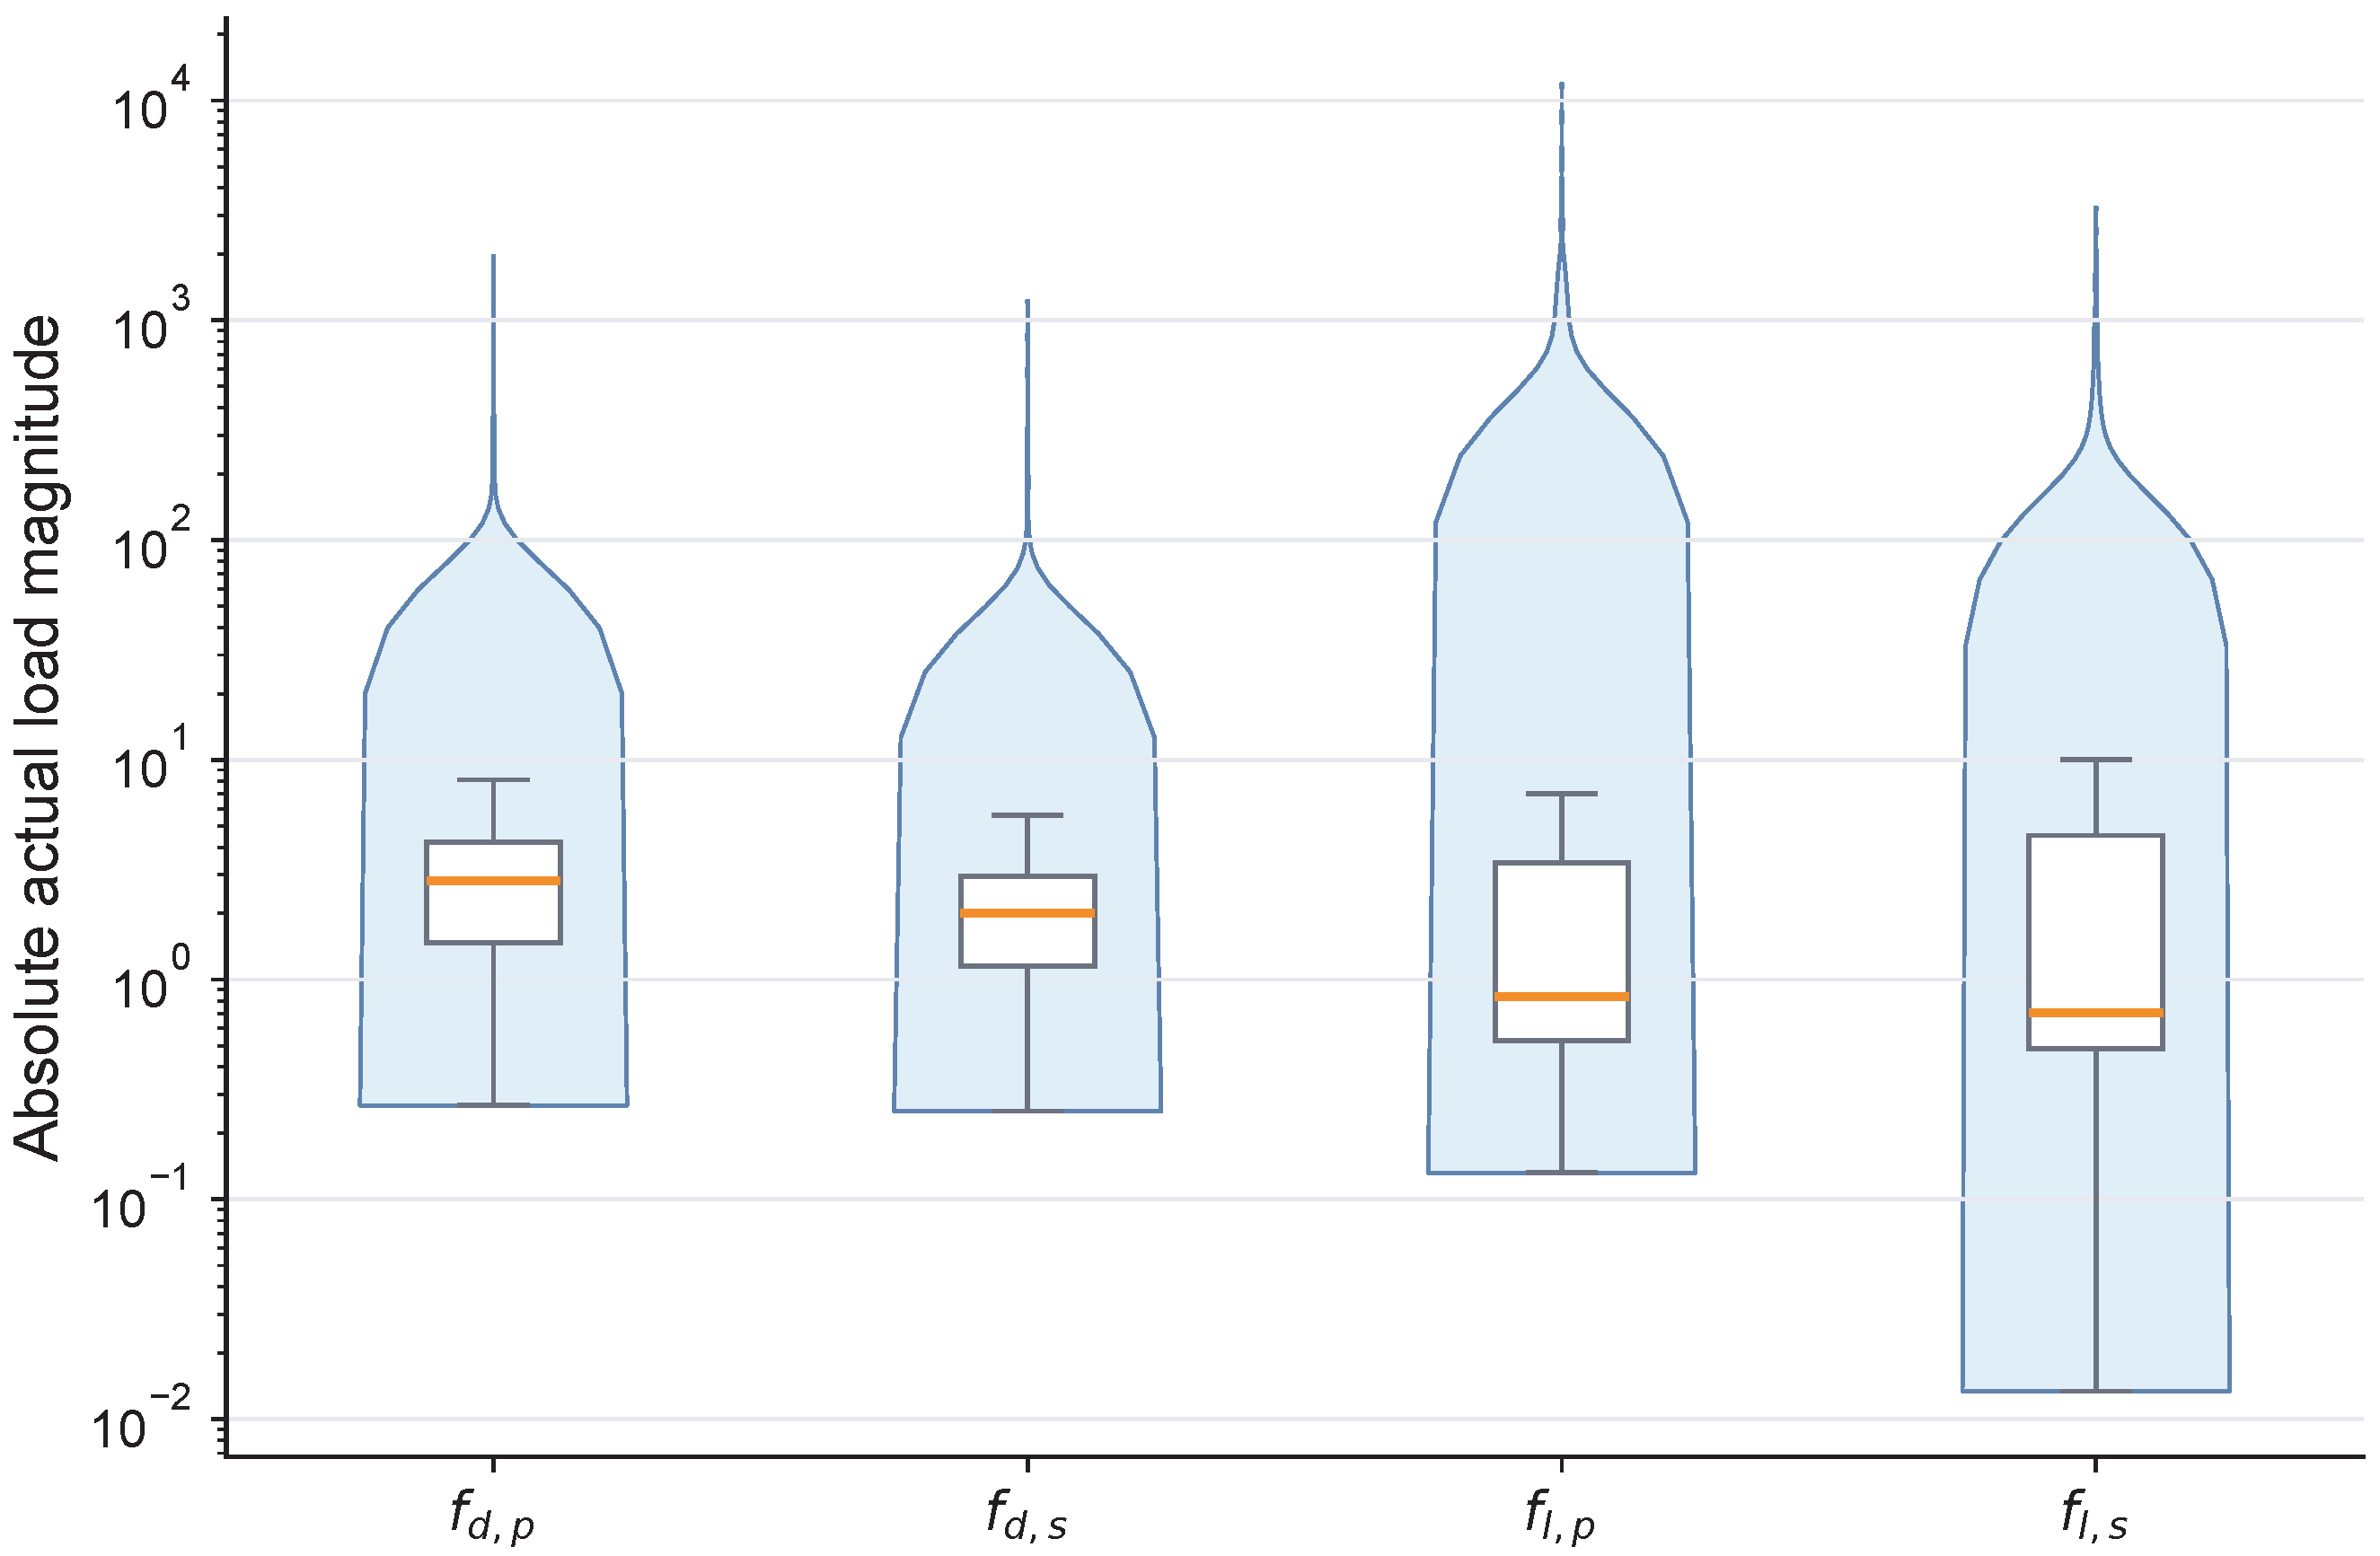
Figure 2 summarises the empirical distributions of the four actual force targets before load-severity categorisation using absolute load magnitude. Violin shapes show where most observations are concentrated, internal boxes mark the central range and median, and the logarithmic vertical scale makes the upper-tail cases visible without compressing the lower-load range. For offshore cable appraisal, this upper-tail structure matters because a small number of high-energy flow conditions or highly exposed cable states may control the need for detailed verification.
Figure 2.
Actual load-magnitude distributions for offshore cable impact appraisal. The violin shapes show the empirical distribution of each target, the internal box marks the central range and median, and the logarithmic vertical axis highlights upper-tail cases. A small number of severe flow–cable interaction cases may warrant detailed evaluation of route, burial and protection conditions.
The upper tail also explains why actual load appraisal is a useful intermediate step between geohazard identification and detailed design. A route segment may be exposed to many low-energy or typical mud-flow conditions, yet a plausible debris-flow or turbidity-current case with high drag or lift demand may warrant further evaluation of burial depth, protection or structural response. In this sense, Figure 2 shows why protection-priority ranking must pay attention to severe but less frequently represented flow–cable combinations.
As Table 1 shows, the sample availability and source coverage differ across targets. Peak drag and peak lift represent the upper-tail horizontal-impact and uplift/exposure modes used by the index. The sustained components remain diagnostic targets only; neither supplies a scenario reference or contributes to category assignment.
3.2. Composite Peak-Load Severity Index for Engineering Appraisal
The composite peak-load severity index is the main result of the study. Isolated transient peak-force prediction is difficult in a multi-source setting. Peak values respond to flow type, experimental or numerical boundary conditions, force-definition details, exposure and cover state, and the limited number of upper-tail observations. Together, these factors reflect the physical and methodological diversity of published submarine gravity-flow interaction data.
For early route corridor assessment, the appropriate target is not a final design force for every transient peak. Engineers usually need to know which flow–cable combinations should be escalated for CFD, physical modelling or structural verification. A composite severity index converts multiple load signals into a comparable engineering priority indicator.
As the primary impact-load severity index, the peak-mean index combines the percentile ranks of peak drag and peak lift. It reflects both horizontal impact demand and uplift/exposure demand. For offshore cables, a critical route section may be controlled by lateral loading, by uplift and exposure, or by a coupled response. The peak-maximum index is retained as a conservative sensitivity definition for cases where one peak component alone is high enough to trigger engineering concern.
The reported categories were not obtained by fitting a separate index regressor: they came from the two out-of-fold component predictions through Equation (1). The auxiliary feature-group analysis did fit the observed index directly (Spearman about 0.84 and about 0.73) solely to compare predictor groups; those values are not performance estimates for the reported category pipeline and are not compared with the component scores. The incremental value claimed for the composite output is therefore operational—one ranked screening quantity represents two distinct peak-load modes—and is evaluated by the category and High/Extreme metrics below.
Load-severity categories derived from this index remain comparative severity classes. They translate multi-source drag and lift evidence into practical Low, Moderate, High and Extreme categories. Within this scope, the composite index is the primary bridge between actual load evidence and practical decisions about which cable-route conditions should advance to detailed verification.
3.3. Cross-Source Appraisal of Individual Load Components
Individual load components provide supporting evidence for the composite severity appraisal. In engineering terms, source-grouped validation tests whether load-response trends remain useful when held-out cases come from independent source studies. Such a setting is closer to a new offshore wind cable corridor than a random split of pooled samples. A new project will not reproduce the exact experimental layout, numerical formulation, flow preparation or cable exposure condition of a previous source.
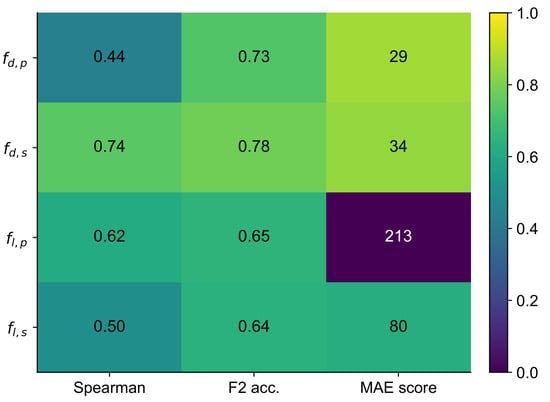
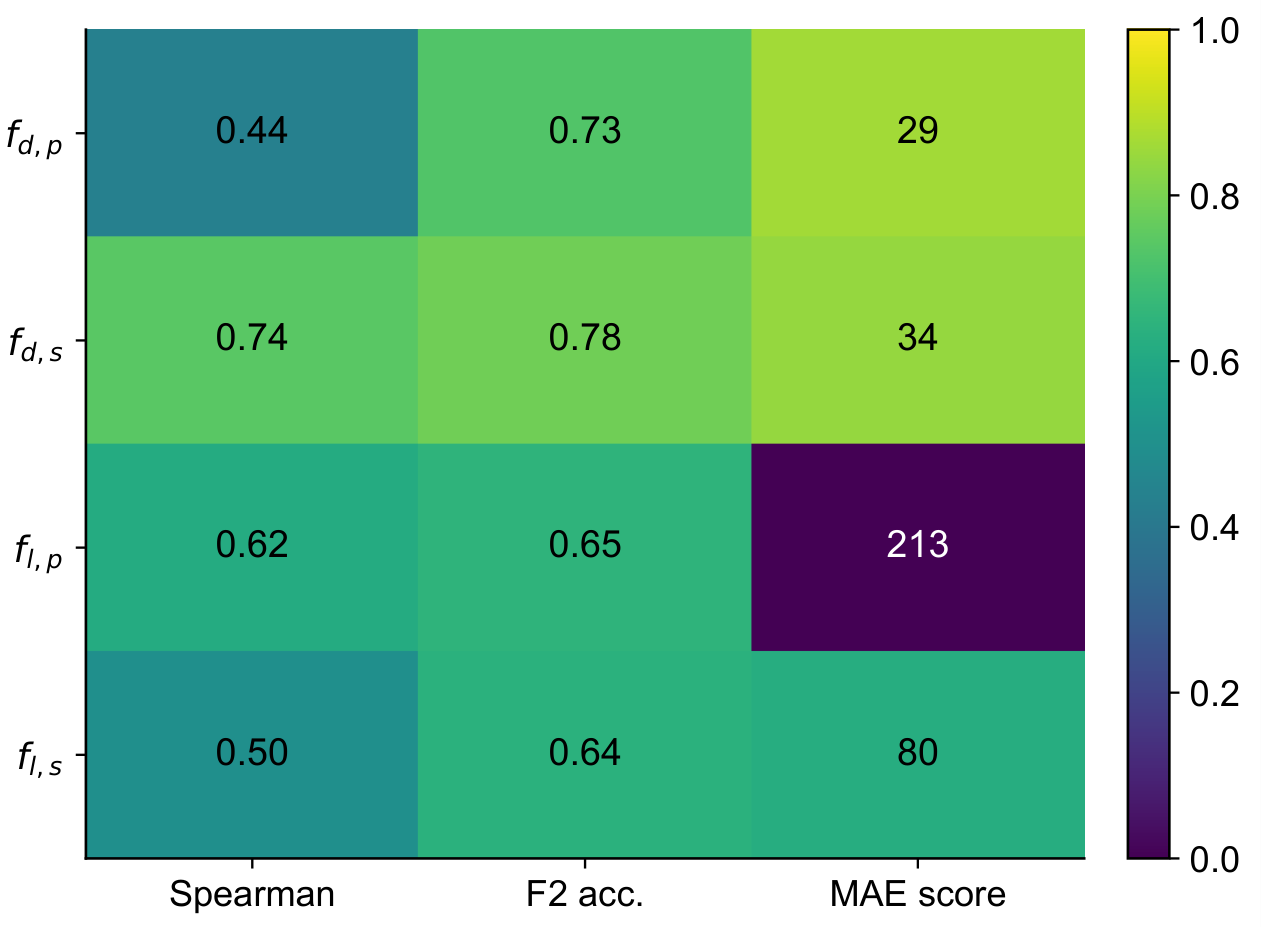
Among the individual components, sustained drag had the highest fold-mean rank and factor-of-two metrics (Spearman correlation 0.745 and factor-of-two accuracy 0.783), but its MAE of 33.7 and reveal substantial upper-tail error (Table 4). Its cross-source predictions never exceeded 4.32 even though the observed training target reached 1226.81. Conversely, fitting all sources produced S6/S8 sustained-drag values near 1087, driven mainly by diameter and log-diameter (combined importance 0.894) and not supported by held-out-source transfer. Sustained drag is therefore retained only as an auxiliary cross-source ranking target; its scenario point predictions were removed.
Table 4.
Selected load-component appraisal performance under source-grouped validation. Metrics are interpreted as preliminary load-appraisal indicators, not final design-load accuracy. Variance-based point-prediction limitations are discussed in the main text.
Peak lift provided rank-order appraisal value for uplift-related severity, with a Spearman correlation of 0.617, factor-of-two accuracy of 0.651 and MAE of 213. This supports its use as the uplift/exposure component of the composite severity index. In cable-route terms, peak lift is relevant to shallow-burial loss, local exposure and free-span initiation; so, even moderate rank-order skill can be useful for identifying cases that deserve closer uplift or span checks.
Under source-grouped validation, peak drag was less stable as a deterministic transient point-prediction target, but it retained practical value as the peak horizontal-impact component. Its factor-of-two accuracy was 0.728, and the MAE was 29.3. For this reason, is interpreted as evidence for relative peak-load severity, not as a stand-alone design-load predictor. Its role is to contribute horizontal impact information to the composite severity index.
Sustained lift was still less reliable: its fold-mean Spearman correlation was 0.497, factor-of-two accuracy 0.638, MAE 80.2, and . The MAE was approximately 114 times the median absolute observed sustained-lift magnitude (0.704). It is retained for transparency but excluded from the severity index and all scenario appraisal.
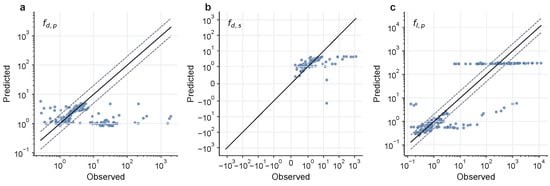
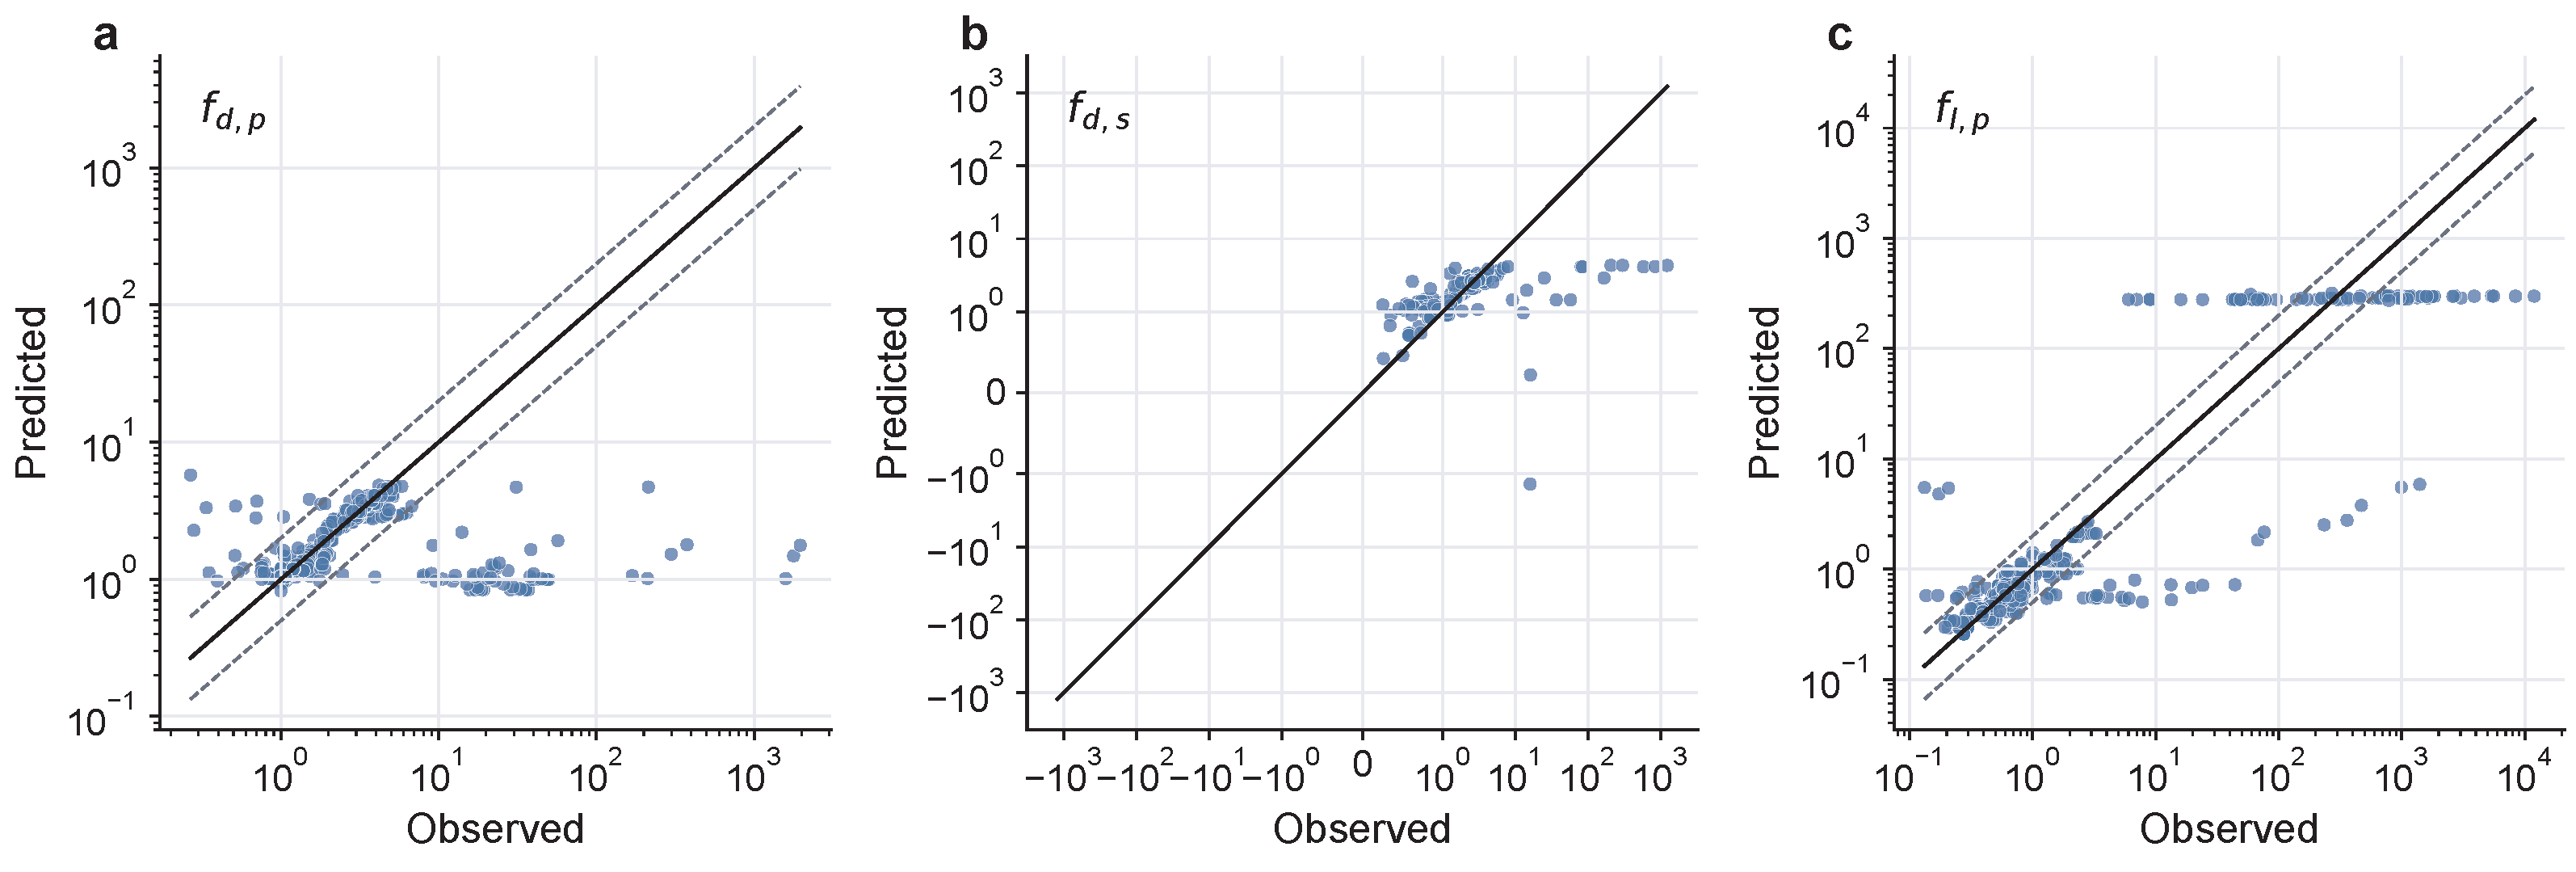
The selected load-component performance is summarised in Table 4, while Figure 3 compares the selected appraisal metrics, and Figure 4 shows observed versus predicted load levels for the selected load components.
Figure 3.
Cross-source appraisal performance of selected load components. The heatmap summarises Spearman correlation, factor-of-two accuracy and MAE; these metrics have different meanings and scales and should be interpreted by column rather than compared as a common magnitude.
Figure 4.
Observed versus predicted selected drag and lift load components under source-grouped validation: (a) peak drag, (b) sustained drag and (c) peak lift. Blue circles represent individual out-of-fold samples; the black solid line denotes one-to-one agreement, and the grey dashed lines mark the factor-of-two envelope for engineering order-of-magnitude load-level appraisal.
The near-horizontal band around 300 in Figure 4c consists of the 71 samples from source 14 held out together in fold 3. Their Random Forest predictions occupied 33 values (maximum 317.4), and none was produced by inverse-transform clipping. The band reflects tree-leaf averaging for a held-out source whose observed peak lifts extended to 11,938, demonstrating failure to extrapolate that source’s upper tail rather than an imputed response value.
3.4. High-Severity Condition Identification and Category Performance
For route appraisal, continuous load evidence has to become a usable priority decision. Low, Moderate, High and Extreme classes indicate relative engineering priority within the compiled evidence base, not acceptance or rejection under a design code. A Low category may still require conventional checks if local seabed conditions, burial quality or third-party hazards are unfavourable.
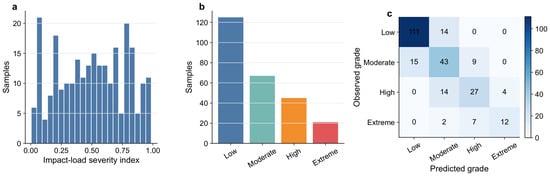
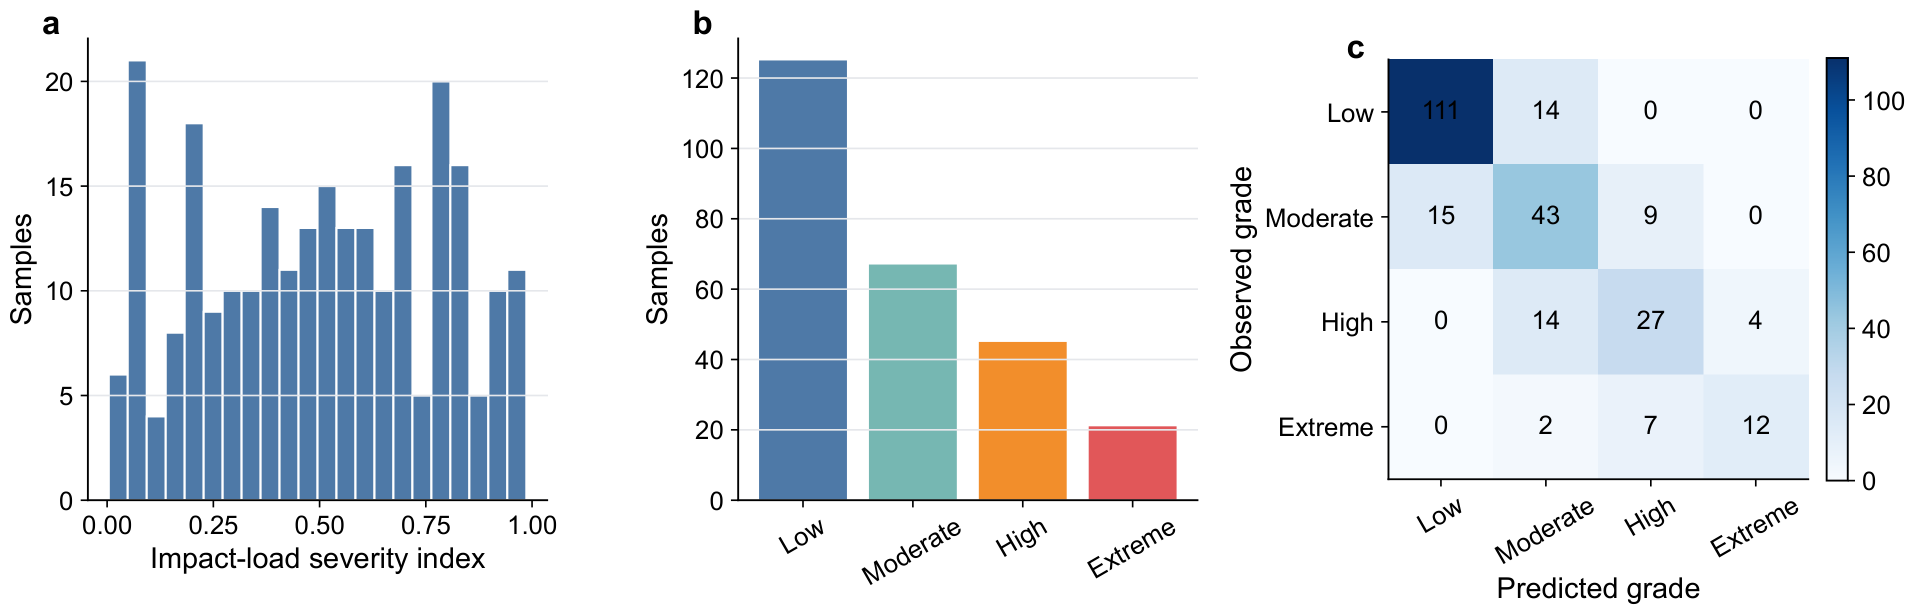
For comparing route segments and protection options, the four-category formulation provides a severity gradient. The peak-mean index gave an accuracy of 0.748, macro F1 of 0.690 and High/Extreme recall of 0.758 (Table 5). The conservative peak-maximum index gave an accuracy of 0.651, macro F1 of 0.597 and High/Extreme recall of 0.750. Moderate–High boundary cases are expected in a percentile-based appraisal because the categories represent a continuum of load severity, not discrete failure modes.
Table 5.
Impact-load severity index and load-severity category performance for peak-load appraisal, including complete four-category and binary metrics. The peak-mean index is the primary severity index, and the peak-maximum index provides a conservative sensitivity definition.
In many route studies, the practical question is whether a condition should be advanced to CFD, physical modelling or structural verification. For the primary peak-mean index, grouping Low and Moderate categories as lower-severity conditions and High and Extreme categories as high-severity conditions gave an accuracy of 0.903, precision of 0.847, recall of 0.758, F1 of 0.800, ROC-AUC of 0.947 and PR-AUC of 0.883. The corresponding confusion matrix contained 16 High/Extreme false negatives among 66 observed High/Extreme cases. In staged route appraisal, this binary output is therefore a prioritisation aid rather than a safety-screening rule.
Figure 5 also shows that high-severity misses remain possible. A missed High or Extreme case could delay detailed verification of a potentially severe load condition. For this reason, the load-severity categories should be used as prioritisation evidence within a staged workflow, not as acceptance criteria. Low or Moderate categories indicate lower relative priority within the compiled dataset; they do not prove that a cable section is safe.
Figure 5.
Load-severity category prediction and high-severity condition identification based on peak drag and peak lift: (a) impact-load index distribution, (b) Low–Extreme category counts and (c) observed versus predicted category confusion matrix.
3.5. Engineering Controls, Robustness and Response Maps
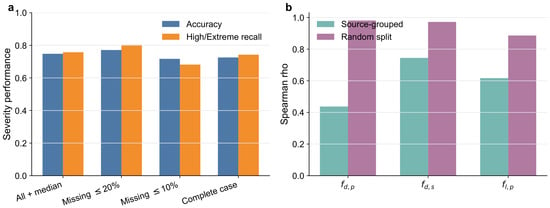
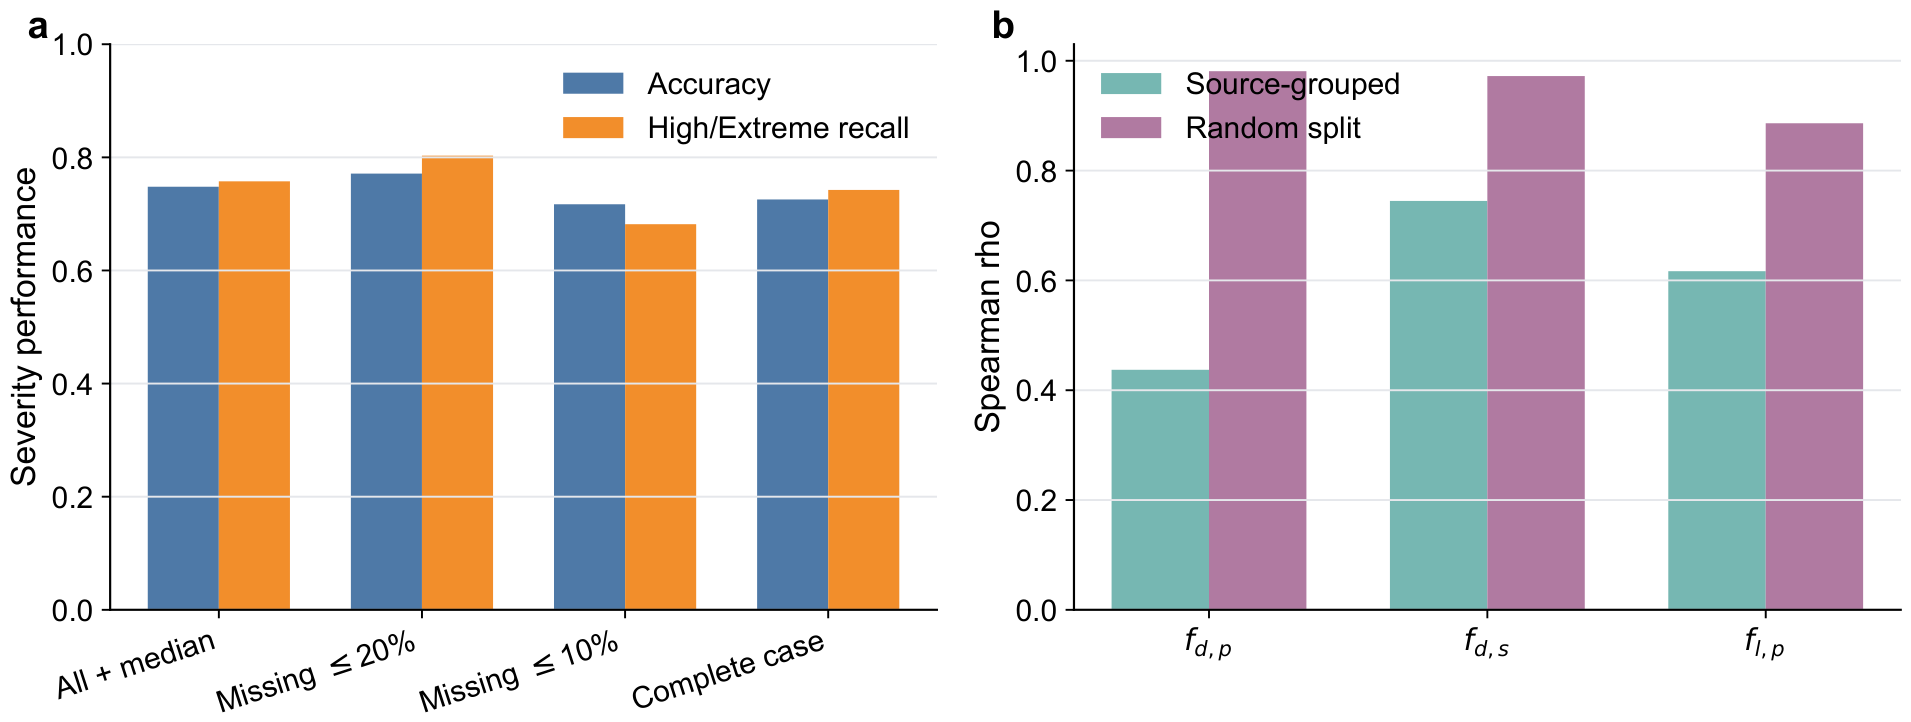
Missingness sensitivity did not indicate that the main category result was created by one imputation choice. Across the full 38-predictor setting, the 32-predictor (≤20% missing) and 23-predictor (≤10% missing) subsets, and 255 paired complete cases on the 32-predictor set, the four-category accuracy ranged from 0.717 to 0.771, macro F1 from 0.645 to 0.719 and High/Extreme recall from 0.682 to 0.803. Removing imputer-generated indicators also did not cause performance collapse (Figure 6). These variations show the useful persistence of the severity signal while ruling out claims of missingness invariance.
Figure 6.
Robustness checks for engineering load appraisal: (a) primary severity performance across full, low-missingness and complete-case predictor settings and (b) source-grouped validation versus random splitting.
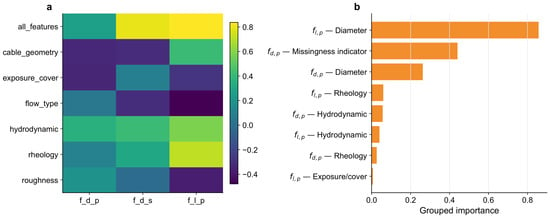
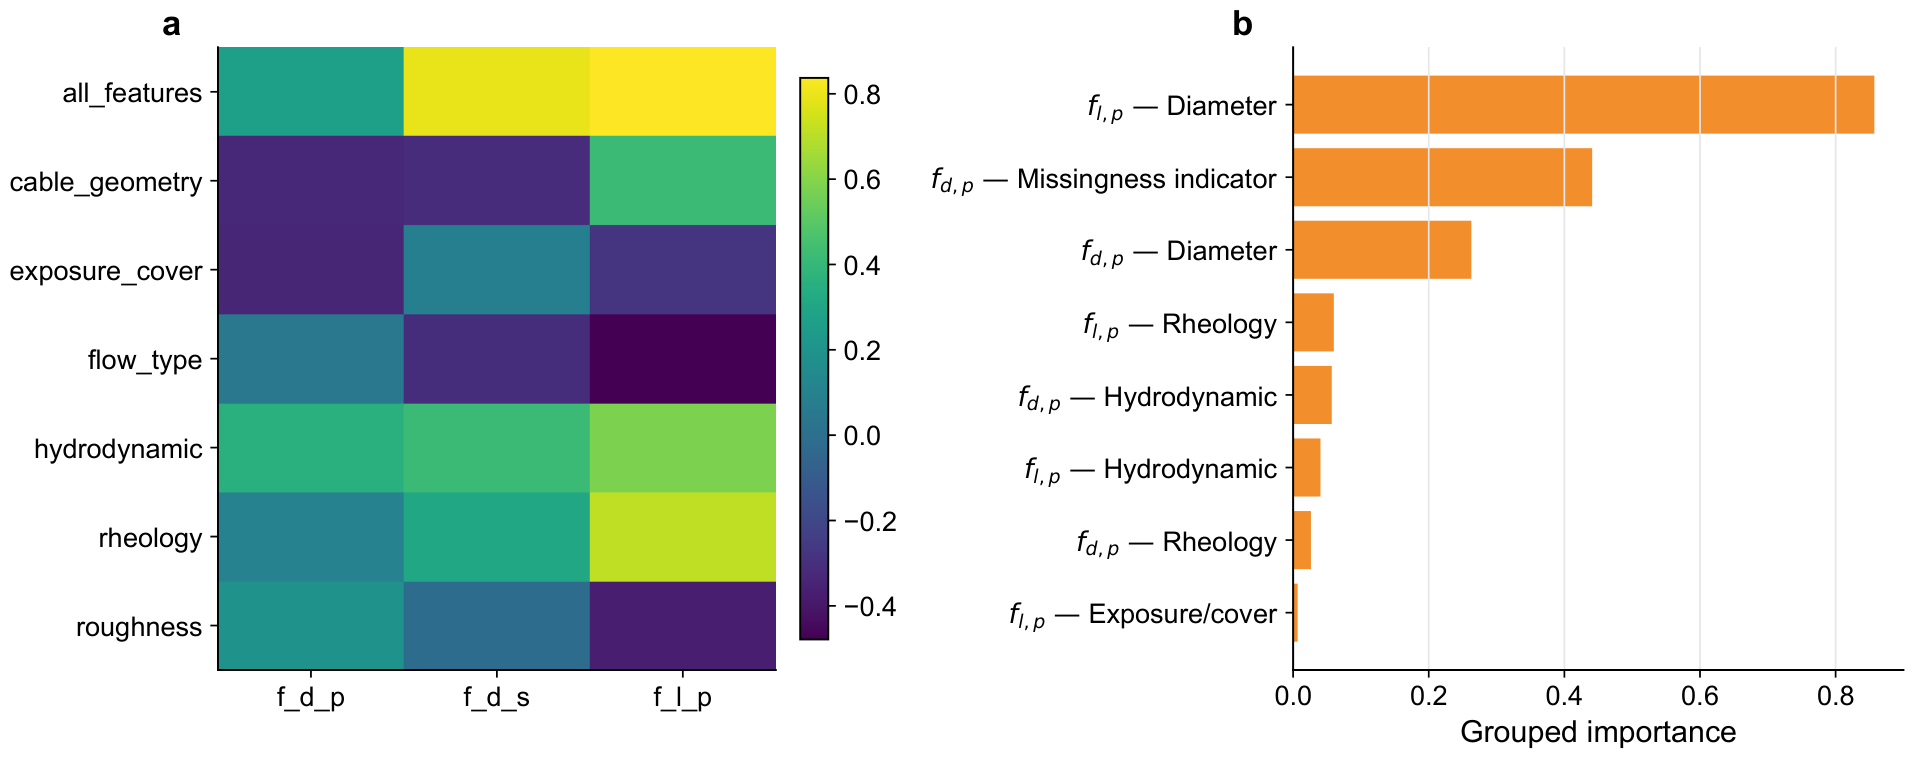
Feature-group ablation provides the main engineering interpretation (Figure 7). Relevant controls include hydrodynamic forcing, density contrast, cable diameter and projected loading scale, rheological behaviour, exposure and burial-cover condition, and roughness or local boundary condition. Grouping the variables in this way keeps the interpretation tied to offshore engineering quantities.
Figure 7.
Feature-group engineering interpretation: (a) source-grouped rank performance for selected engineering feature sets and (b) the eight largest grouped importance values for the two peak-load targets. Importance denotes association within the fitted ensembles, not a causal contribution.
For , the hydrodynamic group produced the strongest single-group performance, consistent with the role of impact velocity, density contrast and flow momentum in controlling peak horizontal force on an exposed or partly exposed cable. In route appraisal terms, sections crossing likely high-energy flow pathways or zones with high density contrast should receive earlier attention, even before detailed structural analysis is available.
For , the full-feature and no-missing-indicator feature sets gave a similar pooled rank performance. Nevertheless, the scenario diagnostic showed that the full-data upper-tail response was dominated by the diameter-related source structure. Feature importance is therefore treated as an association within the compiled evidence, not proof that a diameter-driven sustained-drag law transfers to new scenarios.
For , the full-feature and no-missing-indicator sets were strongest, while rheological variables also contributed. Peak lift depends on more than velocity alone. Mud-flow and debris-flow rheology can alter momentum transfer, pressure distribution and material interaction around the cable. Geometry and cover/exposure descriptors such as and influence whether upward force can act directly on the cable surface or is partly shielded by sediment or protection material.
For the primary equal-weight thresholds, the composite index achieved the metrics in Table 5. Across the nine weight–threshold combinations, the four-category accuracy ranged from 0.682 to 0.760 and High/Extreme recall from 0.489 to 0.849. Lower thresholds improved recall at the cost of category agreement, while upper thresholds produced more false negatives. Source-cluster bootstrap 95% intervals were wide: 0.577–0.945 for accuracy, 0.460–0.965 for macro F1, 0.471–1.000 for High/Extreme recall and 0.834–1.000 for ROC-AUC. Thus, equal weighting is a transparent primary convention supported by comparative performance, not a universal physical constant, and project use requires threshold recalibration.
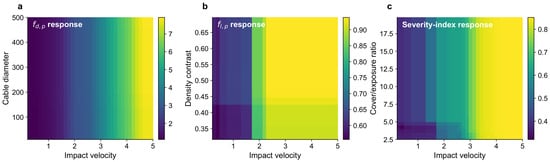
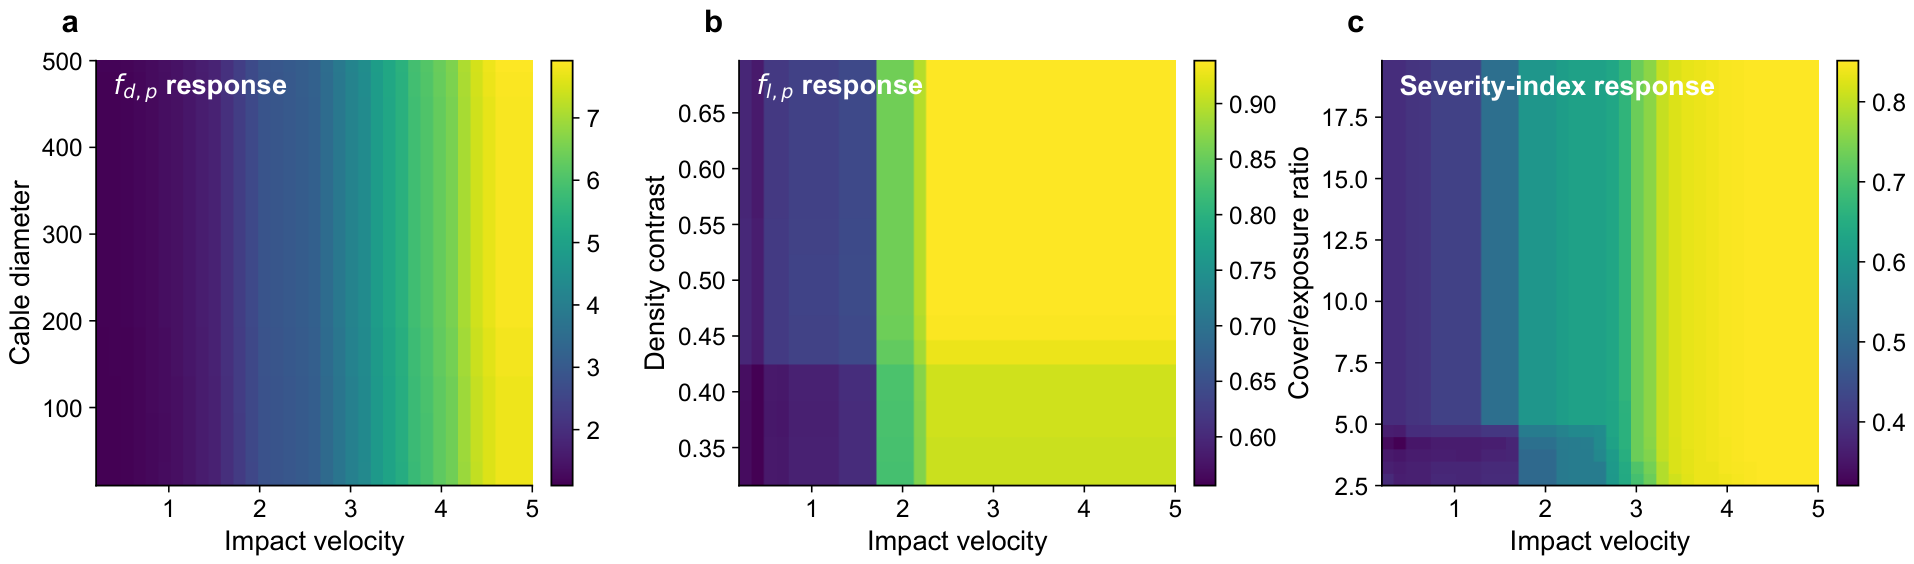
The conditional response maps (Figure 8) visualise fitted associations for selected pairs while other predictors remain fixed. Their patterns are physically interpretable in terms of momentum input, projected scale and exposure, and the tree ensembles can accommodate nonlinear combinations. However, neither a two-dimensional slice nor grouped importance decomposes all higher-order interactions or establishes a causal mechanism; the maps should be used to formulate cases for detailed analysis, not to select a design directly.
Figure 8.
Engineering response maps for peak drag, peak lift and composite severity index: (a) peak drag response versus impact velocity and cable diameter, (b) peak lift response versus impact velocity and density contrast, and (c) composite severity response versus impact velocity and cover/exposure ratio. The maps support route corridor assessment by showing how relative load severity varies with key engineering variables.
3.6. Scenario-Based Cable Route and Protection Appraisal
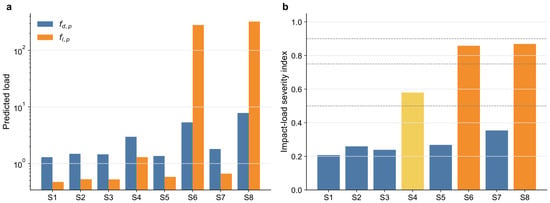
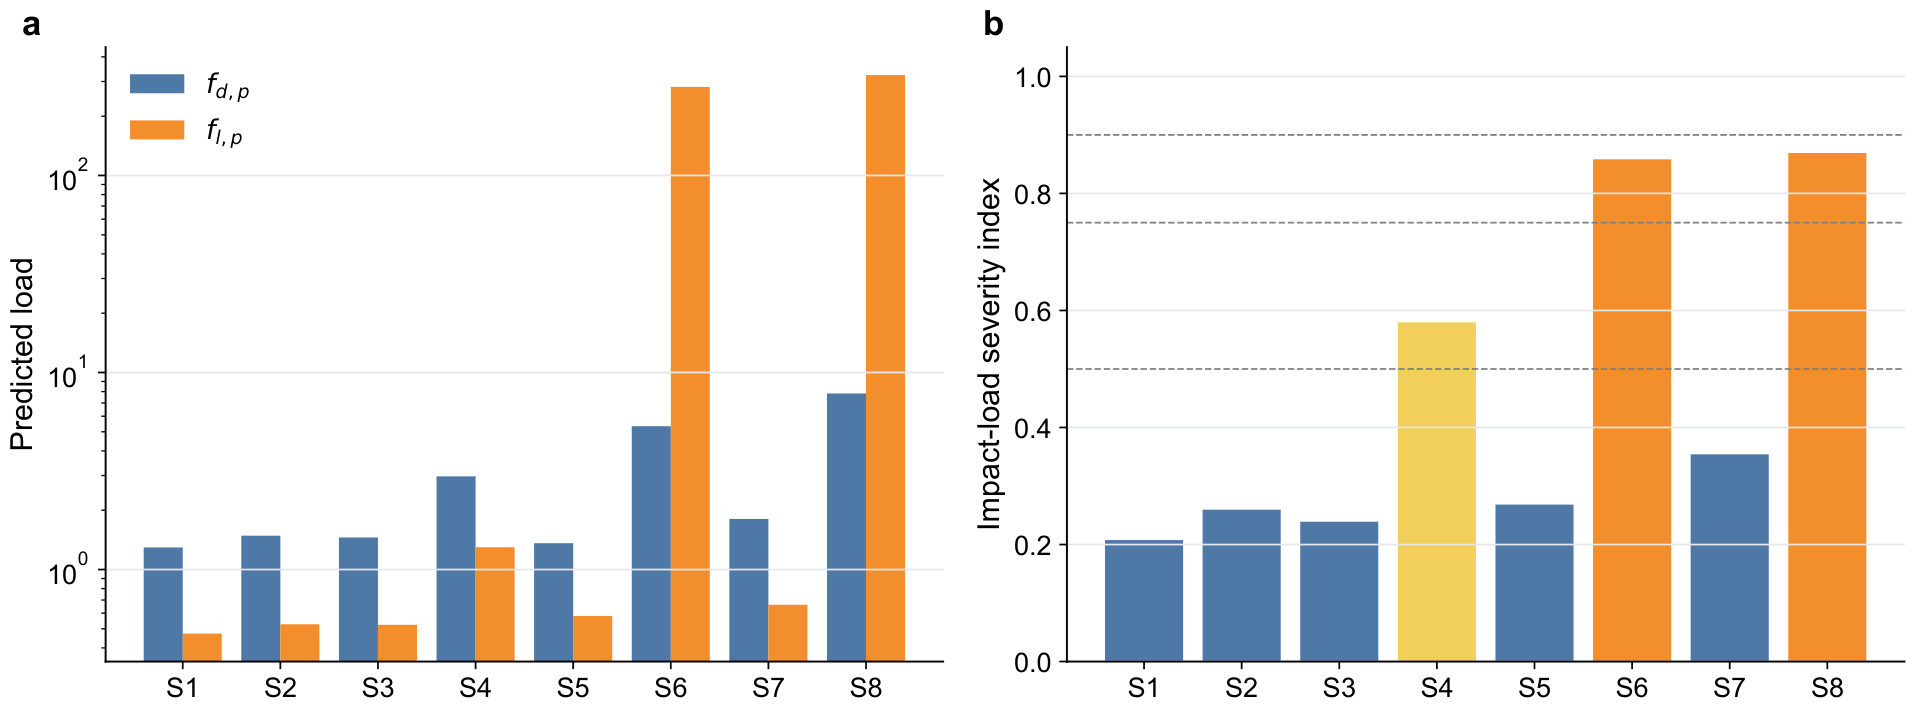
Eight quantile-based conditions illustrate how the validated peak-drag/peak-lift index can order cases for engineering review (Table 6 and Figure 9). The table reports only , and their primary peak-mean index. Sustained-drag scenario values were removed after the cross-source diagnostic described above. These fitted values are comparative outputs, not deterministic design loads.
Table 6.
Scenario-based offshore cable load-severity appraisal using only the two peak components in the validated primary index. Sustained-drag scenario predictions were excluded after a failed cross-source upper-tail diagnostic. Values are relative prioritisation outputs, not design loads.
Figure 9.
Scenario-based cable route appraisal and priority-condition identification: (a) predicted peak drag and peak lift loads and (b) impact-load severity index and load-severity category. High-severity scenarios should be advanced to detailed engineering assessment; Low and Moderate scenarios indicate lower relative priority within the compiled dataset.
Scenarios S1–S3 were classified as Low. Relative to the compiled dataset, these cases represent lower-energy or more typical flow–cable combinations and would generally receive lower immediate priority in first-pass route appraisal. Low severity does not mean safe. Within the available load evidence, these scenarios are less urgent than the higher-severity cases; conventional geotechnical investigation, burial assessment and design checks remain necessary.
S4 was Moderate under the corrected primary peak-mean index (). It illustrates an elevated dense-flow condition that remains below the High threshold and may be retained for sensitivity analysis when independent geohazard evidence warrants it.
S6 was High () because the specified combination produced high relative peak drag and peak lift. This condition should be advanced to CFD, physical modelling or structural verification; the screening result itself cannot justify route acceptance or a protection design.
S8 was High () and near the applicability boundary. Its velocity, density contrast, diameter and exposure ratio were outside the P5–P95 intervals, although inside P1–P99 and min–max bounds. It therefore flags an upper-tail combination for special review rather than supplying a reliable point load.
Taken together, the scenarios show how the composite severity index can translate load evidence into route corridor and protection-priority decisions. High-severity scenarios identify conditions that should advance to detailed engineering assessment. Low and Moderate categories indicate lower relative priority within the available dataset and should be interpreted together with site investigation, design checks and engineering judgement.
4. Discussion
4.1. Engineering Need for Rapid Load Appraisal in Offshore Wind Cable Corridors
Offshore wind cable corridors may extend across large areas with strongly variable seabed conditions, sediment mobility, burial feasibility and geohazard exposure. Within a single project, route sections can differ in slope setting, shallow stratigraphy, potential slide sources, expected density-flow pathways and cable exposure state. Treating all route segments as equally critical is inefficient, but overlooking plausible high-consequence flow events can leave important vulnerabilities unresolved.
Submarine landslide and density-flow hazards are also spatially uneven. Some route sections may cross low-gradient stable seabed, while others may intersect slope breaks, channels, depositional lobes or areas where future sediment remobilisation is plausible. Route corridor assessment needs a way to connect the geohazard interpretation with the mechanical load severity. Without an intermediate load-severity appraisal, engineering teams may over-investigate many low-priority segments or miss a small number of severe flow–cable combinations.
Detailed CFD simulations and physical model tests remain standard for final verification, but they are not practical for every candidate route segment, burial configuration and submarine gravity-flow scenario. Between corridor-scale geohazard appraisal and final design, the workflow occupies an intermediate layer. It converts multi-source load evidence into load-severity priorities and helps identify where detailed engineering resources should be focused.
Site investigation and final design remain essential. The value of the workflow lies in reducing a large set of possible flow–cable conditions to a smaller set of priority cases. In offshore wind development, that reduction can support route-corridor comparison, prioritisation of burial-depth assessment and early allocation of modelling or testing resources.
The ensemble models also provided a clear gain over the mean baseline in order-of-magnitude agreement. For the selected , , and configurations, the factor-of-two accuracy was 0.728, 0.783, 0.651 and 0.638, respectively, compared with 0.439, 0.524, 0.089 and 0.138 for the corresponding transformed mean baselines. Ridge was retained as a linear reference, but it either ranked below the selected ensemble or failed the catastrophic-prediction filter. This gain supports nonlinear ranking and screening, while the remaining errors preclude use as a deterministic design-load calculator.
4.2. Drag and Lift Components as Indicators of Cable Impact Response
Drag and lift components represent different engineering aspects of cable response. Along-flow impact, lateral displacement tendency and disturbance of cable protection layers are mainly drag-related. A high drag event can load the cable and disturb rock cover, mattresses or local seabed material that provides restraint. Lift contributes to uplift, exposure, local loss of embedment, free-span development and possible local instability. Together, the two components describe complementary damage pathways.
Drag-dominated cases are closely related to lateral restraint, protection-layer stability and possible cable displacement along the seabed. Lift-dominated cases are more relevant to embedment loss, exposure, free-span formation and local uplift instability. A route segment that is acceptable for one component may still be problematic for the other, which supports the use of a combined peak-load severity index.
Peak and sustained loads describe different interaction stages. The sustained-drag ranks transferred more consistently than the peak-drag ranks on average, but the upper-tail diagnostic exposed both severe held-out-source underprediction and a non-transferable full-data scenario response. Sustained lift was still less reliable. Accordingly, neither sustained component is used for scenario point appraisal; and define the index because they represent the two peak modes relevant to lateral impact and uplift/exposure screening.
Within this interpretation, remains auxiliary. Sustained lift is a meaningful physical quantity, but the current multi-source evidence does not make it a strong basis for the main severity appraisal. Keeping it as a supporting target avoids forcing an unstable component into the engineering priority indicator while still acknowledging the potential importance of lift during longer flow stages.
4.3. From Load Prediction to Load-Severity Prioritisation
The exact regression of submarine gravity-flow impact loads is difficult in a multi-source setting. Differences in test configuration, numerical formulation, flow type, target definition, cable exposure and source-data completeness all contribute to scatter. Transient peak-load components are especially sensitive to local boundary conditions and upper-tail sampling. Although these limitations constrain deterministic load specification, rank-order and order-of-magnitude information still have value for early-stage route appraisal.
At the route level, practical decisions concern whether a condition lies in the upper part of the load distribution, whether its predicted load has the right order of magnitude, and whether it should be escalated for detailed verification. Spearman correlation, factor-of-two accuracy and high-severity condition identification provide meaningful evidence for prioritisation. They are more aligned with preliminary route decisions than a single variance-based regression score.
The equal-weight peak-mean index makes the trade-off between lateral impact and uplift explicit, whereas the peak-maximum index flags a case dominated by either component. The weight–threshold sensitivity showed that High/Extreme recall varied from 0.489 to 0.849, and source-cluster intervals were wide. These results favour site-specific calibration and conservative escalation near a boundary. The 16 primary-index false negatives prohibit using a Low or Moderate output to exclude a segment from further assessment.
4.4. Engineering Controls Inferred from Feature Groups and Response Maps
Feature-group and response-map results point to engineering controls rather than abstract feature-importance rankings. Hydrodynamic forcing and density contrast govern the momentum available for impact. The cable diameter controls the projected area and the scale of actual force. Rheological variables influence how mud-flow or debris-flow material transfers momentum and pressure to the cable. Exposure and cover descriptors, including -type variables and , indicate whether the cable is shielded, partly buried or directly exposed to uplift and lateral loading.
The response maps are consistent with plausible momentum, projected-scale and exposure mechanisms, but they remain conditional model slices. Correlated inputs, uneven source coverage and unmeasured configuration differences provide alternative explanations for some patterns. Their proper use is to define hypotheses and candidate cases for site-specific modelling, not to infer a universal response law.
Hydrodynamic forcing, density contrast, cable scale and exposure state connect directly to practical route and protection considerations. High expected velocity or density contrast may motivate route avoidance or closer geohazard review. Larger exposed diameters or unfavourable cover/exposure ratios may identify conditions for which burial depth, protection or span-control measures warrant detailed project-specific evaluation. Rheology-sensitive responses indicate that mud-flow and debris-flow scenarios should not be reduced to water-flow analogues without caution. Roughness and boundary-condition descriptors remain relevant because local cable–seabed interaction can alter force transfer near the bed.
Engineering interpretation should focus on hydrodynamic forcing, density contrast, cable scale, rheology and exposure/cover state.
4.5. Applicability, Limitations and Appropriate Use
Appropriate uses of the workflow include route corridor comparison, protection-priority ranking, high-severity condition identification and selection of cases for CFD, physical modelling or structural checks. Project-specific verification still requires design scenarios, reliability settings, partial factors, site parameters and structural acceptance criteria. The compiled dataset used here does not contain the full project-level information needed for a formal code-based comparison.
The applicable standards occupy a different layer from the proposed index. DNV-ST-0359 specifies requirements for subsea power cable systems in offshore wind plants, DNV-RP-0360 gives lifecycle guidance for static subsea cables in shallow water, and DNV-RP-F109 addresses lateral and vertical on-bottom stability under hydrodynamic loading [27,28,29]. None of these documents defines the dataset-percentile landslide-impact categories used here. Consequently, the predicted category is neither a code check, an allowable load, a partial-factor result nor evidence of compliance; it only selects conditions that require project-specific load definition and code-based structural verification.
Treating submarine landslides, mud flows, debris flows and turbidity currents in one workflow does not assume identical mechanics. The load-severity assessment uses reported descriptors such as the flow type, velocity, density contrast, rheology, cable geometry and exposure/cover state, which is appropriate for a compiled multi-process dataset. If more balanced process-specific data become available, separate calibration or process-specific submodels may be preferable.
The categories are dataset-relative mechanical load-severity classes, not geotechnical risk classes. They omit landslide occurrence, vulnerability and consequence; their thresholds and percentile ranks may change when the database changes. Uneven source/flow coverage, incomplete predictors, inaccurate transient peak loads, wide source-cluster intervals, 16 High/Extreme misses, unstable sustained lift and non-transferable sustained-drag scenario extrapolation all restrict use. Missingness sensitivity and applicability flags make these restrictions visible but do not remove them. Near-boundary cases require escalation, and Low or Moderate is never a safety proof.
No project-level field dataset was available for external validation. The source-grouped results therefore demonstrate only cross-study internal transfer within the compiled evidence base. A new source, process regime or offshore project may change the percentile boundaries and error distribution; independent project validation and recalibration are required before operational deployment.
5. Conclusions
Offshore wind cable routes exposed to submarine landslide flows and related density-flow processes require early judgement about load severity. The workflow developed here uses actual drag and lift load evidence from a compiled multi-source dataset, with leakage-controlled feature construction and source-grouped validation. Its role is to support preliminary route and protection appraisal before detailed project-specific verification.
Source-grouped validation showed useful but uneven rank and order-of-magnitude skill for individual loads. The corrected equal-weight peak-mean index gave four-category accuracy 0.748 and binary High/Extreme accuracy 0.903, outperforming the peak-maximum definition on the reported category metrics. The maximum definition remains a conservative component-dominance check. Neither index supplies a design force or an acceptance decision.
Feature groups and conditional scenarios show associations with hydrodynamic forcing, geometry, rheology and exposure/cover state. High-severity combinations can be selected for CFD, physical modelling and structural checks, but route, burial and protection decisions must be made from those project-specific analyses rather than from this index alone.
Future work should test an untouched offshore-project dataset, develop process-specific models from more balanced data, estimate prediction intervals for peak loads, recalibrate weights and thresholds to project loss functions, and couple conditional load severity with occurrence probability, structural vulnerability and consequence. Until then, the method is limited to early relative prioritisation and selection of verification cases.
Author Contributions
Conceptualization, Y.B. and J.L.; methodology, Y.B. and J.L.; software, Y.B.; validation, Y.B., L.H. and C.C.; formal analysis, Y.B. and J.L.; investigation, L.H., C.C., S.B. and X.H.; resources, J.L., C.C. and S.B.; data curation, Y.B. and X.H.; writing—original draft preparation, Y.B.; writing—review and editing, J.L., L.H., C.C., S.B. and X.H.; visualization, Y.B.; supervision, J.L.; project administration, J.L. and C.C.; funding acquisition, J.L. All authors have read and agreed to the published version of the manuscript.
Funding
This research was funded by the Key Research and Development Program of Shanxi Province under contract No. 2025SF-YBXM-278.
Data Availability Statement
The source dataset analysed in this study is publicly available from Liu et al. [21] at https://doi.org/10.1038/s41597-026-06629-1.
Acknowledgments
The authors acknowledge the open-source scientific Python ecosystem used for data processing, model training and figure generation.
Conflicts of Interest
Yu Bai was employed by PowerChina Northwest Engineering Corporation Limited, and Longzhi Han was employed by Qingdao Institute of Marine Engineering Survey and Design Co., Ltd. The remaining authors declare that the research was conducted in the absence of any commercial or financial relationships that could be construed as a potential conflict of interest.
Abbreviations
The following abbreviations are used in this manuscript:
| CFD | Computational fluid dynamics |
| F1 | Harmonic mean of precision and recall |
| MAE | Mean absolute error |
| PR-AUC | Area under the precision–recall curve |
| ROC-AUC | Area under the receiver operating characteristic curve |
References
- Gulski, E.; Anders, G.J.; Jongen, R.A.; Parciak, J.; Siemiński, M.; Piesowicz, E.; Paszkiewicz, S.; Irska, I. Discussion of electrical and thermal aspects of offshore wind farms’ power cables reliability. Renew. Sustain. Energy Rev. 2021, 151, 111580. [Google Scholar] [CrossRef] [Scilit]
- Yoneya, K. Technological trend of submarine power cable system for floating offshore wind. IEEJ Trans. Power Energy 2021, 141, 402–405. [Google Scholar] [CrossRef] [Scilit]
- Ahmad, S.; Thies, P.R.; Recker, N.; Dawood, T. Failure mechanisms and reliability factors for submarine cable failures. In Innovations in Renewable Energies Offshore; CRC Press: Boca Raton, FL, USA, 2024; pp. 1025–1035. [Google Scholar] [CrossRef] [Scilit]
- Yoon, H.S.; Na, W.B. Safety assessment of submarine power cable protectors by anchor dragging field tests. Ocean Eng. 2013, 65, 1–9. [Google Scholar] [CrossRef] [Scilit]
- Doan, D.H.; Puech, A.; Savadogo, D.; MacNay, J. Risk based approach for offshore cable burial depth assessment. In Offshore Site Investigation Geotechnics 8th International Conference Proceedings; Society for Underwater Technology: London, UK, 2017; pp. 889–895. [Google Scholar] [CrossRef] [Scilit]
- Song, C.-Y. Fluid–structure interaction analysis and verification test for soil penetration to determine the burial depth of subsea HVDC cable. J. Mar. Sci. Eng. 2022, 10, 1453. [Google Scholar] [CrossRef] [Scilit]
- Yu, Z.; Jin, Z.; Wang, K.; Zhang, C.; Chen, J. Design and study of mechanical cutting mechanism for submarine cable burial machine. J. Mar. Sci. Eng. 2023, 11, 2371. [Google Scholar] [CrossRef] [Scilit]
- Huang, J.; Zhang, Q.; Xu, C.; Li, F.; Tian, Z.; Fang, H.; Zheng, X.; Zhang, Y. Risk identification and safety evaluation of offshore wind power submarine cable construction. J. Mar. Sci. Eng. 2024, 12, 1718. [Google Scholar] [CrossRef] [Scilit]
- Chtouris, N.-K.; Hasiotis, T. Marine geotechnical research in Greece: A review of the current knowledge, challenges and prospects. J. Mar. Sci. Eng. 2024, 12, 1708. [Google Scholar] [CrossRef] [Scilit]
- Walsh, K.; Holloway, P.; Lim, A. Optimising submarine cable routes from offshore wind farms. J. Ocean Eng. Mar. Energy 2026, 12, 971–993. [Google Scholar] [CrossRef] [Scilit]
- Zakeri, A.; Høeg, K.; Nadim, F. Submarine debris flow impact on pipelines—Part I: Experimental investigation. Coast. Eng. 2008, 55, 1209–1218. [Google Scholar] [CrossRef] [Scilit]
- Zakeri, A.; Høeg, K.; Nadim, F. Submarine debris flow impact on pipelines—Part II: Numerical analysis. Coast. Eng. 2009, 56, 1–10. [Google Scholar] [CrossRef] [Scilit]
- Liu, J.; Tian, J.; Yi, P. Impact forces of submarine landslides on offshore pipelines. Ocean Eng. 2015, 95, 116–127. [Google Scholar] [CrossRef] [Scilit]
- Dong, Y.; Wang, D.; Randolph, M.F. Investigation of impact forces on pipeline by submarine landslide using material point method. Ocean Eng. 2017, 146, 21–28. [Google Scholar] [CrossRef] [Scilit]
- Dutta, S.; Hawlader, B. Pipeline–soil–water interaction modelling for submarine landslide impact on suspended offshore pipelines. Géotechnique 2019, 69, 29–41. [Google Scholar] [CrossRef] [Scilit]
- Sahdi, F.; Gaudin, C.; Tom, J.; Tong, F. Mechanisms of soil flow during submarine slide-pipe impact. Ocean Eng. 2019, 186, 106079. [Google Scholar] [CrossRef] [Scilit]
- Guo, X.-S.; Nian, T.-K.; Fan, N.; Jia, Y.-G. Optimization design of a honeycomb-hole submarine pipeline under a hydrodynamic landslide impact. Mar. Georesour. Geotechnol. 2021, 39, 1055–1070. [Google Scholar] [CrossRef] [Scilit]
- Guo, X.; Liu, X.; Zhang, J.; Jing, S.; Hou, L. Impact of high-speed turbidity currents on offshore spanning pipelines. Ocean Eng. 2023, 287, 115797. [Google Scholar] [CrossRef] [Scilit]
- He, Y.; Okon, E.U.; Hu, Z.; Zhang, J.; Ewa-Oboho, I.; Li, H. Submarine gravity flows and their interaction with offshore pipelines: A review of recent advances. Eng. Geol. 2025, 347, 107914. [Google Scholar] [CrossRef] [Scilit]
- Zhang, Q.; Tang, G.; Zhang, Z.; Ren, H.; Zhang, H.; Wu, K. A state-of-the-art review of the hydrodynamics of offshore pipelines under submarine gravity flows and their interactions. J. Mar. Sci. Eng. 2025, 13, 1654. [Google Scholar] [CrossRef] [Scilit]
- Liu, X.; Wei, X.; Meng, Q.; Xie, X.; Chen, Y.; Guo, X. A global dataset of impact forces from submarine landslides on pipelines and cables. Sci. Data 2026, 13, 285. [Google Scholar] [CrossRef] [Scilit] [PubMed]
- Li, Z.; Nishio, M.; Sugawara, D.; Iwanaga, T.; Chun, P. Surrogate model development for slope stability analysis using machine learning. Sustainability 2023, 15, 10793. [Google Scholar] [CrossRef] [Scilit]
- Gao, W. The application of machine learning in geotechnical engineering. Appl. Sci. 2024, 14, 4712. [Google Scholar] [CrossRef] [Scilit]
- Gao, Y.; Cheng, X.; Song, Z.; Yin, Z.; Chen, W. Machine learning-driven surrogate model development for geotechnical numerical simulation. Geotech. Res. 2025, 12, 71–84. [Google Scholar] [CrossRef] [Scilit]
- Yuan, H.; Choo, J.; Yeo, C.H.; Wang, S.; Yang, C.; Guan, K.; Suryasentana, S.K.; Choo, H. Physics-informed machine learning in geotechnical engineering: A direction paper. Geomech. Geoeng. 2025, 20, 1128–1159. [Google Scholar] [CrossRef] [Scilit]
- Yang, C.; Zhang, Q.; Diao, M.; Yang, G.; Liu, H.; Guo, Y.; Cong, L.; Chen, Y.; Li, J.; Tang, W.; et al. Global and regional soil salinization drives bacterial diversity loss and biogeochemical imbalance. Commun. Earth Environ. 2026, 7, 486. [Google Scholar] [CrossRef] [Scilit]
- DNV-ST-0359; Subsea Power Cables for Wind Power Plants; Edition 2025-12. DNV: Høvik, Norway, 2025. Available online: https://www.dnv.com/energy/standards-guidelines/dnv-st-0359-subsea-power-cables-for-wind-power-plants/ (accessed on 25 August 2026).
- DNV-RP-0360; Subsea Power Cables in Shallow Water; Edition 2016-03, Amended 2021-10. DNV: Høvik, Norway, 2021. Available online: https://www.dnv.com/energy/standards-guidelines/dnv-rp-0360-subsea-power-cables-in-shallow-water/ (accessed on 25 August 2026).
- DNV-RP-F109; On-Bottom Stability Design of Submarine Pipelines, Cables and Umbilicals; Edition 2021-05, Amended 2025-09. DNV: Høvik, Norway, 2025. Available online: https://www.dnv.com/energy/standards-guidelines/dnv-rp-f109-on-bottom-stability-design-of-submarine-pipelines/ (accessed on 25 August 2026).

Disclaimer/Publisher’s Note: The statements, opinions and data contained in all publications are solely those of the individual author(s) and contributor(s) and not of MDPI and/or the editor(s). MDPI and/or the editor(s) disclaim responsibility for any injury to people or property resulting from any ideas, methods, instructions or products referred to in the content. |
© 2026 by the authors. Licensee MDPI, Basel, Switzerland. This article is an open access article distributed under the terms and conditions of the Creative Commons Attribution (CC BY) license.