


Abstract
Severe winter nutritional deficiencies may impair reproductive performance in Mongolian mares, yet optimal protein requirements during late gestation remain undefined. This study aimed to determine the effects of varying protein levels in complementary feed on gestational performance, physiology, and gut health. Seventeen late-gestating mares were assigned to three isocaloric diets differing in crude protein (CP)—high (HCP, 13.25%), medium (MCP, 12.04%), and low (LCP, 10.85%)—for 40 days. Statistical analysis was conducted using one-way ANOVA followed by Tukey’s HSD post hoc test. Mares fed the MCP diet tended to show more favorable growth performance and nutrient digestibility relative to the HCP group (p < 0.05). Blood analysis suggested that MCP mares had comparatively lower serum creatinine and creatine kinase concentrations, along with higher antioxidant capacity (catalase) and interleukin-1β levels (p < 0.001). Fecal microbiota sequencing showed that MCP was associated with comparatively higher microbial diversity, while HCP was characterized by enrichment of Proteobacteria, and LCP by enrichment of Bacteroidetes. Metabolomics identified 533 differential metabolites linked to protein metabolism. The MCP diet may help balance immune function, antioxidant status, and microbial homeostasis. These findings suggest that a complementary feed containing 12.04% CP may be associated with favorable effects on maternal health-related indicators in late-gestating Mongolian mares during winter.
1. Introduction
Horses remain vital to the global animal husbandry industry, particularly in recreational riding, sports, and cultural production. In many regions, horses are a cornerstone of the local animal husbandry economy, primarily raised for meat production, milk, and cultural tourism. However, the industry faces a critical challenge: maintaining reproductive efficiency under the harsh environmental conditions of winter and early spring. During late gestation, livestock face a major constraint as the scarcity of high-quality forage, coupled with extreme cold, results in pronounced nutritional deficiencies [1]. These deficiencies may directly compromise mare body condition, fetal development, and foal survival rates, threatening the sustainability of the industry [2]. In contrast to the highly managed breeding programs for Thoroughbreds or Warmbloods in developed regions—where intensive feeding strategies aim to maximize athletic performance—Mongolian horse breeding is conducted under low-input, extensive management systems. Consequently, there is an urgent need to establish cost-effective nutritional strategies that enhance reproductive performance without relying on intensive management.
Protein is a fundamental nutrient required to support rapid fetal growth and maternal metabolic demands during late gestation [3]. While adequate protein intake influences blood physiology and microbial diversity [4], the precise nutritional requirements of indigenous breeds, such as the Mongolian horse, remain poorly defined under extensive management systems. To the best of our knowledge, no equine breed-specific protein guidelines exist that consider the unique metabolic adaptations of indigenous horses grazing under cold-climate conditions. Unlike ruminants, which are often supplemented primarily to maximize economic return on investment (e.g., weight gain or milk yield), equine operations in this region prioritize the health and longevity of the offspring and the survival of the mare. However, horses managed under grazing systems are rarely supplemented, which exacerbates the risks of weight loss, immunosuppression, and increased foal mortality [5,6].
During late gestation, mares exhibit a marked increase in protein demand to support rapid fetal development, with essential amino acids that are preferentially utilized for fetal tissue synthesis and protein utilization efficiency closely linked to dietary amino acid balance and mineral coordination. Based on these physiological characteristics, we established the following neutral, testable hypothesis: Improper protein supplementation—whether deficient or excessive—negatively affects both mares and their offspring. Specifically, protein deficiency may lead to maternal malnutrition and impaired fetal development, whereas excess protein may increase metabolic load, alter gut microbiota balance, and compromise overall health.
To test this hypothesis and address the knowledge gap regarding optimal protein levels in extensive systems, this study was conducted on late-gestation Mongolian mares. Notably, this study represents one of the first attempts to comprehensively analyze the effects of complementary feed with varying protein levels on zootechnical performance, serum biochemical indices, fecal microbiota, and fecal metabolites in an integrated multi-omics framework for indigenous Mongolian mares under extensive cold-climate management. The findings are expected to help establish a scientific foundation for optimizing feeding strategies, improving reproductive efficiency, and promoting the sustainable development of the horse industry in cold-climate regions.
2. Materials and Methods
2.1. Ethics Statement
The Laboratory Animal Welfare and Ethics Committee of Inner Mongolia Agricultural University (No. NND2024009) approved all sampling procedures, which also adhered to regulatory standards.
2.2. Animals and Experimental Design
The experiment was conducted at the White Horse Base in Xiwuzhumuqin Banner, Xilingol League, Inner Mongolia Autonomous Region from November 2023 to March 2024. A total of 17 late-gestation Mongolian mares (280–320 days of gestation; 320 days of gestation was defined as the pre-foaling stage immediately prior to parturition) were selected. Mares were aged 12–16 years with 5–8 parities and similar body weights (250 ± 25 kg). Mares were randomly divided into three groups using a random number table: 6 animals in the Low-Crude-Protein (LCP) group, 6 in the Medium-Crude-Protein (MCP) group, and 5 in the High-Crude-Protein (HCP) group.
During blood sample processing, one blood sample from the MCP group was contaminated, which only affected the detection of blood-derived indicators (serum biochemical indices, reproductive hormones, immune indicators, and antioxidant indices). Therefore, the effective sample sizes for blood-derived indicators were n = 6 (LCP), n = 5 (MCP), and n = 5 (HCP); for non-blood indicators (weight gain, apparent nutrient digestibility, fecal microbial community and metabolites), the original sample sizes were maintained at n = 6 (LCP), n = 6 (MCP), and n = 5 (HCP).
2.3. Feeding Management and Treatments
The study was conducted during the winter–spring transition, characterized by low temperatures (−20 °C to 5 °C), and withered forage was directly provided to the animals without further conservation treatment such as silage or haylage. Mares had free access to water. The basal diet consisted of native grass hay provided at 9:00 a.m. and 4:00 p.m. for ad libitum intake. This hay was harvested in late autumn and stored for winter feeding, reflecting the typical extensive management in Inner Mongolia. The nutritional composition of the native grass hay is shown in Table 1.
Table 1.
Nutritional composition of native grass hay (dry matter basis, %).
The complementary feed (concentrate) was formulated to provide varying protein levels based on the NRC (2007) requirements for late-gestation mares under extensive conditions [8]. Given that the basal native grass hay contained 12.75% crude protein (Table 1), and considering the extensive feeding pattern in Inner Mongolia, total dietary crude protein intake was determined by the combined contribution of forage and complementary feed. Three isoenergetic diets were formulated with equal energy levels but varying crude protein contents: High Crude Protein (13.25%, HCP), Medium Crude Protein (12.04%, MCP), and Low Crude Protein (10.85%, LCP). This narrow protein gradient was designed to simulate subtle, practical variations in on-farm feeding, rather than extreme artificial levels. These protein levels were selected to bracket the NRC (2007) recommendation of 10–12% CP for maintenance and late gestation, and when combined with the basal forage, the total CP supply of LCP fell below the actual metabolic demand of late-gestating Mongolian mares (deficient), MCP closely matched physiological requirements (adequate), and HCP exceeded the efficient metabolic capacity of the animals under local extensive management (excessive) [7,8]. The complementary feed was administered once daily at 7:00 a.m. at 0.75% of body weight (dry matter basis). This once-daily regimen was chosen to mimic the nomadic management practices of the region, where labor constraints limit multiple feedings, despite horses being evolutionary trickle feeders. The ingredient composition of the complementary feed varied in protein sources: corn accounted for 73.20% in the LCP group, 71.4% in the MCP group, and 69.1% in the HCP group, serving as an energy source yet deficient in lysine, a limiting amino acid for horses. Soybean meal was included at 4.5% in LCP, 7.6% in MCP, and 10.7% in HCP as a high-quality protein supplement abundant in lysine and threonine to offset the amino acid deficiency of corn. Synthetic lysine was added at 1.0% in all groups to guarantee sufficient lysine supply, especially for the LCP group. Notably, the values of 13.25%, 12.04%, and 10.85% represent the total crude protein content of the overall experimental diets for the HCP, MCP, and LCP groups, respectively. These three graded crude protein levels were formulated in accordance with the nutritional requirements of late-gestation mares and the experimental objective of investigating the effects of different protein supply levels on physiological indicators. The ingredient composition and nutrient levels of the concentrate supplements for late-gestation mares are presented in Table 2.
Table 2.
Composition and nutrient levels of concentrate supplement for mares during late gestation (dry matter basis, %).
2.4. Determination of Apparent Nutrient Digestibility
Gestational weight gain was evaluated by recording body weights at initiation and conclusion. Due to logistical constraints inherent to the extensive grazing system, forage sampling was limited to a single collection at the beginning of the trial (a 500 g random sample, subsequently dried and ground). This limitation is acknowledged and should be considered when interpreting the digestibility results. Apparent nutrient digestibility was assessed over the final 3 consecutive days of the 40-day feeding period; this 3-day total fecal collection protocol is a widely accepted standard in equine field nutrition studies, minimizes disturbance and physiological stress to experimental animals, and reliably reflects digestive physiological status following a 37-day dietary adaptation period. Feed intake was quantified using a standard difference method. Specifically, the amount of hay offered was accurately weighed, and refusals (orts) were collected and weighed the following morning prior to the subsequent feeding. Hay intake was then calculated as the difference between the quantity offered and the refusals. Acid-insoluble ash (AIA) served as an endogenous indicator to calculate apparent nutrient digestibility (AD). To account for the mixed diet (hay + concentrate), the AIA concentration in the total dry matter intake (DMI) was calculated as a weighted average based on the proportion of hay and concentrate intake. The gross energy (GE), organic matter (OM), dry matter (DM), crude protein (CP), ether extract (EE), calcium (Ca), phosphorus (P), neutral detergent fiber (NDF), and acid detergent fiber (ADF) contents in both feed and fecal samples were analyzed (NRC, 2007) [7,8], and the following indices were calculated separately [9,10]:
It should be noted that the use of a single endogenous marker (AIA) in a mixed-diet study is a key limitation, as AIA concentrations may differ substantially between hay and concentrate. Although the concentrate proportion was fixed (0.75% BW) and relatively small compared to the ad libitum hay intake, the weighted-average approach may still introduce measurable estimation error, and thus, the resulting apparent nutrient digestibility estimates should be interpreted with appropriate caution.
2.5. Blood and Fecal Sample Collection
At the end of the experimental period (Day 320 of gestation, approximately 10–15 days before the expected foaling date), jugular venous blood was collected before morning feeding (6:30 a.m.) using 10 mL clot activator tubes (serum tubes with procoagulant, no anticoagulant added). Whole blood was allowed to fully clot at room temperature for 30 min, then centrifuged at 3000× g for 15 min at 4 °C. The supernatant serum was carefully aspirated, aliquoted into cryovials, and immediately stored in liquid nitrogen until analysis.
Fecal samples were collected via rectal palpation, with three aliquots obtained per mare. The samples were immediately cryopreserved in liquid nitrogen for subsequent analysis of fecal microbiota composition and metabolomic profiling.
2.6. Biochemical Parameters
The concentrations of serum biochemical markers, including lactate dehydrogenase (LDH), alanine aminotransferase (ALT), aspartate aminotransferase (AST), creatine kinase (CK), γ-glutamyl transferase (GGT), calcium (Ca), phosphorus (P), magnesium (Mg), alkaline phosphatase (ALP), total protein (TP), albumin (ALB), globulin (GLB), albumin-to-globulin ratio (A/G), triglycerides (TG), urea (UREA), glucose (GLU), total cholesterol (TC), and creatinine (CREA), were determined using an automated biochemical analyzer (Mindray Bio-Medical Electronics Co., Ltd., Shenzhen, China, Model: BS-180VET). The analytical performance of the assays was verified, with intra-assay CV < 5%, inter-assay CV < 10%, and the minimum limit of detection meeting the standard requirements for equine serum analysis.
2.7. Reproductive Hormones
Peripheral serum GnRH was determined in late-gestation mares as an indicator of hypothalamic secretory function, and its detection in peripheral circulation has been widely adopted in equine reproductive studies. Serum reproductive hormones, including gonadotropin-releasing hormone (GnRH), follicle-stimulating hormone (FSH), luteinizing hormone (LH), estradiol (E2), prolactin (PRL), oxytocin (OXT), progesterone (P4), and testosterone (T), were measured using equine-specific and fully validated ELISA kits in accordance with the manufacturer’s instructions (Solarbio Science & Technology Co., Ltd., Beijing, China). Assay validation included intra-assay coefficient of variation (CV < 5%) and inter-assay coefficient of variation (CV < 10%), confirming the reliability of hormone quantification in mare serum samples.
2.8. Immune Indices
Serum immune markers, including immunoglobulin M (IgM), immunoglobulin A (IgA), immunoglobulin G (IgG), interleukin-6 (IL-6), tumor necrosis factor-α (TNF-α), interleukin-1β (IL-1β), and interleukin-2 (IL-2), were quantified using ELISA kits provided by Inner Mongolia Baoxin Biotechnology Co., Ltd., Hohhot, Inner Mongolia, China, following the kit-specific protocols.
2.9. Antioxidant Indices
Serum antioxidant parameters, including superoxide dismutase (SOD), total antioxidant capacity (T-AOC), glutathione peroxidase (GSH-Px), catalase (CAT), and malondialdehyde (MDA), were assayed using commercial kits from Nanjing Jiancheng Bioengineering Institute (Nanjing, China), strictly adhering to the manufacturer’s guidelines.
2.10. Fecal Microbiome Diversity Experimental Protocol
Genomic DNA extraction from fecal samples was performed using a standardized kit-based method (Solarbio Science & Technology Co., Ltd., Beijing, China, Model: D2700). The 16S rDNA V3–V4 hypervariable region was amplified with barcoded primers to enable sample multiplexing during sequencing. PCR products were purified via agarose gel electrophoresis followed by magnetic bead-based cleanup to remove primer dimers and non-specific amplicons. The purified amplicons were then ligated with dual-indexed sequencing adapters using T4 DNA ligase, and library quality was assessed via Agilent Bioanalyzer 2100 (Agilent Technologies, Inc., Santa Clara, CA, USA) before pooling for Illumina NovaSeq 6000 sequencing (Illumina, Inc., San Diego, CA, USA). Following high-throughput sequencing, sequence reads were clustered into operational taxonomic units (OTUs) at 97% sequence similarity rather than processed via an amplicon sequence variant (ASV) approach; this choice was made to ensure direct comparability with published equine fecal microbiome datasets and prioritize stability in broad-scale microbial community analysis. This workflow ensured high-fidelity representation of microbial communities while minimizing technical artifacts.
2.11. Fecal Microbiome Diversity Data Processing
Raw sequencing data (FastQ format) underwent multi-step quality control using FASTP (v0.23.2) to remove low-quality reads (Phred score < 20 over 50% of bases) and adapter contamination. Paired-end reads were merged into Tags using FLASH (v1.2.11) with a minimum overlap of 10 bp and maximum mismatch rate of 0.1. Chimeric sequences were identified and removed using the UCHIME algorithm (USEARCH v11.0.667) against the Gold reference database. Clean Tags were clustered into Operational Taxonomic Units (OTUs) at a 97% similarity threshold via the UPARSE pipeline, with singleton OTUs discarded to reduce spurious inflation of diversity estimates. To accommodate distinct analytical objectives, rarefaction to an even sequencing depth was applied for alpha diversity calculation, while OTU abundance tables were normalized using DESeq2’s median ratio method to account for sequencing depth variations across samples for downstream differential abundance analysis of microbial taxa.
2.12. Fecal Microbiome Diversity Information Analysis
Microbial community structure was analyzed through six complementary approaches. Alpha diversity metrics (Shannon index, Observed OTUs) were calculated using QIIME2 (v2022.2) after rarefaction to an even sampling depth (n = 20,000 reads/sample). Beta diversity was exploratorily visualized via PCoA ordination of Bray–Curtis dissimilarities, with PERMANOVA applied as a confirmatory statistical test to assess group differences. Taxonomic annotation of representative OTUs was performed against the SILVA 138.1 database using the RDP classifier (confidence threshold 0.8). Differential abundance analysis employed LEfSe (LDA score > 2, an exploratory, hypothesis-generating tool) and ANCOM-BC (a confirmatory statistical method) to identify biomarkers associated with experimental conditions. Functional predictions were generated using PICRUSt2 based on KEGG Orthology pathways, with statistical significance determined via STAMP software (v2.1.3) (Welch’s t-test, p < 0.05).
2.13. Metabolomics Experimental Protocol
Sample preparation followed a modified MTBE extraction protocol optimized for fecal metabolomics (Majorbio Bio-pharmaceutical Technology Co., Ltd., Shanghai, China), specifically designed to simultaneously extract both polar and non-polar metabolites via dual-phase separation. Briefly, 100 mg freeze-dried feces was spiked with 10 μL internal standard mix (10 μM each of 13C-labeled amino acids and deuterated lipids), then vortexed with 1 mL ice-cold methanol/MTBE/water (1:3:1, v/v/v) for 3 min. This solvent system was selected for its ability to solubilize polar metabolites (in the methanol–water lower phase) and non-polar metabolites (in the MTBE upper phase) simultaneously. After centrifugation (12,000× g, 10 min, 4 °C), the upper organic layer (non-polar metabolites) and the lower methanol–water layer (polar metabolites) were sequentially transferred to the same tube and evaporated to dryness under nitrogen. The residue was reconstituted in 200 μL 50% acetonitrile containing 0.1% formic acid, followed by 0.22 μm filtration before LC-MS/MS analysis. This protocol achieved >85% recovery for test compounds while minimizing matrix effects.
2.14. Metabolomics Chromatography–Mass Spectrometry Parameters
Chromatographic separation was performed on a Waters ACQUITY UPLC HSS T3 column (2.1 × 100 mm, 1.8 μm) maintained at 40 °C. Mobile phase A consisted of 0.1% formic acid in water, while mobile phase B was 0.1% formic acid in acetonitrile. The gradient program started at 5% B (0–1 min), increased linearly to 95% B (1–9 min), was held at 95% B (9–11 min), then returned to 5% B (11–12 min) for column re-equilibration. Mass spectrometry was conducted on a Q Exactive HF-X (Thermo Fisher Scientific, Waltham, MA, USA) in both positive (ESI+) and negative (ESI−) ionization modes with the following parameters: spray voltage 3.5 kV (+)/2.5 kV (−), capillary temperature 320 °C, sheath gas flow 40 arb, auxiliary gas flow 10 arb, and scan range m/z 70–1050 at a 120,000 resolution. Data-dependent acquisition triggered MS/MS fragmentation (NCE 20/30/40) of the top 10 most abundant precursors per cycle.
2.15. Metabolomics Data Quality Control and Preprocessing
Quality control was implemented through systematic injection of pooled QC samples (every 10 injections) to monitor instrument stability. Raw data (.raw files) were converted to mzML format using ProteoWizard (v3.0.21), followed by peak detection, alignment, and grouping using XCMS (v3.18.1) with the following parameters: centWave (ppm = 15, peakwidth = c(5,30)), obiwarp (profStep = 0.5), and fillPeaks (method = “chromatogram”). Missing values were imputed using k-nearest neighbors (k = 5), and batch effects corrected via the ComBat algorithm (sva package). Metabolite identification was achieved by matching accurate mass (±10 ppm) and retention time (±0.2 min) against an in-house library containing >1500 authenticated standards, with manual validation of MS/MS spectra for top candidates.
2.16. Statistical Analysis
Univariate analysis identified differentially expressed metabolites using limma (v3.50.0) with empirical Bayes shrinkage, applying FDR correction (q < 0.05) and absolute log2FC > 1 thresholds. Multivariate analysis employed OPLS-DA (SIMCA-P v14.1) with 7-fold cross-validation to assess model predictive ability (Q2 > 0.5 considered significant). Notably, the OPLS-DA model was not subjected to permutation testing or external validation; therefore, all metabolomics findings are considered exploratory and hypothesis-generating rather than confirmatory. Pathway enrichment analysis utilized MetaboAnalyst 5.0, mapping metabolites to KEGG pathways and calculating over-representation p-values via a hypergeometric test. All statistical tests were performed in R (v4.1.2) with ggplot2 for visualization, ensuring reproducibility through seed setting (set.seed(123)) for randomization-based methods.
Data were initially organized using Microsoft Excel (Microsoft Corporation, Redmond, WA, USA). All data are presented as the mean ± standard deviation (Mean ± SD) to reflect the dispersion of individual observations. Statistical analyses were performed using SPSS software (version 27.0). Prior to analysis, data normality and homogeneity of variances were assessed using the Shapiro–Wilk and Levene’s tests, respectively. For data meeting these assumptions, one-way analysis of variance (ANOVA) was conducted to determine overall differences among the three dietary groups. To identify specific differences between groups, Tukey’s Honestly Significant Difference (HSD) post hoc test was applied following the ANOVA. For the integrative microbiome and metabolomics analyses, which involve a large number of variables, p-values were adjusted using the False Discovery Rate (FDR) correction to control for the risk of Type I errors due to multiple comparisons. A p-value < 0.05 after correction was considered statistically significant for these multi-omics datasets [11].
3. Results
3.1. Effects of Complementary Feed with Different Protein Levels on the Gestational Weight Gain of Mares During Late Gestation
The effects of complementary feed with varying protein levels on gestational weight gain are summarized in Table 3. Prior to the experiment, no significant differences in initial body weight were observed among the three groups (p = 0.93). At the end of the trial, mares in the MCP group exhibited the highest final body weight, significantly surpassing those in the HCP group (p = 0.044). The MCP group also demonstrated significantly higher average daily gain (ADG) compared to the HCP group (p < 0.05), with the LCP group showing intermediate values. No significant variations in dry matter intake (DMI) were detected among the groups (p = 0.15). The MCP group had the lowest Feed/Gain (F:G) ratio, which was significantly lower than that of the HCP group (p = 0.03).
Table 3.
Effects of complementary feed with different protein levels on the gestational weight gain of mares during late gestation.
3.2. Effects of Complementary Feed with Different Protein Levels on Apparent Nutrient Digestibility in Mares During Late Gestation
As shown in Table 4, the ether extract (EE) and dry matter (DM) digestibility in the HCP group were significantly lower than in the MCP and LCP groups (p < 0.001). Conversely, organic matter (OM) digestibility was highest in the MCP group, showing significant superiority over the LCP and HCP groups (p < 0.001). Phosphorus (P) digestibility in the HCP group was significantly lower than in the MCP and LCP groups (p < 0.001). Additionally, neutral detergent fiber (NDF) digestibility in the MCP group was significantly higher than in the LCP and HCP groups (p = 0.020).
Table 4.
Effects of complementary feed with different protein levels on apparent nutrient digestibility in mares during late gestation (% DM).
3.3. Effects of Complementary Feed with Different Protein Levels on Serum Biochemical Indices in Mares During Late Gestation
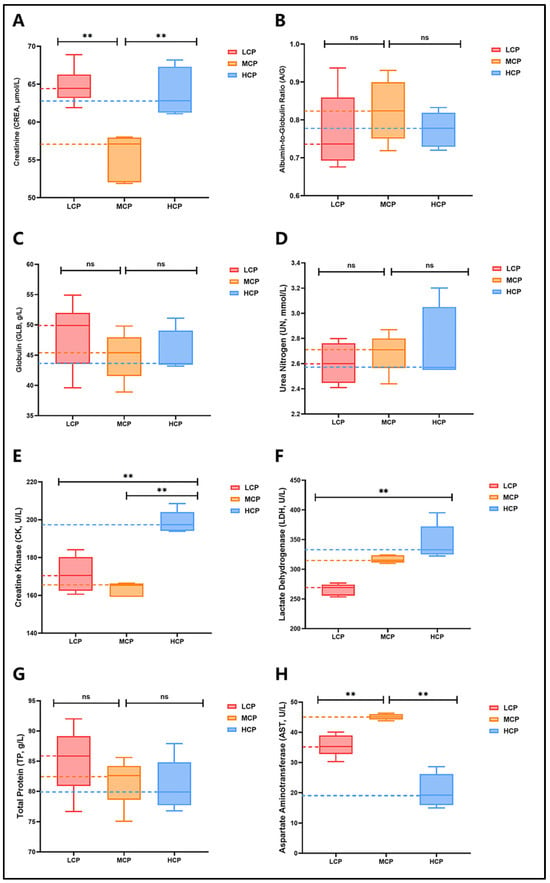
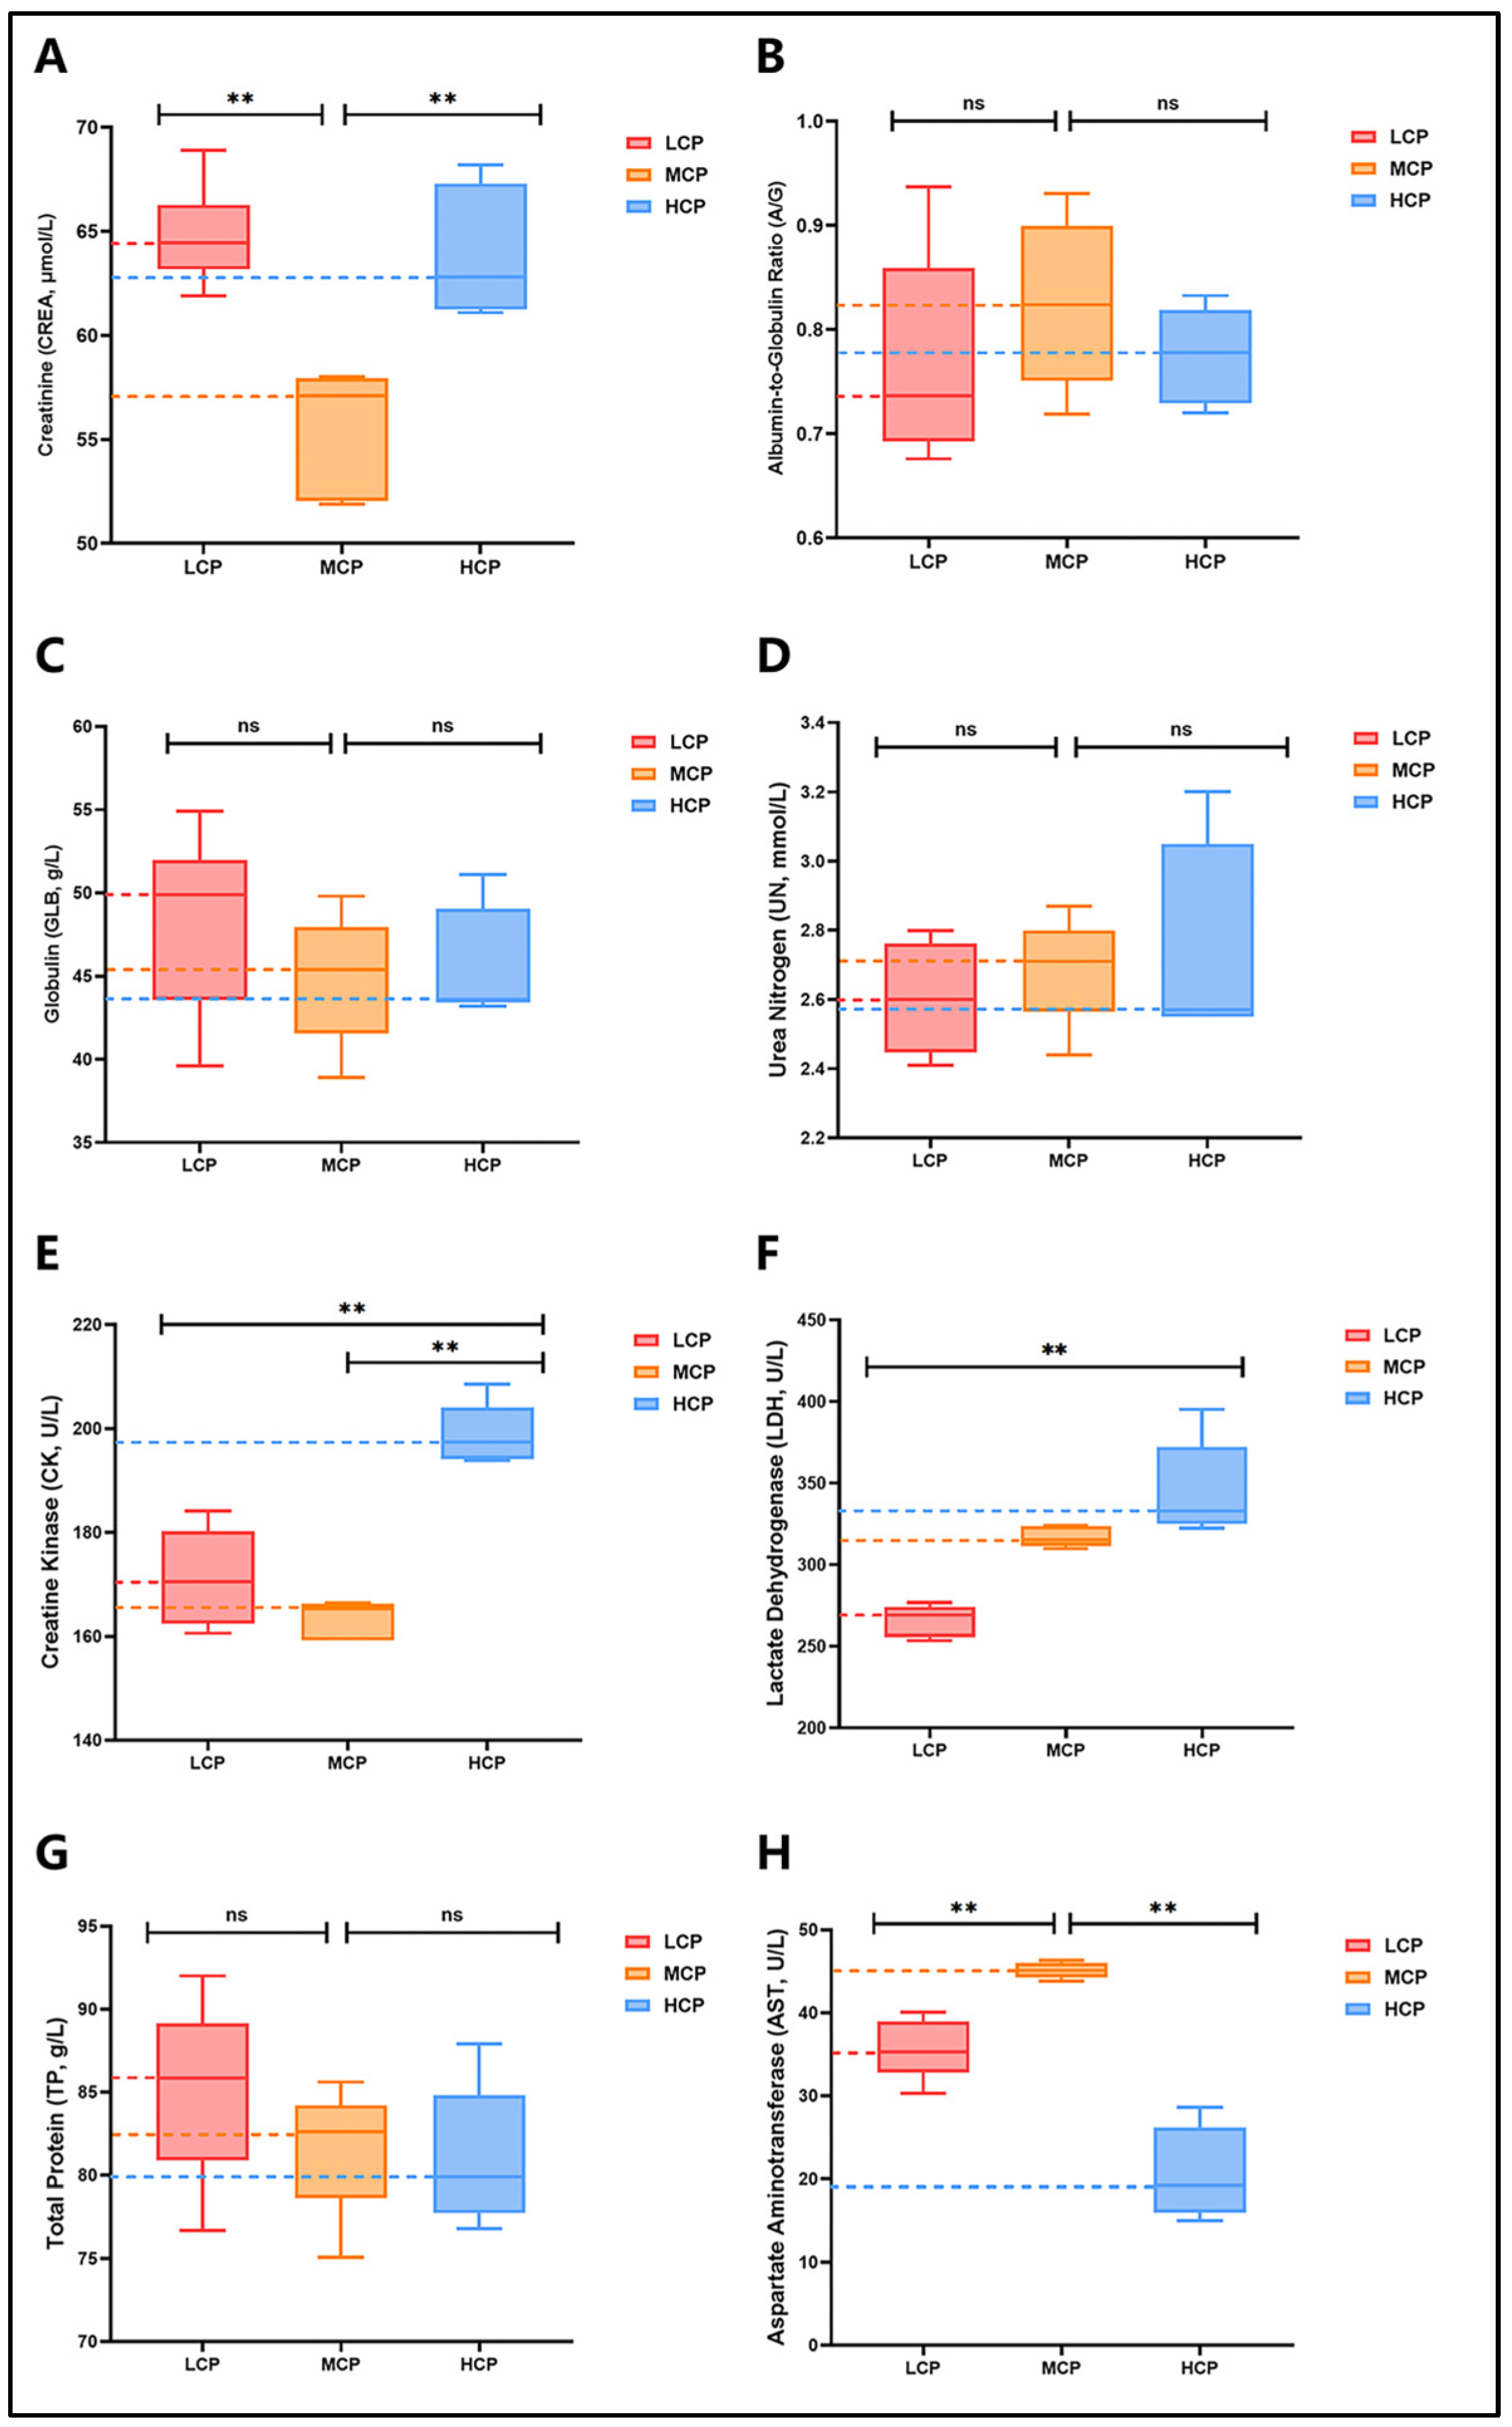
The impacts on serum biochemical indices are presented in Table S1 and Figure 1. The creatinine (CREA) concentration in the MCP group was significantly lower than in both the LCP and HCP groups (p < 0.001) (Figure 1A). Creatine kinase (CK) and lactate dehydrogenase (LDH) activities were significantly elevated in the HCP group compared to the MCP and LCP groups (p < 0.001) (Figure 1E,F). Aspartate aminotransferase (AST) activity was significantly higher in the MCP group than in the LCP and HCP groups (p < 0.001) (Figure 1H). No statistically significant differences were observed in the albumin-to-globulin ratio (A/G), urea nitrogen (UN), globulin (GLB), and total protein (TP) (Figure 1B–D,G). All values remained within normal physiological ranges for horses.
Figure 1.
Effect of different protein levels in complementary feed on serum biochemical indices of mares during late gestation. “ns” indicates no significant difference (not significant), while “**” denotes p < 0.01, suggesting a highly significant difference. HCP (n = 5), MCP (n = 5), LCP (n = 6). (A) Effects of complementary feed with different protein levels on serum creatinine (CREA) concentration in mares during late gestation. (B) Effects of complementary feed with different protein levels on serum albumin-to-globulin ratio (A/G ratio) in mares during late gestation. (C) Effects of complementary feed with different protein levels on serum globulin (GLB) concentration in mares during late gestation. (D) Effects of complementary feed with different protein levels on serum urea nitrogen (UN) concentration in mares during late gestation. (E) Effects of complementary feed with different protein levels on serum creatine kinase (CK) activity in mares during late gestation. (F) Effects of complementary feed with different protein levels on serum lactate dehydrogenase (LDH) activity in mares during late gestation. (G) Effects of complementary feed with different protein levels on serum total protein (TP) concentration in mares during late gestation. (H) Effects of complementary feed with different protein levels on serum aspartate aminotransferase (AST) activity in mares during late gestation.
3.4. Effects of Complementary Feed with Different Protein Levels on Reproductive Hormones in Mares During Late Gestation
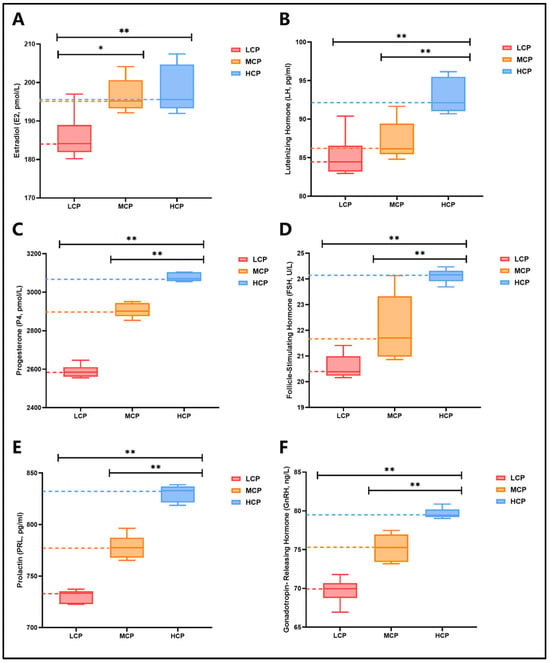
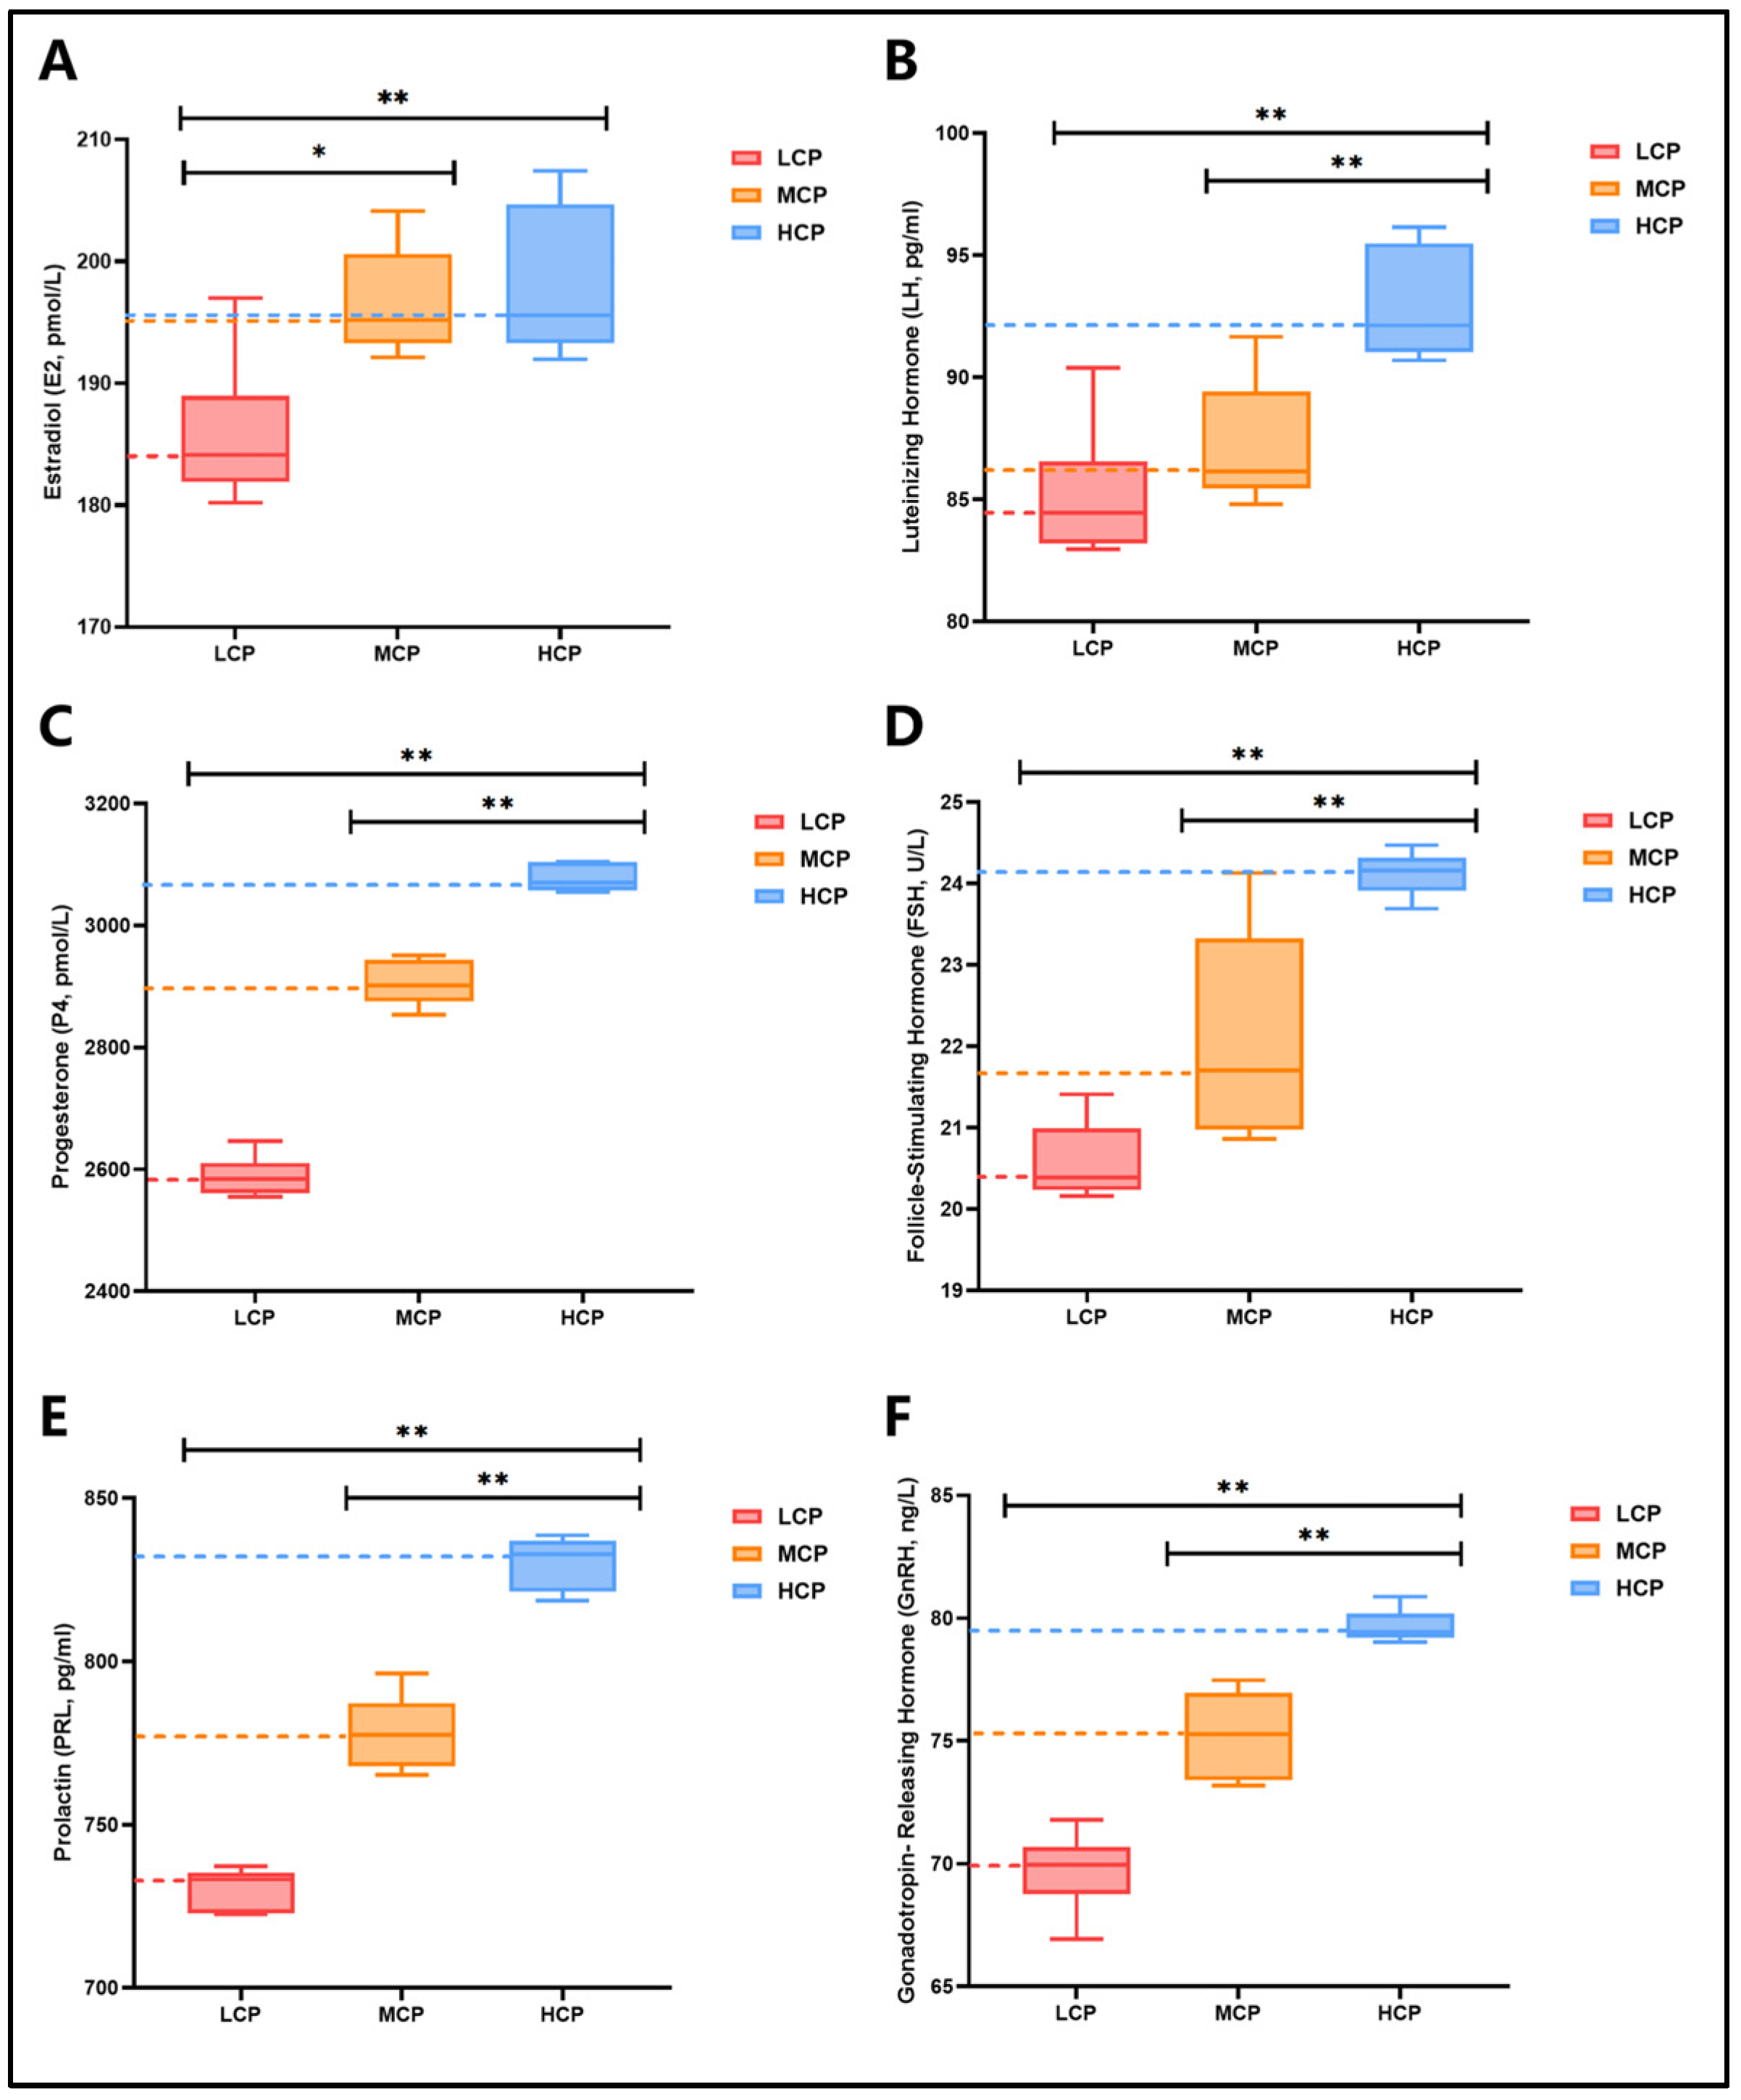
The effects on serum reproductive hormones are shown in Table S2 and Figure 2. E2 levels in the MCP and HCP groups were significantly higher than in the LCP group (p = 0.005) (Figure 2A). LH, P4, FSH, PRL, and GnRH levels in the HCP group were all extremely significantly higher than in the MCP and LCP groups (p < 0.001) (Figure 2B–F).
Figure 2.
Effects of supplemental feeding with different protein levels of complementary feed on serum reproductive hormones in mares during late gestation. “**” denotes p < 0.01, “*” denotes p < 0.05, suggesting a highly significant difference. HCP (n = 5), MCP (n = 5), LCP (n = 6). (A) E2 level comparison in mares receiving complementary feed with varying protein levels in late gestation; (B) LH level comparison in mares receiving complementary feed with different protein levels in late gestation; (C) P4 level comparison in mares receiving complementary feed of diverse protein levels in late gestation; (D) FSH level comparison in mares receiving complementary feed of varying protein content in late gestation; (E) PRL level comparison in mares receiving complementary feed of different protein concentrations in late gestation; (F) GnRH level comparison in mares receiving complementary feed with varying protein levels in late gestation.
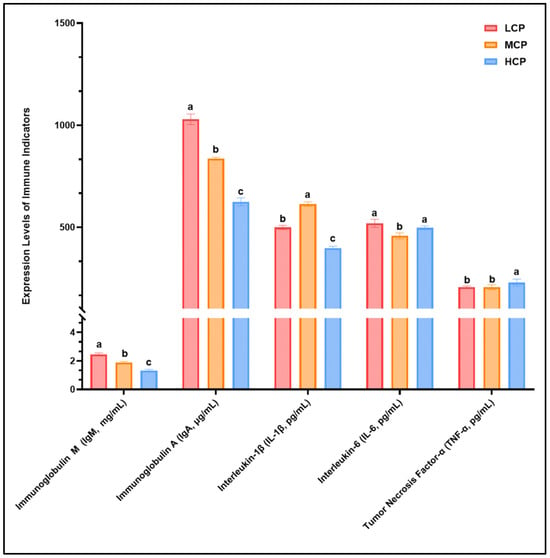
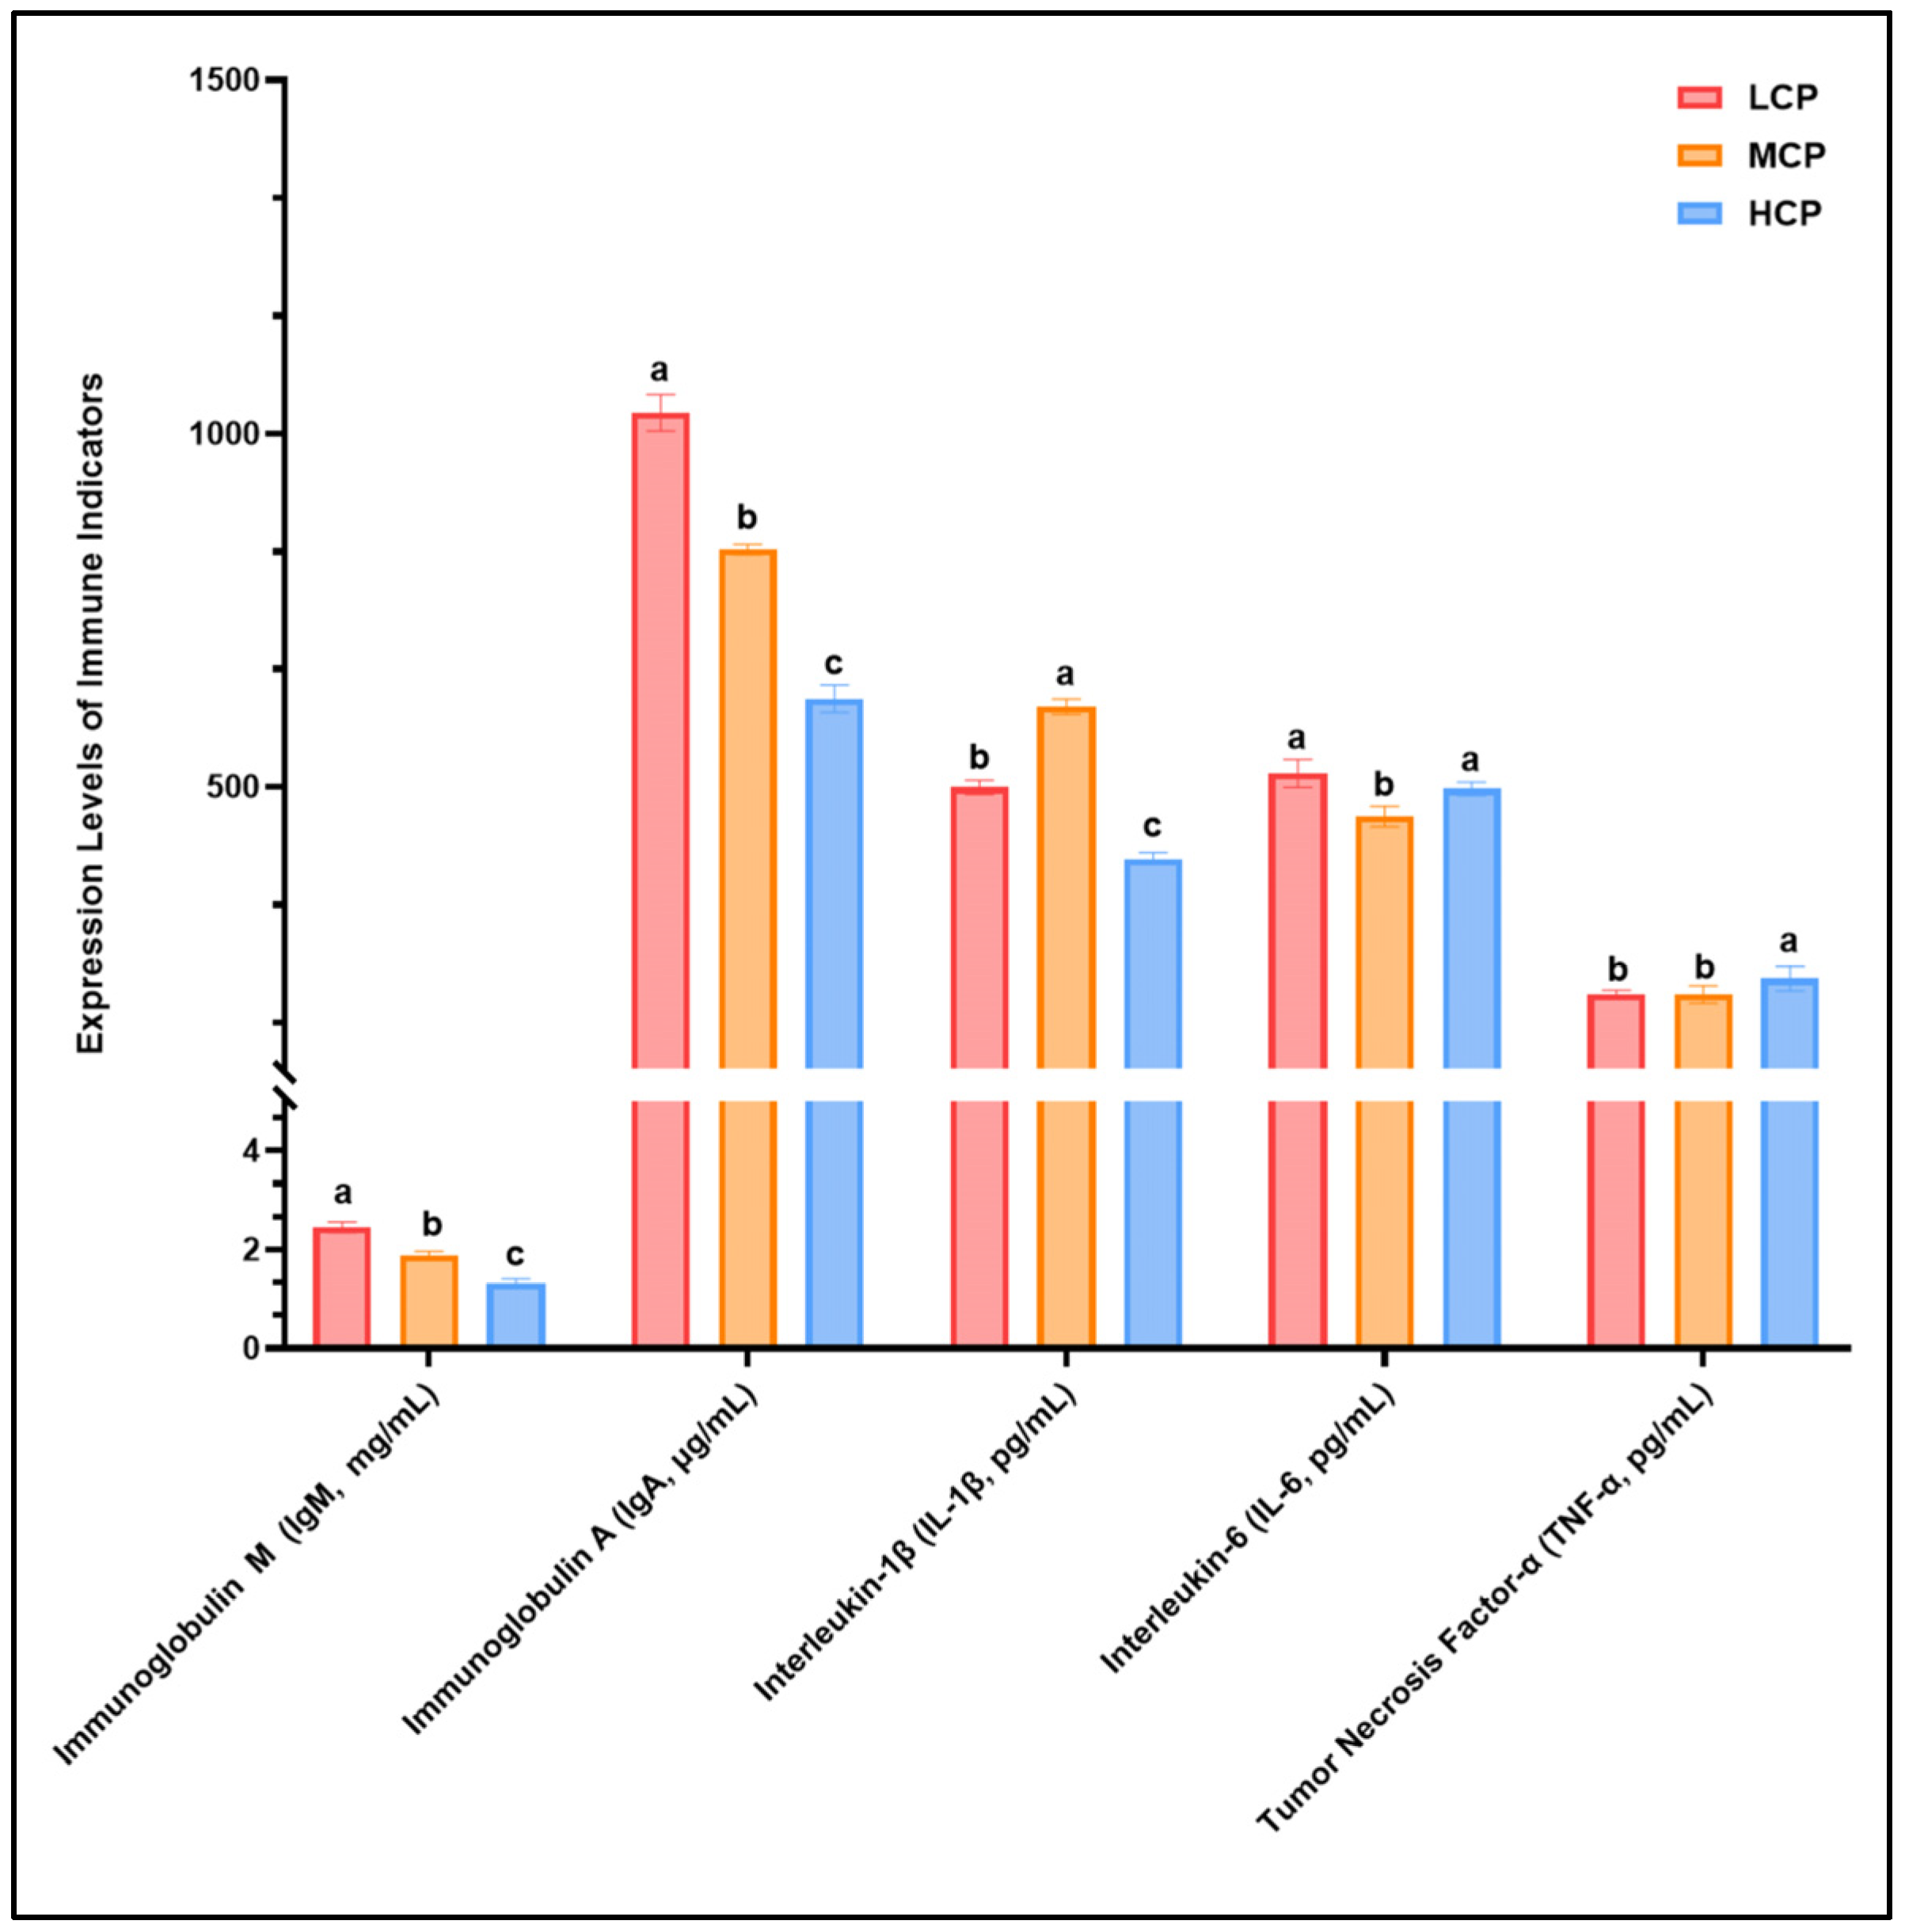
3.5. Effects of Complementary Feed with Different Protein Levels on Immune Indicators in Mares During Late Gestation
The impacts on serum immune indicators are shown in Table S3 and Figure 3. IgM and IgA levels in the LCP group were significantly higher than in the MCP and HCP groups (p < 0.001), with IgM increasing by 30.32% and IgA by 23.18% relative to the MCP group, while HCP showed decreases of 29.79% and 25.26% for these two indices, respectively. IL-1β levels were highest in the MCP group (p < 0.001), being 18.62% higher than in the LCP group and 35.06% higher than in the HCP group; IL-6 levels were highest in the LCP group (p < 0.001) with a 13.34% increase compared with the MCP group, and TNF-α levels were significantly elevated in the HCP group (p < 0.05) showing a 10.84% increase relative to the MCP group.
Figure 3.
Effects of complementary feed with different protein levels on serum immune parameters in mares during late gestation. Values with different lowercase letters indicate significant differences (p < 0.05). HCP (n = 5), MCP (n = 5), LCP (n = 6).
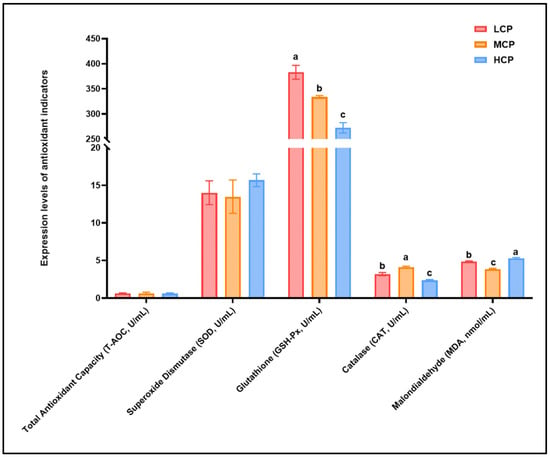
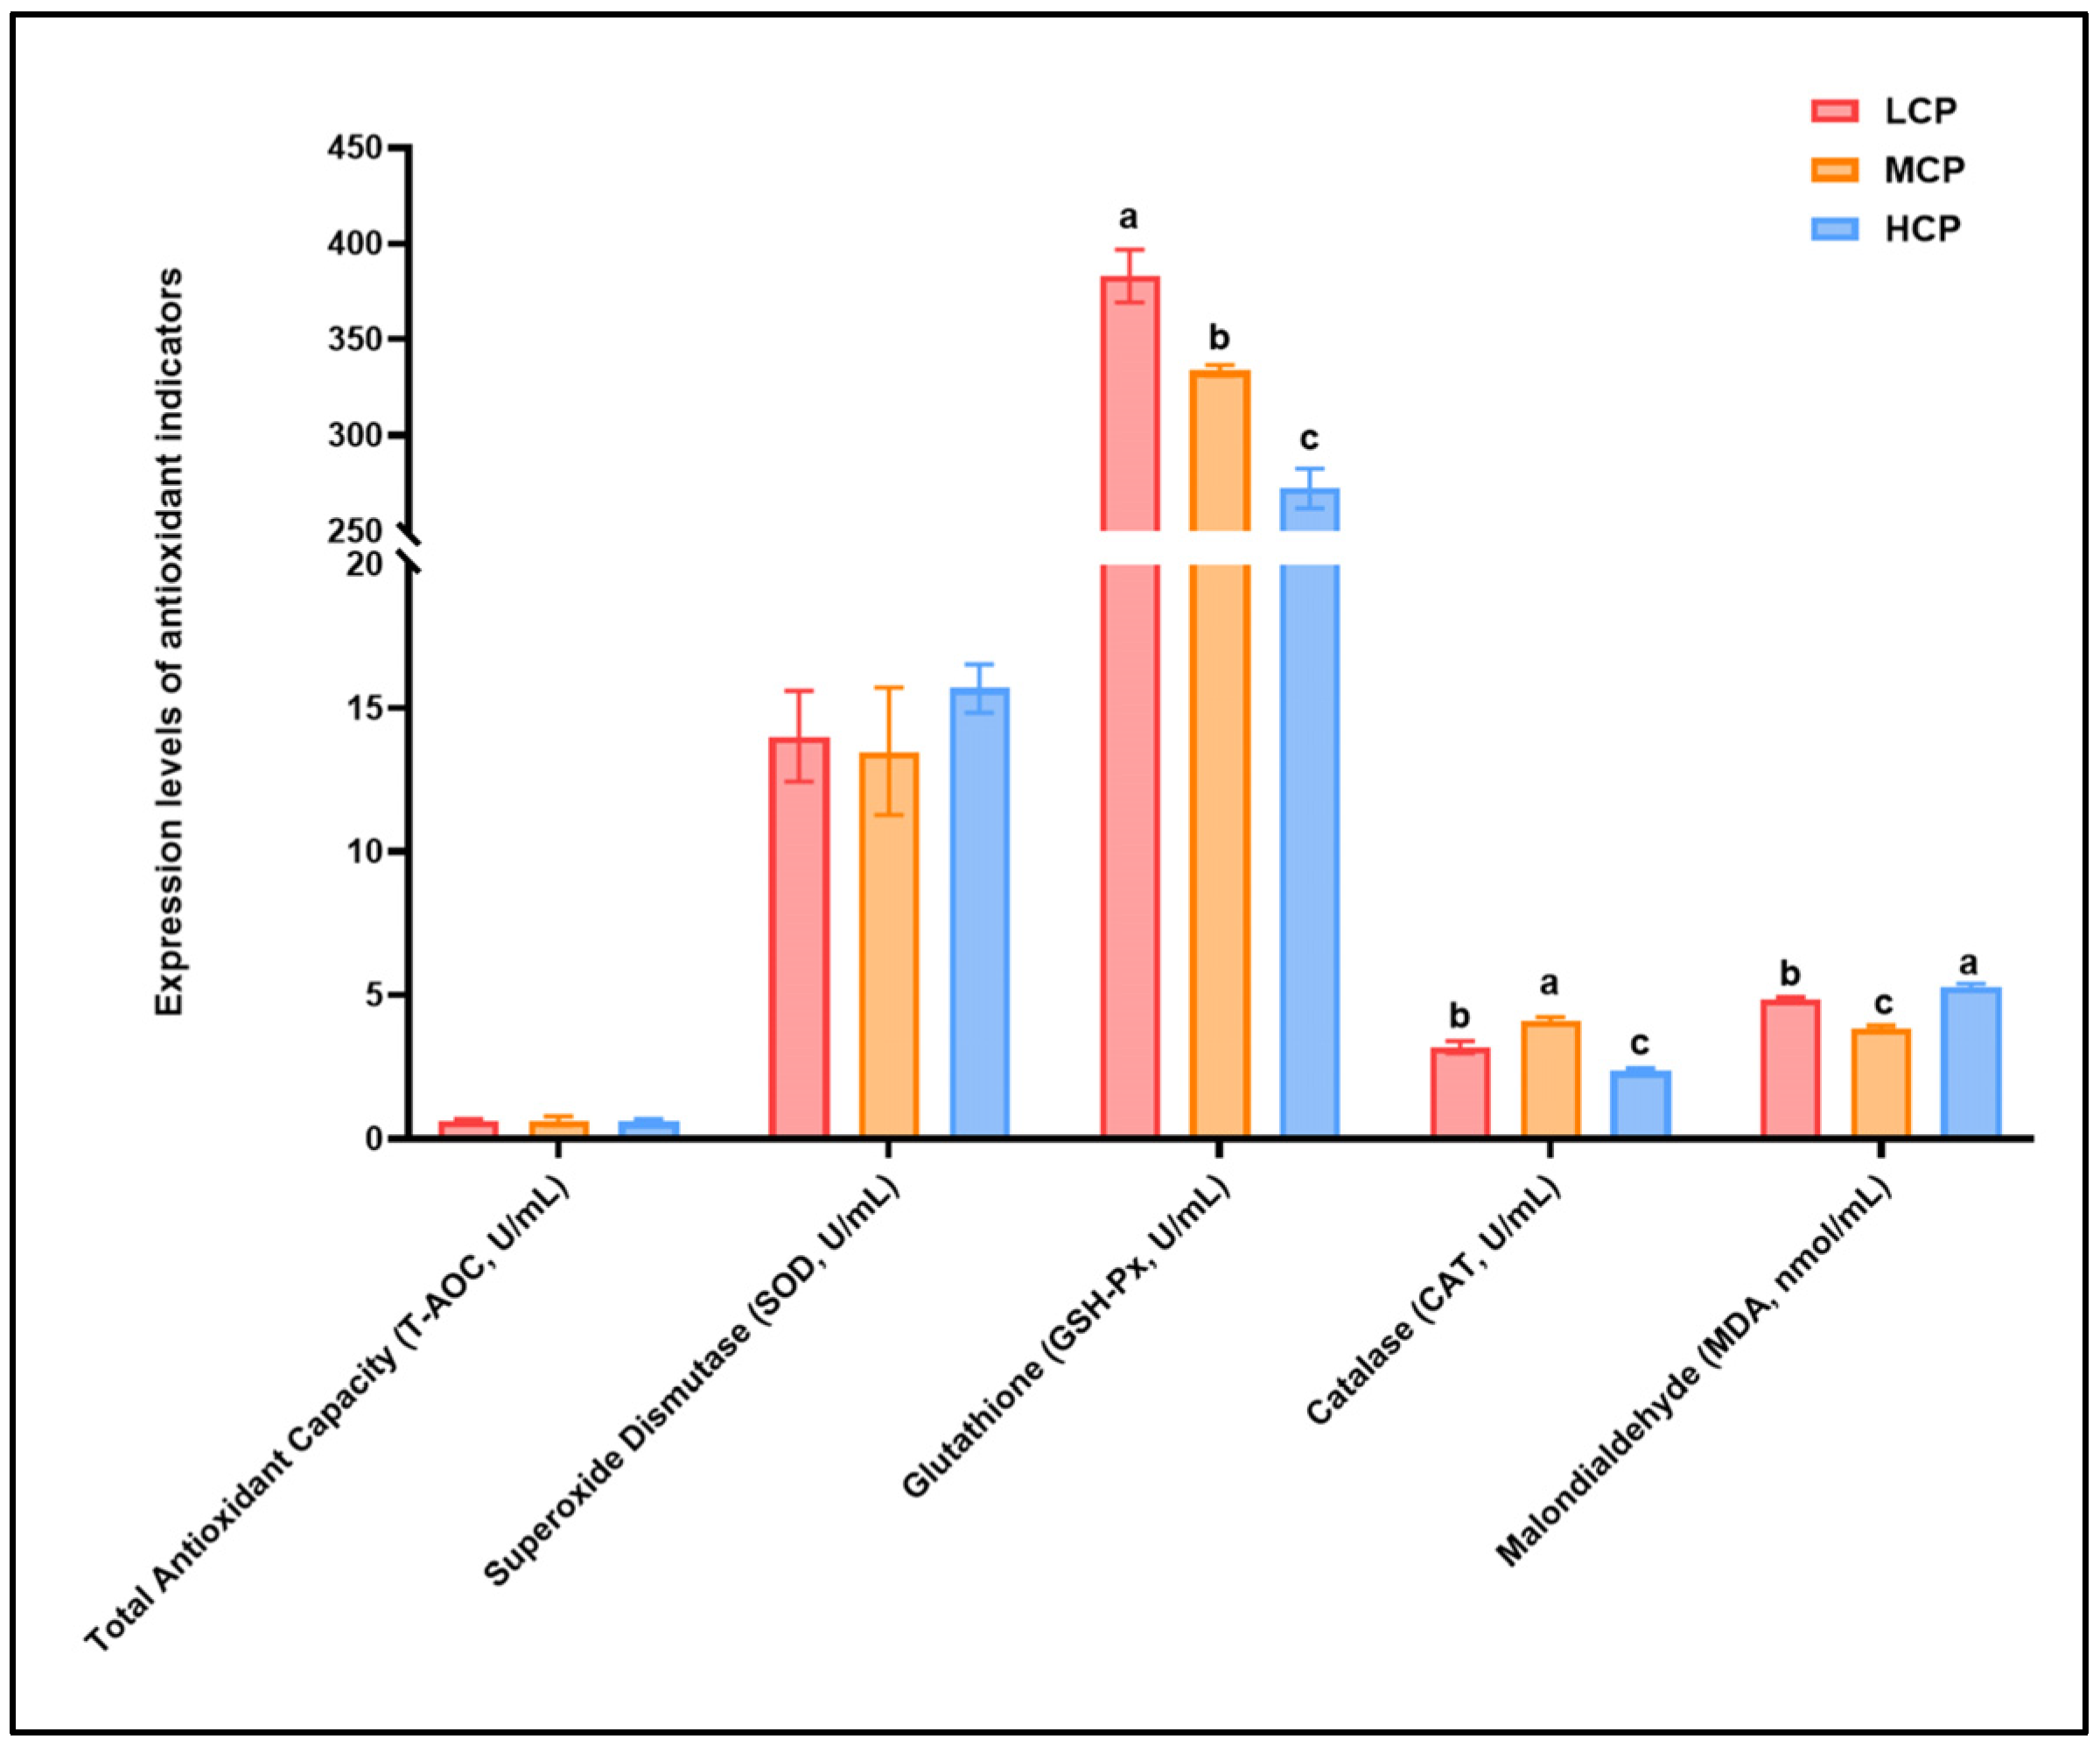
3.6. Effects of Complementary Feed with Different Protein Levels on Antioxidant Indices in Mares During Late Gestation
The impacts on serum antioxidant indices are presented in Table S4 and Figure 4. GSH-Px activity in the LCP group was significantly higher than in the MCP and HCP groups (p < 0.001). CAT activity was highest in the MCP group (p < 0.001), with a 42.20% reduction in the HCP group relative to the MCP group; meanwhile, MDA levels were significantly elevated in the HCP group (p < 0.001), showing a 36.10% increase compared with the MCP group.
Figure 4.
Effect of complementary feed with different protein levels on serum antioxidant indices in mares during late gestation. Values within the same row sharing the same superscript letters indicate no significant difference (p ≥ 0.05). Values with different lowercase letters indicate significant differences (p < 0.05). HCP (n = 5), MCP (n = 5), LCP (n = 6).
3.7. Fecal Microbial Rarefaction Curves and Venn Diagrams
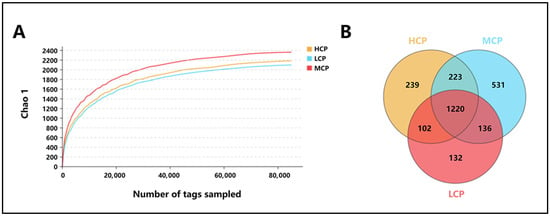
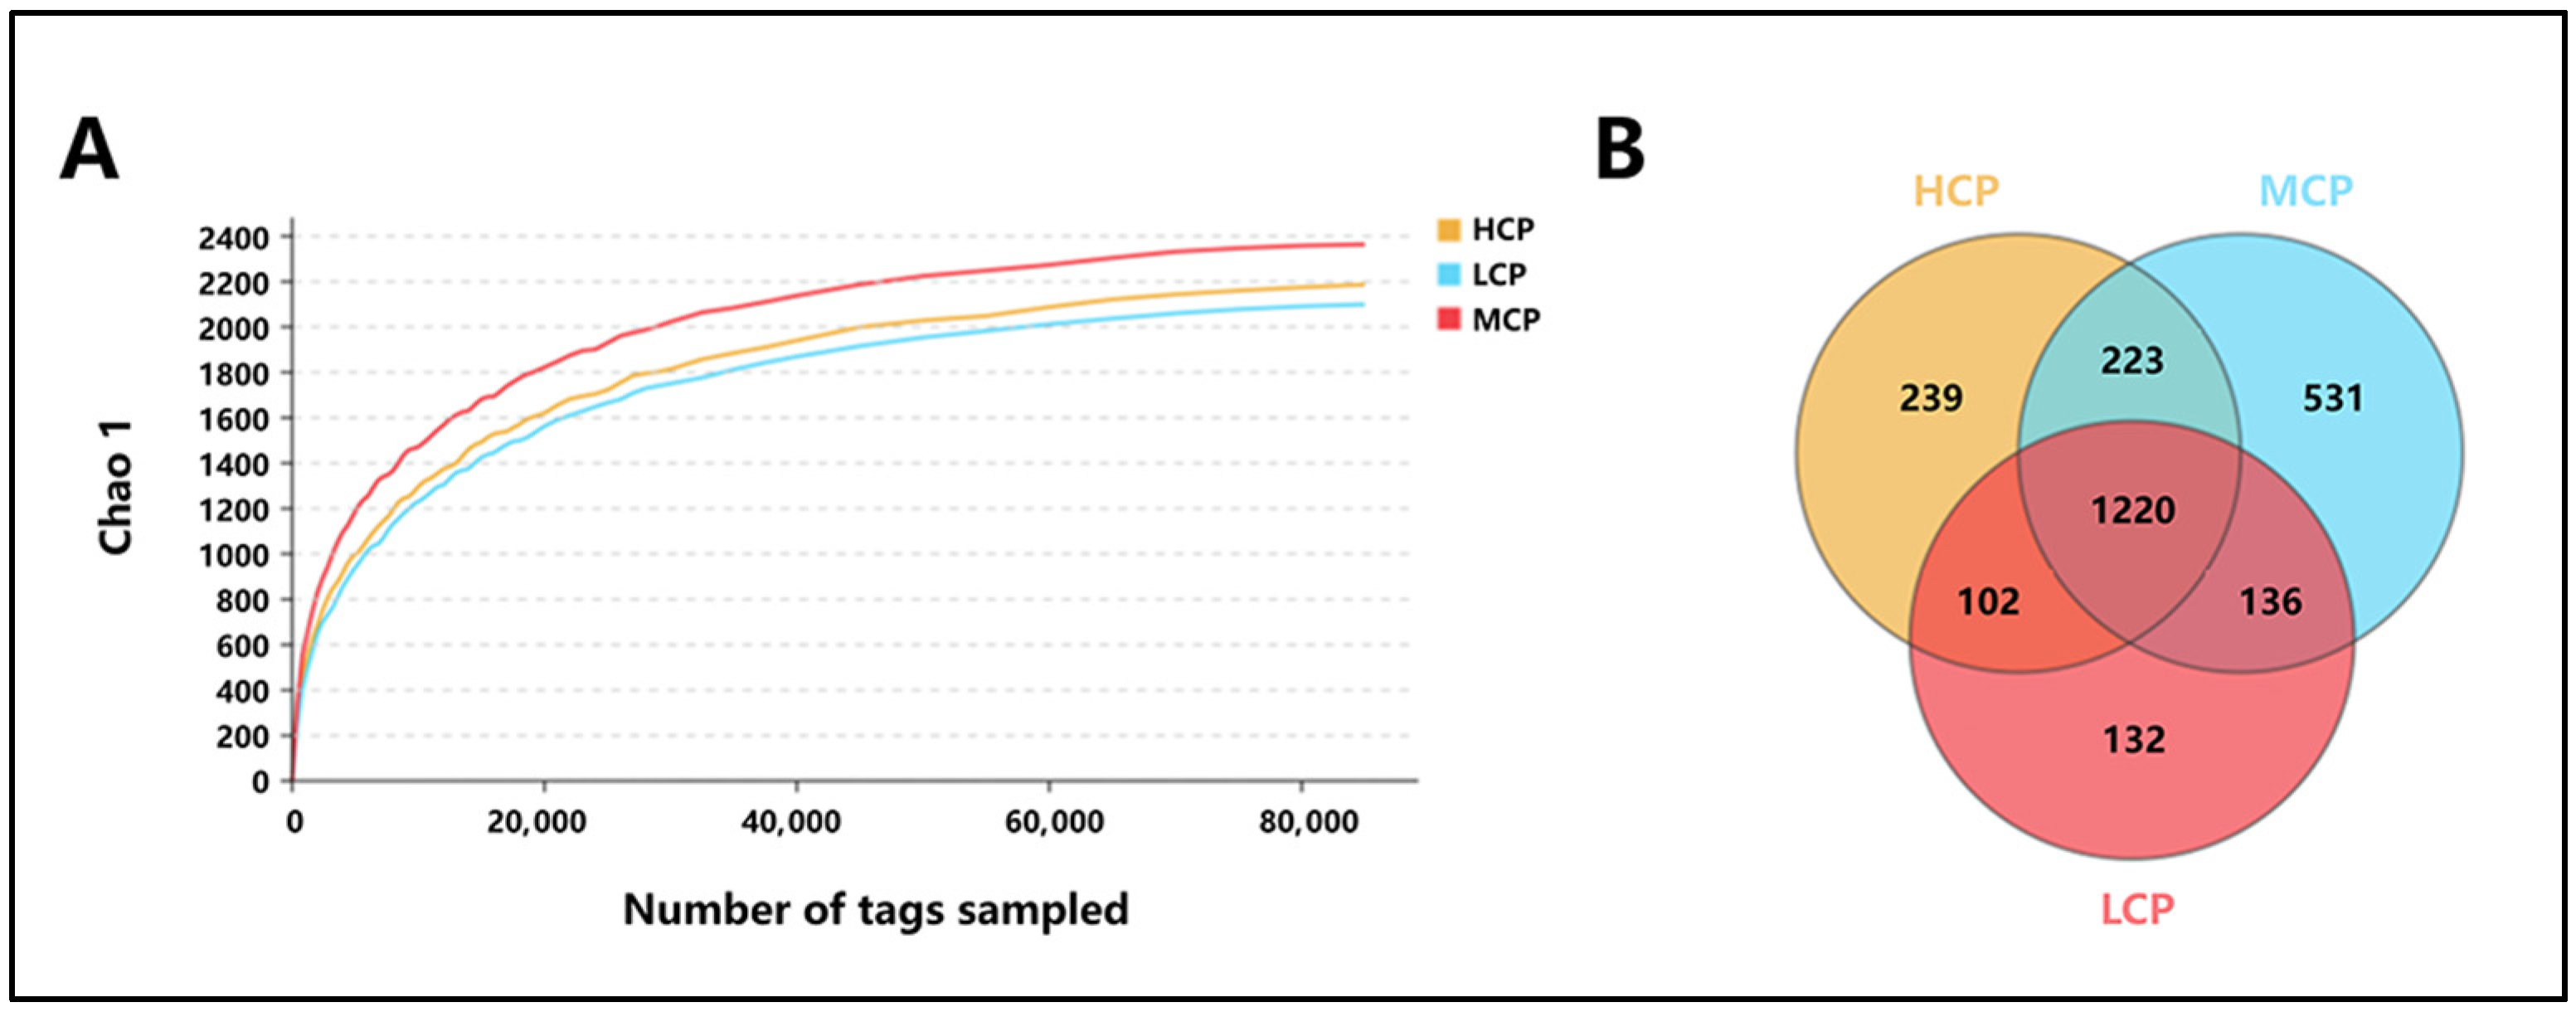
The rarefaction curves (Figure 5A) demonstrate that the curves for all samples plateau after the sequencing volume reaches approximately 20,000 sequences, indicating that the sequencing depth has adequately covered the microbial diversity within the samples. From the Venn diagram (Figure 5B), we can observe that the number of microbial taxa in the HCP group is 1784, in the MCP group is 2110, and in the LCP group is 1590. There are 223 shared OTUs between the HCP and MCP groups, 102 shared OTUs between the HCP and LCP groups, and 136 shared OTUs between the MCP and LCP groups. A total of 1220 operational taxonomic units (OTUs) are common to all three groups. This suggests that distinct microbial communities exist in each of the three groups during the experimental process.
Figure 5.
Dilution curve and Venn diagram. (A) Rarefaction curve; (B) Venn diagram illustrating the differences in the number of operational taxonomic units (OTUs) among different groups.
3.8. Analysis of Fecal Microbial Beta Diversity
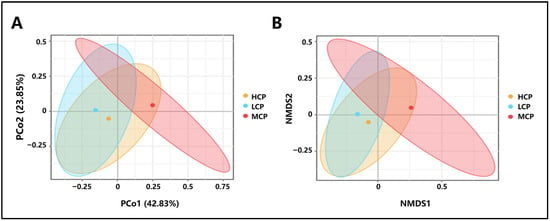
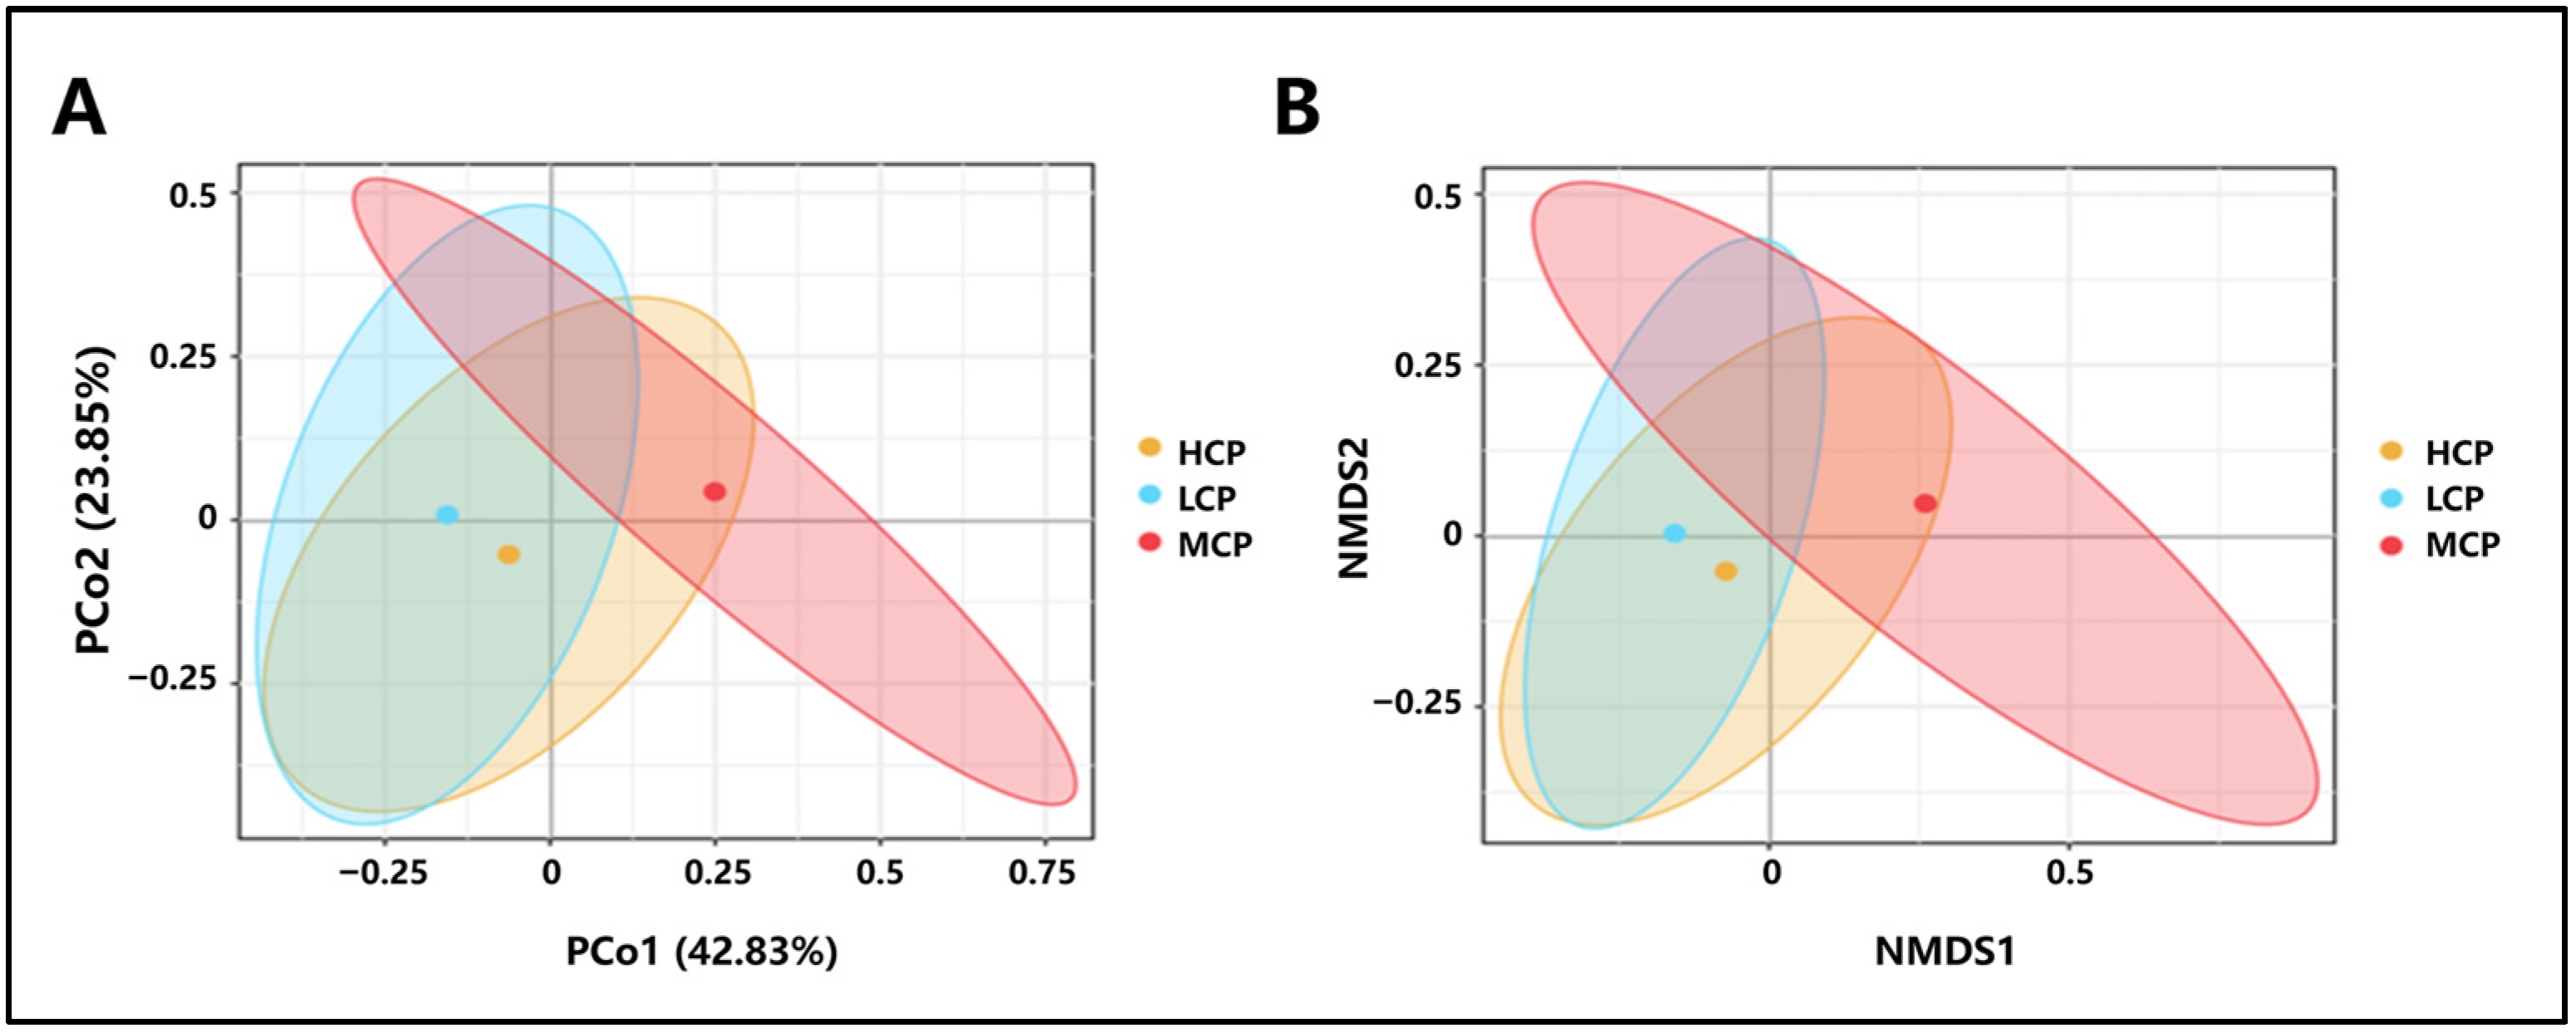
In this experiment, Principal Co-ordinates Analysis (PCoA) and Non-metric Multidimensional Scaling (NMDS) were employed to visualize differences in fecal microbial community structure among mares fed complementary feed with different protein levels. The PCoA analysis based on Bray–Curtis distance (Figure 6A) showed clear separation of samples from the three groups in a two-dimensional space (R = 0.42, p = 0.002), suggesting distinct differences in community composition. Samples from the HCP group clustered closely, while those from the MCP group were more dispersed. Samples from the LCP group were positioned between the HCP and MCP groups but closer to the MCP group. The NMDS analysis (Figure 6B) further supported these visual patterns, with the three groups forming distinct clusters.
Figure 6.
PCoA and NMDS analysis of fecal microbial communities. (A) The PCoA plot illustrates distinct clustering of fecal microbial communities among mares supplemented with different protein levels (HCP, MCP, LCP). (B) The NMDS plot further confirms the separation of microbial communities based on protein supplementation.
3.9. Analysis of Fecal Microbial Alpha Diversity Indices
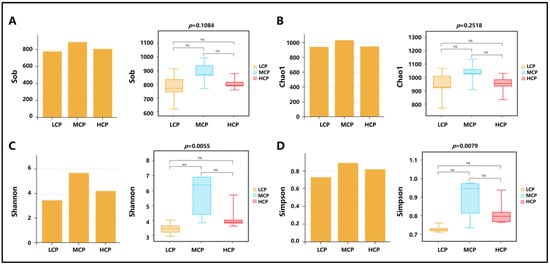
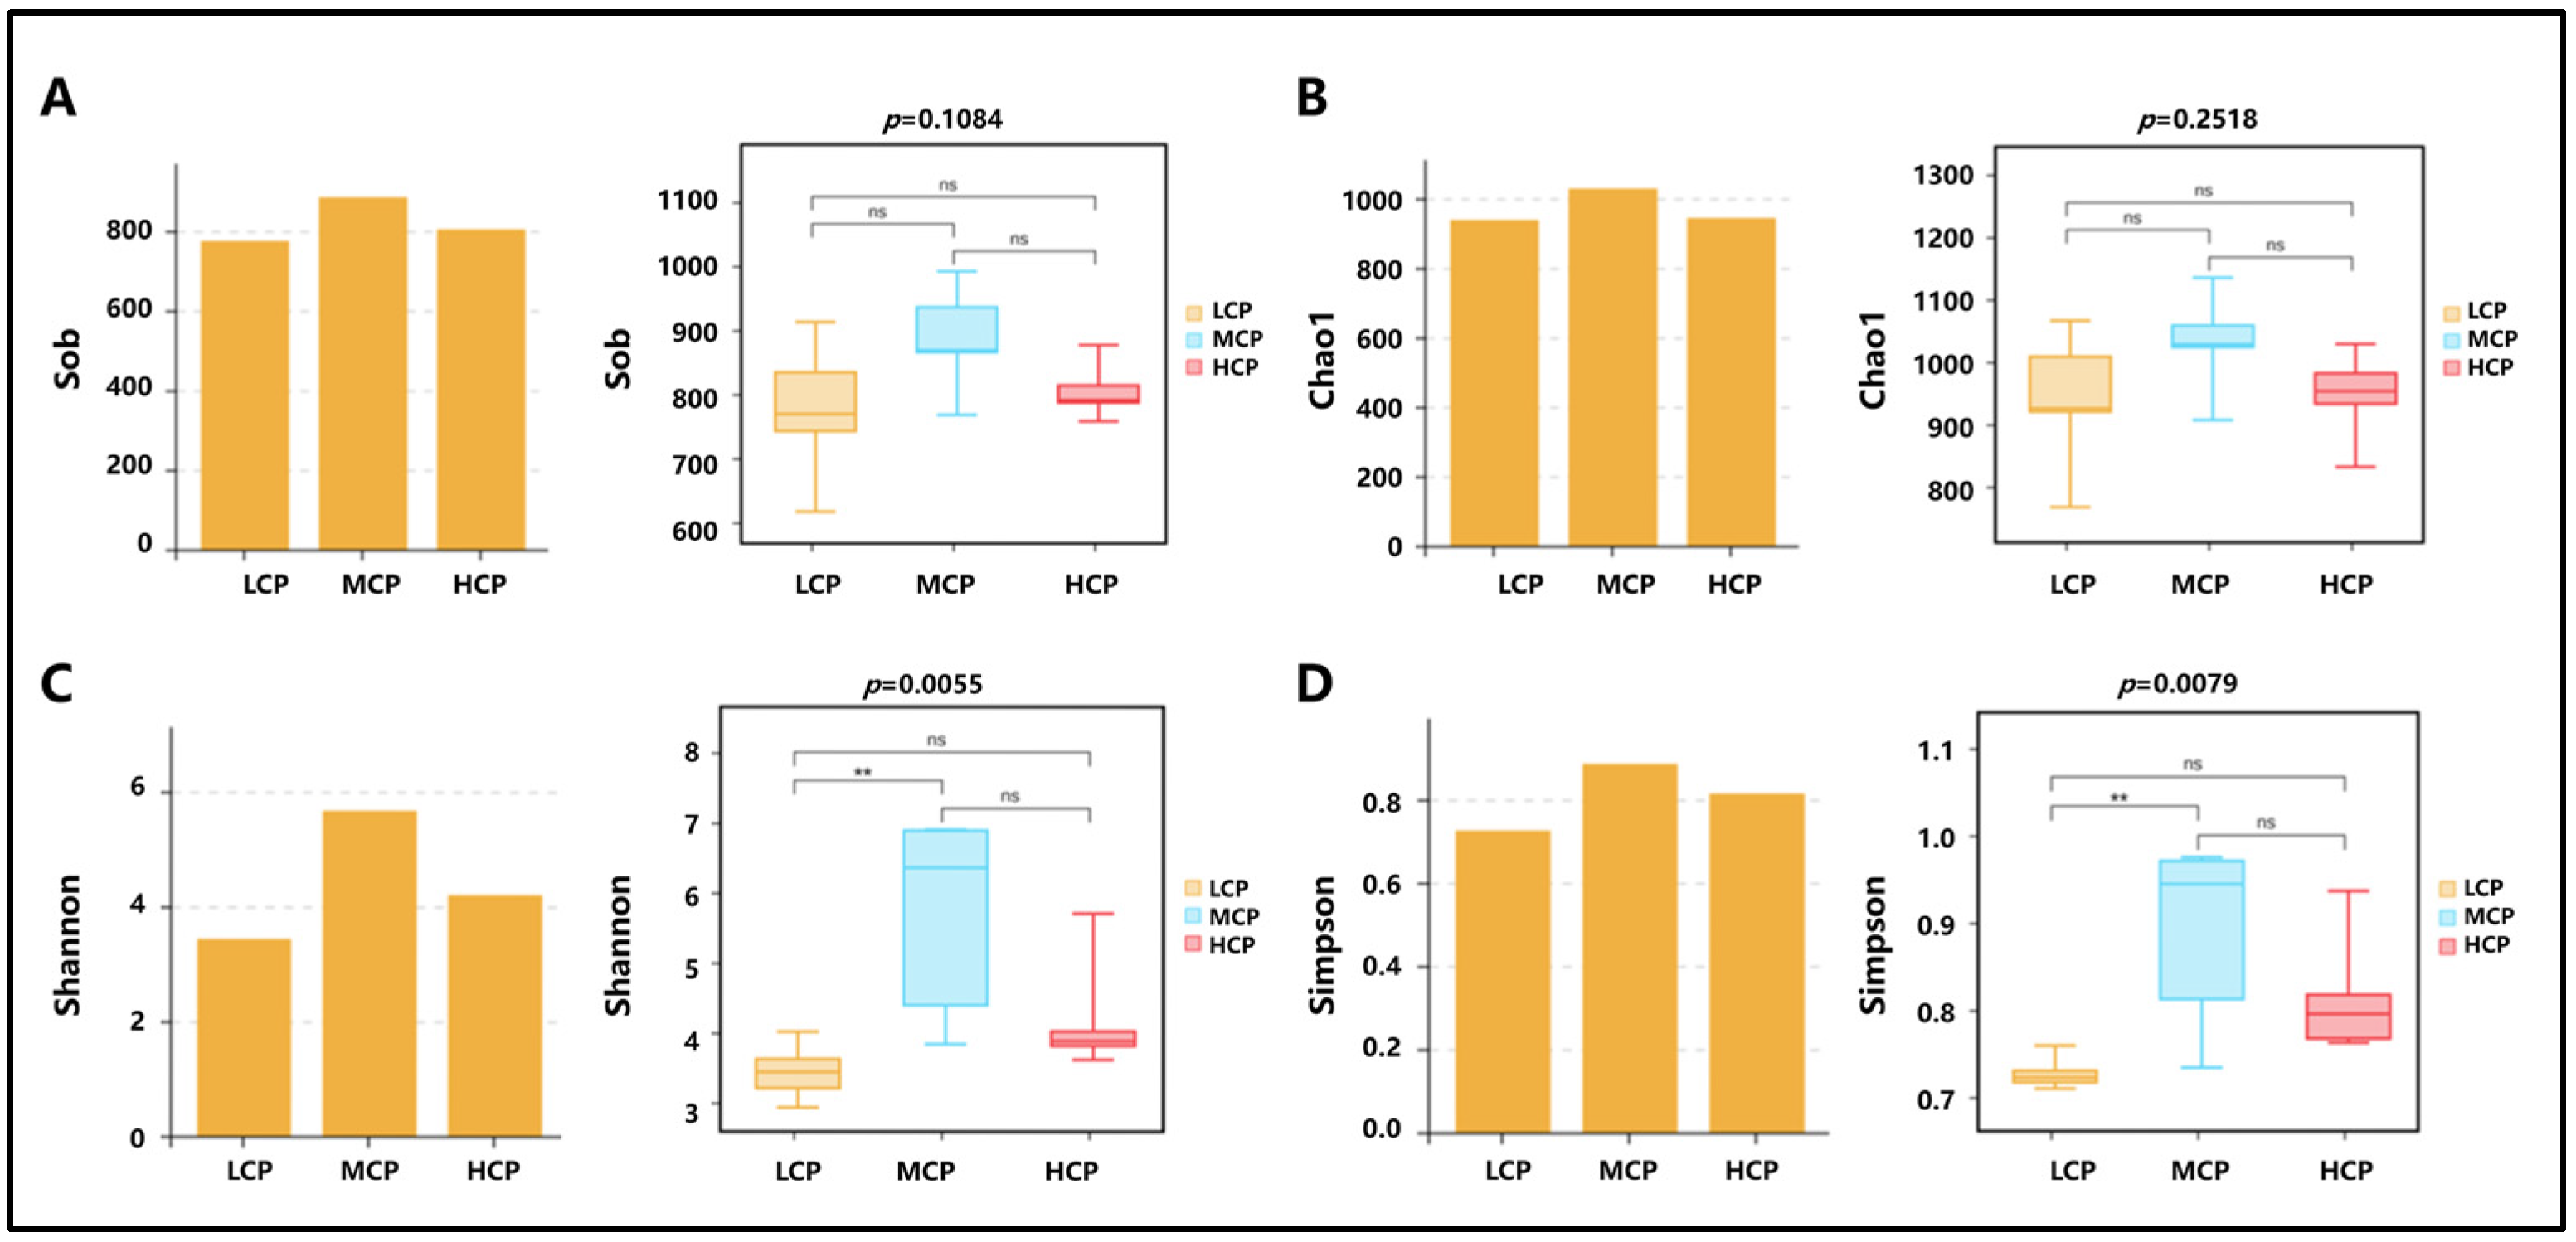
Alpha diversity is utilized to evaluate the diversity of microbial communities within samples, encompassing both species richness and evenness [12]. For the Shannon and Simpson indices, the MCP group exhibits the highest mean diversity, which is significantly greater than that of the LCP group (p < 0.05) (Figure 7C,D). Regarding the Sob and Chao1 indices, although the MCP group also shows the highest mean diversity, no significant differences were observed (Figure 7A,B).
Figure 7.
Alpha diversity analysis of fecal microbial communities. “ns” indicates no significant difference; “**” indicates a highly significant difference (FDR correction, p < 0.05). (A) Left bar chart shows mean Sob index values for LCP/MCP/HCP groups; right box plot displays data distribution (medians, IQR, intergroup difference significance). (B) Left bar chart shows mean Chao1 index values; right box plot displays data distribution. (C) Left bar chart shows mean Shannon index values; right box plot displays data distribution. (D) Left bar chart shows mean Simpson index values; right box plot displays data distribution.
3.10. Fecal Microbiota Characteristics
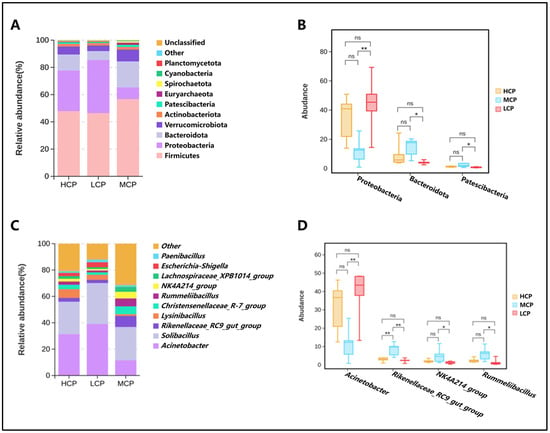
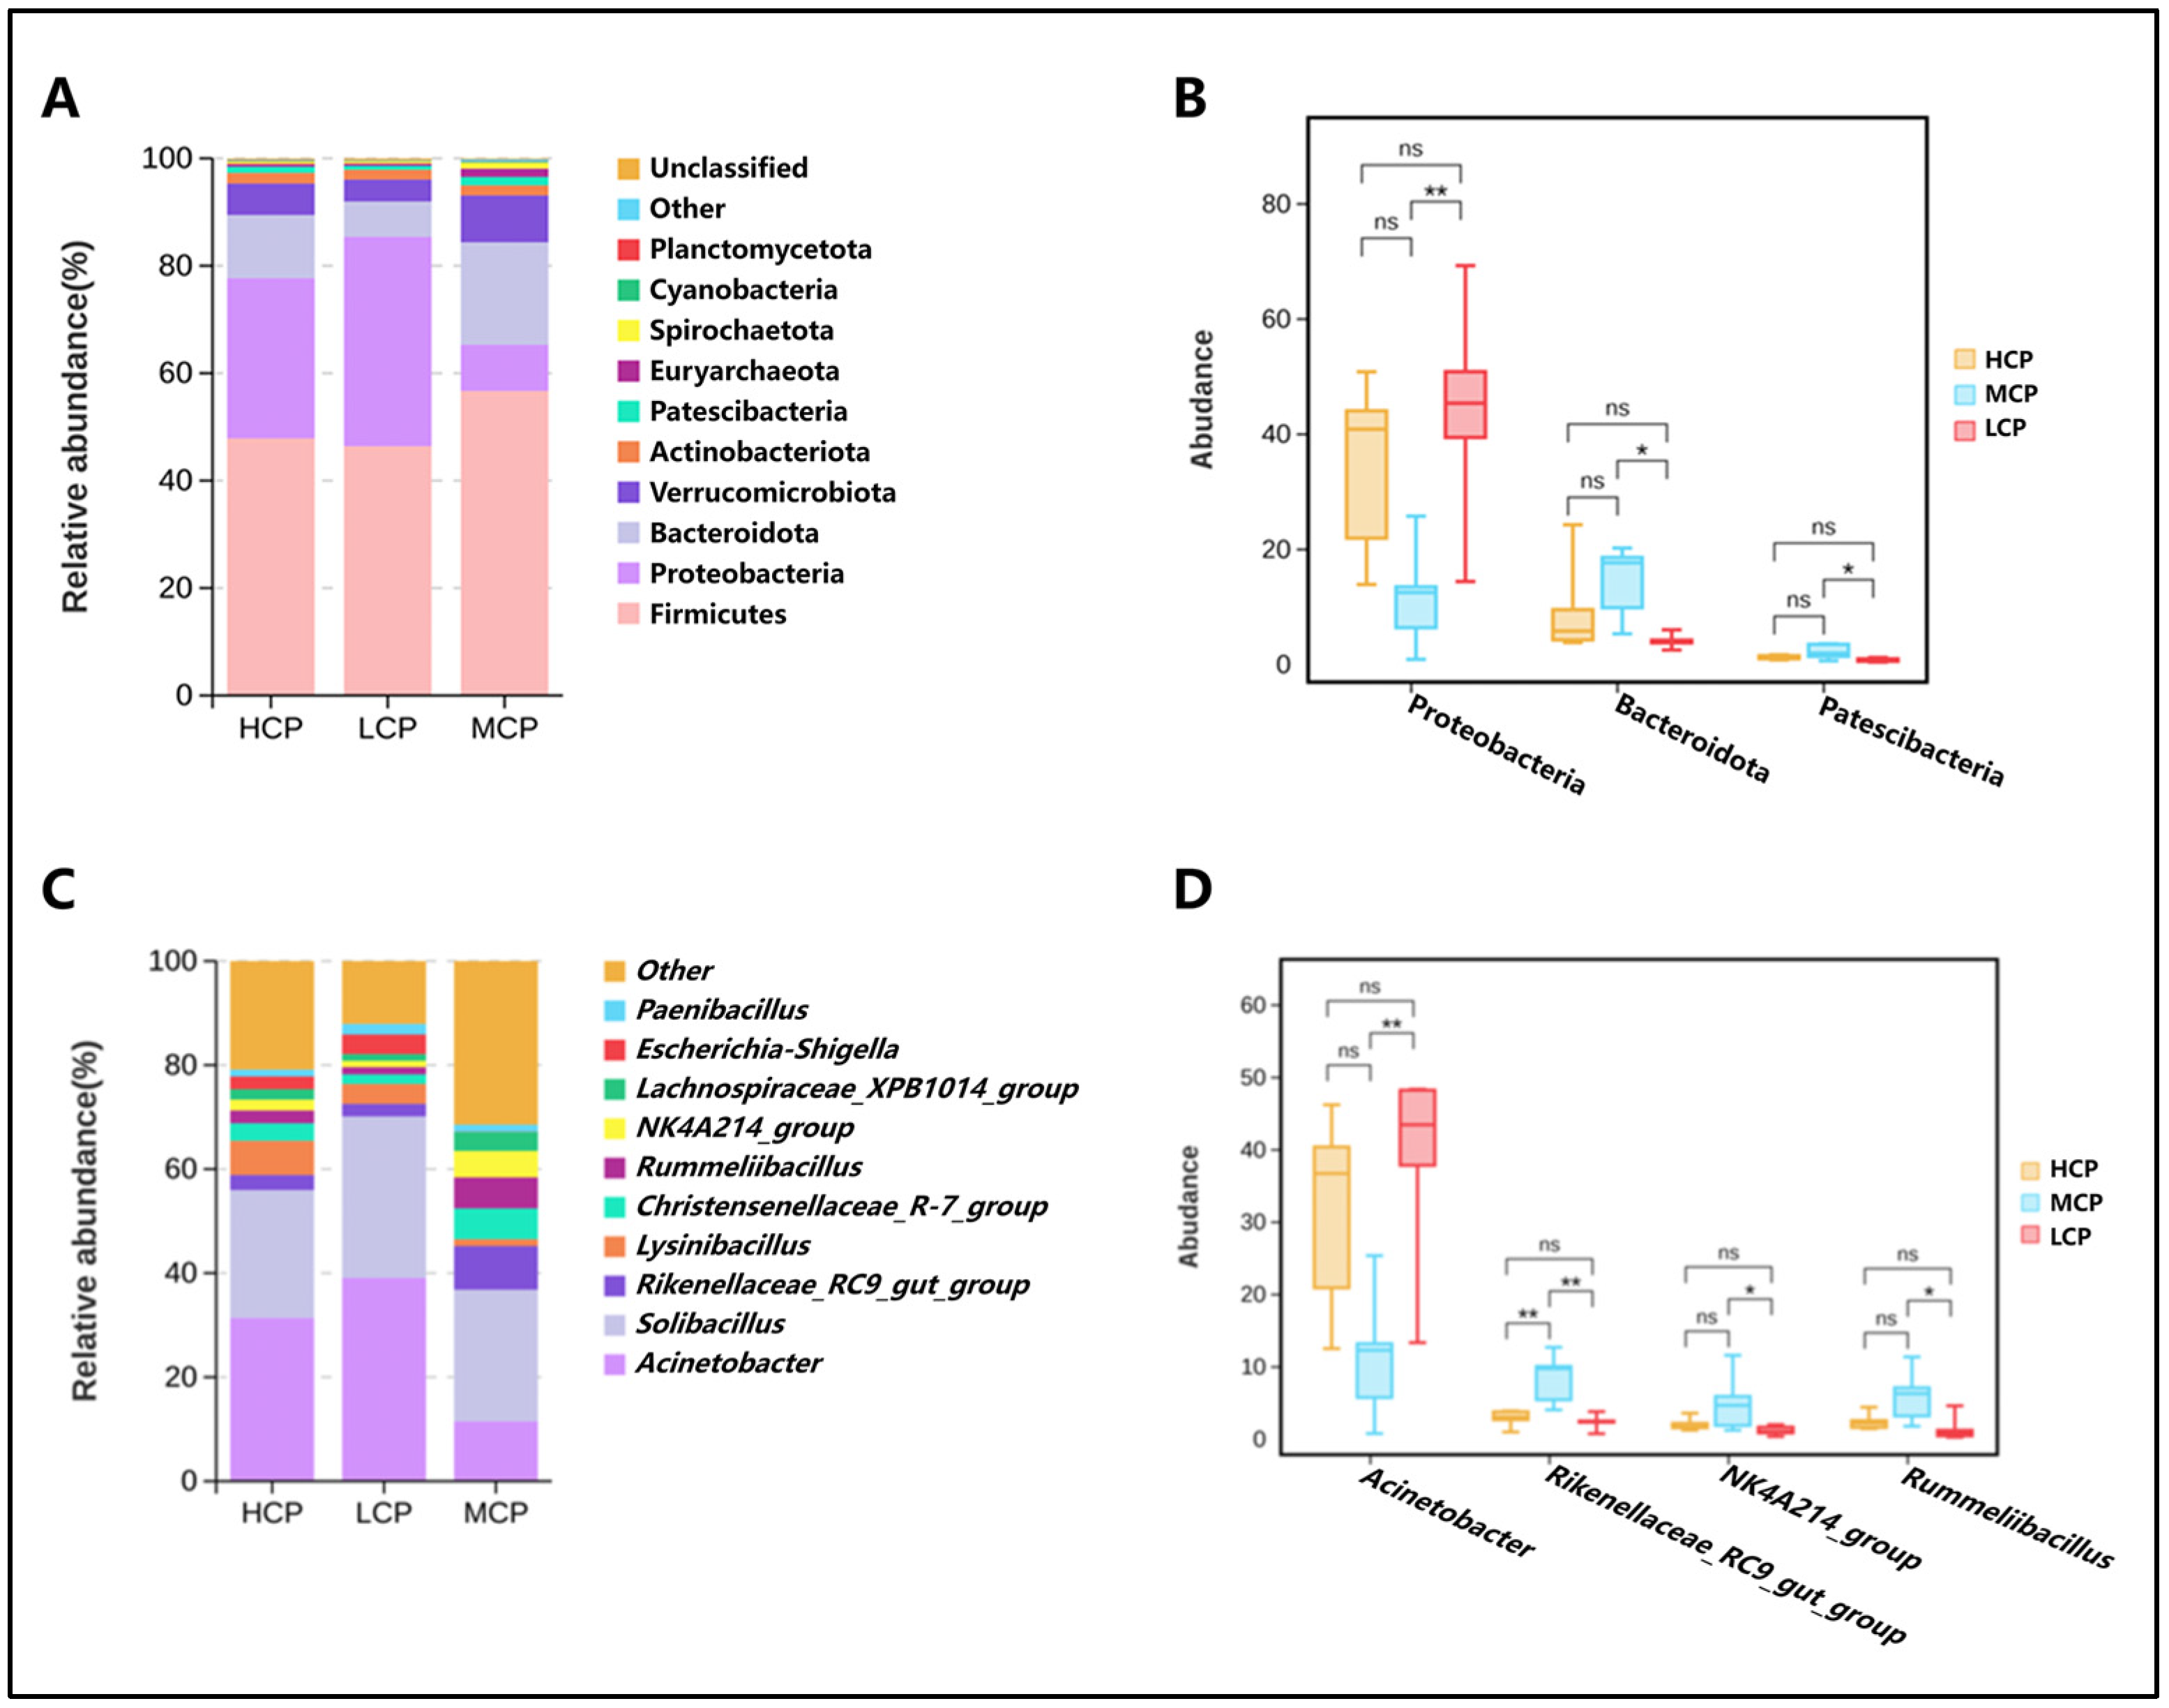
Phylum-level analysis (Figure 8A) revealed that the fecal microbial community is predominantly composed of Firmicutes and Bacteroidetes, which together account for 80% to 90% of the total microbiota. Additionally, Proteobacteria and Actinobacteria are present in minor proportions. The abundance of Proteobacteria in the HCP group was significantly higher than that in the MCP and LCP groups (p < 0.01), while no significant difference was observed between the MCP and LCP groups (p > 0.05). The LCP group exhibited the highest proportion of Bacteroidetes (38%), which was significantly higher than that in both the HCP and MCP groups (p < 0.05). The abundance of Patescibacteria in the MCP group was significantly higher than that in the LCP group (p < 0.05), with no significant difference in abundance between the MCP and HCP groups (p > 0.05) (Figure 8B).
Figure 8.
Characteristics of fecal microbiota at the phylum and genus levels (FDR correction, p < 0.05). (A) The relative abundance of fecal microbiota at the phylum level in the HCP, LCP, and MCP groups. (B) Box plots showing the abundance differences in three key phyla (Proteobacteria, Bacteroidota, Patescibacteria) among the HCP, MCP, and LCP groups. ns: not significant, * p < 0.05, ** p < 0.01. (C) The relative abundance of fecal microbiota at the genus level in the HCP, LCP, and MCP groups. (D) Box plots showing the abundance differences in four representative genera (Acinetobacter, Rikenellaceae_RC9_gut_group, NK4A214_group, Rummeliibacillus) among the HCP, MCP, and LCP groups, * p < 0.05, ** p < 0.01.
Genus-level analysis (Figure 8C) indicated that Prevotella and Ruminococcus are the dominant genera, collectively accounting for 30% to 40% of the total microbiota. The LCP group showed a significantly higher abundance of Acinetobacter compared to the MCP and HCP groups (p < 0.01), with no significant difference observed between the MCP and HCP groups (p > 0.05). The MCP group exhibited a significantly higher abundance of Rikenellaceae_RC9_gut_group compared to both the LCP and HCP groups (p < 0.01), while no significant difference was found between the HCP and LCP groups (p > 0.05). The LCP group had the lowest abundance of Rummeliibacillus, which was significantly lower than that in the MCP group (p < 0.05), with no significant difference compared to the HCP group (p > 0.05). Similarly, the LCP group had the lowest abundance of NK4A214_group, significantly lower than that in the MCP group (p < 0.05), with no significant difference compared to the HCP group (p > 0.05) (Figure 8D).
3.11. LEfSe Analysis
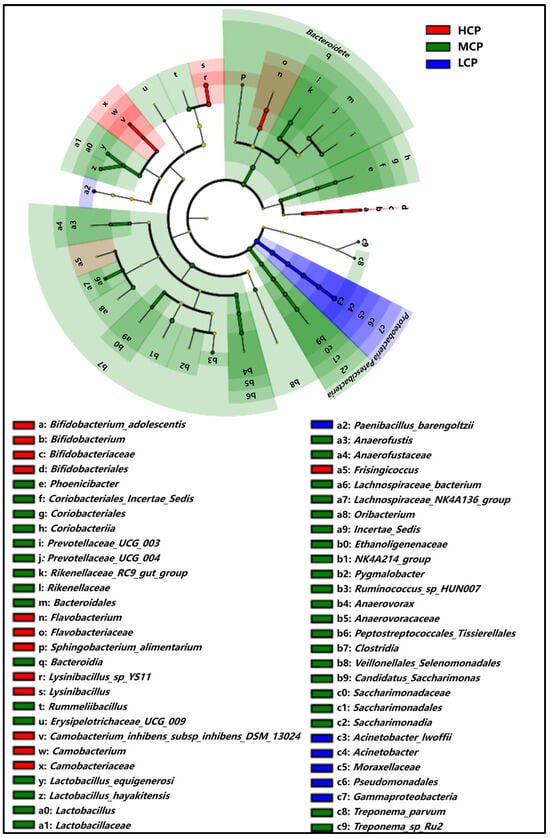
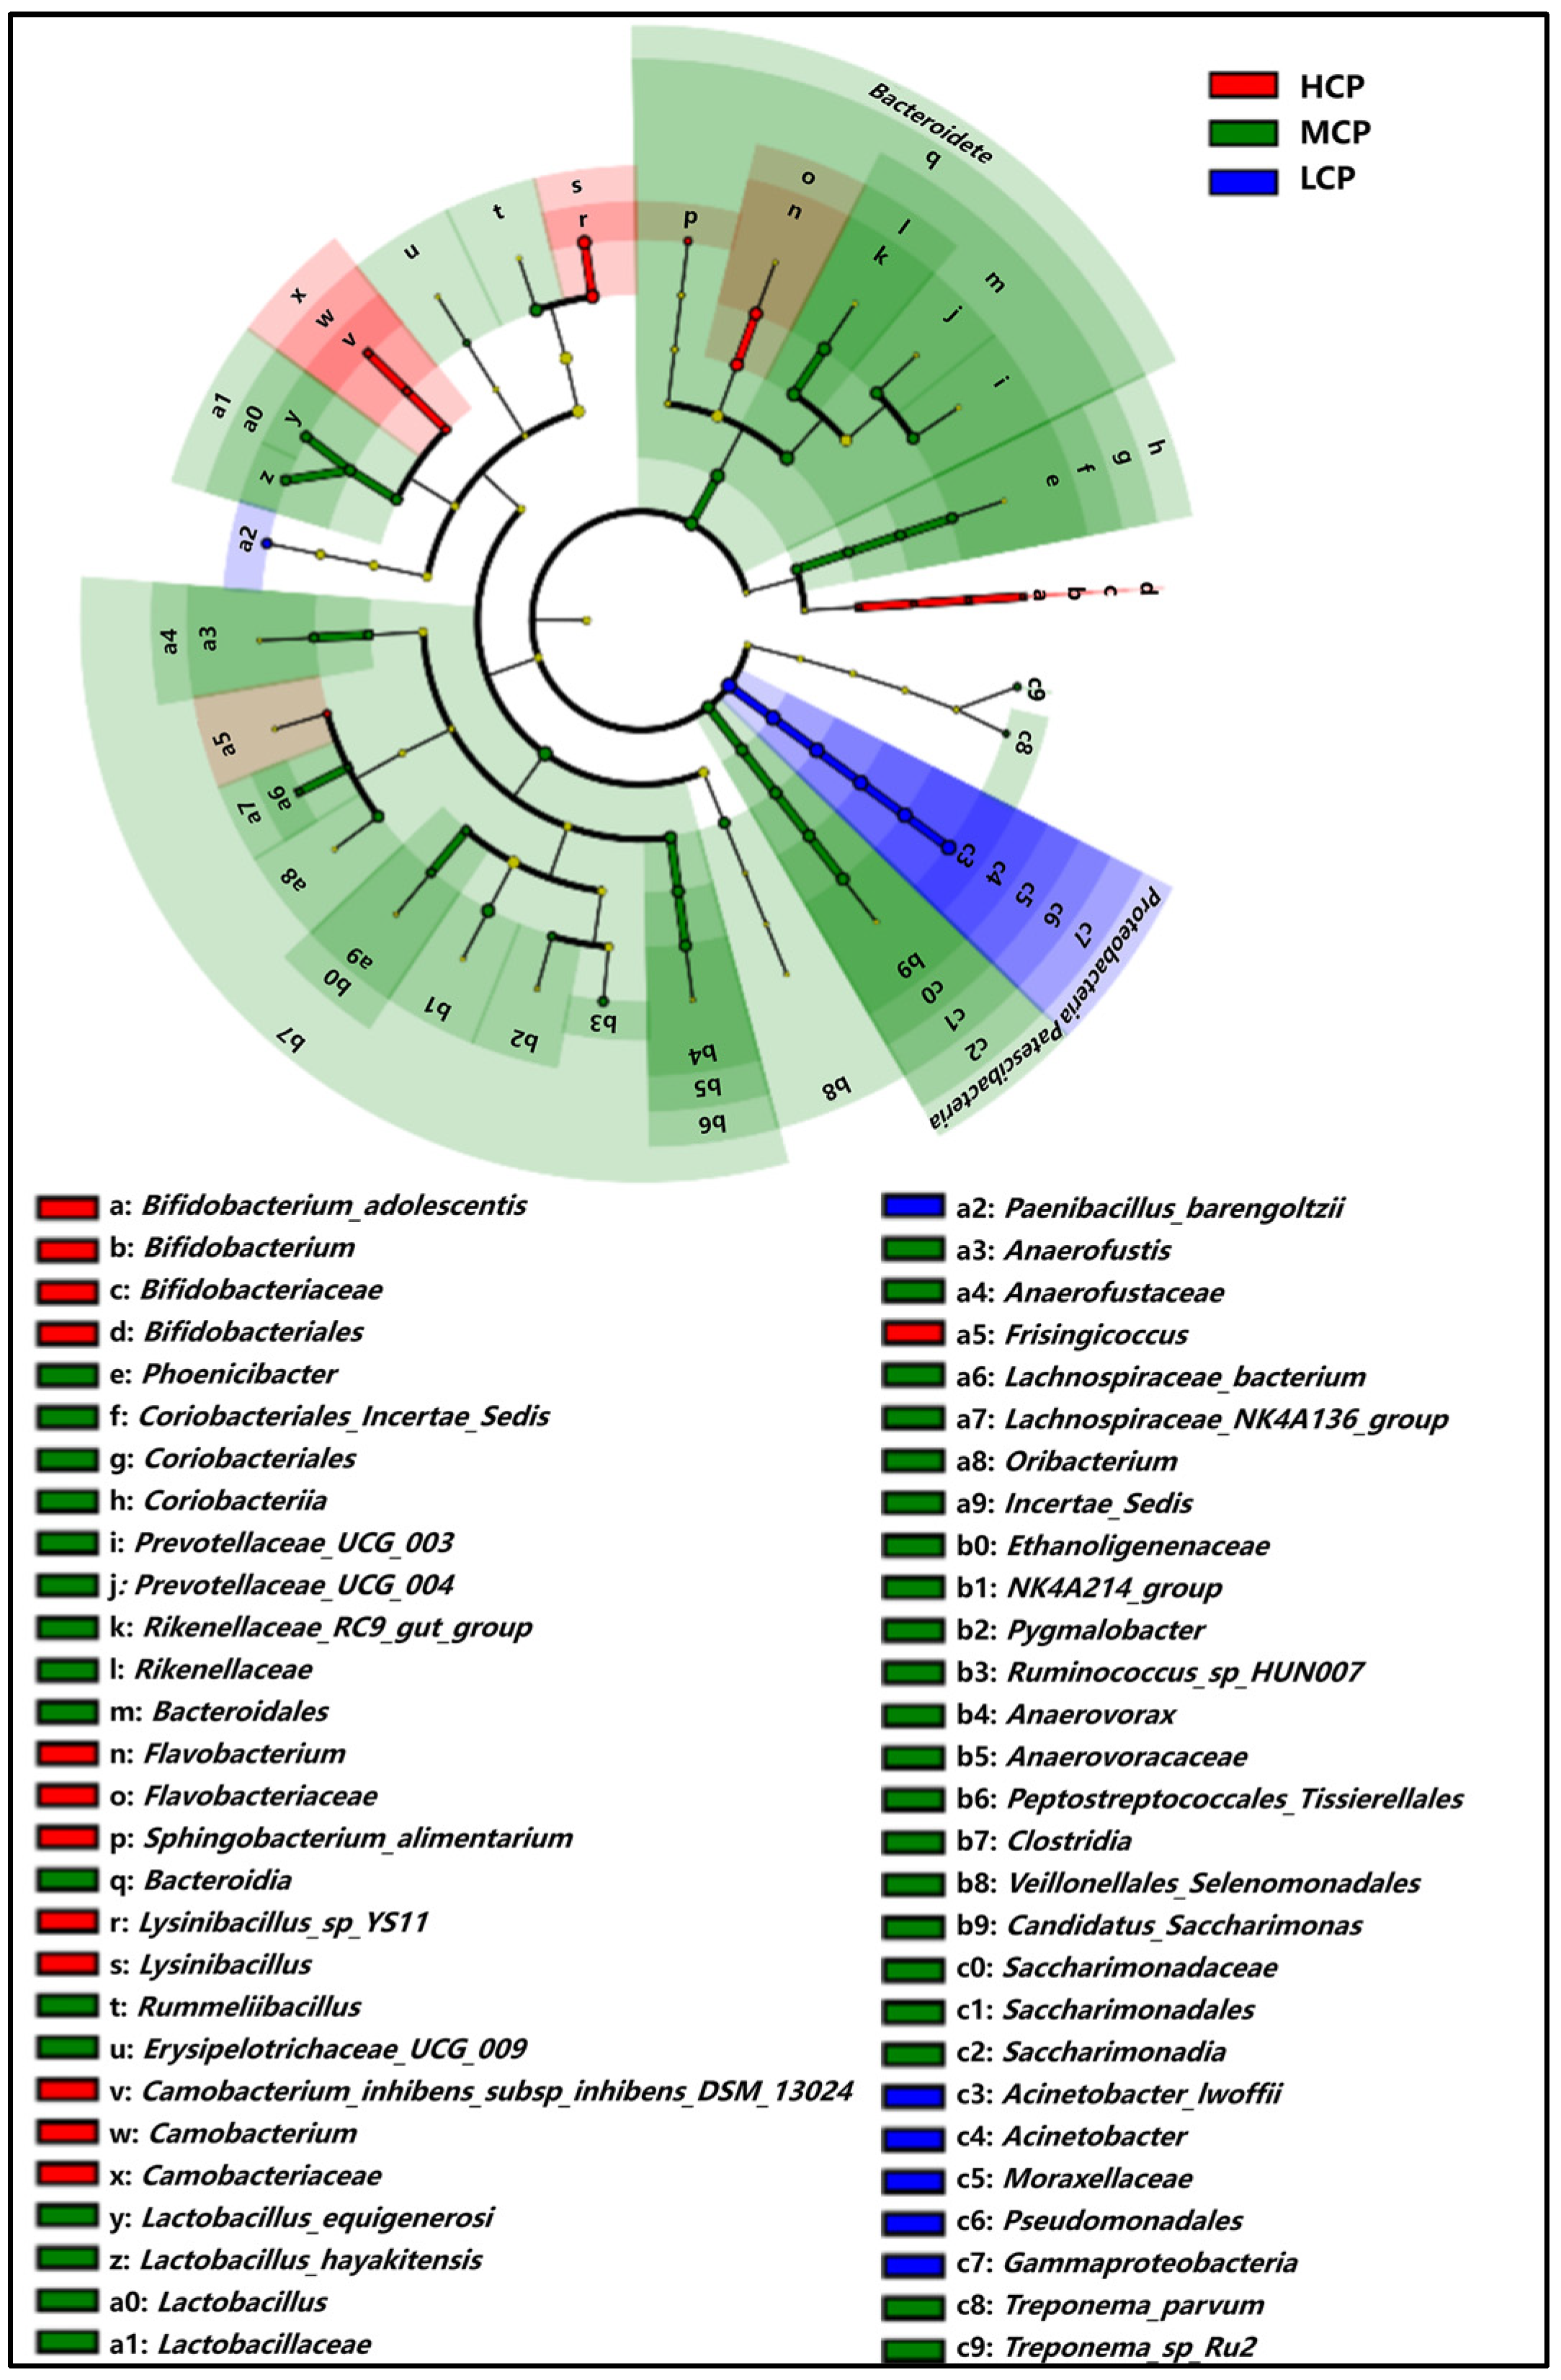
LEfSe analysis was employed to identify microbial taxa that exhibited significant differences among various treatment groups. By comparing the microbial compositions across different groups, this method enabled the discovery of a greater number of differential bacteria. A total of 59 taxa with significantly different abundances (LDA > 2, p < 0.05) were identified among the HCP group, MCP group, and LCP group. The HCP group showed significant enrichment of Clostridium (LDA = 3.8) and Enterococcus (LDA = 2.5). In the MCP group, Ruminococcus (LDA = 4.2) and Butyrivibrio (LDA = 3.5) were significantly enriched. The LCP group exhibited significant enrichment of Prevotella (LDA = 4.0) and Bacteroides (LDA = 3.2) (Figure 9).
Figure 9.
Cluster dendrogram of differential microbial taxa among different treatment groups based on LEfSe analysis. This cluster dendrogram, generated via LEfSe analysis, depicts significantly differential microbial taxa across the HCP, MCP, and LCP treatment groups, with colors (red, green, blue) denoting each group. It displays the hierarchical microbial taxonomy, where nodes represent taxa and small circles on nodes signify significant differences, with circle-branch colors matching treatment groups. The right-side legend lists microbial taxon names, aiding node interpretation.
3.12. Fecal Microbial Function Prediction
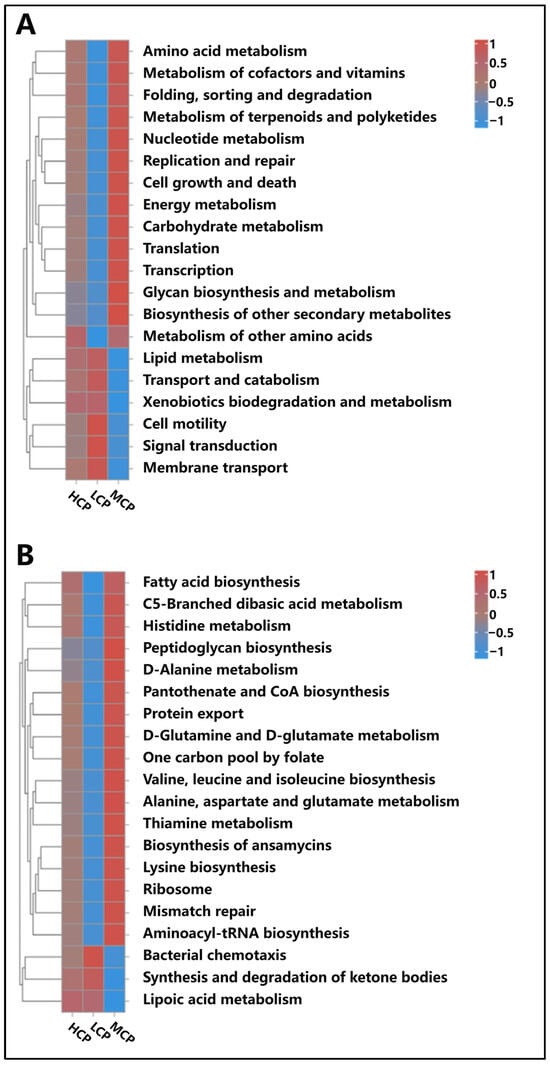
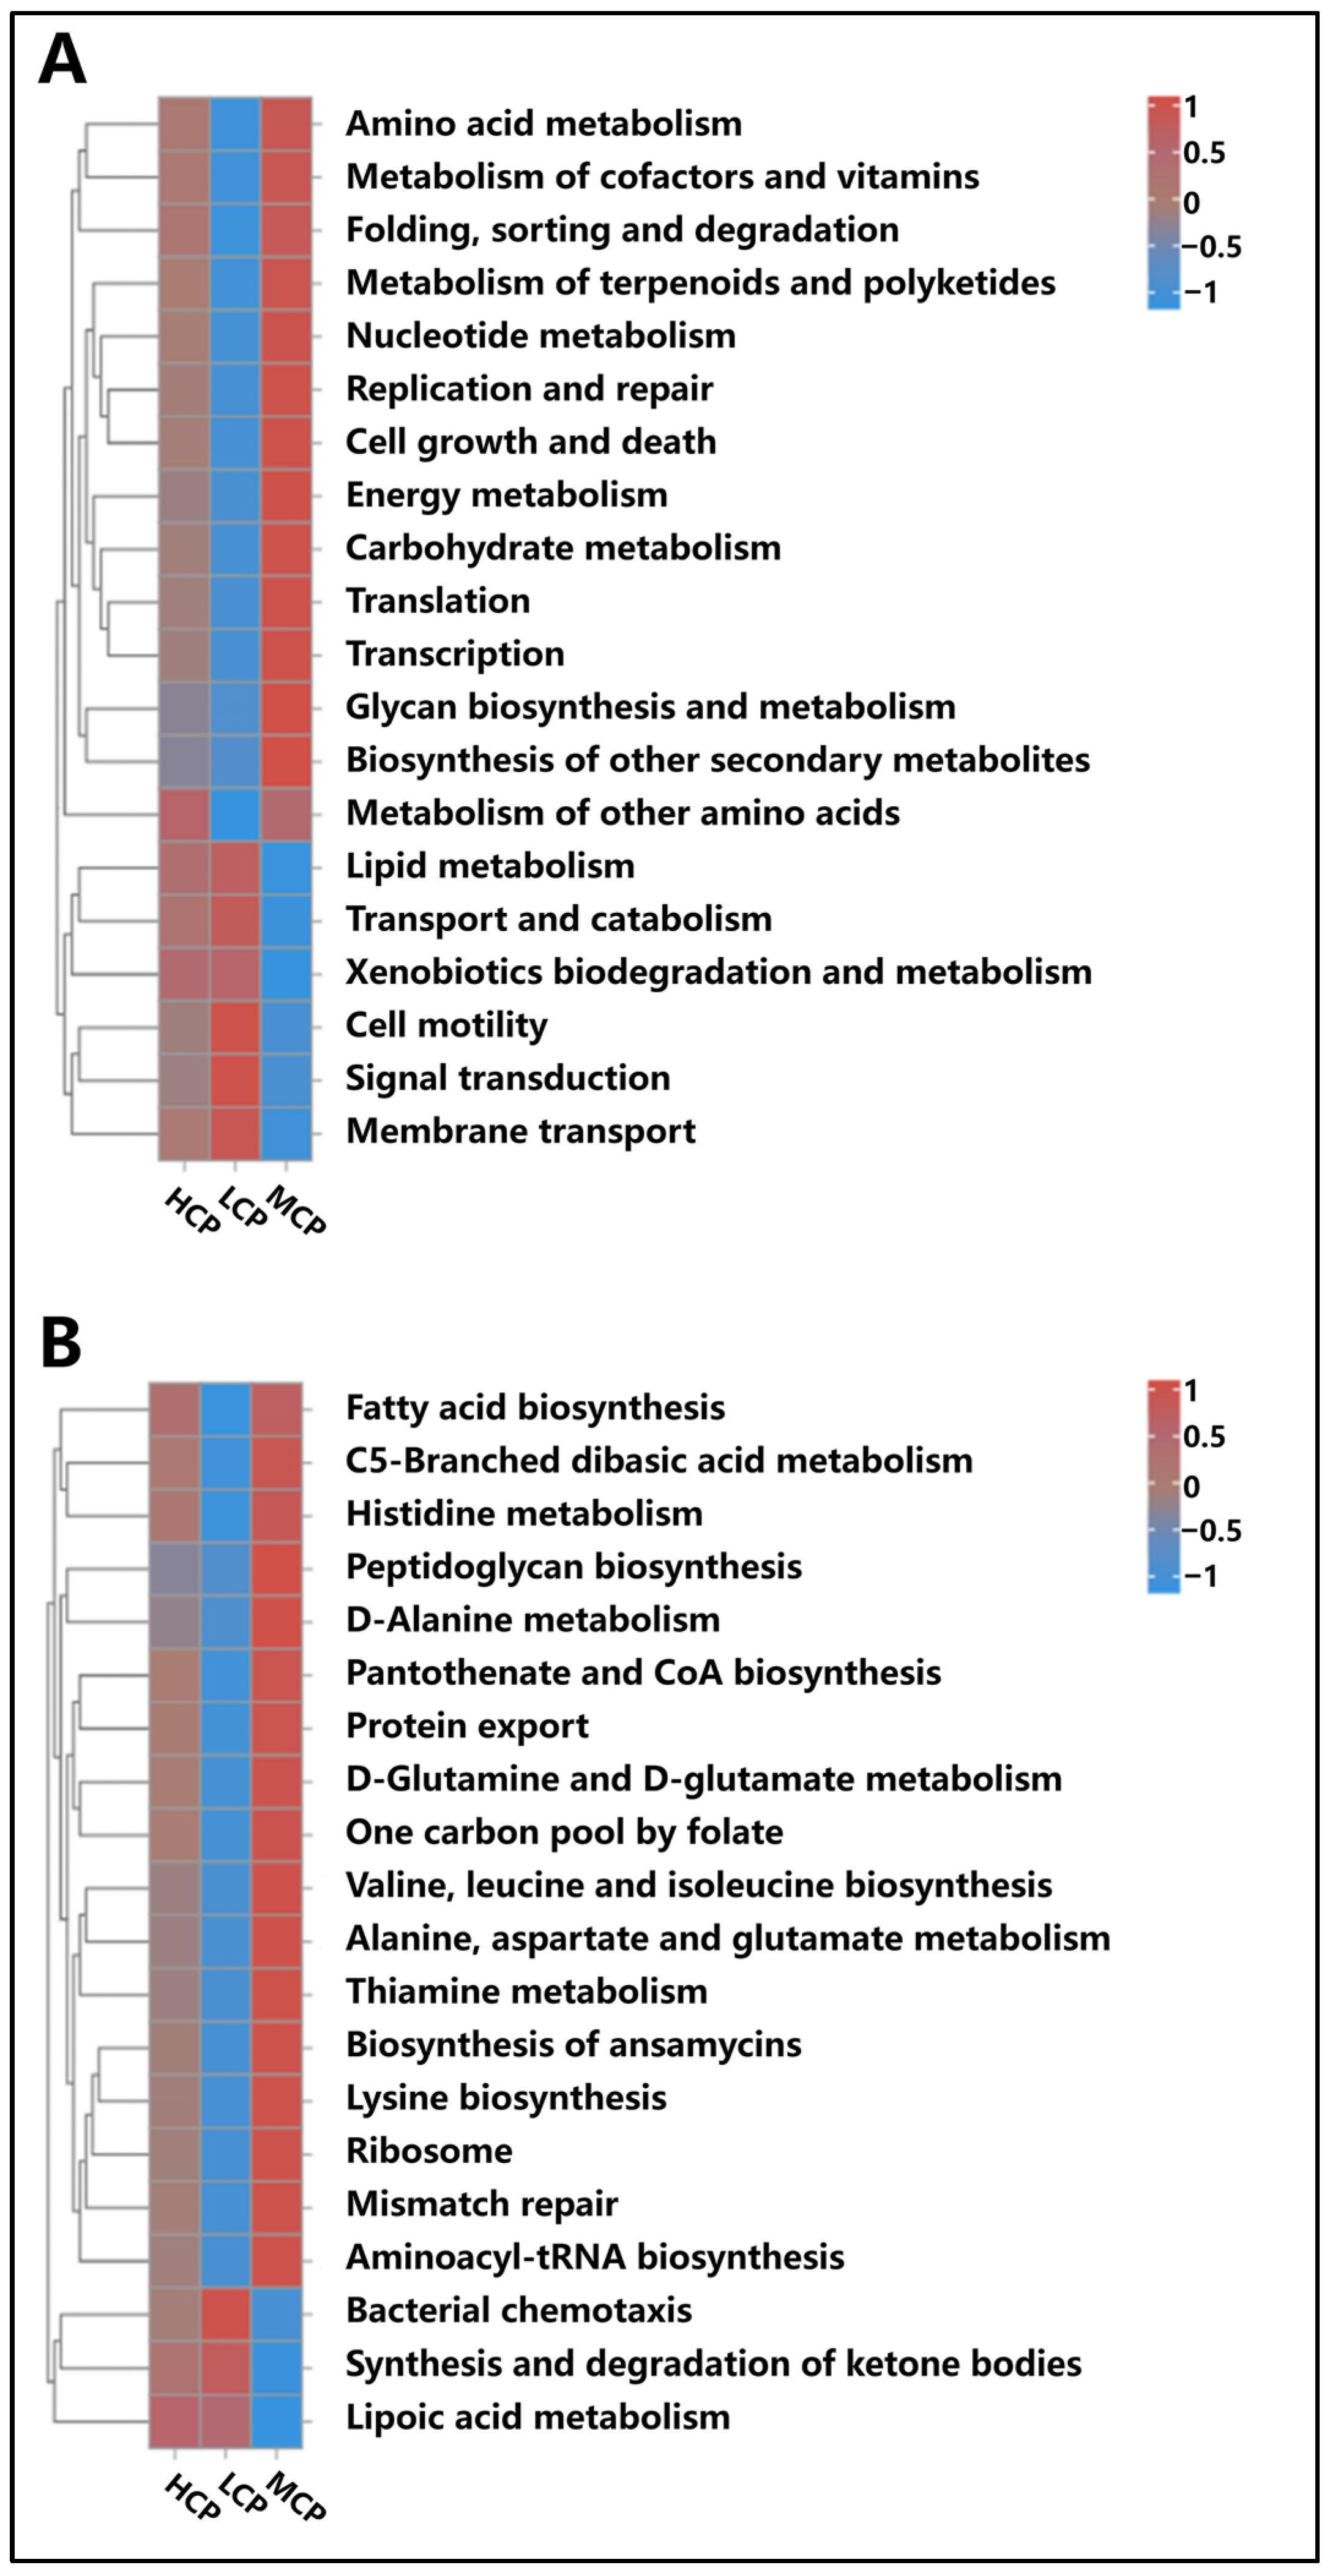
PICRUSt was employed to predict the functions of fecal microbiota in mares during the late gestation period across three groups. The second level reflects the overall direction of metabolic functions, while the third level represents specific biochemical pathways or molecular mechanisms. Based on KEGG pathway predictions, at the second level, pathways related to proteins include energy metabolism, amino acid metabolism, biosynthesis and metabolism of carbohydrates, transcription, and translation. The HCP and MCP groups exhibited upregulation in pathways such as energy metabolism, amino acid metabolism, biosynthesis and translation of carbohydrates, transcription, and metabolism of cofactors and vitamins, whereas the LCP group showed the opposite pattern (Figure 10A).
Figure 10.
Relative enrichment of KEGG pathways in fecal microbiota of mares in late gestation (FDR correction, p < 0.05). (A) Relative enrichment of KEGG secondary pathways in fecal microbiota of mares in late gestation. (B) Relative enrichment of KEGG third-level pathways in fecal microbiota of mares in late gestation.
At the third level, protein-related pathways encompass fatty acid biosynthesis; ribosome biosynthesis; aminoacyl-tRNA biosynthesis; histidine metabolism; alanine, aspartate, and glutamate metabolism; valine, leucine, and isoleucine biosynthesis; and protein export, totaling seven pathways. The HCP and MCP groups demonstrated upregulation in these pathways, while the LCP group displayed the opposite trend (Figure 10B).
3.13. Metabolite PCA and Differential Metabolite Analysis
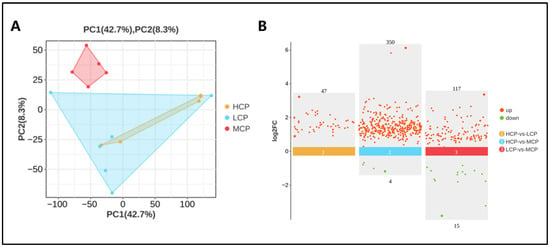
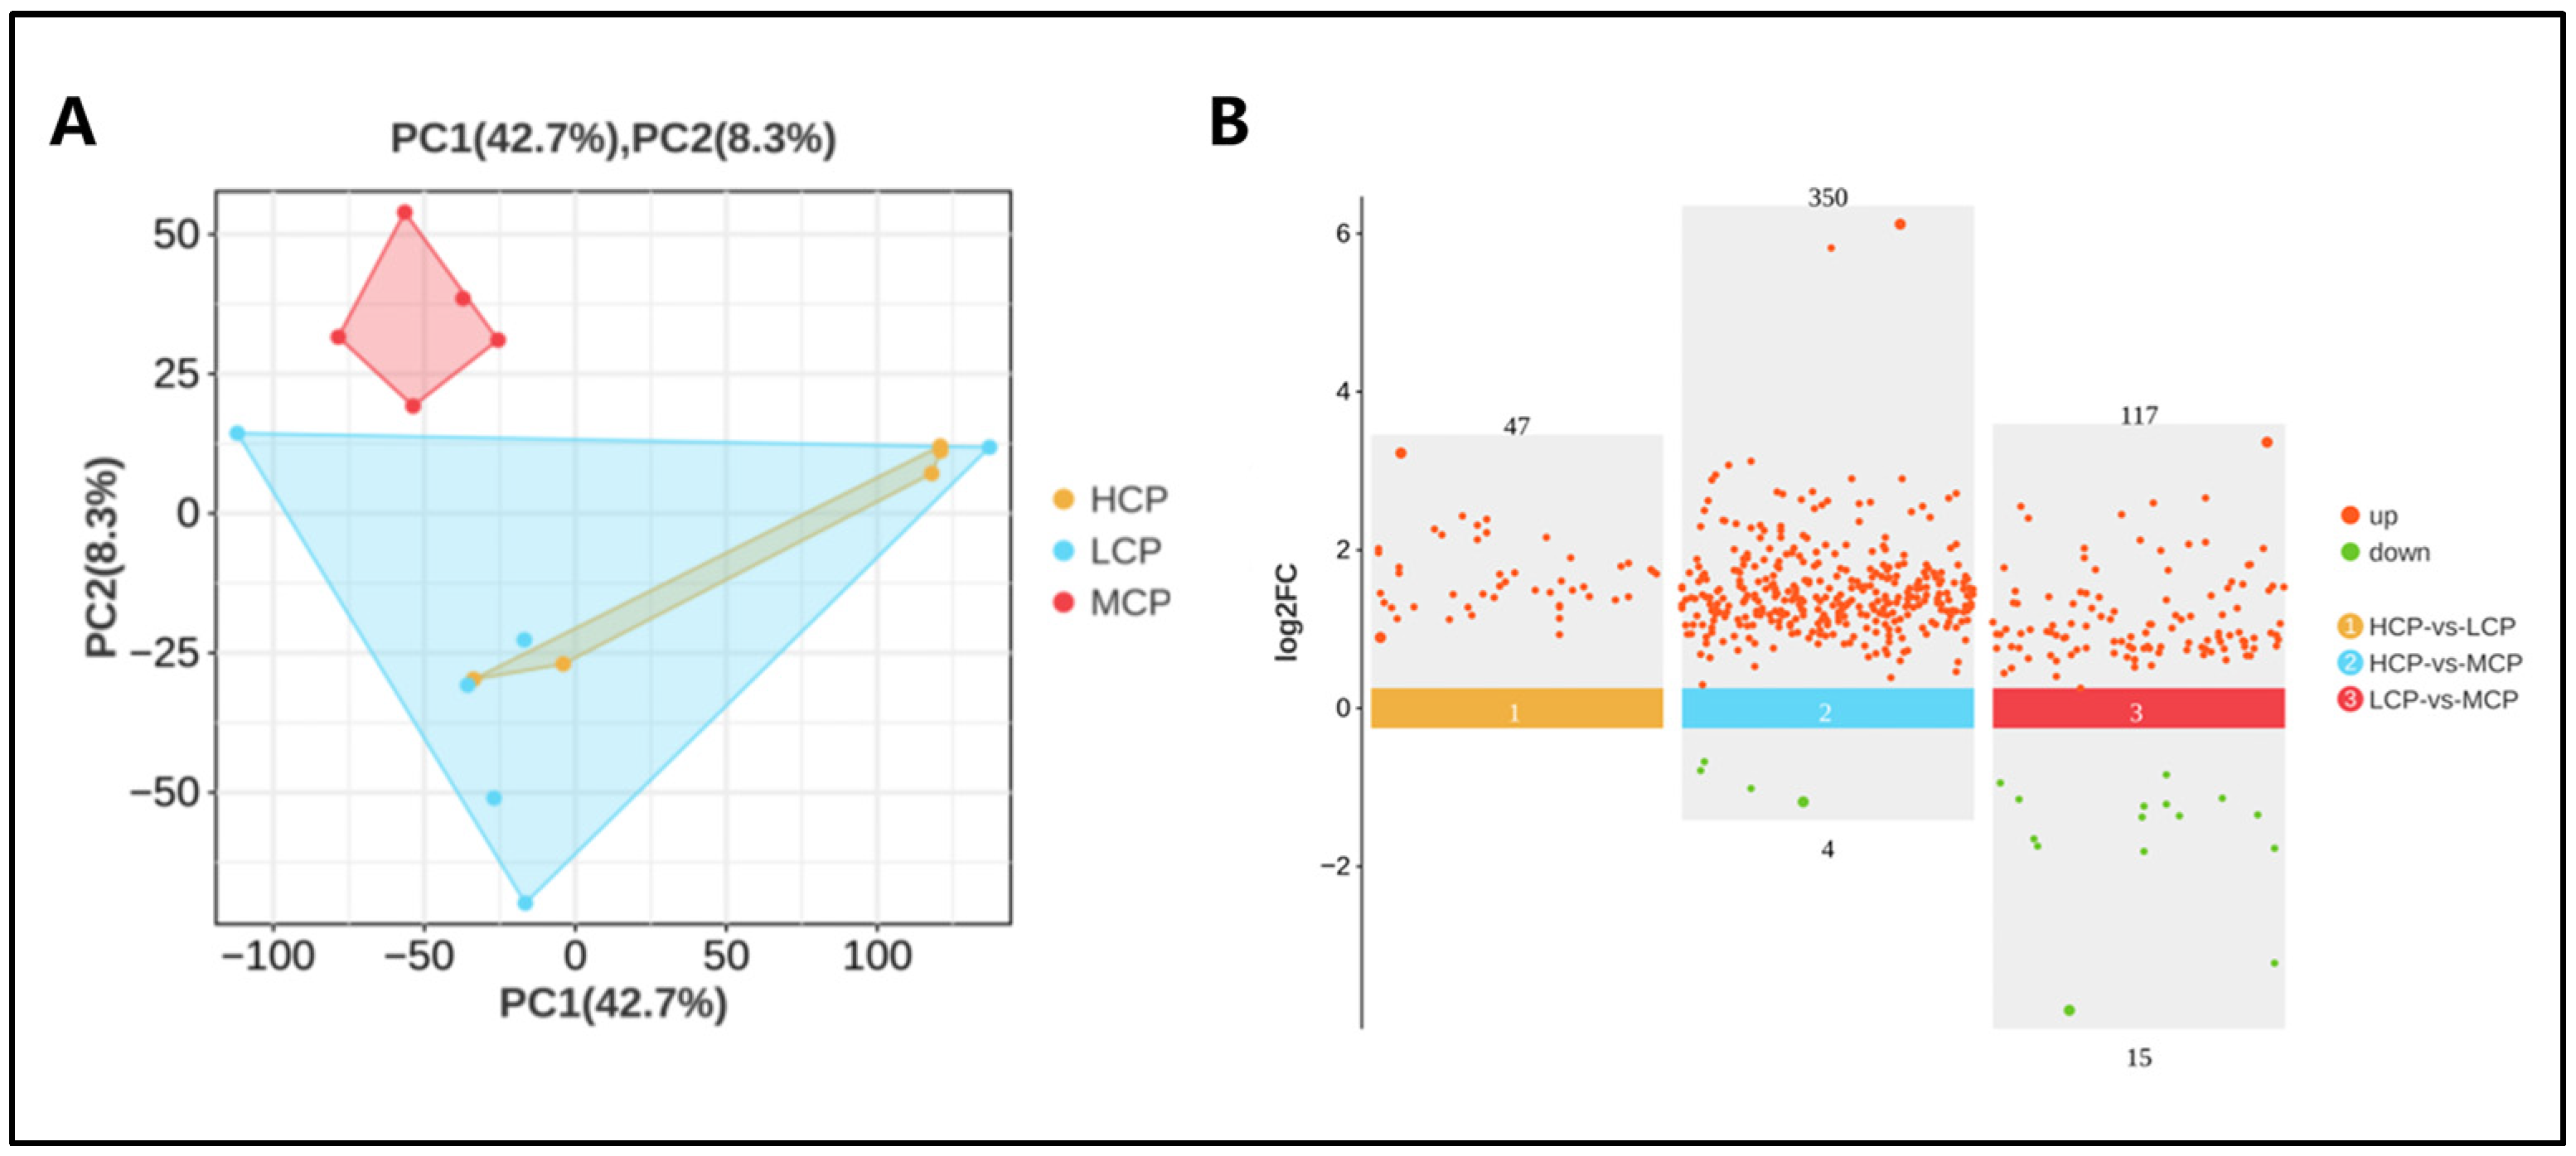
According to the PCA (Principal Component Analysis), samples from the HCP, MCP, and LCP groups exhibited a certain degree of separation in the principal component space. Notably, the MCP group showed a clear separation, indicating that supplementing with protein-rich complementary feed had a significant overall impact on the intestinal metabolome of the mares. In contrast, there was no clear separation between the HCP and LCP groups (Figure 11A).
Figure 11.
Comprehensive analysis of metabolite profiles in different treatment groups. (A) Principal component analysis of fecal metabolites. This panel presents a PCA plot based on metabolite data from the HCP (represented by orange points), LCP (represented by blue points), and MCP (represented by red points) groups. (B) Scatter plot of differences among groups. This panel displays three scatter plots for pairwise comparisons of differential metabolites among the HCP, MCP, and LCP groups. Each point in the scatter plots represents a metabolite. The x-axis does not have a specific label in the context of this description as it is mainly for visual separation of different comparison pairs, and the y-axis represents the log2-fold change (log2FC) of the metabolite expression. In each sub-plot, red points indicate upregulated metabolites, and green points indicate downregulated metabolites. The horizontal colored bars (orange for HCP vs. LCP, blue for HCP vs. MCP, and red for LCP vs. MCP) mark the threshold for significant differential expression.
The differential scatter plots of the three groups revealed that a total of 533 differential metabolites were identified in the comparison of HCP relative to LCP, with 47 metabolites upregulated in HCP vs. LCP. In the comparison of HCP relative to MCP, 354 differential metabolites were identified, including 350 metabolites upregulated in HCP vs. MCP and 4 metabolites downregulated in HCP vs. MCP. When comparing MCP relative to LCP, 132 differential metabolites were identified, comprising 117 metabolites upregulated in MCP vs. LCP and 15 metabolites downregulated in MCP vs. LCP (Figure 11B).
3.14. KEGG Pathway Enrichment Analysis of Differential Metabolites
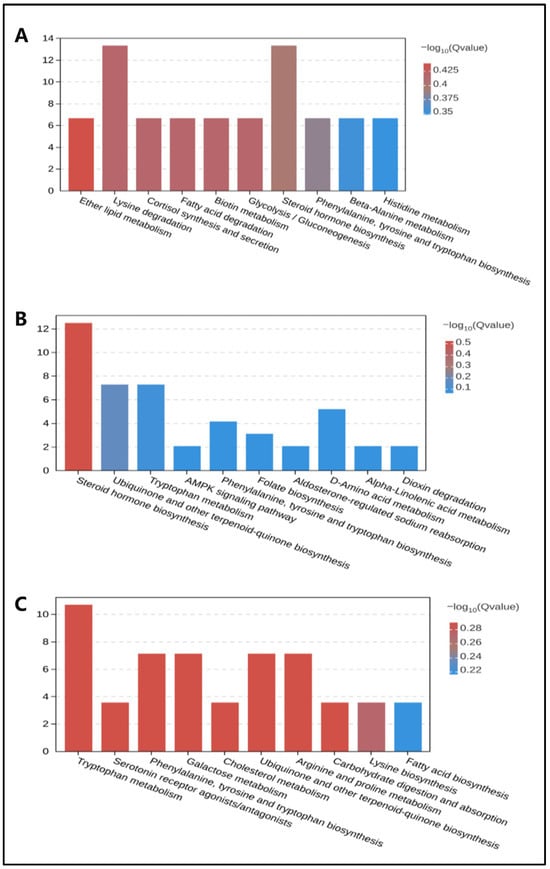
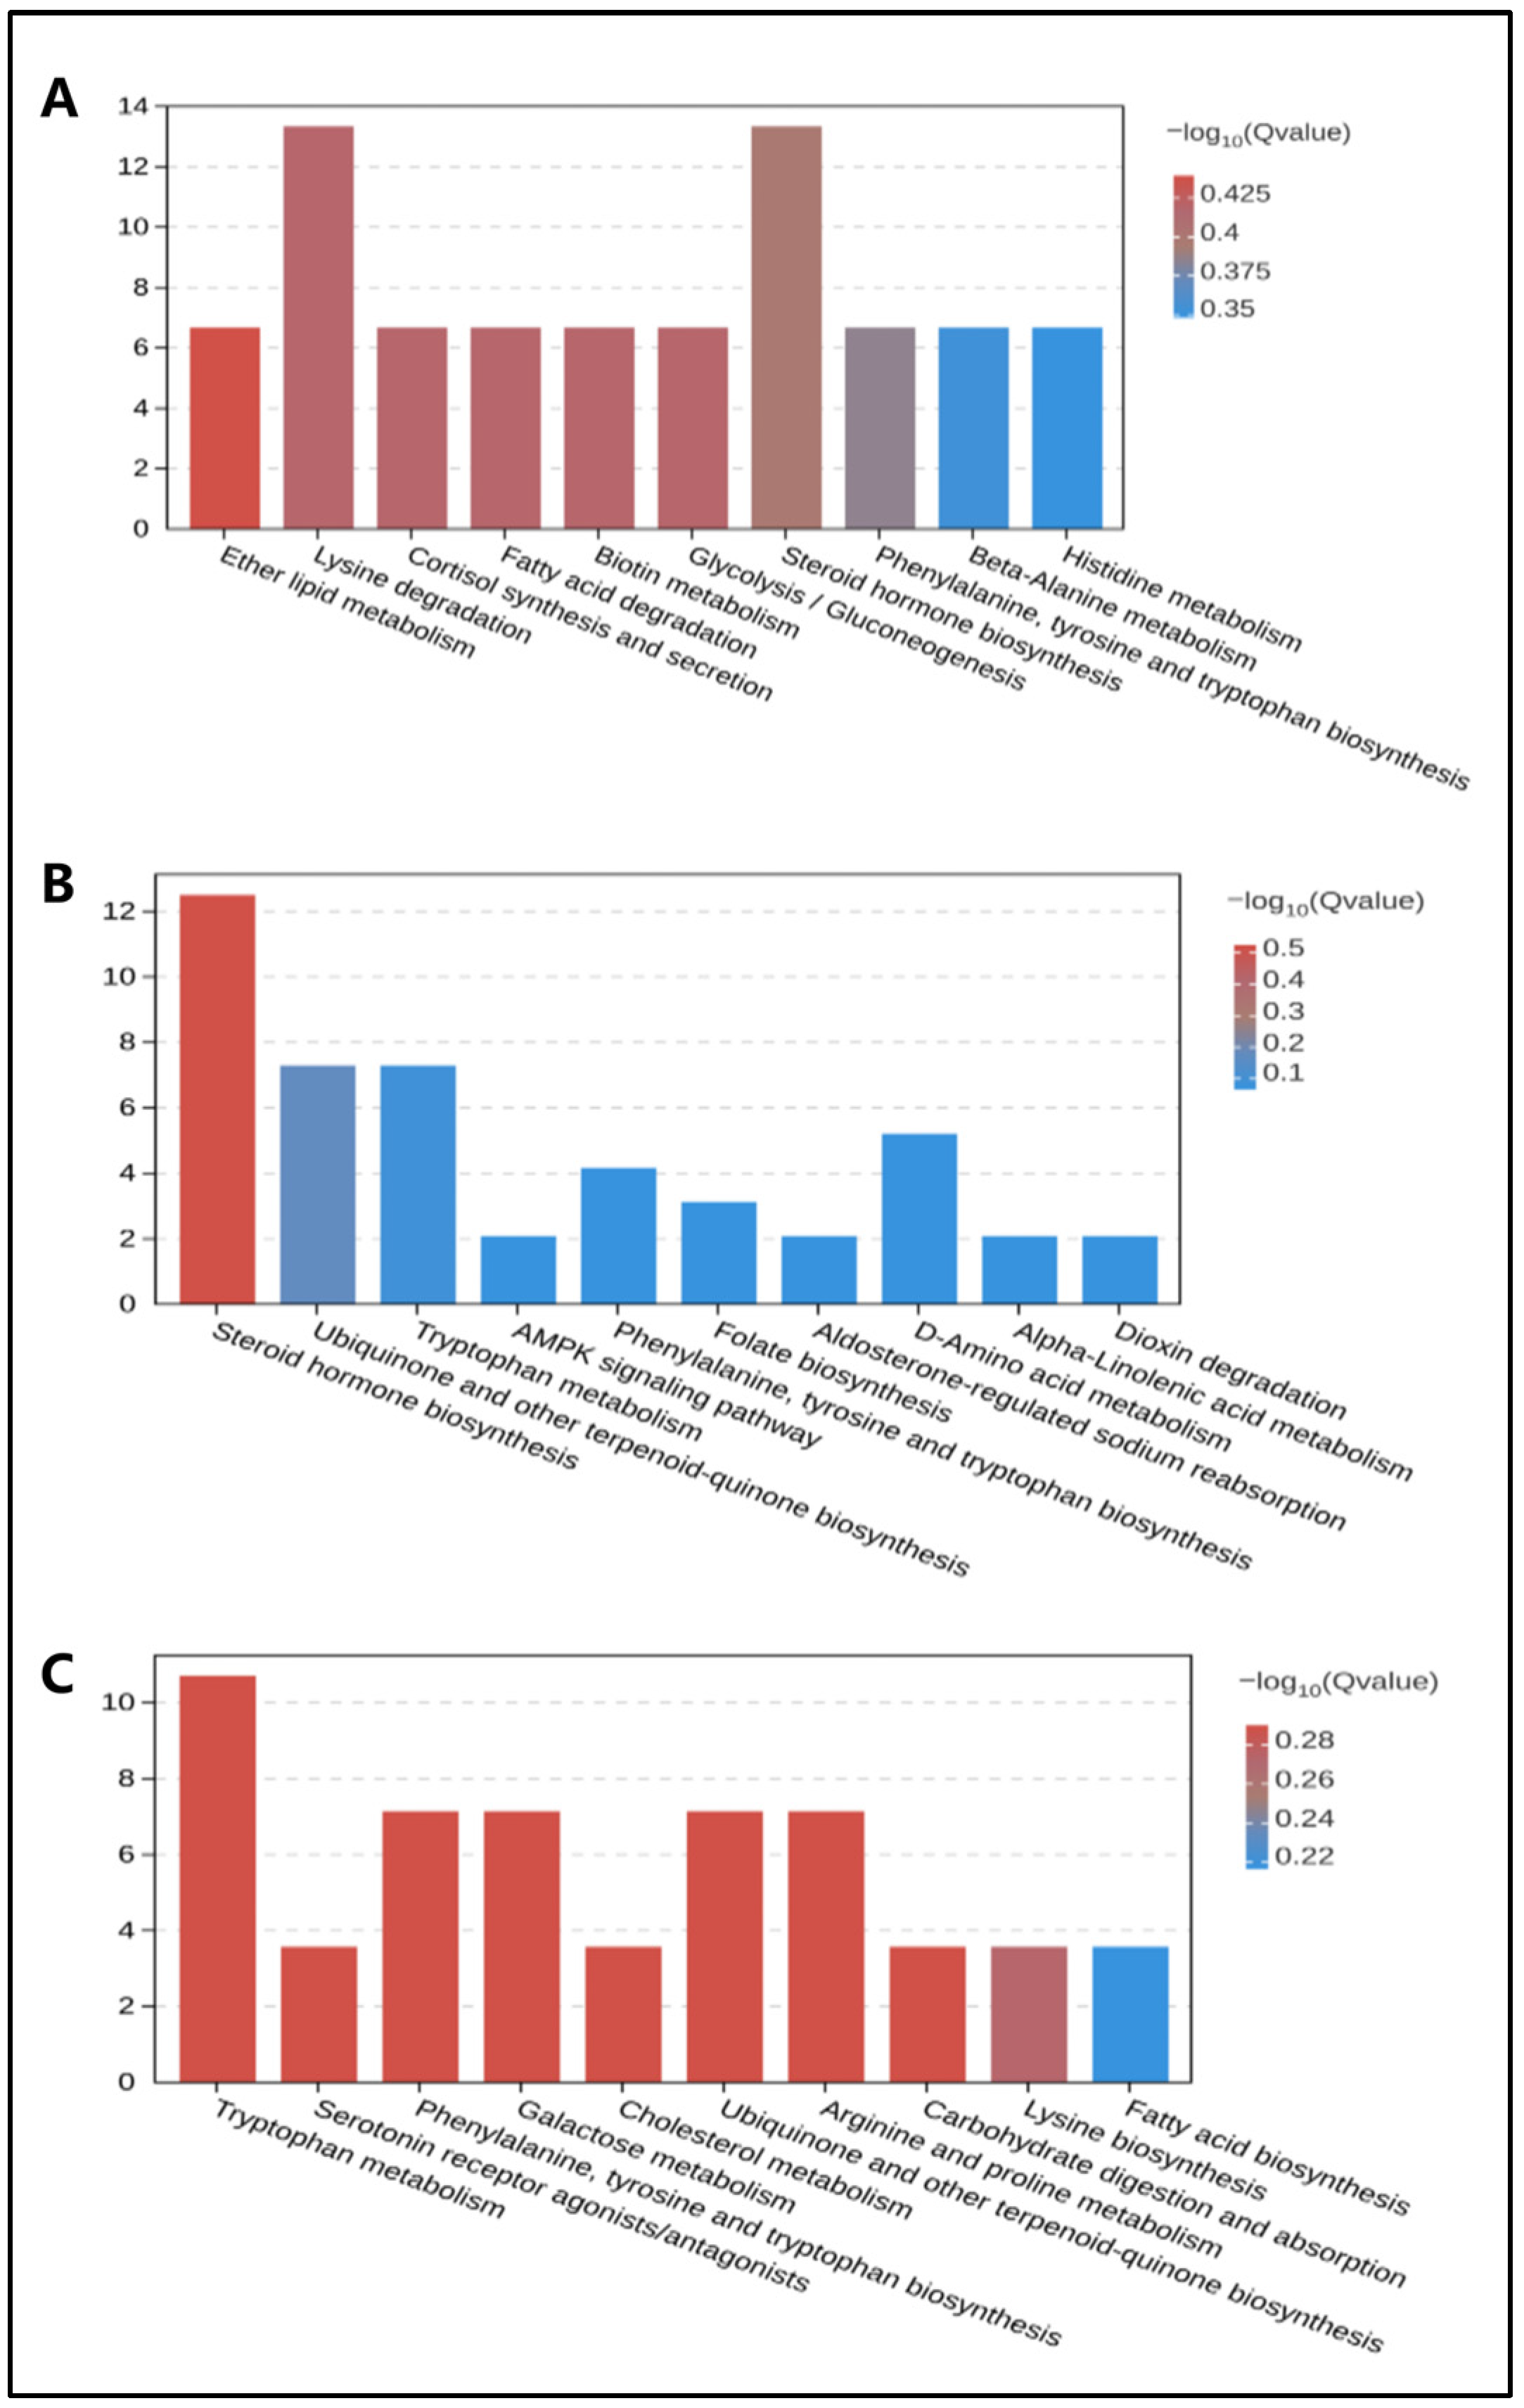
KEGG enrichment analysis was performed separately for each pairwise group comparison, using the differential metabolites identified in each respective comparison. Specifically, enrichment analysis was conducted on the 533 differential metabolites from the HCP vs. LCP comparison, 354 differential metabolites from the HCP vs. MCP comparison, and 132 differential metabolites from the MCP vs. LCP comparison. The top 10 significantly enriched signaling pathways (p < 0.05) were selected for each comparison (Figure 12). Specifically, in the comparison between the HCP group and the LCP group, the protein-related pathways included lysine degradation, histidine metabolism, fatty acid degradation, and steroid hormone biosynthesis (Figure 12A). For the comparison between the HCP group and the MCP group, the protein-related pathways were the AMPK signaling pathway and D-Amino acid metabolism (Figure 12B). In the MCP group versus LCP group comparison, the protein-related pathways comprised lysine degradation, arginine and proline metabolism, and tryptophan metabolism (Figure 12C). Additionally, the biosynthesis of phenylalanine, tyrosine, and tryptophan was commonly enriched across all three group comparisons.
Figure 12.
KEGG enrichment analysis diagram (FDR correction, p < 0.05). (A) KEGG enrichment analysis diagram (HCP group vs. LCP group). KEGG pathways significantly enriched in differential metabolites between the HCP and LCP groups are shown on the X-axis. The Y-axis counts the number of differential metabolites mapped to each pathway. (B) KEGG enrichment analysis diagram (HCP group vs. MCP group). (C) KEGG enrichment analysis diagram (MCP group vs. LCP group).
3.15. Joint Analysis of Gut Microbiota and Metabolome
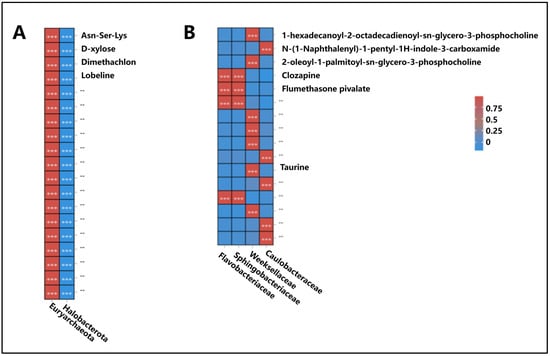
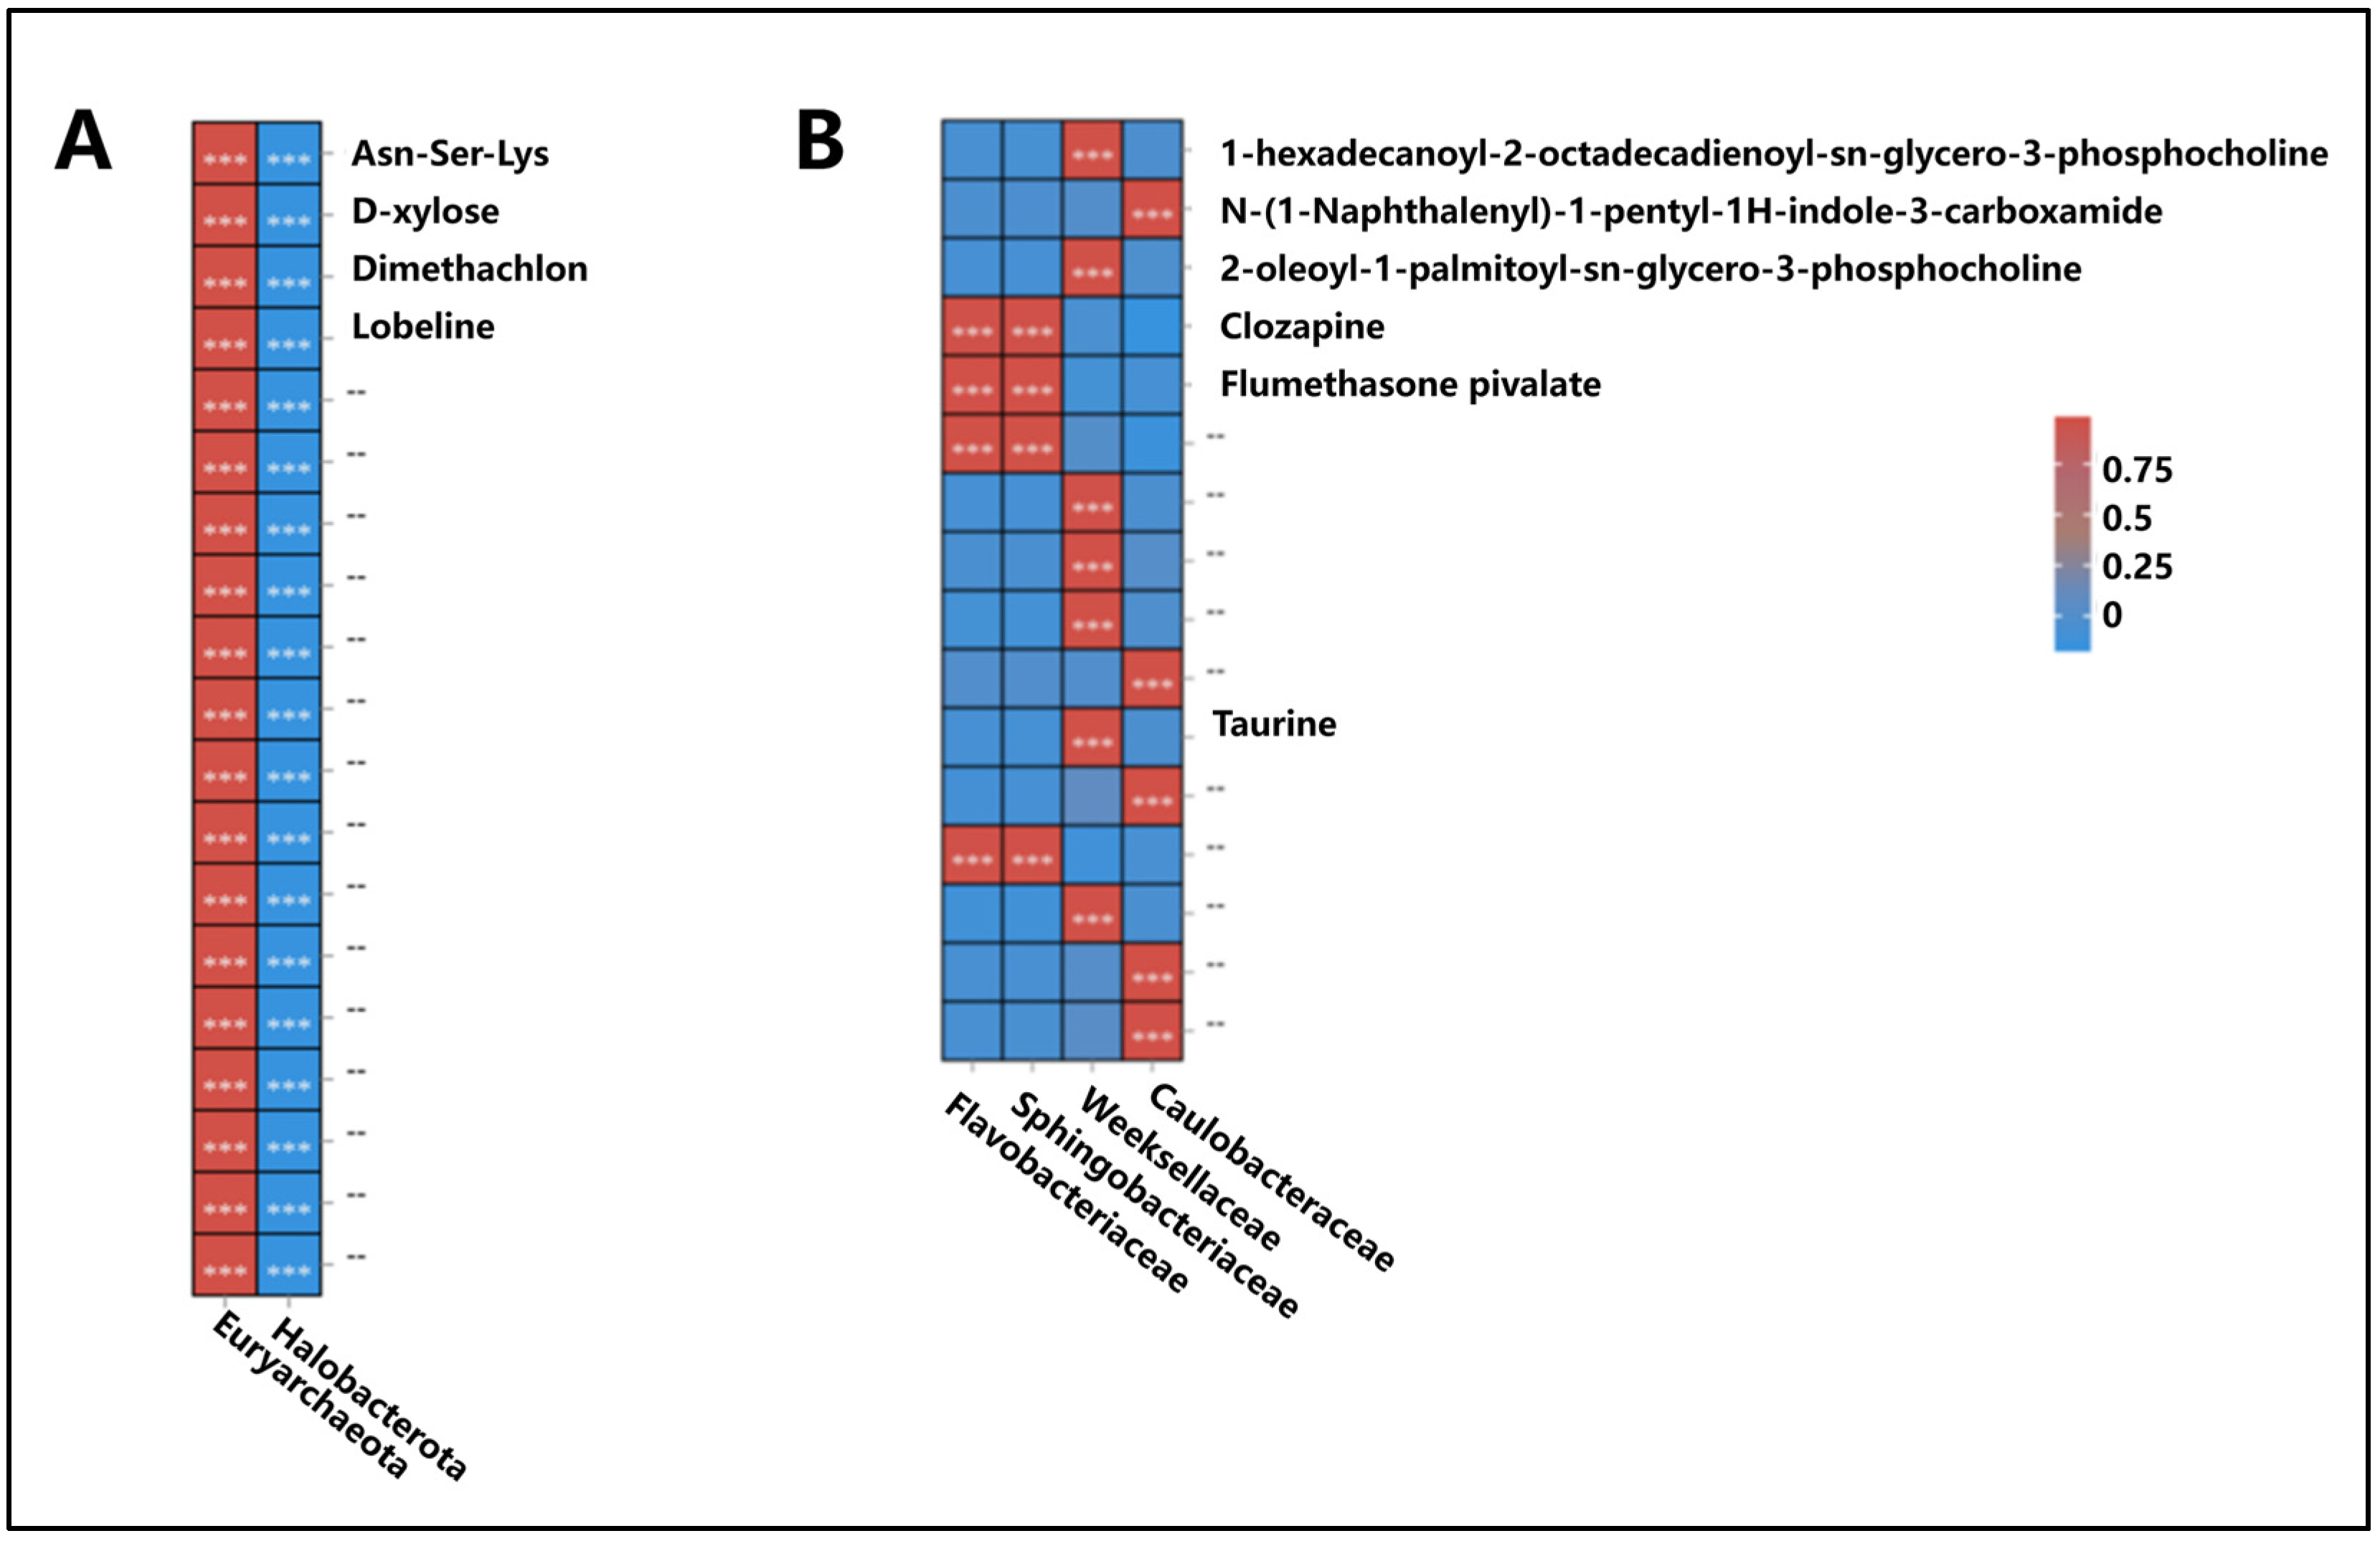
A metabolome–fecal microbiota correlation analysis revealed that Escherichia-Shigella was positively correlated with Asn-Ser-Lys, Dimethachion, Lobeline, and D-xylose, whereas Halobacterota showed negative correlations with the same metabolites (Figure 13A). At the genus level, Flavobacterium and Sphingobacterium were positively associated with Clozapine and Flumethasone pivalate, respectively (Figure 13B).
Figure 13.
Microbiota–metabolome correlation analysis diagram. “***” indicates a highly significant difference. (A) Spearman correlation heatmap at the phylum level between dominant fecal microbial phyla and key differential metabolites; (B) Spearman correlation heatmap at the genus level between dominant fecal microbial genera and key differential metabolites. Red blocks indicate significant positive correlations, blue blocks indicate significant negative correlations, and the color intensity represents the magnitude of the correlation coefficient. Only correlations with p < 0.05 are displayed.
4. Discussion
4.1. Effects of Complementary Feed with Different Protein Levels on Gestational Weight Gain and Nutrient Digestibility
Optimizing gestational weight gain is critical for fetal development and subsequent lactational performance [13,14,15]. Our findings suggest that a Medium-Crude-Protein (MCP) diet (12.04% CP) resulted in a more favorable final body weight, average daily gain (ADG), and feed-to-gain ratio (F:G) compared to both low-protein (LCP) and high-protein (HCP) diets. This suggests that the MCP level may support a balanced supply of amino acids for protein accretion without imposing the excessive metabolic cost associated with catabolizing surplus protein, as observed in the HCP group [16,17]. This aligns with the principle of “diminishing returns” in protein nutrition; while protein is essential for the exponential fetal growth in the last trimester, exceeding the requirement diverts energy toward urea synthesis and renal excretion rather than tissue deposition [8,18,19]. It should be noted that foal birth weights were not recorded in this study. Therefore, the reported “average daily gain” represents the total gain of the mare, including the conceptus. While this limits the ability to isolate pure maternal tissue gain, the total gain may still be a valid indicator of the overall metabolic demand of late gestation under different protein regimes.
As monogastric hindgut fermenters, horses possess a unique digestive physiology characterized by a highly developed cecum and colon, where symbiotic microorganisms serve as the core engine for fiber degradation and nutrient fermentation to supply the majority of energy required by the body [20,21]. The digestibility data provides a mechanistic explanation for these performance differences. The MCP group exhibited the highest digestibility of organic matter (OM) and neutral detergent fiber (NDF), which are critical drivers of energy intake in horses [22]. A trend of peak digestibility at MCP and reduced digestibility in HCP is consistent with equine physiology. Excessive dietary protein can alter the hindgut microbial ecosystem, disrupt the proportional balance between fibrolytic and proteolytic bacteria, and trigger abnormal increases in ammonia concentration and unstable luminal pH, thereby directly inhibiting the activity and proliferation of fiber-digesting bacteria [23]. Crude Protein (CP) digestibility in this study fell within the typical range reported for mature horses [8,24,25]. However, while the HCP group had a numerically higher CP digestibility (68.80%) than the MCP group (65.98%), this did not translate to improved weight gain, suggesting that increased protein absorption may incur a metabolic cost related to renal excretion as a plausible hypothesis, rather than a confirmed mechanism, given the absence of direct nitrogen balance measurements [26,27]. The lower digestibility in the HCP group likely contributed to the poorer F:G ratio, as undigested protein represents a loss of potential energy and a burden on the hindgut [28].
4.2. Serum Biochemical Markers
The serum biochemical parameters reflect the general metabolic responses to different dietary protein levels. Serum creatinine (CREA) was significantly lower in the MCP group than in the LCP and HCP groups. All CREA values remained within the normal clinical reference ranges for horses, and the between-group differences represented mild fluctuations in metabolic turnover related to protein metabolism, with no indication of altered renal function or glomerular filtration burden [29,30,31,32,33]. Creatine kinase (CK) and lactate dehydrogenase (LDH) activities were significantly higher in the HCP group than in the MCP and LCP groups. All values for CK and LDH fell within normal physiological ranges for late-gestation mares, and these differences reflect variations in enzyme activity associated with dietary protein supply rather than muscle damage, tissue stress, or systemic metabolic strain [34,35]. Serum aspartate aminotransferase (AST) activity was highest in the MCP group. All AST values remained within normal physiological ranges, and this difference represents a moderate change in transaminase activity linked to amino acid metabolism, with no evidence supporting interpretations of altered hepatic function, metabolic exhaustion, or inhibitory effects of ammonia accumulation [36,37,38].
Overall, the serum biochemical parameters remained within normal physiological ranges across all groups. The observed between-group differences reflect mild metabolic adjustments in response to different dietary protein levels, with no pathological or functional impairment indicated by any of the measured indices.
4.3. Reproductive Hormones
To accurately characterize the endocrine profile throughout gestation, a longitudinal hormone profile constructed from serial blood samples would provide a more reliable depiction of hormonal dynamics than single-time-point measurements. This limitation—namely, the reliance on single-time-point blood samples rather than a longitudinal sampling approach—should be acknowledged as one of the constraints of the present study.
The endocrine profile revealed a complex interaction between protein intake and the hypothalamic–pituitary–gonadal axis [39]. Notably, the HCP group exhibited elevated levels of LH, FSH, and progesterone (P4) simultaneously. It should be emphasized that LH concentrations in this study were determined based on a single-time-point blood sample without serial sampling, which represents a clear methodological limitation. As such, we cannot definitively distinguish whether the elevated LH observed in the HCP group reflects a genuine increase in mean LH secretion or merely the coincidental capture of a spontaneous LH pulse peak; this uncertainty should be taken into account when interpreting the present results.
Classically, high P4 in late gestation suppresses gonadotropins via negative feedback [40,41]. The concurrent elevation of these hormones in the HCP group is physiologically paradoxical and difficult to reconcile with standard equine reproductive models.
The observed hormonal dysregulation under high protein intake may reflect indirect perturbations of reproductive endocrine homeostasis, though the precise underlying biological mechanism remains unclear given the scope of the present dataset. Additionally, the equine placenta is a major source of progesterone [42,43]; it is possible that the high-protein diet influenced placental efficiency, which in turn modulated maternal hormone profiles. While higher protein levels may promote estrogen synthesis, excessive protein carries the risk of urea nitrogen accumulation, which could negatively impact the intrauterine environment.
Future research employing serial blood sampling to clarify LH pulsatility characteristics and delineate the direct effects of dietary protein on reproductive endocrine function is warranted.
4.4. Immune and Antioxidant Status
Late gestation is characterized by a shift toward anti-inflammatory immunity to tolerate the fetus [44]. The LCP group showed elevated IgM and IgA, reflecting differential humoral immune marker profiles across protein supplementation groups, with no conclusive evidence supporting compensatory upregulation driven by nutritional stress. The HCP group exhibited the highest TNF-α and IL-6, suggesting a pro-inflammatory tendency that may be related to metabolic perturbations under excessive protein intake. Chronic low-grade inflammation is detrimental to fetal development [45,46].
Oxidative stress markers corroborated the biochemical findings. The HCP group had the highest malondialdehyde (MDA), a marker of lipid peroxidation, indicating that the high-protein diet was associated with altered antioxidant profiles in mares. The MCP group, by contrast, showed the highest Catalase (CAT) activity and lowest MDA, demonstrating a more stable antioxidant profile with moderate protein intake, which may confer advantages in placental oxidative stress defense [47,48].
4.5. Fecal Microbiota and Metabolome
The gut microbiota acts as a metabolic organ related to host nutrition [49,50]. For α-diversity, the Shannon and Simpson indices were significantly higher in the MCP group than in the LCP group, while no significant differences were found in microbial richness across groups. The HCP group showed lower α-diversity and enrichment of Proteobacteria (Acinetobacter), whereas the LCP group was dominated by Bacteroidetes and Prevotella. PCoA and NMDS plots showed distinct separation of microbial communities among treatments. LEfSe detected discriminatory taxa among groups, and PICRUSt prediction indicated enriched amino acid metabolism pathways in the MCP and HCP groups. The MCP group also had a higher abundance of Ruminococcus and Butyrivibrio.
Dietary protein level was significantly associated with differences in microbial α-diversity (Shannon and Simpson). Microbial community structure (β-diversity) differed significantly across dietary groups. Significant statistical associations were observed between the HCP diet and elevated Proteobacteria, and between the LCP diet and elevated Bacteroidetes/Prevotella. LEfSe-identified taxa showed statistically significant differentiation among groups, and predicted amino acid metabolism pathways were significantly associated with dietary protein level.
The higher α-diversity in the MCP group may suggest a potentially more stable microbial ecosystem, but this is not definitive evidence of improved gut health in the absence of functional validation [51]. The reduced diversity and enrichment of Proteobacteria in the HCP group are hypothesized to reflect potential microbial perturbation, which may be related to ammonia production from excess nitrogen fermentation, rather than confirmed dysbiosis or inflammation [52,53]. The dominance of Bacteroidetes and Prevotella in the LCP group is interpreted as a possible adaptive response to a high-fiber, low-protein diet [54]. The predicted enrichment of amino acid metabolism pathways in MCP and HCP groups suggests a potential increase in microbial protein utilization. The higher abundance of Ruminococcus and Butyrivibrio in the MCP group leads to the hypothesis that this microbiota may have greater potential for butyrate synthesis; however, since SCFAs were not measured, this inference remains unvalidated. The integration of microbiome and metabolomic data implies a potential connection between microbial composition and host metabolism, but this proposed biological mechanism remains a conceptual hypothesis requiring direct experimental confirmation.
4.6. Limitations
Several key limitations should be acknowledged when interpreting the present findings. First, the final valid sample sizes were n = 5 for the HCP group, n = 5 for the MCP group, and n = 6 for the LCP group, leading to a slight imbalance in sample distribution across treatment groups after exclusion of one contaminated serum sample. Second, the overall small sample size (n = 5–6 per group) may reduce the statistical power for multi-omics analyses including fecal microbiota profiling and metabolomics, which typically involve high-dimensional datasets. Accordingly, all multi-omics results and associated biological inferences should be interpreted as exploratory rather than confirmatory, and further studies with larger sample sizes are warranted to validate the present observations.
5. Conclusions
The results of this experiment indicate that the group fed 12.04% crude protein (Medium Crude Protein, MCP) showed a numerical trend toward more favorable gestational weight gain, nutrient digestibility, intestinal microbial stability, immune function, and antioxidant capacity in late-gestation mares relative to the other dietary treatments. Key differential metabolites involved in energy metabolism, including amino acid metabolites (lysine, proline) and lipid metabolites, were identified as the main drivers of the observed physiological differences among treatments. In contrast, the HCP (High-Crude-Protein) group showed a 36.10% increase in MDA content and a 42.20% reduction in CAT activity (elevated oxidative stress) and altered muscle metabolic indicators, while the LCP (Low-Crude-Protein) group showed reduced average daily gain and feed conversion efficiency, likely related to insufficient dietary protein supply for gestational needs. Based on the comprehensive observational findings of the present study, moderate protein supplementation may support more balanced physiological status in late-gestation mares.
Supplementary Materials
The following supporting information can be downloaded at: https://www.mdpi.com/article/10.3390/agriculture16090936/s1, Table S1: Serum biochemical indices of late-gestation mares fed complementary feed with different protein levels; Table S2: Serum reproductive hormone levels of late-gestation mares fed complementary feed with different protein levels; Table S3: Serum immune indices of late-gestation mares fed complementary feed with different protein levels; Table S4: Serum antioxidant indices of late-gestation mares fed complementary feed with different protein levels.
Author Contributions
Conceptualization, X.Z.; Methodology, M.D. (Manglai Dugarjaviin); Formal Analysis, Z.W., G.W. and X.W.; Investigation, Y.Z. and Q.H.; Resources, D.B. and Q.L.; Data Curation, X.Z.; Writing—Original Draft, Y.L., X.W. and Z.W.; Writing—Review & Editing, Y.L., X.W. and X.Z.; Project Administration, D.B., M.D. (Ming Du) and M.D. (Manglai Dugarjaviin); Funding Acquisition, X.Z., G.B. and M.D. (Manglai Dugarjaviin). All authors have read and agreed to the published version of the manuscript.
Funding
This research was funded by the Key Research and Development Project of the Inner Mongolia Autonomous Region (2023YFDZ0002); Inner Mongolia Education Department Special Research Project For First Class Disciplines (YLXKZX-NND-007); and Outstanding Youth Science Fund Training Project of Inner Mongolia Agricultural University (BR230405).
Institutional Review Board Statement
The animal study protocol was approved by the Laboratory Animal Welfare and Ethics Committee of Inner Mongolia Agricultural University (protocol code NND2024009). All sampling procedures adhered to regulatory standards.
Data Availability Statement
The original contributions presented in the study are included in the article/Supplementary Materials. Further inquiries can be directed to the corresponding author.
Acknowledgments
We thank the Key Laboratory of Genetics, Breeding and Reproduction of Horse Genus in Inner Mongolia Autonomous Region for their assistance and support in this experiment.
Conflicts of Interest
The authors declare no conflicts of interest.
Abbreviations
The following abbreviations are used in this manuscript:
| MCP | Medium-Crude-Protein Complementary Feed (12.04% CP) |
| HCP | High-Crude-Protein Complementary Feed (13.25% CP) |
| LCP | Low-Crude-Protein Complementary Feed (10.85% CP) |
| CP | Crude Protein |
| ADG | Average Daily Gain |
| FCR | Feed Conversion Ratio |
| DM | Dry Matter |
| OM | Organic Matter |
| EE | Ether Extract |
| NDF | Neutral Detergent Fiber |
| ADF | Acid Detergent Fiber |
| Ca | Calcium |
| P | Phosphorus |
| CREA | Creatinine |
| CK | Creatine Kinase |
| LDH | Lactate Dehydrogenase |
| AST | Aspartate Aminotransferase |
| A/G ratio | Albumin-to-Globulin Ratio |
| UN | Urea Nitrogen |
| GLB | Globulin |
| TP | Total Protein |
| E2 | Estradiol |
| LH | Luteinizing Hormone |
| P4 | Progesterone |
| FSH | Follicle-Stimulating Hormone |
| PRL | Prolactin |
| OXT | Oxytocin |
| T | Testosterone |
| GnRH | Gonadotropin-Releasing Hormone |
| IgM | Immunoglobulin M |
| IgA | Immunoglobulin A |
| IgG | Immunoglobulin G |
| IL-6 | Interleukin-6 |
| TNF-α | Tumor Necrosis Factor-α |
| IL-1β | Interleukin-1β |
| IL-2 | Interleukin-2 |
| SOD | Superoxide Dismutase |
| T-AOC | Total Antioxidant Capacity |
| GSH-Px | Glutathione Peroxidase |
| CAT | Catalase |
| MDA | Malondialdehyde |
| OTUs | Operational Taxonomic Units |
| PCoA | Principal Co-ordinates Analysis |
| NMDS | Non-metric Multidimensional Scaling |
| LEfSe | Linear Discriminant Analysis Effect Size |
| PICRUSt | Phylogenetic Investigation of Communities by Reconstruction of Unobserved States |
| KEGG | Kyoto Encyclopedia of Genes and Genomes |
| AMPK | AMP-activated Protein Kinase |
References
- Meyer, A.M. Developmental programming of the neonatal period in ruminant livestock: A review. J. Dev. Orig. Health Dis. 2025, 16, e40. [Google Scholar] [CrossRef] [Scilit]
- Robertson, T.; Thomas, E.; Starbuck, G.; Yarnell, K. Global distribution and gap analysis of equine housing research: The findings so far and where to go next. Anim. Welf. 2024, 33, e58. [Google Scholar] [CrossRef] [Scilit]
- van Niekerk, F.E.; van Niekerk, C.H. The effect of dietary protein on reproduction in the mare. I. The composition and evaluation of the digestibility of dietary protein from different sources. J. S. Afr. Vet. Assoc. 1997, 68, 78–80. [Google Scholar] [CrossRef] [Scilit]
- Liang, J.; Ali, S.; Lv, C.; Yang, H.; Zhao, X.; Ni, X.; Li, C.; Danzeng, B.; Wang, Y.; Quan, G. Dietary protein levels modulate the gut microbiome composition through fecal samples derived from lactating ewes. Front. Endocrinol. 2023, 14, 1194425. [Google Scholar] [CrossRef] [Scilit]
- Becvarova, I.; Buechner-Maxwell, V. Feeding the foal for immediate and long-term health. Equine Vet. J. Suppl. 2012, 41, 149–156. [Google Scholar] [CrossRef] [Scilit]
- Robles, M.; Hammer, C.; Staniar, B.; Chavatte-Palmer, P. Nutrition of Broodmares. Vet. Clin. N. Am. Equine Pract. 2021, 37, 177–205. [Google Scholar] [CrossRef] [Scilit] [PubMed]
- Gao, W.; Zeng, Z.; Shi, H.; Wang, L.; Liu, S.; Dong, X.; Wang, T.; Lai, C.; Zhang, S. Predicting the Net Energy Partition Patterns of Growing Pigs Based on Different Nutrients. Animals 2025, 15, 2464. [Google Scholar] [CrossRef] [Scilit] [PubMed]
- National Research Council (NRC). Nutrient Requirements of Horses: Sixth Revised Edition; National Academies Press: Washington, DC, USA, 2007. [Google Scholar]
- Huang, B.; Shi, H.; Wang, L.; Wang, L.; Lyu, Z.; Hu, Q.; Zang, J.; Li, D.; Lai, C. Effects of Defatted Rice Bran Inclusion Level on Nutrient Digestibility and Growth Performance of Different Body Weight Pigs. Animals 2021, 11, 1374. [Google Scholar] [CrossRef] [Scilit]
- Mashiachidi, J.A.; Manyelo, T.G.; Gunya, B. Effect of Berchemia discolor Leaf Meal (Muni Tree) on Feed Intake, Growth Performance and Digestibility of Non-Descript Goats. Animals 2025, 15, 1342. [Google Scholar] [CrossRef] [Scilit] [PubMed]
- Chatzi, A.; Doody, O. The one-way ANOVA test explained. Nurse Res. 2023, 31, 8–14. [Google Scholar] [CrossRef] [Scilit]
- Gauthier, J.; Derome, N. Evenness-Richness Scatter Plots: A Visual and Insightful Representation of Shannon Entropy Measurements for Ecological Community Analysis. mSphere 2021, 6, e01019-20. [Google Scholar] [CrossRef] [Scilit]
- Robles, M.; Rousseau-Ralliard, D.; Dubois, C.; Josse, T.; Nouveau, É.; Dahirel, M.; Wimel, L.; Couturier-Tarrade, A.; Chavatte-Palmer, P. Obesity during Pregnancy in the Horse: Effect on Term Placental Structure and Gene Expression, as Well as Colostrum and Milk Fatty Acid Concentration. Vet. Sci. 2023, 10, 691. [Google Scholar] [CrossRef] [Scilit]
- Lewis, R.W.; Andrus, A.K.; Arroyo, J.; Brescia, S.; Botham, P.A.; Corvaro, M.; Daston, G.P.; Hofmann, T.; Rodriguez, C.; Sewell, F.; et al. Considerations for the development of guidance on dose level selection for developmental and reproductive toxicity studies. Regul. Toxicol. Pharmacol. 2024, 148, 105585. [Google Scholar] [CrossRef] [Scilit]
- Grieger, J.A.; Takele, W.W.; Vesco, K.K.; Redman, L.M.; Hannah, W.; Bonham, M.P.; Chen, M.; Chivers, S.C.; Fawcett, A.J.; Habibi, N.; et al. Participant characteristics in the effectiveness of lifestyle interventions to optimize gestational weight gain: A systematic review and meta-analysis. Commun. Med. 2025, 5, 439. [Google Scholar] [CrossRef] [Scilit]
- Soenen, S.; Martens, E.A.; Hochstenbach-Waelen, A.; Lemmens, S.G.; Westerterp-Plantenga, M.S. Normal protein intake is required for body weight loss and weight maintenance, and elevated protein intake for additional preservation of resting energy expenditure and fat free mass. J. Nutr. 2013, 143, 591–596. [Google Scholar] [CrossRef] [Scilit]
- Cai, Y.; Zou, J.; Zhou, Y.; Yang, J.; Wang, C.; Mao, H. Nitrogen Utilization and Ruminal Microbiota of Hu Lambs in Response to Varying Dietary Metabolizable Protein Levels. Animals 2025, 15, 2147. [Google Scholar] [CrossRef] [Scilit]
- Martin, J.L.; Vonnahme, K.A.; Adams, D.C.; Lardy, G.P.; Funston, R.N. Effects of dam nutrition on growth and reproductive performance of heifer calves. J. Anim. Sci. 2007, 85, 841–847. [Google Scholar] [CrossRef] [Scilit] [PubMed]
- Marín-García, P.J.; Llobat, L.; López-Lujan, M.C.; Cambra-López, M.; Blas, E.; Pascual, J.J. Urea Nitrogen Metabolite Can Contribute to Implementing the Ideal Protein Concept in Monogastric Animals. Animals 2022, 12, 2344. [Google Scholar] [CrossRef] [Scilit]
- Schank, N.; Cottone, A.; Wulf, M.; Seiter, K.; Thomas, B.; Miller, L.M.J.; Anderson, S.L.; Sahyoun, A.; Abidi, A.H.; Kassan, M.; et al. The Role of Short-Chain Fatty Acids (SCFAs) in Colic and Anti-Inflammatory Pathways in Horses. Animals 2025, 15, 3482. [Google Scholar] [CrossRef] [Scilit] [PubMed]
- Zhang, Z.; Gao, X.; Dong, W.; Huang, B.; Wang, Y.; Zhu, M.; Wang, C. Plant Cell Wall Breakdown by Hindgut Microorganisms: Can We Get Scientific Insights from Rumen Microorganisms? J. Equine Vet. Sci. 2022, 115, 104027. [Google Scholar] [CrossRef] [Scilit] [PubMed]
- Richard, N.; Silva, T.S.; Wulff, T.; Schrama, D.; Dias, J.P.; Rodrigues, P.M.; Conceição, L.E. Nutritional mitigation of winter thermal stress in gilthead seabream: Associated metabolic pathways and potential indicators of nutritional state. J. Proteom. 2016, 142, 1–14. [Google Scholar] [CrossRef] [Scilit] [PubMed]
- Oliveira, C.A.; Azevedo, J.F.; Martins, J.A.; Barreto, M.P.; Silva, V.P.; Julliand, V.; Almeida, F.Q. The impact of dietary protein levels on nutrient digestibility and water and nitrogen balances in eventing horses. J. Anim. Sci. 2015, 93, 229–237. [Google Scholar] [CrossRef] [Scilit]
- Pisch, C.; Wensch-Dorendorf, M.; Schwarzenbolz, U.; Henle, T.; Greef, J.M.; Zeyner, A. Effect of Hay Steaming on the Estimated Precaecal Digestibility of Crude Protein and Selected Amino Acids in Horses. Animals 2022, 12, 3092. [Google Scholar] [CrossRef] [Scilit] [PubMed]
- Bockisch, F.; Taubert, J.; Coenen, M.; Vervuert, I. Protein Evaluation of Feedstuffs for Horses. Animals 2023, 13, 2624. [Google Scholar] [CrossRef] [Scilit]
- Htoo, J.K.; Araiza, B.A.; Sauer, W.C.; Rademacher, M.; Zhang, Y.; Cervantes, M.; Zijlstra, R.T. Effect of dietary protein content on ileal amino acid digestibility, growth performance, and formation of microbial metabolites in ileal and cecal digesta of early-weaned pigs. J. Anim. Sci. 2007, 85, 3303–3312. [Google Scholar] [CrossRef] [Scilit]
- Lopez, D.A.; Stein, H.H.; Miesner, M.D.; Gebhardt, J.T.; Stark, C.R.; Paulk, C.B. Effect of feed conditioning time prior to pelleting on standardized ileal digestibility of amino acids and total tract digestibility of energy in diets fed to growing pigs. Transl. Anim. Sci. 2025, 9, txaf153. [Google Scholar] [CrossRef] [Scilit]
- Lawal, A.S.; Ogunribido, T.Z.; Fu, Y.; Adeola, O.; Ajuwon, K.M. Responses in weanling pigs fed low protein diets supplemented with dietary nucleotides. Transl. Anim. Sci. 2024, 8, txae142. [Google Scholar] [CrossRef] [Scilit]
- Akhmiyati, P.A.; Chen, B.; Yang, Y.; Liu, L.; Liu, W. Multi-omics insight into muscle quality divergence between high-altitude Bayinbuluke sheep and low-altitude Turpan black sheep. Front. Vet. Sci. 2025, 12, 1682137. [Google Scholar] [CrossRef] [Scilit]
- Liang, S.; Zhang, Y.; Xia, Q.; Liu, X.; Liang, J. Association of serum biochemical parameters with growth performance and gut microbiota in large white pigs. Front. Vet. Sci. 2026, 12, 1702154. [Google Scholar] [CrossRef] [Scilit]
- Souza, R.A.; Miranda, H.; Xavier, M.; Lazo-Osorio, R.A.; Gouvea, H.A.; Cogo, J.C.; Vieira, R.P.; Ribeiro, W. Effects of high-dose creatine supplementation on kidney and liver responses in sedentary and exercised rats. J. Sports Sci. Med. 2009, 8, 672–681. [Google Scholar] [PubMed]
- Pires, M.J.; Cotovio, M.; Queiroga, F.; Pires, C.A.; Silvestre-Ferreira, A.C. Reference Intervals for Biochemical Analytes in Clinically Healthy Adult Lusitano Horses. Vet. Sci. 2025, 12, 656. [Google Scholar] [CrossRef] [Scilit]
- Odle, J.; Jacobi, S.K.; Boyd, R.D.; Bauman, D.E.; Anthony, R.V.; Bazer, F.W.; Lock, A.L.; Serazin, A.C. The Potential Impact of Animal Science Research on Global Maternal and Child Nutrition and Health: A Landscape Review. Adv. Nutr. 2017, 8, 362–381. [Google Scholar] [CrossRef] [Scilit]
- Losada-Espinosa, N.; Villarroel, M.; María, G.A.; Miranda-de la Lama, G.C. Pre-slaughter cattle welfare indicators for use in commercial abattoirs with voluntary monitoring systems: A systematic review. Meat Sci. 2018, 138, 34–48. [Google Scholar] [CrossRef] [Scilit]
- Jahoor, F.; Peters, E.J.; Wolfe, R.R. The relationship between gluconeogenic substrate supply and glucose production in humans. Am. J. Physiol. 1990, 258, E288–E296. [Google Scholar] [CrossRef] [Scilit] [PubMed]
- Ruiz-Rodado, V.; Nicoli, E.R.; Probert, F.; Smith, D.A.; Morris, L.; Wassif, C.A.; Platt, F.M.; Grootveld, M. 1H NMR-Linked Metabolomics Analysis of Liver from a Mouse Model of NP-C1 Disease. J. Proteome Res. 2016, 15, 3511–3527. [Google Scholar] [CrossRef] [Scilit]
- Pu, D.; Wang, Z.; Zheng, J.; Li, P.; Wei, X.; Li, D.; Gao, L.; Zhou, L.; Wang, Y. Effects of Ammonia Stress on Liver Tissue Structure, Enzyme Activities, and Metabolome of Juvenile Largemouth Bass Micropterus salmoides. Metabolites 2024, 14, 649. [Google Scholar] [CrossRef] [Scilit]
- Kroupina, K.; Bémeur, C.; Rose, C.F. Amino acids, ammonia, and hepatic encephalopathy. Anal. Biochem. 2022, 649, 114696. [Google Scholar] [CrossRef] [Scilit]
- Arfuso, F.; Giannetto, C.; Bazzano, M.; Assenza, A.; Piccione, G. Physiological Correlation between Hypothalamic-Pituitary-Adrenal Axis, Leptin, UCP1 and Lipid Panel in Mares during Late Pregnancy and Early Postpartum Period. Animals 2021, 11, 2051. [Google Scholar] [CrossRef] [Scilit]
- Skinner, D.C.; Evans, N.P.; Delaleu, B.; Goodman, R.L.; Bouchard, P.; Caraty, A. The negative feedback actions of progesterone on gonadotropin-releasing hormone secretion are transduced by the classical progesterone receptor. Proc. Natl. Acad. Sci. USA 1998, 95, 10978–10983. [Google Scholar] [CrossRef] [Scilit] [PubMed]
- Yanagisawa, Y. How dietary amino acids and high protein diets influence insulin secretion. Physiol. Rep. 2023, 11, e15577. [Google Scholar] [CrossRef] [Scilit] [PubMed]
- Parker, J.; Briden, L.; Gersh, F.L. Recognizing the Role of Insulin Resistance in Polycystic Ovary Syndrome: A Paradigm Shift from a Glucose-Centric Approach to an Insulin-Centric Model. J. Clin. Med. 2025, 14, 4021. [Google Scholar] [CrossRef] [Scilit]
- Dhakal, P.; Hirama, A.; Nambo, Y.; Harada, T.; Sato, F.; Nagaoka, K.; Watanabe, G.; Taya, K. Circulating pituitary and gonadal hormones in spring-born Thoroughbred fillies and colts from birth to puberty. J. Reprod. Dev. 2012, 58, 522–530. [Google Scholar] [CrossRef] [Scilit]
- Barth, C.; de Lange, A.G. Towards an understanding of women’s brain aging: The immunology of pregnancy and menopause. Front. Neuroendocrinol. 2020, 58, 100850. [Google Scholar] [CrossRef] [Scilit] [PubMed]
- Fink, N.R.; Chawes, B.; Bønnelykke, K.; Thorsen, J.; Stokholm, J.; Rasmussen, M.A.; Brix, S.; Bisgaard, H. Levels of Systemic Low-grade Inflammation in Pregnant Mothers and Their Offspring are Correlated. Sci. Rep. 2019, 9, 3043. [Google Scholar] [CrossRef] [Scilit] [PubMed]
- Cadaret, C.N.; Merrick, E.M.; Barnes, T.L.; Beede, K.A.; Posont, R.J.; Petersen, J.L.; Yates, D.T. Sustained maternal inflammation during the early third-trimester yields intrauterine growth restriction, impaired skeletal muscle glucose metabolism, and diminished β-cell function in fetal sheep. J. Anim. Sci. 2019, 97, 4822–4833. [Google Scholar] [CrossRef] [Scilit]
- Peng, X.; Cai, X.; Li, J.; Huang, Y.; Liu, H.; He, J.; Fang, Z.; Feng, B.; Tang, J.; Lin, Y.; et al. Effects of Melatonin Supplementation during Pregnancy on Reproductive Performance, Maternal-Placental-Fetal Redox Status, and Placental Mitochondrial Function in a Sow Model. Antioxidants 2021, 10, 1867. [Google Scholar] [CrossRef] [Scilit]
- Huang, J.; Li, S.; Sung, J.Y.; Qiao, S.; Zeng, X.; Zhou, J. Transfer of Antioxidant Capacity Through Placenta and Colostrum: β-Carotene and Superoxide Dismutase Collaboratively Enhance Integrated Breeding of Sows and Piglets. Antioxidants 2025, 14, 359. [Google Scholar] [CrossRef] [Scilit] [PubMed]
- Plovier, H.; Cani, P.D. Microbial Impact on Host Metabolism: Opportunities for Novel Treatments of Nutritional Disorders? Microbiol. Spectr. 2017, 5, BAD-0002-2016. [Google Scholar] [CrossRef] [Scilit]
- Rowland, I.; Gibson, G.; Heinken, A.; Scott, K.; Swann, J.; Thiele, I.; Tuohy, K. Gut microbiota functions: Metabolism of nutrients and other food components. Eur. J. Nutr. 2018, 57, 1–24. [Google Scholar] [CrossRef] [Scilit] [PubMed]
- Zhu, Y.; Cidan, Y.; Ali, M.; Lu, S.; Javed, U.; Cisang, Z.; Gusang, D.; Danzeng, Q.; Li, K.; Basang, W. Evaluating the Effect of Dietary Protein-Energy Ratios on Yak Intestinal Microbiota Using High-Throughput 16S rRNA Gene Sequencing. Vet. Sci. 2025, 12, 208. [Google Scholar] [CrossRef] [Scilit]
- Walker, A.W.; Sanderson, J.D.; Churcher, C.; Parkes, G.C.; Hudspith, B.N.; Rayment, N.; Brostoff, J.; Parkhill, J.; Dougan, G.; Petrovska, L. High-throughput clone library analysis of the mucosa-associated microbiota reveals dysbiosis and differences between inflamed and non-inflamed regions of the intestine in inflammatory bowel disease. BMC Microbiol. 2011, 11, 7. [Google Scholar] [CrossRef] [Scilit] [PubMed]
- Shin, N.R.; Whon, T.W.; Bae, J.W. Proteobacteria: Microbial signature of dysbiosis in gut microbiota. Trends Biotechnol. 2015, 33, 496–503. [Google Scholar] [CrossRef] [Scilit] [PubMed]
- González-Prendes, R.; Pena, R.N.; Solé, E.; Seradj, A.R.; Estany, J.; Ramayo-Caldas, Y. Modulatory Effect of Protein and Carotene Dietary Levels on Pig gut Microbiota. Sci. Rep. 2019, 9, 14582. [Google Scholar] [CrossRef] [Scilit] [PubMed]

Disclaimer/Publisher’s Note: The statements, opinions and data contained in all publications are solely those of the individual author(s) and contributor(s) and not of MDPI and/or the editor(s). MDPI and/or the editor(s) disclaim responsibility for any injury to people or property resulting from any ideas, methods, instructions or products referred to in the content. |
© 2026 by the authors. Licensee MDPI, Basel, Switzerland. This article is an open access article distributed under the terms and conditions of the Creative Commons Attribution (CC BY) license.