


Abstract
Climate change poses increasing challenges to livestock production in tropical regions, where rising temperatures, rainfall variability, and feed cost fluctuations affect productivity and economic stability. However, few studies have jointly quantified the effects of climatic and economic variables on swine production in tropical production systems, particularly in Brazil. This study examined the effects of maximum temperature, precipitation, and feed price on swine production density in Brazil’s main producing states. The analysis included Paraná and Rio Grande do Sul as the principal empirical base, while Mato Grosso was retained because of its strategic relevance but contributed only limited observations and was therefore interpreted more cautiously. Using monthly observations and a multiple linear regression model with heteroskedasticity- and autocorrelation-consistent (HAC, Newey–West) standard errors, we found that higher maximum mean temperatures were associated with lower production density: a 1 °C increase corresponded to an estimated decline of 1.34 × 10⁶ kg/km2. Precipitation showed a positive association, with each additional millimeter corresponding to an increase of approximately 1.82 × 10⁵ kg/km2, whereas a 0.173 USD/kg increase in feed price was associated with a reduction of about 6.2 × 10⁶ kg/km2. Although the model explained only a modest share of monthly variation (R2 = 0.162), the results suggest that climatic exposure and feed-cost pressure are relevant components of swine production dynamics in Brazil and should be considered in future climate-risk and agricultural planning.
1. Introduction
Climate change has become a major challenge for livestock production because rising temperatures, altered rainfall regimes, and more frequent extreme events affect animal physiology, feed availability, water resources, and production stability. Empirical evidence indicates that climate-related stress can reduce livestock productivity through lower feed intake, impaired growth, compromised reproduction, and higher mortality. At the same time, indirect effects also emerge through disruptions in feed supply, transport, and market chains [1]. In Brazil, these risks are particularly relevant because recent assessments have shown that climate change is increasing heat stress exposure across livestock systems, with marked regional differences in severity and adaptive capacity [2].
Among livestock species, pigs are especially vulnerable to high temperatures because of their limited capacity for evaporative heat dissipation. Studies in pigs have shown that increasing ambient temperature reduces feed intake, impairs growth efficiency, and alters thermoregulatory and carcass responses, with the magnitude of these effects varying by genotype and production environment [3]. This is particularly important in tropical and subtropical environments, where climatic stress can be persistent, and adaptation infrastructure may be unevenly distributed across production regions [2].
In addition to direct biological effects, climate change affects pig production through feed and market dynamics. Swine systems are highly dependent on grain-based feed, particularly corn and soybean meals, which account for a substantial share of total production costs. Climate shocks and weather anomalies can affect agricultural commodity markets [4,5,6], increasing price volatility and amplifying production uncertainty throughout the livestock sector [7,8]. These linkages are especially relevant in Brazil, where pig production is closely integrated with grain-producing regions and where climatic variability can simultaneously influence both feed costs and production performance [9,10].
This interaction is even more critical in tropical livestock systems, which are more exposed to thermal stress, rainfall variability, and infrastructure limitations. In such environments, climate vulnerability is shaped not only by biophysical exposure but also by the capacity of producers and regions to adapt to changing conditions. Therefore, analyzing swine production in Brazil provides an important opportunity to understand how climatic and economic stressors jointly influence livestock outcomes in a tropical production context [1,2].
Brazil stands out as one of the world’s largest producers and exporters of pork, playing a strategic role in global food security [2]. Swine production in Brazil is concentrated primarily in Paraná, Rio Grande do Sul, and Mato Grosso. These states were selected because they represent contrasting thermal and rainfall regimes within major Brazilian swine-producing regions. However, while this geographic contrast is analytically important, Mato Grosso’s empirical contribution in the present study is limited by data availability and is therefore treated more cautiously in the subsequent analysis.
In recent decades, these regions have experienced a gradual increase in average maximum temperatures and a decline in rainfall intensity, particularly during the dry months, altering patterns of thermal comfort and water availability [2,3,6]. Despite these challenges, the Brazilian swine sector has shown signs of structural resilience. According to the Brazilian Institute of Geography and Statistics (IBGE) [11], feed production continues to expand nationwide, supported by technological innovations and crop–livestock integration. This trend highlights the sector’s adaptive capacity to sustain productivity amid climatic and economic pressures.
Previous studies have shown that heat stress is among the main limiting factors for growth and feed conversion efficiency in pigs [3,12]. However, few studies have simultaneously quantified the combined effects of temperature and precipitation on swine productivity in tropical contexts, while accounting for economic variables such as feed prices. This gap is particularly relevant in Brazil, where climate variability spans a broad spatial and temporal range, influencing both direct productivity outcomes and input costs.
This study provides a quantitative assessment of climate sensitivity in Brazilian swine production by integrating climatic, productive, and economic variables within a high-resolution analytical framework. We hypothesized that higher maximum temperatures and higher feed prices would be negatively associated with swine production density, whereas precipitation would be positively associated with swine production density by moderating thermal and water stress within the production environment. We further expected these relationships to be observed more strongly in the southern states, given the limited number of observations available for Mato Grosso.
2. Materials and Methods
This study employed time-series regression analysis to investigate the relationship between climatic and economic variables and swine production in Paraná, Rio Grande do Sul, and, to a more limited extent, Mato Grosso. The effective regression dataset was defined by the availability of monthly swine-production observations. Longer climate and feed-related series were incorporated only for contextual or descriptive purposes and were aligned to the production period when used as explanatory variables. Thus, the distinct temporal windows across variables do not constitute a single uninterrupted panel from 1931 to 2024, but rather multiple data layers that serve different analytical functions within the study design.
The effective analytical window for the swine-production model was 2014–2024, corresponding to the availability of production records. Feed-related information was incorporated through two complementary dimensions: feed production data, used to characterize grain supply conditions, and feed price data, represented in the model as FeedPrice (USD/kg), the main economic indicator of input-cost pressure. Feed production series were drawn from the broader period 2007–2024 and summarized descriptively as 2007–2020 and 2021–2024 to compare historical and recent contexts. In contrast, the feed price was included directly in the regression specification as an explanatory variable. This distinction is now made explicit to ensure consistency between the data description, model specification, and results interpretation.
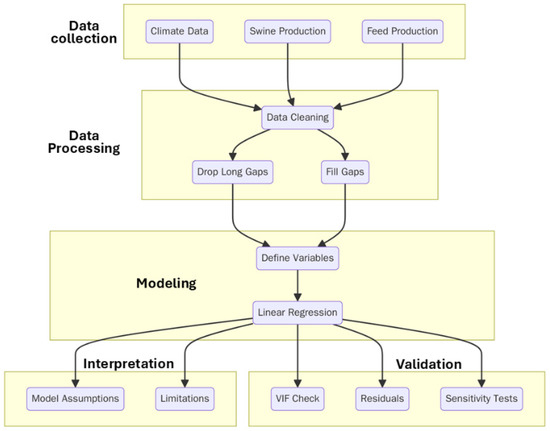
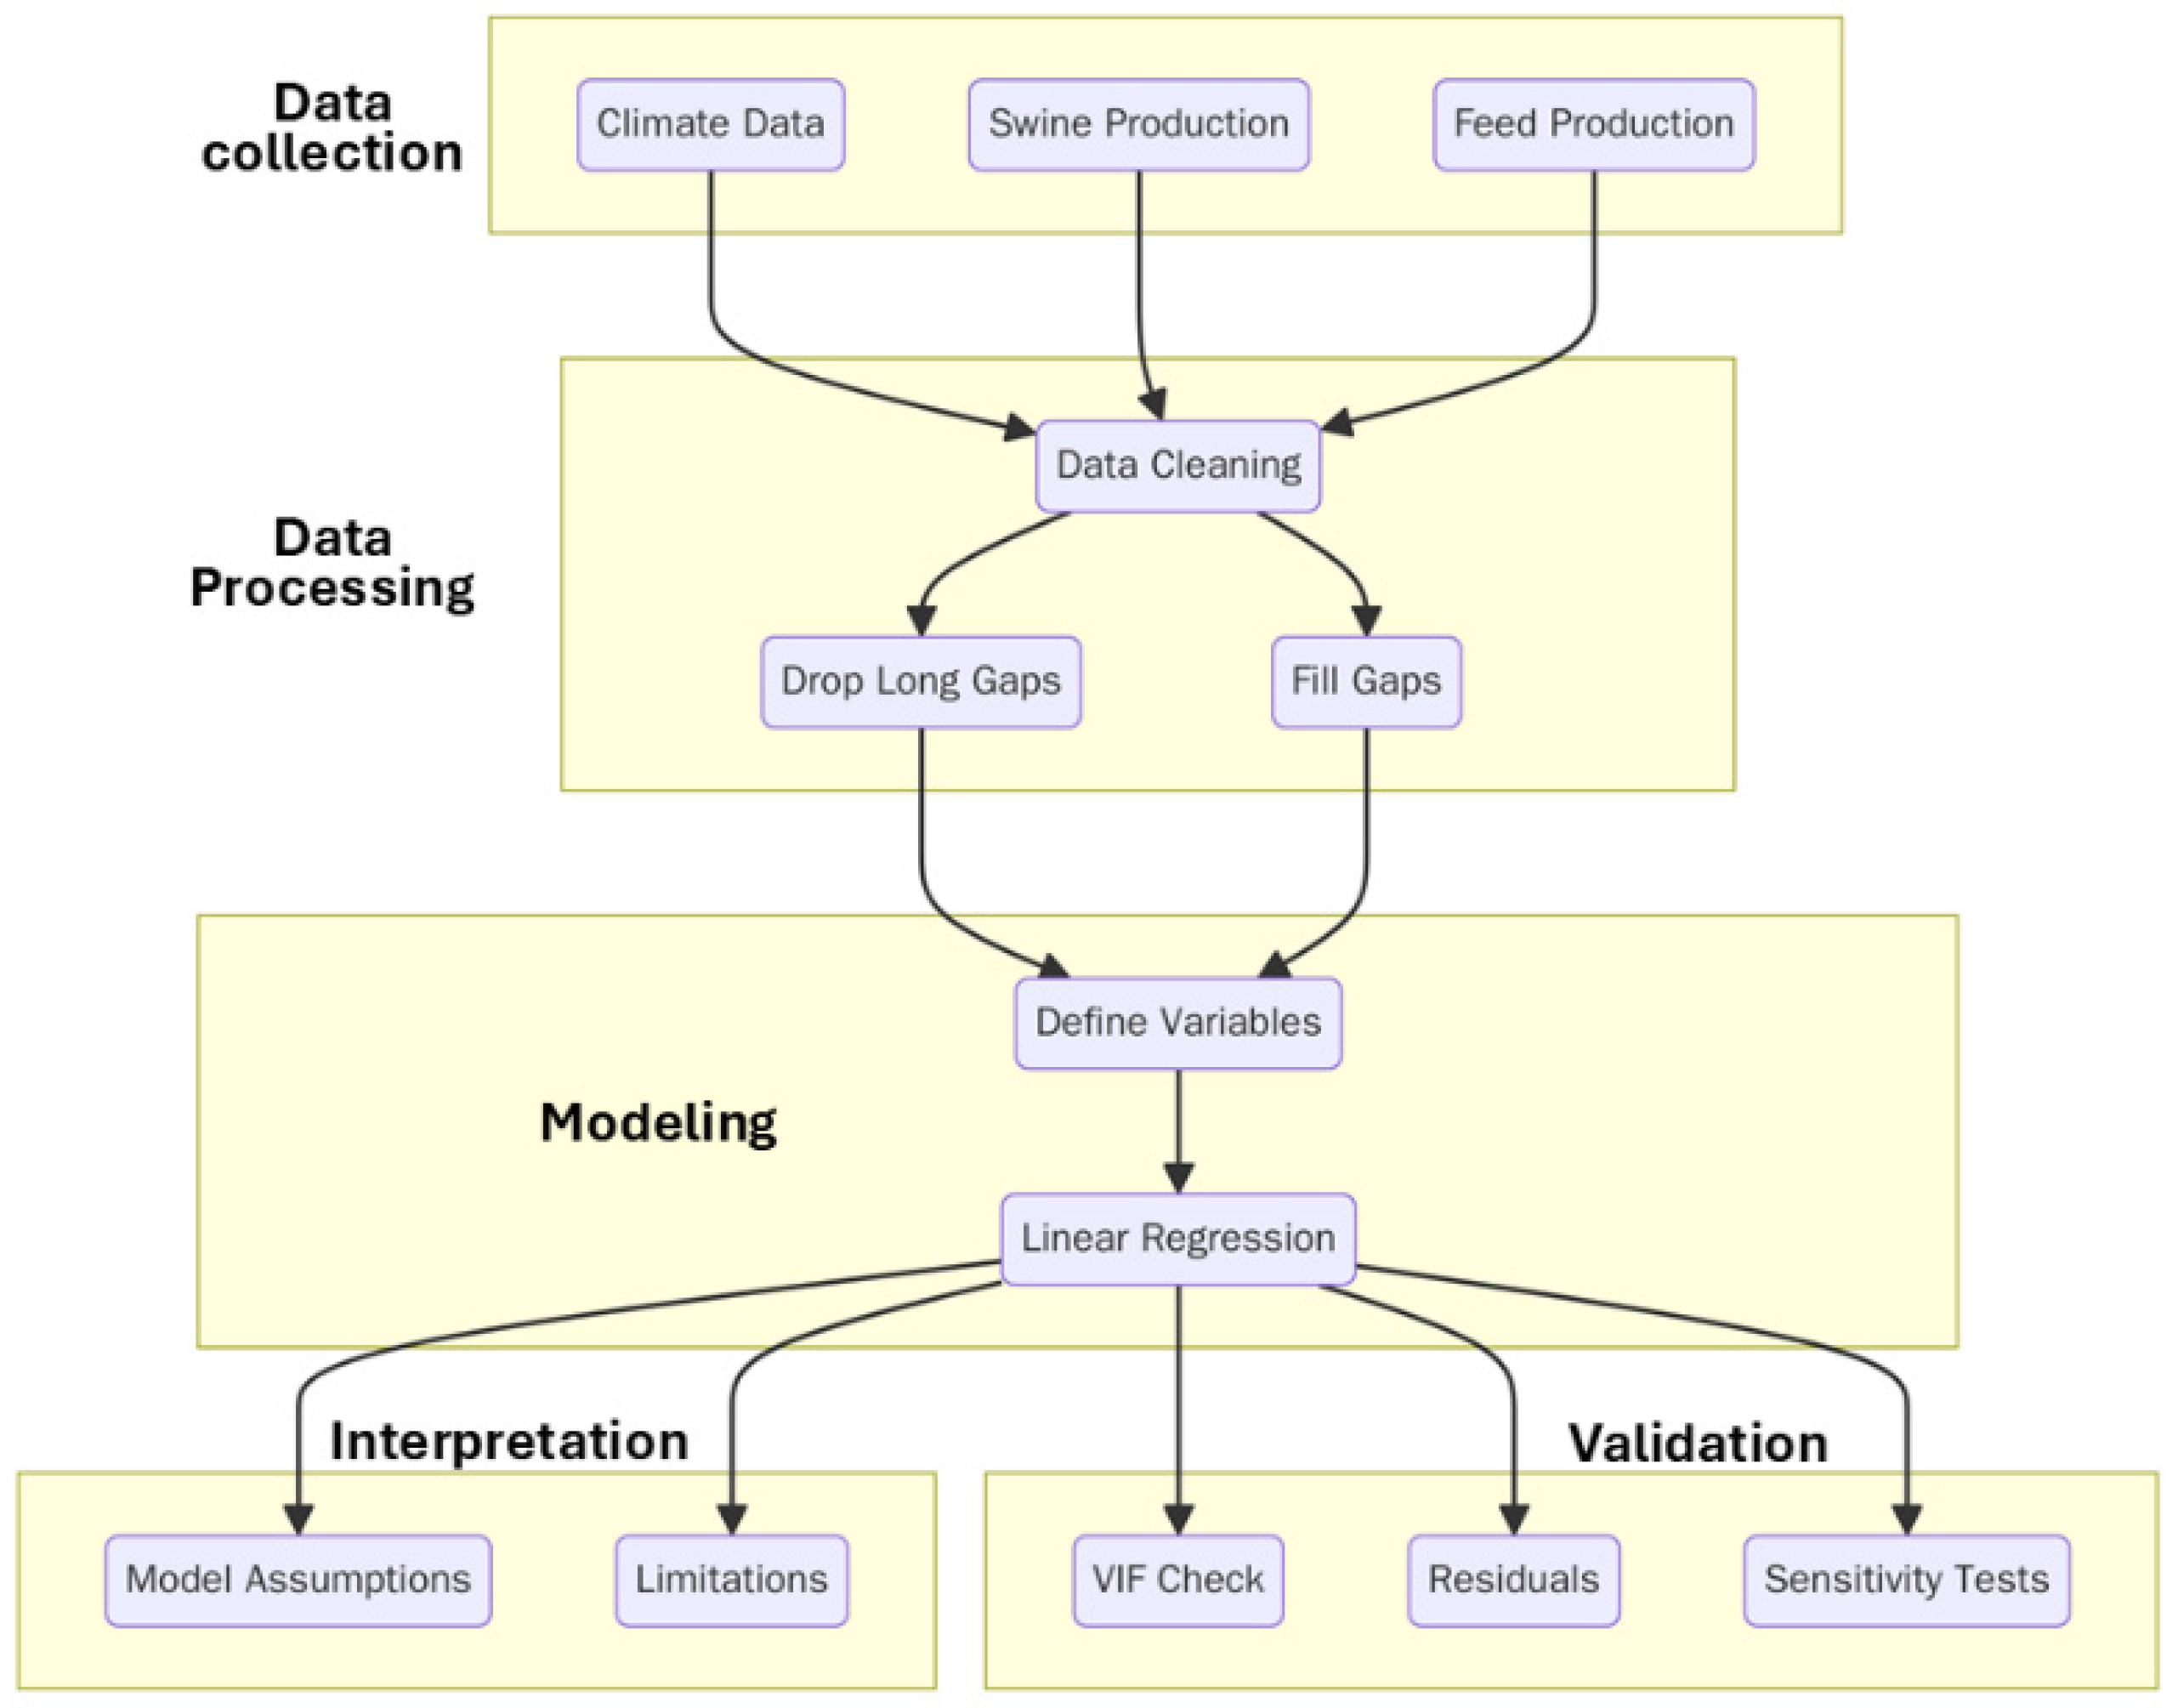
Figure 1 presents a schematic representation of the process, encompassing data collection (climatic, swine-production, feed-production, and feed-price data), data processing (including cleaning and handling missing values), model development using multiple linear regression, diagnostic validation procedures, and interpretation steps that account for assumptions and limitations.
Figure 1.
Methodological workflow illustrating the study design for assessing the impact of climate variability on swine production in Brazil.
2.1. Data Collection
To capture the relationship between climate variability, feed conditions, and swine production, we used secondary data from multiple official sources [10,11,13], with each dataset covering the period available for its specific analytical purpose.
Swine production was assessed as annual production per unit area (kg/km2) in the principal producing states [13]. For Paraná and Rio Grande do Sul, monthly data were available from 2014 to 2024. For Mato Grosso, only four months of production data were available because of reporting limitations. Although limited, Mato Grosso was retained because it is one of Brazil’s most important agricultural states and plays a strategic role in the interaction between feed production and livestock systems. To reduce the risk of distortion associated with this asymmetry, observations of this asymmetry received lower analytical weight in the weighted regression, and an additional sensitivity analysis excluding Mato Grosso was performed.
Feed Production Data: Corn and soybean production data were obtained from IBGE [11] and FAO [14] sources for the period 2007–2024. These data were used descriptively to characterize medium-term variation in feed supply conditions across the principal producing regions and to contextualize changes in grain availability relevant to swine production.
Feed Price Data: The economic dimension of the model was represented by FeedPrice (USD/kg), which was used directly as an explanatory variable in the regression analysis. This variable captures input-cost pressure from feed markets and reflects the economic effect of feed-cost variation on swine production density. Feed price was included separately from feed production because grain availability and feed cost, although related, represent distinct analytical dimensions.
Feed production was summarized for two periods, 2007–2020 and 2021–2024, to contrast a longer historical baseline with a more recent period marked by greater climatic and market instability. This division was used for descriptive and contextual comparisons of feed-supply conditions, not to define two separate regression panels. Recent data indicate a decline in average monthly corn production between these periods, which is relevant because corn is the main energy component of swine feed and strongly affects production costs. However, this comparison is interpreted descriptively, and no direct causal inference is drawn from the split by period alone.
These distinct temporal windows were therefore not treated as equivalent observational spans within a single panel structure; instead, they served different analytical purposes, with the 2014–2024 period defining the effective regression horizon and the longer climate and feed series providing historical and structural context for interpreting the production results.
Corn accounts for a substantial share of swine feed formulation [15], and fluctuations in domestic corn availability can affect feed costs and producer margins. In the Brazilian context, feed for pig production is supplied predominantly by domestic grain production; imports are generally limited and used to complement supply during temporary shortages rather than to serve as the principal source of feed grain. Therefore, reductions in domestic corn output may increase price volatility and production costs even when imports are available as a residual balancing mechanism. For this reason, feed production and price-related indicators were incorporated as contextual and explanatory variables in the analytical framework. Table 1 summarizes the data sources, temporal coverage, analytical purpose, and effective observation structure of the variables used in the study.
Table 1.
Summary of data sources, temporal coverage, analytical role, and observation structure.
All explanatory variables included in the regression were temporally matched to months with available swine production data; longer historical series were used only to contextualize climatic and feed-related conditions. Therefore, the total number of observations reported in the regression model refers to the final matched analytical sample rather than to the sum of all raw state-level records listed in Table 1.
2.2. Sensitivity and Weighting Procedures
To address data availability asymmetry across states, particularly the limited four-month production series for Mato Grosso (MT), two complementary robustness strategies were applied. First, a Weighted Least Squares (WLS) regression was estimated, assigning a lower analytical weight (0.25) to MT observations to reduce potential bias arising from incomplete data. Second, a sensitivity test was conducted by re-estimating the model after excluding MT.
Both procedures used the same HAC (Newey–West) correction parameters to maintain consistency with the main model. Coefficient estimates and significance levels were then compared across models to evaluate whether MT’s inclusion materially affected parameter stability. Coefficient estimates and significance patterns were compared across the baseline OLS-HAC model, the WLS specification, and the sensitivity model excluding Mato Grosso to assess whether MT’s inclusion materially affected parameter stability. The results remained substantively stable across specifications, supporting the robustness of the main findings to regional data imbalance (Table 2).
Table 2.
Comparison of coefficient estimates, robust standard errors, number of observations, and R2 across the baseline OLS-HAC model, the WLS specification, and the sensitivity model excluding Mato Grosso (MT).
Table 2 indicates that the main coefficients were qualitatively stable across the baseline, WLS, and MT-excluded specifications. Temperature and feed price remained negatively associated with swine production density, whereas precipitation remained positively associated. This consistency suggests that the main findings are robust to the data imbalance introduced by the limited Mato Grosso series.
2.3. Assumptions and Justification for Variable Selection
Mato Grosso was retained in the analytical sample because of its economic and territorial relevance to the climate–feed–livestock system examined in this study. To reduce potential bias arising from its shorter production series, two robustness procedures were incorporated into the modeling strategy: reduced weighting in the Weighted Least Squares specification and a sensitivity analysis excluding Mato Grosso. These procedures were used to evaluate whether the inclusion of the state materially affected parameter stability. Nevertheless, because Mato Grosso contributed only four monthly observations, the estimated regression relationships were still driven predominantly by Paraná and Rio Grande do Sul. Accordingly, the resulting coefficients should be interpreted as more representative of the southern production context than of the Center-West region.
The analytical specification was assumed to be linear to preserve interpretability and parsimony. Because climatic responses may also involve interaction effects, an alternative specification including a temperature–rainfall interaction term (Temp × Rain_index) was estimated [16]. The interaction coefficient was not significant (p > 0.05) and did not materially improve model fit relative to the baseline model [17]. Therefore, the more parsimonious linear specification was retained.
2.4. Data and Variables
The study employed a comprehensive database built from climatic, feed, and production records for Brazil’s three major swine-producing states: Mato Grosso (MT), Paraná (PR), and Rio Grande do Sul (RS). These states account for a substantial share of national swine production and were selected because they represent distinct climatic and productive contexts rather than uniform environmental conditions. Their inclusion, therefore, enables a comparative assessment of climate–production relationships across heterogeneous thermal and rainfall regimes.
The dependent variable, Y_swine (kg/km2), represented monthly swine production density, calculated as the number of animals per territorial area multiplied by an average slaughter weight of 92 kg per head. This area-based specification was adopted because the study aimed to evaluate the spatial intensity of swine production under heterogeneous climatic conditions across large territorial units. Although this metric is less conventional than farm-level productivity indicators such as total production, heads slaughtered, or kg per sow per year, those alternatives were not consistently available at comparable temporal and regional scales for all states included in the analysis. For this reason, production density was considered the most suitable outcome for linking territorial climatic exposure to state-level production performance. At the same time, this standardization relies on the simplifying assumption that average slaughter weight is constant across states and years. Because this assumption was not directly verified in the present dataset, the resulting measure should be interpreted as an approximate indicator of territorial production rather than a direct zootechnical productivity metric. This specification is consistent with official data from the Brazilian Animal Protein Association (ABPA) [13] and the Brazilian Institute of Geography and Statistics (IBGE) [11].
The independent variables are described as follows:
- Maximum mean monthly temperature (Temp, °C): obtained from state meteorological stations and linearly interpolated to account for intra-annual variation of ±3%. This indicator reflects the primary source of thermal stress, as higher temperatures are known to decrease feed intake, weight gain, and overall productivity [12,18].
- Monthly rainfall index (Rain_index, mm): calculated as the total monthly accumulated precipitation, representing water availability and its moderating effect on ambient temperature and animal comfort. Monthly rainfall values were used directly in the regression model to preserve temporal granularity and ensure consistency with the monthly structure of the swine production dataset. This specification allows the climatic effect of precipitation to be estimated in a way that is directly aligned with the econometric analysis.
- Feed Price (FeedPrice, USD/kg): average feed price derived from CONAB monthly soybean and corn production-cost series [10]. The original data were compiled in current Brazilian reais (BRL) and then converted to USD/kg using a single reference exchange rate from the first semester of 2025 for unit standardization and interpretive comparability. This conversion was not used as a temporal deflator and therefore did not generate the time variation in the series, which remained determined by the underlying monthly CONAB cost data. Thus, FeedPrice should be interpreted as a unit-converted cost indicator rather than as an inflation-adjusted international price series. This variable captures fluctuations in feed input costs, which constitute the primary economic component of swine production systems.
2.5. Modeling Strategy
To evaluate the effects of climatic and contextual variables on swine productivity, a multiple linear regression model was employed. This approach allows estimating the individual influence of each independent variable on the dependent variable (Y_swine, monthly production density), while controlling for potential confounding effects among predictors. The choice of this model is grounded in two key methodological principles. The first is statistical parsimony, which emphasizes using the minimum number of parameters necessary to adequately represent the empirical relationships observed in the data. The second principle concerns the direct interpretability of coefficients, which facilitates sensitivity analysis of climatic and cost-related variables influencing swine production [19]. A linear specification was preferred over more complex dynamic or structural alternatives (such as ARIMA, Vector Autoregression (VAR), or mixed-effects models) for several methodological reasons.
First, the available dataset comprises 216 monthly observations, which constrains the degrees of freedom available for estimating high-parameter dynamic systems. VAR models require estimating multiple lagged endogenous relationships, substantially increasing parameter dimensionality and the risk of overfitting in moderately sized samples. Second, the primary objective of this study is to estimate the marginal sensitivity of productivity to climatic and economic variables, rather than to model multivariate feedback dynamics or generate forecasts. Although more sophisticated models may improve predictive performance, they would impose a higher per-sample parameter cost and potentially reduce coefficient stability. To mitigate potential endogeneity and temporal autocorrelation, the estimation employed Heteroskedasticity and Autocorrelation-Consistent (HAC) robust standard errors, as proposed by Newey and West [20]. This correction ensures valid statistical inference even in the presence of moderate serial dependence by adjusting the covariance matrix of the estimators.
In addition, the model was evaluated for multicollinearity among explanatory variables using the Variance Inflation Factor (VIF). All VIF values remained below the conventional threshold of 10, indicating no severe collinearity. Model adequacy was further evaluated using formal diagnostic procedures, including tests of multicollinearity, residual behavior, and serial dependence, as described in Section 2.7.
2.6. Model Specification
The econometric model adopted in this study is based on the functional relationships among climatic variables, feed costs, and swine production density. The general form of the multiple linear regression equation is expressed in Equation (1).
where is the monthly swine production density (kg/km2), calculated as the number of animals per area multiplied by a standardized average slaughter weight of 92 kg per head. is the maximum mean monthly temperature (°C); is the monthly rainfall index (mm); is the average monthly feed price (USD/kg); is the intercept; , , and are the regression coefficients associated with the explanatory variables; and is the random error term capturing residual variation in swine production density not explained by the model.
Y_swine,t = β0 + β1⋅Tempt + β2⋅Rain_indext + β3⋅FeedPricet + εt.
Tempt is the maximum mean monthly temperature (°C), the primary climatic variable associated with thermal stress; Rain_indext is the monthly rainfall index (mm), representing water availability; FeedPricet is the average monthly feed price (USD/kg), representing the main economic cost component considered in the model; β0 is the intercept, indicating the baseline production level under reference climatic and economic conditions; where β1, β2, and β3 are the regression coefficients associated with the explanatory variables, and εt is the random error term capturing residual variation in swine production density not explained by the model. The model was estimated using Ordinary Least Squares (OLS) with Heteroskedasticity- and Autocorrelation-Consistent (HAC) robust standard errors [21]. To facilitate substantive interpretation, coefficients for monetary variables are discussed in increments that reflect realistic market variation in feed costs.
The specification adopted in this study is linear and therefore captures average partial associations between the explanatory variables and swine production density over the observed data range. It was not designed to estimate biological optimum points, lower thresholds, or upper thresholds for temperature and precipitation. Accordingly, the climatic coefficients should be interpreted as empirical marginal effects within the sample rather than as universal physiological response limits.
Model parameters were evaluated for individual statistical significance using Student’s t-test and for overall significance using the F-test, with a confidence level of α = 0.05. Model fit quality was assessed using the coefficient of determination (R2) and the root mean squared error (RMSE). The model diagnostic procedures are discussed in the subsequent section.
2.7. Statistical Analysis and Model Diagnostics
Diagnostic procedures were conducted to assess the robustness and statistical consistency of the analytical model. The explanatory variables included in the final specification, namely Temp, Rain_index, and FeedPrice, were tested for stationarity using the Augmented Dickey–Fuller (ADF) and KPSS procedures. The results suggest that these variables were stationary in levels at conventional significance thresholds. Therefore, no difference was required, and the model was estimated in level form. Given that the variables in the final specification were integrated of order zero, concerns about spurious regression were not applicable in this context.
Multicollinearity among the independent variables included in the final model was assessed using the Variance Inflation Factor (VIF). The computed values for Temp, Rain_index, and FeedPrice ranged from 1.78 to 2.14, indicating low collinearity among predictors and supporting the stability of the estimated coefficients (Table 3).
Table 3.
Variance Inflation Factor (VIF) values for the independent variables included in the final multiple linear regression model.
Additionally, standardized residuals were analyzed to verify normality, homoscedasticity, and the absence of significant residual autocorrelation. Residual plots and quantile–quantile (Q–Q) plots confirmed that the model met the fundamental assumptions of linear regression. Seasonal patterns in both climatic and production variables were also examined. Monthly seasonal dummy variables were tested in an alternative specification to assess potential confounding associated with the periodicity of temperature and rainfall, which is particularly relevant in tropical and subtropical swine production systems [12,21]. Because their inclusion did not materially alter the main coefficients or improve the model’s interpretability, they were not retained in the final reported specification.
The overall adequacy of the model was assessed using standard goodness-of-fit indicators, residual diagnostics, and tests for serial correlation. Residual plots and quantile–quantile (Q–Q) plots indicated that the model satisfied the main assumptions of linear regression. The Durbin–Watson statistic and Ljung–Box tests up to 12 lags showed no evidence of problematic residual serial dependence. Detailed goodness-of-fit statistics for the final model are presented in the next section.
All analyses were performed using the Python programming language (version 3.12; [22]), with the statsmodels [23], pandas [24], numpy [25], and matplotlib libraries [26]. These tools supported parameter estimation, diagnostic testing, and visualization of results, ensuring the reproducibility and transparency of the analytical process.
3. Results
This section presents the empirical findings, focusing on how variations in climatic variables, particularly temperature and rainfall, together with feed-related economic conditions, influenced swine production density across key Brazilian states. The results of the multiple linear regression model showed significant relationships between the climatic variables, FeedPrice, and swine production density. The estimated coefficients confirm that both climatic and economic factors exert measurable effects on production performance, aligning with the theoretical expectations discussed in previous sections.
Econometric Model Results
The results of the multiple linear regression model (estimated using Ordinary Least Squares (OLS) with Heteroskedasticity and Autocorrelation Consistent (HAC) robust standard errors) revealed significant relationships between the climatic variables, feed cost, and swine production density. The estimated coefficients confirmed that both climatic and economic factors exerted measurable effects on productivity, aligning with the theoretical expectations discussed in previous sections.
The detailed regression outputs are presented in Table 4, including the estimated coefficients, standard errors, t-values, significance levels, and summary fit statistics. Before turning to the regression estimates, it is important to note that monthly swine production density exhibited substantial temporal variation over the study period, reflecting the heterogeneous production dynamics of the states analyzed. This variation did not occur independently of the explanatory variables: periods of higher temperature tended to coincide with lower production density, whereas higher rainfall tended to be associated with comparatively more favorable production levels. Likewise, increases in feed price were generally accompanied by lower production density, consistent with the cost-pressure mechanism examined in the econometric model. These descriptive patterns do not replace formal statistical testing, but they are consistent with the direction of the estimated coefficients reported below.
Table 4.
Multiple linear regression results for swine production density (effective analytical window: 2014–2024).
To facilitate interpretation, the estimated linear model can be expressed in terms of its partial slopes. Holding the other variables constant, swine production density decreases by 1,342,369 kg/km2 for each 1 °C increase in maximum mean temperature and increases by 182,362 kg/km2 for each additional millimeter of precipitation. These coefficients represent average marginal effects within the observed sample range and should not be interpreted as implying that the biological response is strictly linear over all climatic conditions.
The estimated coefficients indicated that both temperature and feed price were negatively associated with swine production density and remained significant in the model, whereas precipitation (Rain_index) showed a positive and significant association. A 1 °C increase in maximum mean temperature was associated with an average reduction of approximately 1.34 × 10⁶ kg/km2 in production density. Conversely, holding the other variables constant, each additional millimeter of rainfall was associated with an average increase of approximately 1.82 × 10⁵ kg/km2 in swine production density. This rainfall coefficient should be interpreted as a conditional marginal effect within the regression model rather than as a simple seasonal correlation between wetter months and higher output.
The mean feed price (FeedPrice) exhibited a significant negative correlation with swine output, suggesting that escalating input costs act as a constraint on production. Because FeedPrice is expressed in USD/kg, a one-unit increase would represent a very large market shock and is therefore not the most informative basis for interpretation. For this reason, the coefficient is interpreted using a 0.173 USD/kg increase, which reflects a more realistic variation within the observed data range; at this scale, the model indicates an average decline of approximately 6.2 × 10⁶ kg/km2 in production density.
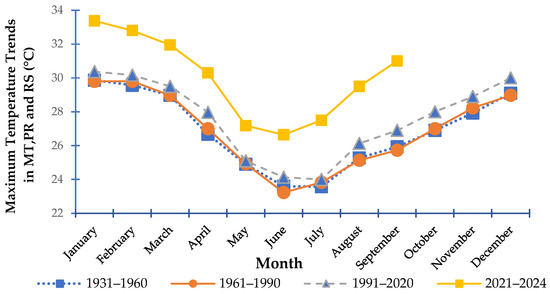
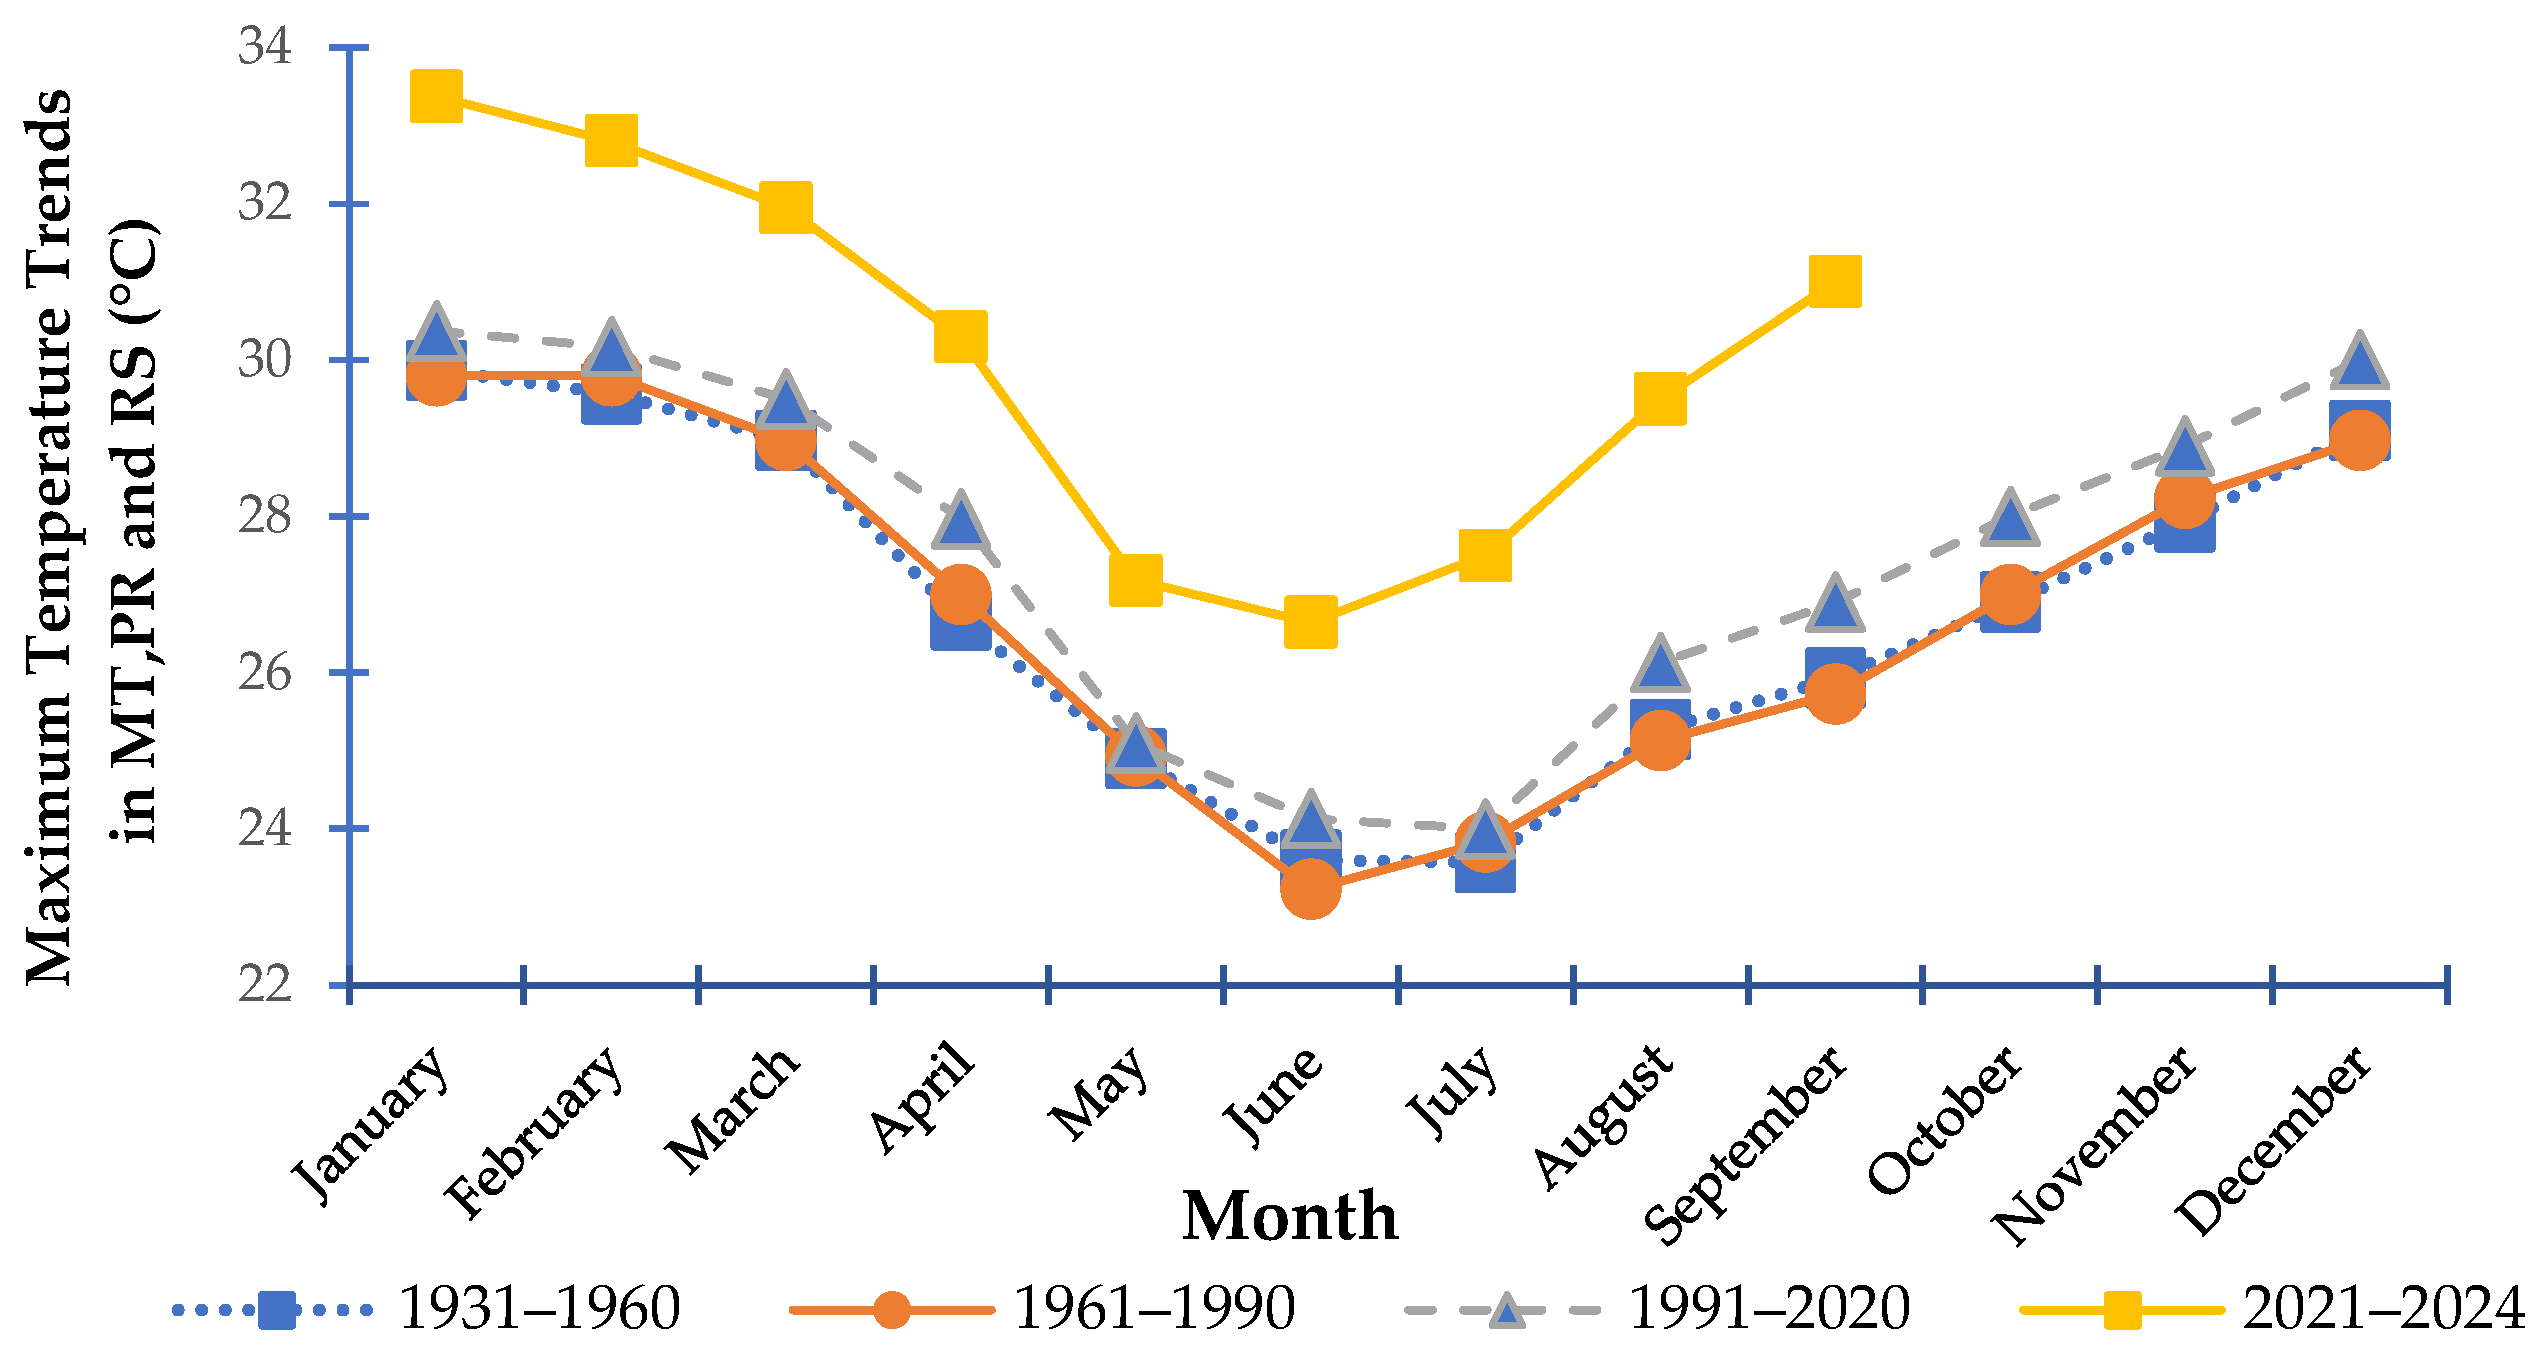
Figure 2 presents the monthly maximum temperature trends for Mato Grosso, Paraná, and Rio Grande do Sul over the study period, showing an increase in recent years. The model explained 16.2% of the monthly variation in swine production density (R2 = 0.162; adjusted R2 = 0.150). Despite the statistical significance of the coefficients, the model’s limited explanatory power suggested that considerable variation was not captured by the variables included in the present specification. The RMSE (1.99 × 10⁶ kg/km2), therefore, should be interpreted as a descriptive measure of residual dispersion rather than evidence of strong predictive performance.
Figure 2.
Regional monthly maximum temperature trends in the states of Mato Grosso—MT, Paraná—PR, and Rio Grande do Sul—RS (°C, monthly averages).
Robustness comparisons across the baseline, WLS, and MT-excluded specifications are reported in Table 1 and show no major qualitative change in the main coefficients.
4. Discussion
This study analyzed the influence of climatic and economic variables on Brazilian swine productivity from 2007 to 2024, using a monthly time series covering the country’s main producing states, including Mato Grosso, Paraná, and Rio Grande do Sul. Through a multiple linear regression model with Heteroskedasticity and Autocorrelation Consistent (HAC) correction (Newey–West), the effects of maximum mean temperature, precipitation (Rain_index), and average feed price on swine production density (kg/km2) were estimated. However, because Mato Grosso’s contribution to the analytical sample was minimal relative to Paraná and Rio Grande do Sul, the empirical pattern captured by the model primarily reflects the climatic and production conditions of the southern states, and caution is warranted when extending these results to the Center-West.
The results indicated that climatic and economic variables were significantly associated with swine production density in the analyzed states. However, the model explained only 16.2% of the monthly variation in the dependent variable, indicating that most short-term variability remained outside the scope of the present specification. This limited explanatory power requires a cautious interpretation of the estimated coefficients. The model should not be interpreted as a comprehensive causal representation of swine production dynamics, but rather as a parsimonious framework identifying directional associations among temperature, precipitation, feed price, and swine production density. The large unexplained share of variance likely reflects additional determinants not explicitly modeled here, including management practices, housing conditions, genetics, sanitary events, logistics, technological heterogeneity, and other regional or temporal factors. Accordingly, the present findings should be interpreted as informative but partial evidence regarding the climate–economy interface of swine production, and the policy implications should be understood as selective and contextual rather than exhaustive.
Pig physiology is characterized by stage-specific thermal comfort ranges, and previous studies indicate that thermoneutral conditions vary according to age, production phase, and housing environment. For example, reviews of pig thermal physiology and commercial sow environments have reported thermoneutral ranges near 15–20 °C for gestating sows, while heat stress effects on performance intensify outside such comfort zones. Therefore, the present results should be interpreted as average linear effects across the observed climatic range of the sample, rather than as estimates of biological optima or maximum tolerable thresholds. Future studies should test quadratic, spline, or threshold-based models to more precisely identify nonlinear patterns in climatic responses. This limitation also implies that the estimated coefficients, although statistically significant, should not be overinterpreted as isolated drivers of production outcomes, since their magnitudes are conditioned by a simplified model structure that leaves a large share of variation unexplained.
Despite these climatic pressures, a descriptive comparison of period averages indicated that production density increased by 12.7%, from 35.6 × 10⁶ to 40.2 × 10⁶ kg/km2, while average maximum temperature increased by 2.4 °C (Figure 2) and rainfall declined by 14% between 2007–2020 and 2021–2024. Because this comparison is descriptive and not based on regression-adjusted predictions or formal trend testing, it should be interpreted as contextual evidence rather than as a statistically tested effect.
An implication of the model’s relatively low explanatory power (R2 = 0.162) is that the estimated coefficients must be interpreted with caution. Although the associations identified for temperature, precipitation, and feed price were statistically significant, the model explained only a modest share of the monthly variation in swine production density. Accordingly, these coefficients should not be read as a complete causal representation of production dynamics, but rather as conditional associations obtained within a simplified specification centered on a small set of climatic and economic variables. The large unexplained share of variance likely reflects additional determinants not modeled here, including management practices, housing conditions, genetics, sanitary events, logistics, technological heterogeneity, and other regional or temporal factors. For this reason, the policy implications of the findings should be understood as selective and contextual, highlighting relevant exposure pathways rather than providing an exhaustive basis for prediction or intervention.
Our results suggest direct implications for the climatic and economic management of Brazil’s swine production, particularly under increasing temperature variability and rising production costs [2,27,28]. The effects identified for temperature, precipitation, and feed prices point to the importance of integrated adaptation measures at both farm and sectoral scales, consistent with the wider literature on climate-related pressures in livestock systems [2,29]. Adjustments in environmental control systems, nutritional management, and thermally efficient housing can partially mitigate the adverse effects of heat stress and rainfall variability [12,30]. The comparative design adopted here is based on climatic heterogeneity across states, not on environmental uniformity, which is why the estimated relationships should be interpreted as operating across distinct regional production contexts.
Despite these climatic pressures, production density increased by 12.7%, from 35.6 × 10⁶ to 40.2 × 10⁶ kg/km2, even amid an average temperature rise of 2.4 °C (Figure 2) and a 14% decline in rainfall between 2007–2020 and 2021–2024. This pattern suggests that the observed production trajectory cannot be explained by climatic and feed-cost variables alone and may also reflect additional determinants not explicitly modeled in the present analysis. Because these factors were not directly measured, no specific causal attribution can be made regarding their relative contributions.
Our findings collectively indicate that environmental and economic factors associated with climate change significantly influence livestock production outcomes, consistent with previous studies [27,31,32,33]. Elevated maximum mean temperatures appear to be associated with swine performance in ways that are consistent with the physiological literature on reduced feed intake, weight gain, and thermal comfort under heat stress [12,34]. Quantitatively, each 1 °C increase in maximum mean monthly temperature was associated with an estimated reduction of approximately 1.34 × 10⁶ kg/km2 in production density, highlighting the sector’s vulnerability to heat waves and shifts in regional temperature regimes.
Precipitation plays a complementary role by moderating thermal stress and sustaining feed production, whereas reduced rainfall contributes to lower grain yields and heightened input costs. Taken together, these associations are consistent with the sensitivity of Brazilian swine production to both climatic variability and feed market dynamics, underscoring the need for regionally tailored adaptation and mitigation strategies in intensive pig farming systems [1,12,35]. Our results (Table 4) suggest that higher monthly rainfall contributes to more favorable environmental conditions for swine production, likely by reducing thermal stress and supporting regional feed production. These findings emphasize the role of humidity and natural ventilation as relevant regulators of microclimatic conditions within production facilities [12].
Mitigation strategies such as the adoption of ventilation and evaporative cooling systems, reflective roofing materials, and heat-adapted diet formulations have proven effective in maintaining performance under moderate thermal stress conditions [1,12]. Moreover, water management, particularly storage and redistribution during dry periods, emerges as a key measure for maintaining production stability in regions with marked seasonal rainfall variability, as also suggested by the positive coefficient estimated for Rain_index.
Moreover, the estimated positive coefficient for Rain_index suggests that water availability is relevant to production stability in regions with marked seasonal rainfall variability. From a management perspective, this result supports the importance of water storage and redistribution strategies during dry periods. Reductions in domestic corn production may alter grain availability and intensify price volatility, thereby increasing feed costs and placing pressure on swine-production profitability, particularly in systems highly dependent on corn-based diets. Incentives for crop–livestock integration, local input production, and the use of agro-industrial by-products [36] could reduce the production chain’s vulnerability to both climatic and market shocks [10,14]. Together, these strategies would strengthen the sector’s resilience and reduce the impacts of climate change on food security and regional economic balance [9].
The results underscore the need to integrate climatic risk into management strategies and public policy frameworks for Brazil’s swine production sector. The estimated marginal effects are economically substantial: a 1 °C increase in maximum temperature is associated with a reduction of 1.34 × 10⁶ kg/km2, while a 0.173 USD/kg rise in feed prices corresponds to a decline of approximately 6.2 × 10⁶ kg/km2. These magnitudes indicate that both thermal stress and grain market volatility represent systemic risks to production stability.
From a policy perspective, adaptation measures should prioritize: (1) investments in thermal mitigation infrastructure, including ventilation, evaporative cooling systems, and thermally efficient housing materials [12,30]; (2) improved water storage and redistribution systems to buffer rainfall variability; and (3) mechanisms to stabilize feed supply chains, such as crop–livestock integration, strategic grain reserves, and incentives for diversified feed sources [36,37,38].
These strategies are consistent with Brazil’s Nationally Determined Contribution (NDC) under the Paris Agreement, which emphasizes climate-resilient agricultural systems, low-carbon livestock practices, and sustainable land-use management [4,9,39]. Strengthening adaptive capacity in the swine sector, therefore, contributes not only to production stability but also to national climate-mitigation and food-security commitments.
Beyond the immediate policy implications, several research avenues warrant further exploration. Future studies should examine dynamic and lagged climate–productivity relationships using advanced econometric approaches, such as the generalized method of moments (GMM) or autoregressive distributed lag (ARDL) models, to better capture delayed and cumulative climatic effects. Integrating higher-resolution spatial datasets may also improve the identification of regional heterogeneity in climate sensitivity. In parallel, greater attention should be directed toward biological adaptation mechanisms, including heat-tolerant genetics, feed efficiency under thermal stress, and animal welfare indicators, which are increasingly recognized as critical dimensions of climate-resilient livestock systems [39,40].
Establishing regional observatories for climate and animal production could enable continuous monitoring of environmental and productivity indicators, fostering evidence-based governance. Such platforms should integrate data on climate, feed costs, productivity, and management practices, helping both producers and policymakers make adaptive decisions. The adoption of digital tools and early-warning systems, linked to econometric models such as the one developed in this study, would strengthen the resilience of the tropical and subtropical swine industry worldwide.
Despite ongoing climatic and economic pressures, the Brazilian swine sector exhibits measurable adaptive capacity, supported by technological innovation, genetic improvement, and enhanced management practices. However, projected warming trends and increasing climate variability suggest that future productivity gains may face structural limits if adaptation efforts are not continuously strengthened [5,27,40]. Sustained resilience will therefore depend on integrating climate-risk assessment into long-term sectoral planning and investment strategies.
From a methodological perspective, this study contributes by integrating climatic, economic, and productive variables into a high-resolution monthly analytical framework and adjusting for HAC-robust errors to control for serial correlation and heteroskedasticity. This approach provides an empirical foundation for future research on the effects of climate on animal productivity. It represents a methodological advancement in the application of adaptive econometric techniques to Brazilian agricultural data.
A primary limitation of this analysis concerns the incomplete production dataset for Mato Grosso, one of Brazil’s leading grain- and livestock-producing states, for which only four months of swine production data were available. This contrasts with the more complete multi-year datasets for Paraná and Rio Grande do Sul. Such asymmetry reduces the representativeness of Mato Grosso-specific effects and limits the extent to which seasonal dynamics can be fully captured for that state. Although reduced weighting and sensitivity analysis were used to mitigate this imbalance, the pooled regression remained empirically dominated by the southern states. Therefore, the estimated coefficients should be interpreted as stronger evidence for the climatic and economic relationships observed in Paraná and Rio Grande do Sul than for the distinct production context of the Center-West.
A further limitation is that Y_swine was standardized using a constant slaughter weight of 92 kg/head across states and years. Although this facilitated spatial comparability, the assumption was not directly verified and may introduce measurement error if actual slaughter weights vary across regions or over time.
While the multiple linear regression framework provided a transparent and policy-relevant analytical approach, it had important limitations. Most notably, the model explained only a modest fraction of the monthly variation in swine production density, indicating that a large share of production dynamics was associated with factors not represented in the present specification. In addition, the model may not fully capture threshold or nonlinear physiological responses to climate extremes; for instance, abrupt heat spikes could cause disproportionately greater productivity losses than gradual temperature increases.
Nonlinear terms (e.g., quadratic or spline regressions), generalized additive models, or richer panel specifications including additional structural and managerial covariates could be applied in future studies to better represent biological responses and the broader determinants of livestock productivity. Thus, the present approach should be viewed as a transparent and interpretable first-step model rather than as a complete causal representation of climate-driven swine production dynamics.
Future research should also address variables not examined here (irrigation practices, feed composition, and disease incidence) by using higher-resolution spatial datasets and mixed-effects or multilevel modeling frameworks to distinguish better climate-induced from management-related effects. While the multiple linear regression framework provides a transparent and policy-relevant analytical approach, it may not fully capture threshold or nonlinear physiological responses to climate extremes. For instance, abrupt heat spikes could cause disproportionately greater productivity losses compared to gradual temperature increases.
Nonlinear terms (e.g., quadratic or spline regressions) or generalized additive models (GAMs) could be applied in future studies to better capture patterns of biological responses and climatic variability. Despite these constraints, the present approach establishes a robust, interpretable, and replicable foundation for quantifying climate-driven dynamics in swine productivity. It also provides a valuable empirical baseline for subsequent modeling efforts that integrate environmental, economic, and biological dimensions of livestock production.
5. Conclusions
This study indicates that swine production density in the analyzed Brazilian states is associated with climatic and economic conditions, particularly maximum temperature, rainfall, and feed price. Higher temperatures and feed prices were linked to lower production density, whereas rainfall showed a positive association. However, these findings should be interpreted with caution because the model explained only a modest share of the monthly variation, the dataset was geographically imbalanced and dominated by the southern states, and the regression specification assumed linear relationships that may not fully capture threshold or nonlinear climatic responses. Accordingly, the results should be understood as partial evidence on the climate–economy interface of swine production rather than as a complete causal account of production dynamics.
Supplementary Materials
The dataset supporting information can be downloaded at: https://github.com/rommaia/dados_artigos.git (accessed on 29 March 2026).
Author Contributions
All authors contributed to the conception and design of the study. R.F.d.S.M. performed material preparation, data collection, software, and analysis. R.F.d.S.M. wrote the first draft of the manuscript. I.d.A.N. supervised the research. I.d.A.N. wrote the final and polished version of the manuscript. All authors have read and agreed to the published version of the manuscript.
Funding
This research received no external funding.
Institutional Review Board Statement
Not applicable.
Data Availability Statement
The dataset provided in Supplementary Materials is the same dataset used in the study.
Acknowledgments
The authors thank the Coordination for the Improvement of Higher Education Personnel (CAPES/PROSUP) for a doctoral scholarship to the first author; and the Centro Universitário Senac—Santo Amaro and the Paulista University for helping with the APC.
Conflicts of Interest
The authors declare no conflicts of interest.
References
- Godde, C.M.; Mason-D’Croz, D.; Mayberry, D.E.; Thornton, P.K.; Herrero, M. Impacts of climate change on the livestock food supply chain: A review of the evidence. Glob. Food Secur. 2021, 28, 100488. [Google Scholar] [CrossRef] [Scilit] [PubMed]
- Ferreira, N.C.R.; Andrade, R.R.; Ferreira, L.N. Climate change impacts on livestock in Brazil. Int. J. Biometeorol. 2024, 68, 2693–2704. [Google Scholar] [CrossRef] [Scilit] [PubMed]
- Hörtenhuber, S.J.; Lindenthal, T.; Zollitsch, W.; Lindorfer, J.; Niebuhr, K.; Piringer, G.; Anders, I.; Andre, K.; Hennig-Pauka, I.; Schönhart, M.; et al. The effect of climate change-induced temperature increase on the performance and environmental impact of intensive pig production systems. Sustainability 2020, 12, 9442. [Google Scholar] [CrossRef] [Scilit]
- IPCC. Summary for policymakers. In Climate Change 2021: The Physical Science Basis. Contribution of Working Group I to the Sixth Assessment Report of the Intergovernmental Panel on Climate Change; IPCC: Geneva, Switzerland, 2021. [Google Scholar]
- Tui, S.H.K.; Descheemaeker, K.; Valdivia, R.O.; Masikati, P.; Sisito, G.; Moyo, E.N.; Crespo, O.; Ruane, A.C.; Rosenzweig, C. Climate change impacts and adaptation for dryland farming systems in Zimbabwe: A stakeholder-driven integrated multi-model assessment. Clim. Change 2021, 168, 10. [Google Scholar] [CrossRef] [Scilit]
- Abbass, K.; Qasim, M.Z.; Song, H.; Murshed, M.; Mahmood, H.; Younis, I. A review of the global climate change impacts, adaptation, and sustainable mitigation measures. Environ. Sci. Pollut. Res. 2022, 29, 42539–42559. [Google Scholar] [CrossRef] [Scilit]
- Dhifaoui, Z.; Ben Jabeur, S.; Guesmi, K. Exploring the effect of climate risk on agricultural and food stock prices. J. Environ. Manag. 2023, 326, 116789. [Google Scholar] [CrossRef] [Scilit]
- Khalfaoui, R.; Ben Jabeur, S.; Guesmi, K. Impact of climate risk shocks on global food and agricultural commodity markets. Int. Rev. Financ. Anal. 2024, 93, 103206. [Google Scholar] [CrossRef] [Scilit]
- Zilli, M.; Scarabello, M.; Soterroni, A.C.; Valin, H.; Mosnier, A.; Leclère, D.; Havlík, P.; Kraxner, F.; Lopes, M.A.; Ramos, F.M. The impact of climate change on Brazil’s agriculture. Sci. Total Environ. 2020, 740, 139384. [Google Scholar] [CrossRef] [Scilit]
- CONAB—National Supply Company. Online Agricultural Information 2024. Available online: https://portaldeinformacoes.conab.gov.br/ (accessed on 10 October 2024).
- IBGE—Brazilian Institute of Geography and Statistics. Produção Agropecuária no Brasil 2024. Available online: https://www.ibge.gov.br/estatisticas/economicas/agricultura-e-pecuaria/9117-producao-agricola-municipal-culturas-temporarias-e-permanentes.html?=&t=resultados (accessed on 10 September 2024).
- Renaudeau, D.; Collin, A.; Yahav, S.; De Basilio, V.; Gourdine, J.L.; Collier, R.J. Adaptation to hot climate and strategies to alleviate heat stress in livestock production. Animal 2012, 6, 707–728. [Google Scholar] [CrossRef] [Scilit]
- ABPA—Brazilian Association of Animal Protein—2024 Report. Available online: https://abpa-br.org/ (accessed on 28 November 2024).
- FAO—Food and Agriculture Organization of the United Nations. FAOSTAT 2024. Available online: https://www.fao.org/statistics/data-releases/en (accessed on 23 January 2025).
- Ali, B.M.; van Zanten, H.H.; Berentsen, P.; Bastiaansen, J.W.; Bikker, P.; Oude Lansink, A. Environmental and economic impacts of using co-products in the diets of finishing pigs in Brazil. J. Clean. Prod. 2017, 162, 247–259. [Google Scholar] [CrossRef] [Scilit]
- Almazroui, M.; Ashfaq, M.; Islam, M.N.; Rashid, I.U.; Kamil, S.; Abid, M.A.; O’Brien, E.; Ismail, M.; Reboita, M.S.; Sörensson, A.A.; et al. Assessment of CMIP6 Performance and Projected Temperature and Precipitation Changes Over South America. Earth Syst. Environ. 2021, 5, 155–183. [Google Scholar] [CrossRef] [Scilit]
- Majumdar, J.; Naraseeyappa, S.; Ankalaki, S. Analysis of agriculture data using data mining techniques: Application of big data. J. Big Data 2017, 4, 20. [Google Scholar] [CrossRef] [Scilit]
- INMET—National Institute of Meteorology 2024. Available online: https://portal.inmet.gov.br/ (accessed on 9 September 2024).
- Wooldridge, J.M. Introductory Econometrics: A Modern Approach, 6th ed.; South-Western Cengage Learning: Boston, MA, USA, 2016. [Google Scholar]
- Newey, W.K.; West, K.D. A simple, positive semi-definite, heteroskedasticity and autocorrelation consistent covariance matrix. Econometrica 1987, 55, 703–708. [Google Scholar] [CrossRef] [Scilit]
- Kim, J.H. Multicollinearity and misleading statistical results. Korean J. Anesthesiol. 2019, 72, 558–569. [Google Scholar] [CrossRef] [Scilit]
- Python Software Foundation. Python Language Reference. Version 3.12.10. 2024. Available online: http://www.python.org (accessed on 13 December 2024).
- Seabold, S.; Perktold, J. Statsmodels: Econometric and statistical modeling with Python. In Proceedings of the 9th Python in Science Conference (SciPy 2010), Austin, TX, USA, 28 June–3 July 2010; pp. 92–96. [Google Scholar] [CrossRef] [Scilit]
- McKinney, W. Data structures for statistical computing in Python. In Proceedings of the 9th Python in Science Conference (SciPy 2010), Austin, TX, USA, 28 June–3 July 2010; pp. 56–61. [Google Scholar] [CrossRef] [Scilit]
- Harris, C.R.; Millman, K.J.; Van Der Walt, S.J.; Gommers, R.; Virtanen, P.; Cournapeau, D.; Wieser, E.; Taylor, J.; Berg, S.; Smith, N.J.; et al. Array programming with NumPy. Nature 2020, 585, 357–362. [Google Scholar] [CrossRef] [Scilit]
- Hunter, J.D. Matplotlib: A 2D graphics environment. IEEE Comput. Sci. Eng. 2007, 9, 90–95. [Google Scholar] [CrossRef] [Scilit]
- Rust, J.M. The impact of climate change on extensive and intensive livestock production systems. Anim. Front. 2019, 9, 20–25. [Google Scholar] [CrossRef] [Scilit]
- Jasrotia, R.; Dhar, M.; Langer, S. Climate Change Impacts on Animal Production. In Global Agricultural Production: Resilience to Climate Change; Ahmed, M., Ed.; Springer International Publishing: Cham, Switzerland, 2022; pp. 311–333. [Google Scholar]
- Nardone, A.; Ronchi, B.; Lacetera, N.; Ranieri, M.S.; Bernabucci, U. Effects of climate change on animal production and the sustainability of livestock systems. Livest. Sci. 2010, 130, 57–69. [Google Scholar] [CrossRef] [Scilit]
- Lancaster, L.T.; Fuller, Z.L.; Berger, D.; Barbour, M.A.; Jentoft, S.; Wellenreuther, M. Understanding climate change response in the age of genomics. J. Anim. Ecol. 2022, 91, 1056–1063. [Google Scholar] [CrossRef] [Scilit]
- Barlow, K.M.; Christy, B.P.; O’Leary, G.J.; Riffkin, P.A.; Nuttall, J.G. Simulating the impact of extreme heat and frost events on wheat crop production: A review. Field Crops Res. 2015, 171, 109–119. [Google Scholar] [CrossRef] [Scilit]
- Farooq, M.S.; Uzair, M.; Raza, A.; Habib, M.; Xu, Y.; Yousuf, M.; Yang, S.H.; Ramzan Khan, M. Uncovering the Research Gaps to Alleviate the Negative Impacts of Climate Change on Food Security: A Review. Front. Plant Sci. 2022, 13, 927535. [Google Scholar] [CrossRef] [Scilit] [PubMed]
- Gaikwad, D.; Rokade, J.; Kadam, M.; Bhattacharjee, M. Impact of Climate Change on Livestock and Poultry for Sustainable Food Production. In Sustainable Food Systems (V.I). World Sustainability Series; Thakur, M., Ed.; Springer Nature: Cham, Switzerland, 2024; pp. 437–442. [Google Scholar]
- Omotosho, O.O.; Fowowe, O.; Abiola, J.O.; Oyagbemi, A.A.; Omobowale, T.O. High Environmental Temperature Induces Oxidative Stress, Reduced Sow Productivity, and Increased Piglet Mortality. J. Appl. Vet. Sci. 2024, 9, 42–54. [Google Scholar] [CrossRef] [Scilit]
- Descheemaeker, K.; Zijlstra, M.; Masikati, P.; Crespo, O.; Tui, S.H.K. Effects of climate change and adaptation on the livestock component of mixed farming systems: A modeling study from semi-arid Zimbabwe. Agric. Syst. 2018, 159, 282–295. [Google Scholar] [CrossRef] [Scilit]
- Lee, J.; Zijlstra, R.; Nyachoti, M. Evaluation and Improvement of the Nutritional Value of co-Products for swine. J. Anim. Sci. 2022, 100, 76. [Google Scholar] [CrossRef] [Scilit]
- Anderson, R.; Bayer, P.E.; Edwards, D. Climate change and the need for agricultural adaptation. Curr. Opin. Plant Biol. 2020, 56, 197–202. [Google Scholar] [CrossRef]
- Sun, H.; Jiang, Z.; Chen, Z.; Liu, G.; Liu, Z. Effects of fermented unconventional protein feed on pig production in China. Front. Vet. Sci. 2024, 11, 1446233. [Google Scholar] [CrossRef] [Scilit]
- Weindl, I.; Lotze-Campen, H.; Popp, A.; Müller, C.; Havlík, P.; Herrero, M.; Schmitz, C.; Rolinski, S. Livestock in a changing climate: Production system transitions as an adaptation strategy for agriculture. Environ. Res. Lett. 2015, 10, 094021. [Google Scholar] [CrossRef] [Scilit]
- Mayorga, E.J.; Renaudeau, D.; Ramirez, B.C.; Ross, J.W.; Baumgard, L.H. Heat stress adaptations in pigs. Anim. Front. 2019, 9, 54–61. [Google Scholar] [CrossRef] [Scilit]

Disclaimer/Publisher’s Note: The statements, opinions and data contained in all publications are solely those of the individual author(s) and contributor(s) and not of MDPI and/or the editor(s). MDPI and/or the editor(s) disclaim responsibility for any injury to people or property resulting from any ideas, methods, instructions or products referred to in the content. |
© 2026 by the authors. Licensee MDPI, Basel, Switzerland. This article is an open access article distributed under the terms and conditions of the Creative Commons Attribution (CC BY) license.