


Abstract
Agriculture contributes 23% of global carbon emissions, with crop cultivation now exceeding livestock as China’s primary emission source, yet how cropping structure evolution drives regional differentiation remains insufficiently quantified. This study examines the Northeast Plain, Huang-Huai-Hai Plain, Middle-Lower Yangtze River Plain, and Xinjiang-Gansu using carbon accounting, LMDI decomposition, and correlation analysis (2000–2021). Cropping structure dominates spatial emission heterogeneity: the Northeast’s shift to corn monoculture (63.6% share) created a carbon hotspot; Huang-Huai-Hai’s wheat–corn rotation (>64%) generated the highest northern intensity; the Yangtze region maintained moderate growth through diversification; and Xinjiang-Gansu showed “scale-intensity dual growth” under arid constraints. Structural effects drove cumulative growth (+1.85 Mt and +1.33 Mt), while regional drivers differed—mechanization scale (r = 0.90), fertilizer dependency (r = 0.84), irrigation–carbon coupling (r = 0.94), and irrigation–fertilizer synergy. The 2015 fertilizer policy marked a turning point in intensity. Differentiated strategies—rotation optimization, input efficiency, water–heat synergy, and water-saving technology—can synergize food security with carbon neutrality.
1. Introduction
Agriculture is a significant source of greenhouse gas emissions, accounting for 23% of global carbon emissions [1,2]. In China, crop cultivation has now surpassed livestock as the primary source of agricultural emissions [3]. Within this sector, cropping patterns—the composition and combination of crops—are a core determinant of carbon emissions, influencing fertilizer application, energy consumption, and soil management practices [4]. Researchers have employed decomposition methods like the Logarithmic Mean Divisia Index (LMDI) to disentangle the drivers of agricultural emissions. For instance, a study of the Baltic States identified agricultural economic growth as a key driver of emissions increases, while declining employment and GHG intensity contributed to reductions [5]. At the global level, research has found that technology gaps and industrial structure drive higher emissions in developing countries, whereas land-use change is more significant in developed nations [6]. These studies consistently highlight the importance of agricultural structure in shaping emission profiles. However, they often rely on national or farm-level data or examine structural factors defined at an aggregate sectoral level, leaving a gap in fine-grained analysis. In recent years, scholars have increasingly examined the relationship between cropping structure and carbon emissions at multiple scales, including the national level [7,8], provincial levels [9,10,11], and county level [11]. Despite this progress, systematic assessment of cross-regional differences remains limited. The LMDI model is particularly suited for addressing this gap due to its ability to provide perfect decomposition without residuals [12]. While previous applications in both Chinese and international contexts have decomposed emissions by factors such as economic scale, labor, and intensity [8,10], the specific contribution of cropping pattern changes at a disaggregated, crop-composition level remains underexplored.
As an agricultural powerhouse, China exhibits significant regional variability in crop carbon emissions due to differences in resource endowments and cropping systems [13]. As shown in Figure 1, this study selects eight provinces across four major production zones as representative samples: the Northeast Plain (Heilongjiang, Liaoning), characterized by a temperate climate and dominated by corn and soybean cultivation; the Huang-Huai-Hai Plain (Henan, Shandong), with a warm temperate climate and a wheat–corn rotation system; the Middle-Lower Yangtze Plain (Jiangxi, Hubei), featuring a subtropical climate and rice-based cropping; and the Xinjiang-Gansu region, an arid northwest area combining wheat, corn, cotton, and potato production. Together, these regions form the core of China’s grain and characteristic agricultural product supply, contributing 50%, 58%, and 32% of national corn, wheat, and rice output. Their distinct climate, soil, and cropping combinations create a natural ideal gradient for examining the relationship between cropping structure and crop carbon emissions.
Figure 1.
Overview map of the study area. Note: The provincial administrative boundaries were derived from the “Standard Map Service System” of the Ministry of Natural Resources of the People’s Republic of China (http://bzdt.ch.mnr.gov.cn, accessed on 23 February 2026) with the map review number GS(2022)4308. The agricultural zoning boundaries were sourced from the Open Source Geospatial Foundation (OSGeo, https://osgeo.cn/map/m0007/, accessed on 23 February 2026).
To address this gap, this study has four objectives: (1) systematically examine the spatiotemporal evolution of cropping patterns and crop carbon emissions; (2) identify region-specific correlations between key agricultural practices and carbon emissions; (3) quantify the contribution of different crop types to regional emissions; and (4) employ the LMDI model to decompose the drivers of emission changes, with a specific focus on isolating the structural effect of cropping pattern shifts. We hypothesize that cropping pattern changes are the primary driver of spatial heterogeneity in crop carbon emissions across China’s major grain hubs and that the direction and magnitude of this structural effect are mediated by region-specific factors—namely, mechanization levels, fertilizer dependency, and irrigation practices. By testing this hypothesis, we aim to reveal the intrinsic logic of how cropping structure influences carbon emissions and provide a scientific basis for regionally differentiated emission reduction strategies that align with national food security goals.
2. Materials and Methods
2.1. Data Sources
The time series of data used for this study covers the period from 2000 to 2021. The cropping areas of major crops in the eight provinces were obtained from the China Agricultural Yearbook, the China Rural Statistical Yearbook, and the statistical yearbooks of each province. Some detailed data were supplemented and verified by the statistical bulletins of each province. Data on fertilizer, pesticide, agricultural film usage, agricultural machinery power, and diesel consumption required for crop carbon emissions accounting were sourced from the China Agricultural Yearbook, the China Environmental Statistics Yearbook, and the National Bureau of Statistics website. Crop cropping areas were cross-checked to ensure consistency, and missing data were interpolated using the average of adjacent years (accounting for <3%). All data were standardized to ensure consistency.
2.2. Research Methods
2.2.1. Standardization of Cropping Structures
The four-tier crop classification system constructed in this study is divided in a hierarchical progressive manner, with a clear definition of high- and low-carbon emission crops (Table 1). The classification of high- and low-carbon emission crops is based on differences in life cycle carbon footprints, referring to the crop carbon emission coefficients in the [14] (IPCC, 2013) inventory, the results of regional-specific corrections, and relevant literature to define high- and low-carbon crops [14,15]. Specifically, the four-tier system is structured as follows:
Table 1.
Definition and classification justification of high- and low-carbon crops.
- Tier 1: Four major categories (grain, cash crops, vegetables, and others);
- Tier 2: Subdivision of Tier 1 (grain: cereals, legumes, and tubers; cash crops: oilseeds, cotton, sugar crops, bast fibers, and tobacco; others: fruits, medicinal materials, and forage);
- Tier 3: Core crop types under Tier 2 subcategories (e.g., cereals: rice, wheat, and corn; oilseeds: peanuts, sesame, and rapeseeds);
- Tier 4: Subdivisions of Tier 3 crops (e.g., rice: early rice, middle rice, single-cropping late rice, and double-cropping late rice).
2.2.2. Carbon Emission Calculation
The research focuses on constructing a carbon emission accounting system for six major carbon sources: diesel, fertilizers, pesticides, agricultural films, irrigation, and plowing [25]. On the basis of integrating practical production experience and existing research achievements, and with the participation of professional expert consultations, this study defines the main sources of crop cultivation carbon emissions by focusing on the core connotation of low-carbon cultivation—namely, minimizing the use of high-carbon agricultural inputs and mitigating soil organic carbon degradation during production. Specifically, these sources include four key aspects: carbon emissions directly or indirectly triggered by the application of agricultural inputs like chemical fertilizers, pesticides, and agricultural films; greenhouse gas releases resulting from diesel consumption by agricultural machinery; carbon emissions associated with electrical energy use in irrigation operations; and soil organic carbon loss caused by plowing and soil disturbance [26].
The intrinsic links between the six carbon sources and carbon emissions are clarified as follows: Diesel, combustion in agricultural machinery directly releases CO2, serving as a direct emission source [27]. Fertilizers, nitrogen fertilizers induce soil nitrification/denitrification to emit N2O, with indirect emissions from their production and transportation [28]. Pesticides, Energy consumption during their production, transportation, and application generate emissions; residuals affect soil microbial activity and the organic carbon cycle [29]. Agricultural films, their carbon emissions mainly come from two pathways: direct CO2 emissions from fossil energy consumption during petroleum-based production, and indirect emissions from improper disposal of non-degradable residues (damaging soil structure and inhibiting organic carbon decomposition), with additional direct emissions from incineration [30,31]. Irrigation, indirect emissions come from energy consumption in water extraction/transport; unreasonable irrigation reduces soil organic carbon [32]. Plowing, soil disturbance, accelerates organic carbon oxidation and causes erosion-induced loss [33].
The emission quantities of each carbon source are calculated using a coupling model that combines activity level data with carbon emission coefficients. The formula is as follows:
where represents the carbon emissions of the type of carbon source, is the activity level data of this carbon source, is the corresponding carbon emission coefficient, and ki is the unit conversion coefficient. The values of the carbon emission coefficients are as follows: 0.89 for fertilizer application, 4.93 for pesticide use [34], 0.59 for diesel consumption [14], 5.18 for plastic film input [35], 266.48 for irrigation energy consumption [36], and 312.60 for the plowing operation [4]. All carbon emission coefficients adopted in this study are derived from Ding et al. (2022), which are the nationally validated average coefficients for China’s planting industry [26].
The total crop carbon emissions are the sum of emissions from the six major carbon sources (). Carbon emission intensity is calculated using a “total-area” coupling model: at the provincial level, it is calculated by dividing the total crop carbon emissions by the total crop cropping area; at the production area level, it is calculated by aggregating the total carbon emissions and total cropping area of two provinces. To analyze the dynamic evolution of total carbon emissions/intensity, the year-on-year growth rate (G) is used to measure annual trends:
where and are the year-on-year growth rates of total carbon emissions and carbon emission intensity, respectively, and are the total carbon emissions/emission intensity in year and year , respectively.
A one-sample two-tailed t-test was used to assess the significance of the contribution of crops to carbon emissions and the stage-wise changes in contribution rates. The test statistic formula is:
where is the mean of the variable, is the population mean, is the sample standard deviation, and is the year. The -value is obtained using the test statistic and degrees of freedom . The significance level is set as follows: if , it is considered extremely significant (marked with ***); if , it is considered very significant (marked with **); and if , it is considered significant (marked with *).
2.2.3. Contribution of Crops to Carbon Emissions
The contribution of crops to carbon emissions refers to the relative impact of crops with specific carbon emission attributes (high carbon or low carbon) on the overall crop carbon emissions in a province’s cropping structure. It reflects the contribution weight of these crops in the regional carbon emission total through the correlation between their cropping proportion and their own carbon emission intensity. For each crop in each province, the carbon emission contribution was calculated for the time periods (2000–2010) and (2011–2021):
where is the cropping area of crop during period , and is the total number of crop types. To focus on core impact crops, the absolute values of all crop contributions were calculated, and the top three crops with the largest absolute values in the region were selected for analysis. The arithmetic average of crop carbon emission contributions was calculated as the representative indicator for the region.
The rate of change in the carbon emission contribution of a crop, i.e., the contribution rate (R), quantifies the extent to which changes in the carbon emission contribution of a particular crop affect overall carbon emission changes. The formula is as follows:
where and represent the carbon emission contribution of a particular crop in the region from 2000 to 2010 and from 2011 to 2021, respectively. The contribution rates of high-carbon and low-carbon crops are calculated separately to reveal the trends of increase and decrease.
2.2.4. Correlation Analysis
To analyze the driving mechanisms of cropping structure on crop carbon emissions, a correlation analysis framework was established between crop cropping proportions, carbon emission intensity, and carbon emission components. The variables selected were the proportions of crops classified into four categories and carbon emissions per unit area from 2000 to 2021. Pearson’s correlation coefficient was used to quantify the linear correlation. The study employed the Logarithmic Mean Divisia Index (LMDI) method to construct a cropping structure–carbon emissions correlation model, aiming to elucidate the driving mechanisms behind changes in crop carbon emissions. This method offers advantages such as perfect decomposability and robustness to zero values [12], decomposing crop carbon emissions () into:
where is the crop carbon emissions intensity, is the cropping structure proportion, and A is the total cropping area. The change in carbon emissions () is decomposed into:
In the equation, is the logarithmic mean function, defined when = . This decomposition method attributes changes in carbon emissions to: scale effects (), representing the absolute carbon emission change driven by total cropping area variation (positive = emission increase from area expansion, negative = emission decrease from area shrinkage); structural effects (), reflecting emission changes induced by cropping structure adjustment (positive = emission increase from a higher proportion of high-carbon crops, negative = emission decrease from a higher proportion of low-carbon crops); and intensity effects (), quantifying emission changes caused by per-unit carbon emission intensity variation (positive = emission increase from higher intensity, negative = emission decrease from lower intensity). Through cumulative effect analysis (, , and ), the long-term mechanisms of driving factors are revealed, and regional comparisons are used to analyze the differences in emission reduction potential between cropping structure adjustments and technological progress in different agricultural ecological zones.
3. Results
3.1. Spatio-Temporal Evolution Characteristics of Cropping Structure and Crop Carbon Emissions
Based on the first-level classification data of cropping structure (food crops, cash crops, and vegetables) from 2000 to 2021, combined with regional functional positioning and resource endowment differences, the spatio-temporal evolution characteristics were systematically analyzed (Figure 2).
Figure 2.
Changes in the proportion of crop cropping areas in eight major provinces in China from 2000 to 2021.
In terms of spatial differentiation, driven by the functional positioning of commercial grain bases and regional resource endowments, China’s major agricultural producing areas exhibit distinct and distinctive cropping structure characteristics. The Northeast Plain (Heilongjiang and Liaoning) features an absolute dominance of grain crops, a prominent response to the national food security strategy, with the average proportion of grain crops exceeding 90% in Heilongjiang and over 82% in Liaoning, while the combined proportion of cash crops and vegetables is less than 20%. Leveraging its tradition of wheat–corn rotation and advantages as a core grain-producing area, the Huang-Huai-Hai Plain (Shandong, Henan) has formed a stable grain-cash crop-vegetable synergy, where grain crops account for a stable 70–80%, accompanied by balanced proportions of cash crops (10–20%) and vegetables (10–18%). Benefiting from abundant water and heat resources and a solid foundation in economic crop cultivation, the Middle and Lower Reaches of the Yangtze River Plain (Hubei and Jiangxi) present a diversified and compatible cropping structure, with the proportion of grain crops less than 60% and the combined proportion of vegetables and cash crops exceeding 40%, reflecting the profound shaping effect of resource endowments on cropping structure. As the northwest major producing area, Xinjiang and Gansu exhibit unique characteristics distinct from the three major plains: Xinjiang is dominated by cash crops, with the proportion of cash crops remaining above 40% for a long time, while grain crops account for 35–43%, showing a structure of “cash crop dominance supplemented by grain crops”; Gansu, on the other hand, maintains a relatively stable dominance of grain crops (67–72%), with a gradual increase in the proportion of vegetables from less than 5% in 2000 to more than 10% in recent years, reflecting the adjustment of cropping structure to adapt to regional arid and semi-arid climate conditions.
In terms of the dimension of time evolution, the structural reshaping characteristics of cropping structure driven by policies and industrial development are prominent across all major producing areas. In Heilongjiang Province, the proportion of grain crops increased by more than 10% from 2000 to 2015, closely related to the strengthening effect of the commercial grain base capacity improvement project on the grain production scale. The proportion of vegetables in Shandong has long remained stable at 15–20%, which reflects the consolidation of its comparative advantages by the Shouguang model—a nationally recognized vegetable industrial cluster characterized by standardized production, full industrial chain integration, and technology export and green transformation [37]. Since 2010, the proportion of cash crops in Hubei and Jiangxi has decreased by more than 15%, reflecting the crowding-out effect of grain subsidy policies on cash crop cultivation and the inertia of structural adjustment under policy guidance [38]. For the northwest major producing area, Xinjiang’s cash crop proportion fluctuated slightly but remained dominant, with a gradual optimization trend in recent years, while Gansu witnessed a continuous upward trend in the proportion of vegetables and a slow decline in grain crops, reflecting the adaptation of cropping structure to regional resource endowments and market demand. Additionally, Shandong in the Huang-Huai-Hai Plain saw a significant jump in the proportion of grain crops after 2017, rising from around 68% to over 75%, further consolidating its position as a core grain-producing area.
Changes in the proportion of major grain crops in China’s eight major provinces from 2000 to 2021 are illustrated in Figure 3. It reveals a reverse substitution of corn and soybeans in Northeast China: the proportion of soybean sown area in Heilongjiang Province dropped from 36.53% in 2000 to 26.72% in 2021, while the corn proportion jumped from 22.94% to 44.84% over the same period. After the 2015 adjustment of Northeast China’s corn temporary reserve policy—a government price support program that previously set a guaranteed “floor price” for corn—the soybean proportion rebounded temporarily, reflecting how price signals directly shape farmers’ crop choices. In Liaoning Province corn proportion surged from 49.76% to 76.88%, forming a highly homogeneous variety structure and exposing the hidden risk of variety path dependence under large-scale cultivation. The Huang-Huai-Hai region maintains a stable wheat–corn double-cropping system: in Shandong Province, the combined proportion of wheat and corn has consistently exceeded 85%, with corn proportion abnormally rising to 47.31% in 2017, possibly linked to phased cropping subsidy tilts; in Henan Province, wheat proportion has remained stable at 54–55%, while corn proportion increased from 24.38% to 35.89%, with their combined share exceeding 90%, highlighting the path dependence of the rotation system. The Yangtze River Basin has strengthened rice’s absolute dominance: rice proportion in Hubei has stayed stable at ~48%, while in Jiangxi it has remained above 85%, even rising to over 92% from 2017 to 2019, reflecting both climatic adaptability to subtropical monsoon conditions and the inertia of traditional rice farming; further subdivision shows a shift from early-season rice to single-cropping mid-late rice in Jiangxi, indicating structural optimization of rice varieties. Notably, the northwest regions (Xinjiang and Gansu) exhibit distinct patterns: Xinjiang is dominated by wheat (45–57%) and corn (26–47%), with the rice proportion remaining below 5% due to arid conditions; Gansu has an extremely small scale of rice cultivation, relying on a stable wheat–corn structure (wheat 27–43%, corn 17–39%), reflecting adaptation to arid-semi-arid climates. These regional heterogeneous responses to policies and resource endowments have further amplified the differentiation in cropping structure.
Figure 3.
Changes in the proportion of major grain crops in China’s eight major provinces, 2000–2021.
Figure 4 and Figure 5 systematically reveal the spatio-temporal evolution patterns of crop carbon emissions in the eight major production provinces from 2000 to 2021 from the perspective of “total amount-composition-intensity”. Shandong and Henan in the Huang-Huai-Hai Plain form the core emission areas, reaching 7.346 million tons and 8.831 million tons, respectively, in 2021—significantly higher than Hubei (4.296 million tons) in the Yangtze River Basin, the Northeast region (Heilongjiang 5.244 million tons), as well as Xinjiang (5.427 million tons) and Gansu (2.291 million tons). This spatial differentiation is deeply coupled with agricultural intensification and regional climatic conditions: the proportion of chemical fertilizer emissions in Shandong and Henan reached 46.2% and 62.4%, respectively, with Henan’s fertilizer-dependent emissions (5.395 million tons, over 60% of total) being particularly prominent; Shandong also presented a leading high proportion of film emissions (1.554 million tons, 18.0%), reflecting its facility agriculture scale. For northwest regions, Xinjiang’s irrigation emissions accounted for 26.2% (1.071 million tons)—a core carbon source echoing its arid climate—while Gansu’s film emissions (31.0%, 647,000 tons) stood out, reflecting moisture retention demands in arid-semi-arid areas. The cold-region Northeast shows distinct traits: Heilongjiang’s irrigation emissions (25.7%, 1.102 million tons) ranked second only to fertilizers (41.3%), and its diesel emissions (16.6%, 710,000 tons) reflect mechanized farming needs; Liaoning’s film emissions (21.1%, 595,000 tons) highlight cold-region moisture retention. The Yangtze River Basin has unique features: Hubei’s fertilizer emissions (58.6%, 2.706 million tons) dominate, with its pesticide emissions (12.6%, 583,000 tons) higher than the Huang-Huai-Hai region; Jiangxi’s pesticide (16.0%, 391,000 tons) and irrigation (21.1%, 514,000 tons) proportions reflect water–heat-driven cropping structure impacts.
Figure 4.
Total crop carbon emissions and their proportional composition in China’s eight major provinces, 2000–2021 (multi-year average).
Figure 5.
Crop carbon emissions (a) and emission intensity (b) in China’s eight major provinces, 2000–2021.
Figure 5 illustrates that intensive fertilizer use drove emission growth in Shandong and Henan, while Heilongjiang’s cold-climate farming featured prominent irrigation emissions—structural differences that guide emission reduction pathways. Notably, after the 2015 “Zero Growth in Fertilizer and Pesticide Use” initiative, Shandong cut total emissions by 15% via cropping structure adjustments; Henan remained at 9 million tons, reflecting policy implementation heterogeneity; Xinjiang’s total emissions rose then slightly declined (peaking at 5.606 million tons in 2017), while Gansu’s emissions fell after 2015 (from 2.810 million tons to 2.291 million tons), aligning with regional water-saving and film-reduction measures. Post-2015, Henan reduced intensity by 19.3% while stabilizing total emissions (1.8% cut); Shandong became a “double-reduction model” (15% total cut, 5% intensity cut), showing technological progress offsets fertilizer input growth under stable scale. This aligns with Xu’s conclusion that “fertilizer/pesticide inputs drive emission intensity rises,” suggesting policies achieve reductions via “total control” or “intensity optimization,” depending on enforcement rigor and cropping structure flexibility [2].
The carbon emission intensity dimension reveals differentiated reduction trajectories and technical mechanisms: all provinces show falling intensity with heterogeneous rates (Figure 5b). Though Shandong led in total emissions, its intensity dropped from 70.61 to 67.08 tons/ha (5% cut, 2000–2021). The Yangtze River Basin performed well: Jiangxi’s intensity fell to 39.30 tons/ha (2021, the lowest), and Hubei cut intensity by 26.3%. The Northeast has unique trends: Heilongjiang saw a 2016 efficiency inflection point (37.56 tons/ha) with a 1.8% annual intensity cut, but its ±5.2% fluctuation reflects cold-region technical bottlenecks. For northwest provinces, Xinjiang’s intensity remained relatively high (~85 tons/ha in 2021) due to irrigation demands, while Gansu cut intensity by ~12% (from 35.5 to 31.3 tons/ha), driven by local water-saving agriculture practices.
3.2. The Correlation Between Cropping Structure and Crop Carbon Emissions and the Driving Mechanisms
Quantitative correlation analysis between cropping structure and carbon emissions has revealed significant regional differentiation in the water-carbon flux response mechanisms of the four major grain-producing areas in China (Figure 6, Figure 7 and Figure 8).
Figure 6.
Correlation between cropping structure proportions and crop carbon emission intensity in the Northeast Plain Region, 2000–2021. Scatter plots were fitted with trend lines via regression analysis, and 95% confidence intervals were provided. Here, “Total” refers to the overall crop carbon emission intensity; “Irrigation,” “Diesel,” and “Plowing” respectively denote crop carbon emission intensities driven by irrigation area, agricultural diesel consumption, and plowing area (same below). The significance levels are defined as follows: *** p < 0.001, extremely significant; ** p < 0.01, very significant; * p < 0.05, significant.
Figure 7.
Correlation between crop cropping structure proportions and crop carbon emission intensity in the Huang-Huai-Hai Plain Region, 2000–2021. The significance levels are defined as follows: *** p < 0.001, extremely significant; ** p < 0.01, very significant; * p < 0.05, significant.
Figure 8.
Correlation between crop cropping structure proportions and crop carbon emission intensity in the Middle and Lower Reaches of the Yangtze River Plain Region, 2000–2021. The significance levels are defined as follows: *** p < 0.001, extremely significant; ** p < 0.01, very significant; * p < 0.05, significant.
3.2.1. Correlation Characteristics in the Northeast Plain Region
As shown in Figure 6a, crop categories such as grain (food crops), cereals, rice, and maize exhibit numerous significant positive correlations with carbon intensity indicators, including “Total (total carbon intensity)” and “Fertilizer (chemical fertilizer)”. Combined with the agricultural characteristics of Northeast China—as China’s core commodity grain base, centered on the large-scale cultivation of food crops like maize and rice—this reflects the typical “grain crop-dominated” pattern of the Northeast region. Figure 6b shows a strong positive correlation between the proportion of corn cropping area in Northeast China and total carbon emission intensity (r = 0.90), confirming the cumulative carbon footprint effect of fertilizer and machinery inputs under the expansion of monocropping corn. In this region, corn cropping accounts for over 60% of the total cropping area. Large-scale production here involves fertilizer application (in pure terms) reaching 350 kg/ha, with diesel consumption (during sowing and harvesting) contributing over 40% of total carbon emissions. Diesel consumption (in the sowing and harvesting stages) accounts for more than 40% of total carbon emissions. Figure 6c shows a positive correlation between the proportion of rice cultivation area and irrigation–carbon emission intensity (r = 0.84), highlighting the high-intensity energy extraction characteristics of rice irrigation in cold regions. Cold-region rice has high water requirements during its growth period, and conventional flooding irrigation systems consume significant amounts of energy. As the core method for groundwater extraction in Northeast China, the pumping station water extraction process accounts for the majority of irrigation–carbon emissions [39], making it the key factor driving the association between rice cultivation and irrigation–carbon emissions. Notably, the negative correlation between the proportion of legume cropping area and diesel carbon emission intensity (r = −0.67) in Figure 6d and the positive correlation between the proportion of cash crop cropping area and tillage carbon emission intensity (r = 0.63) in Figure 6e form a dialectical relationship: the former reflects the inhibitory effect of legume crop rotation on the frequency of mechanical operations, while the latter reveals the carbon cost of increased tillage intensity for cash crops such as sugar beets and flax.
3.2.2. Correlation Characteristics in the Huang-Huai-Hai Plain Region
The Huang-Huai-Hai Plain presents a pattern of “fertilizer dominance—structure sensitivity” (Figure 7). Figure 7a showed an extremely strong positive correlation (r = 0.84) between the proportion of rice cropping area and the carbon emission intensity, indicating the high dependence of the rice cultivation system on chemical fertilizer input. Our results have been clearly confirmed in the study of Guo et al. [40], which reported that the total application of nitrogen, phosphorus, and potassium fertilizers increased by 73.8% over the past 14 years, while the total crop yield only rose by 4.2%. The significant imbalance between fertilizer input and yield growth reveals the inefficient mode of “high input—low output” in intensive production. Under this mode, excessive fertilizers not only fail to effectively increase yields but also convert nitrogen surplus (such as ammonia volatilization, nitrification, and denitrification) into greenhouse gases, becoming the core driving source of carbon emissions. Figure 7c,e jointly reveal the “mechanical-water resource” co-consumption characteristics of dryland farming systems: The seasonal peak of mechanical operations in vegetable production and the continuous energy demand for wheat irrigation superimpose to form a carbon pressure hub.
3.2.3. Correlation Characteristics in the Middle and Lower Reaches of the Yangtze River Plain Region
Figure 8a illustrates that crops such as grains (including cereals) and vegetables exhibit significant positive correlations with carbon intensity indicators like diesel consumption, irrigation, and pesticide use, while leguminous crops show a strong negative correlation with total carbon intensity. The Middle and Lower Reaches of the Yangtze River region demonstrate a pronounced “high-input-crop synergy” pattern, where agricultural carbon emissions are deeply intertwined with crop types and resource utilization practices. Significant variations in carbon emissions exist across different crops, each influenced by distinct factors. Figure 8b reveals an extremely strong positive correlation (r = 0.94) between the proportion of corn cropping area and irrigation–carbon emission intensity. This closely relates to the region’s reliance on water-intensive irrigation systems for corn production. Zhang et al. found that irrigation electricity accounted for 33.2% of corn’s total carbon input, while global-scale irrigation studies further confirm that groundwater extraction accounts for 89% of total irrigation energy consumption [41,42]. This high-carbon-intensity irrigation model directly elevates the carbon footprint of corn production. In contrast, the proportion of legume planting area in Figure 8d shows a strong negative correlation with the total carbon emission intensity (r = −0.90). This is mainly due to the biological nitrogen fixation effect of leguminous crops, which significantly reduces the demand for synthetic nitrogen fertilizers and thereby lowers the indirect carbon emissions from the fertilizer production process (mainly from the energy-intensive ammonia synthesis process). Additionally, legumes are typically grown under rain-fed or low-intensity irrigation conditions, avoiding the high-energy consumption of groundwater extraction and further reducing irrigation-related carbon emissions [43]. Figure 8c shows a strong positive correlation (r = 0.92) between the proportion of vegetable cropping area and diesel carbon emission intensity, reflecting the high dependence on mechanized operations in vegetable production across the middle and lower Yangtze regions and their associated high carbon emissions. Zheng et al. found that mechanization rates for key rapeseed cultivation stages—plowing, planting, and harvesting—exceeded the national average in the middle Yangtze region [44]. Both the “high-speed, high-efficiency, low-consumption” mechanized tillage techniques and the combined/segmented harvesting model rely heavily on diesel as the primary power source, resulting in elevated carbon emissions. Figure 8e shows a positive correlation between rice cultivation and diesel carbon emissions (r = 0.73), primarily due to substantial diesel consumption during mechanized drainage and tillage in paddy fields. Zhang et al. found that carbon emissions from mechanized equipment during rice irrigation accounted for 35% of total emissions, consistent with our findings and highlighting the unique “energy-carbon” linkage within rice production systems [41].
3.2.4. Correlation Characteristics in the Xinjiang-Gansu Main Production Area
As shown in Figure 9a, the Xinjiang-Gansu main production area exhibits a distinct “arid-region carbon source-cropping structure coupling” pattern, with crop proportions showing highly significant correlations with carbon intensity components that distinguish it from other major regions. Maize planting proportion displays an extremely strong positive correlation with total carbon emission intensity (r = 0.94, Figure 9c)—a stronger association than the Northeast Plain’s maize–total carbon correlation (r = 0.90). This reflects the cumulative carbon footprint of dual inputs of fertilizer and irrigation under maize monocropping expansion in arid regions (maize accounts for over 20% of sown area, with irrigation contributing over 15% of total emissions), whereas the Northeast’s correlation is driven mainly by fertilizer and diesel inputs for large-scale mechanization. Conversely, the wheat planting proportion shows a strong negative correlation with plastic film carbon intensity (r = −0.85, Figure 9b)—a unique correlation not observed in the Huang-Huai-Hai Plain or the Middle and Lower Reaches of the Yangtze River Plain—stemming from reduced reliance on film mulching for moisture retention as wheat cultivation adjusts to arid climate constraints. Most notably, legume planting proportion exhibits an extremely strong negative correlation with fertilizer carbon intensity (r = −0.97, Figure 9d), which is more targeted and robust than the Yangtze River Basin’s legume–total carbon correlation (r = −0.90). This is driven by legumes’ biological nitrogen fixation, which cuts synthetic fertilizer demand by up to 30% and directly reduces fertilizer-related carbon emissions, whereas the Yangtze River Basin’s correlation reflects a broader reduction in overall carbon intensity. Meanwhile, the economic crop planting proportion shows a significant positive correlation with diesel carbon intensity (r = 0.67, Figure 9e), reflecting the high carbon cost of mechanized harvesting for cash crops like cotton and oilseeds—core to the region’s agricultural economy—unlike the Huang-Huai-Hai Plain’s diesel correlation tied to vegetable production mechanization. These correlations collectively highlight the dual characteristics of the Xinjiang-Gansu region: high carbon dependence on irrigation and fertilizer for staple crops and the emission reduction potential of legume rotation and optimized film use.
Figure 9.
Correlation between cropping structure proportions and crop carbon emission intensity in the Xinjiang-Gansu Main Production Area, 2000–2021. The significance levels are defined as follows: *** p < 0.001, extremely significant; ** p < 0.01, very significant; * p < 0.05, significant.
3.3. Analysis of Carbon Emissions Contributions from a Crop Type Perspective
Figure 10 presents a heatmap illustrating the carbon emission contribution (C) of major crops in eight key producing regions from 2000 to 2021. The figure demonstrates that cropping structure significantly shapes the spatiotemporal differentiation of crop carbon emissions. During 2000–2010, the Northeast Plain (Heilongjiang and Liaoning) was dominated by high-carbon crops: corn’s emission contribution reached 27.04% in Heilongjiang and 48.76% in Liaoning, forming the core of regional emissions, while Heilongjiang’s legumes (35.79%, a low-carbon crop) created a “high-carbon staple—low-carbon legume” dual balance, and Liaoning’s vegetables (10.49%) and oil crops (5.86%) showed emission reduction synergy from optimized structure. In the Middle and Lower Yangtze River (Hubei, Jiangxi), rice dominated emissions: Jiangxi’s rice contribution reached 57.26%, while Hubei’s rice (27.53%) and wheat (11.68%) formed a rotation-driven structure, with oil crops (19.15%) and vegetables (11.89%) reflecting the basin’s “grain-cash crop integration” synergy. The Huang-Huai-Hai region (Shandong, Henan) exhibited high-intensity emissions from wheat–corn rotation: Shandong’s wheat (31.55%) and corn (24.68%) contributed over 56%, Henan’s wheat reached 36.52%, and cotton (5.39–7.54%) elevated the region to northern China’s highest carbon pressure area. Notably, the Xinjiang-Gansu main production area displayed distinct arid-region characteristics: Xinjiang’s cotton (32.67%) and corn (13.07%) dominated high-carbon emissions, while legumes (2.50%) provided limited low-carbon buffering; Gansu’s wheat (26.67%) and corn (14.27%) formed a staple-driven structure, with vegetables (7.77%) emerging as a low-carbon mitigation factor.
Figure 10.
Stage-wise dynamic changes in crop carbon emission contributions (C) across eight provinces in China, 2000–2021. Each cell lists the top three crops contributing to carbon emissions in the corresponding province during the specified period, with values indicating carbon emission contribution intensity (red indicates high-carbon emission crops, and blue indicates low-carbon emission crops).
During 2011–2021, cropping structure changes exhibited “intensified dominance and weakened balance”: The Northeast Plain’s high-carbon dependence deepened, with Heilongjiang’s corn contribution rising from 27.04% to 42.97% and Liaoning’s from 48.76% to 63.64%, while low-carbon crops like legumes (Heilongjiang: 35.79% → 24.74%) and vegetables (Liaoning: 10.49% → 8.19%) declined, signaling pronounced high-carbonization. The Middle and Lower Yangtze showed differentiated adjustment: Hubei’s vegetable contribution rose to 16.17% (with oil crops at 17.01%) to strengthen low-carbon sinks, but Jiangxi’s rice remained high at 60.60%, reflecting path dependence in rice-growing regions. The Huang-Huai-Hai’s wheat–corn dominance intensified: Shandong’s wheat (35.07%) and corn (31.58%) contributed over 66%, and Henan’s wheat (38.26%) and corn (26.15%) over 64%, creating “dual staple high-carbon synergy” that drove emission intensity up, while cotton’s sharp decline (Shandong: 7.54% → 3.71%, Henan: 5.39% → 0.64%) had a limited mitigation effect. For Xinjiang-Gansu, Xinjiang’s cotton (32.67% → 37.14%) and corn (13.07% → 16.93%) maintained high-carbon dominance, with legumes (2.50% → 0.76%) declining further; Gansu’s corn contribution surged to 24.50%, wheat fell to 19.33%, and vegetables (7.77% → 10.87%) increased, reflecting adaptation to arid conditions and market demand for low-carbon crops.
The spatiotemporal evolution of crop carbon emission contributions is driven by three core pathways, with Xinjiang-Gansu exhibiting distinct regional drivers: First, national food security strategies and subsidies drove staple expansion, seen in Northeast corn and Huang-Huai-Hai wheat growth [45], as well as Xinjiang’s cotton expansion (supported by cash crop policies) and Gansu’s corn increase. Second, profitability simplified crop varieties: Liaoning’s corn surge and legume decline reflected market returns, while Xinjiang’s sustained cotton dominance and Gansu’s vegetable growth also responded to market signals. Third, technological progress had differential impacts: Hubei’s protected vegetable cultivation reduced carbon intensity [46], and Gansu’s improved irrigation efficiency for vegetables supported their low-carbon contribution. It is critical to highlight that the systemic decline of low-carbon crops (legumes, tubers, and fruits/melons contributing 30–60% less) weakened rotation buffering, while high-carbon agglomeration (Northeast corn, southern rice, Huang-Huai-Hai wheat–corn, and Xinjiang cotton) intensified spatial heterogeneity, with Xinjiang-Gansu’s arid-region cropping structure adding unique differentiation.
Figure 11 reveals the divergent trends of high-carbon and low-carbon crop changes across eight major provinces, highlighting pronounced regional heterogeneity and structural adjustment characteristics. For high-carbon crops (left panel), corn exhibits a nationwide expansion trend, with significant increases in Gansu (71.6%), Jiangxi (94.9%), and Liaoning (30.5%), reflecting the dominance of staple grain expansion under national food security strategies. In contrast, traditional high-carbon cash crops such as cotton and tobacco show sharp declines: Xinjiang’s tobacco contribution plummets by 99.6%, Henan’s cotton by 88.1%, and Liaoning’s cotton by 96.9%, indicating a shift away from carbon-intensive economic crops toward staple grains. Notably, the Northwest region (Xinjiang-Gansu) displays unique traits: Xinjiang’s cotton increases by 13.7%** (aligned with local cash crop policies), while Gansu’s corn surges by 71.6%, and both provinces see rice reductions (Xinjiang: −32.4%, Gansu: −36.4%**), reflecting adaptation to arid conditions.
Figure 11.
Significant differences in carbon emission contribution rates of high/low-carbon crops in eight provinces of China, 2000–2021. Province abbreviations: Heilongjiang (HL), Liaoning (LN), Shandong (SD), Henan (HN), Hubei (HB), Jiangxi (JX), Gansu (GS), Xinjiang (XJ).
For low-carbon crops (right panel), a systemic decline is observed across legumes, tubers, and oil crops: Xinjiang’s legumes decrease by 69.4%, Heilongjiang’s oil crops by 81.2%, and Liaoning’s legumes by 65.9%, weakening the carbon buffering capacity of crop rotation systems. However, vegetables emerge as a critical low-carbon mitigation factor in Hubei (36.0%) and Gansu (40.0%***), where protected cultivation and improved irrigation efficiency have enhanced their carbon sink function. This contrast—between the contraction of traditional low-carbon crops and the expansion of vegetable-based low-carbon sinks—underscores the adaptive nature of regional cropping structures. Across regions, the Northeast shows the most pronounced high-carbonization (corn up, low-carbon crops down), the Huang-Huai-Hai maintains high staple crop dominance, and the Yangtze River Basin balances corn expansion with vegetable-based emission reduction, while the Northwest (Xinjiang-Gansu) combines staple grain expansion with vegetable-driven low-carbon adaptation.
3.4. Quantitative Analysis of the Driving Effect of Cropping Structure on Crop Carbon Emissions
Figure 12 reveals a strong coupling between the annual dynamics of carbon emission changes and the evolution of cropping patterns across the four major production regions. The decomposition highlights distinct regional driving patterns. In the Northeast Plain, the structural effect peaked in 2004 (409,600 tons), driven by a rapid expansion of maize area (+37.6% since 2000) and increased rice cultivation. Negative structural effects in 2003 (−275,500 tons) corresponded to a sharp decline in soybean area (−28.4%) and a reduced share of cash crops. Intensity effects fluctuated significantly, reaching −308,000 tons in 2021 due largely to rising tillage emissions (+49.8%), despite a slight decline in the share of diesel emissions. In the Huang-Huai-Hai Plain, structural effects sharply rose during 2005–2006 (exceeding 350,000 tons), linked to large-scale contiguous maize cultivation (+14.3% by 2006). By 2017, intensity effects turned strongly negative (−639,000 tons) due to improved irrigation efficiency (−8.2% per unit area) and optimized tillage practices (−11.3% from peak levels), reflecting a transition from “scale expansion to technological correction.” The Yangtze River Middle-Lower Reaches exhibited consistently negative intensity effects since 2015 (averaging −142,000 tons annually), attributable to reduced fertilizer use (−12.7% from 2015 to 2021) and improved film efficiency (−31.2% in emissions per unit area). However, expanding vegetable area (+71.8%) pushed structural emissions upward, creating a tension between “technology-driven reduction and structure-driven increase.” The Xinjiang-Gansu Main Production Area showed significant annual fluctuations in intensity effects, with notable positive contributions in multiple years (e.g., +267,900 tons in 2007) driven by increased input intensity in arid farming systems, while structural effects varied between positive and negative values, reflecting ongoing adjustments in crop composition under water constraints. A significant turning point in intensity effects occurred around 2015 across all regions, aligning with the national Zero Growth in Fertilizer Use policy initiated that year. This synchronization underscores the cross-regional effectiveness of coordinated policy interventions in promoting technological efficiency and emission control.
Figure 12.
LMDI decomposition of carbon emissions changes in the four major production areas, 2000–2021.
Figure 13 presents the cumulative contributions of emission drivers. In the Northeast Plain, dual pressures from scale (+1.3923 million tons) and structure (+1.3255 million tons) reflected the ecological cost of corn belt expansion (maize area up 187.2% by 2021). Intensity improvements reduced emissions by 1.0825 million tons, e.g., through a 28.5% drop in film emission intensity, yet the rising grain crop ratio (70.7%) constrained further mitigation. The Huang-Huai-Hai Plain saw structural effects increase emissions by 1.8457 million tons, resulting from a shrinking cash crop share (29.5% to 22.4%) and insufficient low-carbon substitution within staple crops. Intensity effects reduced emissions by 1.2873 million tons through improved fertilizer efficiency (−18.4% per unit area) and water-saving irrigation (−23.1% per unit yield). The Yangtze River Middle-Lower Reaches exhibited a technology-dominated pattern: intensity reductions (−451,400 tons) offset scale-driven growth (+204,900 tons). Key contributions came from yield-enhanced rice cultivation (23.1% higher yield, lower carbon intensity) and low-carbon vegetable production (film emission intensity down 31.2%). Post-2015, a rise in oil crop share (+12.3%) helped moderate structural increases. Notably, the Xinjiang-Gansu Main Production Area presents a dual-driven growth pattern, where both scale effects (+1.119 million tons) and intensity effects (+1.018 million tons) were major positive contributors, jointly driving substantial carbon growth. The negative structural effect (−91200 tons) indicates that regional crop mix optimization—such as increased cultivation of high-value and water-efficient crops—partially offset emission pressures from area expansion and input intensification.
Figure 13.
Cumulative contributions of the four major carbon emission drivers in the four major production areas, 2000–2021.
4. Discussion
4.1. Regional Differentiation Mechanism of Cropping Structure Affecting Crop Carbon Emissions
4.1.1. Northeast Plain: High-Carbon Lock-In of Corn Monoculture
The core driving factor of carbon emission heterogeneity in the Northeast Plain is the shift from corn-legume balanced cropping to corn monoculture, forming a typical “scale-up-high carbonization” mechanism under cold-region farming conditions. The large-scale expansion of corn planting has significantly raised the input intensity of chemical fertilizers and agricultural machinery, and the loss of low-carbon legume rotation has further weakened the carbon buffering capacity of the cropping system. Critically, the “scale” and “structure” mechanisms are not independent; they exhibit a strong synergistic interaction. The policy-driven expansion of corn acreage (scale effect) directly caused the structural shift away from soybeans; this, in turn, eliminated the low-carbon benefits of legume rotation (reduced fertilizer need, lower diesel use), thereby intensifying the carbon footprint. This mechanism is essentially the ecological cost of the Northeast Plain’s functional positioning as a national commodity grain base: the large-scale centralized cultivation of corn has led to a superposition of high fertilizer application (350 kg/ha of pure nitrogen) and high diesel consumption from mechanization, while the cold-region rice cultivation system relies on high-energy pumping stations for irrigation, further amplifying the carbon emission effect of scale expansion.
This “high-carbon lock-in” phenomenon in the Northeast Plain exhibits parallels with, yet distinct differences from, the lock-in effects observed in other global grain baskets. For instance, in the U.S. Corn Belt, the dominance of the corn-soybean system is reinforced by a confluence of factors, including federal crop insurance, the Renewable Fuel Standard, and an agricultural infrastructure optimized for these two commodities, creating a powerful socio-technical lock-in that hinders diversification [47,48]. While both regions face structural constraints, the Northeast’s lock-in is more directly driven by top-down national food security mandates and the subsequent market signals, resulting in a shift towards a higher-carbon corn monoculture, whereas the U.S. Corn Belt’s lock-in maintains a lower-carbon (due to soybeans’ nitrogen fixation) but still highly specialized rotation system. The ecological and economic rigidity in both cases, however, similarly stifles crop diversification and perpetuates system-level carbon intensity. Chen et al. (2025) also verified that the continuous cropping of corn in the Northeast has led to a significant increase in soil carbon emissions, and the optimized corn-soybean rotation can increase soil organic carbon storage by 3.21%, which directly supports the emission reduction potential of structural adjustment in this region [49]. Different from previous studies that only focused on the impact of single crop expansion on emissions, this study further reveals the synergistic effect of cropping structure change and cold-region resource constraints—the decentralized small-scale irrigation model in cold regions leads to low water reuse efficiency, which in turn increases the carbon emission intensity of irrigation, making the high-carbon lock-in more prominent [50].
4.1.2. Huang-Huai-Hai Plain: Emission Reduction Bottleneck of Wheat–Corn Rotation
The path dependence of the wheat–corn rotation system and insufficient structural diversification are the core reasons for the highest carbon emission intensity in the Huang-Huai-Hai Plain in northern China. The combined contribution of wheat and corn to carbon emissions exceeds 64% in this region, and the high dependence on chemical fertilizers in the rotation system forms an inefficient “high input—low output” production model, which is the main source of carbon emissions. This path dependence is strongly reinforced by existing agricultural policies, such as price supports and subsidies tied to commodity crops, which create a powerful disincentive for farmers to adopt more diversified, low-carbon systems [47]. The interaction between policy (an external driver) and structure is central here: the policy framework incentivizes the maintenance of the wheat–corn rotation, which in turn sustains high fertilizer demand and locks the region into a high-emissions trajectory, regardless of technological improvements at the margin. This creates the observed “emission reduction paradox.” Zhang et al. (2022) found that grain-producing regions with concentrated cropland have faster carbon emission growth due to the overuse of fertilizers and diesel, which is consistent with the findings of this study [51]; while Chen et al. (2016) pointed out that the carbon sequestration capacity of farmland in the Huang-Huai-Hai Plain is limited by management methods, and pure technological improvement cannot break through structural high-carbon lock-in, which further explains the “emission reduction paradox” in this region—Shandong Province achieved a 15% reduction in total emissions through irrigation and tillage optimization, but Henan Province maintains high emissions due to the lack of crop diversity [52]. This intra-regional divergence underscores that technological potential (intensity effect) can be systematically underutilized when structural and policy conditions are unfavorable, highlighting a key interaction between the “intensity” and “structure” mechanisms. This study supplements the existing literature by clarifying that the key to breaking the high-carbon lock-in in the Huang-Huai-Hai Plain is not only technological improvement but also the moderate diversification of the cropping system under the premise of ensuring food security.
4.1.3. Middle-Lower Yangtze Plain: Water–Heat-Driven Dual-Driven Emission Reduction
The Middle-Lower Yangtze Plain has the strongest carbon emission resilience among the four regions, mainly due to its “water–heat driven” diversified cropping structure, forming a dual-driven emission reduction mechanism of structural elasticity and technological improvement. The high matching degree of water and heat resources in this region supports the coexistence of rice staple cultivation and vegetable/oil crop diversification, and the biological nitrogen fixation of legumes and energy-saving irrigation technology have further reduced carbon emission intensity. Here, the “structure” and “intensity” mechanisms interact positively and synergistically. The diversified structure, featuring legumes and vegetables, creates an inherent demand for less intensive inputs (e.g., lower fertilizer for legumes) and creates niches where water-saving technologies can be profitably adopted. This structural elasticity enhances the effectiveness of technological improvements, unlike in the rigid monoculture systems of the north, where technology is often tasked with merely offsetting structural deficiencies. Wang et al. [52] verified that grain-legume intercropping can significantly reduce synthetic nitrogen fertilizer input and enhance soil carbon sequestration, which is consistent with the strong negative correlation (r = −0.90) between legume planting proportion and total carbon emission intensity in this study [53]; Qin et al. (2024) pointed out that global irrigated agriculture has high energy carbon emissions, and this study further found that the corn irrigation–carbon coupling effect (r = 0.94) in this region can be effectively mitigated by water-saving technologies (e.g., alternate wetting and drying irrigation) [42].
This finding is consistent with experimental studies in other rice-growing regions, such as the Mediterranean, where a shift from continuous flooding to midseason drainage not only reduced CH4 emissions by 44% but also lowered water consumption, demonstrating the significant co-benefits of optimized water management [54]. Different from the structural rigidity of the Northeast and Huang-Huai-Hai Plains, this study found that the water–heat resource endowment gives the region a unique advantage in structural optimization—the increase in the proportion of vegetables and oil crops in Hubei Province drives a 26.3% reduction in carbon intensity, providing a feasible emission reduction path for humid and semi-humid agricultural regions.
4.1.4. Xinjiang-Gansu Main Production Area: Aridity Adaptation and Technology Offset
The carbon emission mechanism of the Xinjiang-Gansu region is characterized by “high-carbon structural adaptation under water constraints and partial offset of emissions by water-saving technologies”, which is significantly different from the other three plain regions. Water scarcity determines the cropping structure of this region: the area of water-intensive rice has shrunk by 34.2%, while drought-tolerant corn and cash crop cotton have become the main crops, forming a high-carbon structure with their combined planting proportion reaching 76.5%; the scale expansion of cultivated land (45.7% increase) has become the primary emission driver, and water-saving technologies such as under-film drip irrigation have partially offset emission growth by reducing irrigation and fertilizer carbon intensity. Here, the “negative structural effect” (from optimized crop mix) and the positive scale and intensity effects do not act in isolation; they are deeply intertwined and exhibit a complex, two-way interaction. The structural shift towards cash crops like cotton, driven by economic incentives under arid conditions, inherently necessitates higher input intensities (fertilizer and film), thereby directly amplifying the positive scale and intensity effects. Simultaneously, the adoption of water-saving technologies is not merely an independent “intensity effect” but a direct response to the water demands of this specific high-carbon cropping structure, enabling its continued expansion on marginal lands. This creates a dynamic where the optimized crop mix paradoxically reinforces the very conditions (high input demand) that technology then seeks to mitigate. This “scale-structure-intensity” nexus is a defining feature of emission dynamics in resource-constrained agricultural frontiers. Zhu et al. (2023) found that the agricultural water–energy–carbon nexus is the core of emission reduction in arid regions, and this study further quantifies the offset effect of water-saving technologies in the Xinjiang-Gansu region—a 37.5% reduction in unit irrigation–carbon emissions and a 19.8% reduction in fertilizer application intensity have achieved a cumulative intensity effect of −0.6519 million tons [32].
This pattern of “resource constraint driving structural adaptation, which in turn spares technological response” is not unique to China. It mirrors challenges in other arid agricultural regions, such as the Murray-Darling Basin in Australia, where climate change-induced water scarcity is forcing a re-evaluation of water-intensive crops and driving the adoption of more efficient irrigation technologies, though the pace and scale of adaptation remain critical policy challenges [55]. The unique contribution of this study is to reveal that technological progress in arid agricultural regions is not a voluntary choice but a survival necessity driven by resource constraints, and its emission reduction potential is limited by the high-carbon lock-in of the cropping structure adapted to aridity. This aligns with the broader finding that while technological progress (intensity effect) is crucial, its potential can be constrained or even counteracted by powerful structural drivers [56].
4.2. Regional Differentiated Collaborative Measures for Crop Carbon Reduction
Based on the unique carbon emission mechanisms of the four major regions, the construction of crop carbon reduction measures must follow the principle of “regional adaptation—structural optimization—technology integration”, with the core goal of synergizing food security and low-carbon transition. To address inherent trade-offs between short-term production goals, long-term environmental benefits, and farmers’ economic interests, targeted policy designs are integrated into regional measures as follows: For the Northeast Plain, priority should be given to promoting the corn-soybean rotation system and optimizing the cold-region irrigation model: relying on large-scale agricultural infrastructure, transform corn continuous cropping to corn–soybean–corn rotation, and promote centralized scheduling of pumping stations and return water utilization to reduce irrigation–carbon emissions [49]. To resolve the tension between lower direct benefits of silage corn and increased intercropping labor input, additional labor compensation of 500 yuan/hm2 will be provided, and long-term forage purchase contracts will be established through government–enterprise cooperation to guarantee stable sales channels for farmers. For the Huang-Huai-Hai Plain, it is necessary to break through the technological emission reduction ceiling and realize moderate structural diversification: pilot strip intercropping of strong-gluten wheat and silage corn, replace 10% of traditional corn area with low-carbon silage corn, and link agricultural subsidies with carbon emission reduction to balance farmers’ income and low-carbon transformation. For the Middle-Lower Yangtze Plain, it is necessary to amplify the advantage of water–heat resource matching: promote rice-legume intercropping and alternate wetting and drying (AWD) irrigation technology in double-cropping rice areas [53], and further develop facility agriculture with photovoltaic supplementary lighting to form a “photovoltaic-agriculture” zero-carbon model [46]. To mitigate the trade-off between precise water management for AWD irrigation (increasing labor input by 8%) and high initial investment in photovoltaic facilities, policies will cover 50% of the cost of AWD monitoring equipment along with free technical training and offer 3–5 year interest-free loans for photovoltaic projects plus a 30% electricity generation subsidy for the first three years. For the Xinjiang-Gansu region, emission reduction measures must be based on arid water constraints: focus on popularizing water-saving technologies such as under-film drip irrigation, replace 10% of the corn with drought-tolerant legumes, and establish a subsidy mechanism linked to water-saving and emission reduction to encourage farmers’ participation. To address the conflict between low market demand for legumes and high initial costs of drip irrigation equipment, the subsidy mechanism will integrate 1200–1500 yuan/hm2 for legume planting and 40% coverage of drip irrigation equipment costs, while local legume processing industries will be developed to enhance product value. All measures take the protection of grain production capacity as the premise and realize differentiated emission reduction according to regional resource endowments and cropping system characteristics. The core logic of these supplementary policies is to resolve short-term trade-offs through “subsidy compensation—stable channels—technical support”, ensuring that low-carbon transition does not compromise food security or farmers’ interests.
4.3. Limitations and Future Research Prospects
This study still has three limitations. First, it is constrained by data availability. Due to data scarcity in some regions within the four major production areas—Northeast Plain, Huang-Huai-Hai Plain, Middle-Lower Yangtze River Plain, and Xinjiang-Gansu Main Production Area—this study only selected eight provinces (Heilongjiang, Liaoning, Shandong, Henan, Jiangxi, Hubei, Xinjiang, and Gansu) as typical samples, failing to cover all provinces in each major production area. This may result in insufficient sample representativeness, masking more detailed differentiation characteristics of the cropping structure–carbon emission nexus within each region. Meanwhile, the calculation of crop carbon contribution relies on provincial statistical data and lacks field measurement verification at the county scale, which may further obscure the carbon effect differences in small-scale structural patterns such as plot rotation. Second, the depth of mechanism analysis is inadequate. The micro-regulation of carbon cycling processes by soil microbial communities (e.g., methanogens and nitrogen-fixing bacteria) has not been incorporated, making it difficult to quantify the impact of biological factors on the “crop-carbon” association. Third, the proposed measures lack dynamism, failing to consider the potential impact of climate change on irrigation demand and the differences in farmers’ acceptance during technology promotion.
In future research, we will first expand the research scope to cover all provinces in the four major production areas, integrate county-scale field monitoring and remote sensing data to refine the analysis of micro-scale cropping structure–carbon emission heterogeneity, and verify the carbon effects of small-scale agronomic practices such as plot rotation. Second, incorporate soil microbial community dynamics into the crop carbon emission framework to quantify the micro-regulatory role of biological factors (e.g., methanogens, nitrogen-fixing bacteria) in the crop–carbon nexus and deepen the mechanistic understanding. Third, construct a dynamic response model coupling climate change and agricultural carbon emissions, and conduct field surveys to explore farmers’ technology adoption behavior so as to formulate more adaptive, dynamic, and feasible regional low-carbon agricultural policies.
5. Conclusions
This study quantifies cropping structure-carbon emission linkages across China’s four major agricultural regions (2000–2021). The main conclusions are as follows: (1) structural differentiation drives 40–70% of spatial emission variance, with corn monoculture expansion increasing regional emissions by 15–30%; (2) high-carbon crop expansion (corn +12.4% area, cotton +8.7%) correlates with emission growth (r = 0.82–0.94), while legume contraction (−30% to −96.9%) erodes carbon buffering; (3) scale and structure effects dominate cumulative growth (+1.444 million tons in Xinjiang-Gansu, +0.89 million tons in Huang-Huai-Hai), partially offset by intensity reductions (−0.652 million tons) post-2015 policy intervention; (4) region-specific decoupling potentials exist through rotation optimization (Northeast), input efficiency (Huang-Huai-Hai), and water-saving technology (Xinjiang-Gansu).
Author Contributions
Conceptualization, F.G.; data curation, L.J.; formal analysis, J.X.; funding acquisition, F.G.; investigation, P.W.; methodology, J.Z.; supervision, P.W.; validation, P.W. and J.X.; visualization, J.Z.; writing—original draft, J.Z.; writing—review and editing, F.G. and L.J. All authors have read and agreed to the published version of the manuscript.
Funding
This research was financially supported by the Major Science and Technology Project of Xinjiang Autonomous Region (2023A02002-1), the Special Project of Scientific and Technological Innovation of Xinjiang Research Institute of Arid Area Agriculture (XJHQNY-2025-3), the National Natural Science Foundation of China (52109065), the Research Project of Shaanxi Laboratory for Arid Region Agriculture (2024ZY-JCYJ-02-40), and the Shanghai Cooperation Institute of Modern Agricultural Development (SCO24A001).
Data Availability Statement
The data presented in this study are derived from the following resources available in the public domain, and the datasets used for analysis can be accessed through the corresponding official channels: China Statistical Yearbook (2000–2021), National Bureau of Statistics of China, available at https://www.stats.gov.cn/sj/ndsj/ (accessed on 3 March 2026); Agricultural and Rural Affairs Ministry Database, available at http://zdscxx.moa.gov.cn:8080/nyb/pc/index.jsp (accessed on 3 March 2026); Provincial Statistical Yearbooks (2000–2021) of eight major grain-producing provinces: Heilongjiang Province: https://tjj.hlj.gov.cn/tjjnianjian/2024/zk/indexch.htm (accessed on 23 February 2026); Liaoning Province: https://tjj.ln.gov.cn/tjj/tjxx/xxcx/tjnj/index.shtml (accessed on 23 February 2026); Hubei Province: https://tjj.hubei.gov.cn/tjsj/sjkscx/tjnj/qstjnj/index.shtml (accessed on 23 February 2026); Jiangxi Province: https://tjj.hubei.gov.cn/tjsj/sjkscx/tjnj/qstjnj/index.shtml (accessed on 23 February 2026); Shandong Province: http://tjj.shandong.gov.cn/col/col6279/index.html (accessed on 23 February 2026); Henan Province: https://tjj.henan.gov.cn/tjfw/tjcbw/tjnj/ (accessed on 23 February 2026); Xinjiang Uygur Autonomous Region: https://tjj.xinjiang.gov.cn/tjj/nyypu/list_nj1.shtml (accessed on 23 February 2026); Gansu Province: https://cnki.istiz.org.cn/CSYDMirror/area/Yearbook/Single/N2025020020?z=D28 (accessed on 23 February 2026).
Conflicts of Interest
The authors declare no conflicts of interest.
References
- Huang, X.; Wu, X.; Guo, X.; Shen, Y. Agricultural carbon emissions in China: Measurement, spatiotemporal evolution, and influencing factors analysis. Front. Environ. Sci. 2024, 12, 1488047. [Google Scholar] [CrossRef] [Scilit]
- Xu, X.; Zhao, Q.; Guo, J.; Li, C.; Li, J.; Niu, K.; Jin, S.; Fu, C.; Gaffney, P.P.J.; Xu, Y.; et al. Inequality in agricultural greenhouse gas emissions intensity has risen in rural China from 1993 to 2020. Nat. Food 2024, 5, 916–928. [Google Scholar] [CrossRef] [Scilit] [PubMed]
- Pan, G.; Zhao, Q. Study on evolution of organic carbon stock in agricultural soils of China: Facing the challenge of global change and food security. Adv. Earth Sci. 2005, 20, 384. [Google Scholar]
- Xue, Y.; Li, C.; Li, J.; Lyu, H.; Lai, Q.; Kang, Z.; Yao, P.; Li, J. Analysis of spatial and temporal characteristics and drivers of agricultural carbon emissions in China. Chin. J. Eco-Agric. 2024, 32, 1805–1817. [Google Scholar]
- Makutėnienė, D.; Perkumienė, D.; Makutėnas, V. Logarithmic mean Divisia index decomposition based on Kaya identity of GHG emissions from agricultural sector in Baltic States. Energies 2022, 15, 1195. [Google Scholar] [CrossRef] [Scilit]
- Gao, M.; Xu, H.; Ma, M.; Gao, G.; Chen, X.; Chen, J.; Liu, X.; Qi, L. Global intercountry croplands’ greenhouse gas emissions differences and their potential drivers from economic levels perspective. Ecol. Indic. 2024, 167, 112635. [Google Scholar] [CrossRef] [Scilit]
- He, Y.; Dai, X. Phase characteristics and regional differences in agriculture carbon emissions in China. Resour. Sci. 2016, 38, 1780–1790. [Google Scholar]
- Tian, Y.; Shao, D.; Li, S.; Wang, B. Response of rice water requirement to groundwater depths and irrigations simulation in cold region of Northeast China. J. Irrig. Drain 2019, 38, 68–77. [Google Scholar]
- Deng, W.; Xu, Z. Characteristics of agricultural carbon emissions and carbon peak analysis in Hunan Province. Chin. J. Eco-Agric. 2024, 32, 206–217. [Google Scholar]
- Ren, H.; Li, H.; Feng, Y. Dynamic evolution characteristics and development trend of agricultural carbon emissions in Guangdong Province based on spatial and temporal perspective. Chin. J. Eco-Agric. 2023, 31, 1287–1300. [Google Scholar]
- Yang, S.; Sun, X.; Ding, J.; Jiang, Z.; Xu, J. Effects of biochar addition on the NEE and soil organic carbon content of paddy fields under water-saving irrigation. Environ. Sci. Pollut. Res. 2019, 26, 8303–8311. [Google Scholar] [CrossRef] [Scilit]
- Ang, B.W. Decomposition analysis for policymaking in energy: Which is the preferred method? Energy Policy 2004, 32, 1131–1139. [Google Scholar] [CrossRef] [Scilit]
- Peng, C.; Jia, J.S.; Yu, Q.; Zhu, C. Analysis of Spatio-temporal evolution and influencing factors of agricultural carbon emission in China. Res. Environ. Sci. 2024, 37, 1181–1192. [Google Scholar]
- IPCC. Climate Change 2013: The Physical Science Basis; IPCC: Geneva, Switzerland, 2013. Available online: https://www.ipcc.ch/report/ar5/wg1/ (accessed on 20 August 2025).
- Chataut, G.; Bhatta, B.; Joshi, D.; Subedi, K.; Kafle, K. Greenhouse gases emission from agricultural soil: A review. J. Agric. Food Res. 2023, 11, 100533. [Google Scholar] [CrossRef] [Scilit]
- Prud’homme, M. Global nitrogen fertilizer supply and demand outlook. Sci. China Ser. C-Life Sci. 2005, 48, 818–826. [Google Scholar] [CrossRef] [Scilit]
- Tongwane, M.; Mdlambuzi, T.; Moeletsi, M.; Tsubo, M.; Mliswa, V.; Grootboom, L. Greenhouse gas emissions from different crop production and management practices in South Africa. Environ. Dev. 2016, 19, 23–35. [Google Scholar] [CrossRef] [Scilit]
- Linquist, B.A.; Adviento-Borbe, M.A.; Pittelkow, C.M.; van Kessel, C.; van Groenigen, K.J. Fertilizer management practices and greenhouse gas emissions from rice systems: A quantitative review and analysis. Field Crops Res. 2012, 135, 10–21. [Google Scholar] [CrossRef] [Scilit]
- Gupta, K.; Kumar, R.; Baruah, K.K.; Hazarika, S.; Karmakar, S.; Bordoloi, N. Greenhouse gas emission from rice fields: A review from Indian context. Environ. Sci. Pollut. Res. 2021, 28, 30551–30572. [Google Scholar] [CrossRef] [Scilit] [PubMed]
- Mohammadi, A.; Tabatabaeefar, A.; Shahin, S.; Rafiee, S.; Keyhani, A. Energy use and economical analysis of potato production in Iran a case study: Ardabil province. Energy Convers. Manag. 2008, 49, 3566–3570. [Google Scholar] [CrossRef] [Scilit]
- Cole, C.V.; Duxbury, J.; Freney, J.; Heinemeyer, O.; Minami, K.; Mosier, A.; Paustian, K.; Rosenberg, N.; Sampson, N.; Sauerbeck, D.; et al. Global estimates of potential mitigation of greenhouse gas emissions by agriculture. Nutr. Cycl. Agroecosyst. 1997, 49, 221–228. [Google Scholar] [CrossRef] [Scilit]
- Kim, S.; Dale, B.E.; Keck, P. Energy requirements and greenhouse gas emissions of maize production in the USA. BioEnergy Res. 2014, 7, 753–764. [Google Scholar] [CrossRef] [Scilit]
- Meng, Q.; Yue, S.; Hou, P.; Cui, Z.; Chen, X. Improving yield and nitrogen use efficiency simultaneously for maize and wheat in China: A Review. Pedosphere 2016, 26, 137–147. [Google Scholar] [CrossRef] [Scilit]
- Tokel, D.; Erkencioglu, B.N. Production and trade of oil crops, and their contribution to the world economy. In Oil Crop Genomics; Springer International Publishing: Cham, Switzerland, 2021; pp. 415–427. [Google Scholar]
- Yang, S.; Huo, L.; Wang, C.; Wen, M. Characteristics of agricultural carbon emissions in Gansu Province based on STIRPAT model. Arid Land Geogr. 2023, 46, 1493–1502. [Google Scholar]
- Ding, B.G.; Zhao, Y.; Deng, J.H. Calculation, decoupling effects and driving factors of carbon emission from planting industry in China. Chin. J. Agric. Resour. Reg. Plan. 2022, 43, 1–11. [Google Scholar]
- Zhuang, M.; Wang, X.; Yang, Y.; Wu, Y.; Wang, L.; Lu, X. Agricultural machinery could contribute 20% of total carbon and air pollutant emissions by 2050 and compromise carbon neutrality targets in China. Nat. Food 2025, 6, 513–522. [Google Scholar] [CrossRef] [Scilit]
- Du, L.; Zhong, H.; Guo, X.; Li, H.; Xia, J.; Chen, Q. Nitrogen fertilization and soil nitrogen cycling: Unraveling the links among multiple environmental factors, functional genes, and transformation rates. Sci. Total Environ. 2024, 951, 175561. [Google Scholar] [CrossRef] [Scilit]
- Mitra, S.; Saran, R.K.; Srivastava, S.; Rensing, C. Pesticides in the environment: Degradation routes, pesticide transformation products and ecotoxicological considerations. Sci. Total Environ. 2024, 935, 173026. [Google Scholar] [CrossRef] [Scilit] [PubMed]
- Ru, M.; He, X.; Shi, D.; Shen, J.; Xu, X.; Cui, J.; Lu, Z.; Ruan, Y.; Zhu, P. Impacts of Degradable Film Mulch on GHG Emissions in Paddy Fields and Rice Yield: A Case Study. Agriculture 2025, 15, 2144. [Google Scholar] [CrossRef] [Scilit]
- Zhang, G.; Ming, B.; Xie, R.; Chen, J.; Hou, P.; Xue, J.; Shen, D.; Li, R.; Zhai, J.; Zhang, Y.; et al. Reducing plastic film mulching and optimizing agronomic management can ensure food security and reduce carbon emissions in irrigated maize areas. Sci. Total Environ. 2023, 883, 163507. [Google Scholar] [CrossRef] [Scilit]
- Zhu, R.; Zhao, R.; Li, X.; Hu, X.; Jiao, S.; Xiao, L.; Xie, Z.; Sun, J.; Wang, S.; Yang, Q.; et al. The impact of irrigation modes on agricultural water-energy-carbon nexus. Sci. Total Environ. 2023, 860, 160493. [Google Scholar] [CrossRef] [Scilit]
- Rochette, P.; Angers, D.A. Soil Surface Carbon Dioxide Fluxes Induced by Spring, Summer, and Fall Moldboard Plowing in a Sandy Loam. Soil Sci. Soc. Am. J. 1999, 63, 621–628. [Google Scholar] [CrossRef] [Scilit]
- West, T.O.; Marland, G. A synthesis of carbon sequestration, carbon emissions, and net carbon flux in agriculture: Comparing tillage practices in the United States. Agric. Ecosyst. Environ. 2002, 91, 217–232. [Google Scholar] [CrossRef] [Scilit]
- Wang, B.; Zhang, W. A research of agricultural eco-efficiency measure in China and space-time differences. China Popul. Resour. Environ. 2016, 26, 11–19. [Google Scholar]
- Duan, H.; Zhang, Y.; Zhao, J.; Bian, X. Carbon footprint analysis of farmland ecosystem in China. J. Soil Water Conserv. 2011, 25, 203–208. [Google Scholar]
- Li, E.; Ren, S.; Yang, Y. Green transformation mechanisms and implementation path for agricultural clusters: A case study of the vegetable cluster in Shouguang city, Shandong province, China. J. Geogr. Sci. 2024, 34, 2393–2420. [Google Scholar] [CrossRef] [Scilit]
- Meng, L.I.; Christopher, G.A.N.; Wanglin, M.A. Impact of cash crop cultivation on household income and migration decisions: Evidence from low-income regions in China. J. Integr. Agric. 2022, 19, 2571–2581. [Google Scholar]
- Yang, N.; Sun, X.; Qi, Q. Impact of factor quality improvement on agricultural carbon emissions: Evidence from China’s high-standard farmland. Front. Environ. Sci. 2022, 10, 989684. [Google Scholar] [CrossRef] [Scilit]
- Guo, C.; Xie, K.; Ding, D.; Liu, A.; Ren, W.; Chen, J.; Yong, B.; Li, Z. Soil fertility and crop yield variation and their response to fertilization in the fluvo-aquic soil regions of east Henan Province from 2006 to 2019. J. Plant Nutr. Fertil. 2023, 29, 1290–1299. [Google Scholar]
- Zhang, Y.; Gu, J.; Wang, C.; Wang, W.; Zhang, W.; Gu, J.; Liu, L.; Yang, J.; Zhang, H. Carbon footprint of major grain crops in the middle and lower reaches of the Yangtze River during 2011–2020. J. Appl. Ecol. 2023, 34, 3364–3372. [Google Scholar]
- Qin, J.; Duan, W.; Zou, S.; Chen, Y.; Huang, W.; Rosa, L. Global energy use and carbon emissions from irrigated agriculture. Nat. Commun. 2024, 15, 3084. [Google Scholar] [CrossRef] [Scilit]
- Okumu, O.O.; Otieno, H.M.; Okeyo, G.O. Production systems and contributions of grain legumes to soil health and sustainable agriculture: A review. Arch. Agric. Environ. Sci. 2023, 8, 259–267. [Google Scholar] [CrossRef] [Scilit]
- Zheng, J.; Huang, H.; Liao, Y.; Wang, L.; Yuan, J.; Lin, J.; Liao, Q. Progress and suggestions on full mechanization of rapeseed production in the middle reaches of the Yangtze River. Chin. J. Oil Crop Sci. 2024, 46, 245–259. [Google Scholar]
- Luo, H.; Pan, L.; Yu, Z. Evolution of grain supply and demand pattern in major grain-producing areas in China based on contribution rate to food security. Acta Agric. Zhejiangensis 2020, 32, 2077–2086. [Google Scholar]
- Hu, S.; Xiang, R.; Dong, J.; Qi, Z. The sustainable development of vegetable production system from the carbon footprint perspective in Hubei Province. Res. Agric. Mod. 2016, 37, 460–467. [Google Scholar]
- Traldi, R.; Asprooth, L.; Usher, E.M.; Floress, K.; Arbuckle, J.G.; Baskerville, M.; Church, S.P.; Genskow, K.; Harden, S.; Maynard, E.T.; et al. “Safer to plant corn and beans”? Navigating the challenges and opportunities of agricultural diversification in the U.S. Corn Belt. Agric. Hum. Values 2024, 41, 1687–1706. [Google Scholar] [CrossRef] [Scilit]
- Searchinger, T.; Heimlich, R.; Houghton, R.A.; Dong, F.; Elobeid, A.; Fabiosa, J.; Tokgoz, S.; Hayes, D.; Yu, T.-H. Use of U.S. croplands for biofuels increases greenhouse gases through emissions from land-use change. Science 2008, 319, 1238–1240. [Google Scholar] [CrossRef] [Scilit]
- Chen, J.; Shi, Z.; Tian, Y.; Li, H.; Duan, H.; Qin, Z.; Cheng, J.; Dang, Y.P.; Lin, B.; Zhao, X. From growth to decline: The dynamic effects of maize-based cropping systems on soil organic carbon storage in Northeast China. Agric. Ecosyst. Environ. 2025, 393, 109825. [Google Scholar] [CrossRef] [Scilit]
- Tian, Y.; Zhang, J.; Li, B. Agricultural carbon emissions in China: Calculation, spatial-temporal comparison and decoupling effects. Resour. Sci. 2012, 34, 2097–2105. [Google Scholar]
- Zhang, Y.; Li, H.; Zhao, Z. Effects of grain crop planting changes on agricultural carbon emissions between provinces in China. Chin. J. Agric. Resour. Reg. Plan. 2022, 10, 1–12. [Google Scholar]
- Chen, L.; Hao, J.; Wang, F.; Yin, Y.; Gao, Y.; Duan, W.; Yang, J. Carbon sequestration function of cultivated land use system based on the carbon cycle for the Huang-Huai-Hai Plain. Resour. Sci. 2016, 38, 1039–1053. [Google Scholar]
- Wang, X.; Chen, Y.; Yang, K.; Duan, F.; Liu, P.; Wang, Z.; Wang, J. Effects of legume intercropping and nitrogen input on net greenhouse gas balances, intensity, carbon footprint and crop productivity in sweet maize cropland in South China. J. Clean. Prod. 2021, 314, 127997. [Google Scholar] [CrossRef] [Scilit]
- Meijide, A.; Gruening, C.; Goded, I.; Seufert, G.; Cescatti, A. Water management reduces greenhouse gas emissions in a Mediterranean rice paddy field. Agric. Ecosyst. Environ. 2017, 238, 168–178. [Google Scholar] [CrossRef] [Scilit]
- Prosser, I.P.; Chiew, F.H.S.; Smith, M.S. Adapting water management to climate change in the Murray–Darling Basin, Australia. Water 2021, 13, 2504. [Google Scholar] [CrossRef] [Scilit]
- Fellmann, T.; Perez, D.I.; Witzke, P.; Weiss, F.; Hristov, J.; Barreiro, H.J.; Leip, A.; Himics, M. Greenhouse gas mitigation technologies in agriculture: Regional circumstances and interactions determine cost-effectiveness. J. Clean. Prod. 2021, 317, 128406. [Google Scholar] [CrossRef] [Scilit]
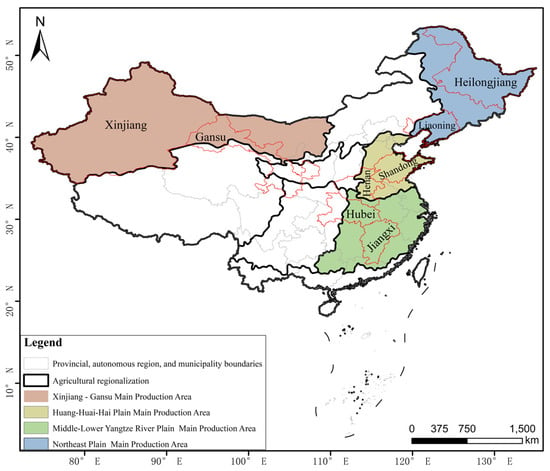
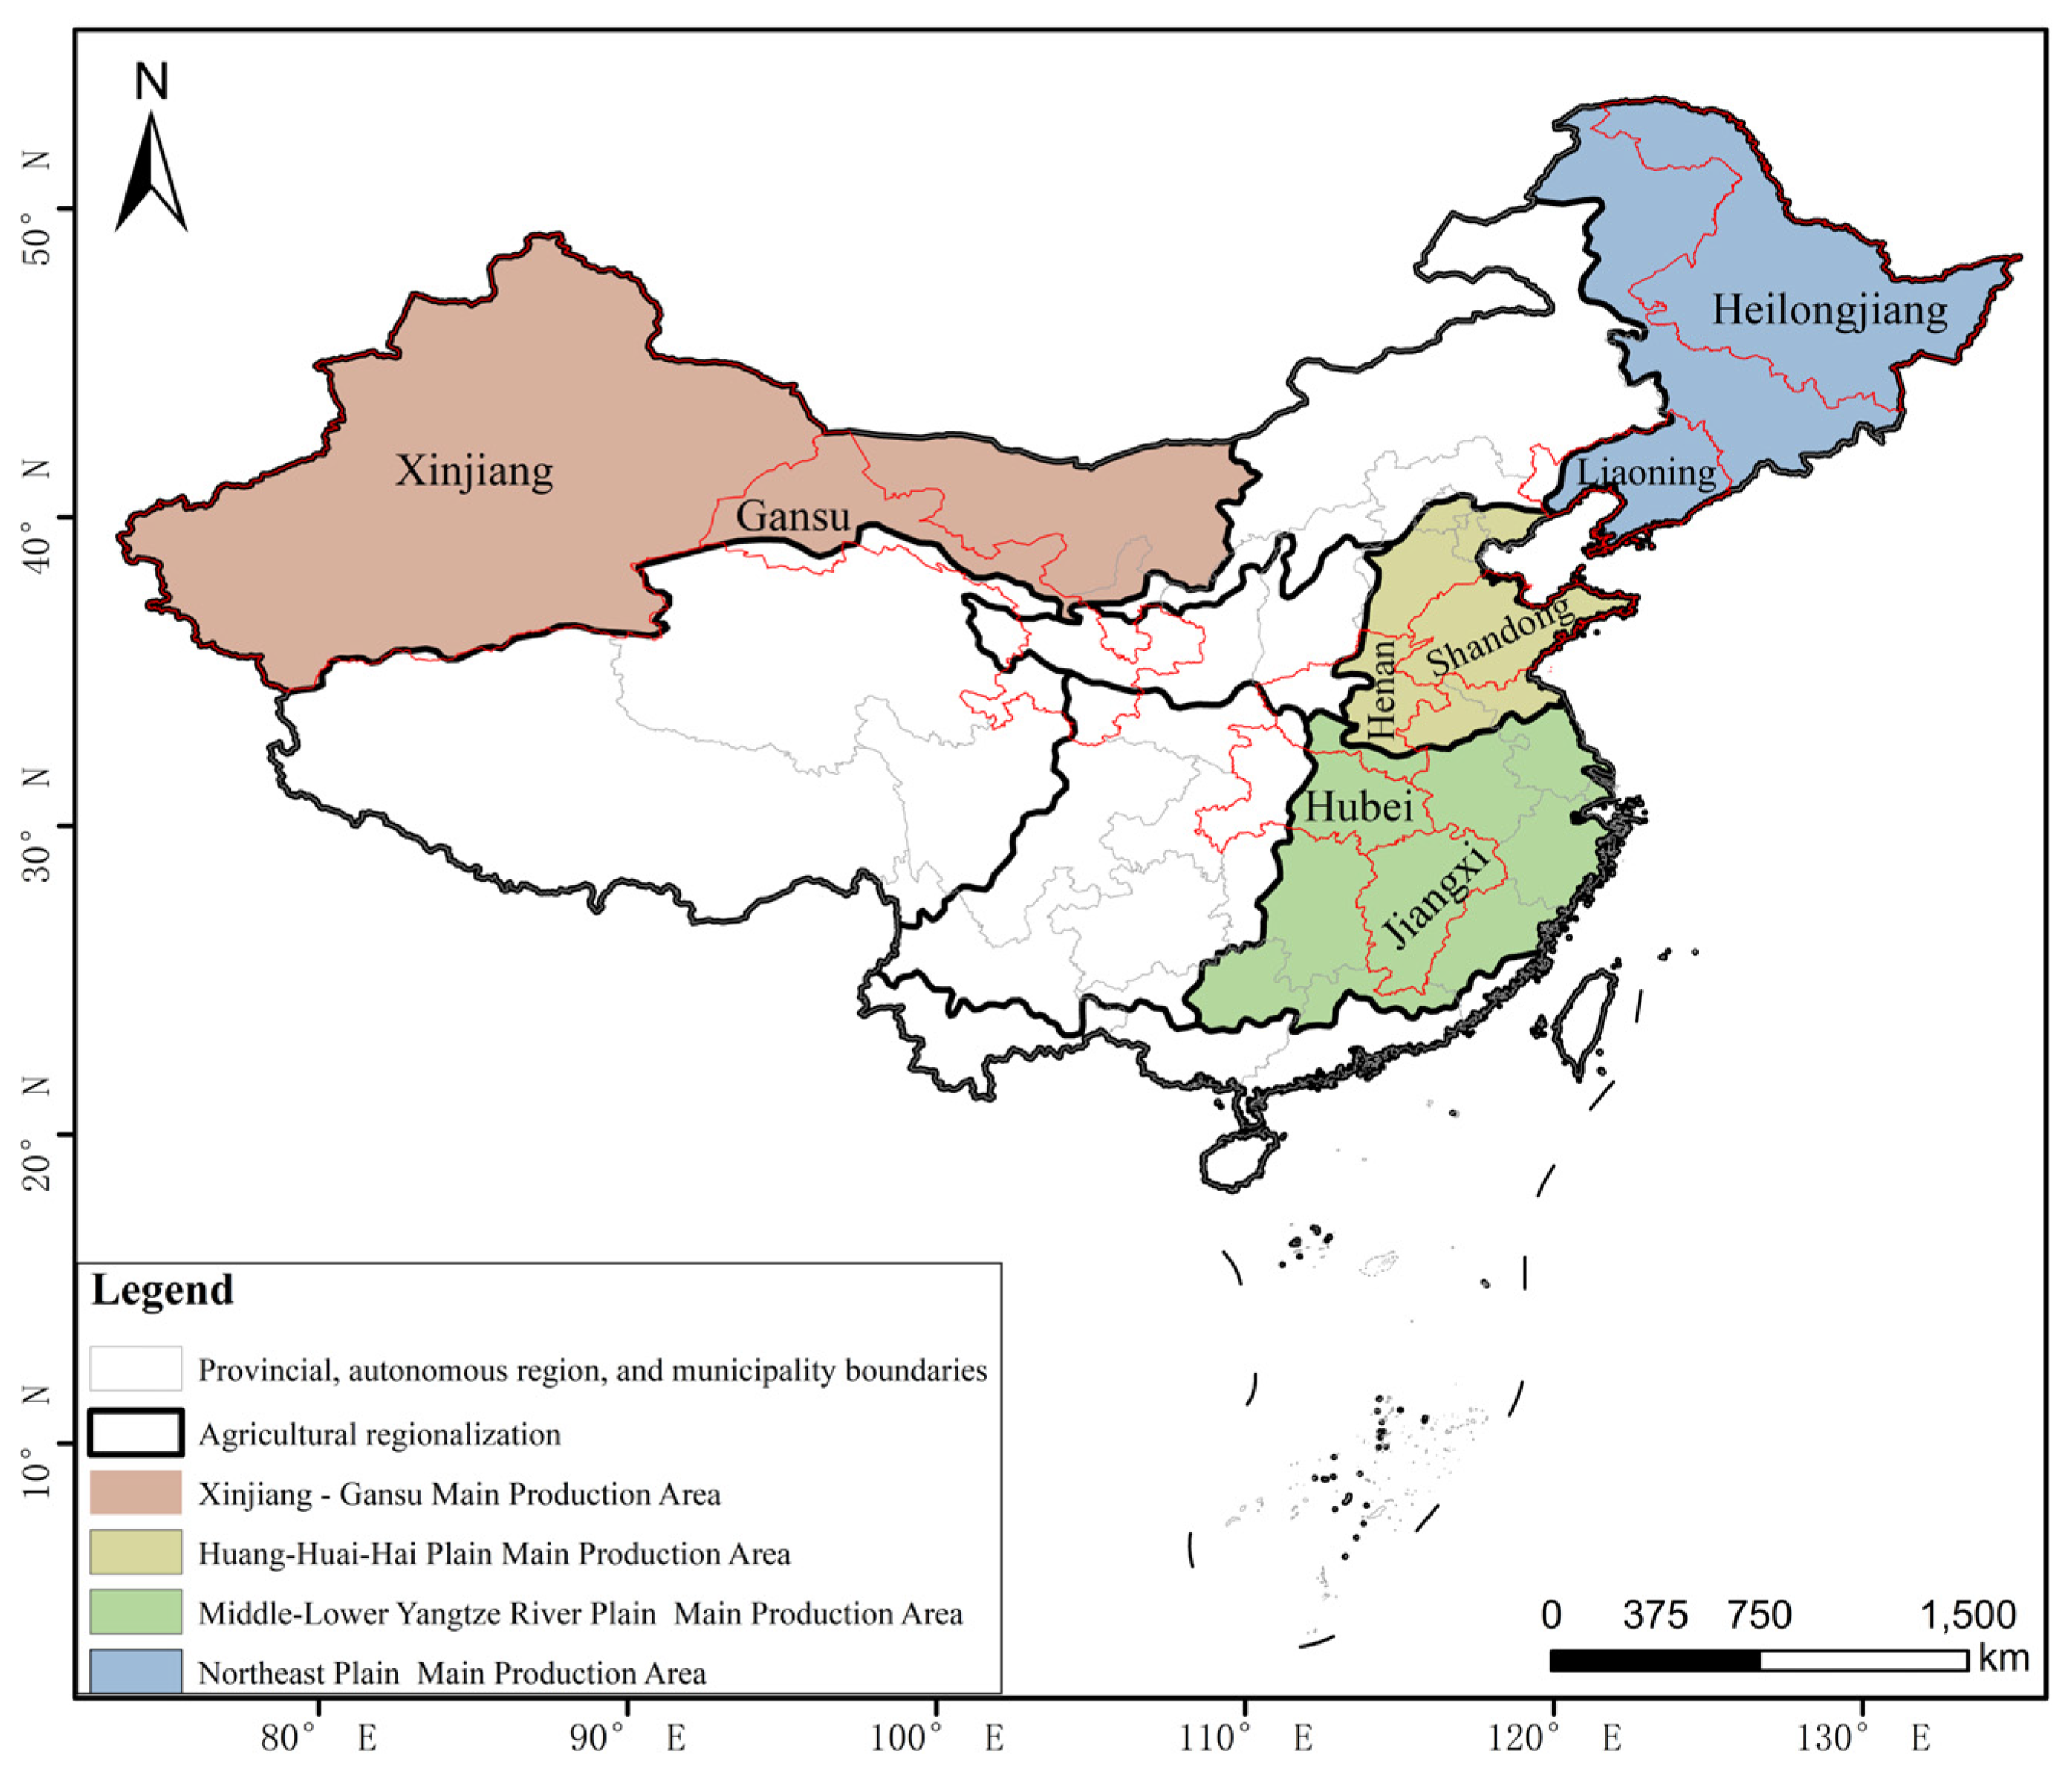
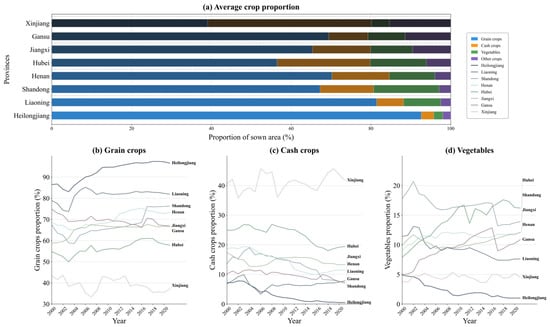
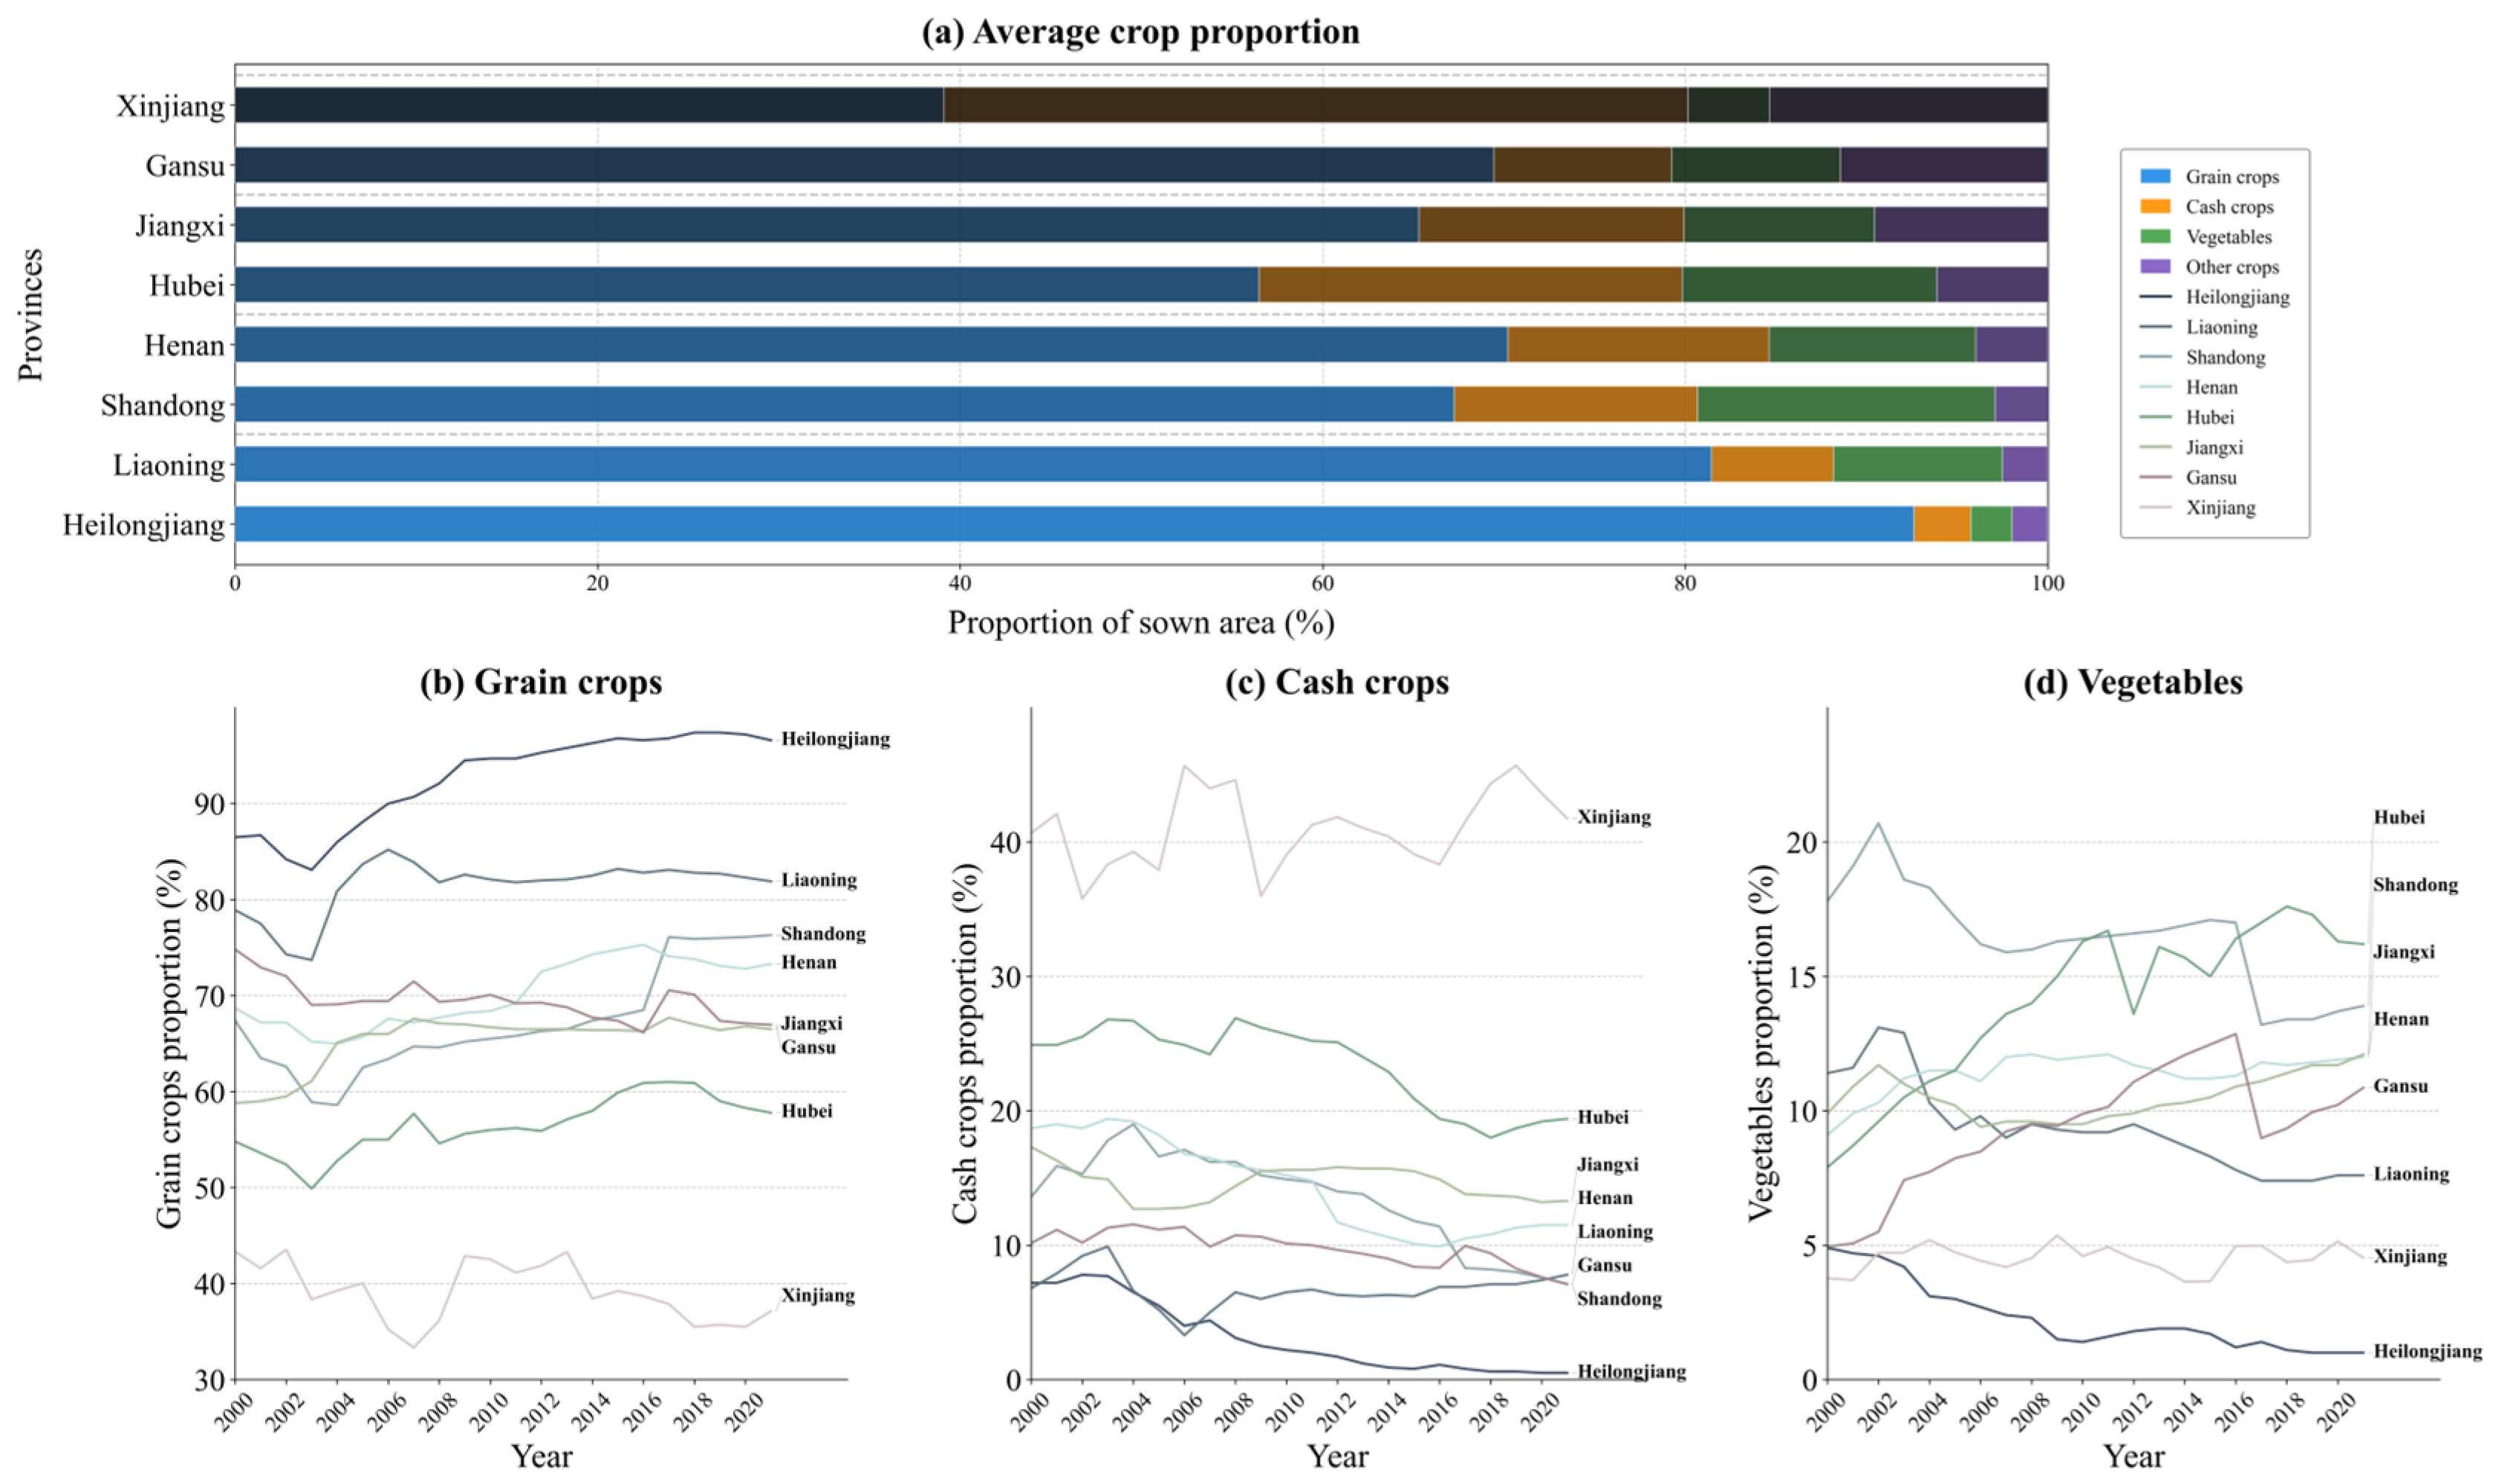
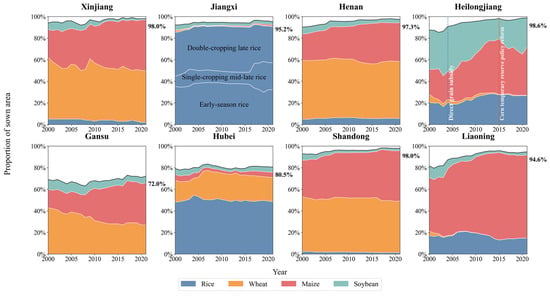
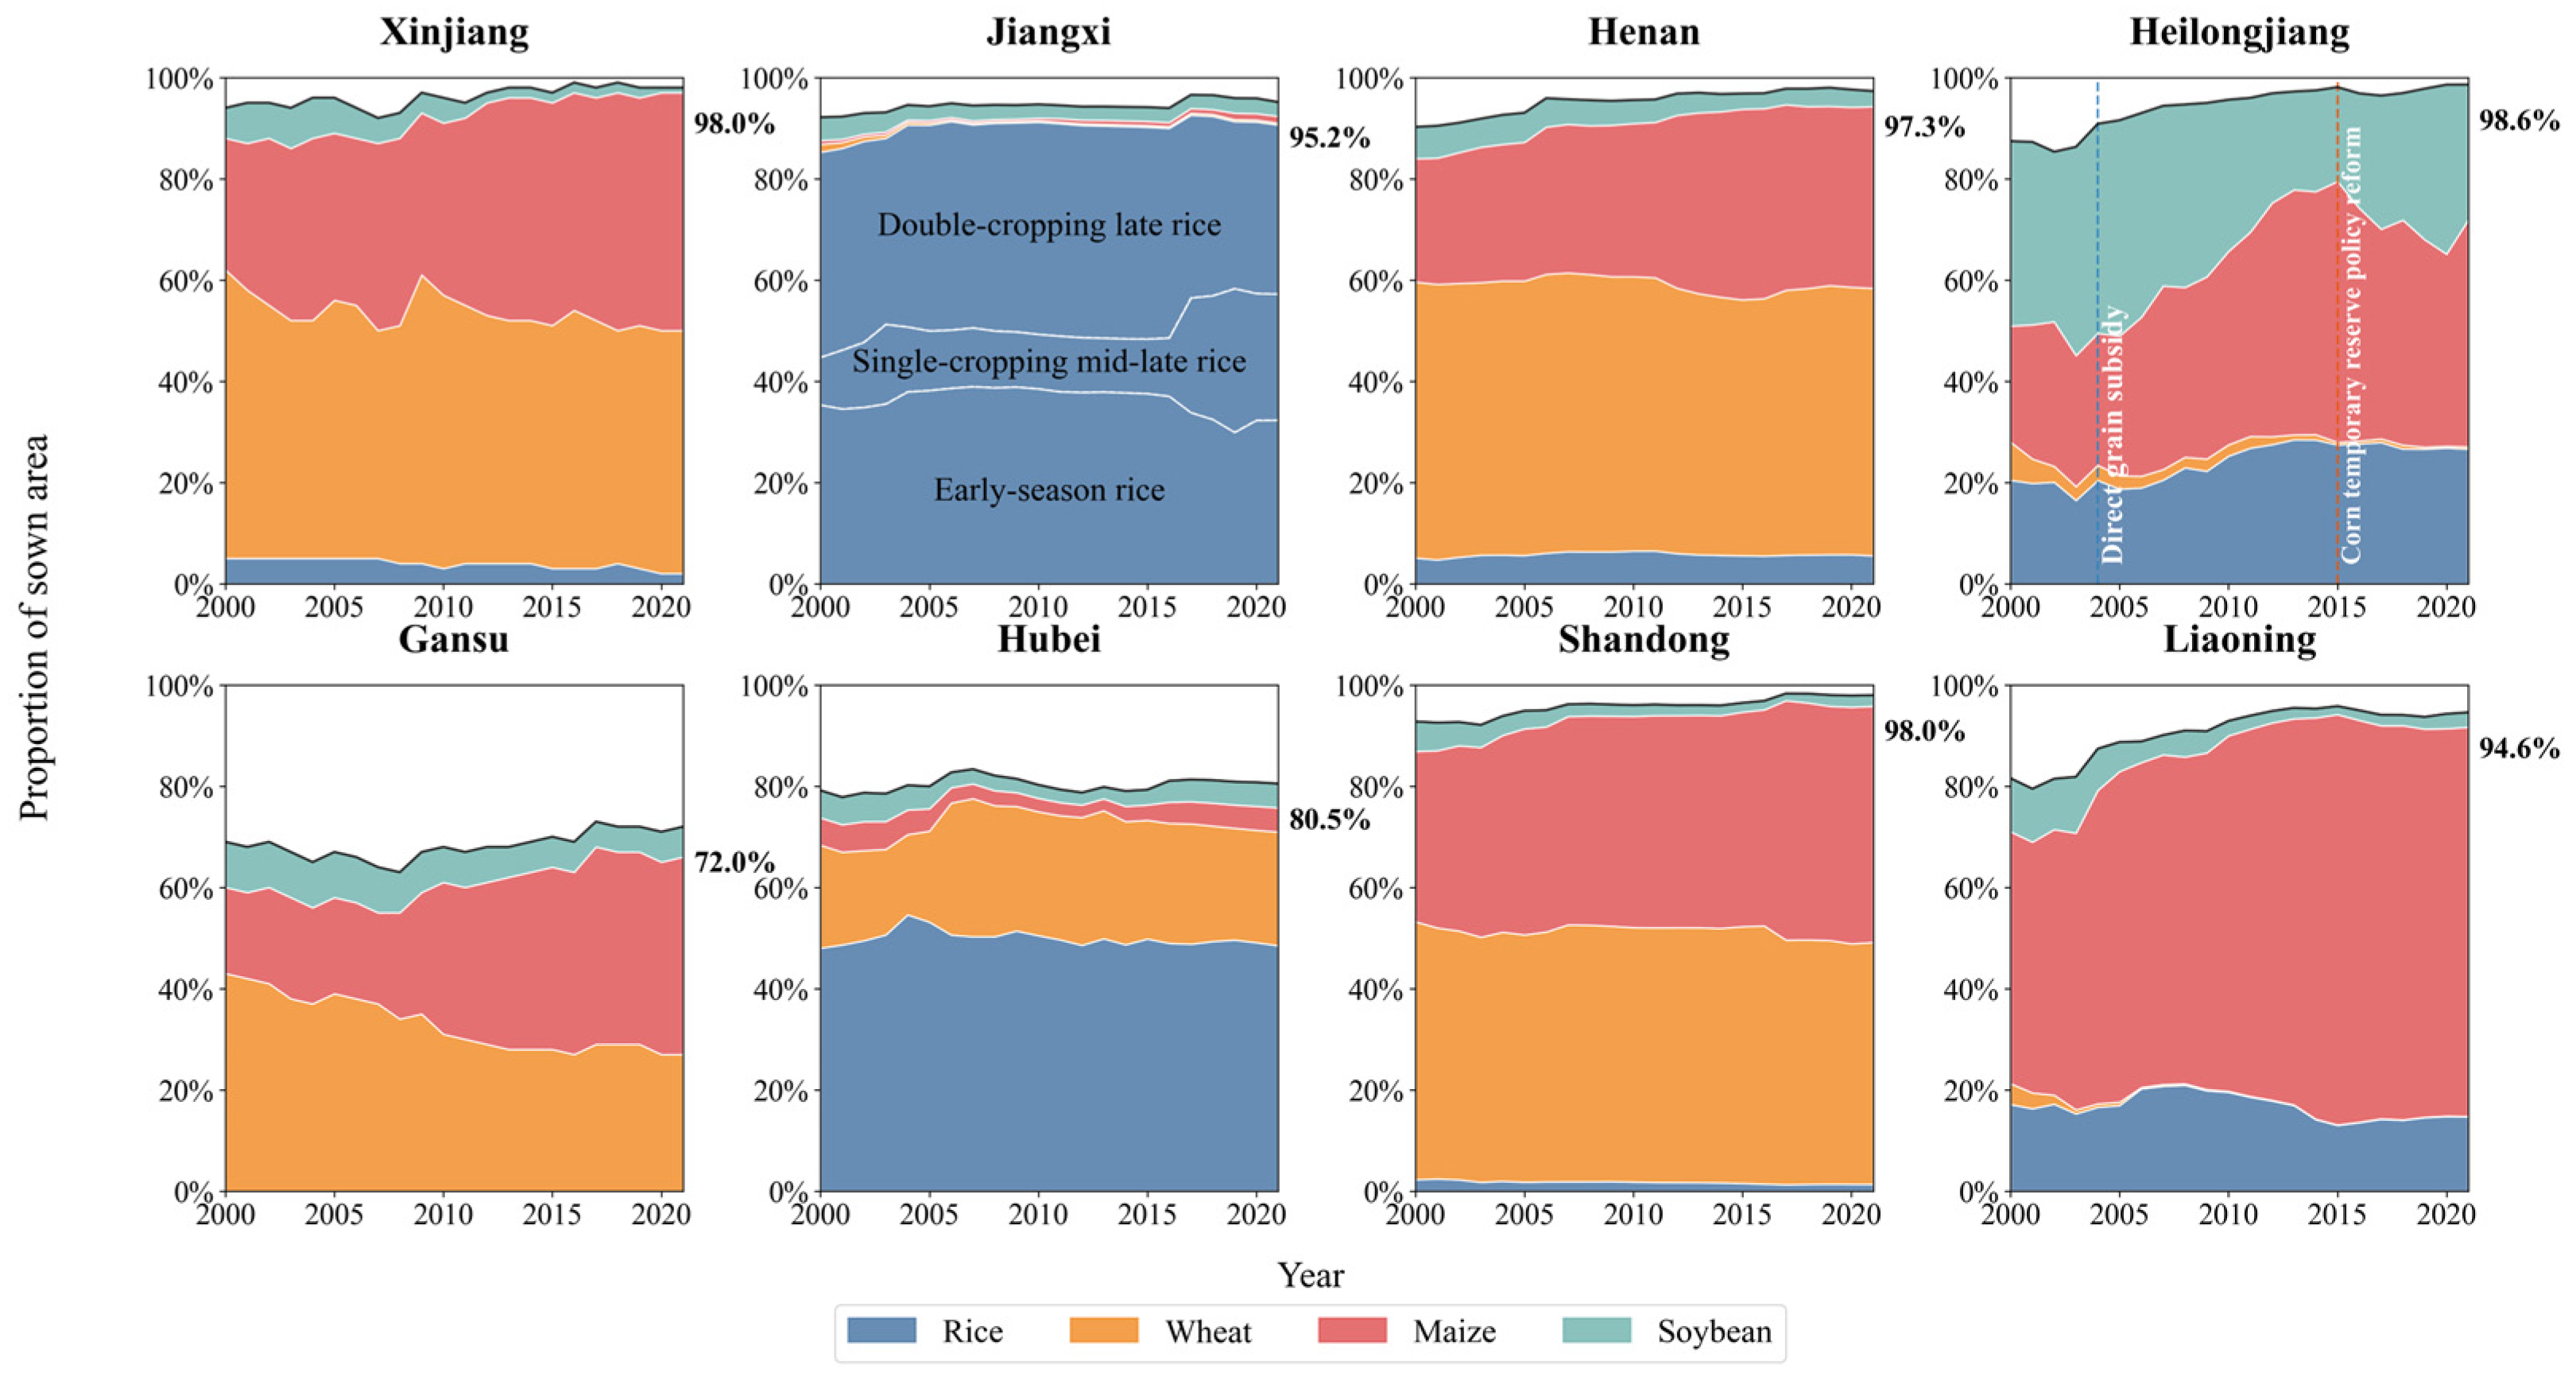
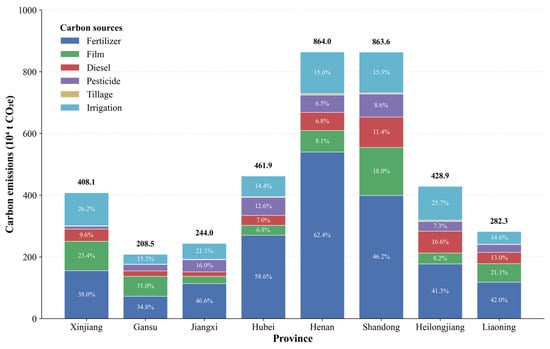
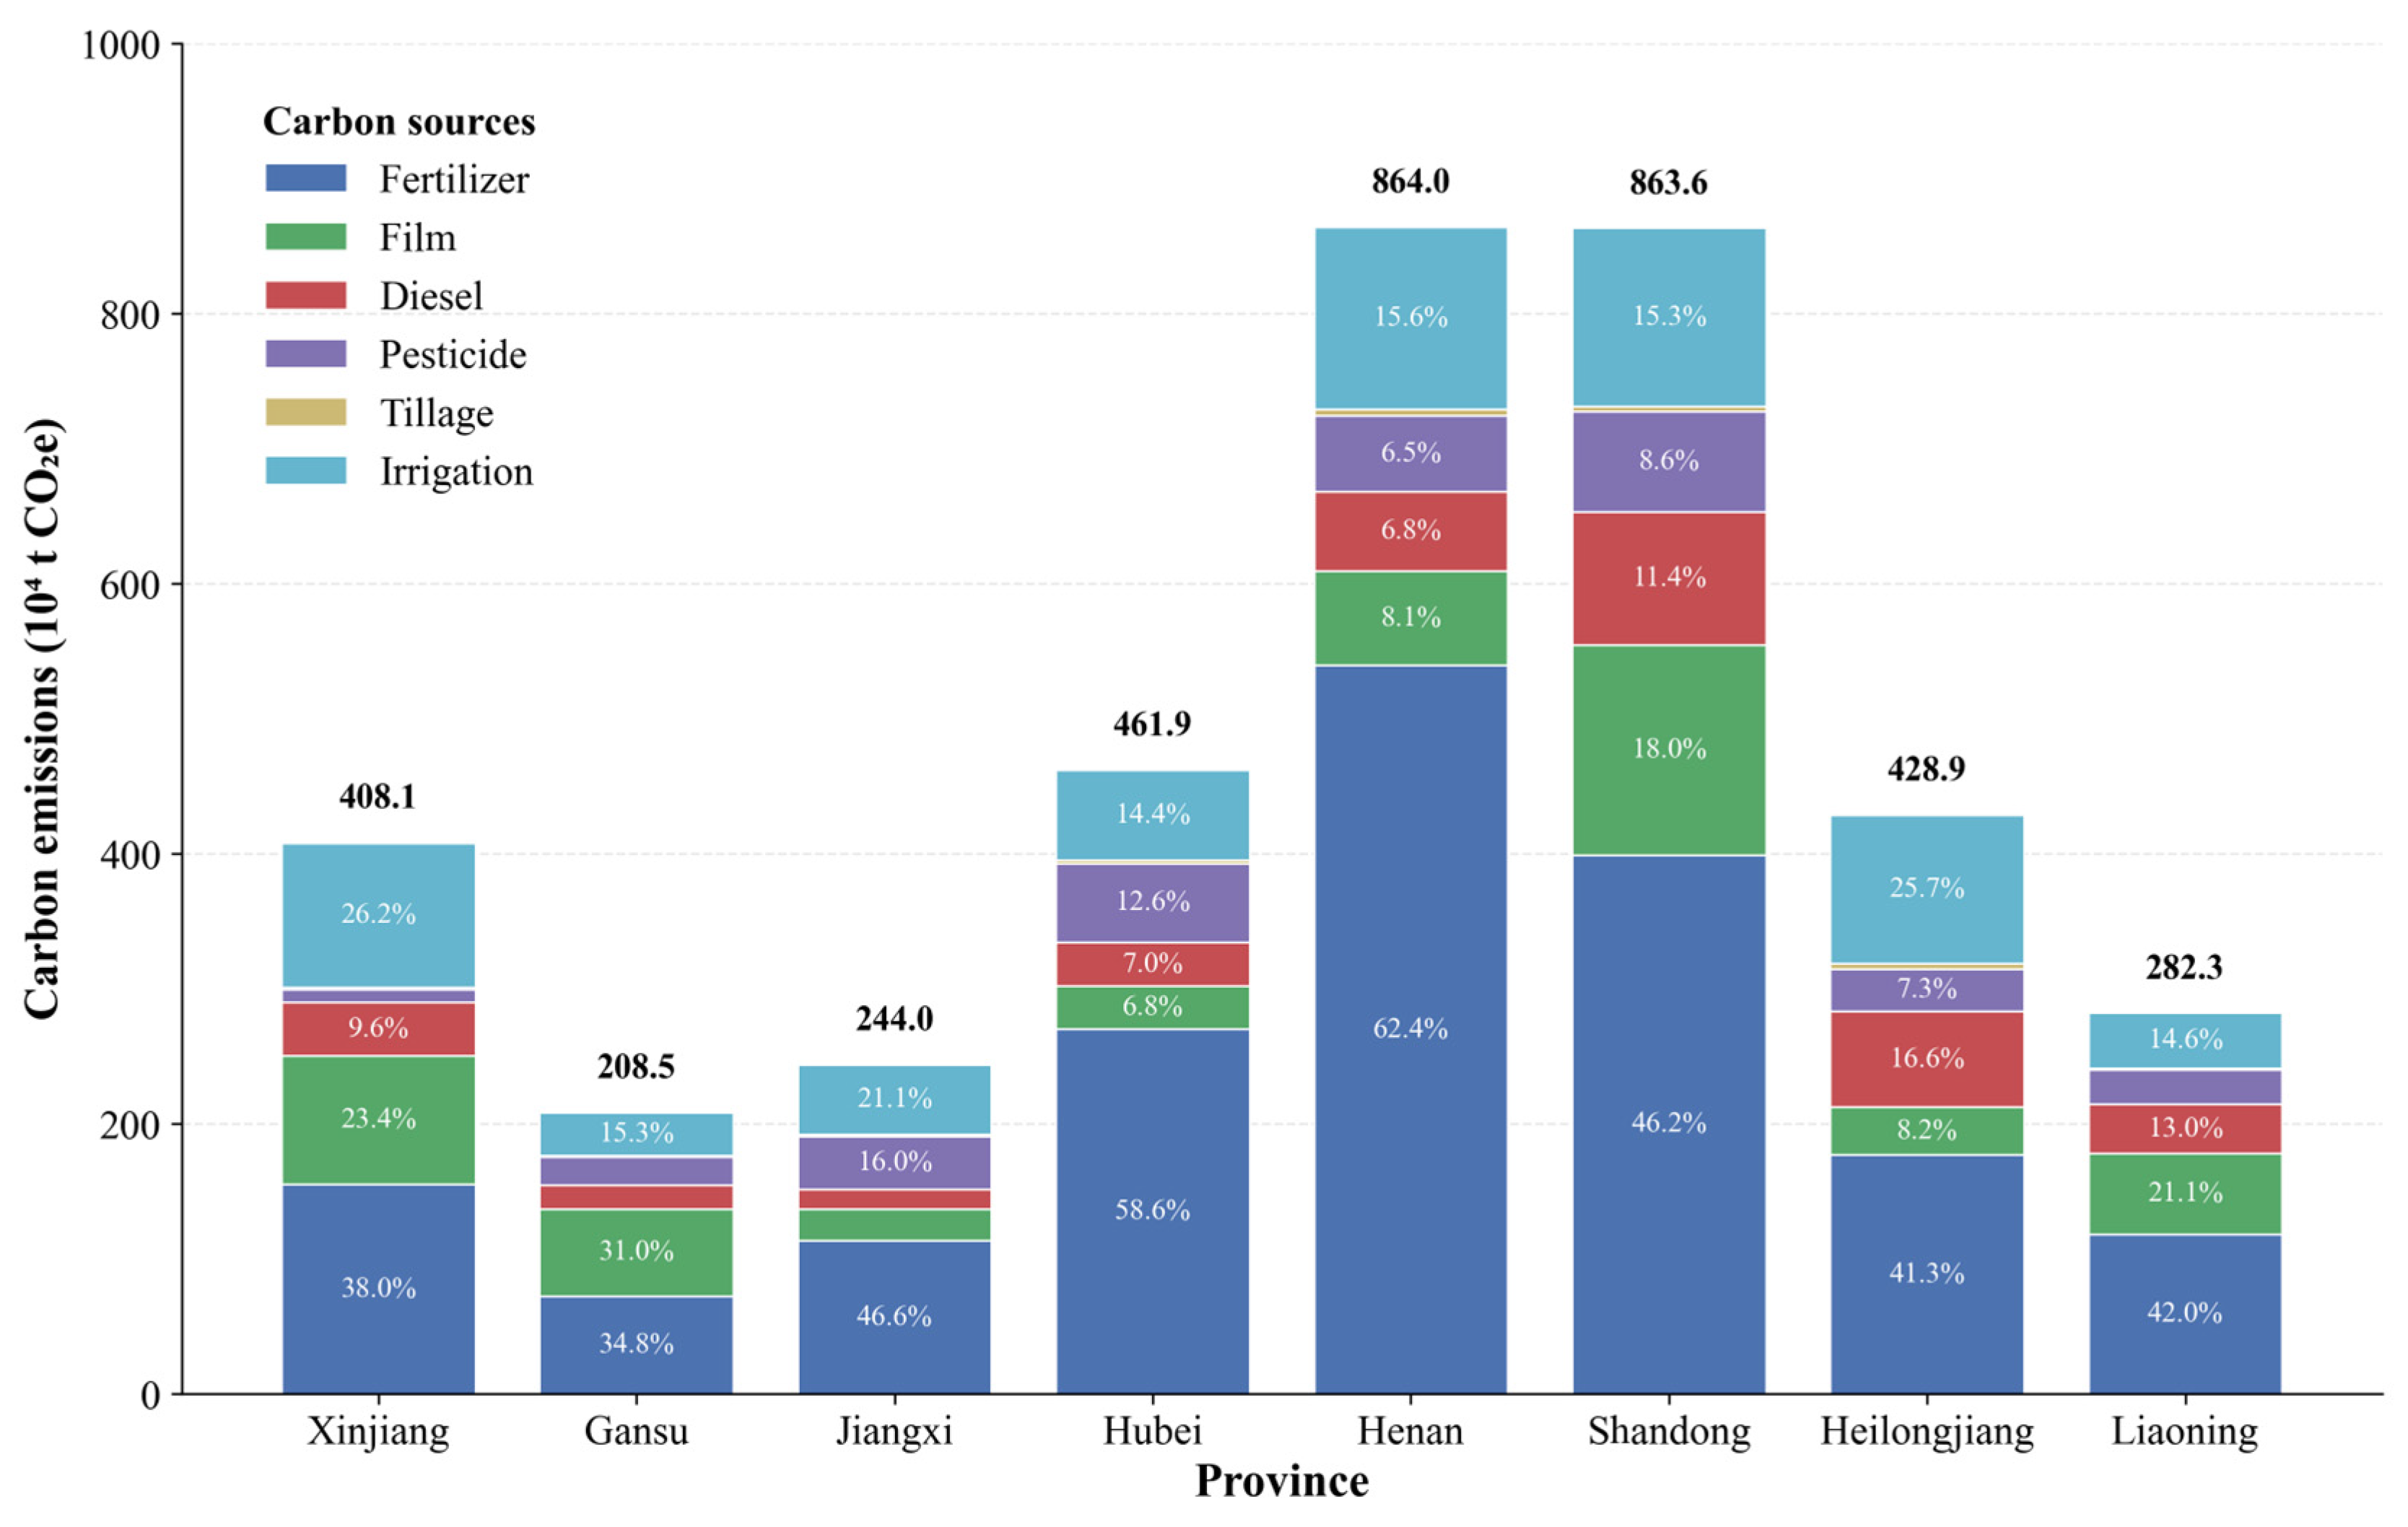
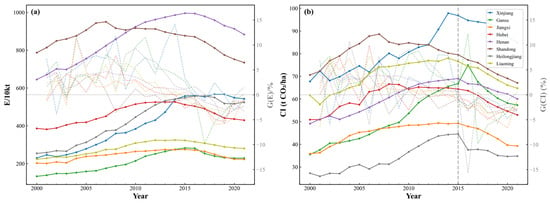
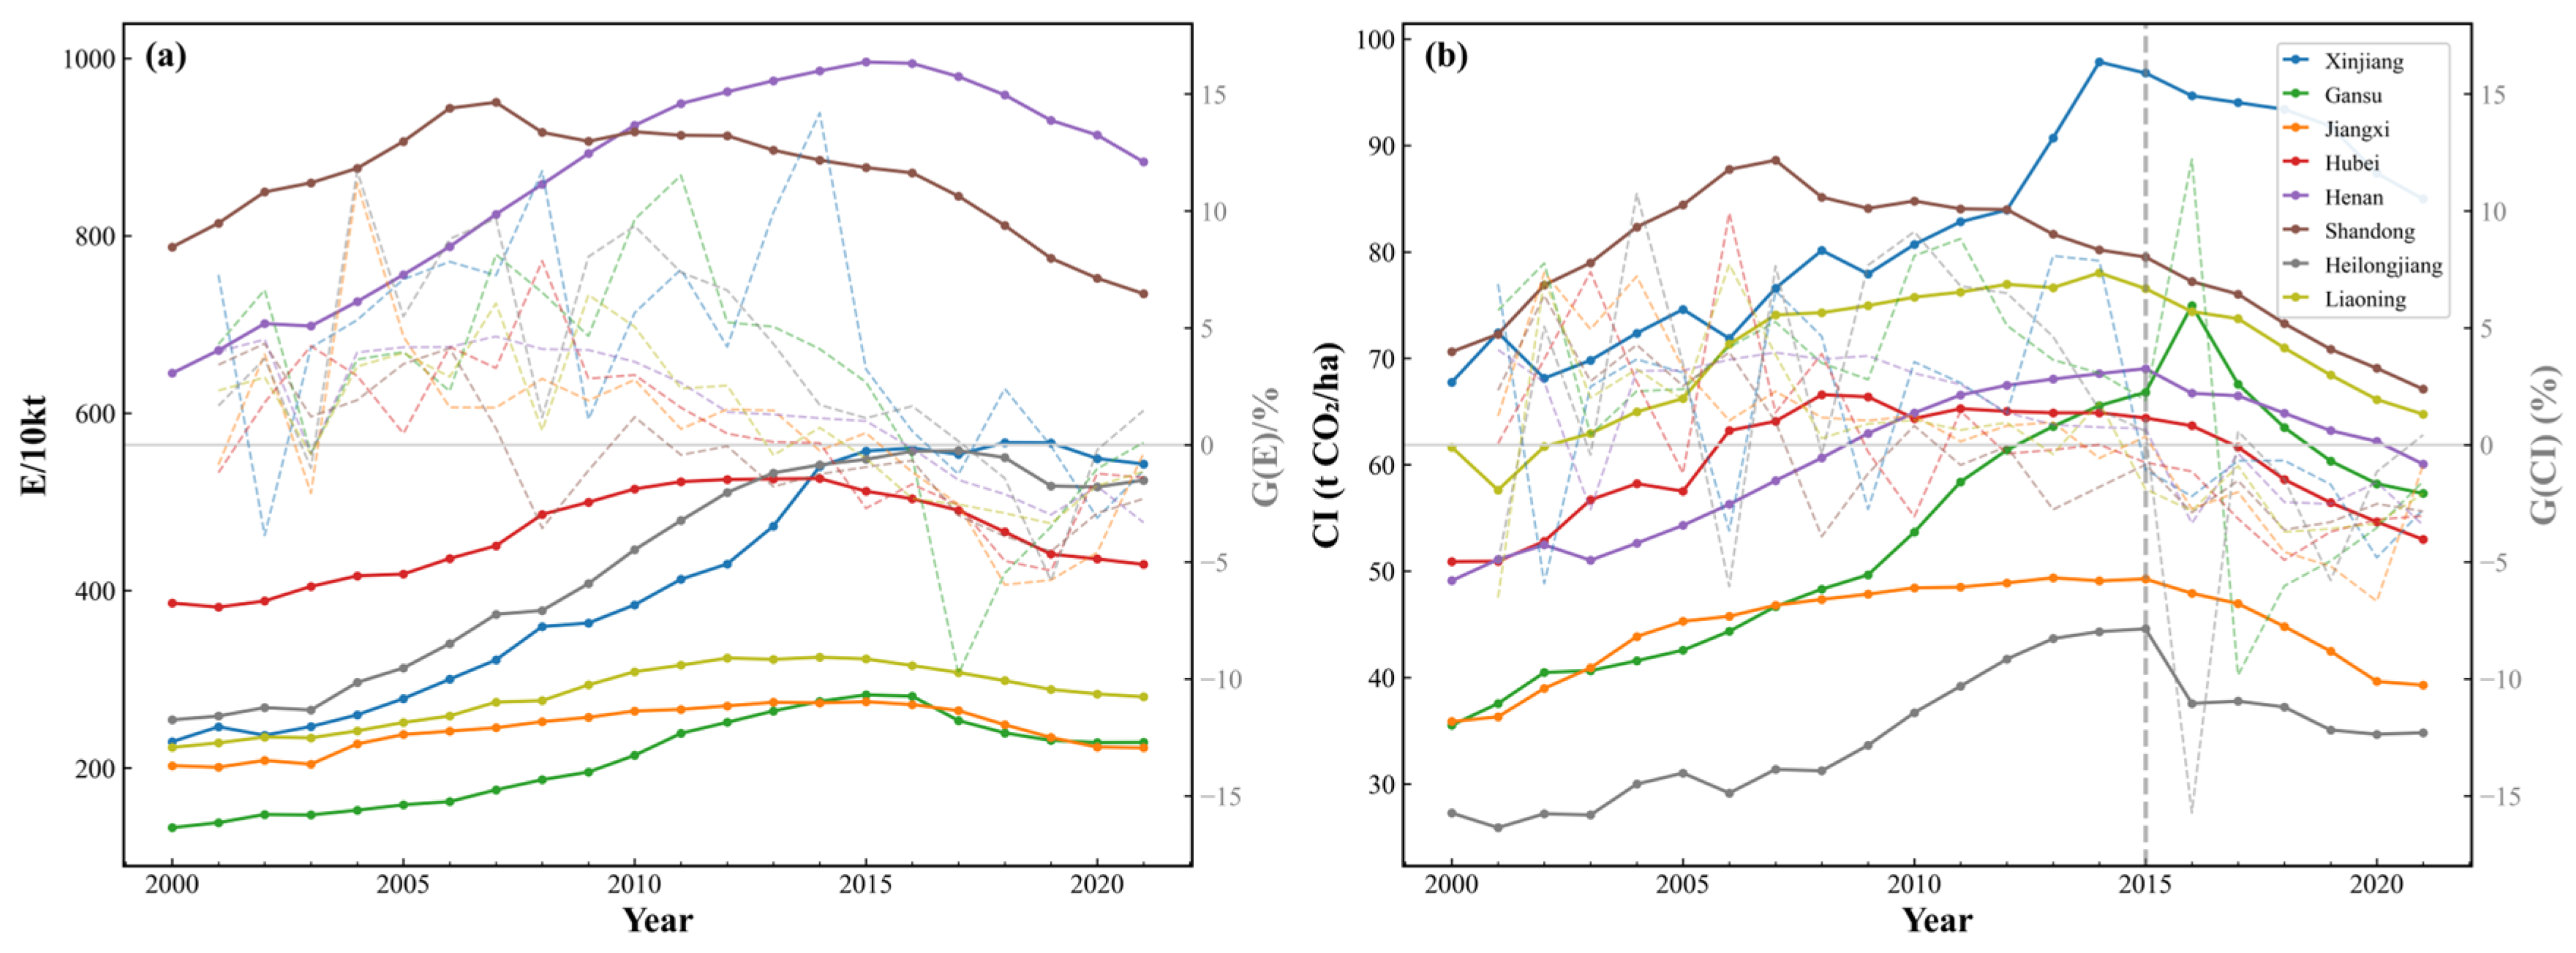
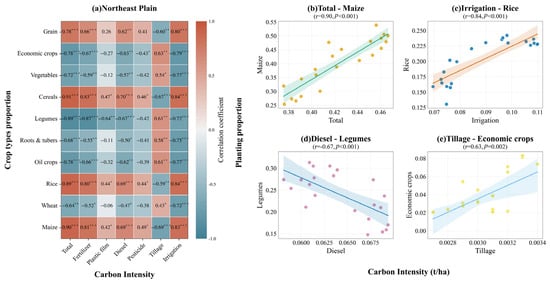
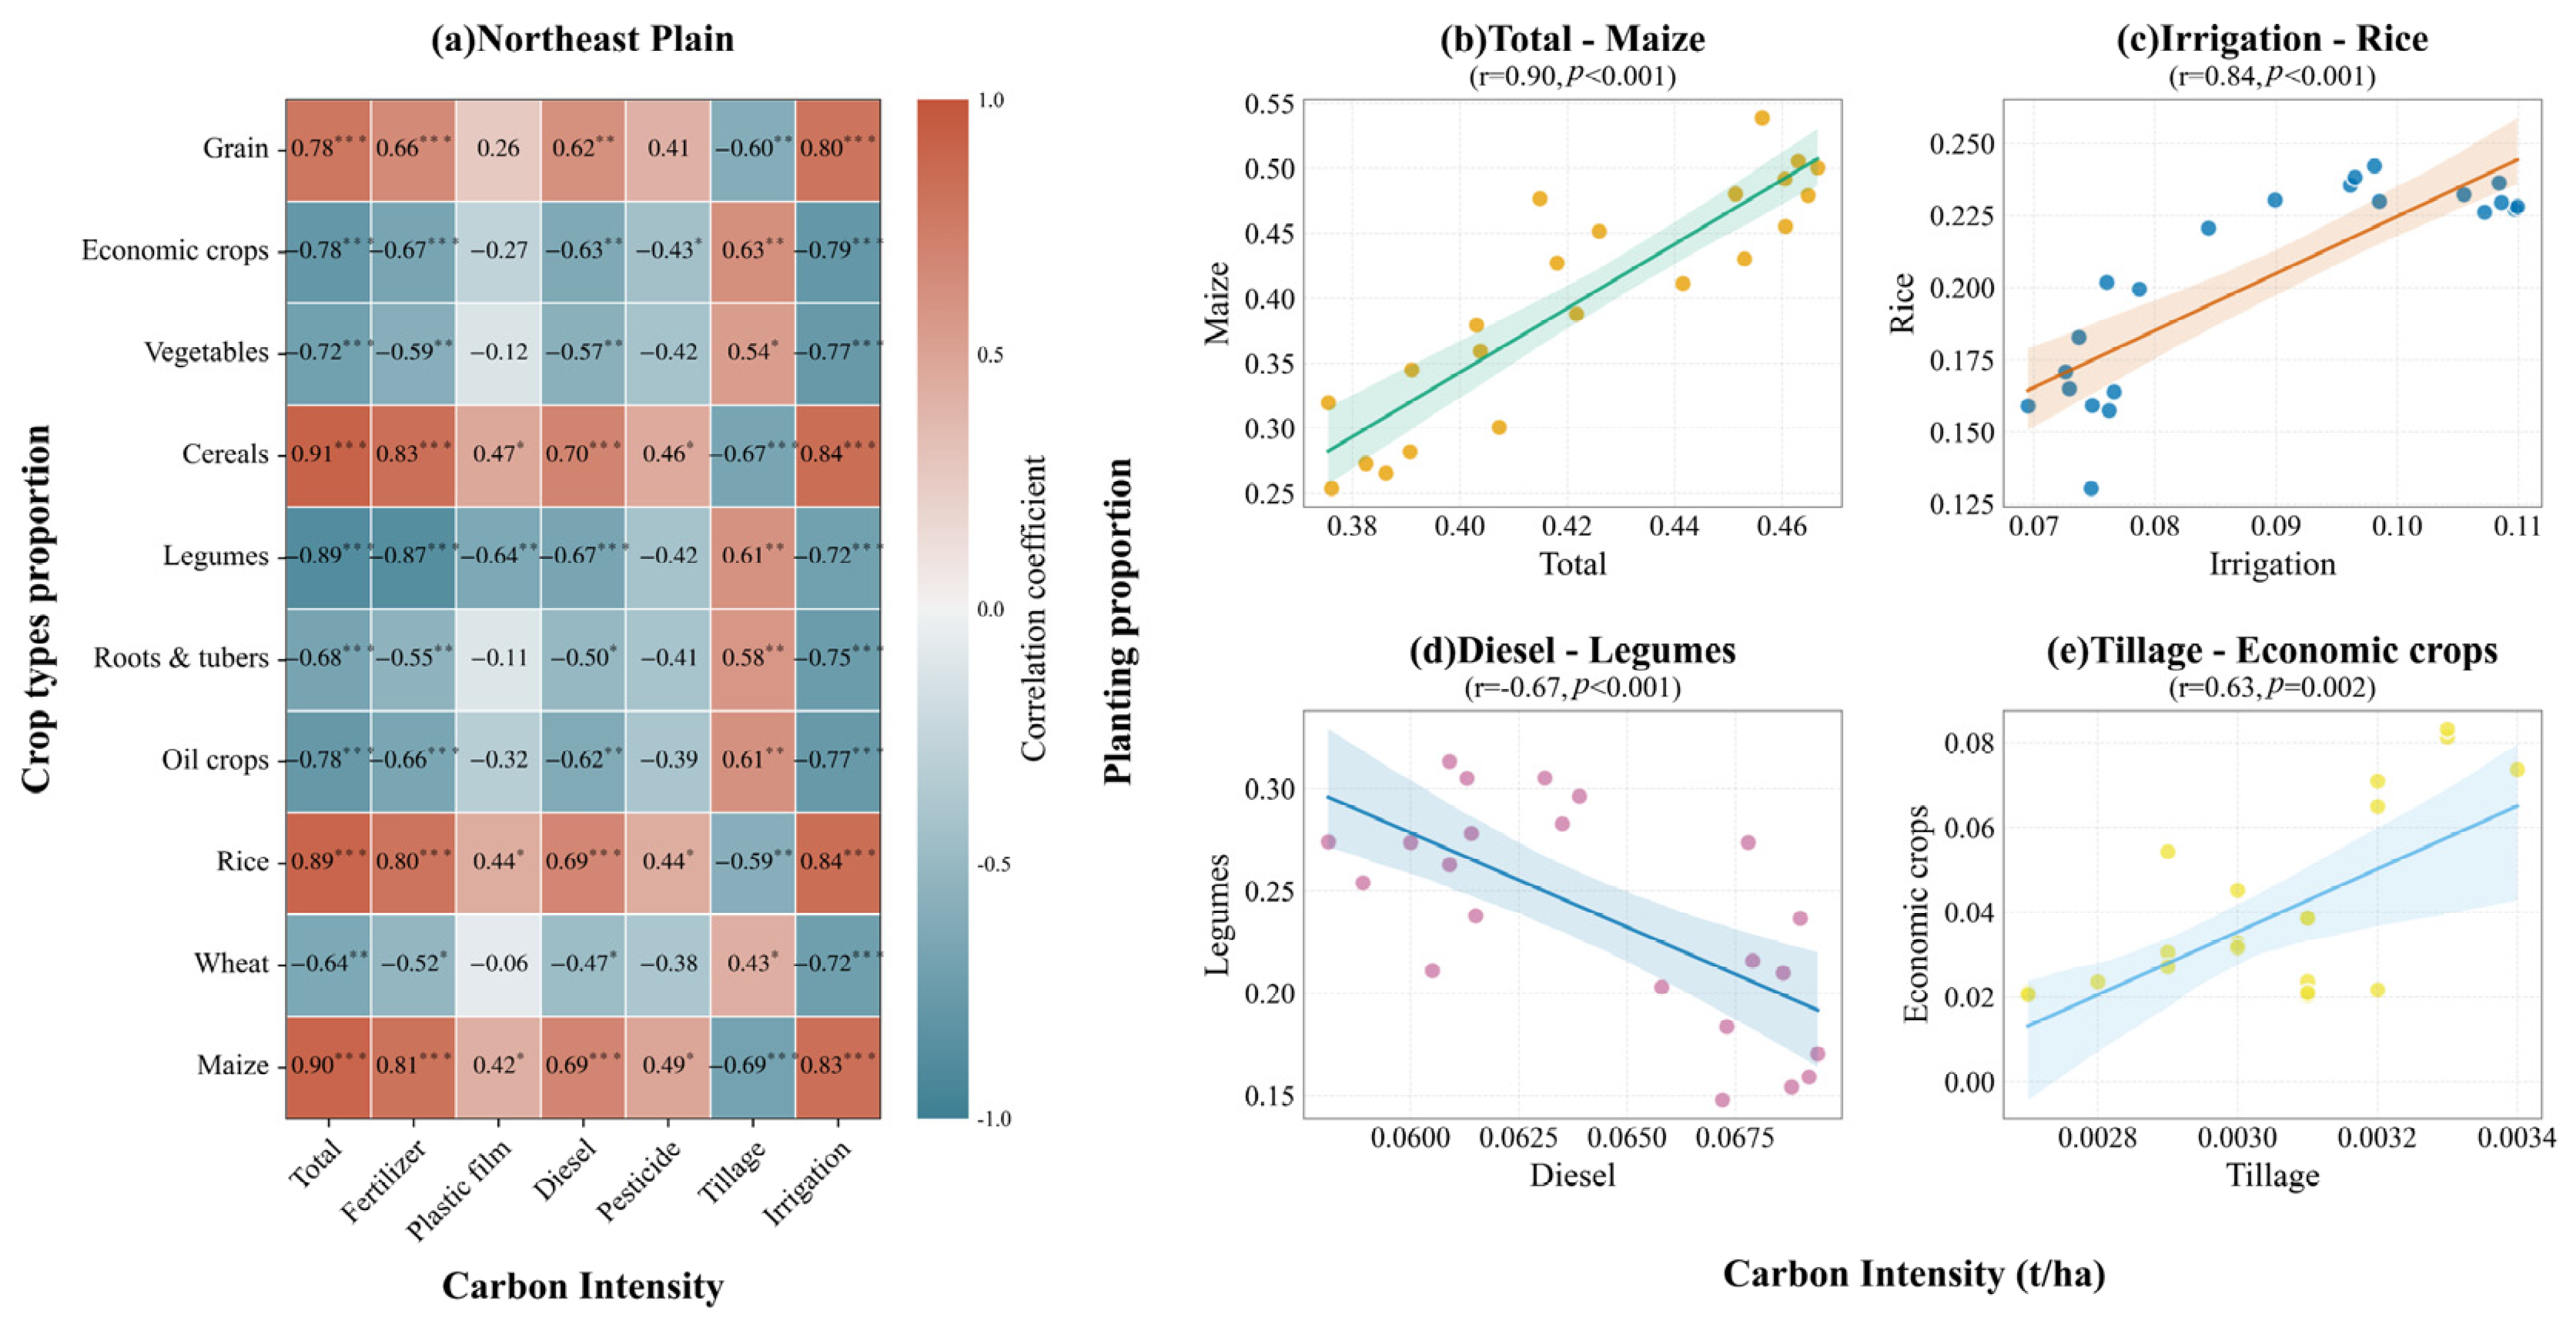
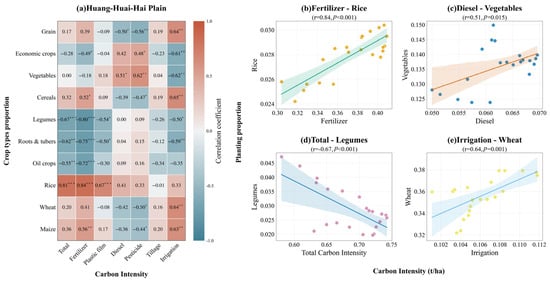
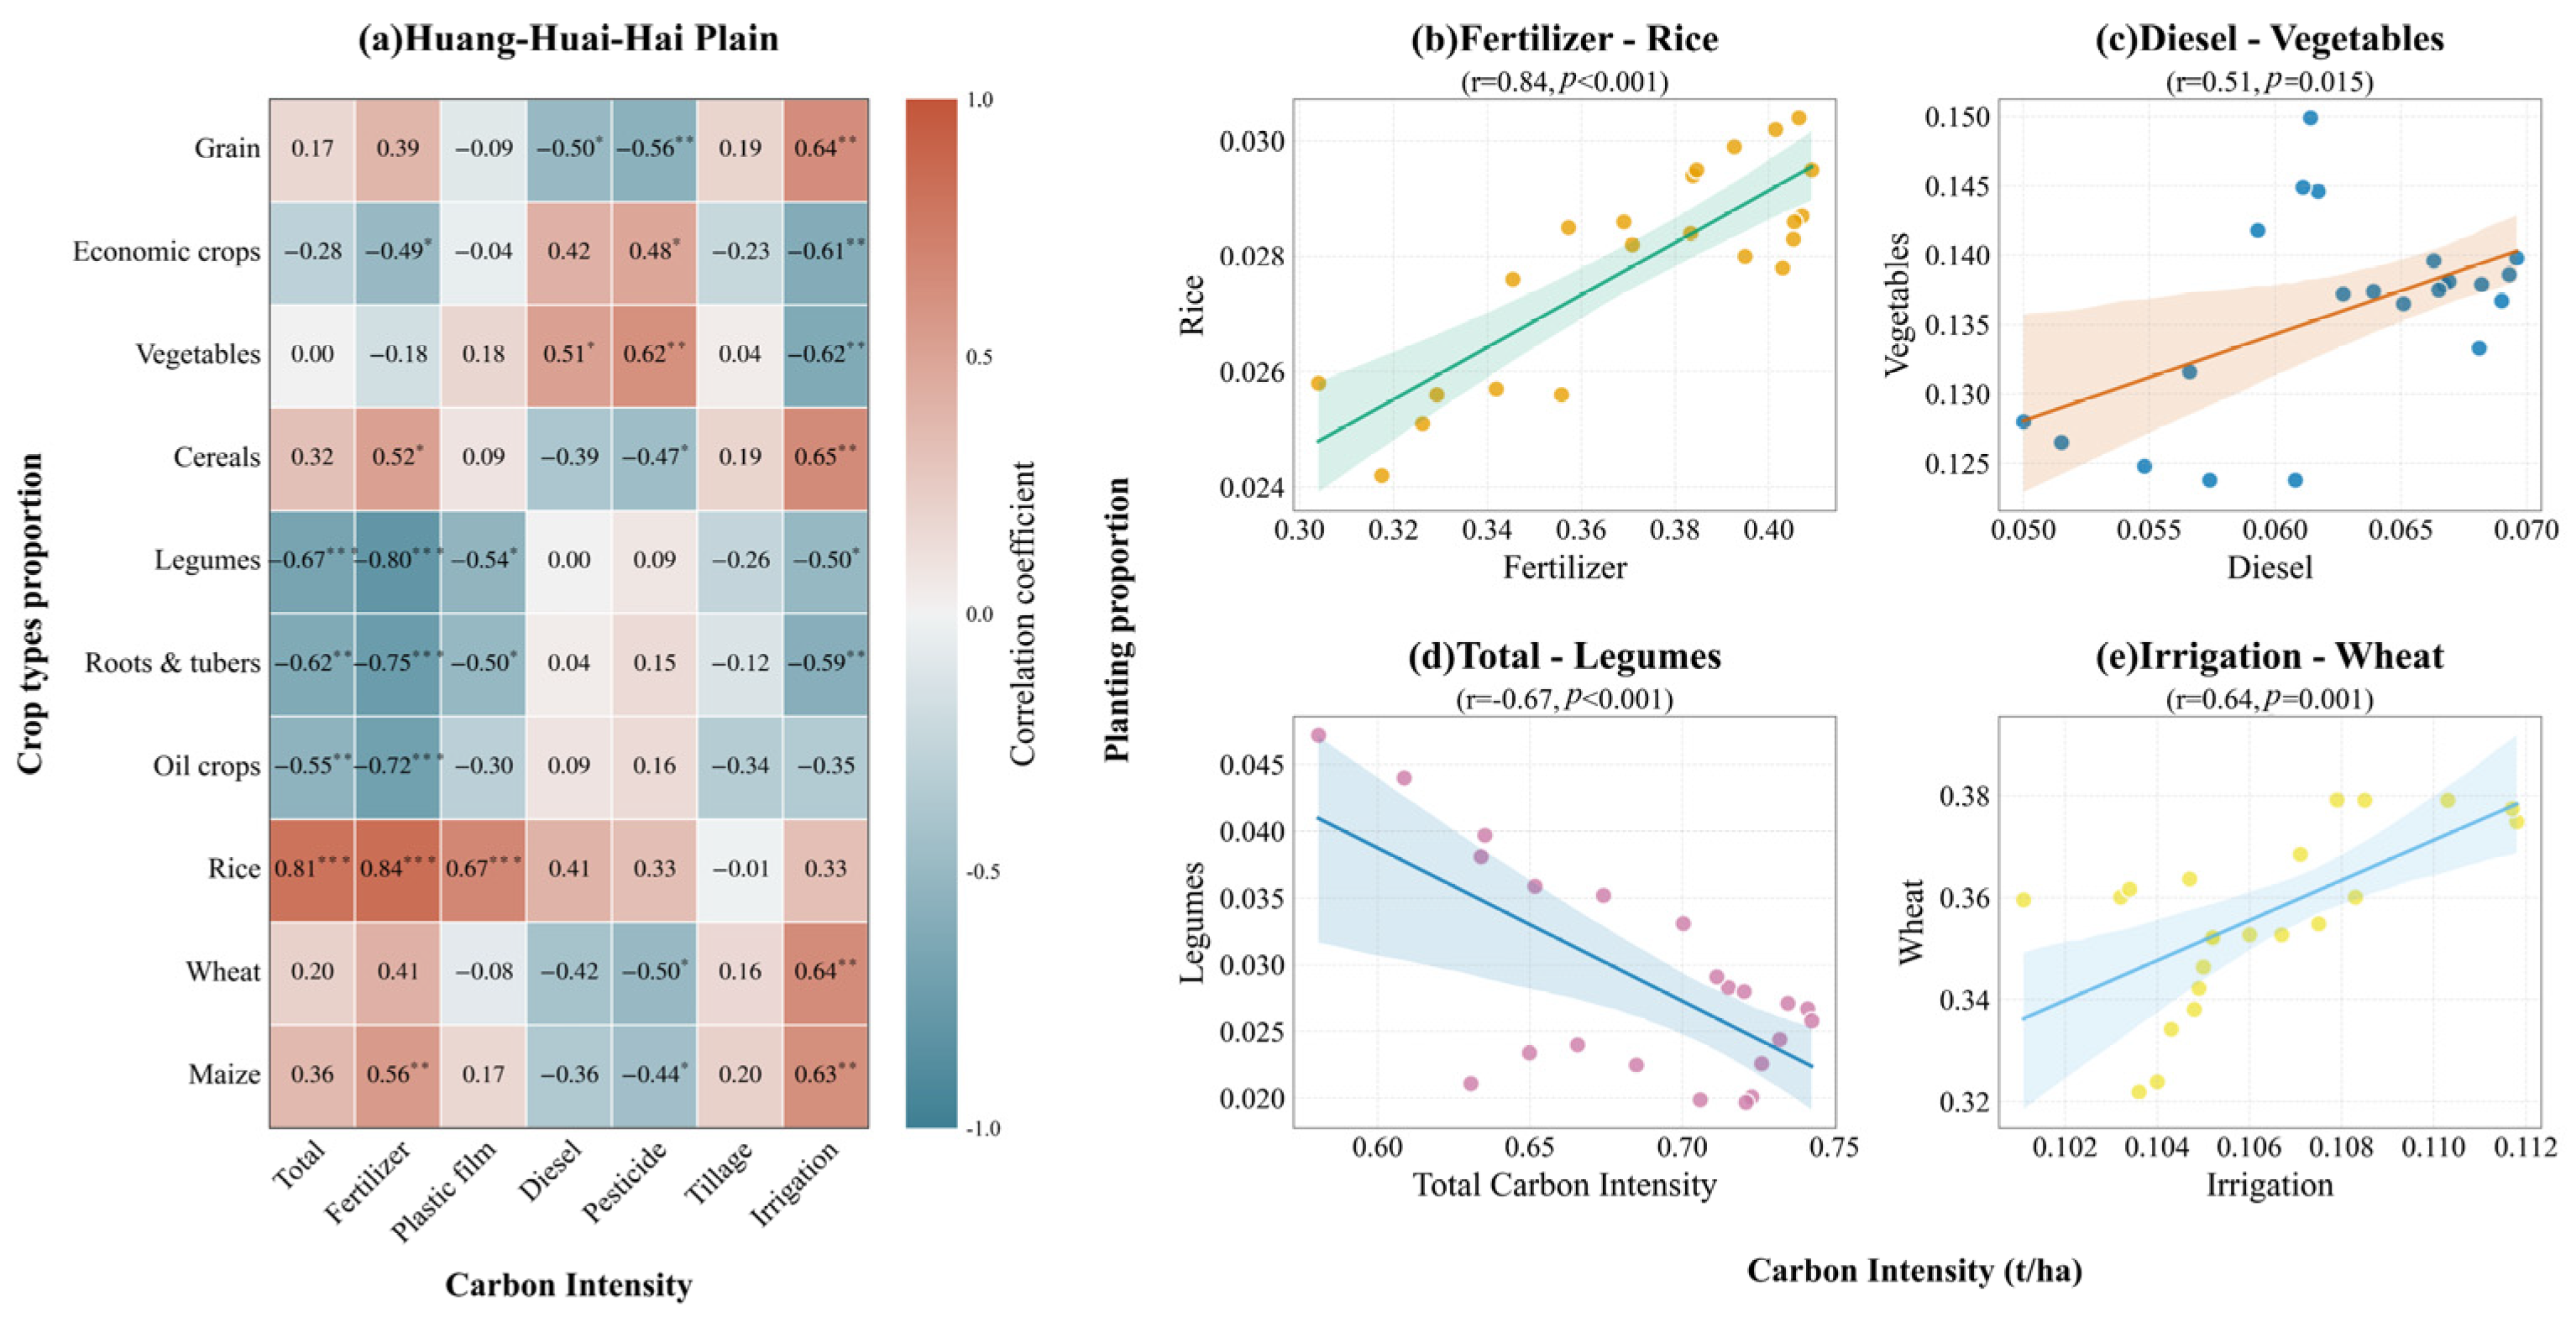
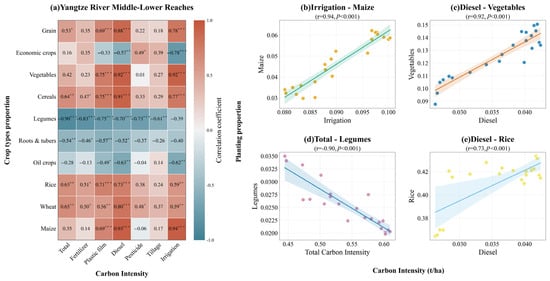
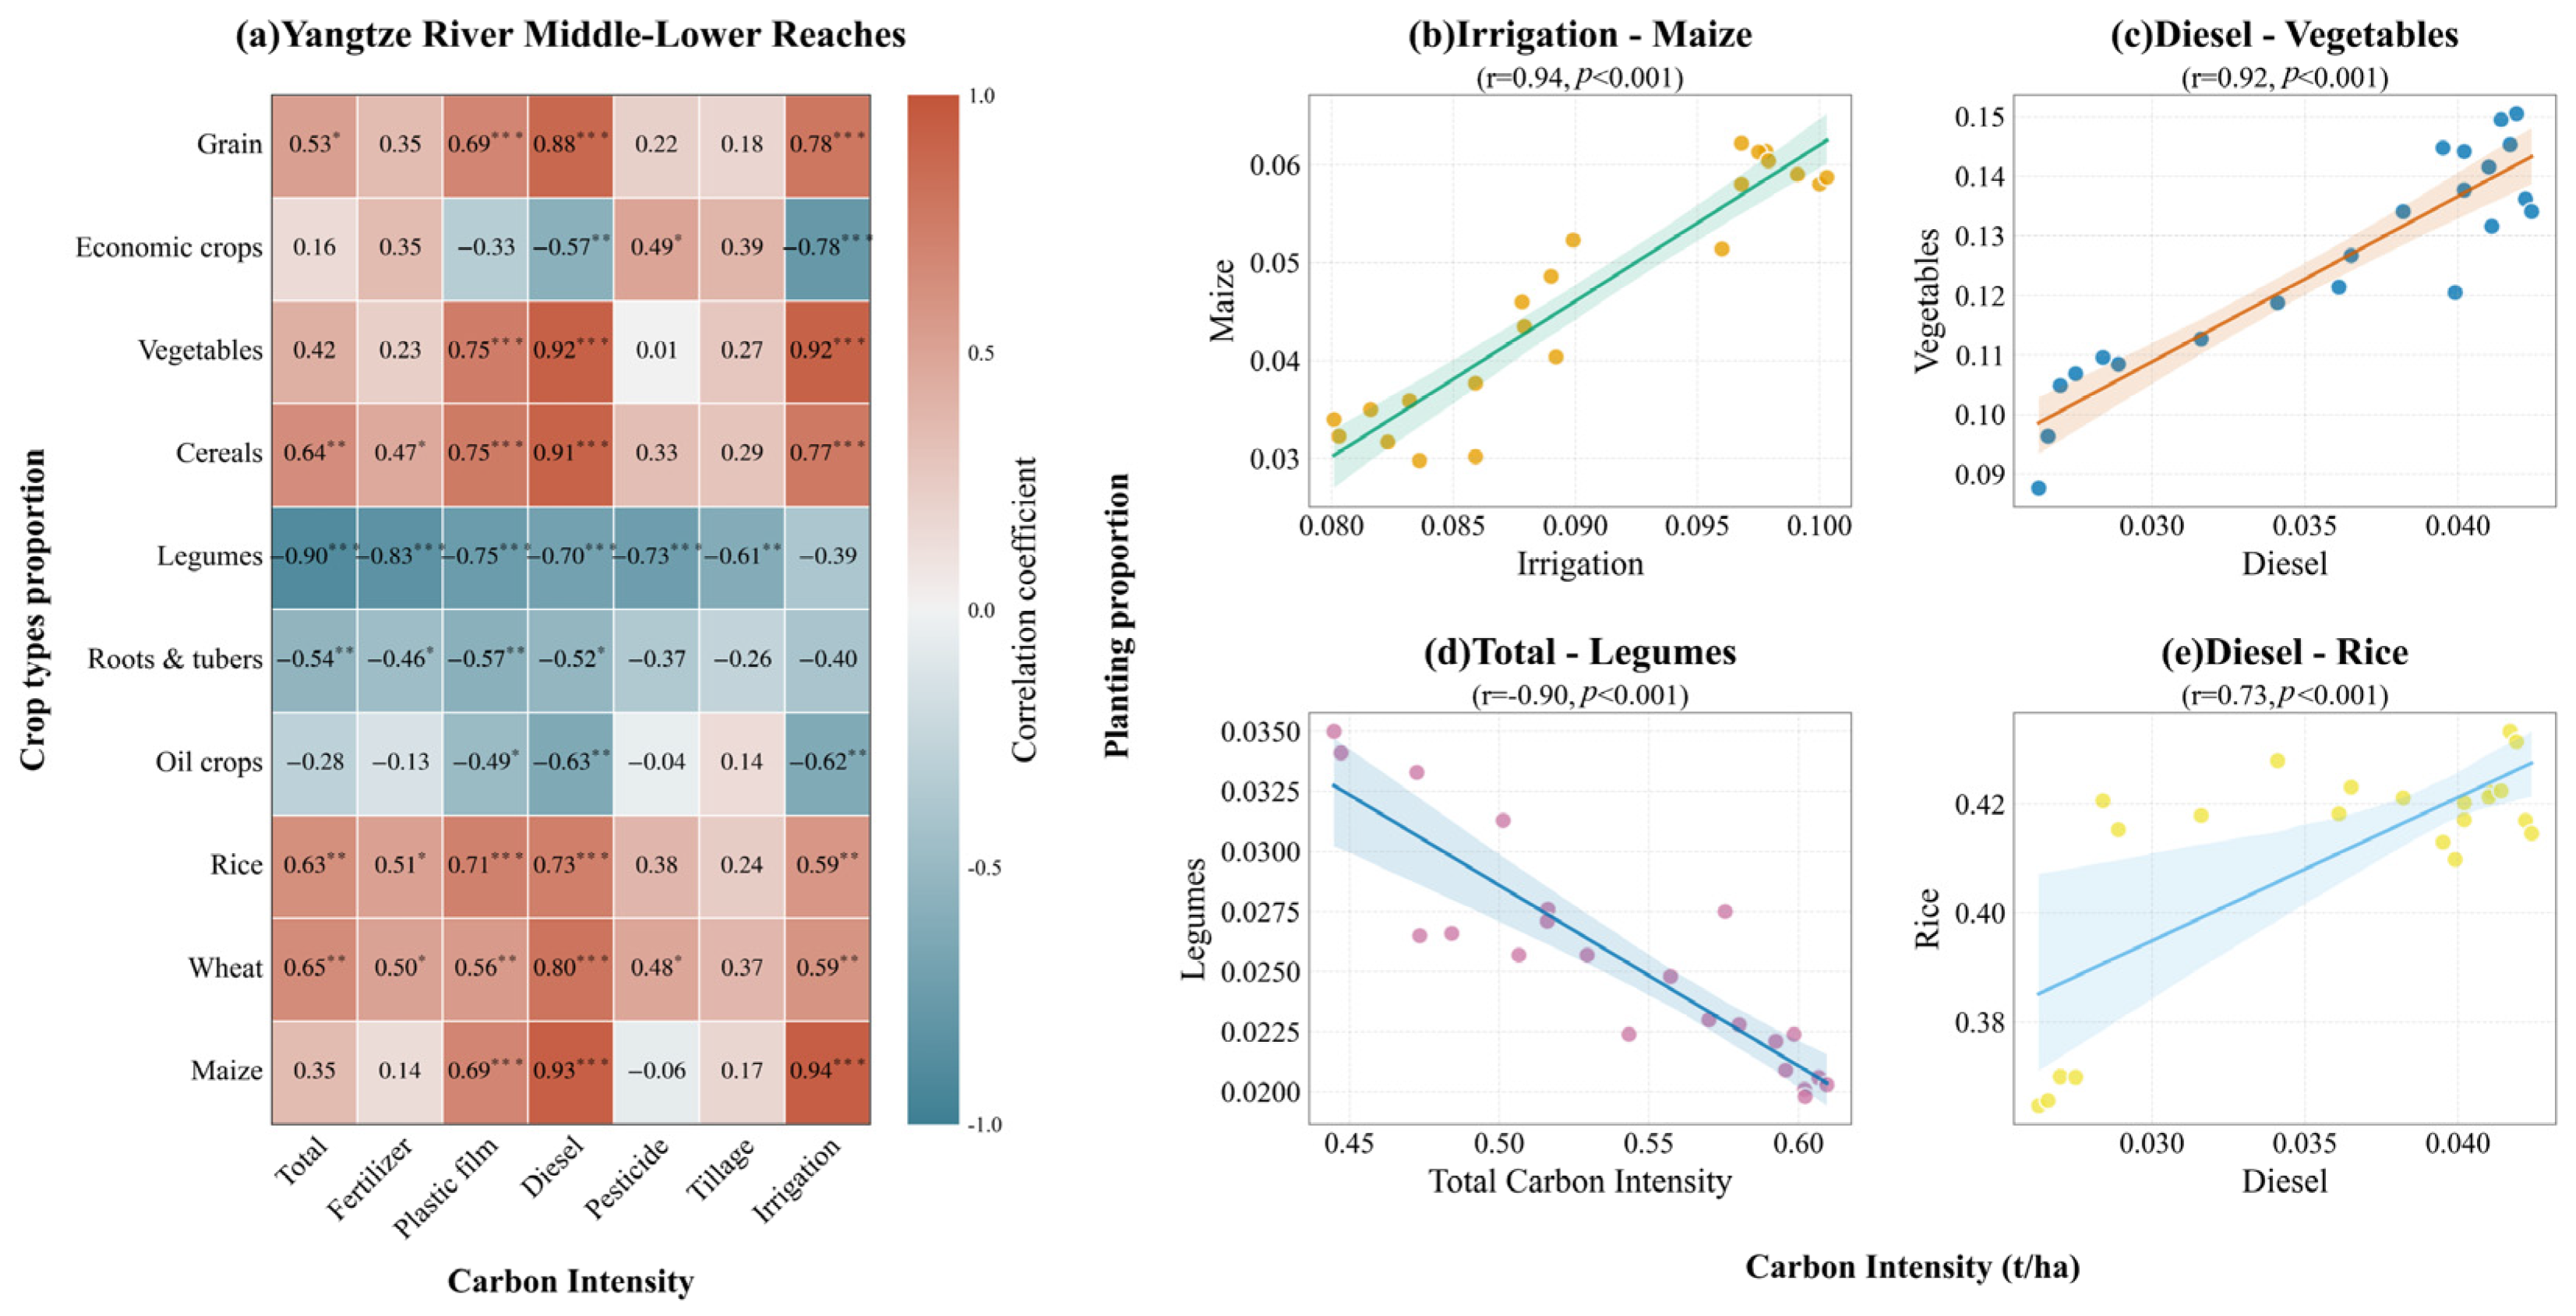
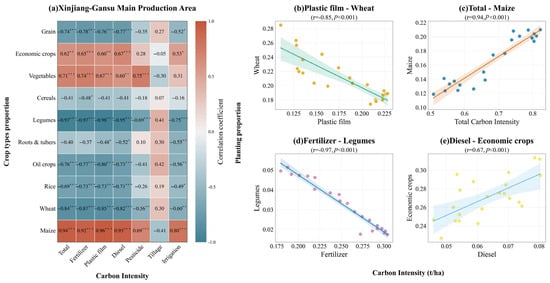
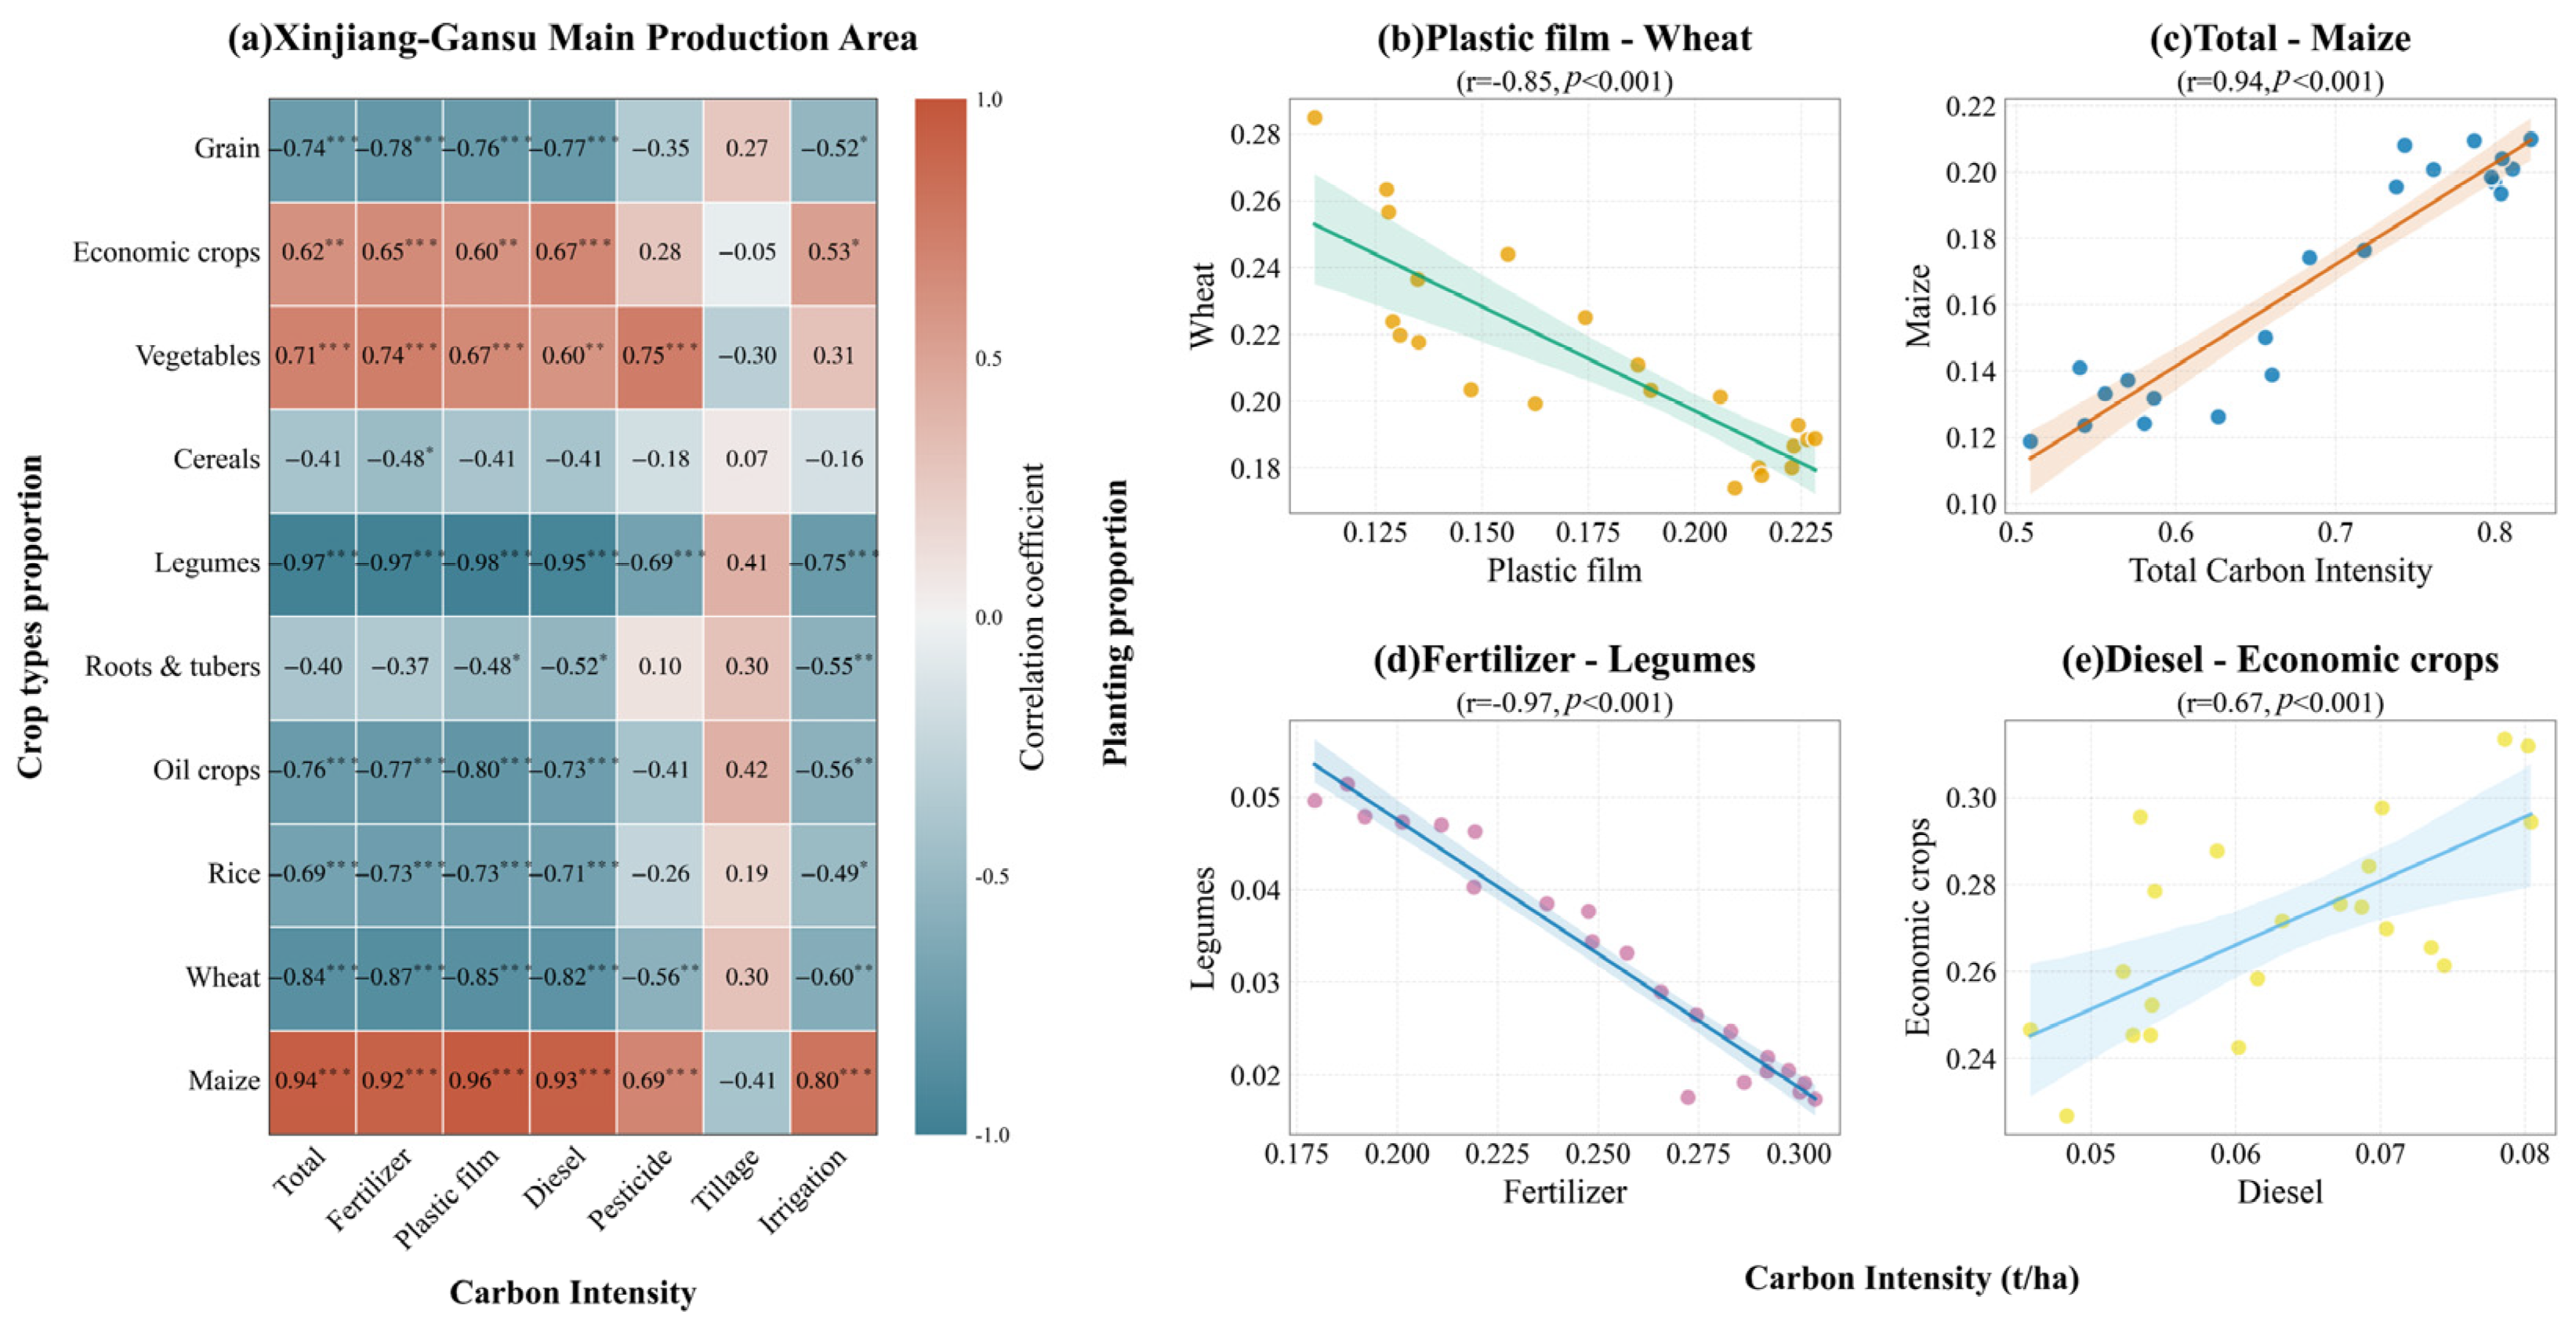
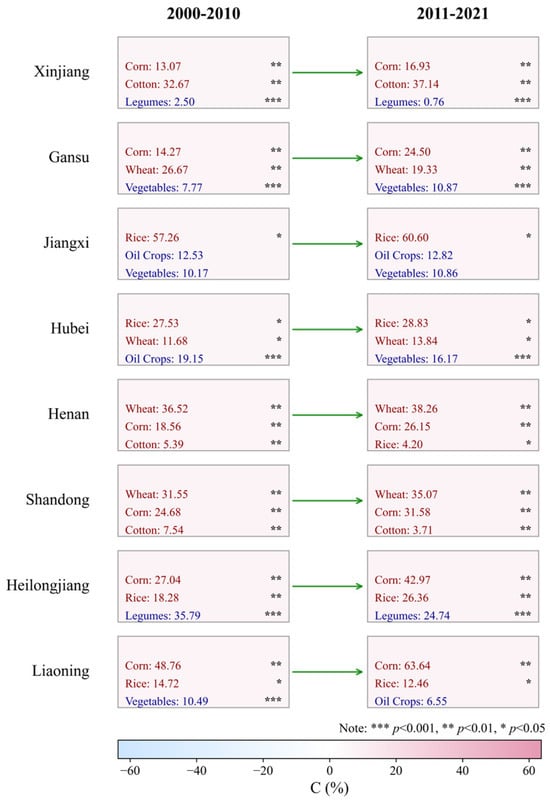
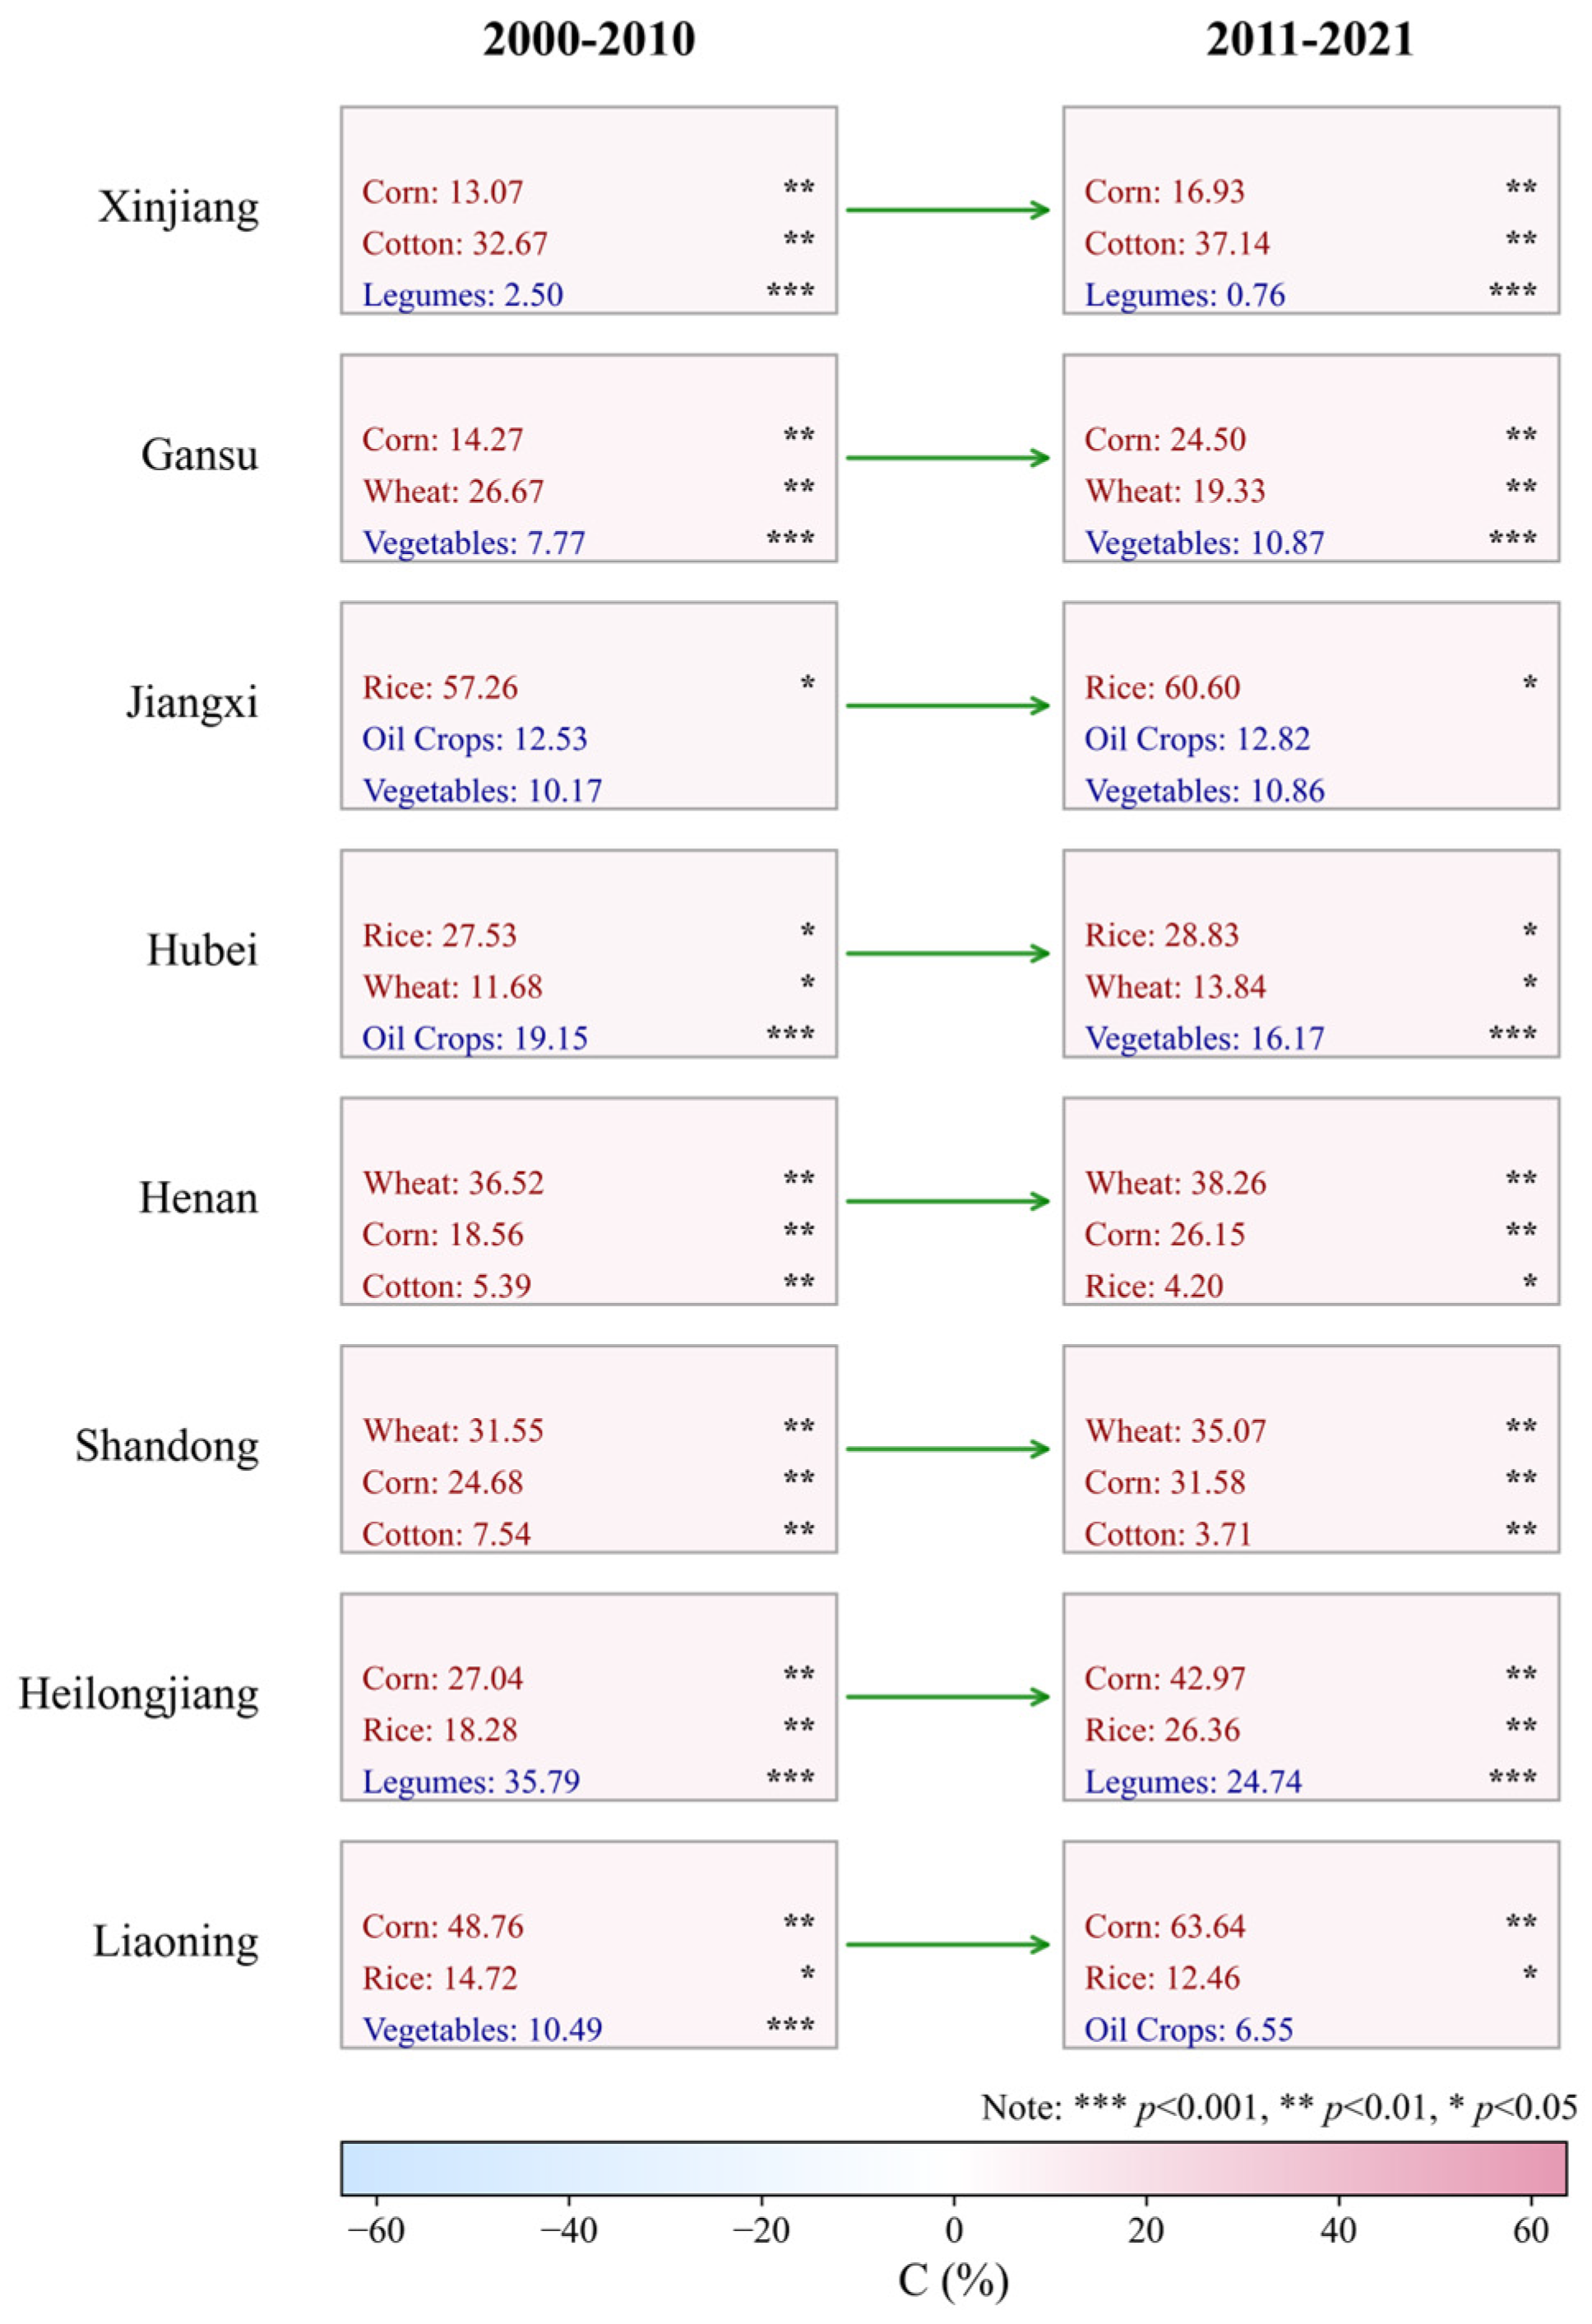
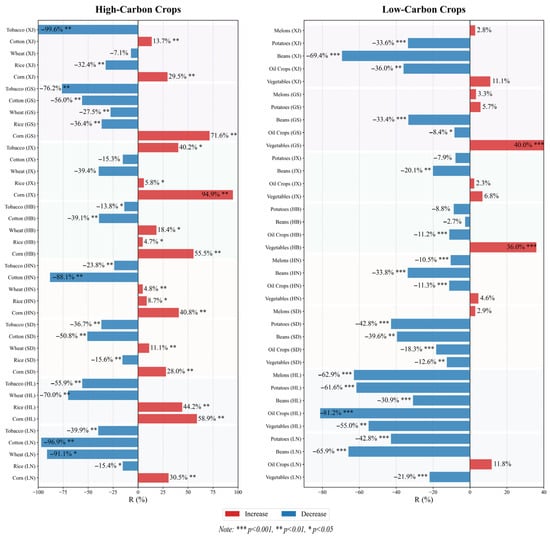
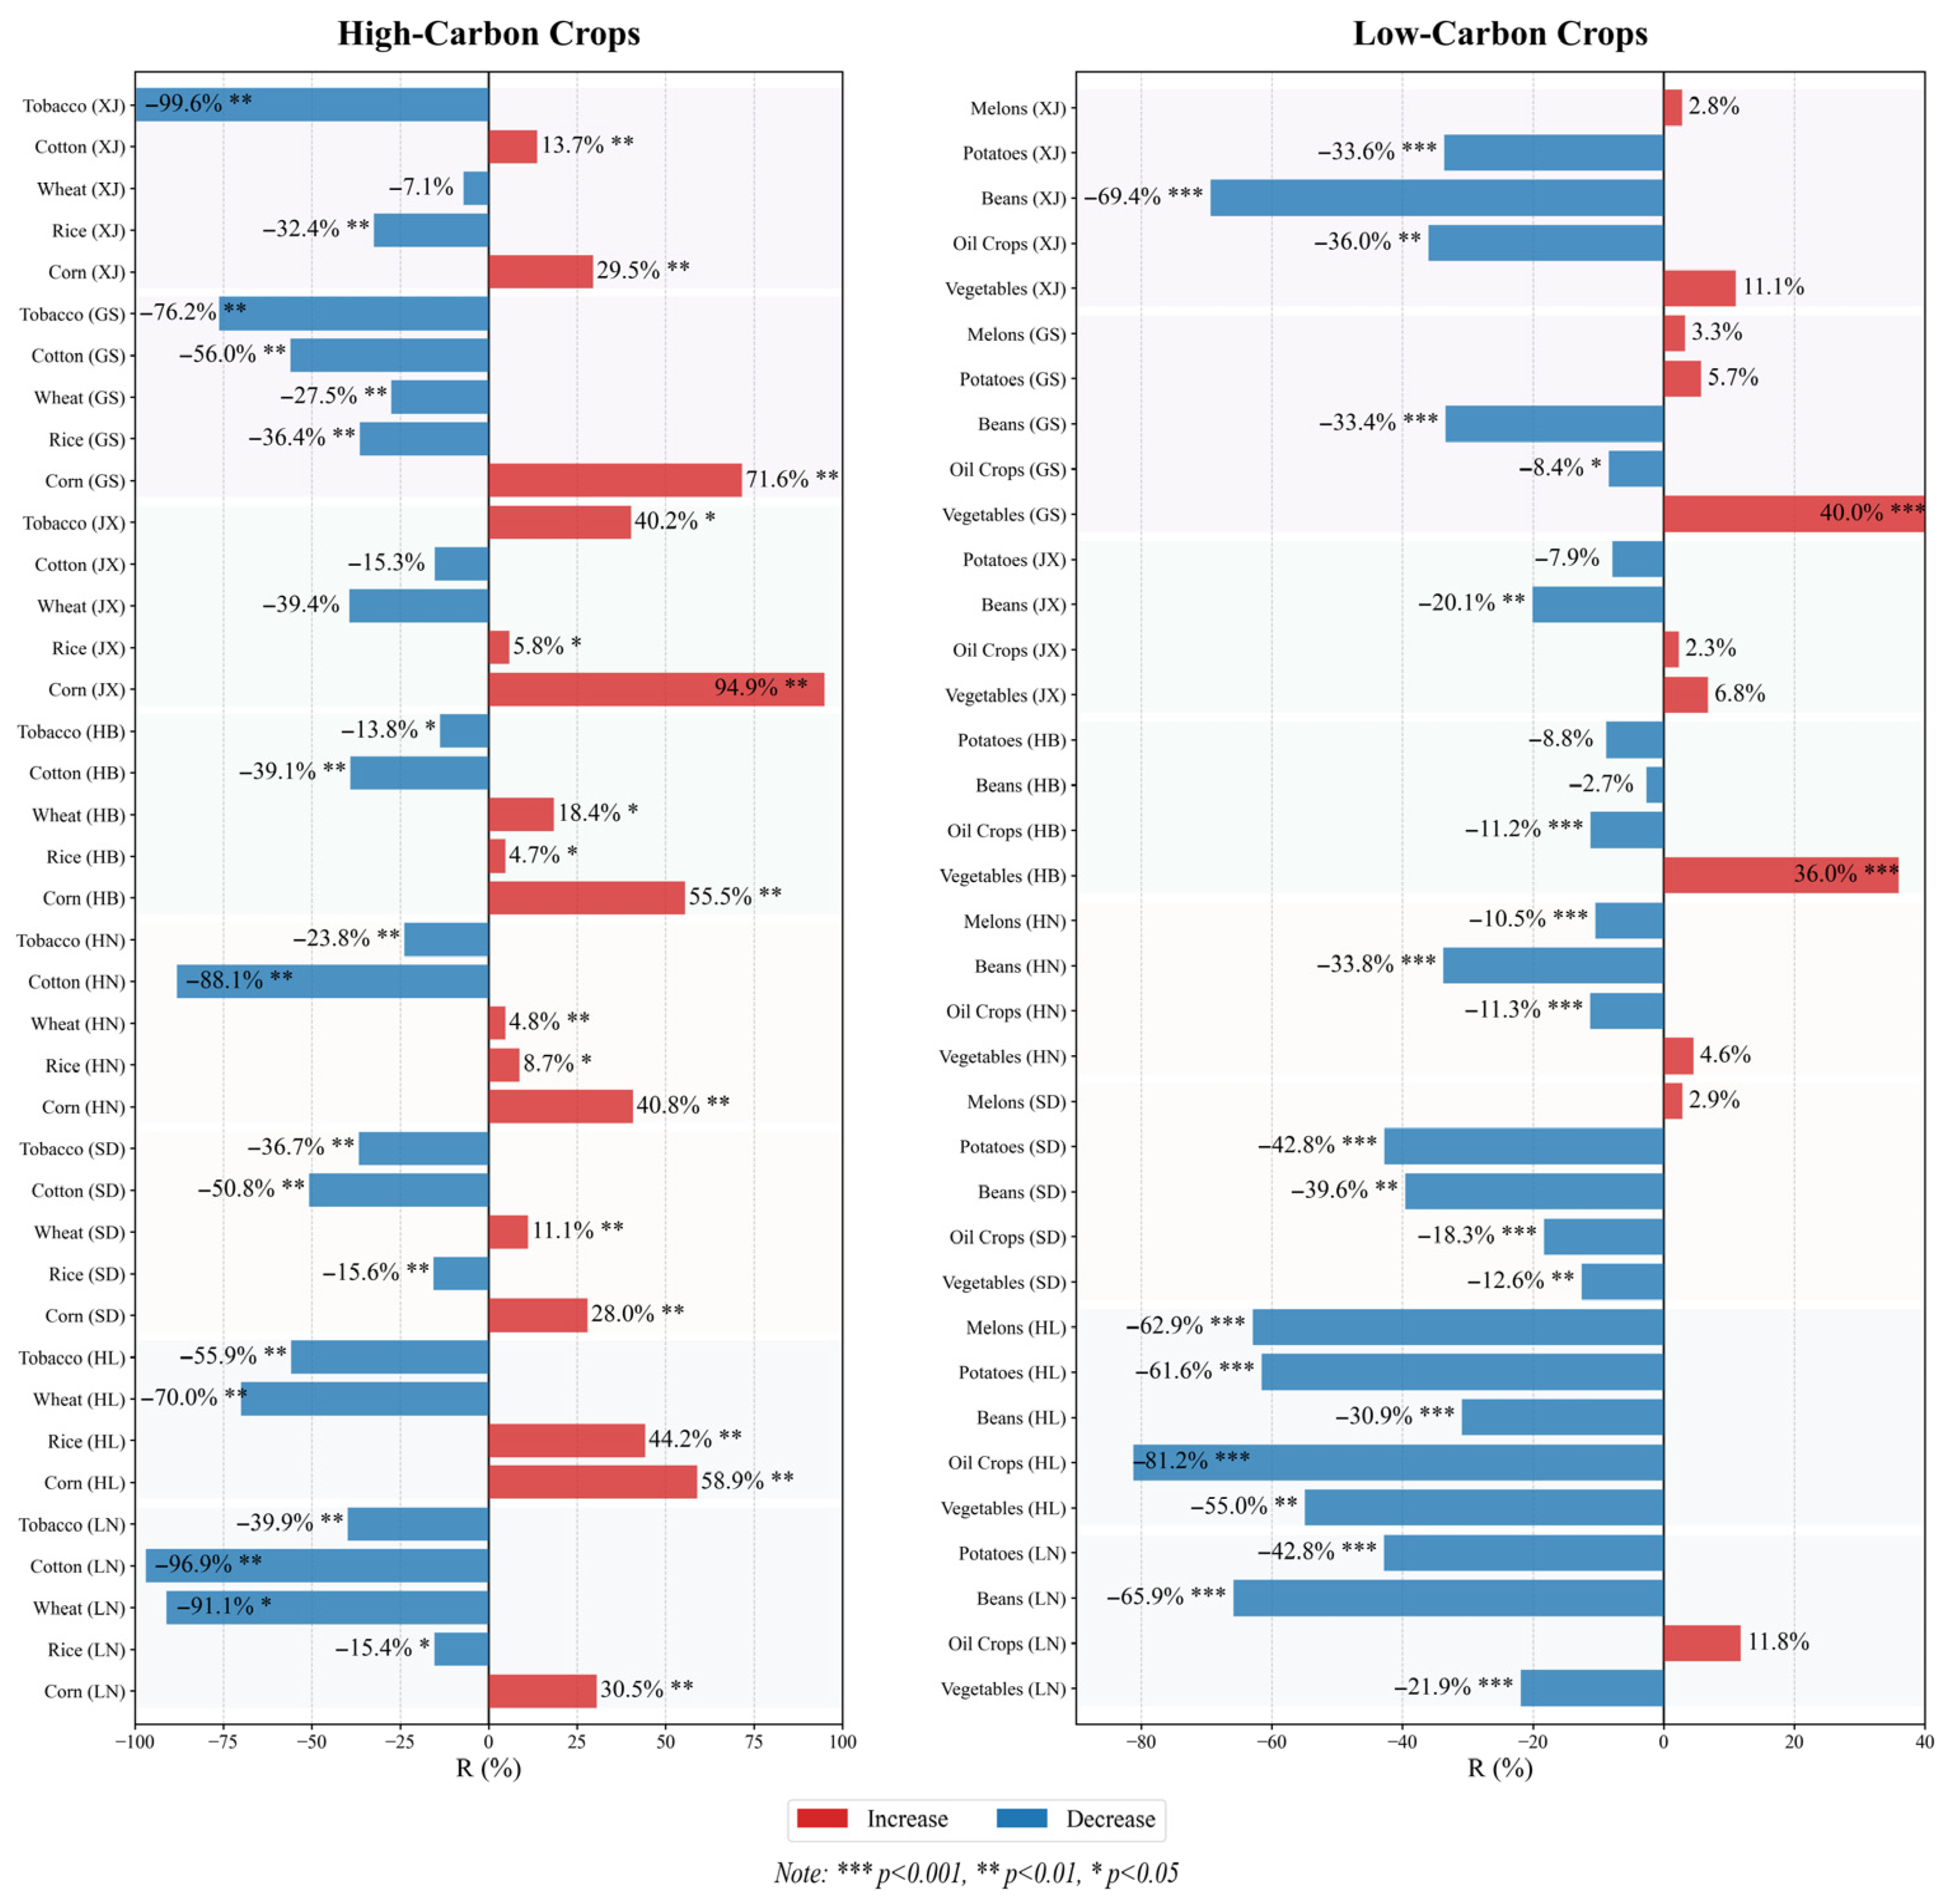
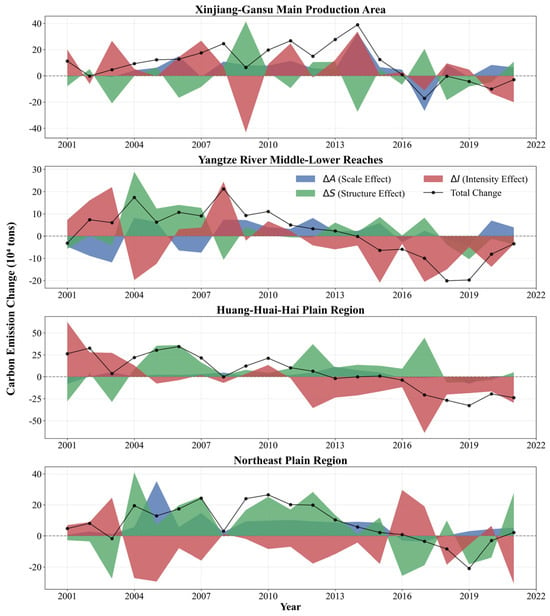
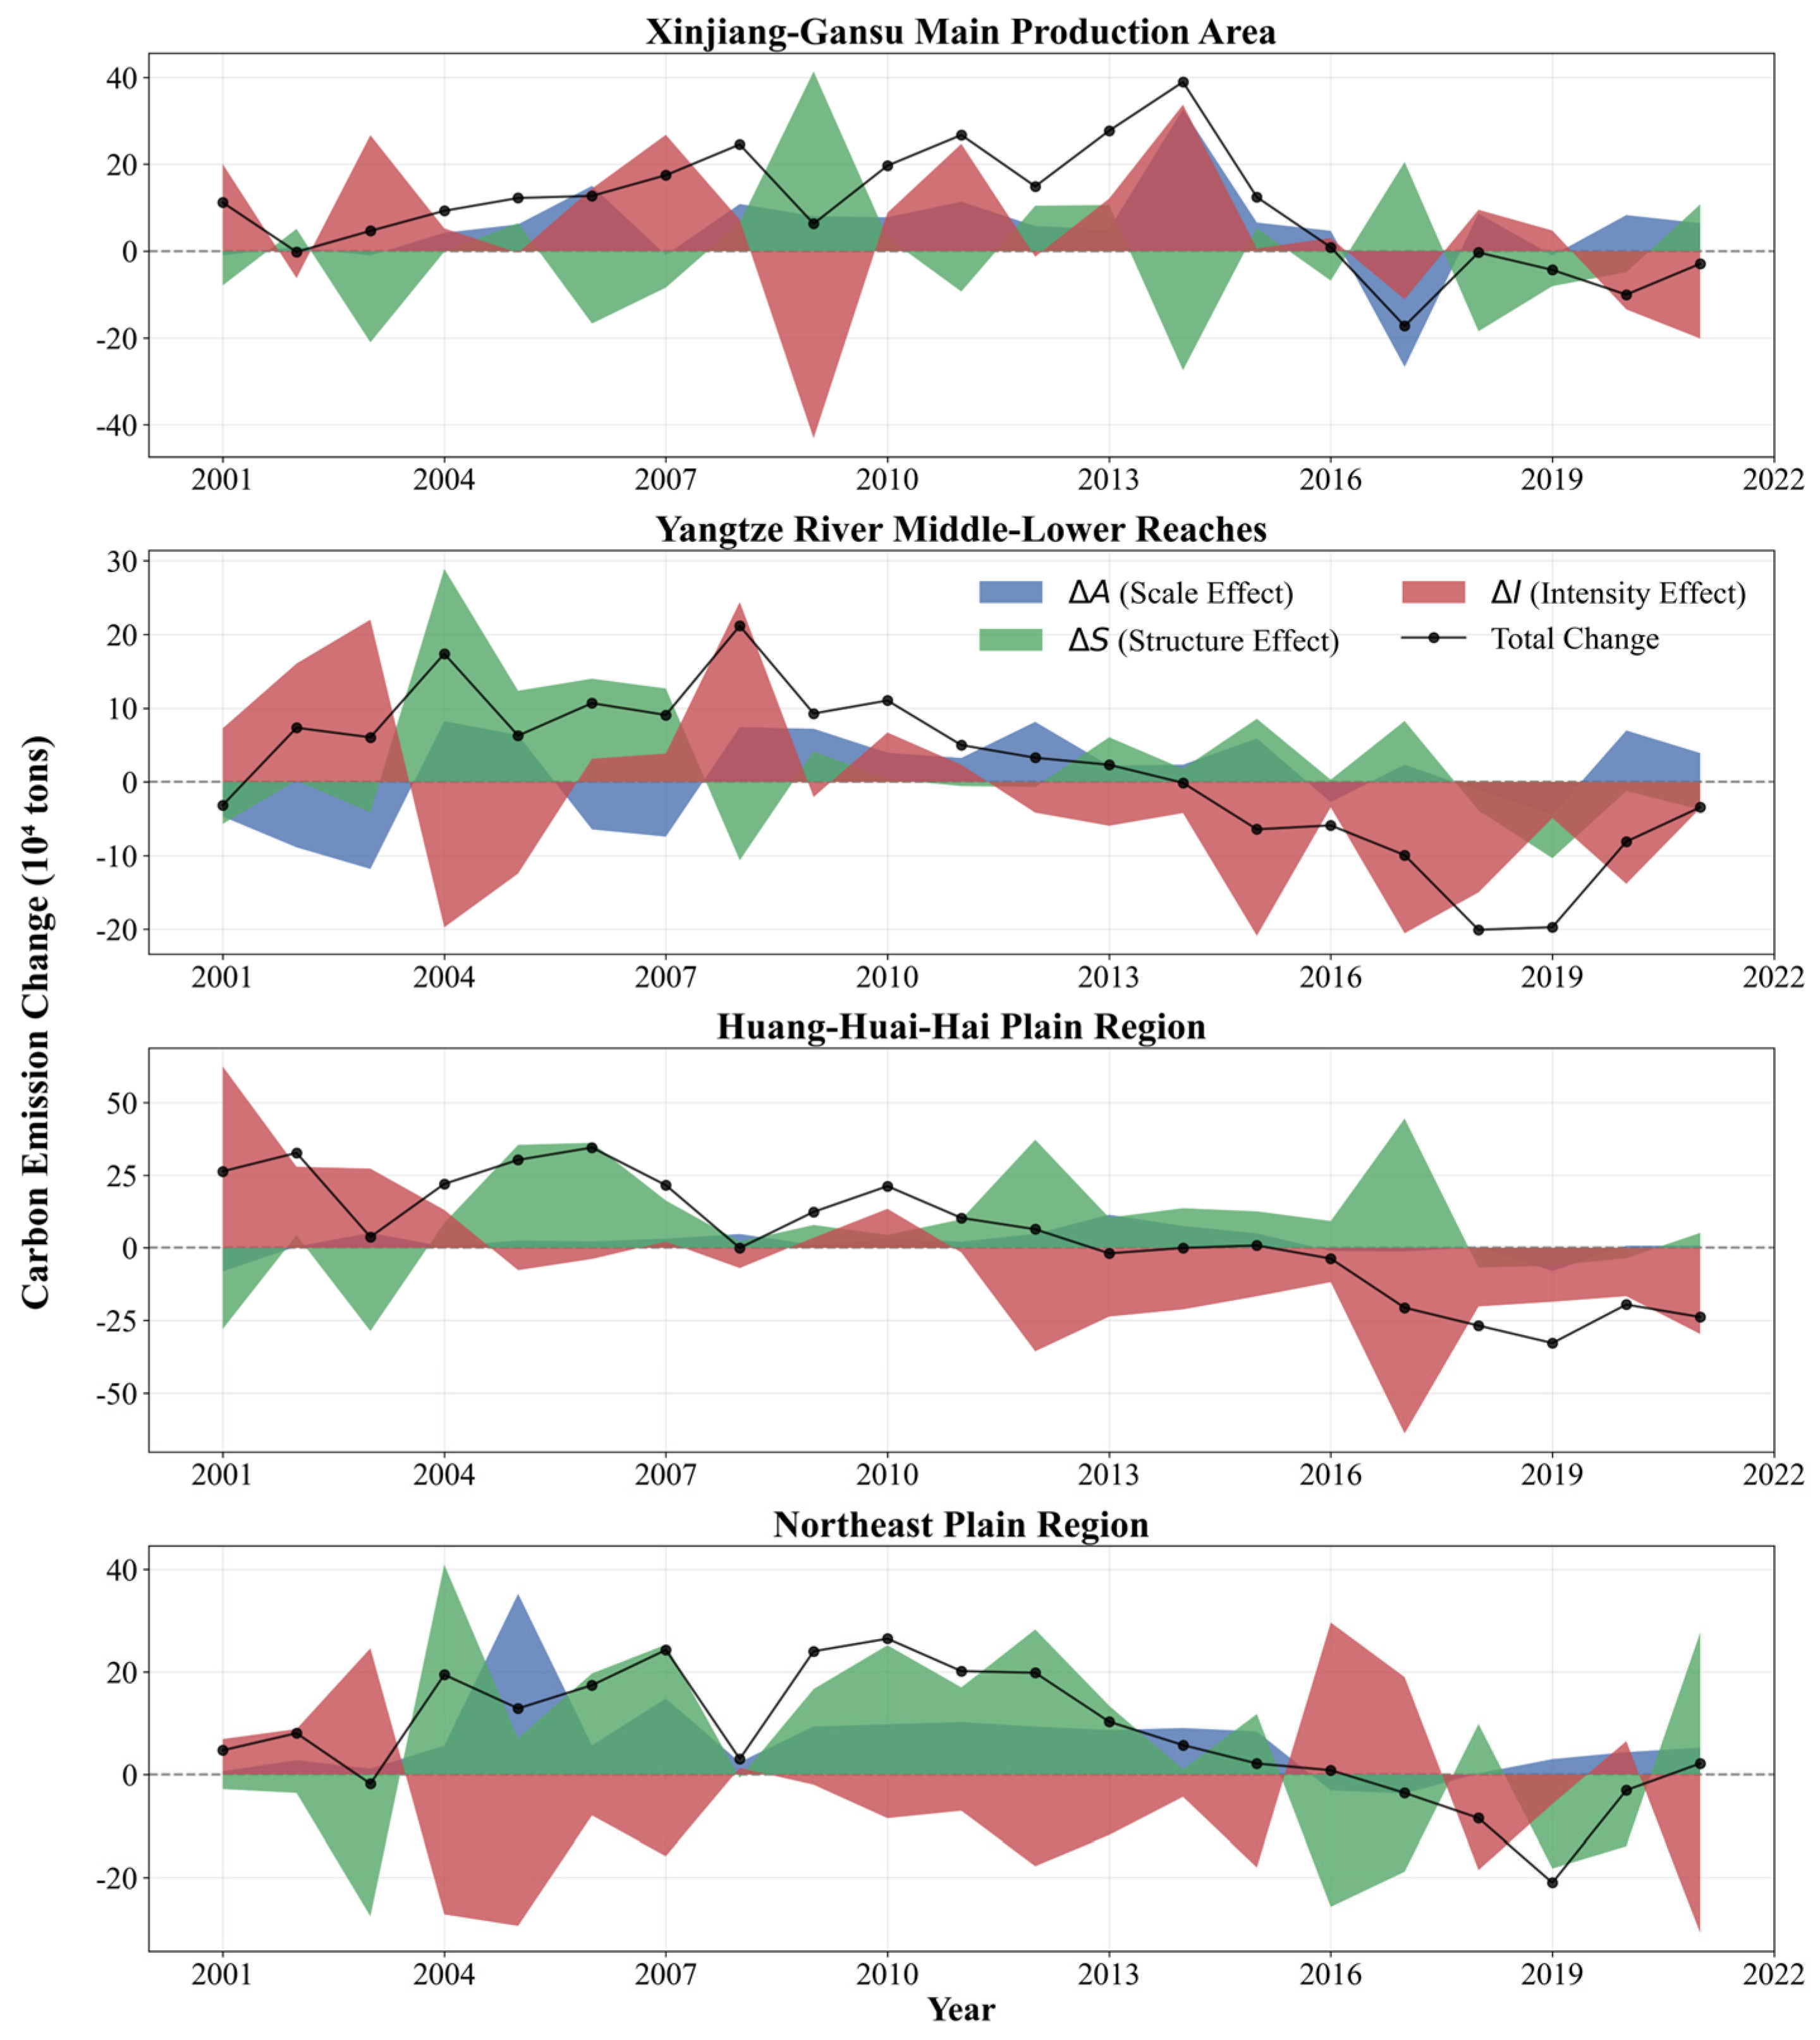
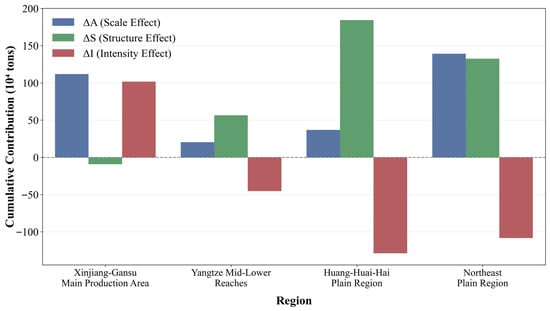
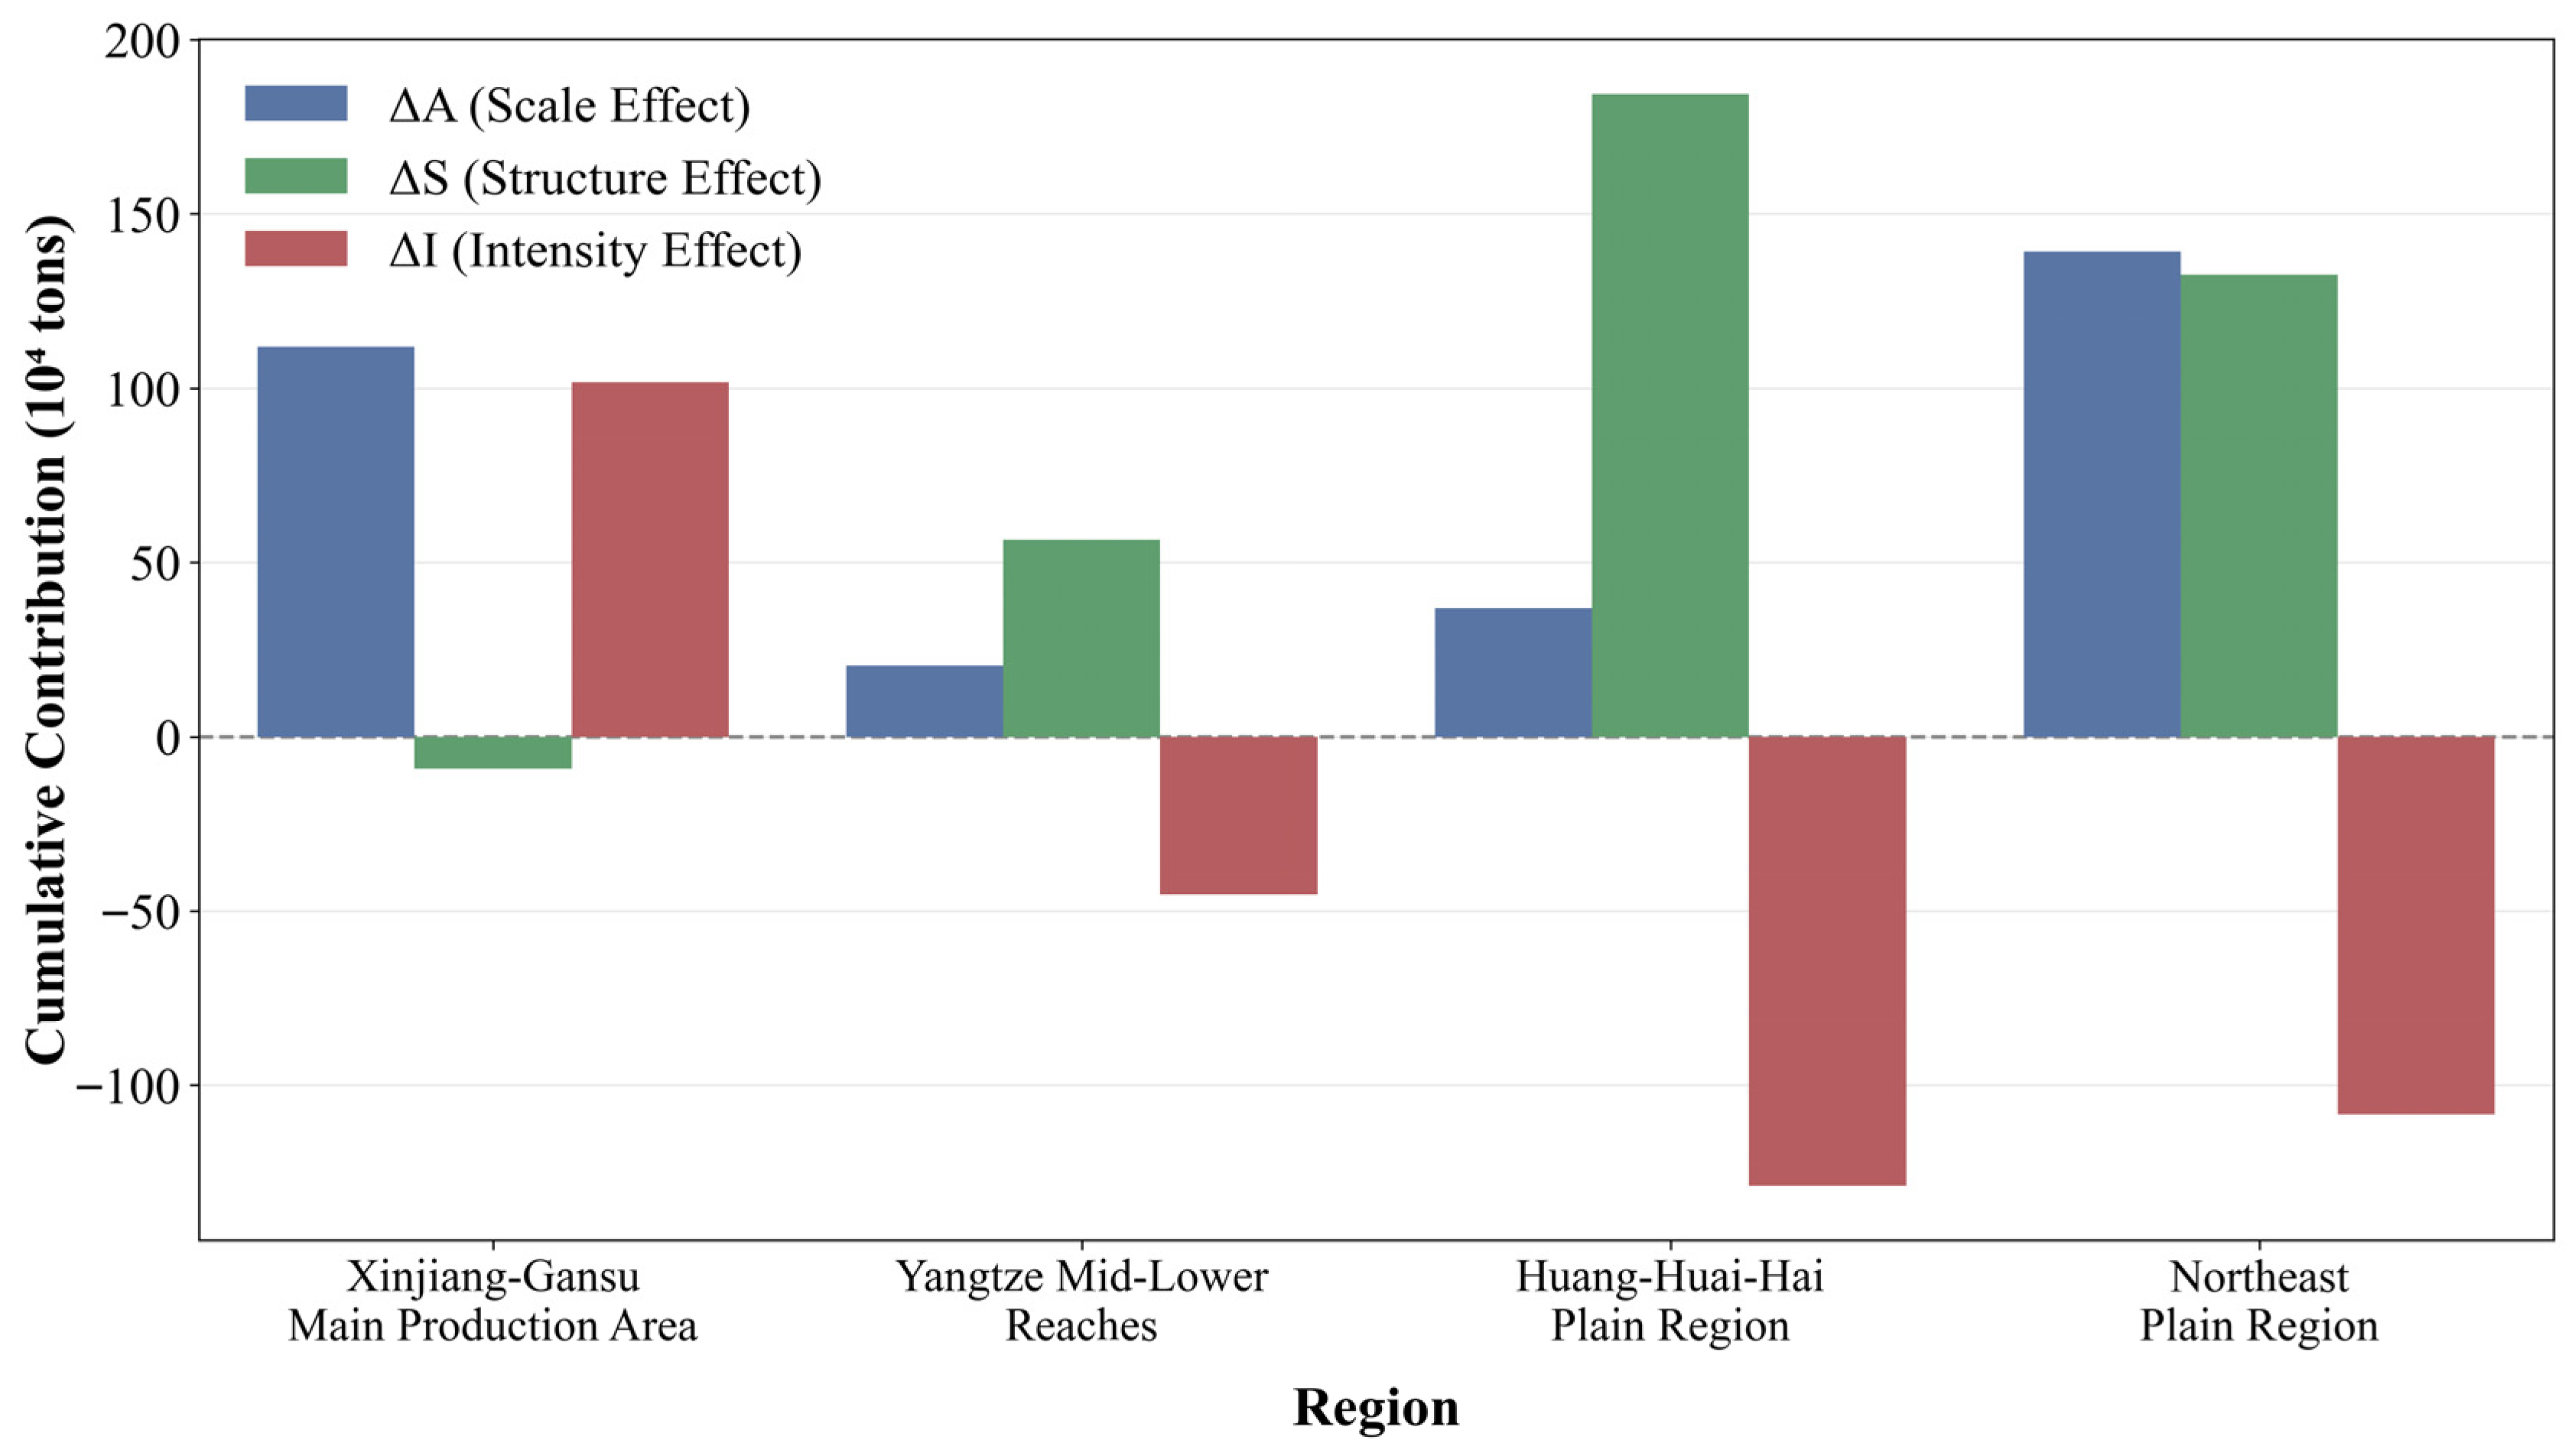

Disclaimer/Publisher’s Note: The statements, opinions and data contained in all publications are solely those of the individual author(s) and contributor(s) and not of MDPI and/or the editor(s). MDPI and/or the editor(s) disclaim responsibility for any injury to people or property resulting from any ideas, methods, instructions or products referred to in the content. |
© 2026 by the authors. Licensee MDPI, Basel, Switzerland. This article is an open access article distributed under the terms and conditions of the Creative Commons Attribution (CC BY) license.