Article

Prediction of Quality and Ripeness in ‘Weidi’ and ‘Fengweimeigui’ Apricot–Plum Using Near-Infrared Spectroscopy and Machine Learning Analysis

1
Xinjiang Uygur Autonomous Region Academy of Forestry, Urumqi 830092, China
2
College of Horticulture, Xinjiang Agricultural University, Urumqi 830052, China
3
Akesu Observation and Research Station of Chinese Forest Ecosystem, Aksu 843101, China
4
College of Horticulture and Forestry, Tarim University, Alar 843300, China
*
Author to whom correspondence should be addressed.
These authors contributed equally to this work.
Agriculture 2026, 16(5), 602; https://doi.org/10.3390/agriculture16050602
Submission received: 26 January 2026 / Revised: 9 February 2026 / Accepted: 13 February 2026 / Published: 5 March 2026

Abstract

To meet consumer demand for high-quality fruit and replace traditional subjective assessment methods, there is a growing interest in objective, quantitative, and non-destructive testing techniques within the agricultural and food industries. This study explores the integration of near-infrared (NIR) spectroscopy with machine learning for the quality detection of apricot–plum hybrids, aiming to provide a rapid and efficient technical approach. Two cultivars, ‘Fengweimeigui’ and ‘Weidi’, were selected for analysis. The relationships between various quality attributes were analyzed using analysis of variance (ANOVA) and Pearson correlation. Raw spectral data were preprocessed using Savitzky–Golay (SG) smoothing, and principal component analysis (PCA) was employed to reduce the high dimensionality of the spectral data. The scores of the first 15 principal components (PCs) were extracted as input features for the subsequent models. A comparative study was conducted between backpropagation neural network (BPNN) and support vector machine (SVM) models. The results indicated that during the color-break period, significant differences existed across all quality indicators except for dry matter content, with significant correlations observed among these parameters. The results demonstrated that BPNN achieved the best predictive performance for total phenols content, peel L*, peel b*, vitamin C content, flavonoids content, soluble solids content, soluble sugars content, and soluble protein content in ‘Weidi’ and ‘Fengweimeigui’ from the color-turning to the ripening stages. The R P 2 values for these indicators were 0.968, 0.966, 0.950, 0.939, 0.939, 0.923, 0.921, and 0.905, respectively, with residual predictive deviation (RPD) values exceeding 3.0. These findings indicate that near-infrared (NIR) spectroscopy is a feasible tool for the rapid detection of plum–apricot quality. However, the model performance for Flesh a* requires further optimization. In conclusion, the combination of NIR spectroscopy and machine learning enables the rapid, efficient, and non-destructive quality assessment of plum–apricot hybrids, providing robust technical support for maturity prediction and quality control in commercial production.

1. Introduction

Apricot–plums are novel varieties developed through repeated interspecific hybridization between apricots and plums introduced from abroad [1]. They have garnered widespread attention due to their vibrant color, distinctive flavor, rich aroma, crisp texture, high nutritional value, excellent storage capacity, and significant economic value [2]. The unique taste profile of the apricot–plum, distinct from both apricots and plums, positions them as one of the most promising emerging fruit varieties for the 21st-century market [3,4]. Xinjiang, a major apricot–plum production area in China, possesses abundant germplasm resources. As a respiratory burst fruit [5], harvesting the apricot–plum at optimal maturity significantly impacts their marketability. Fruit maturity is critical, directly influencing the fresh eating quality at harvest.
In traditional agricultural production, assessing the maturity of the apricot–plum typically relies on physical and chemical analysis methods. These include using colorimeters to measure fruit color, refractometers to determine soluble solids content, and firmness testers to gauge firmness. While these methods offer high precision, they require destructive sampling, involve complex operations, demand lengthy analysis times, and incur high costs. Consequently, they struggle to meet the demands for large-scale, real-time quality inspection in modern agricultural production. Soluble solids content serves as a key indicator for assessing fruit sweetness and maturity. Traditional detection methods like sensory evaluation and chemical analysis have also become inadequate for meeting the demands of efficient, non-destructive testing.
Near-infrared (NIR) spectroscopy technology has been widely applied in agricultural product quality testing due to its non-destructive, rapid, efficient, and environmentally friendly advantages. Non-destructive evaluation of fruit quality using Visible/Near-Infrared (Vis-NIR) spectroscopy is a well-established methodology [6]. The quantification of soluble solids content (SSC) and dry matter (DM) is predicated on the vibrational overtones of O-H and C-H functional groups associated with sugars and water in the NIR spectrum [7]. Distinct from chemical constituents, fruit firmness prediction hinges on the light-scattering phenomena within the pulp, providing an indirect measure of cell wall structure and tissue density [8]. Additionally, exterior attributes like skin color are characterized by the reflectance profiles of surface pigments—predominantly chlorophylls and carotenoids—within the visible spectrum [9]. Such spectral–physicochemical relationships have been proven robust across various Prunus species [10,11]. Over the past few decades, NIR spectroscopy has garnered significant attention in non-destructive testing maturity indices due to its simplicity, rapid detection speed, and accuracy [7]. Applications of NIR spectroscopy have become widespread across various sectors, including food [12,13], agriculture, feed [14], pharmaceuticals [15,16], and petrochemicals [17]. As a detection technology, it has a broad application range, capable of covering various sample types, including solids and liquids, fully meeting detection needs across different scenarios [18,19,20]. However, progress in non-destructive testing for determining maturity indices in apricot–plum varieties remains limited. Wang Ruyue et al. [21] sought to screen methods for grading apricot–plum fruit maturity levels. Using the ‘Dinosaur Egg’ apricot–plum variety as the test material, they examined fruit quality changes post-color transition phase, collecting 21 samples in total. with 60 fruits selected per stage. This experimental process consumed a large number of fruits to assess maturity, lacking the convenience and efficiency of non-destructive testing. Methods for evaluating fruit maturity can employ machine learning regression algorithms to estimate fruit quality parameters such as firmness and soluble solids content, thereby determining the sample quality based on these values. Near-infrared spectroscopy (NIRS) represents an emerging fruit and vegetable quality assessment technology characterized by rapidity, convenience, low cost, and non-destructive operation [22]. It has been extensively applied in fruit and vegetable quality analysis and inspection [23,24]. This technology has been extensively studied for the non-destructive quality assessment of uniformly shaped fruits and vegetables with thin skins. Several portable non-destructive quality analyzers have been applied in production with satisfactory results. For instance, Ma Te et al. [25] developed PLSR predictive models for apple SSC and firmness, successfully forecasting these parameters.
Although linear chemometric methods such as partial least squares regression (PLSR) have been widely applied in agricultural product analysis, their predictive performance is often limited when dealing with fruit samples with complex biological structures. This limitation arises because fresh fruits such as the apricot–plum are optically turbid media, in which near-infrared (NIR) light propagation through the flesh involves not only absorption by chemical constituents (e.g., water and sugars) but also complex multiple scattering effects caused by cell walls, intercellular spaces, and particulate structures [7]. This coupled absorption–scattering interaction results in a pronounced nonlinear relationship between spectral responses and analyte concentrations, rather than the simple linear relationship described by the Lambert–Beer law [26].
In addition, external environmental factors (e.g., temperature fluctuations) and intrinsic instrument response characteristics may further introduce nonlinear disturbances. For such complex systems, conventional linear models are often insufficient to extract deep spectral features. In contrast, nonlinear machine learning algorithms, such as back-propagation neural networks (BPNN) and support vector machines (SVM), exhibit strong adaptive learning capability and nonlinear mapping ability [27]. BPNN can approximate arbitrarily complex nonlinear functions through multilayer neuron architectures with nonlinear activation functions, whereas SVM employs the kernel trick to project low-dimensional nonlinear data into high-dimensional feature space for linear separation, effectively addressing small-sample, nonlinear, and high-dimensional pattern recognition problems. In recent years, numerous studies have demonstrated the superior performance of nonlinear machine learning algorithms in modeling complex fruit spectral signals. Xu Min et al. [28] developed predictive models for titratable acidity and SSC in ‘Kyoho’ grapes using least-squares support vector machines (LS-SVM) and deep learning algorithms, achieving high-accuracy non-destructive monitoring of internal fruit quality. Similarly, Zhilei Zhao et al. [29] established a total acidity prediction model for the ‘Angeleno’ plum based on a back-propagation artificial neural network (BP-ANN), and their results indicated that nonlinear models significantly outperformed traditional linear regression methods in capturing the complex mapping between spectral features and chemical concentrations.
With respect to the application of NIR spectroscopy for apricot–plum quality evaluation, Yunhai Wang et al. [30] employed competitive adaptive reweighted sampling (CARS) and the shuffled frog leaping algorithm (SFLA) to select key wavelengths and developed PLSR models for predicting SSC, moisture content, and firmness of ‘Dinosaur Egg’ apricot–plum fruit. Although this study demonstrated the feasibility of NIR-based non-destructive quality assessment for the apricot–plum, limited attention was paid to fruit maturity prediction. At present, research on the rapid non-destructive detection of fruit quality and maturity prediction for the apricot–plum cultivars ‘Fengweimeigui’ and ‘Weidi’ based on NIR spectroscopy remains extremely scarce.
Quality parameters such as soluble solids content, moisture content, and firmness are not only critical determinants of consumer preference [31] but also serve as key indicators for cultivation management optimization, harvest timing determination, postharvest grading, and storage strategy development. Therefore, efficient and accurate detection of these parameters is of great practical significance for the high-quality development of the apricot–plum industry.
In summary, although significant progress has been achieved in grapes, apples, and certain plum cultivars, studies focusing on rapid quality assessment and maturity prediction during the color-transition stage of the apricot–plum cultivars ‘Fengweimeigui’ and ‘Weidi’ using nonlinear models remain limited. Given the pronounced nonlinear changes in nutrient composition during apricot–plum fruit maturation, the introduction of robust nonlinear models such as BPNN and SVM is essential for improving prediction accuracy [24].
This study collected near-infrared spectra from four sampling periods—1 day, 8 days, 15 days, and 22 days after color change—for the apricot–plum varieties ‘Weidi’ and ‘Fengweimeigui’ at different color transition stages. Single-factor ANOVA, Duncan’s multiple range test, and Pearson correlation analysis were employed to examine the interactions among 16 quality indicators of ‘Weidi’ and ‘Fengweimeigui’ fruits during color transition. Raw spectral data were preprocessed using Savitzky–Golay (SG) smoothing, and the first 15 principal components (PCs) extracted via principal component analysis (PCA) were selected as characteristic variables for model input, combined with backpropagation neural networks (BPNN) and support vector machines (SVM), to establish quantitative models for changes in SSC, SC, firmness, and sugar–acid ratio. This study investigates rapid quality assessment of apricot–plum fruits during color transition using near-infrared (NIR) technology. The goal is to establish stable, highly accurate predictive models for fruit quality, providing technical support for quality control during the color transition phase of ‘Weidi’ and ‘Fengweimeigui’ apricot–plums. This enables rapid, non-destructive detection of intrinsic quality and maturity monitoring.

2. Materials and Methods

2.1. Sample Collection

The apricot–plums ‘Weidi’ and ‘Fengweimeigui’ were used as experimental samples. All apricot–plum samples were collected from the National Key Forest Tree Breeding Base Construction Experimental Garden of the Xinjiang Academy of Forestry Sciences in Wenshu County, Aksu Prefecture, Xinjiang Uygur Autonomous Region. Four sampling events were conducted during the fruit development period: 1 day after color change, 8 days after color change, 15 days after color change, and 22 days after color change. Each sampling event collected 80 disease-free, undamaged fruit samples, totaling 640 samples. All apricot–plum samples were collected in 2025. Sampling information is shown in Table 1.

2.2. Fruit NIR Spectral Data Acquisition

The collected fruits were analyzed using the Felix F-750 (Felix Instruments, WA, USA) portable spectrometer to capture the diffuse reflectance spectra of ‘Fengweimeigui’ and ‘Weidi’ apricot–plums. Reflected light within the 310–1100 nm spectral range was recorded using the Carl Zeiss MMS-1 spectrometer. Data acquisition was performed by placing the collected fruit samples directly on the instrument’s optical window holder—one on the sun-exposed side and the other on the non-sun-exposed side (approximately 180° apart)—and manually pressing the scan button on the Felix device. Radiometric training of the data was conducted using the built-in white reference standard. Each sample was scanned twice to collect spectral data. After obtaining two output spectra for each specimen, the average spectrum was calculated and used as the representative spectral information to ensure the accuracy and reliability of the acquired signals [30]. Each individual spectrum consisted of 83 wavelength points.

2.3. Spectral Preprocessing and Sample Set Division

During the acquisition of NIR spectra, signals are often contaminated by dark current, light scattering, and high-frequency random noise. Consequently, developing models using raw spectral data without treatment can lead to reduced model robustness and diminished predictive accuracy [32]. To optimize the spectral quality, seven preprocessing techniques—mean centering (MC), multiplicative scatter correction (MSC), standard normal variate (SNV), Savitzky–Golay (SG) smoothing, first derivative (FD), second derivative (SD), and vector normalization (VN)—were comparatively evaluated. SG smoothing was eventually identified as the optimal approach. By employing the least-squares convolutional fitting, the SG algorithm demonstrates a robust capability to suppress high-frequency random noise while maintaining the integrity of fundamental spectral peaks [32].

2.4. Sample Subset Partitioning

To guarantee a representative distribution of training and prediction sets within the multidimensional sample space and to avoid stochastic bias, the SPXY (sample set partitioning based on joint X-Y distance) algorithm was implemented. A total of 640 specimens (derived from 2 varieties, 80 fruits per variety, across 4 maturation stages) were partitioned. Unlike the KS algorithm, which focuses solely on the spectral domain (X), SPXY accounts for the joint Euclidean distance in both X and physicochemical (Y) spaces [33]. Following the normalization of X and Y to neutralize dimensional discrepancies, the comprehensive distance dij between samples i and j was determined according to Equation (1).
d ij = d x ( i , j ) max ( d x ) + d y ( i , j ) max ( d y )
In this context, dx and dy denote the Euclidean distances within the spectral and target variable domains, respectively. Following the principle of maximum comprehensive distance, the total samples were divided into a training set (n = 448) and a prediction set (n = 192) using a 7:3 ratio. This strategy guarantees that the training subset captures the broadest range of sample diversity, which significantly improves the model’s generalization performance.

2.5. Principal Component Analysis and Dimensionality

Due to the fact that the original NIR spectral data contains a large number of wavelength variables with high collinearity and redundancy, direct modeling can easily lead to overfitting and low computational efficiency. Therefore, in this study, PCA was employed to reduce the high dimensionality of the spectral data. PCA transforms the original spectral variables into a set of uncorrelated linear combinations, known as principal components (PCs), through orthogonal transformation [34]. To strictly prevent data leakage, the PCA model was constructed solely based on the training set. The loading matrix and mean center values were calculated from the training set spectra. The spectral data of the prediction set were then ‘projected’ onto the principal components defined by the training set to obtain their respective scores. Based on the criterion that the cumulative explained variance exceeds 99.9%, the first 15 principal components were extracted as inputs for subsequent modeling [35].

2.6. Non-Linear Regression Models

The development of the regression models involved two distinct phases: training and validation. The former, also known as the training stage, focuses on establishing the regression framework. The latter, termed the prediction stage, evaluates the model developed in the previous step by comparing predicted values with actual experimental measurements. BPNN is a multi-layer feedforward neural network characterized by its superior non-linear mapping and self-learning capabilities, which allow it to effectively resolve complex non-linear relationships among variables. Moreover, BPNN models are user-friendly, robust, and highly fault-tolerant [36]. Similarly, SVM efficiently handles non-linear problems through the kernel trick, ensuring a global rather than local optimum and adapting to diverse data distributions. Before training, several critical parameters must be configured, including the penalty factor C, the kernel function type, and its corresponding parameters. Since two or more parameters require optimization, a grid search technique was implemented. This process identified the Gaussian radial basis function (RBF) as the most suitable kernel for the current application. Using the RBF kernel, the optimal C, γ, and ε parameters were selected during the SVM training process [37]. To strictly avoid overfitting and optimistic bias during hyperparameter tuning (e.g., determining the number of hidden neurons for BPNN, and C/γ for SVM), we implemented a 5-fold cross-validation (CV) procedure strictly within the training set. The model parameters were optimized to minimize the average error of the 5-fold CV. The independent prediction set (30%) was completely excluded from this tuning process and was used only for the final external validation of the optimized models.
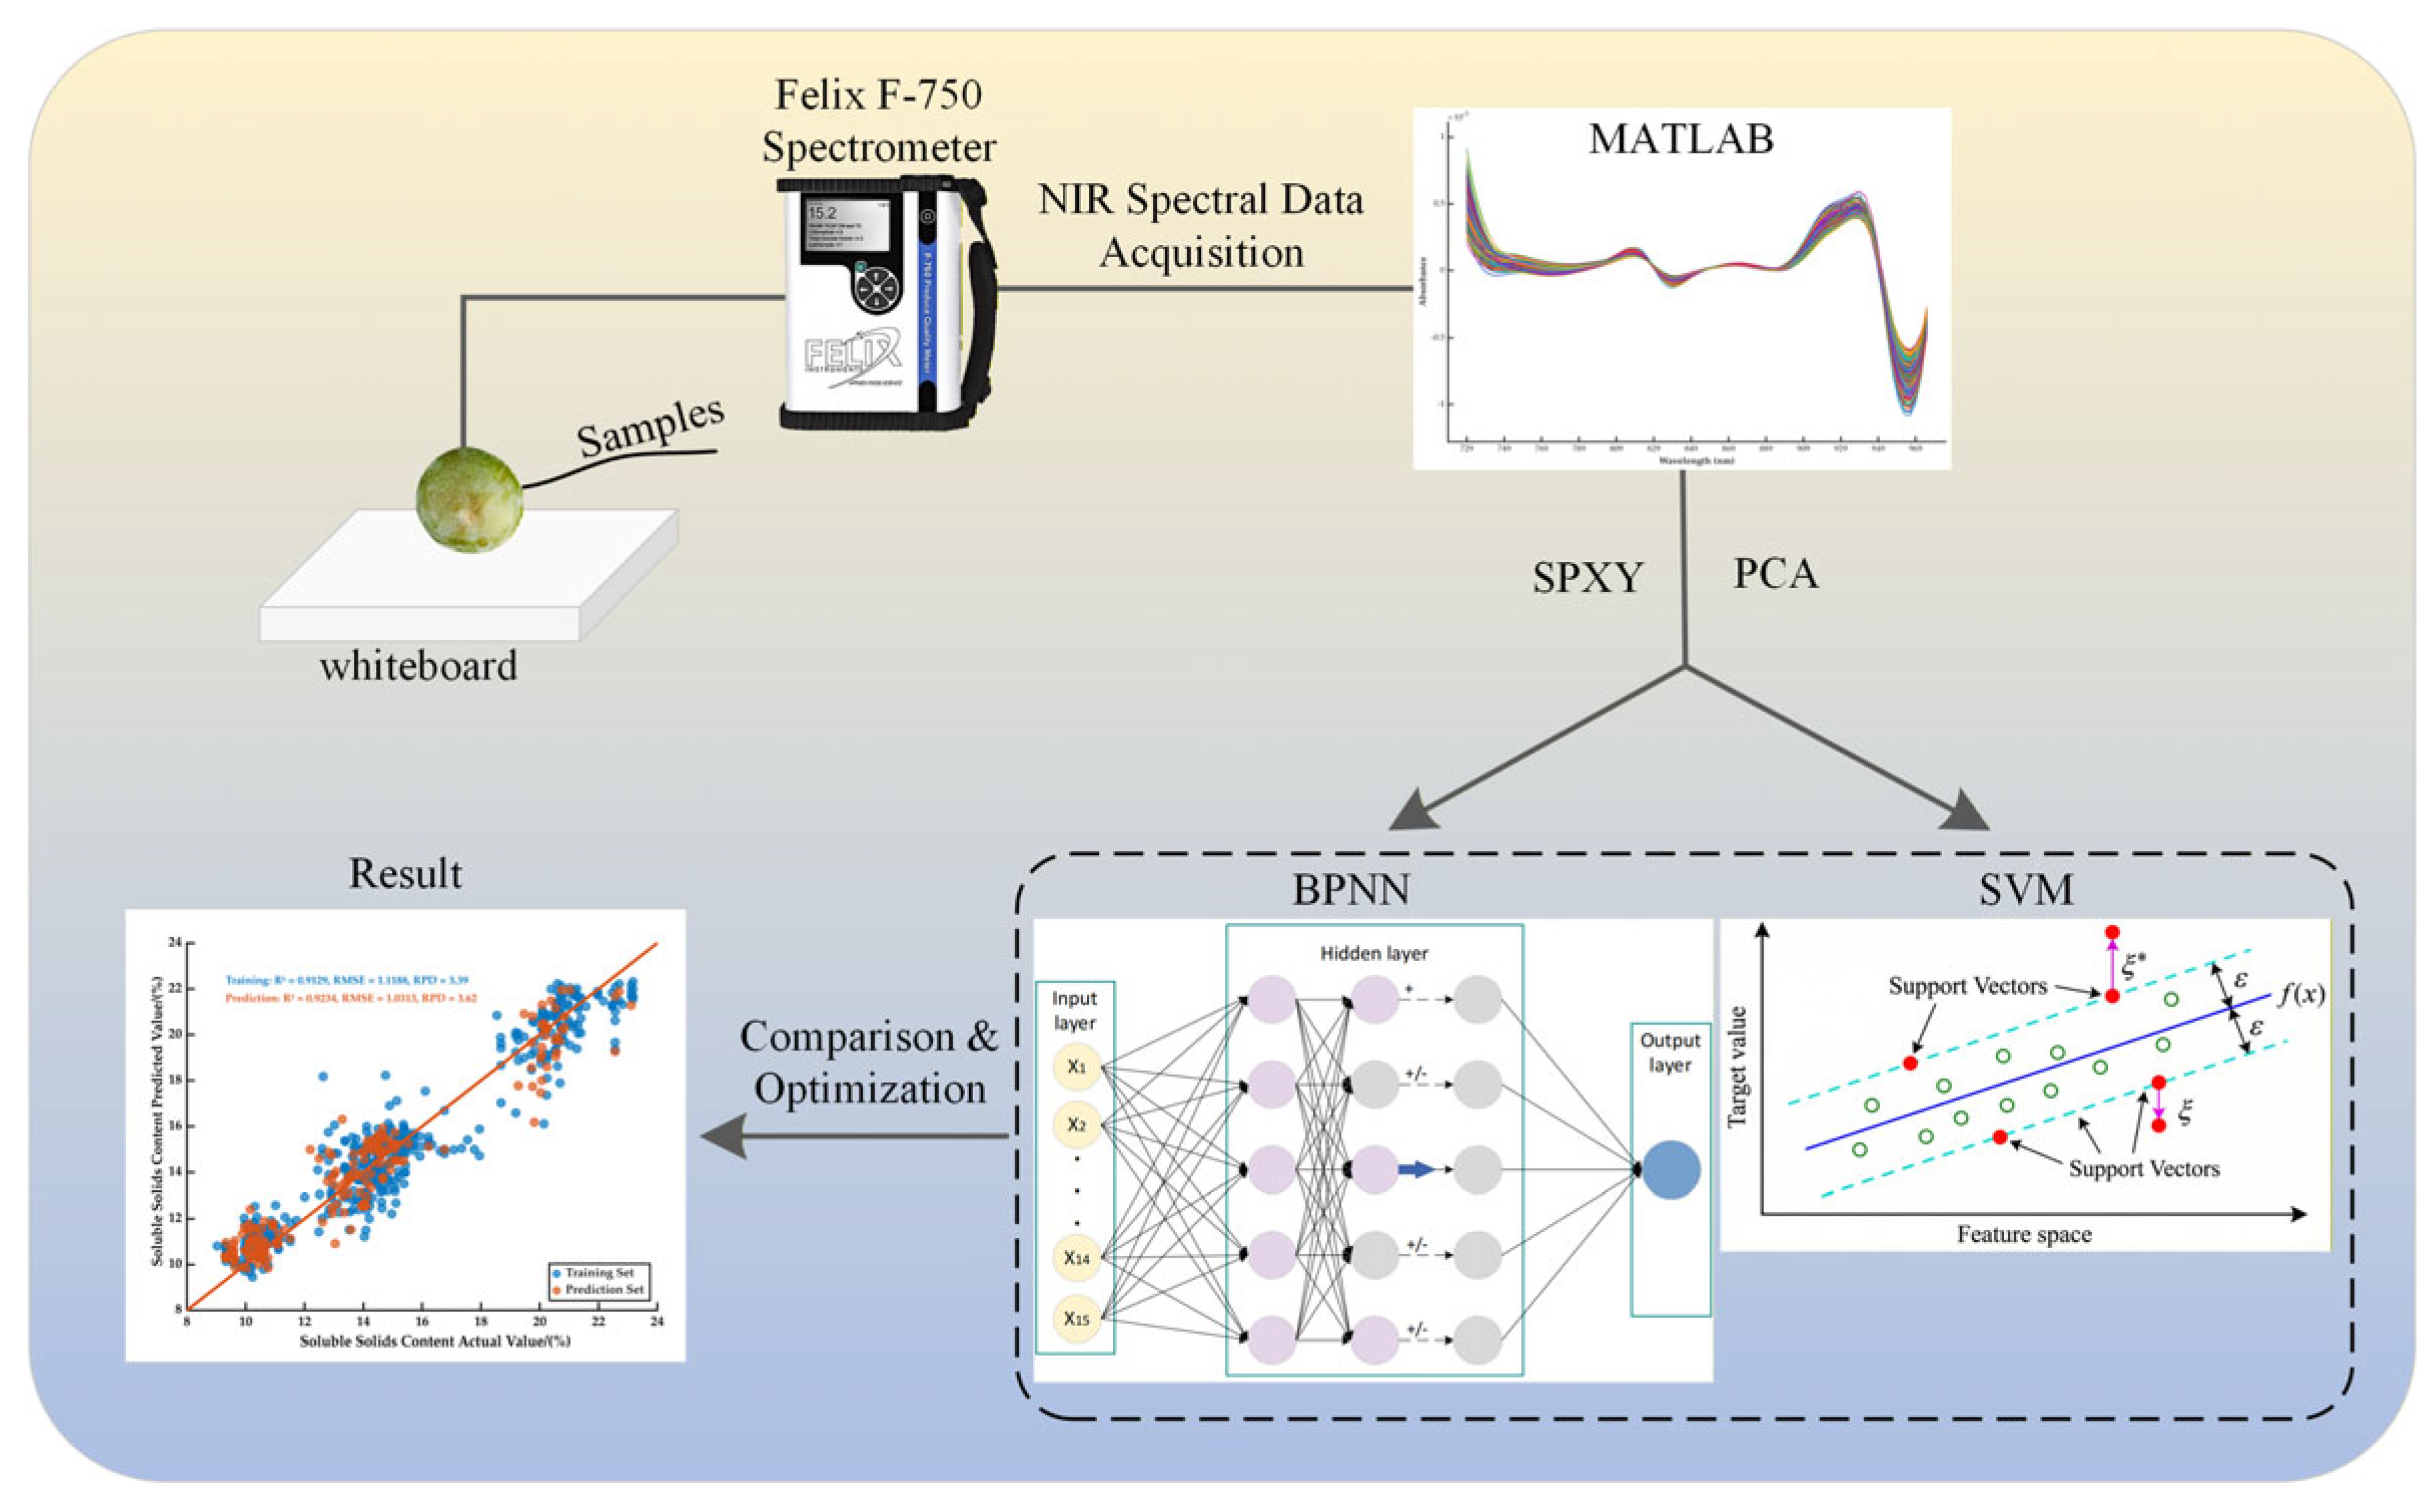
The construction of the BPNN and SVM models followed the methodology outlined in Figure 1. All procedures were executed using MATLAB R2025a software (MathWorks, Natick, MA, USA), leveraging its core toolboxes and specialized functions.

2.7. Model Evaluation Metrics

To assess the performance of the constructed models, this paper employs the model’s correlation coefficient (R2), root mean square error (RMSE), and residual prediction deviation (RPD) as primary criteria for evaluating model quality. An R2 closer to 1 indicates higher prediction accuracy; an RMSE closer to 0 signifies greater prediction stability. An RPD value between 1.5 and 2 indicates poor predictive capability, while a value between 2 and 2.5 suggests an average predictive capability suitable for rough quantitative predictions. Values between 2.5 and 3 or above 3 indicate good and excellent predictive performance, respectively [38]. The equations are shown in (Equations (2)–(4)).
R T 2 , R P 2 = 1 i = 1 n ( y i y i ^ ) 2 i = 1 n ( y i y ¯ ) 2
R M S E T , R M S E P = i = 1 n [ y i y i ^ ] 2 n
Here, y i represents the actual measured sample value, y i ^ denotes the predicted sample value, y ¯ signifies the average of the actual measured sample values, and n indicates the number of samples in the set.
R P D = S D R M S E P
Here, SD denotes the standard deviation of the measured values.

2.8. Fruit Quality Reference Values

Quality measurements will be conducted on apricot–plum fruit samples collected in 2025. Specific sampling dates are listed in Table 1 above. External and internal color attributes (L*, a*, and b*) were quantified using a portable colorimeter, and firmness was assessed with a fruit penetrometer. The soluble solids content (SSC) was recorded using a digital refractometer (ATAGO, Japan). Biochemical analyses included the determination of soluble sugars via anthrone–sulfuric acid colorimetry [39], titratable acidity (TA) through NaOH neutralization titration [39], and vitamin C using the molybdenum blue method [39]. Protein content was analyzed via the Coomassie Brilliant Blue assay [39]. Flavonoids and total phenolic content (TPC) were quantified spectrophotometrically following previously established protocols [40]. The sugar-to-acid ratio was derived from the respective concentrations of soluble sugars and TA, while dry matter (DM) was measured gravimetrically using the oven-drying method.

2.9. Data Processing Software

Data were subjected to ANOVA and Duncan’s multiple range tests using SPSS 27.0 (IBM, Armonk, NY, USA), while Pearson correlation analyses were executed in Origin 2025b (OriginLab, Northampton, MA, USA) to evaluate quality fluctuations during fruit maturation (p < 0.05). The computational framework was developed in MATLAB R2025a (The Mathworks, Natick, MA, USA), leveraging specialized toolboxes:
Preprocessing: Savitzky–Golay smoothing was applied via the sgolayfilt function (Signal Processing Toolbox) for noise reduction;
Dimensionality reduction: The pca function (Statistics and Machine Learning Toolbox) was utilized for feature extraction;
SVM modeling: Non-linear regression was performed using the fitrsvm function with a radial basis function (RBF/Gaussian) kernel;
BPNN modeling: A feedforward neural network (feedforwardnet) was trained using the Levenberg-Marquardt optimization (trainlm) through the Deep Learning Toolbox.

3. Results

3.1. Quality Analysis of Apricot–Plum During Color Change Period

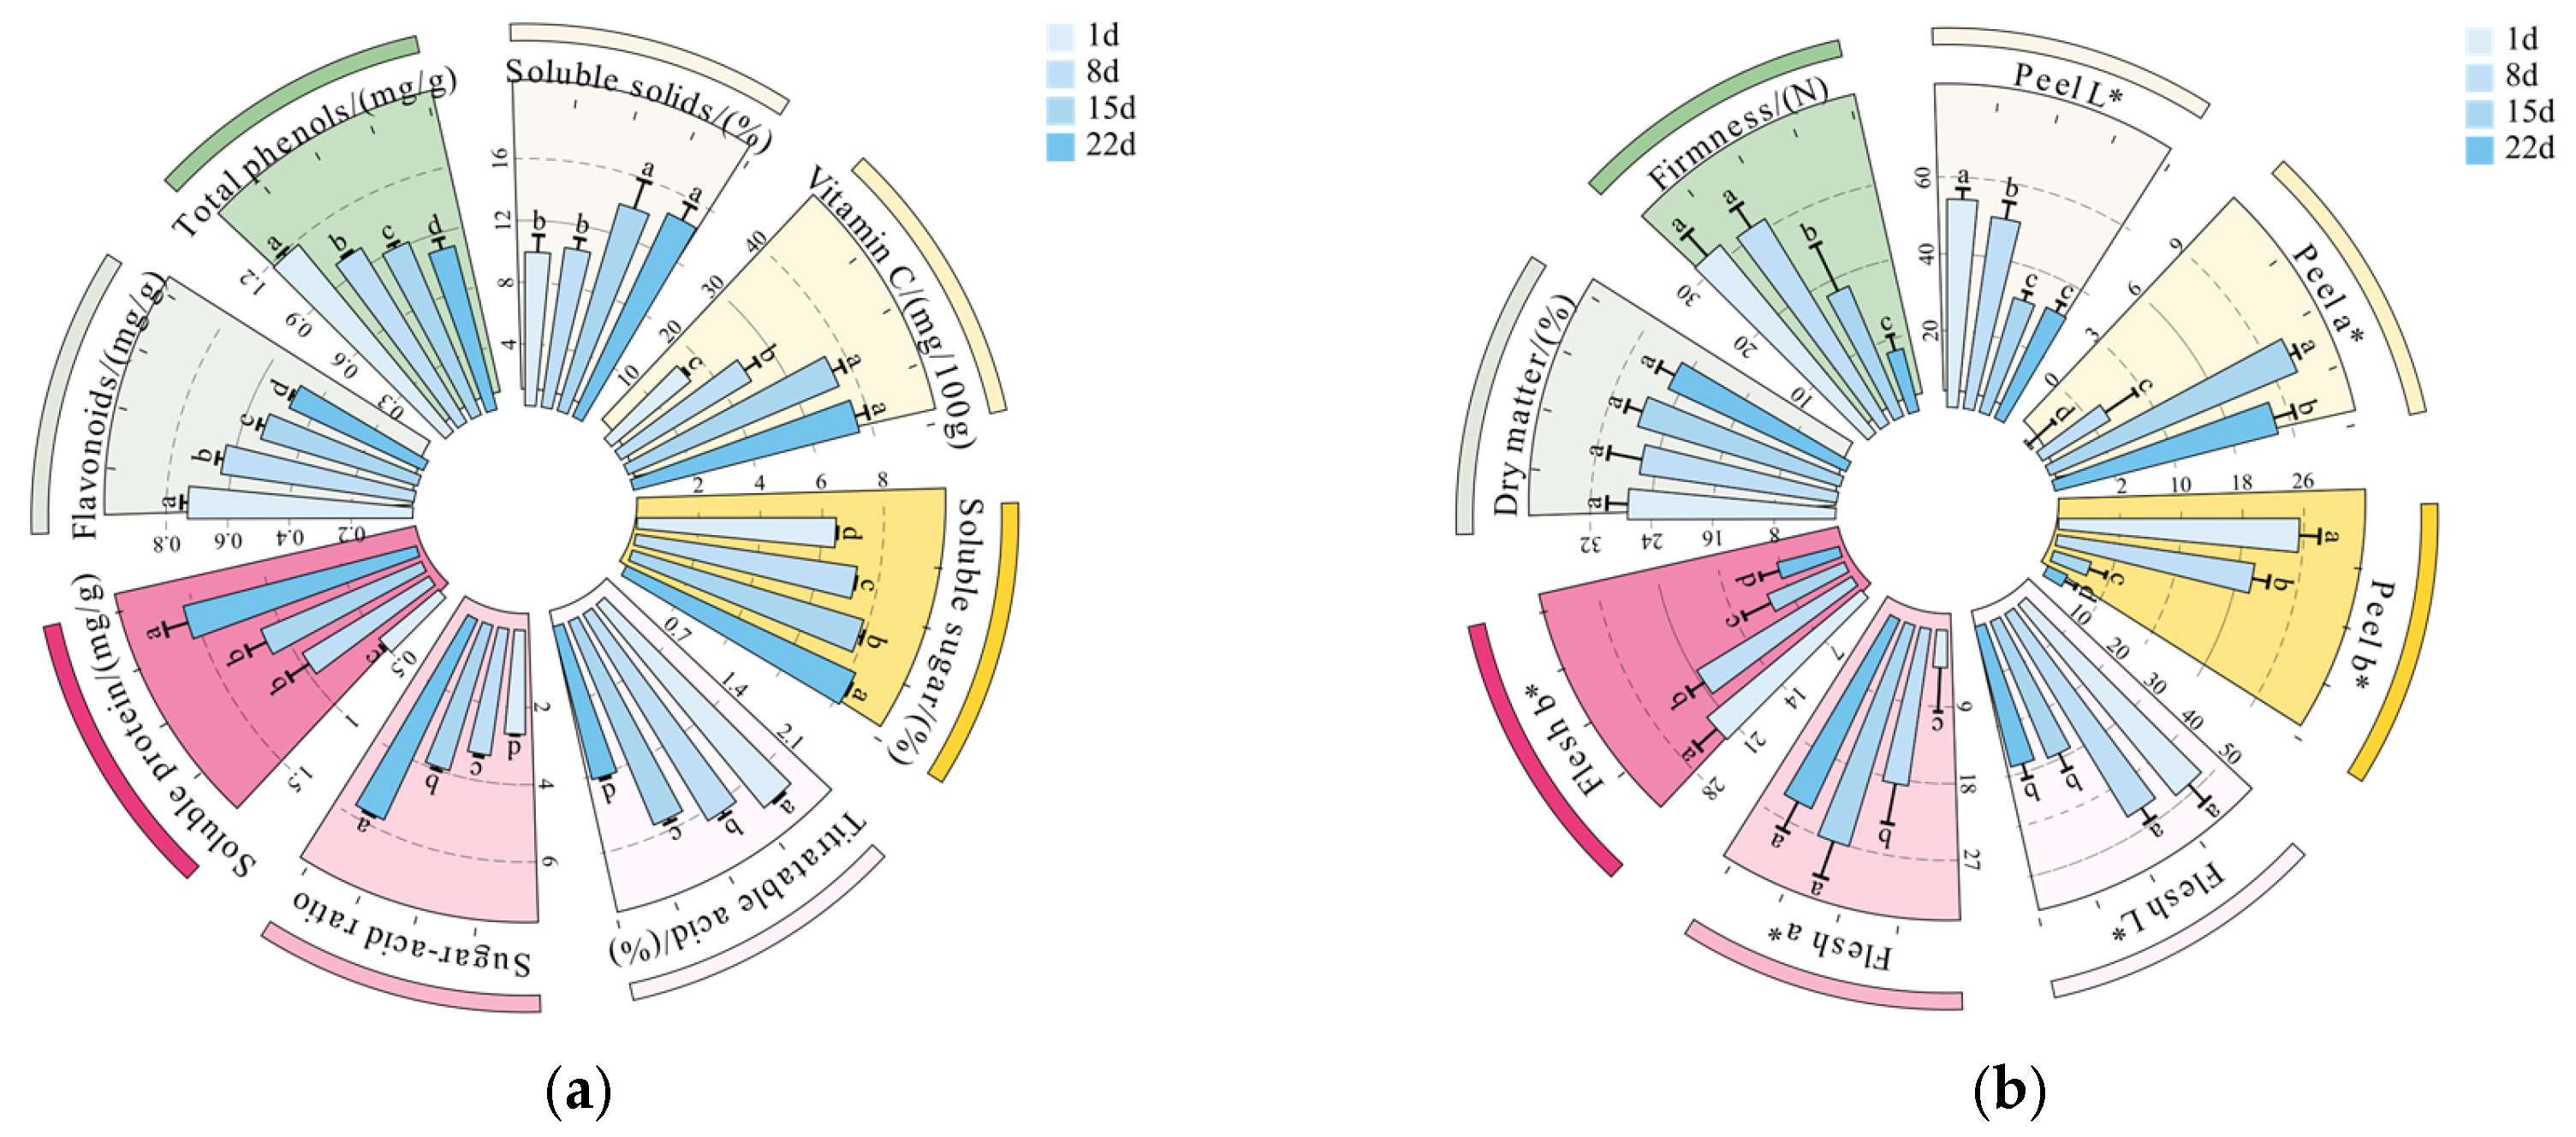
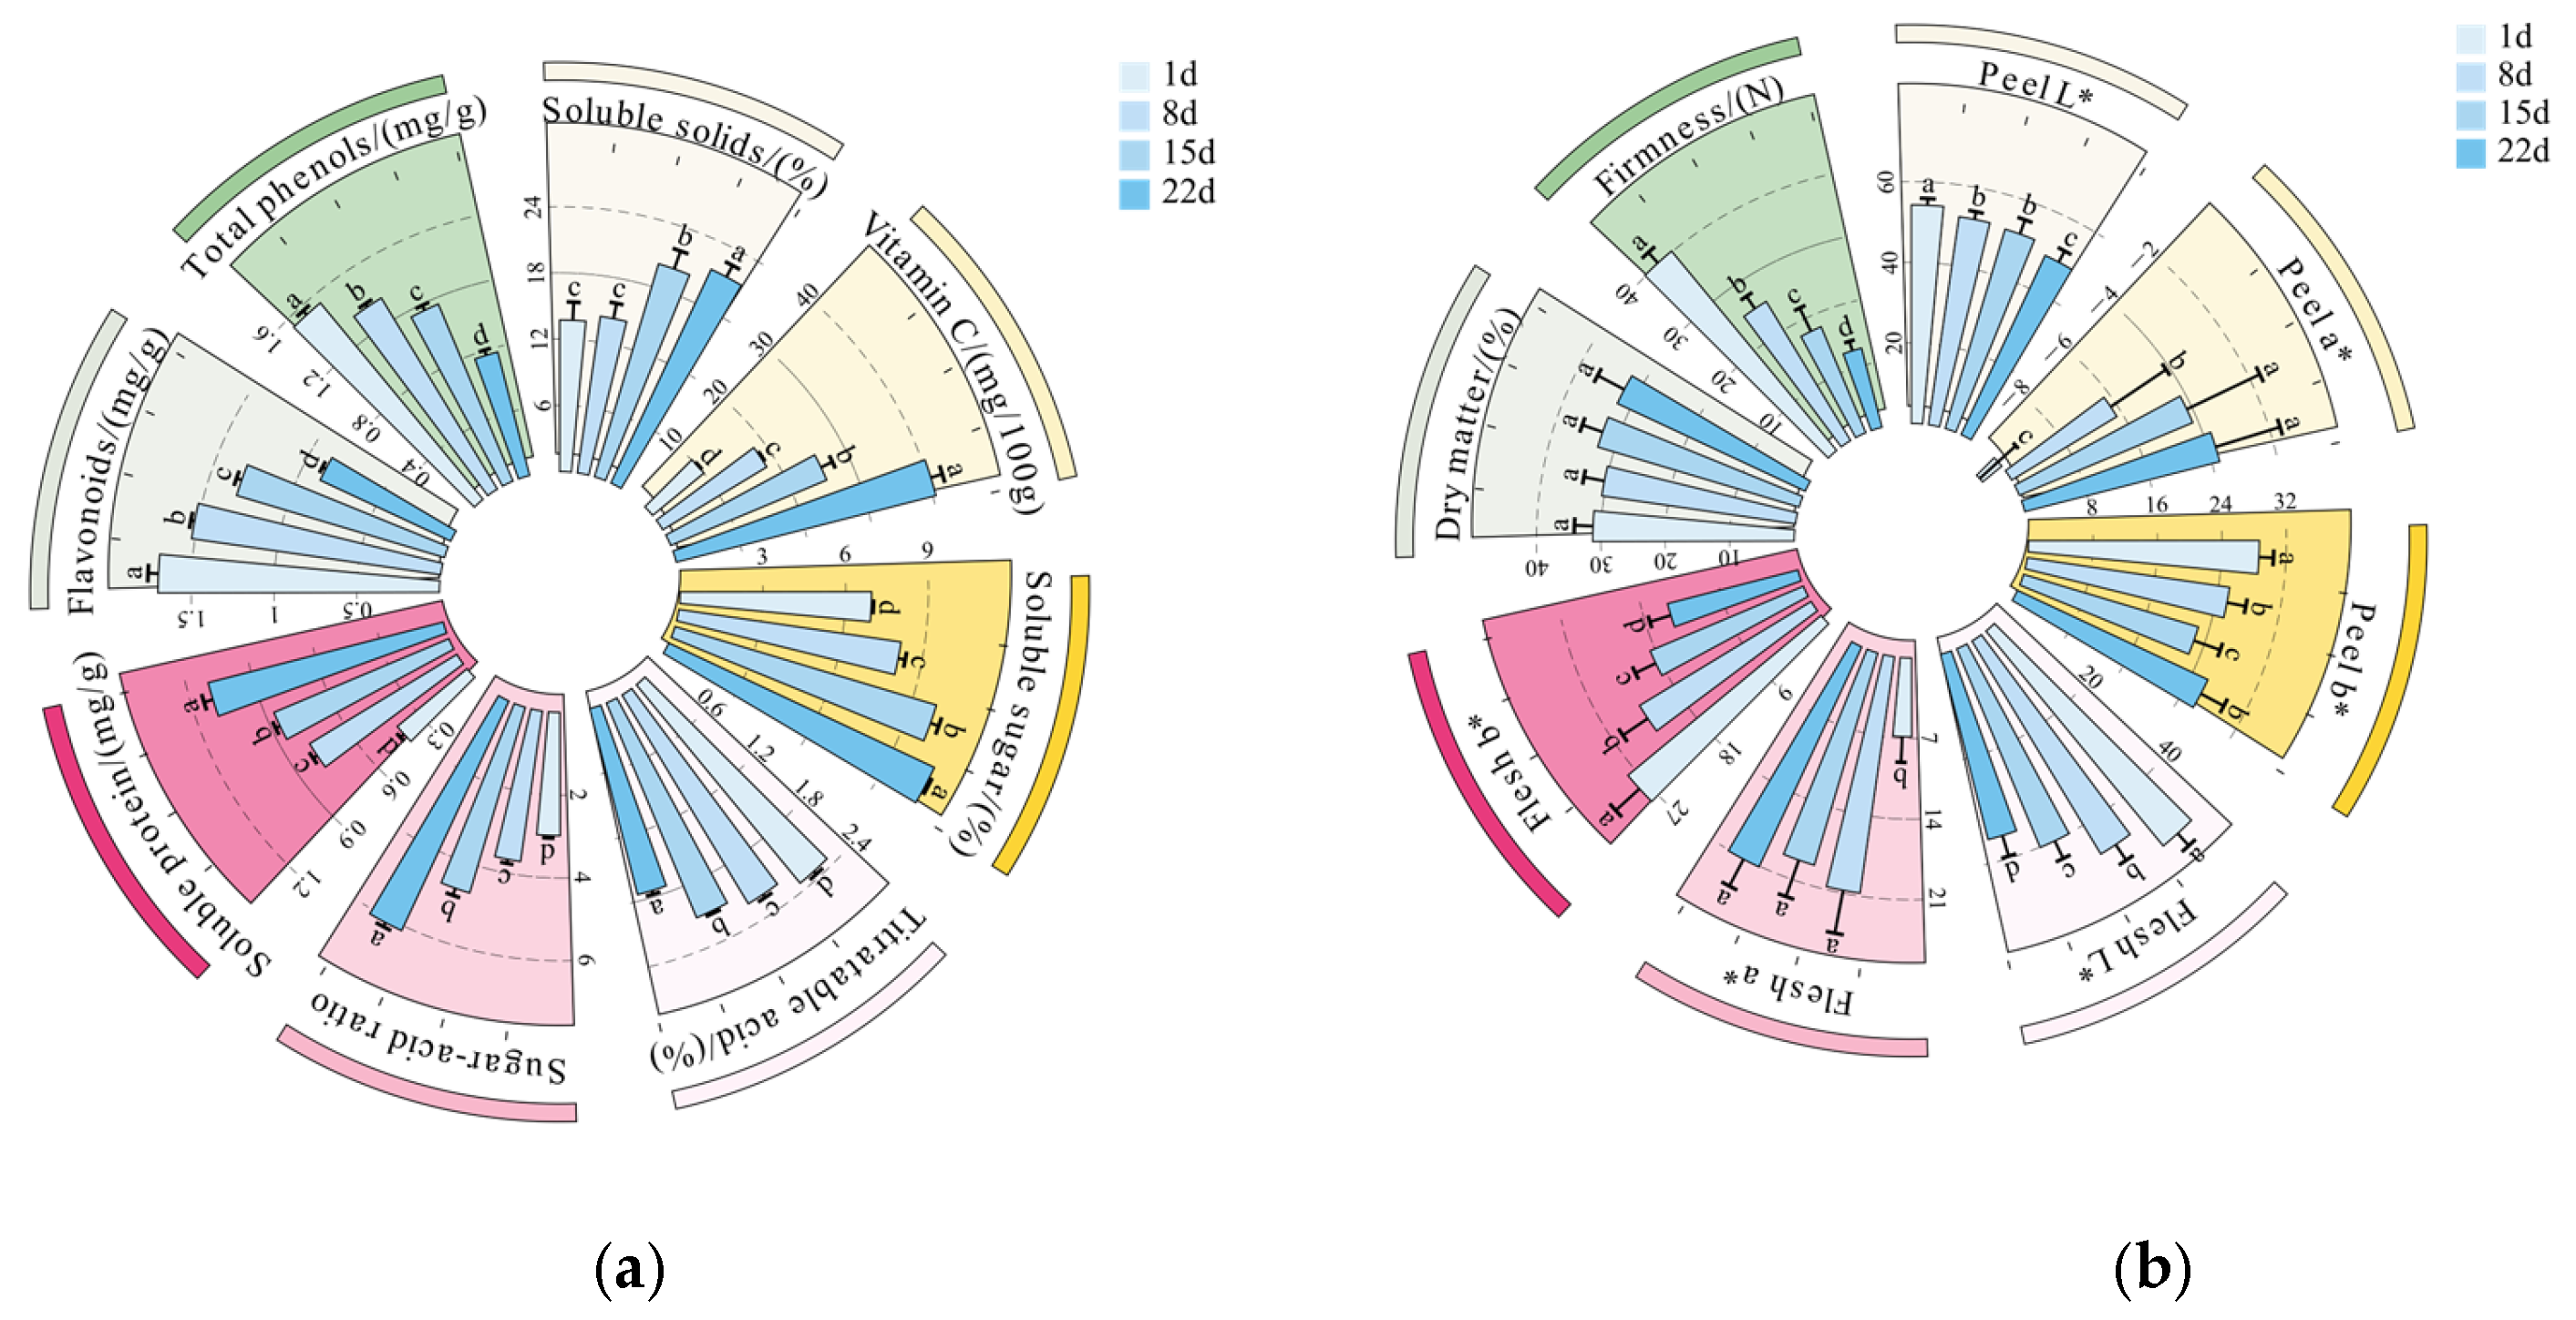
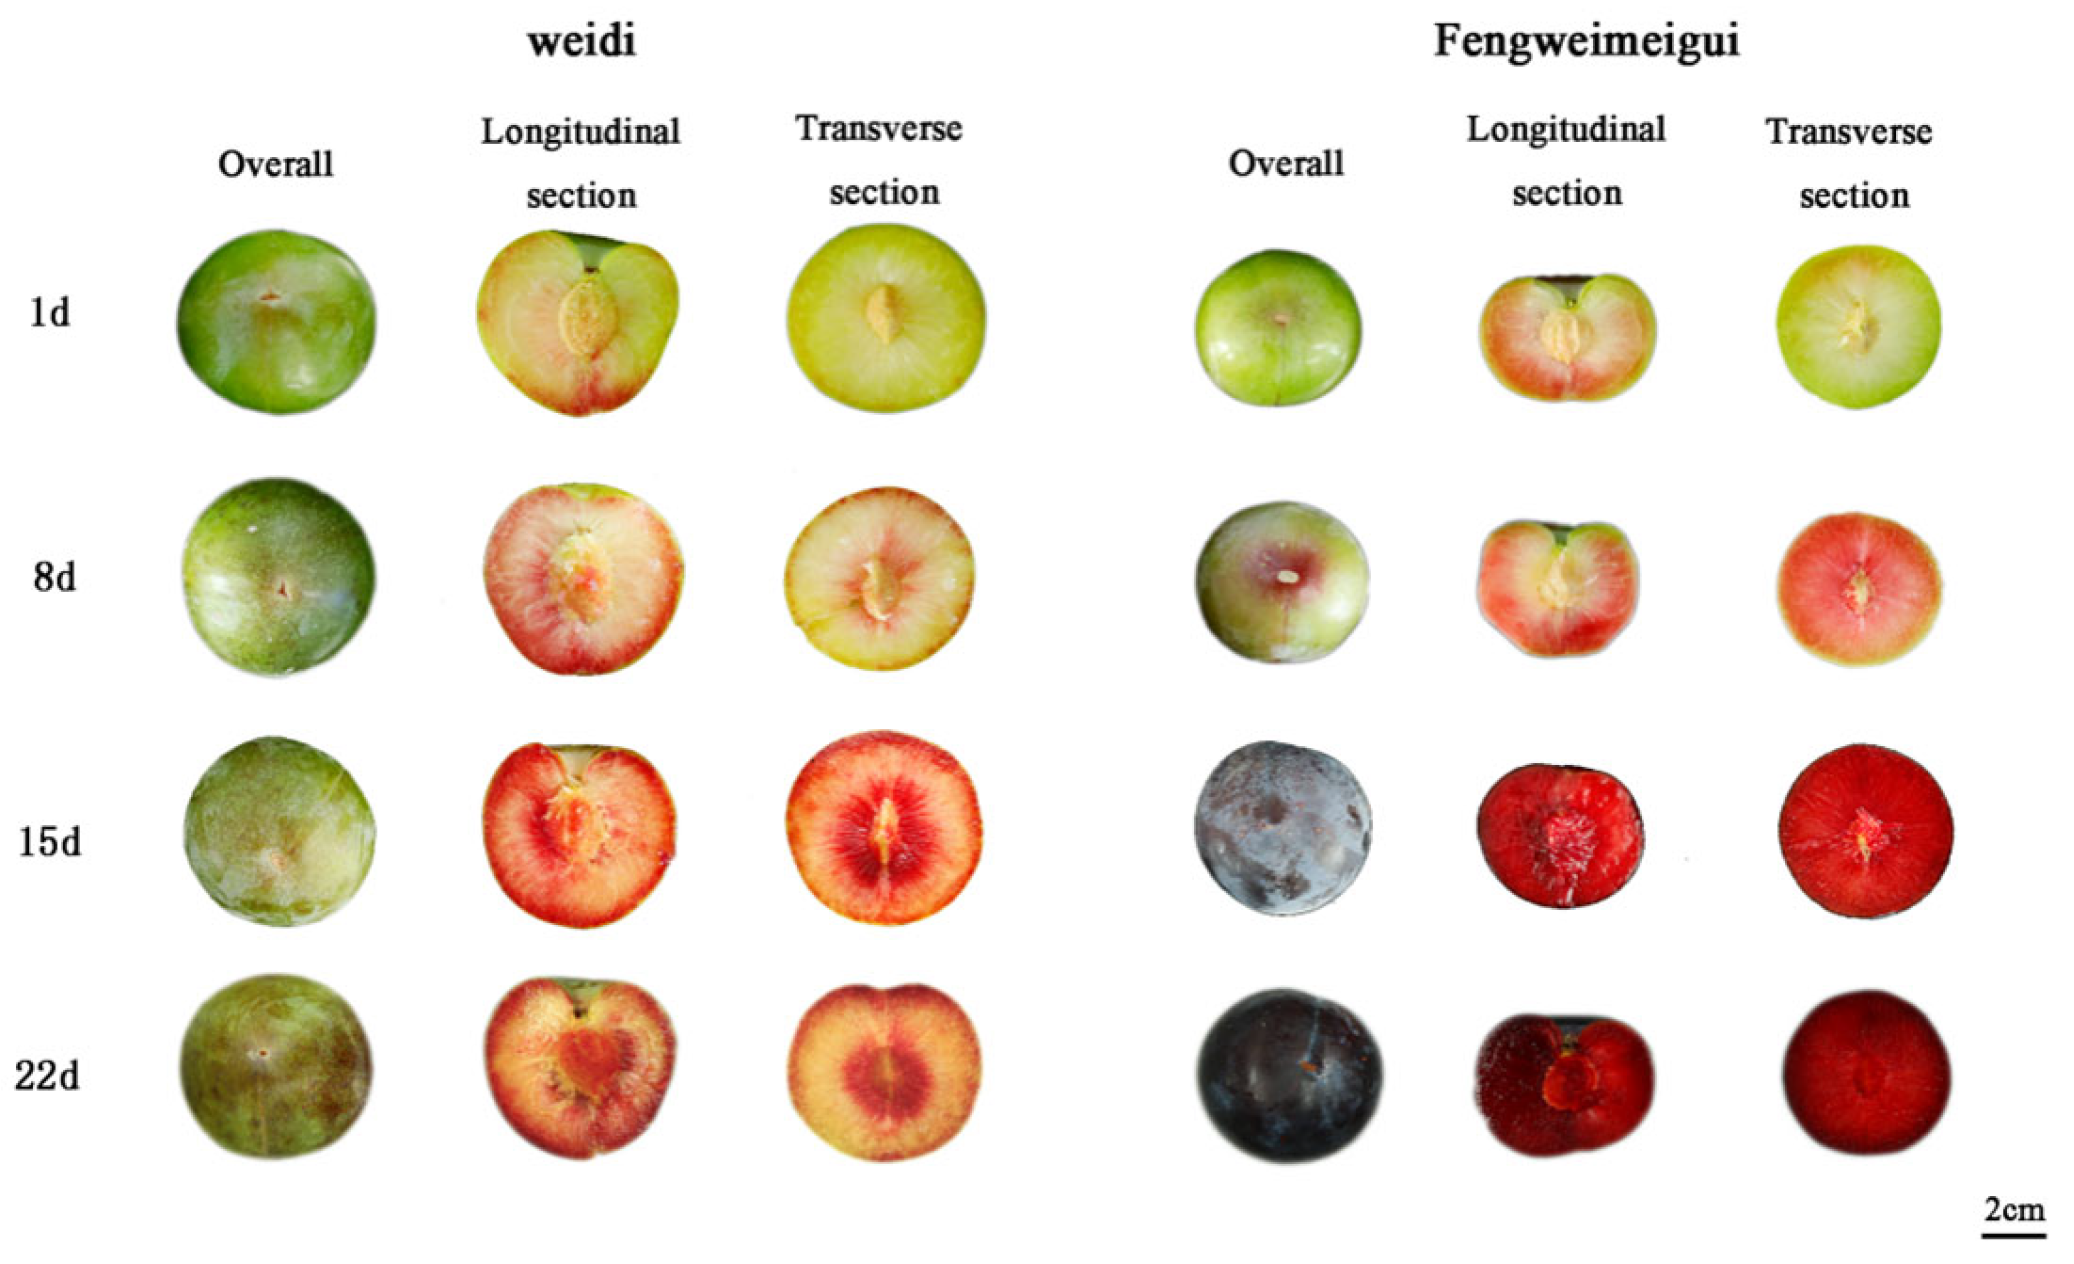
The quality indicators for ‘Fengweimeigui’ and ‘Weidi’ fruits during color change were summarized and subjected to one-way ANOVA. Duncan’s multiple range test was applied at a 0.05 significance level. Results are presented in Figure 2 and Figure 3. Figure 4 shows the changes in appearance of the apricot–plums ‘Fengweimeigui’ and ‘Weidi’ during the fruit color transition period.
With increasing post-color change, soluble solids, vitamin C, SS, and soluble protein content in both ‘Fengweimeigui’ and ‘Weidi’ exhibited an overall upward trend. Notably, soluble solids in both cultivars showed a significant increase at 15 d post-color change. During the color change period, the TA, flavonoids, total phenolic content, and firmness of ‘Fengweimeigui’ and ‘Weidi’ exhibited a gradual decreasing trend. Dry matter, a key indicator for measuring the total solids content in fruit, showed a pattern of initially decreasing, then increasing, before decreasing again in ‘Fengweimeigui’ and ‘Weidi’. The sugar–acid ratio serves as an indicator for evaluating fruit flavor. During fruit ripening, sugar gradually accumulates while acidity decreases, causing the sugar–acid ratio to increase with advancing maturity. Consequently, this ratio is commonly used to determine whether fruit has reached harvest maturity. Generally, a high sugar–acid ratio coupled with elevated acidity results in a sweet taste perception. Following the color change, the sugar–acid ratio of ‘Weidi’ exhibited an upward trend. Both ‘Fengweimeigui’ and ‘Weidi’ reached peak sugar–acid ratios 22 d post-color change, coinciding with the lowest titratable acid content and sweetest palate. As shown in Figure 2b and Figure 3b, the firmness, skin and flesh lightness values (peel L*, flesh L*), and yellow–blue values (peel b*, flesh b*) of ‘Fengweimeigui’ and ‘Weidi’ generally decreased, with the color tone gradually darkening. The red–green values (peel a*, flesh a*) of the skin and flesh of ‘Fengweimeigui’ reached their maximum at 15 d post-color change, exhibiting the reddest color tone. Concurrently, the red–green values (peel a*, flesh a*) of ‘Weidi’ peel and flesh peaked at 22 d post-color change, exhibiting the most intense red hue.
Research findings indicate that, during the ripening process, the lightness value L* of both the peel and flesh of the apricot–plum cultivars ‘Fengweimeigui’ and ‘Weidi’ exhibited a decreasing trend, consistent with the experimental results reported by Wang Ruyue et al. [41] for the apricot–plum cultivar ‘Fengweihuanghou’. The peel a* and flesh a* gradually increased, consistent with the changes in a* values observed by Peiqia Ma et al. [42] in the peel and flesh of the Gong Orange fruit at different maturity stages. Research indicates that apricot–plum fruit firmness showed a significant gradual decline during the color change period, consistent with previous studies [43,44]. Studies by Xue et al. [45] and Zhang et al. [46] on plum and apricot fruits indicate that fruit nutrients undergo changes with extended ripening periods. Particularly during the ripening stage, nutrient accumulation progressively increases as fruit maturity advances. This study demonstrates that the soluble solids content gradually increases during the color change period, while TA gradually decreases. Total sugar and vitamin C content also progressively increased across different color-changing stages, consistent with findings by Zhigang Zhang et al. [46] and Guiping Wang et al. [47].

3.2. Coefficient of Variation

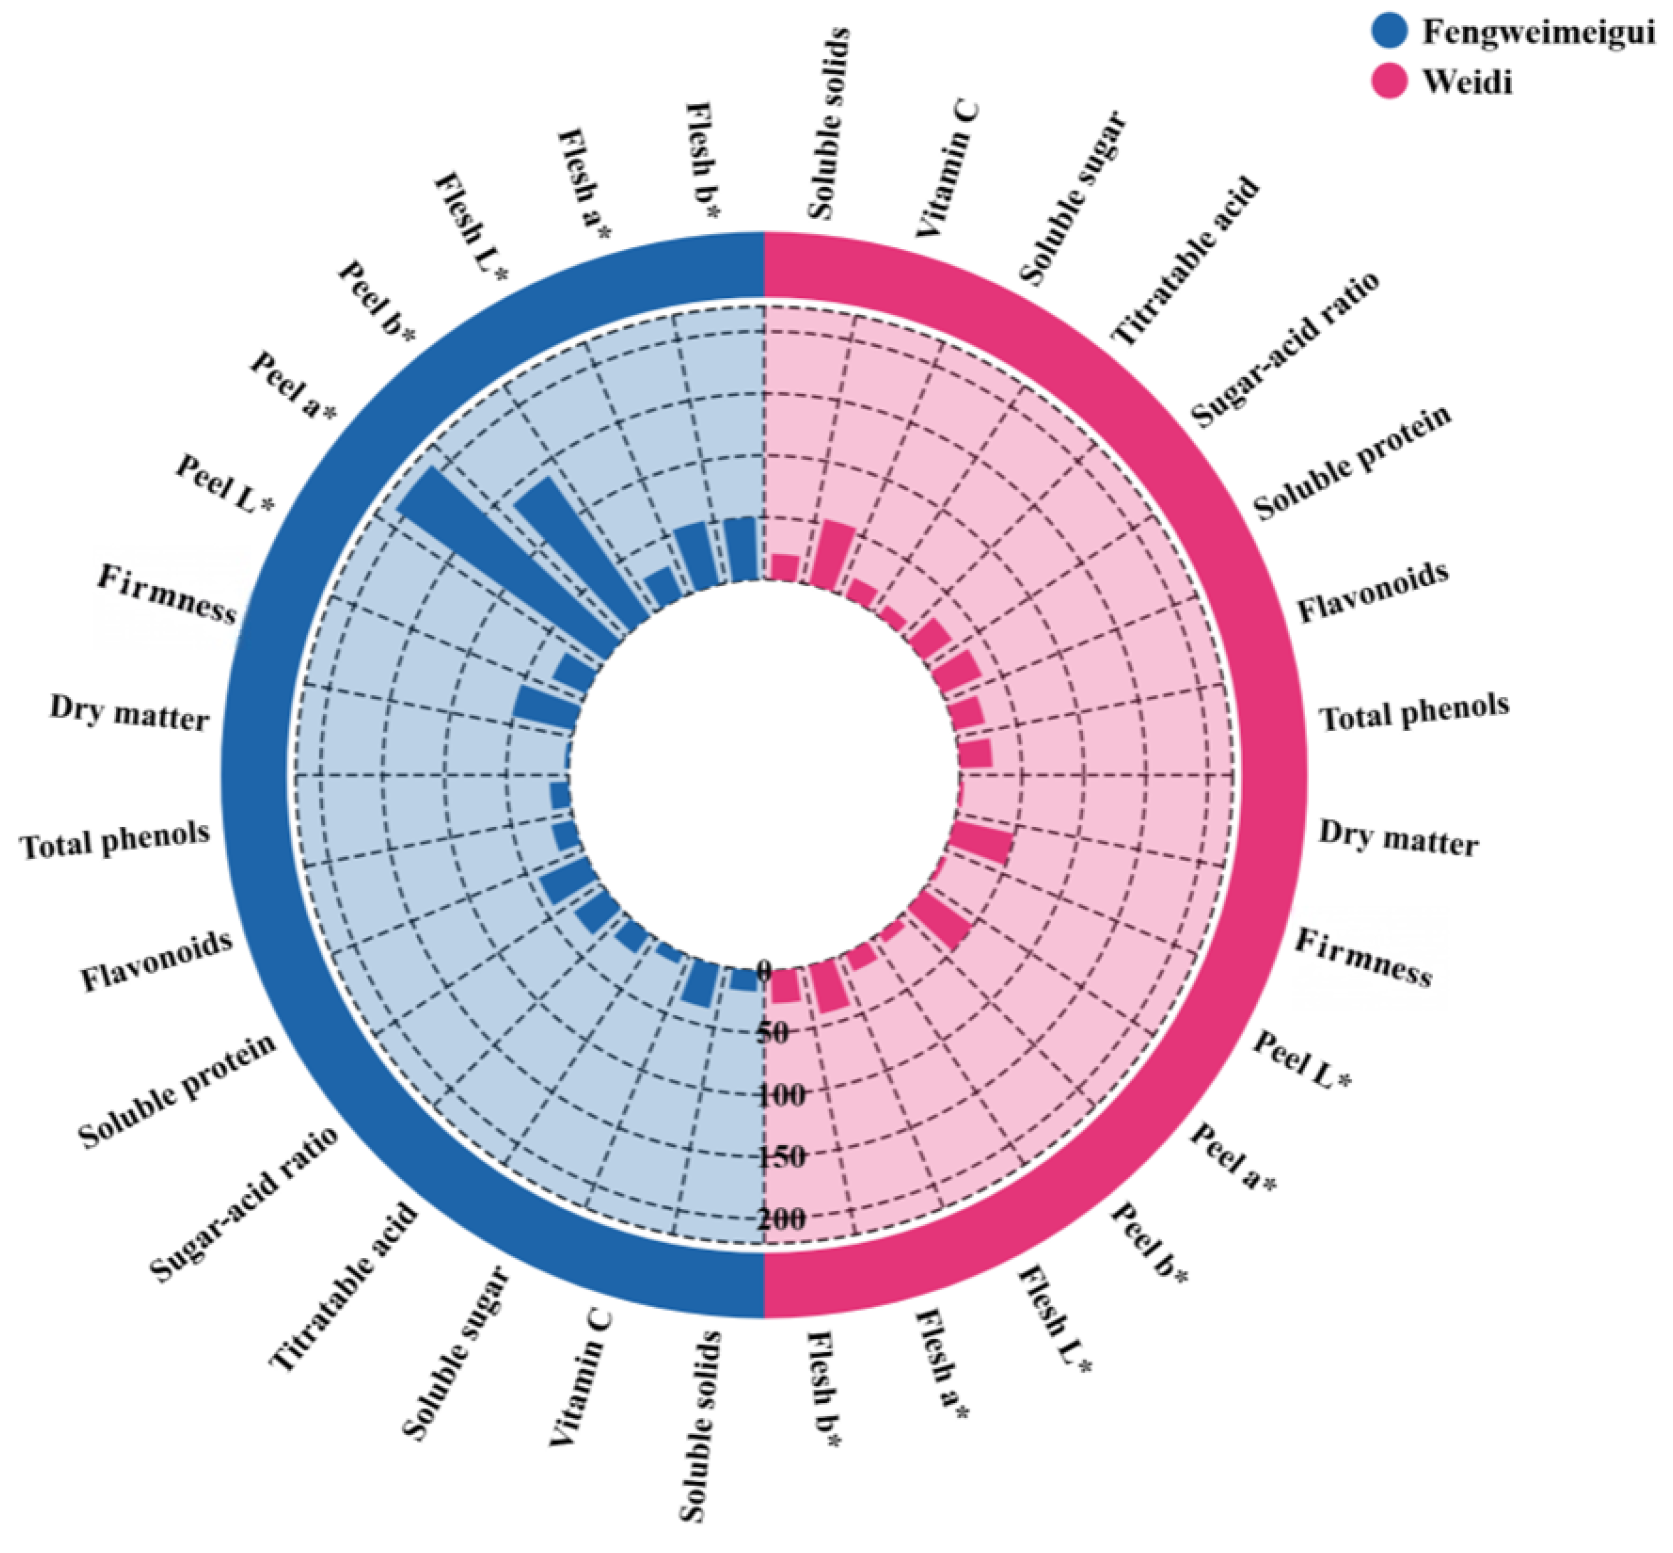
The equations should be inserted in editable format from the equation editor. The coefficient of variation (CV) during color change was calculated, with CV values reflecting the dispersion of each quality indicator. As shown in Figure 5, significant variations were observed for peel redness (peel a*), peel blue–greenness (peel b*), flesh redness (flesh a*), firmness, flesh blue-greenness (flesh b*), soluble protein content, VC concentration, sugar–acid ratio, and peel lightness (peel L*) across different color change stages in ‘Fengweimeigui’ fruit. The coefficients of variation (CV) for peel a*, peel b*, flesh a*, firmness, flesh b*, soluble protein, vitamin C, sugar–acid ratio, and peel L* were 215.04%, 139.92%, 53.01%, 51.27%, 50.19%, 42.31%, 35.57%, 31.46%, and 30.38%, respectively. This indicates that, during the color change period, significant changes occurred in the peel a*, b-skin, flesh a*, firmness, b-flesh, soluble protein, vitamin C, sugar–acid ratio, and peel L* of the Fengweimeigui fruit. The CV value for dry matter content (3.43%) was relatively low, indicating its lesser susceptibility to variation during color transition. Conversely, significant variation was observed in VC, peel a*, firmness, flesh a*, soluble protein, and sugar–acid ratio across different color transition stages. The CV values for VC, peel a*, firmness, flesh a*, soluble protein, and sugar–acid ratio were 54.43%, 49.68%, 48.99%, 40.31%, 35.44%, and 29.13%, respectively. This indicates that, during the color change period, significant alterations occurred in the VC content, peel a*, firmness, flesh a*, soluble protein, and sugar–acid ratio of the ‘Weidi’ fruit. The CV values for dry matter and peel L* were relatively low, indicating that dry matter and peel L* were relatively less affected during the color change period. Based on the CV values, it can be observed that, during the color change process, there were very significant differences in the peel a*, peel b*, flesh a*, and firmness of the ‘Fengweimeigui’, as well as in the VC, peel a*, and firmness of the ‘Weidi’, at different stages of the color change period.

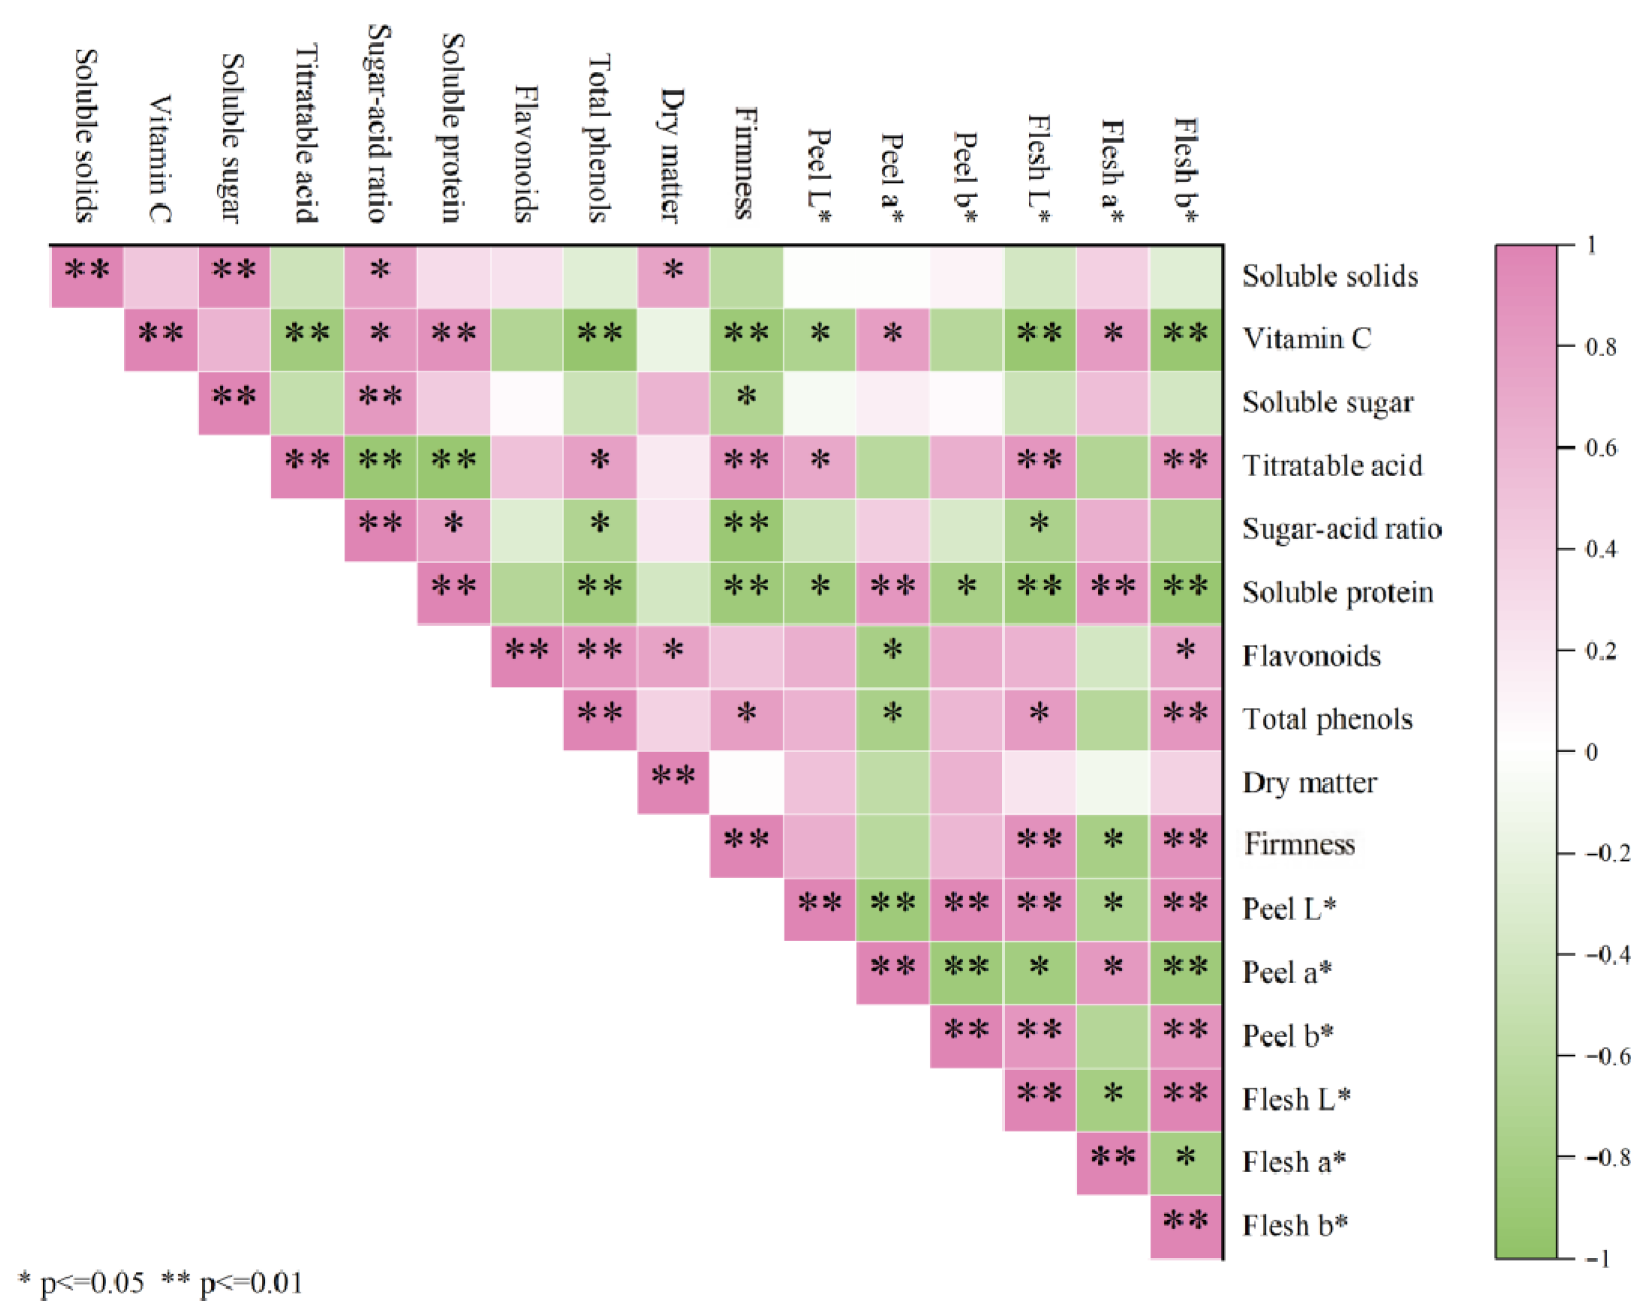
3.3. Pearson Correlation Analysis of Apricot–Plum Fruit Quality

A Pearson correlation analysis was conducted on the quality attributes of apricot–plum fruit during color development to investigate the correlations among these attributes. The results are presented in Figure 6 SSC showed a significant positive correlation with dry matter and sugar–acid ratio, and an extremely significant positive correlation with SS. VC exhibited a highly significant negative correlation with flesh b*, flesh L*, firmness, total phenols, and TA, and a significant negative correlation with peel L*. It showed significant positive correlations with flesh a*, peel a*, sugar–acid ratio, and soluble protein. SS demonstrated a significant negative correlation with firmness and a highly significant positive correlation with sugar–acid ratio. TA showed a highly significant positive correlation with flesh b*, flesh L*, and firmness; a significant positive correlation with peel L* and total phenolics; and a highly significant negative correlation with soluble protein and sugar–acid ratio. The sugar–acid ratio exhibited a significant negative correlation with flesh L*, total phenolics, and a highly significant negative correlation with firmness, while showing a significant positive correlation with soluble protein. Soluble protein displayed a highly significant negative correlation with flesh b*, flesh L*, firmness, and total phenolics, a highly significant positive correlation with flesh a* and peel a*, and a significant negative correlation with peel L* and peel b*. Flavonoids showed a significant positive correlation with flesh b* and dry matter, a significant negative correlation with peel a*, and a highly significant positive correlation with total phenolics. Total phenolics exhibited a highly significant positive correlation with flesh b*, a significant positive correlation with flesh L* and firmness, and a significant negative correlation with peel a*. Firmness exhibited a highly significant positive correlation with flesh b* and flesh L*, and a significant negative correlation with flesh a*. Peel L* showed a highly significant positive correlation with flesh b*, flesh L*, and peel b*, a significant negative correlation with flesh a*, and a highly significant negative correlation with peel a*. Flesh a* exhibited a highly significant negative correlation with flesh b* and peel b*, a significant negative correlation with flesh L*, and a significant positive correlation with flesh a*. Peel b* showed a highly significant positive correlation with flesh b* and flesh L*. Flesh L* demonstrated a highly significant positive correlation with flesh b* and a significant negative correlation with flesh a*. Flesh a* exhibited a significant negative correlation with flesh b*.

3.4. NIR Spectroscopy and Quality Correlation Analysis

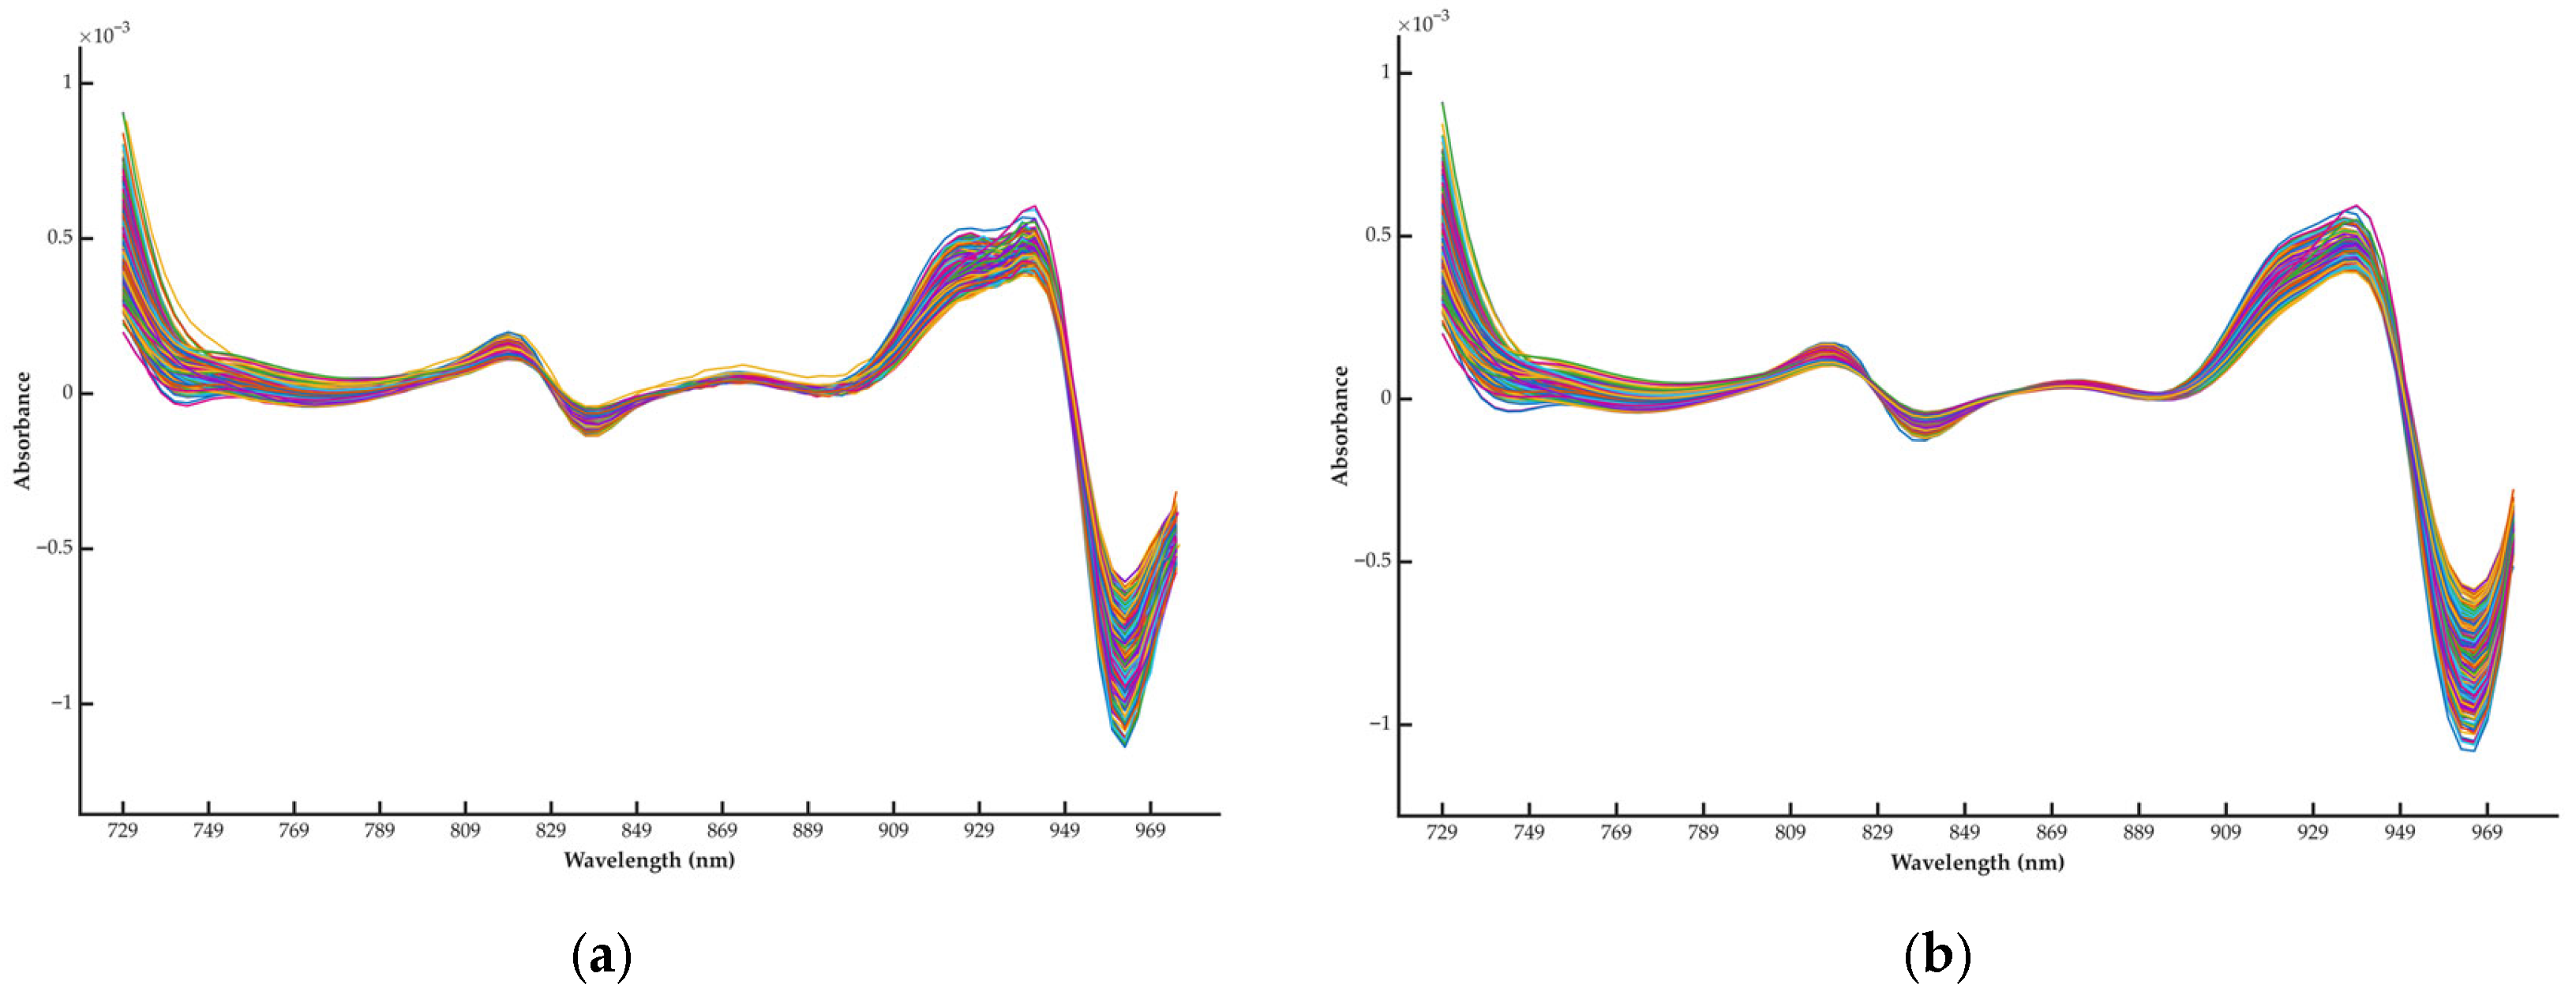
Spectral preprocessing refers to a series of mathematical transformations and processing applied to raw spectral signals prior to analyzing them with machine learning models. This effectively removes interference signals unrelated to target variables while enhancing valid spectral features [48]. The Savitzky–Golay smoothing method employs local polynomial least-squares fitting on data points, replacing the original data points with calculated values at central points using the fitted polynomial. This approach effectively suppresses noise while maximally preserving the original signal characteristics [49]. Figure 7 shows the raw near-infrared (NIR) spectra and Savitzky–Golay-smoothed spectra of ‘Weidi’ and ‘Fengweimeigui’ fruits collected at four stages after color change. The spectral trends are consistent. The NIR spectrum of ‘Weidi’ fruit exhibits a distinct absorption peak near 945 nm, with the lowest absorbance at 966 nm. The NIR spectrum of ‘Fengweimeigui’ fruit exhibits a distinct absorption peak near 942 nm, with the lowest absorbance at 963 nm. The absorption peaks in the 942~966 nm range primarily correspond to O-H vibrations, which correlate with SS, soluble solids, and dry matter content in both ‘Weidi’ and ‘Fengweimeigui’ fruit. In summary, the near-infrared spectrum contains absorption peaks and bands correlated with the quality of ‘Weidi’ and ‘Fengweimeigui’ fruits, thereby correlating with fruit quality during the color-changing period. Based on these spectra, quantitative models can be established for measuring soluble solids, SS, titratable acids, flavonoids, soluble proteins, total phenols, dry matter content, skin-to-flesh color difference, sugar–acid ratio, and firmness in ‘Weidi’ and ‘Fengweimeigui’.

3.5. Mechanistic Insights into Feature Wavelengths and Model Interpretability

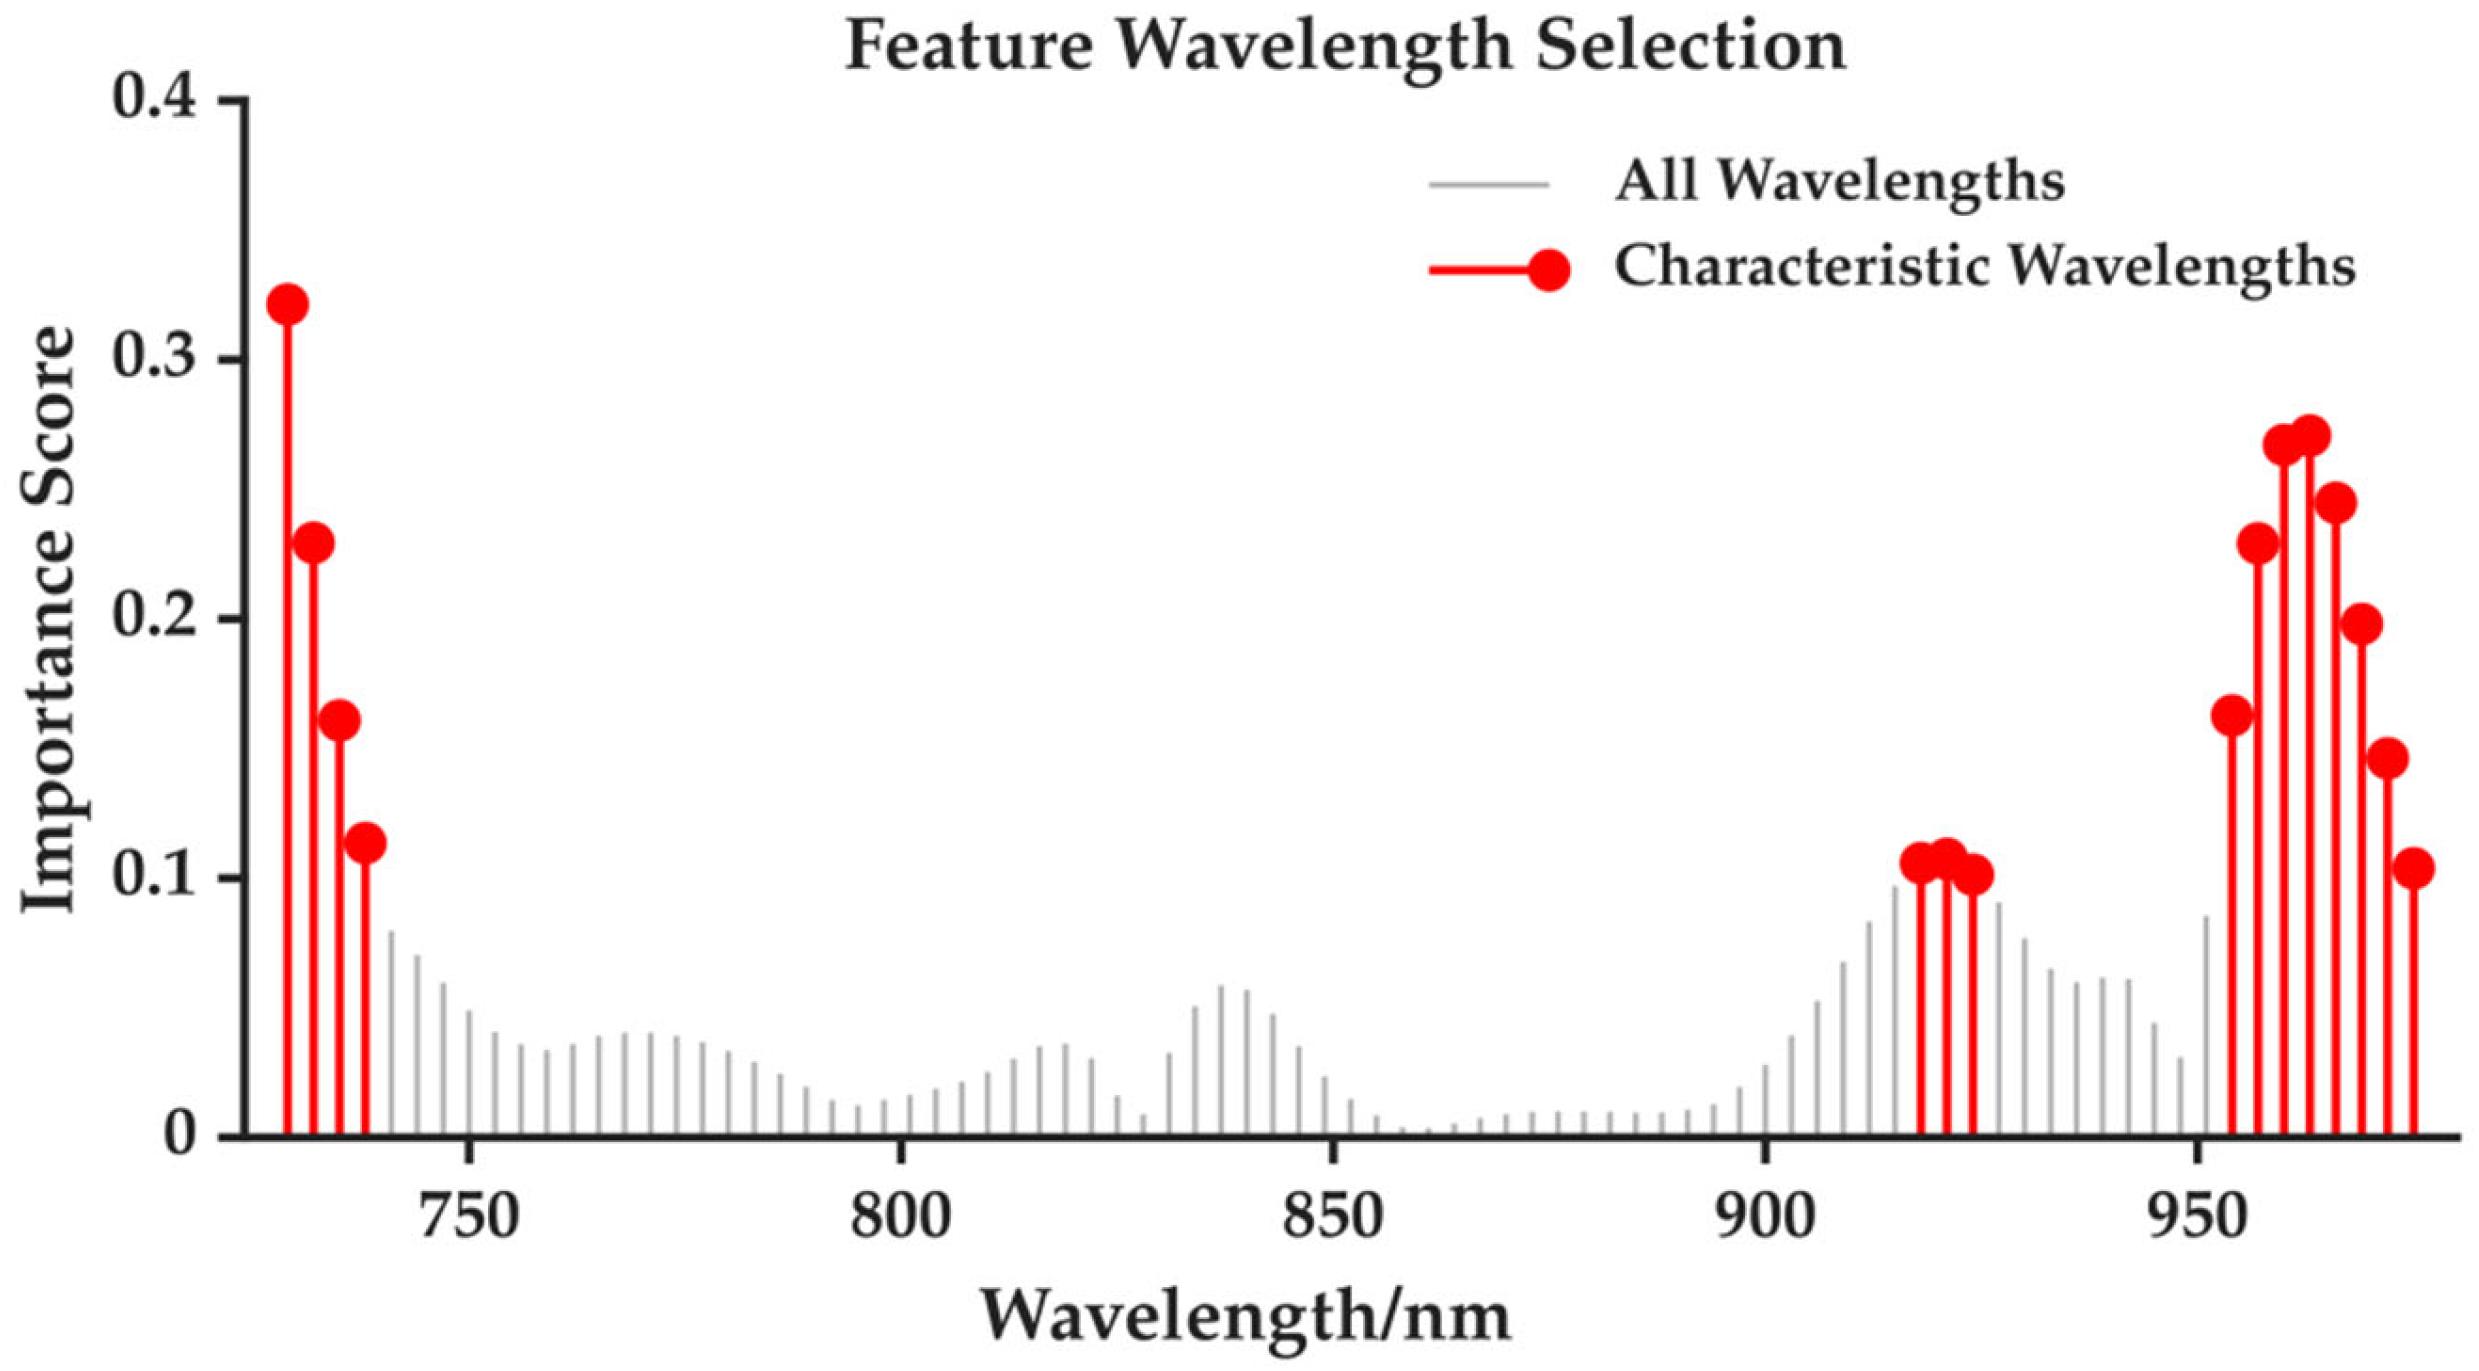
To decode the physicochemical underpinnings of the nonlinear models, 15 dominant characteristic wavelengths were prioritized via PCA-based weight analysis. As depicted in Figure 8, these variables are strategically clustered within three functionally distinct spectral regions:
The 954~975 nm region (O-H and C-H overtones): This cluster (eight wavelengths) represents the second overtone of O-H vibrations and the third overtone of C-H bonds. The high importance of 963 nm and 960 nm highlights the model’s reliance on sugar–water dynamics, which are pivotal for predicting SSC and textural changes (firmness) during ripening [50].
The 729~738 nm region (the red-edge transition): Situated at the Vis-NIR interface, this region—led by 729 nm—is highly responsive to the metabolic shift from chlorophyll degradation to anthocyanin synthesis in plum–apricot cultivars (‘Weidi’ and ‘Fengweimeigui’) [9].
The 918~924 nm region (carbohydrate fingerprints): Identified as a sugar-specific band in the SW-NIR range, these wavelengths correspond to C-H stretching modes. The model’s identification of these peaks validates that the BPNN architecture successfully captures intrinsic chemical signatures for sugar–acid ratio estimation [10].
Overall, these findings demonstrate that our BPNN and SVM models, despite their algorithmic complexity, operate on inputs with transparent biochemical relevance. The synergy between long-wave chemical information and red-edge phenotypic traits facilitates high-precision, non-destructive assessment [51]. This dual-domain feature extraction mechanism underpins the models’ superior performance in complex biological matrices, conforming to the rigorous interpretability standards of modern chemometrics.
Prominent absorption peaks and bands within the NIR region characterize the quality profiles of ‘Weidi’ and ‘Fengweimeigui’ fruits, establishing a definitive link between spectral response and fruit quality during the color-turning stage. This spectral–physicochemical relationship enables the development of reliable quantitative models for various attributes, including SSC, soluble sugars, TA, flavonoids, soluble protein, total phenols, dry matter, peel and flesh color coordinates, sugar-to-acid ratio, and firmness.

3.6. NIR Spectral Sample Set Partitioning

Based on the SPXY algorithm, the 640 specimens were divided into a training set and a prediction set at a 7:3 ratio (comprising 448 and 192 samples, respectively). The comprehensive statistical profiles are presented in Table 2 The data demonstrate that the distribution ranges for each quality indicator in the training set were highly congruent with those in the prediction set. The SSC in the training and prediction sets ranged from 9.03% to 23.17% and 9.30% to 23.11%, respectively. The VC content varied from 9.53 to 41.29 mg/100 g and 10.03 to 40.89 mg/100 g, respectively. The SS content ranged from 6.37% to 10.84% and 6.44% to 10.64%, respectively. The TA content ranged from 1.38% to 2.41% and 1.43% to 2.39%, respectively, with sugar–acid ratios ranging from 2.64 to 6.17 and 2.70 to 6.14, respectively. The soluble protein content ranged from 0.40 to 1.62 mg/g and 0.40 to 1.54 mg/g, respectively, while the flavonoid content ranged from 0.41 to 1.79 mg/g and 0.48 to 1.73 mg/g, respectively. The total phenolic content ranged from 0.75 to 1.58 mg/g and 0.76 to 1.55 mg/g, and the dry matter content ranged from 22.37% to 38.91% and 22.37% to 36.48%. The firmness values ranged from 5.99 to 46.01 N and 6.17 to 46.01 N, and peel L* values ranged from 27.23 to 57.41 and 29.34 to 56.31, peel a* values from −12.81 to 10.23 and −12.41 to 9.27, and peel b* values from −7.05 to 30.80 and −4.78 to 29.52. The flesh L* values ranged from 22.37 to 55.99 in both cases. The flesh a* values ranged from −3.20 to 32.61 and −3.20 to 28.37, respectively, and the flesh b* values ranged from 3.76 to 33.13 in both instances. Overall, the training set demonstrated excellent representativeness, with negligible discrepancies in statistical features (e.g., mean and standard deviation) between the two subsets. These findings confirm that the SPXY-based partitioning was robust and appropriate, providing a solid foundation for subsequent model development and performance evaluation.

3.7. Development of Apricot–Plum Quality Prediction Models

Machine learning models were employed to predict changes in 16 key internal quality indicators of apricot–plum fruits—including SSC, VC, SS, titratable acids, flavonoids, soluble proteins, total phenols, dry matter content, skin-flesh color difference, sugar–acid ratio, and firmness—from the color change stage through ripening. Based on different stages of apricot–plum fruit maturity, BPNN and SVM models were developed to predict fruit quality, aiming to identify the optimal prediction model.
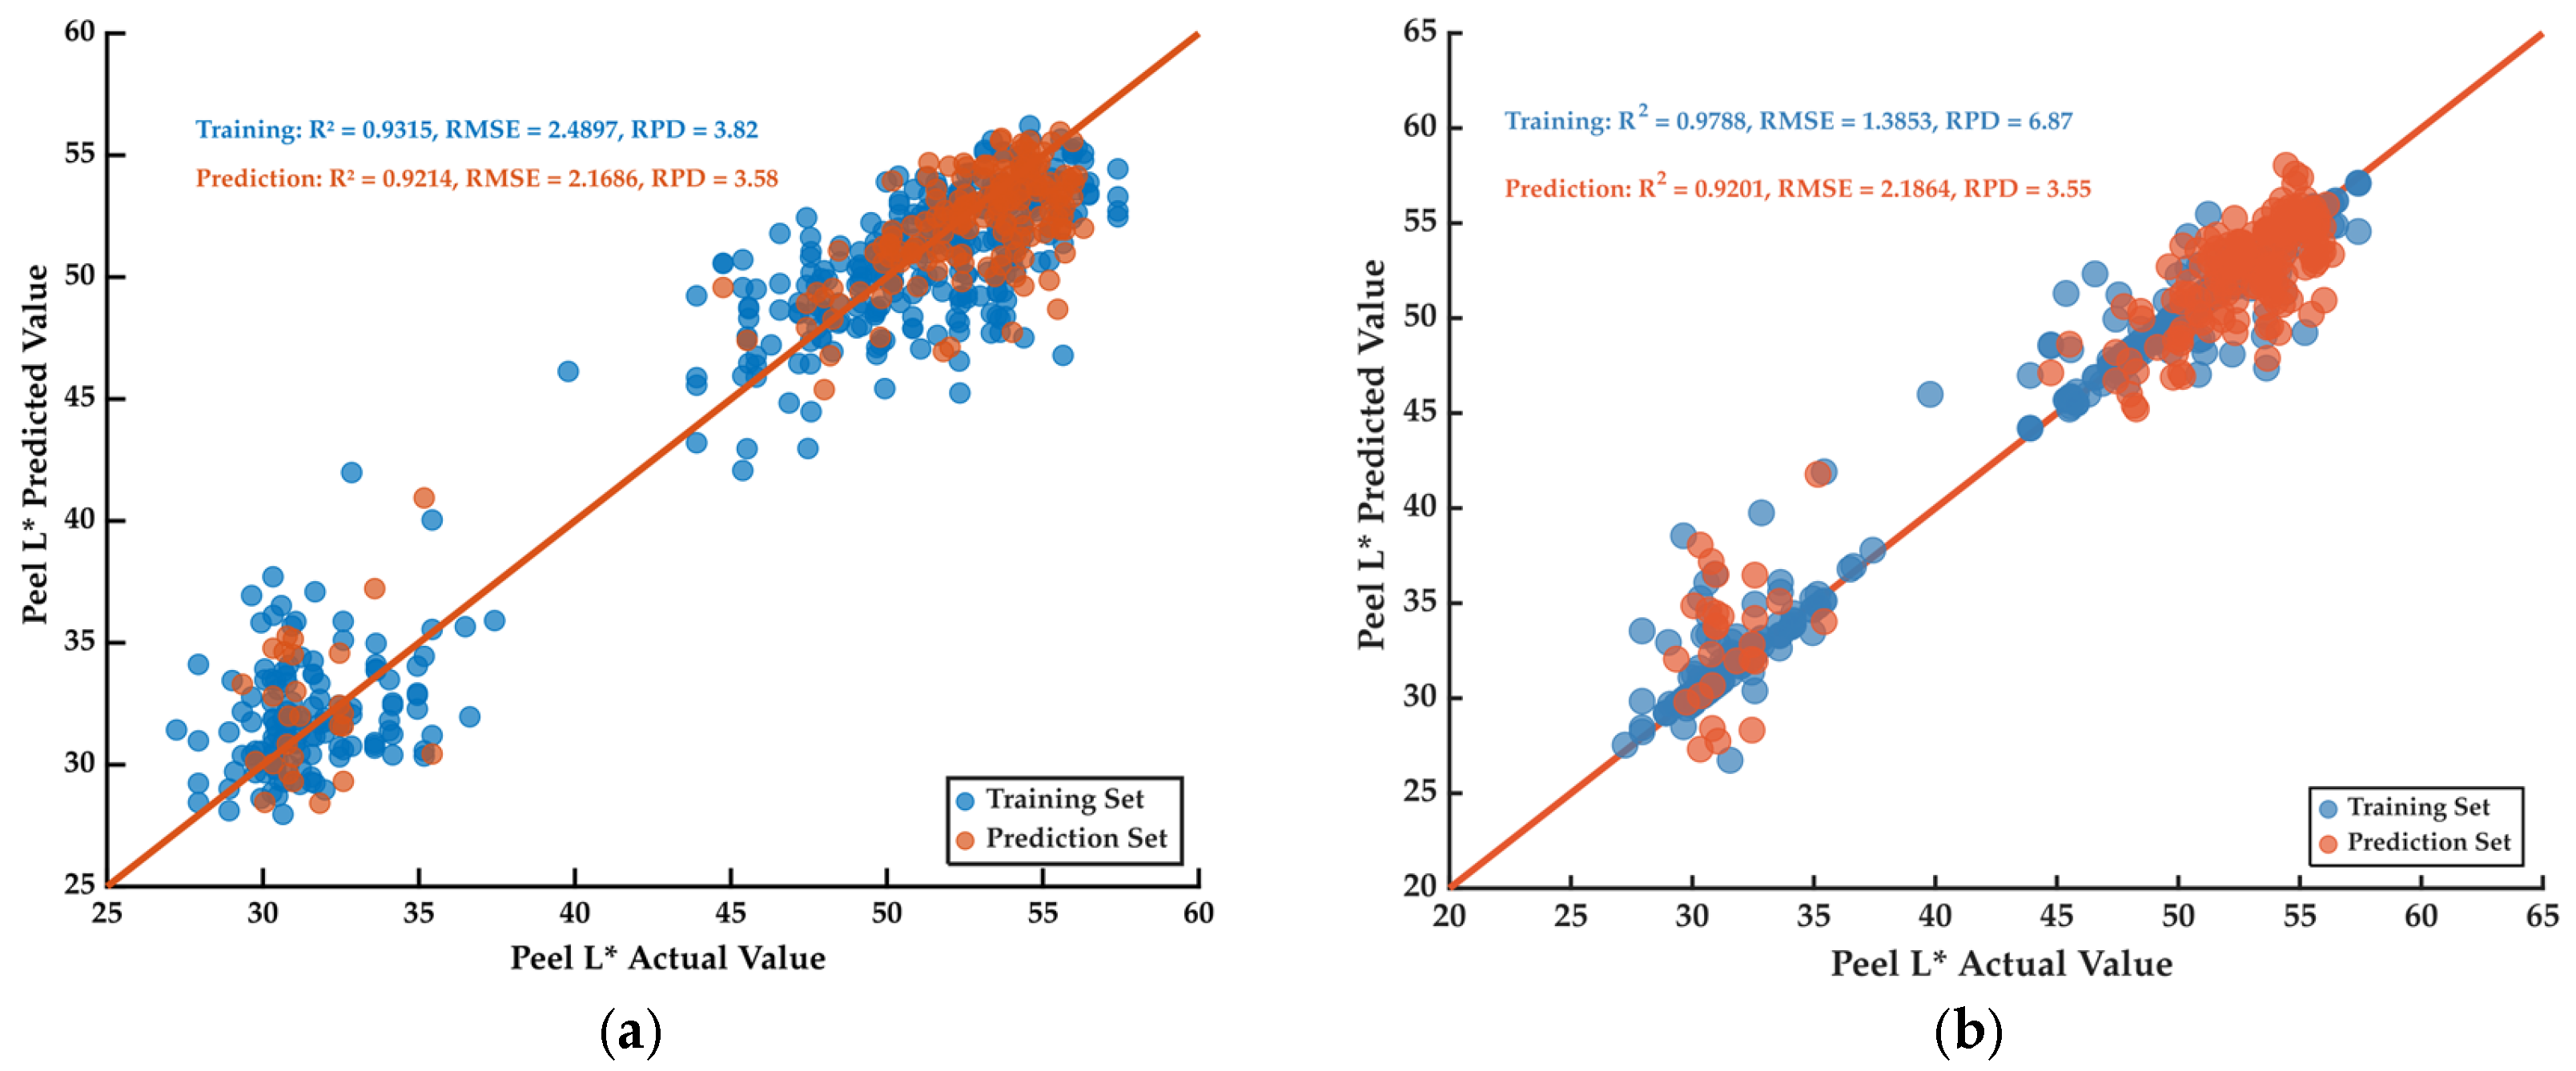
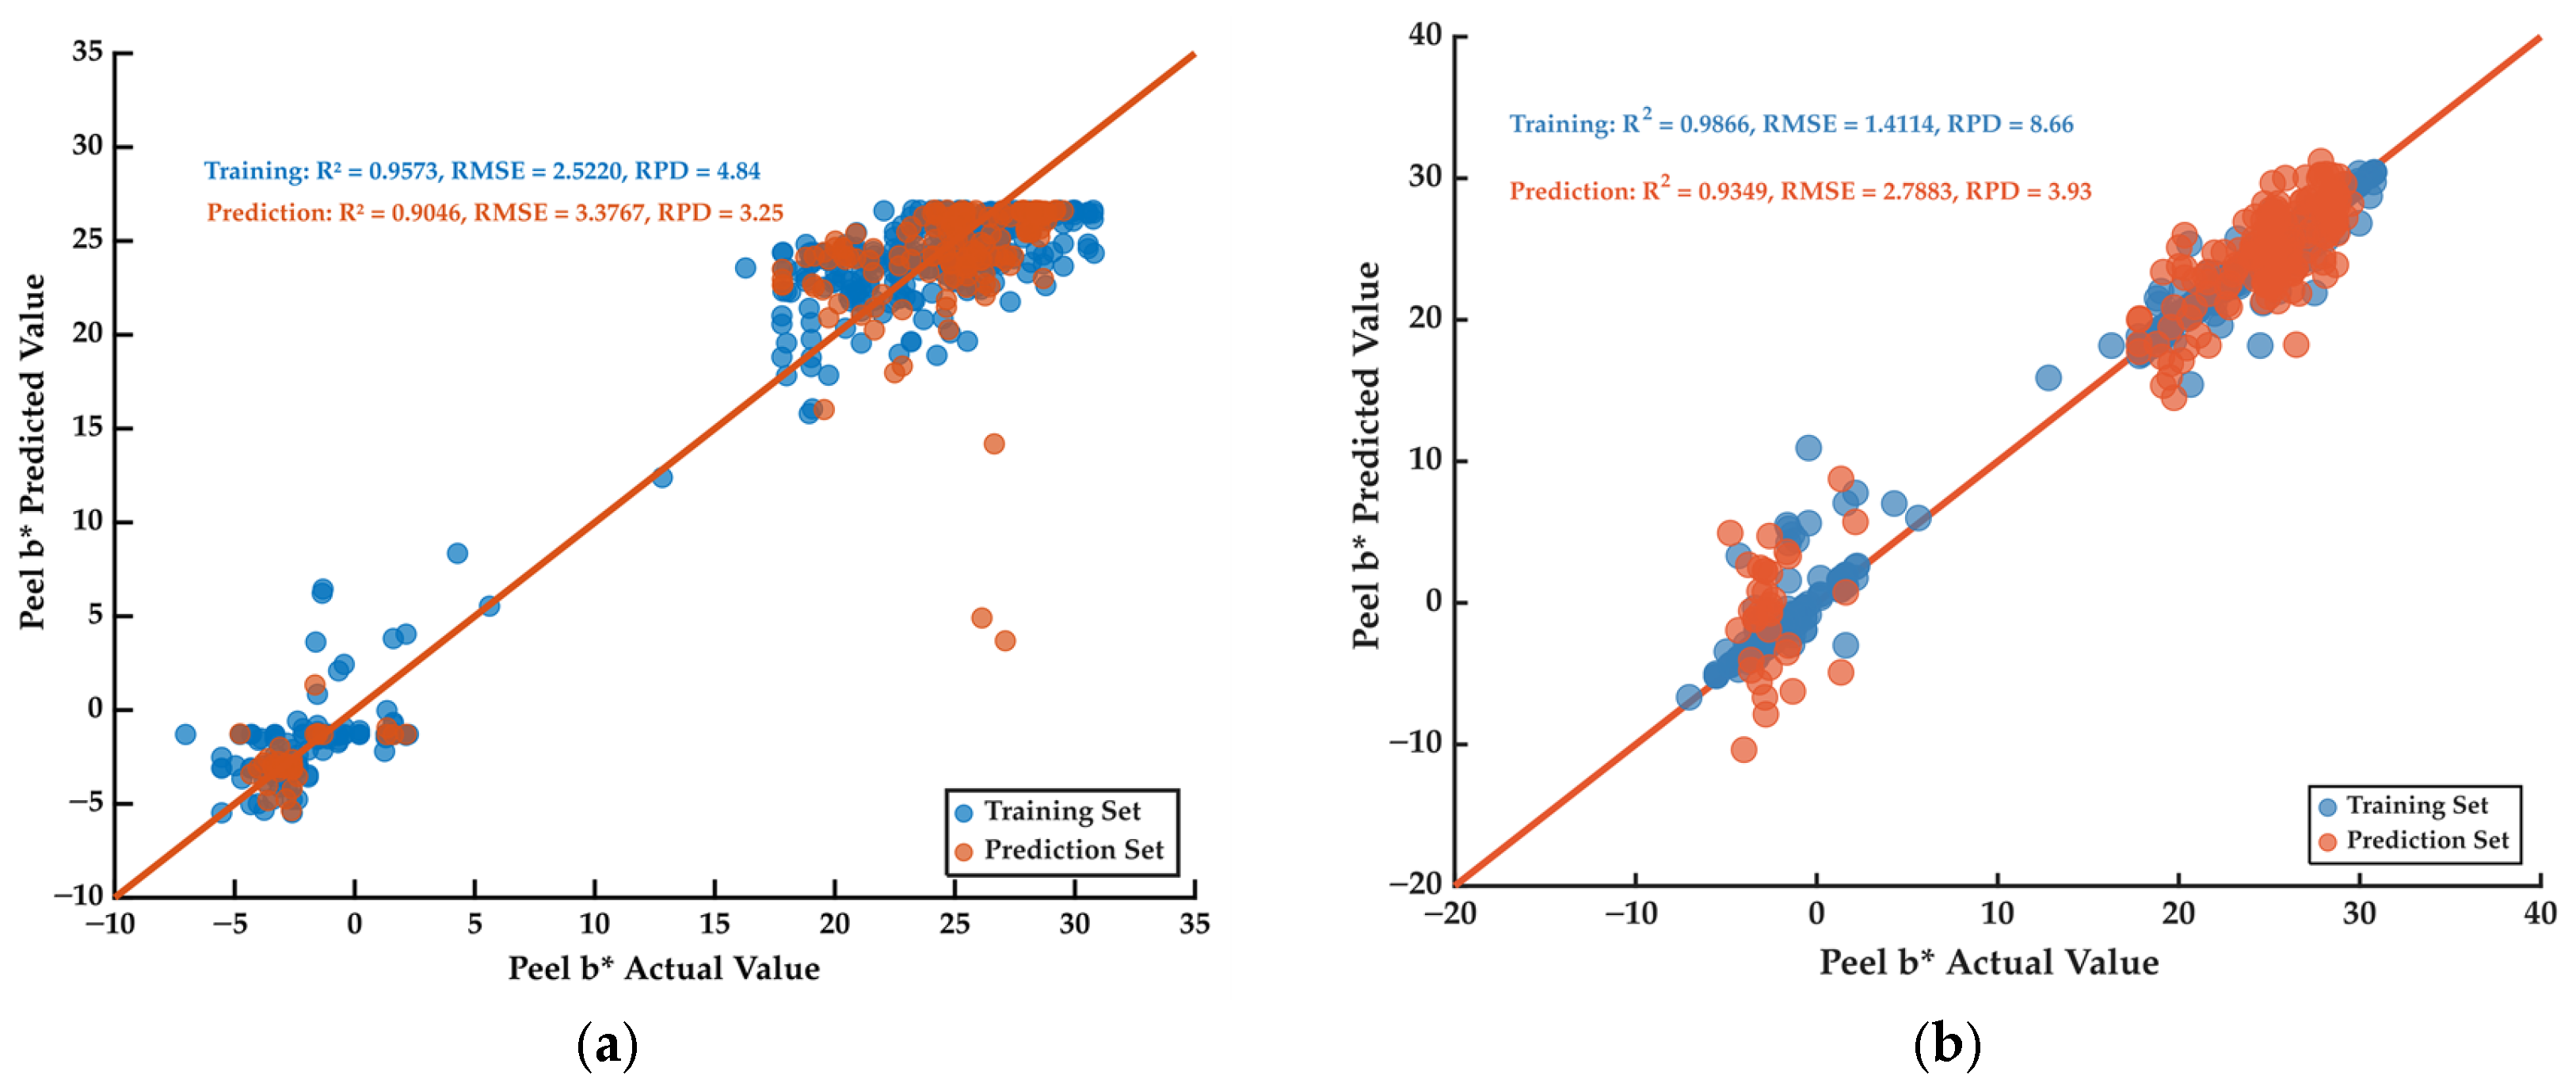
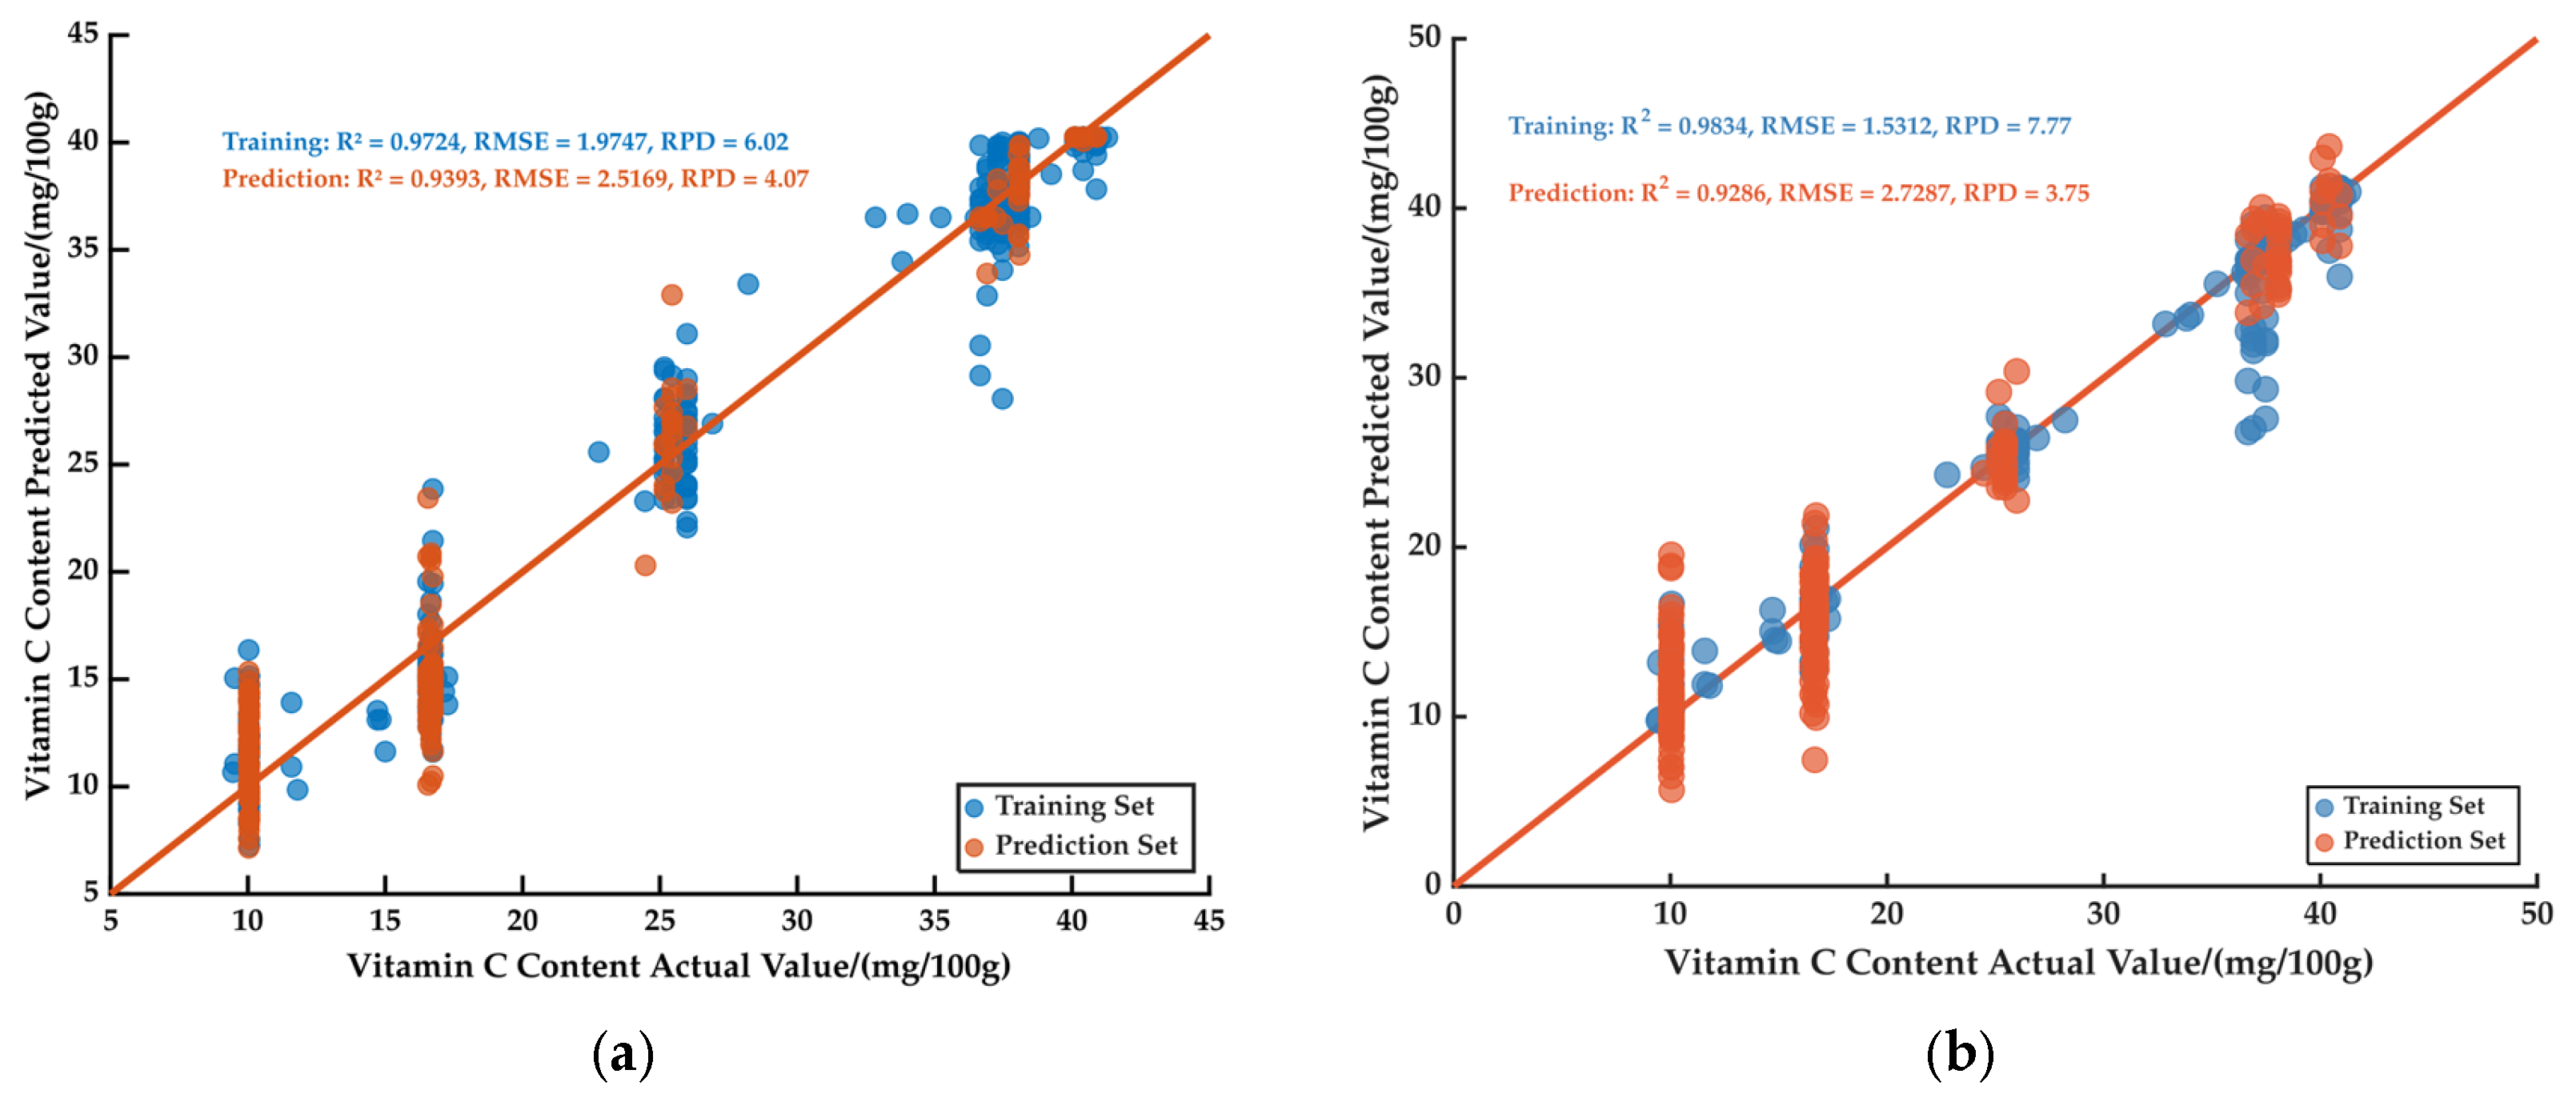
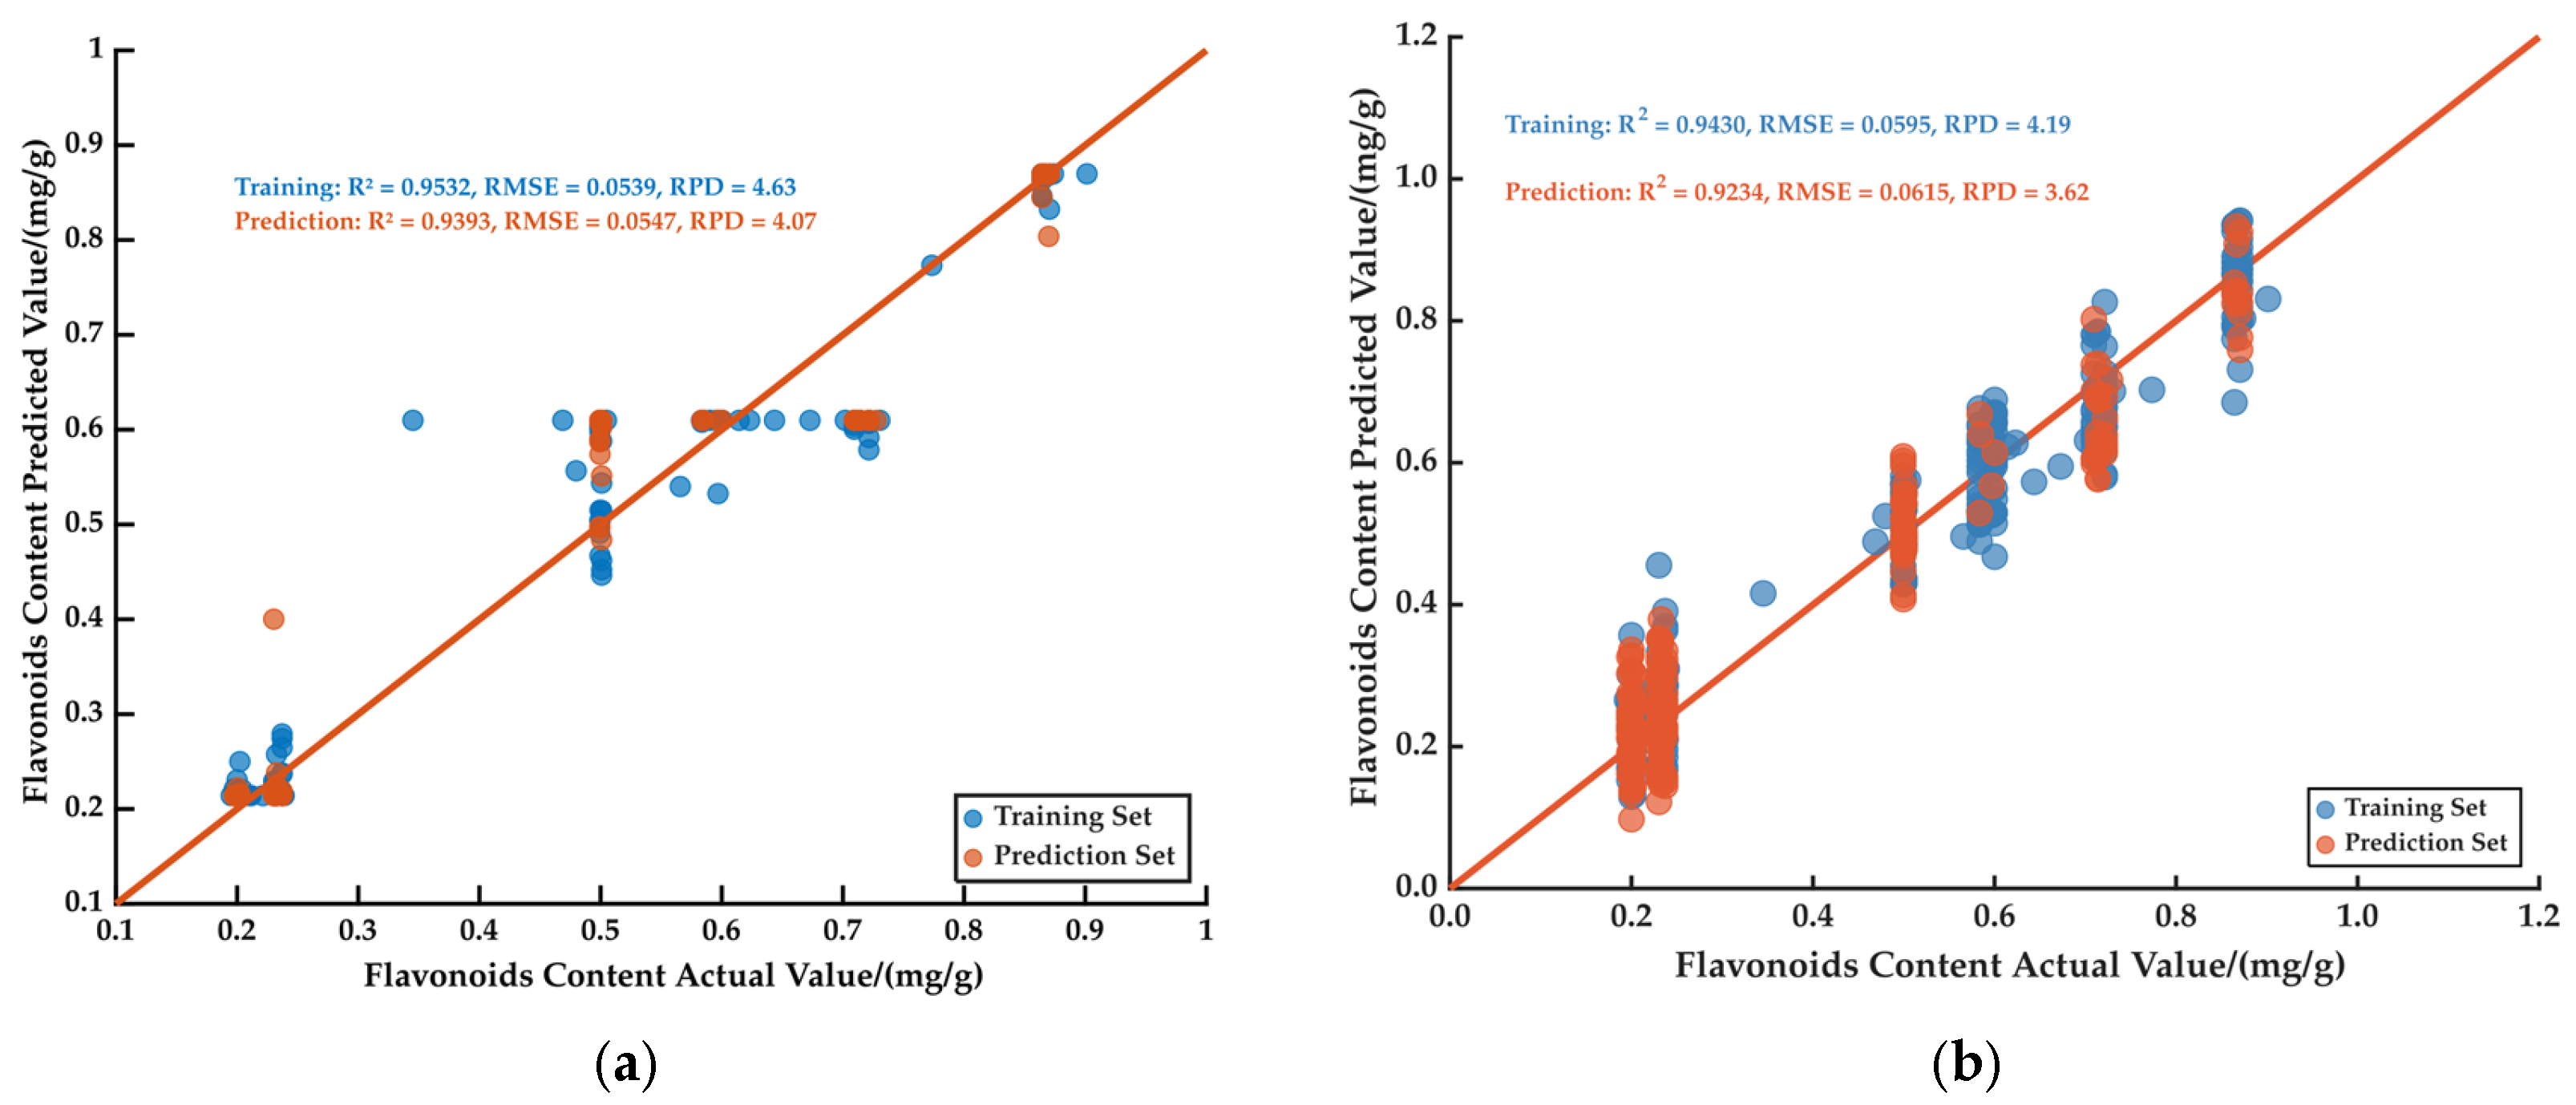
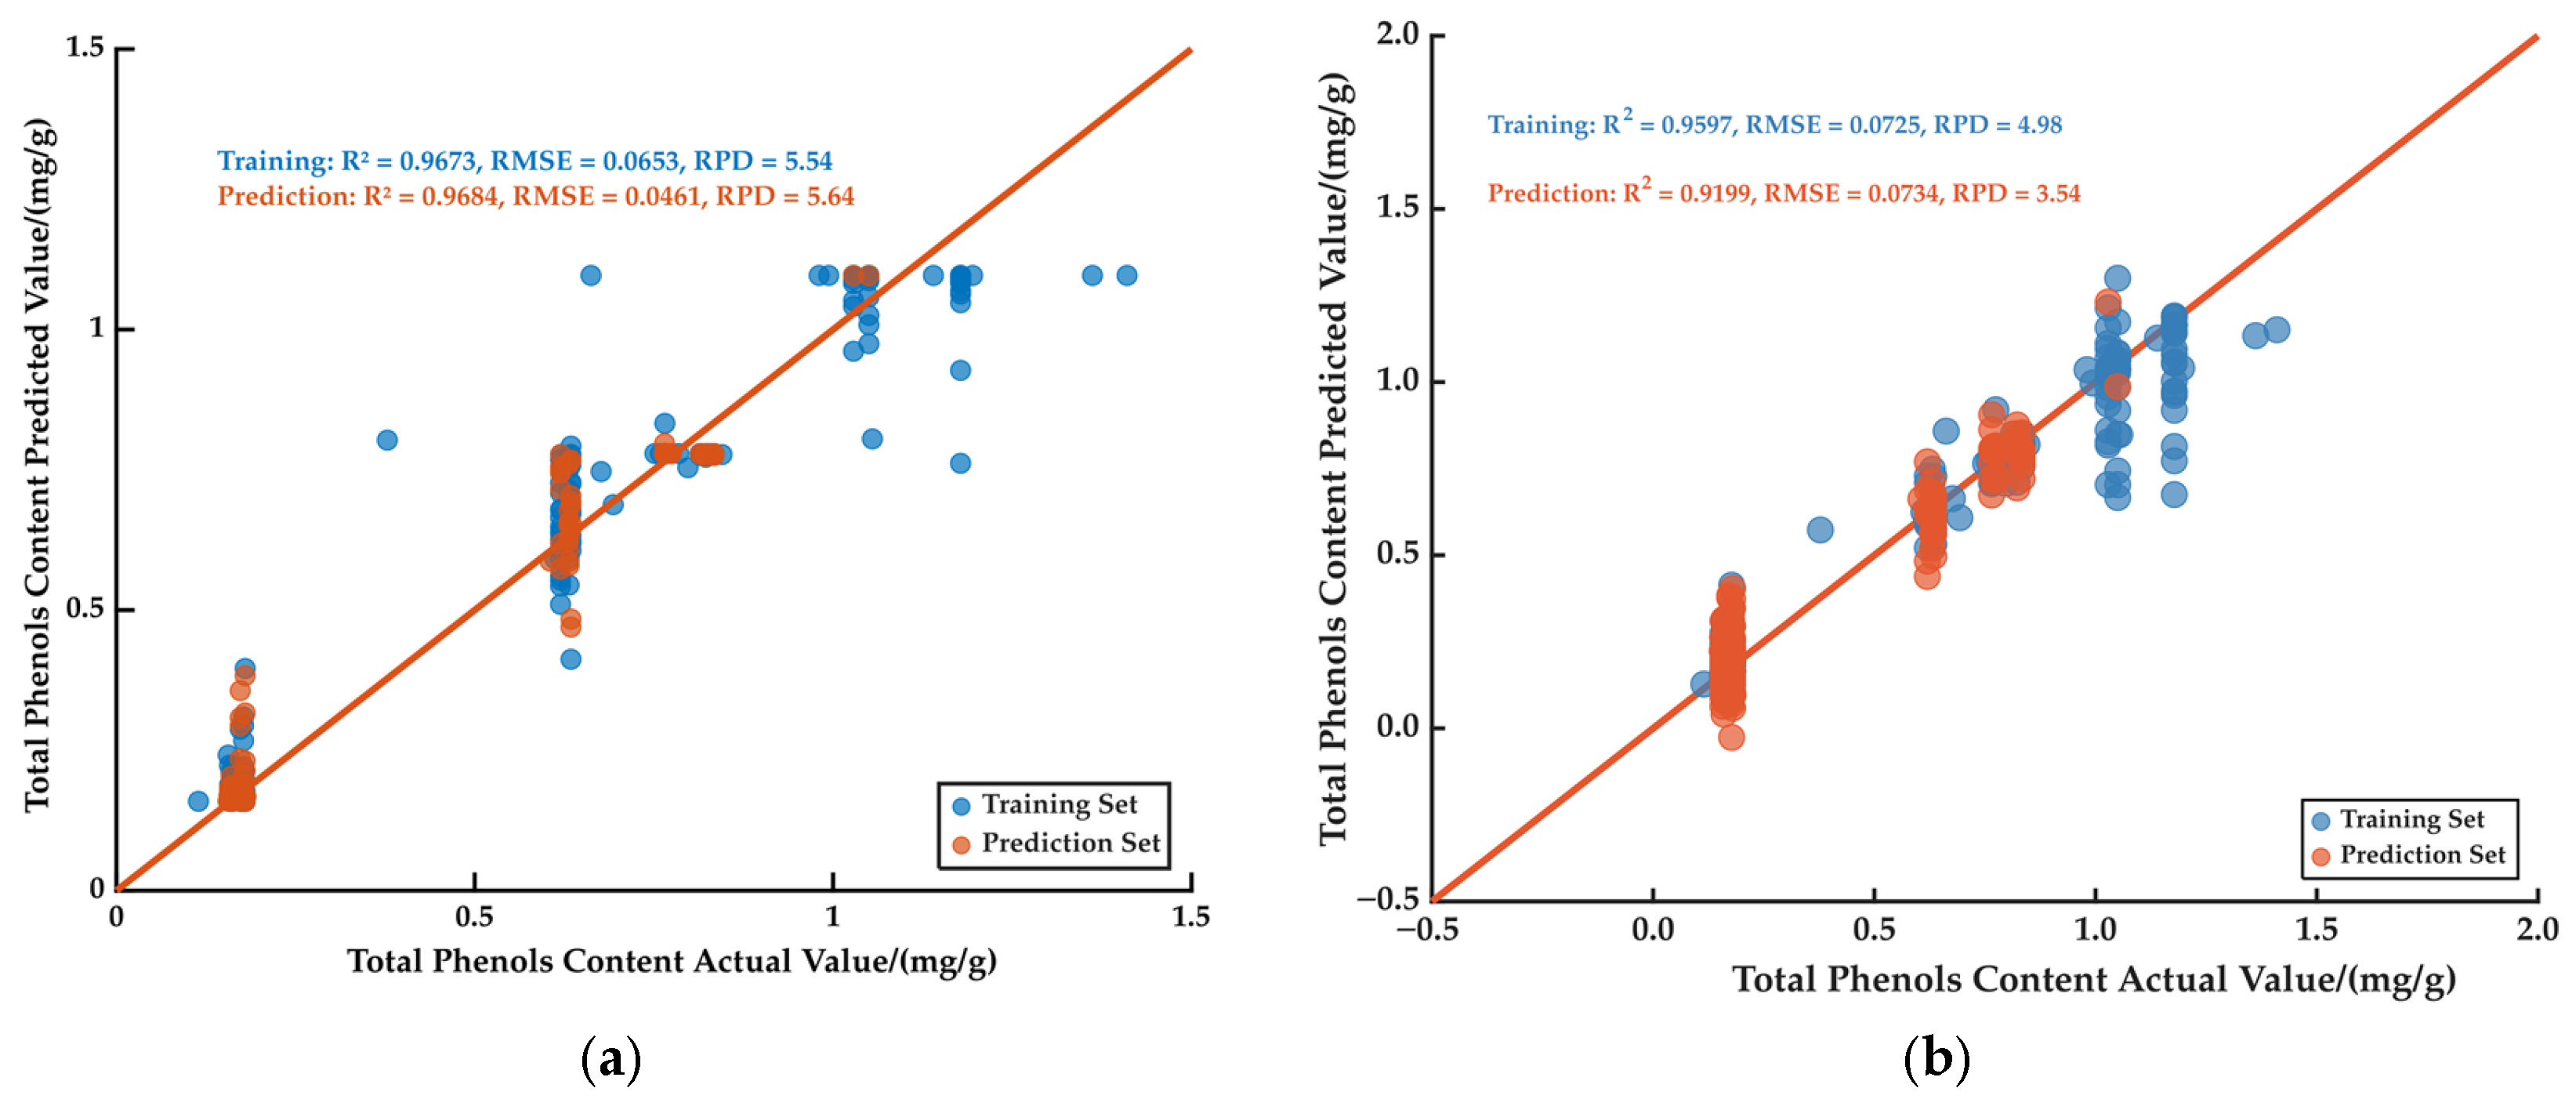
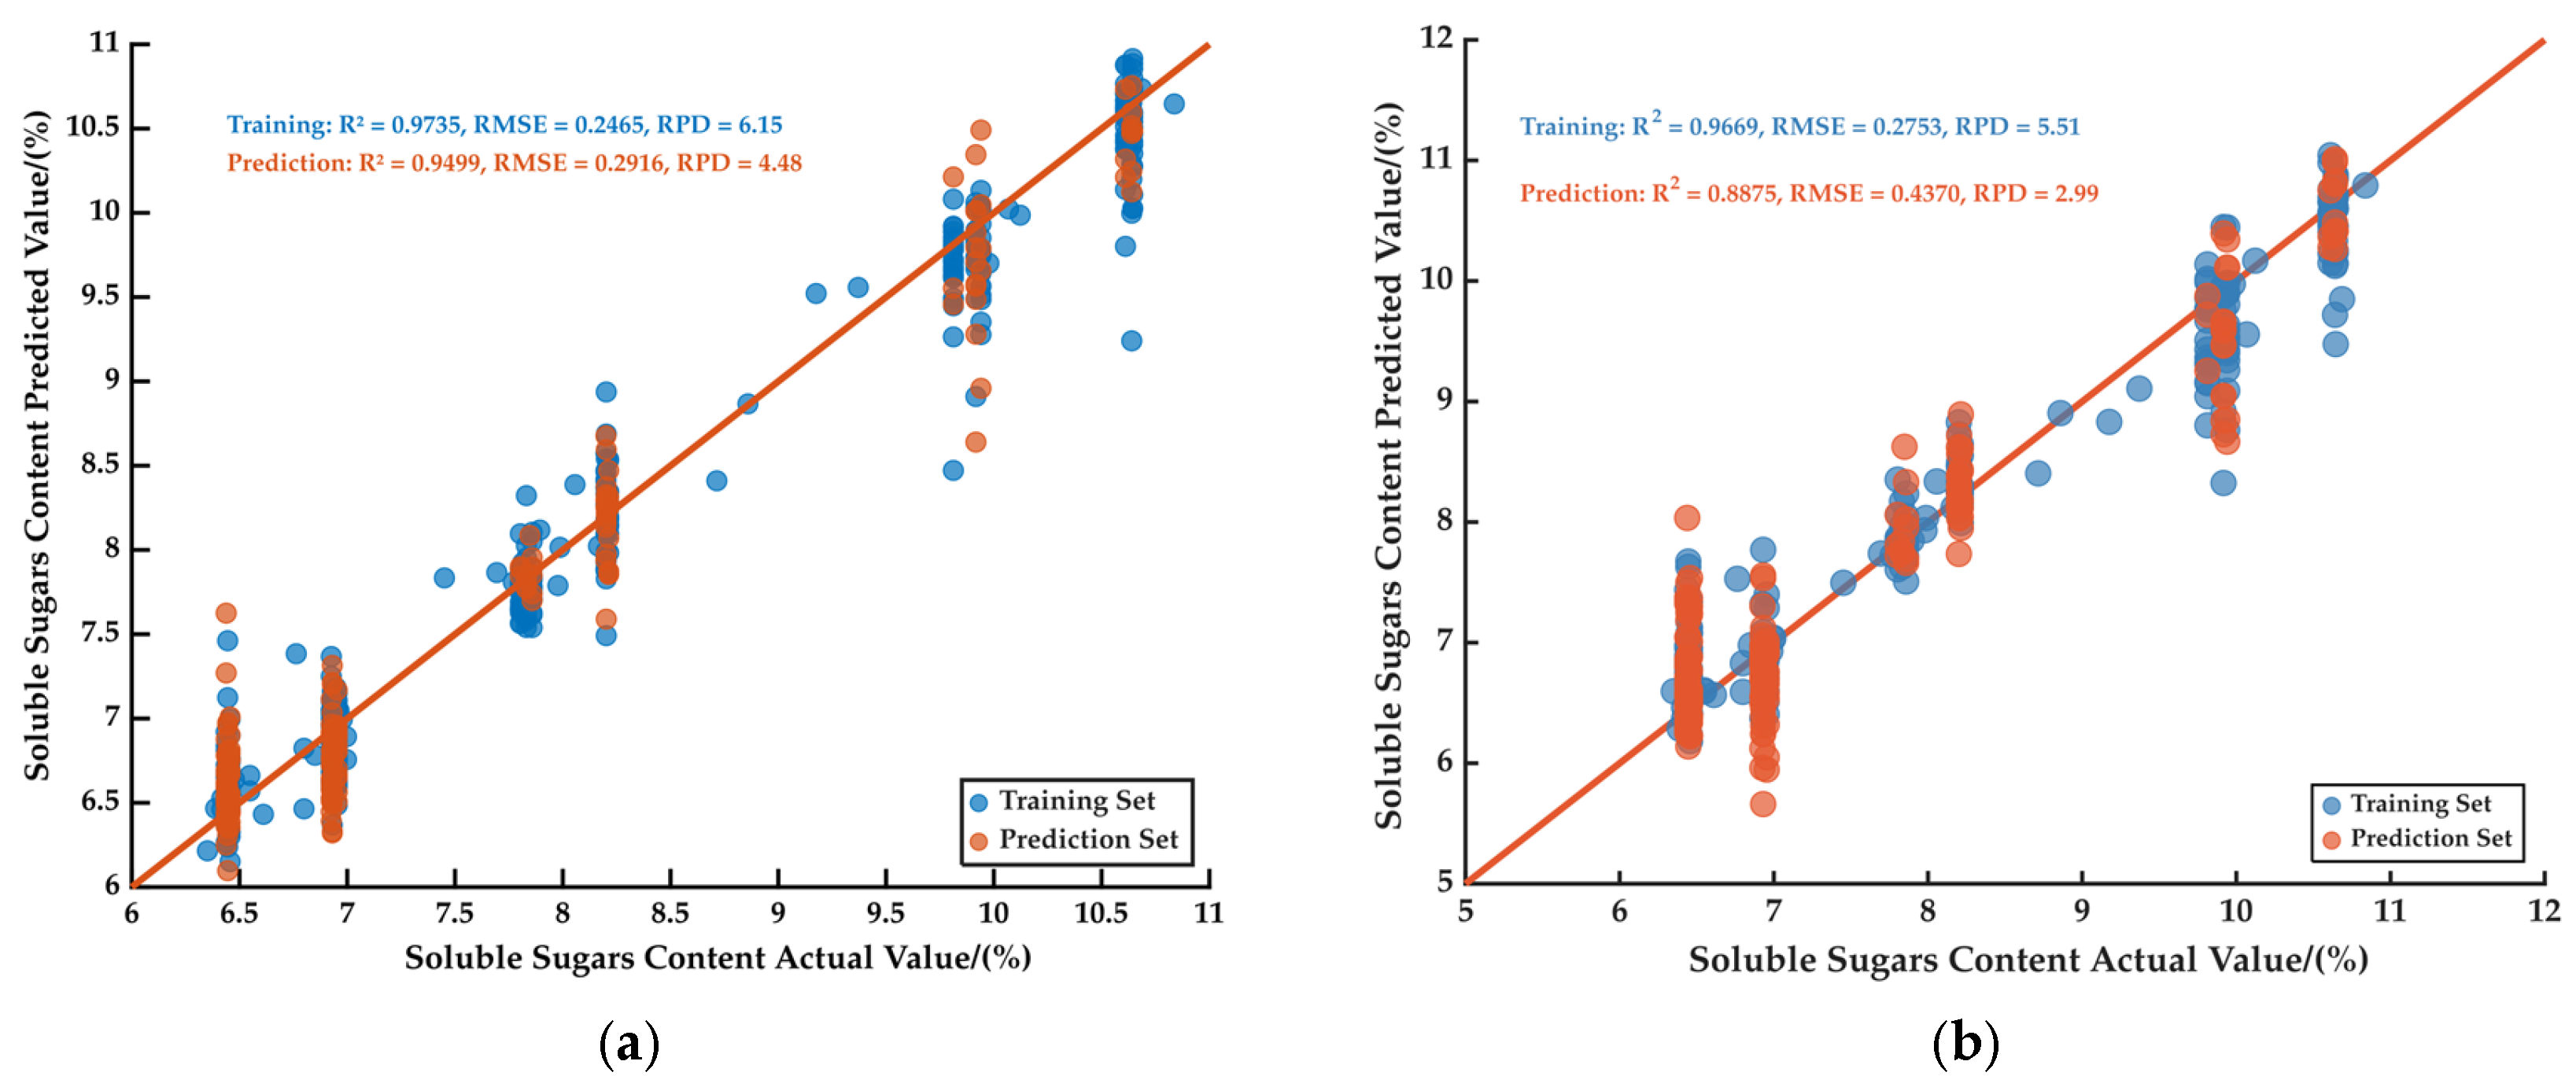
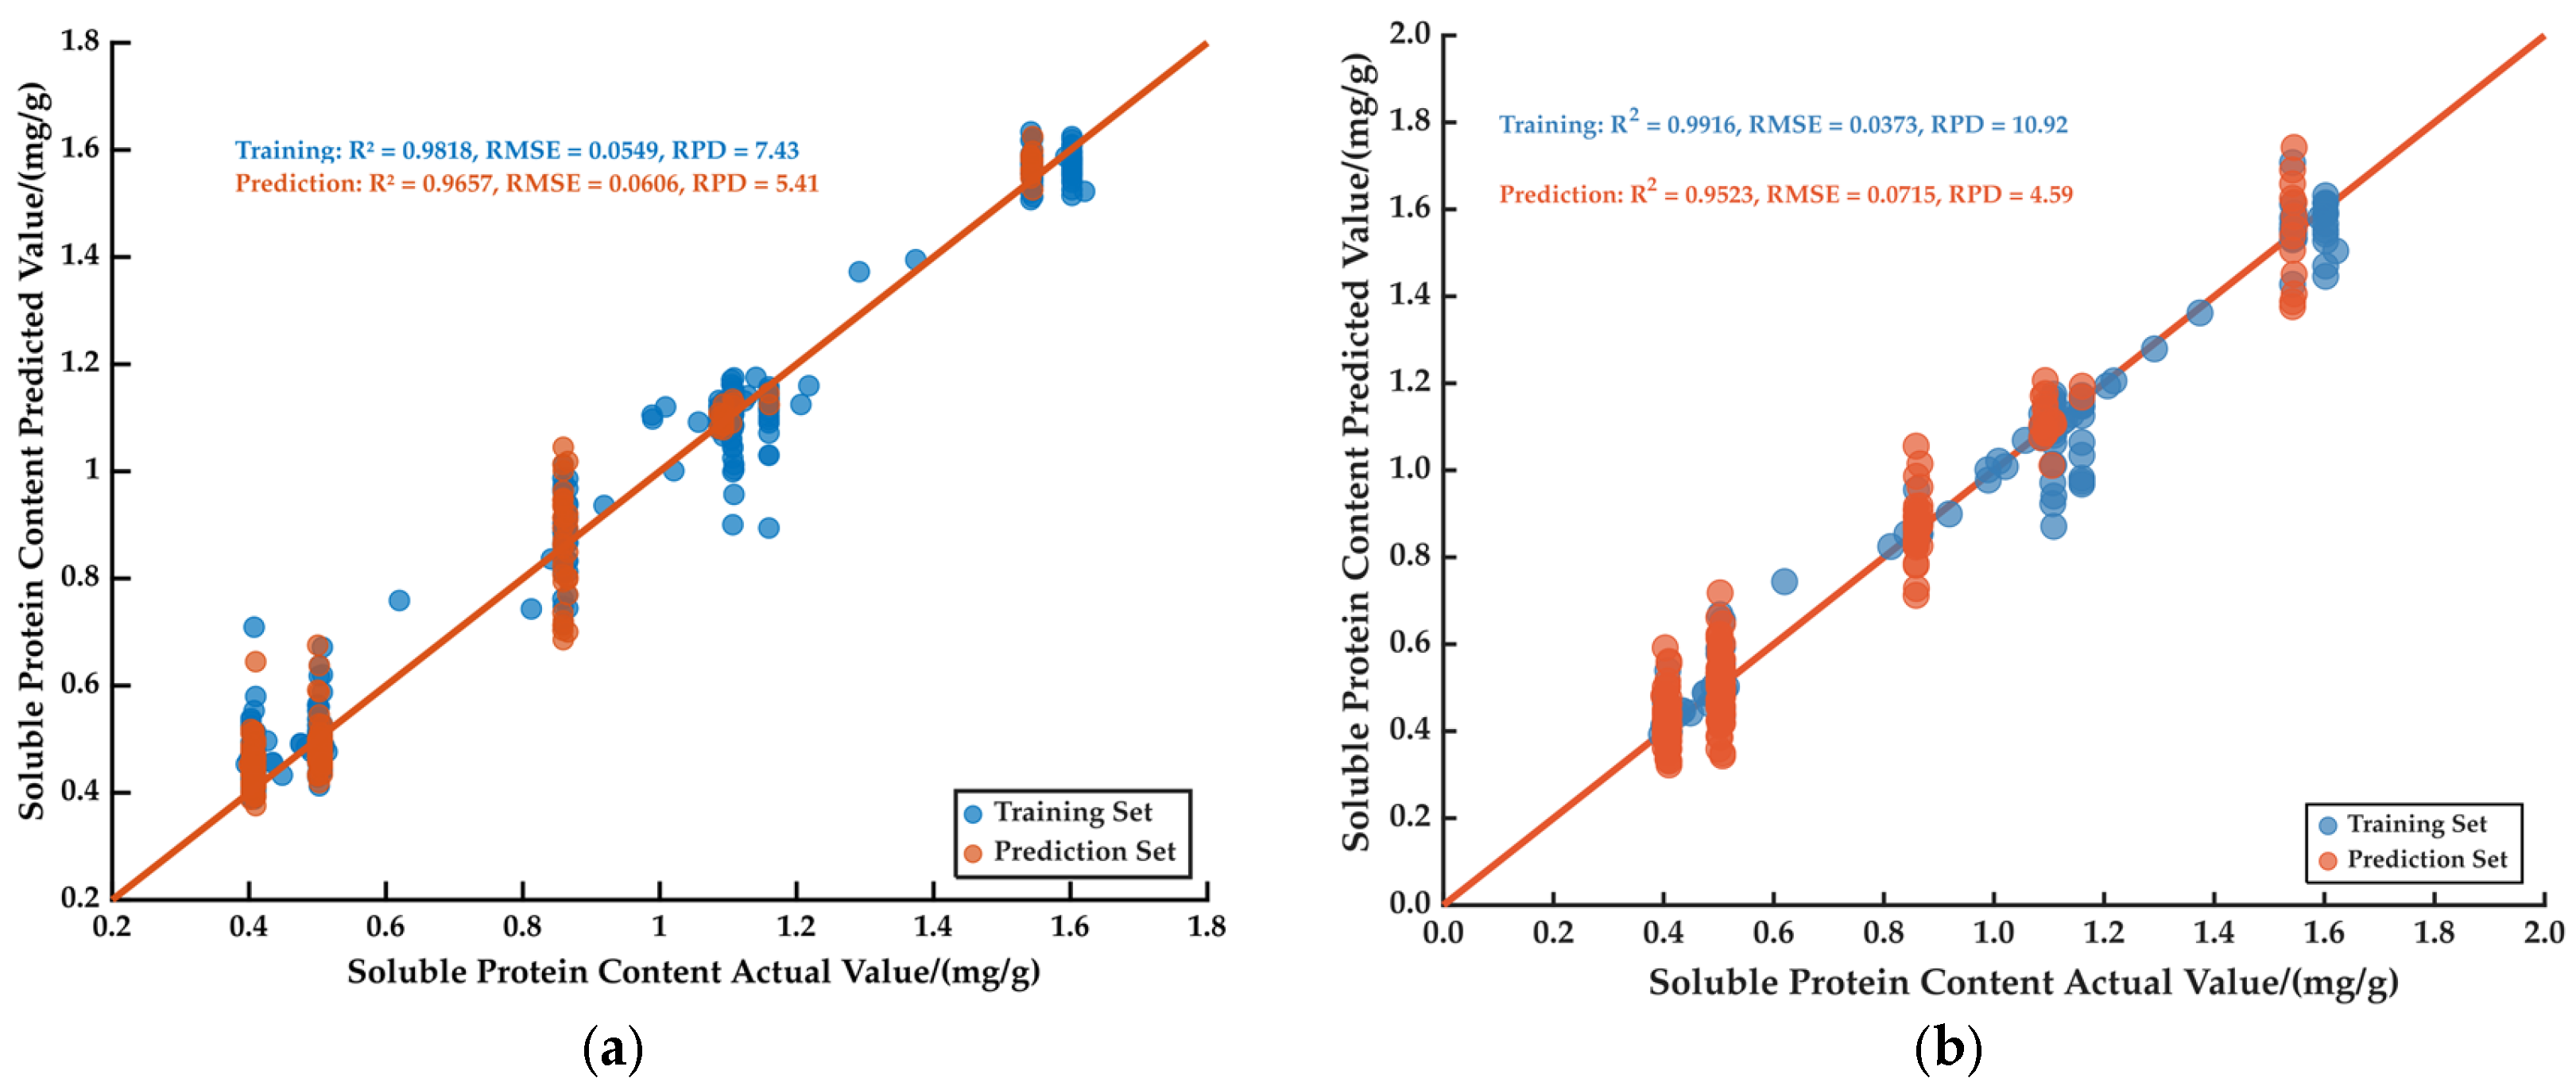
Figure 9a presents the BPNN model for the peel L* of apricot–plum fruit, with an R P 2 of 0.921, an RMSEP of 2.169, and an RPD of 3.58. Figure 10a shows the BPNN model for peel b*, yielding an R P 2 of 0.905, an RMSEP of 3.377, and an RPD of 3.25. The BPNN model for vitamin C content is illustrated in Figure 11a, with an R P 2 of 0.939, an RMSEP of 2.517, and an RPD of 4.07. As shown in Figure 12a, the BPNN model for flavonoid content achieved an R P 2 of 0.939, an RMSEP of 0.055, and an RPD of 4.07. Figure 13a depicts the BPNN model for the total phenols content, with an R P 2 of 0.968, an RMSEP of 0.046, and an RPD of 5.64. The BPNN model for soluble sugars content (Figure 14a) exhibited an R P 2 of 0.950, an RMSEP of 0.292, and an RPD of 4.48, while the model for soluble protein content shown in Figure 15a achieved an R P 2 of 0.966, an RMSEP of 0.061, and an RPD of 5.41. Overall, all these BPNN models exhibited RPD values greater than 3.0, indicating very high predictive accuracy and stability. The overall prediction performance reached an excellent level, enabling reliable evaluation of peel L*, peel b*, vitamin C content, flavonoids content, total phenols content, soluble sugars content, and soluble protein content in apricot–plum fruit. Figure 9b illustrates the SVM model for peel L*, with an R P 2 of 0.920 and an RMSEP of 2.186. The SVM model for peel b* (Figure 10b) yielded an R P 2 of 0.935 and an RMSEP of 2.788. As shown in Figure 11b, the SVM model for vitamin C content achieved an R P 2 of 0.929 and an RMSEP of 2.729. The SVM models for flavonoid content and soluble protein content, shown in Figure 12b and Figure 15b, exhibited R P 2 values of 0.923 and 0.952 and RMSEP values of 0.062 and 0.071, respectively. All these models showed RPD values greater than 3.0, indicating relatively high predictive accuracy and stability. In contrast, the SVM models for total phenols content (Figure 13b) and soluble sugars content (Figure 14b) yielded RPD values between 2.5 and 3.0, suggesting moderate predictive performance, which was overall inferior to that of the corresponding BPNN models.
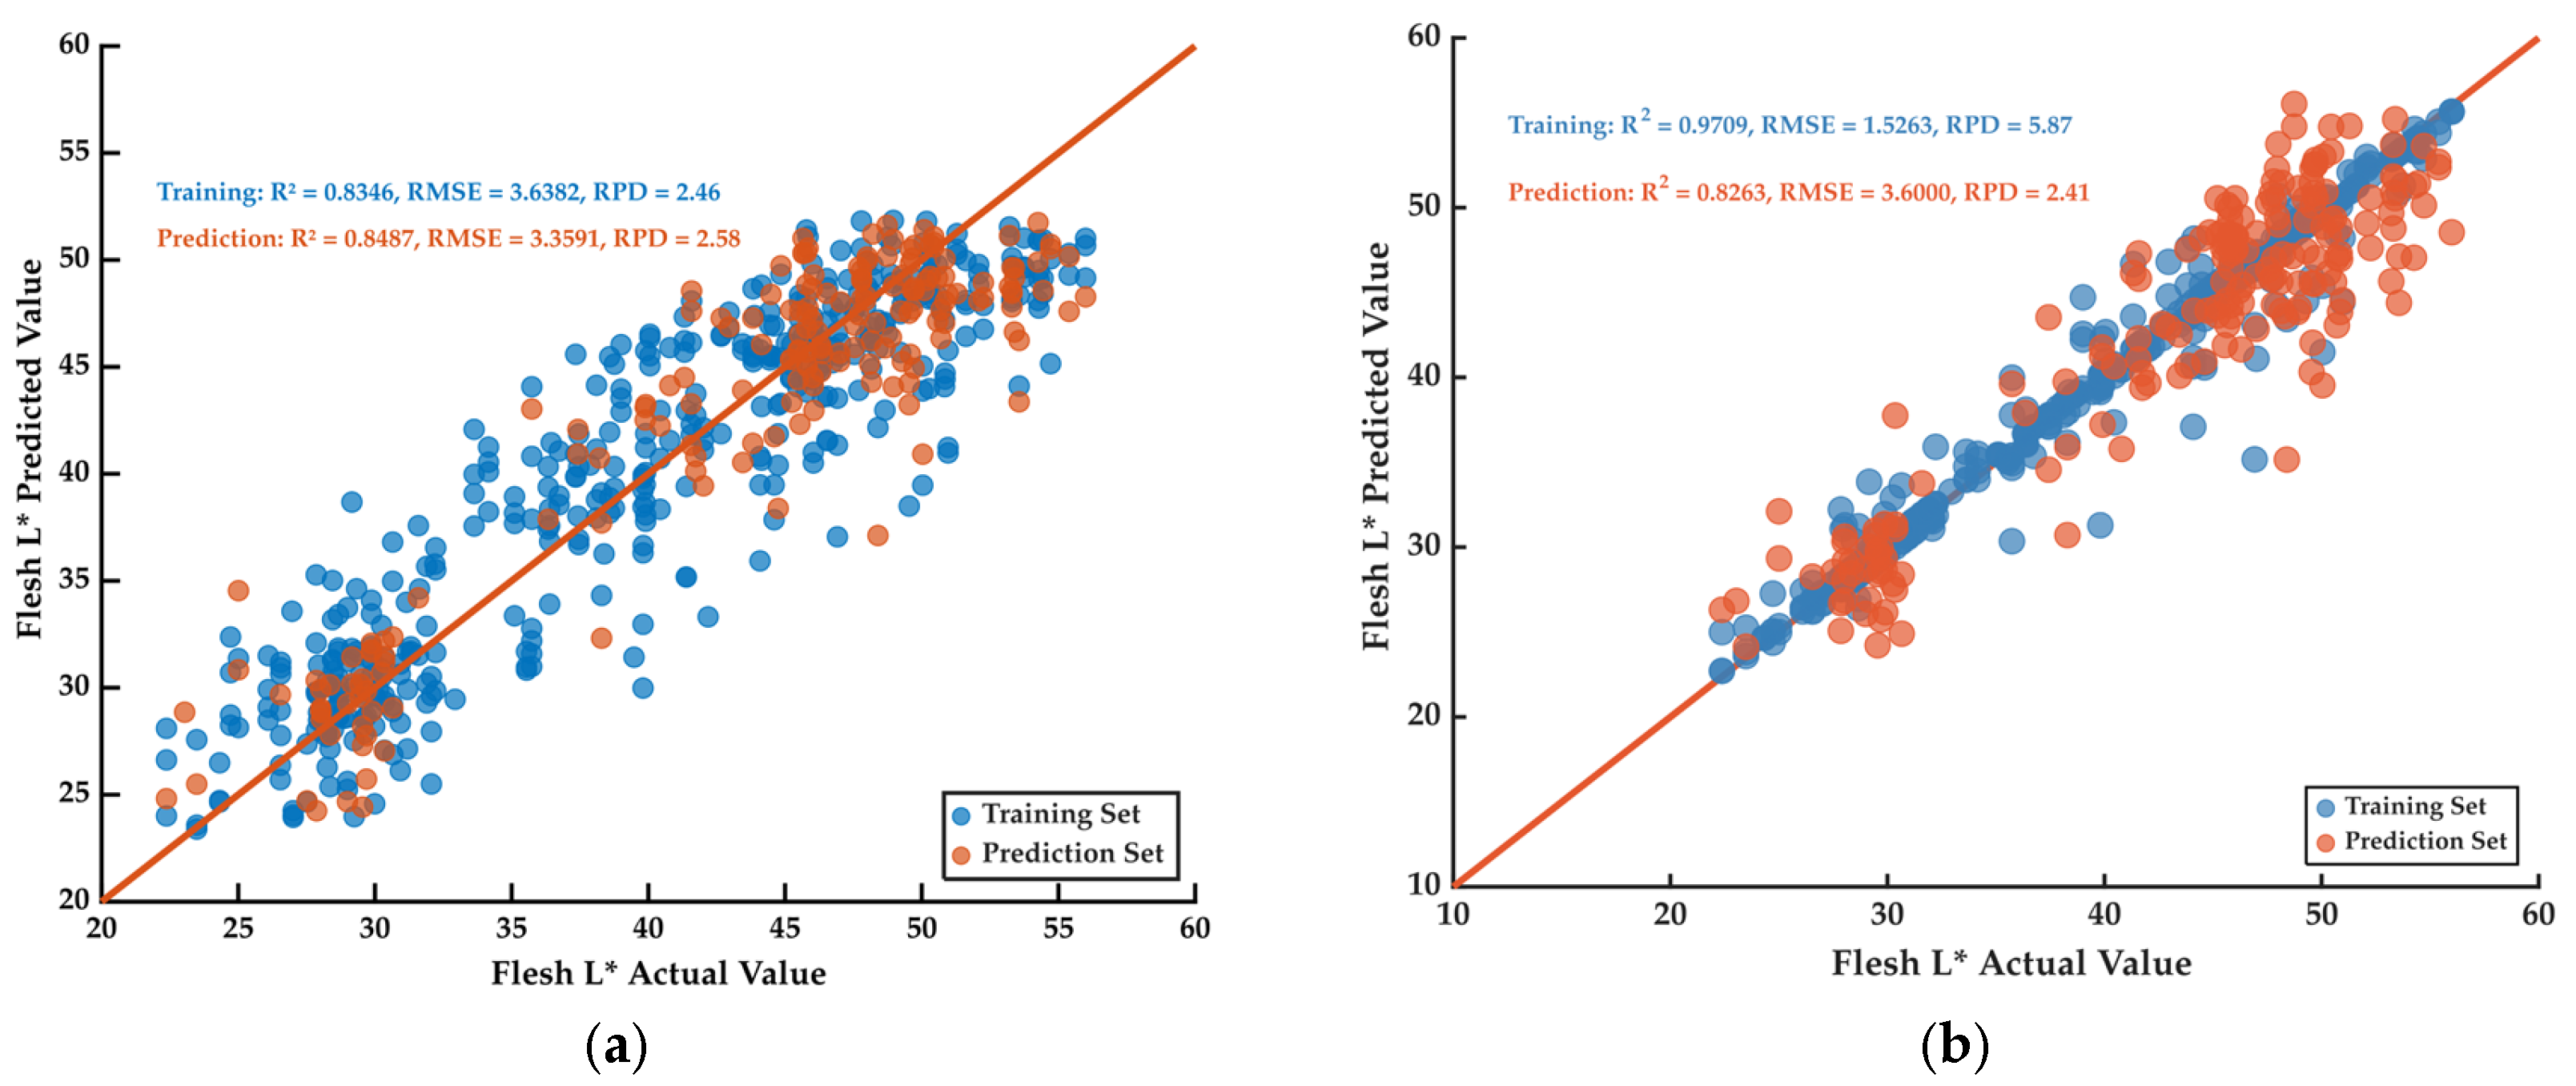
Figure 16a shows the BPNN model for flesh L*, with an R P 2 of 0.849, an RMSEP of 3.359, and an RPD of 2.58. As the RPD value exceeded 2.5, this model demonstrated relatively high accuracy and stability, with good overall predictive performance for evaluating flesh L* of apricot–plum fruit. In comparison, the SVM model for Flesh L* (Figure 16b) achieved an R P 2 of 0.827, an RMSEP of 3.600, and an RPD of 2.41, indicating lower predictive performance than the BPNN model.
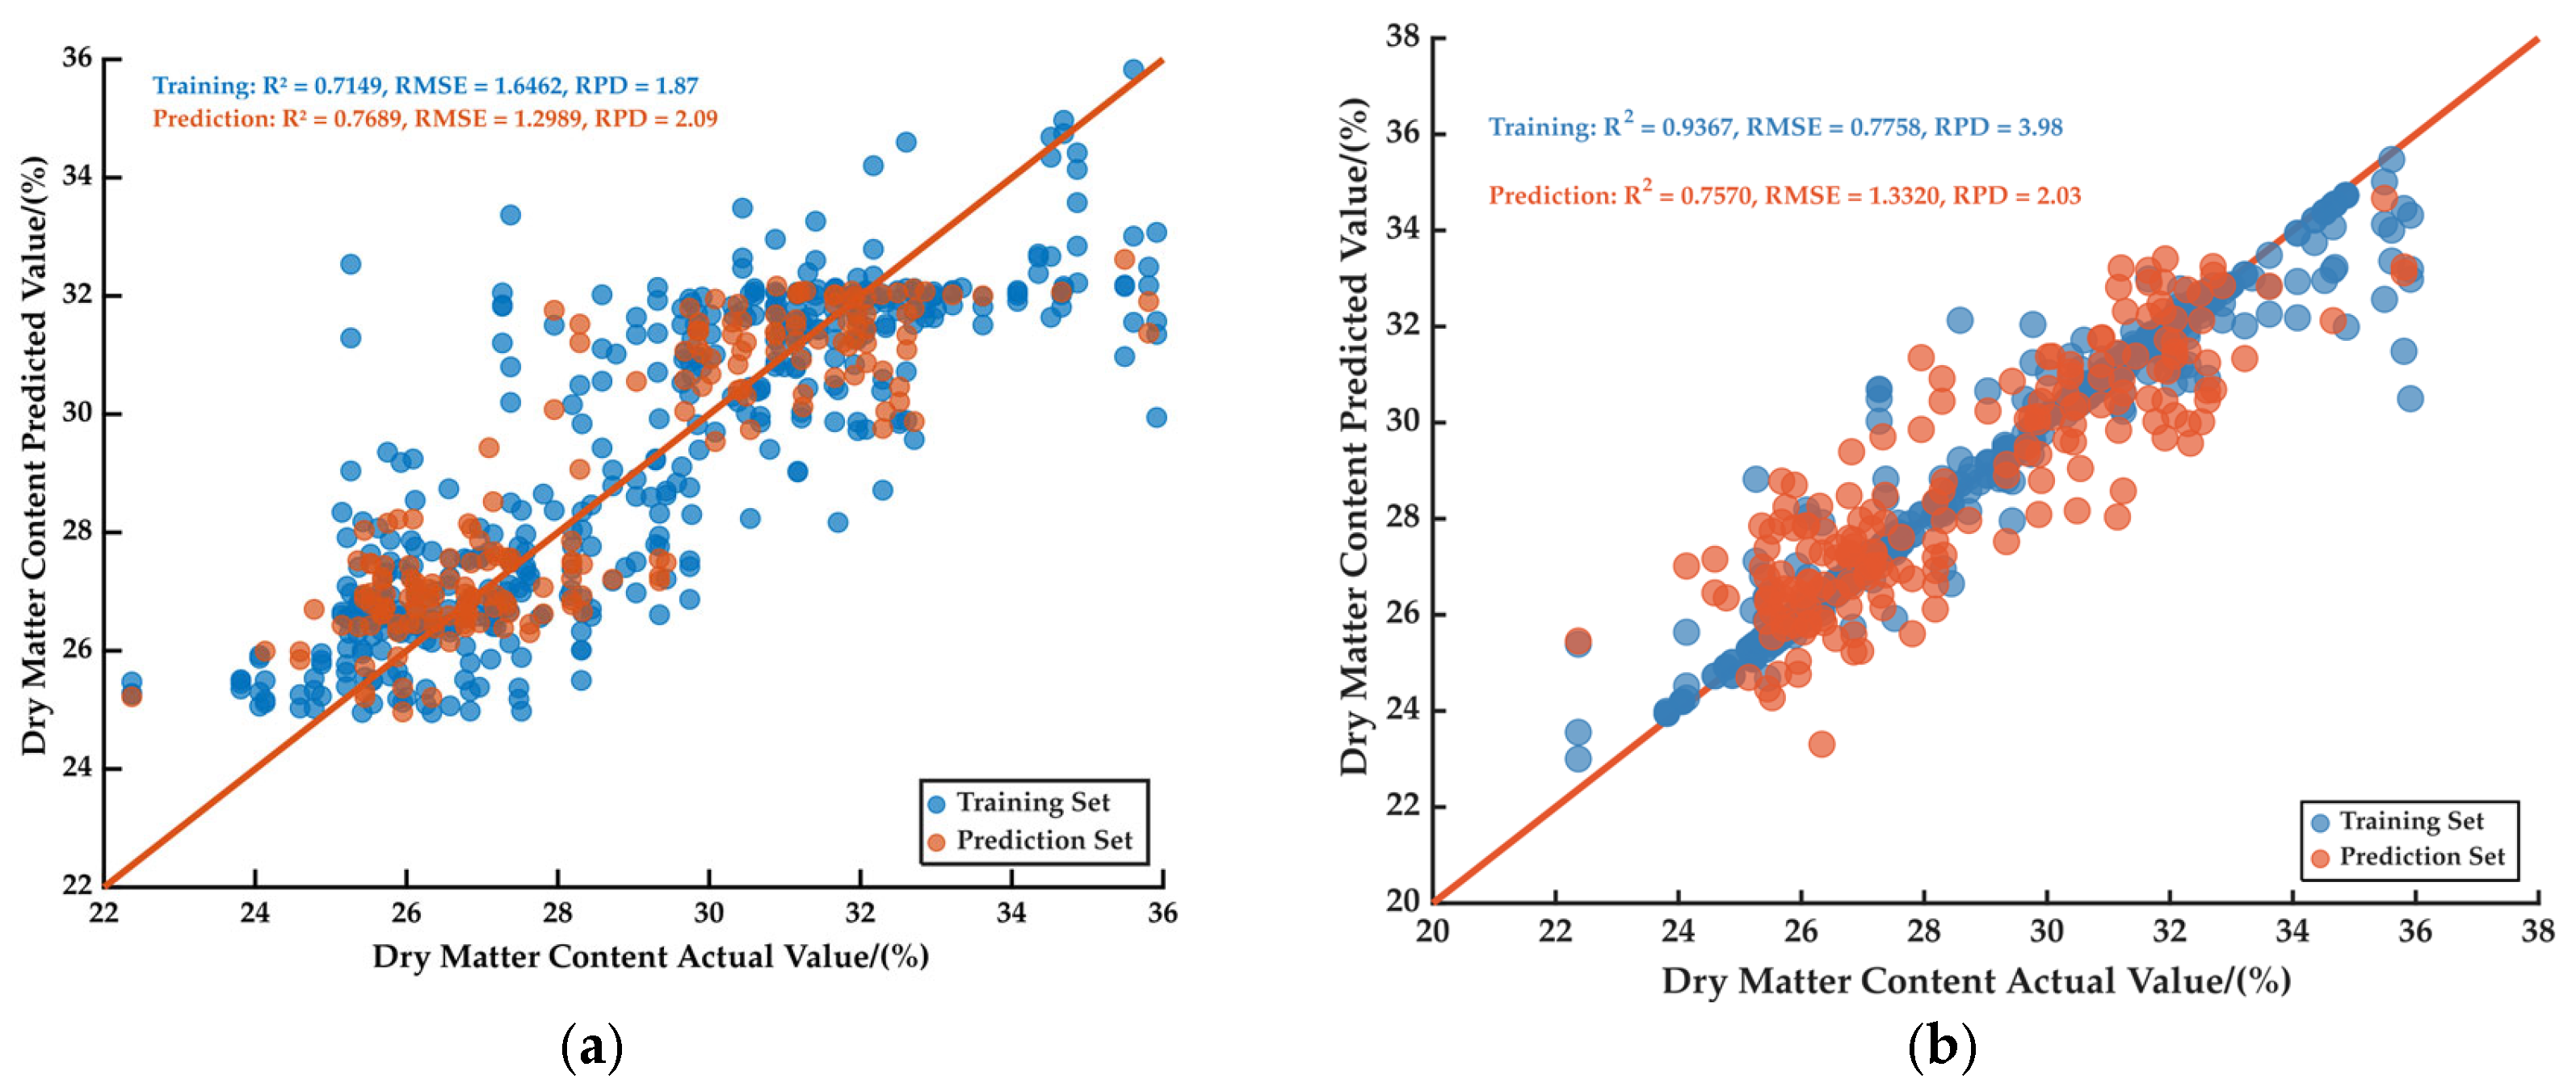
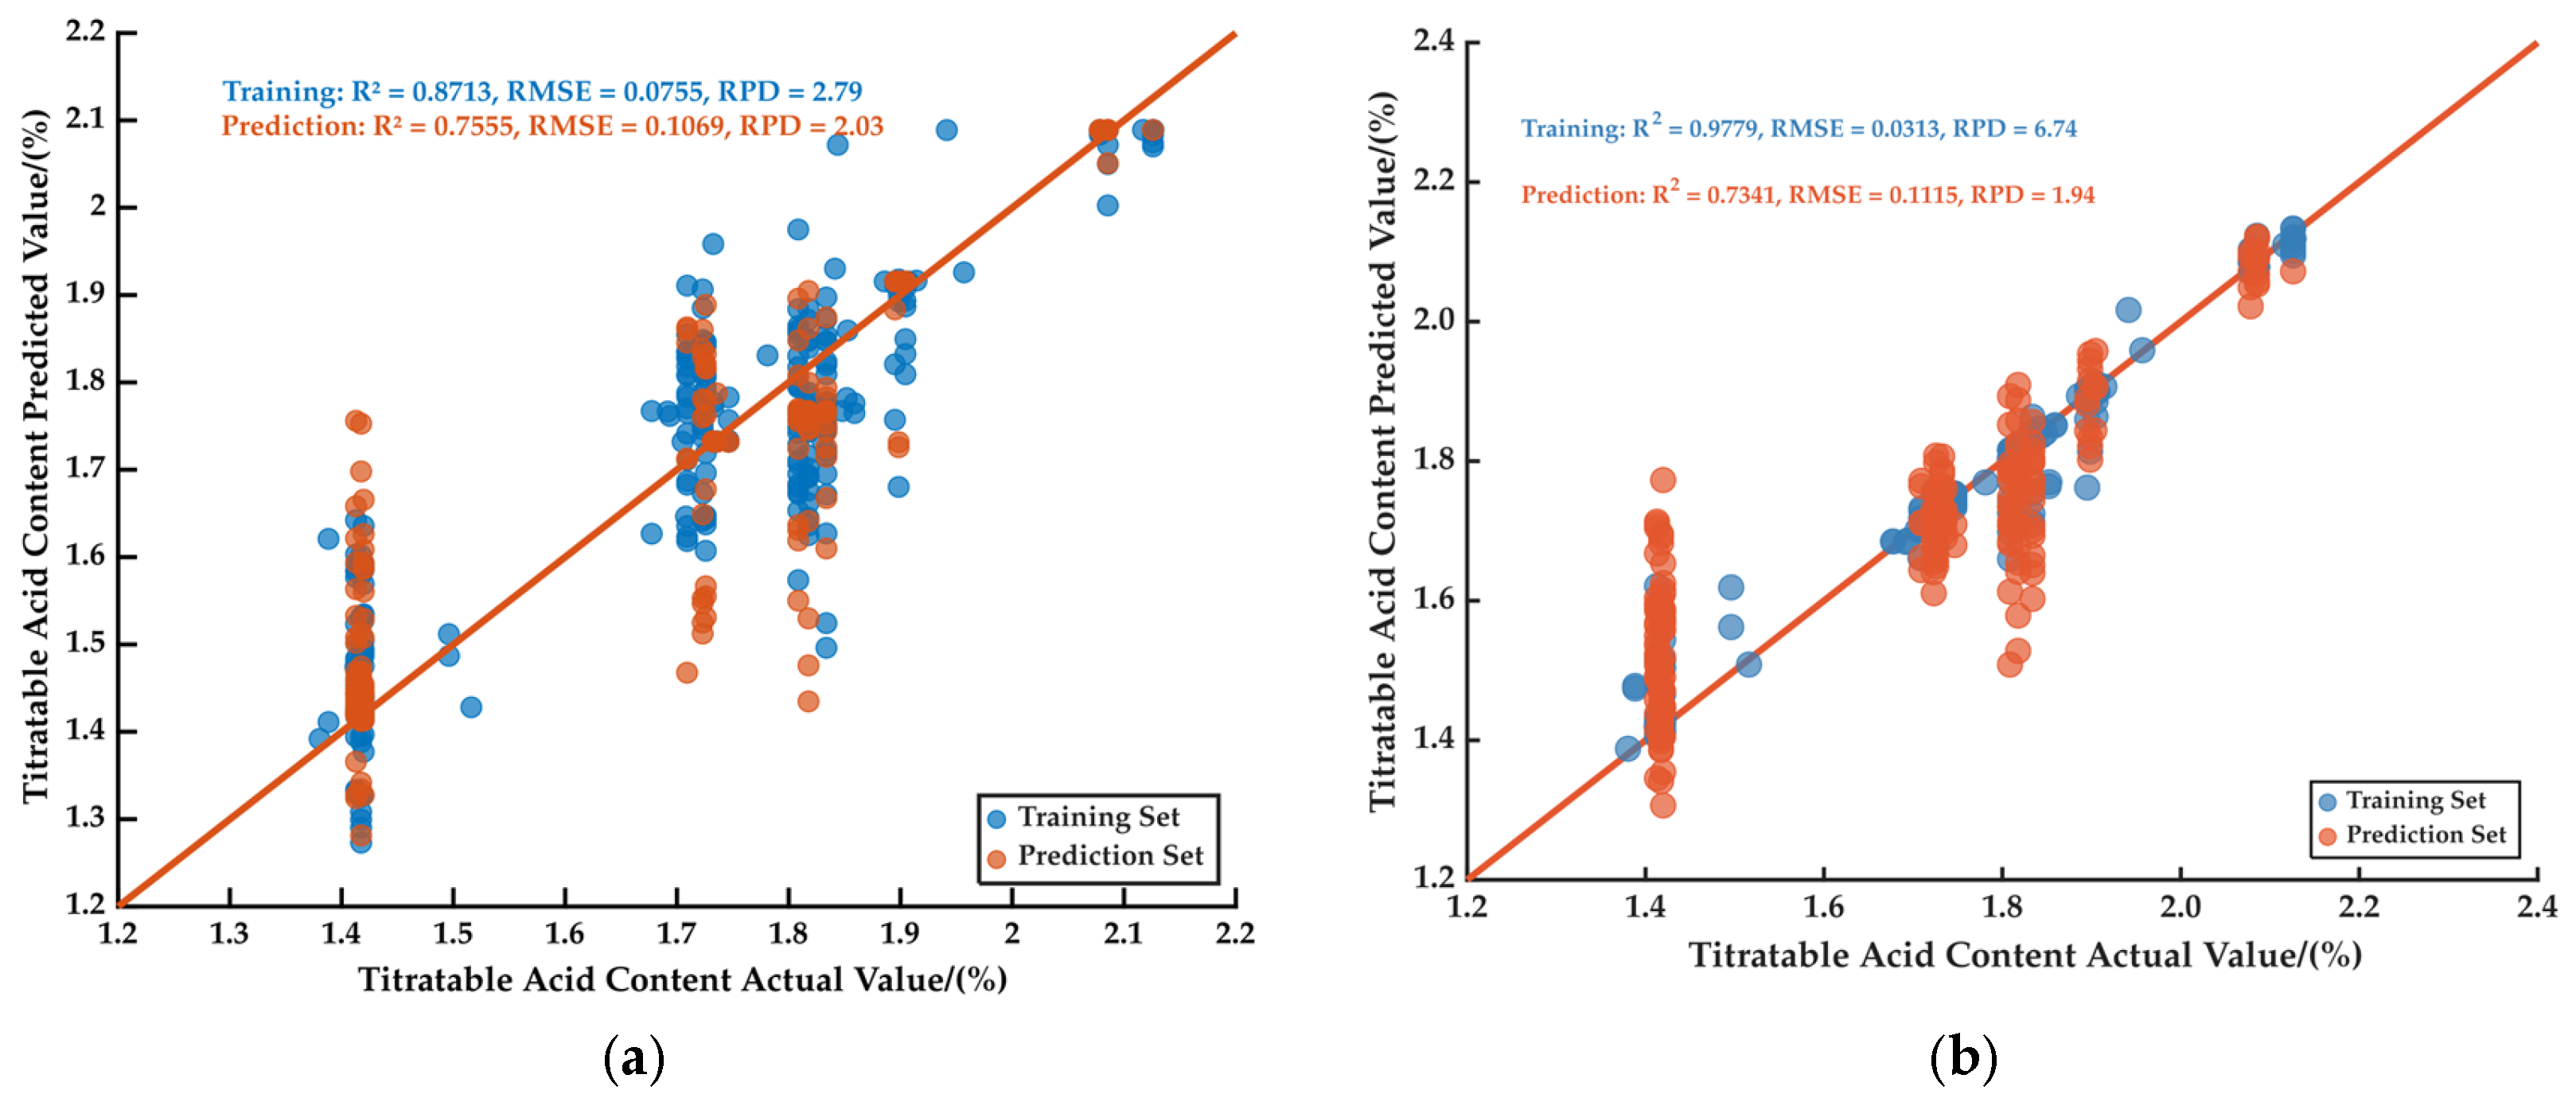
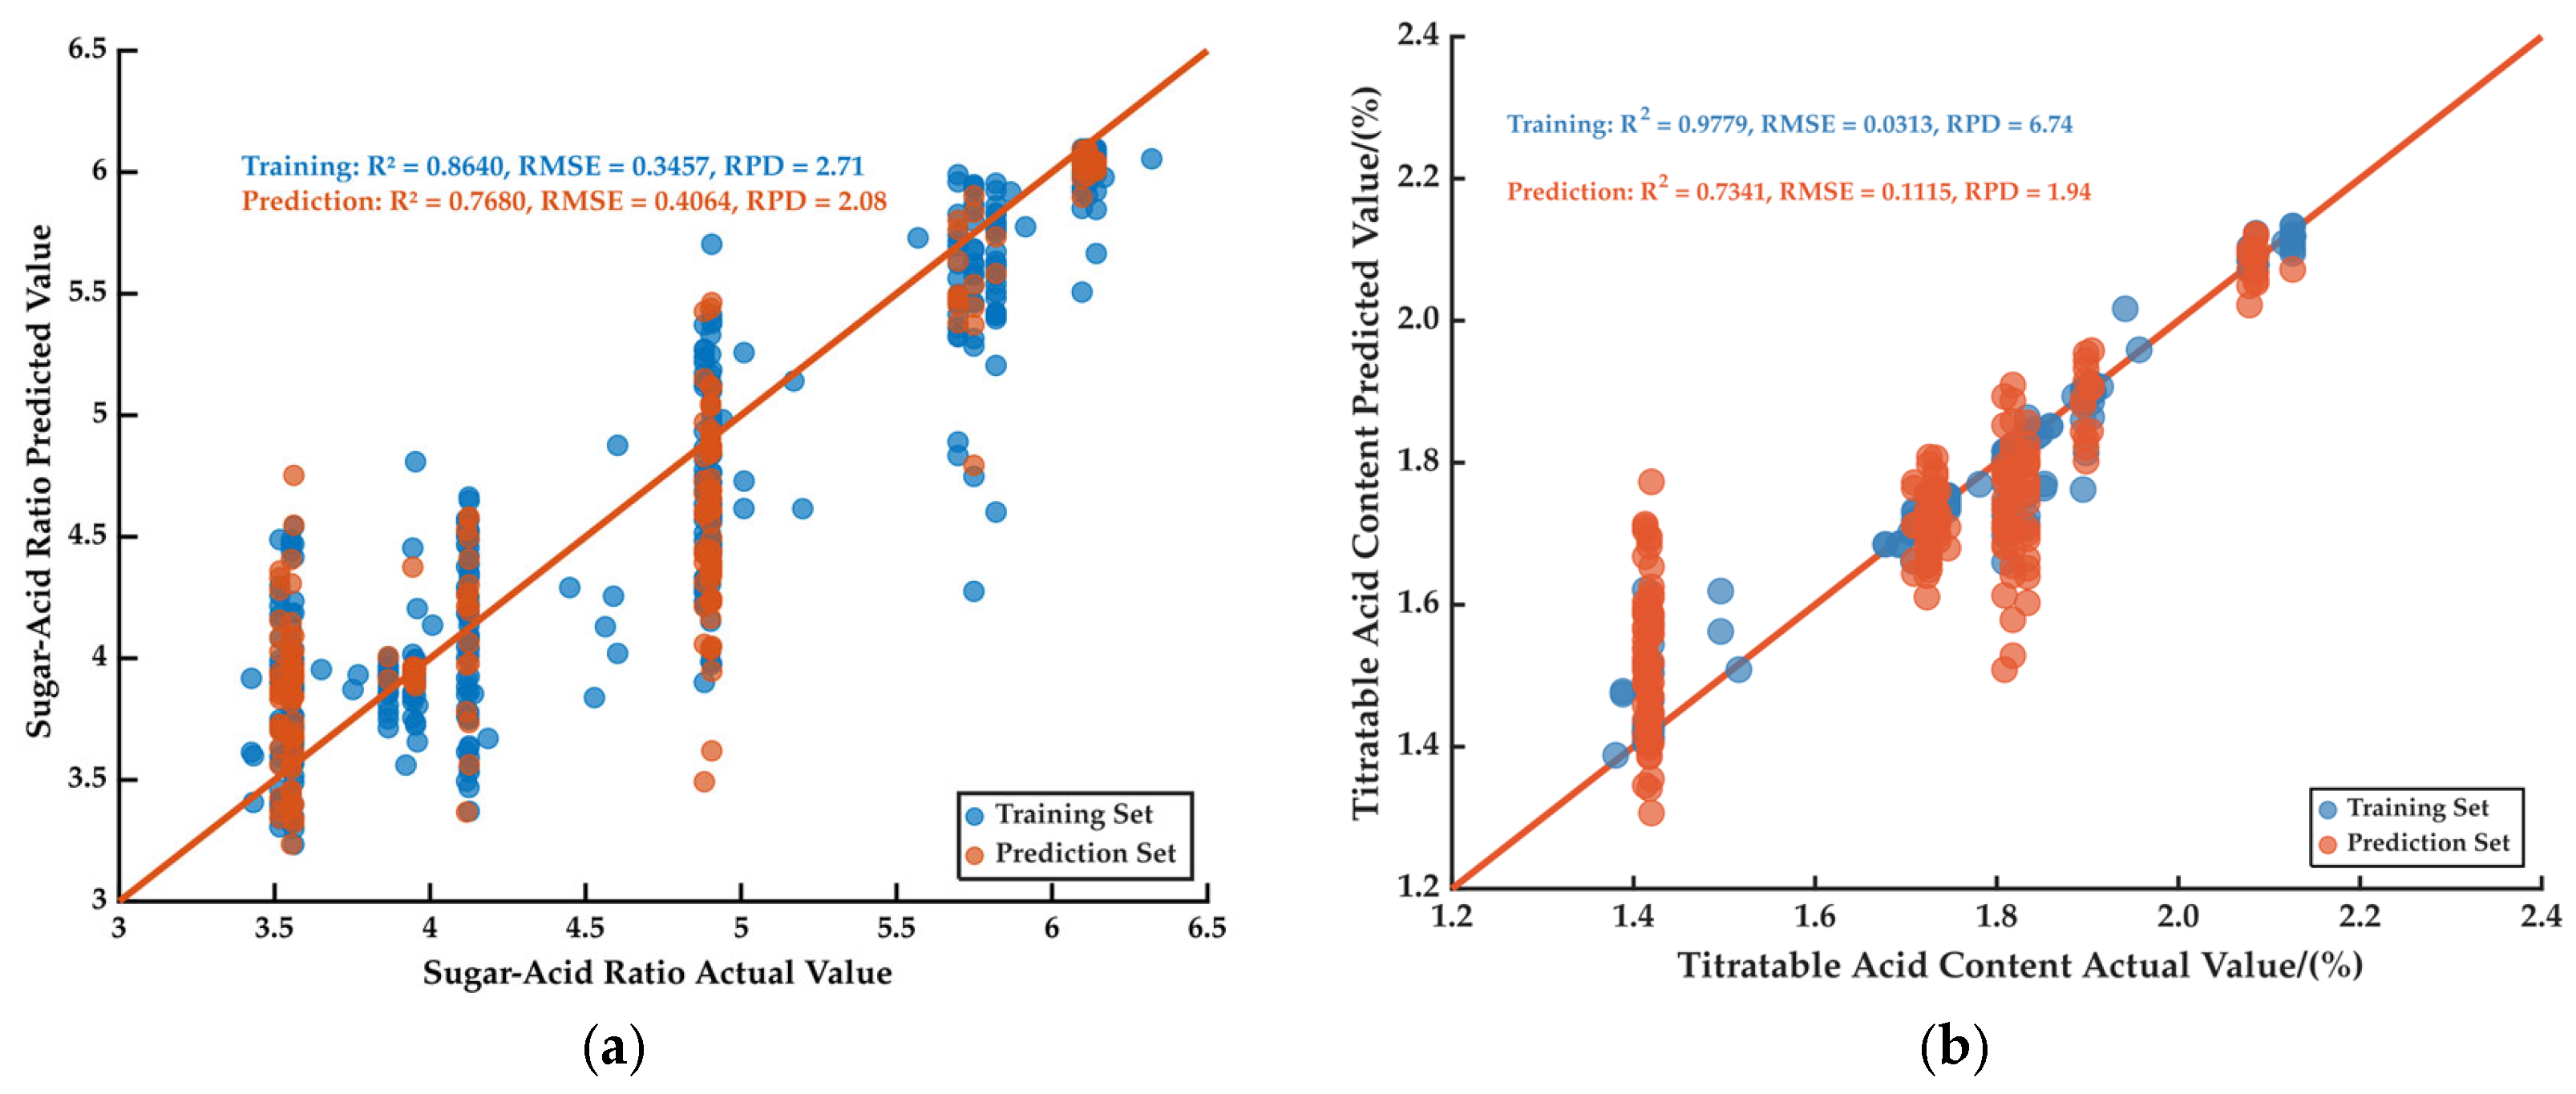
For dry matter content, the BPNN model shown in Figure 17a yielded an R P 2 of 0.769, an RMSEP of 1.299, and an RPD of 2.09. The BPNN models for titratable acid content and sugar–acid ratio, presented in Figure 18a and Figure 19a, achieved R P 2 values of 0.756 and 0.768, RMSEP values of 0.107 and 0.406, and RPD values of 2.03 and 2.08, respectively. All these models exhibited RPD values between 2.0 and 2.5, indicating average predictive accuracy and stability. Thus, these models can only be used for rough estimation of dry matter content, titratable acid content, and sugar–acid ratio.
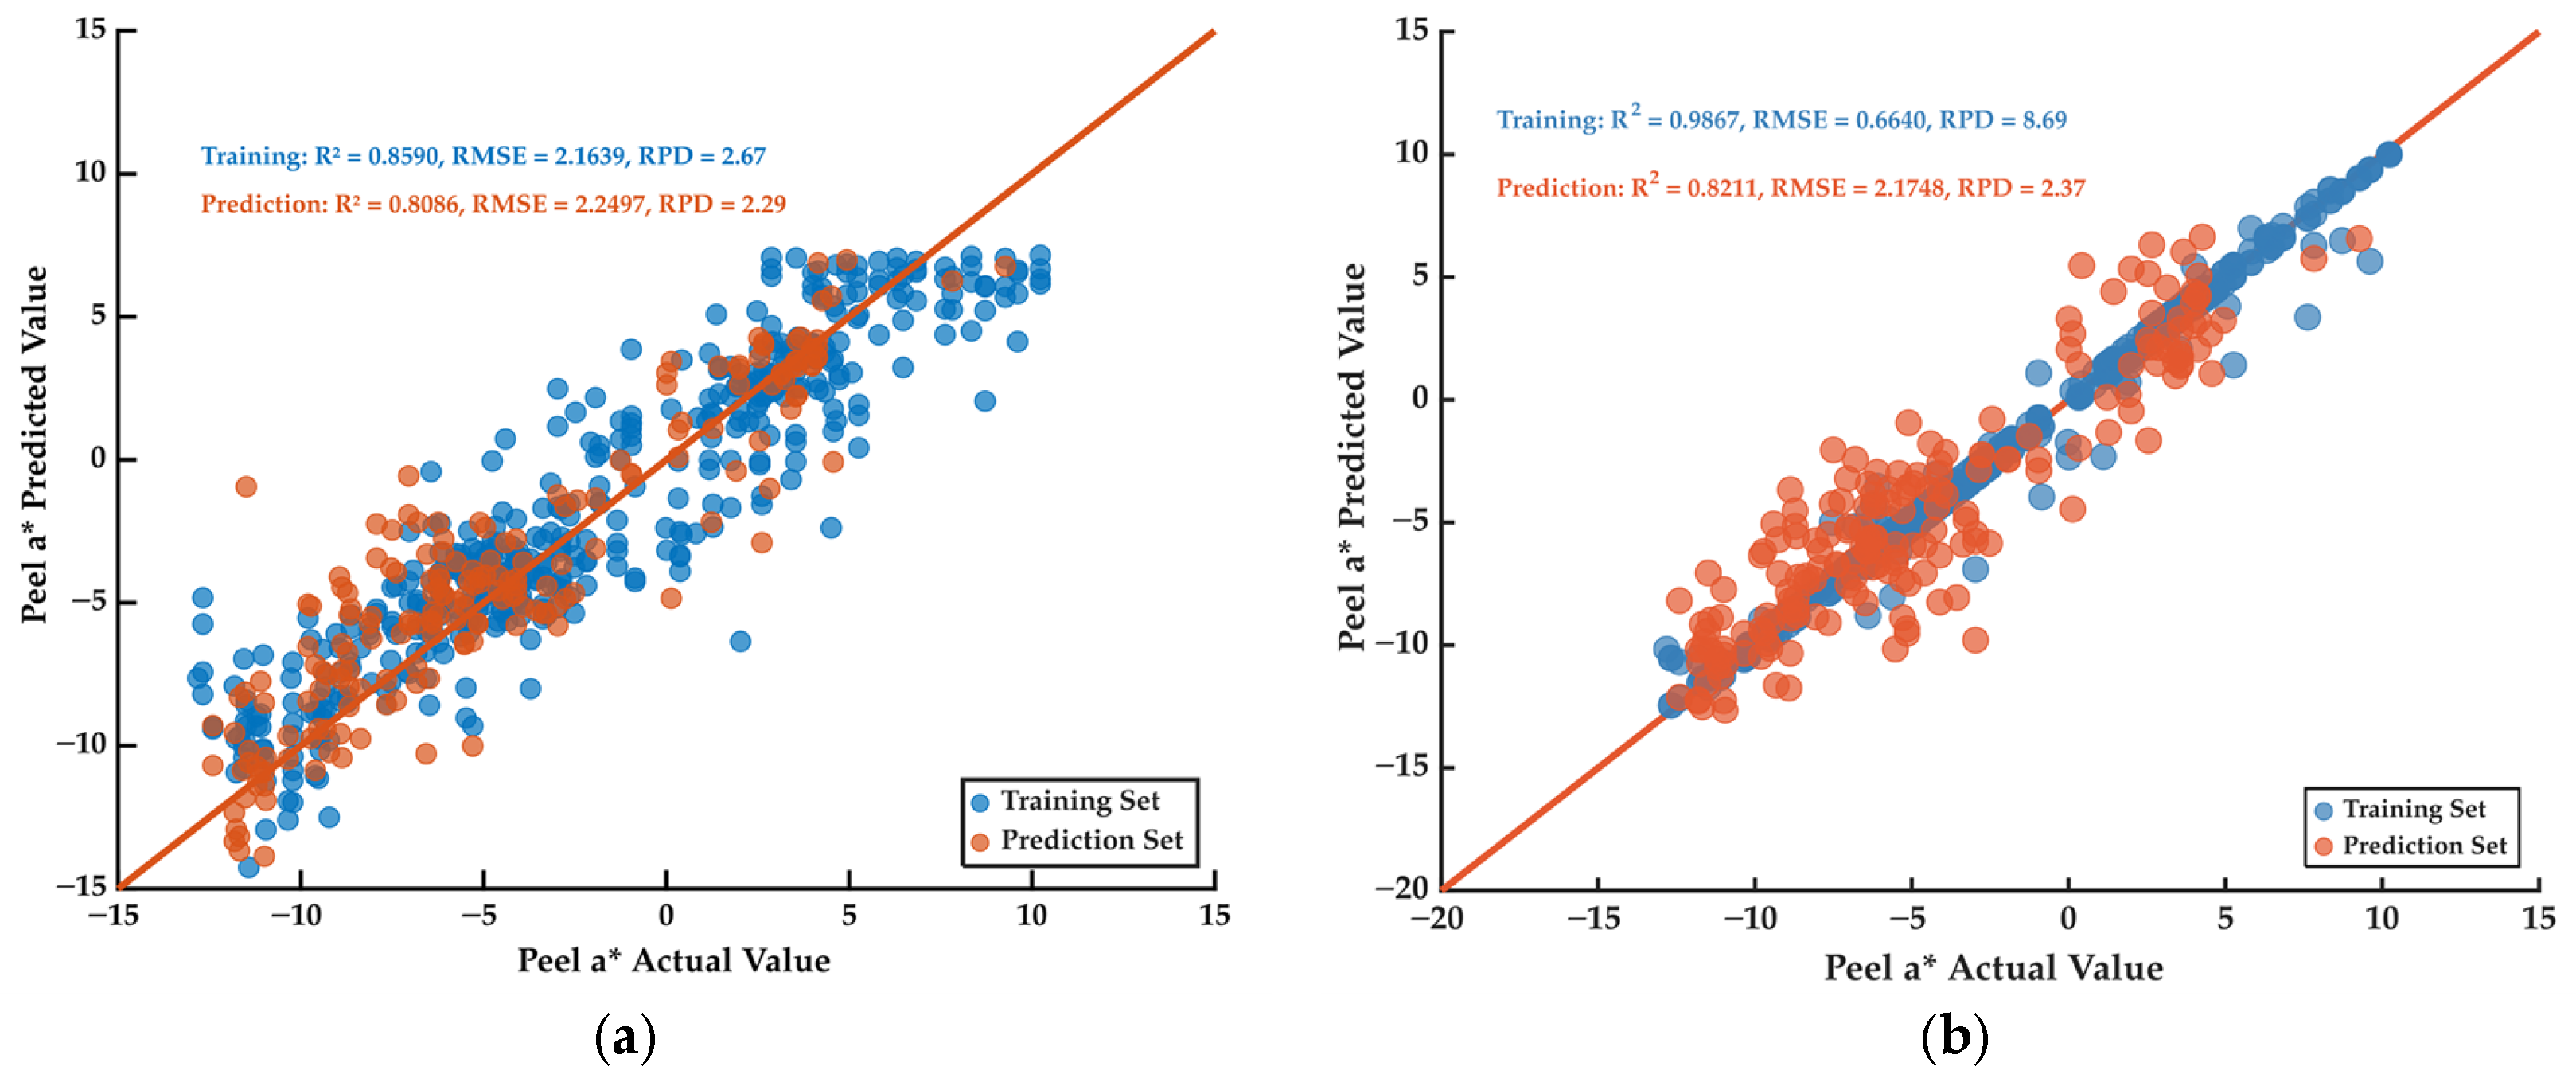
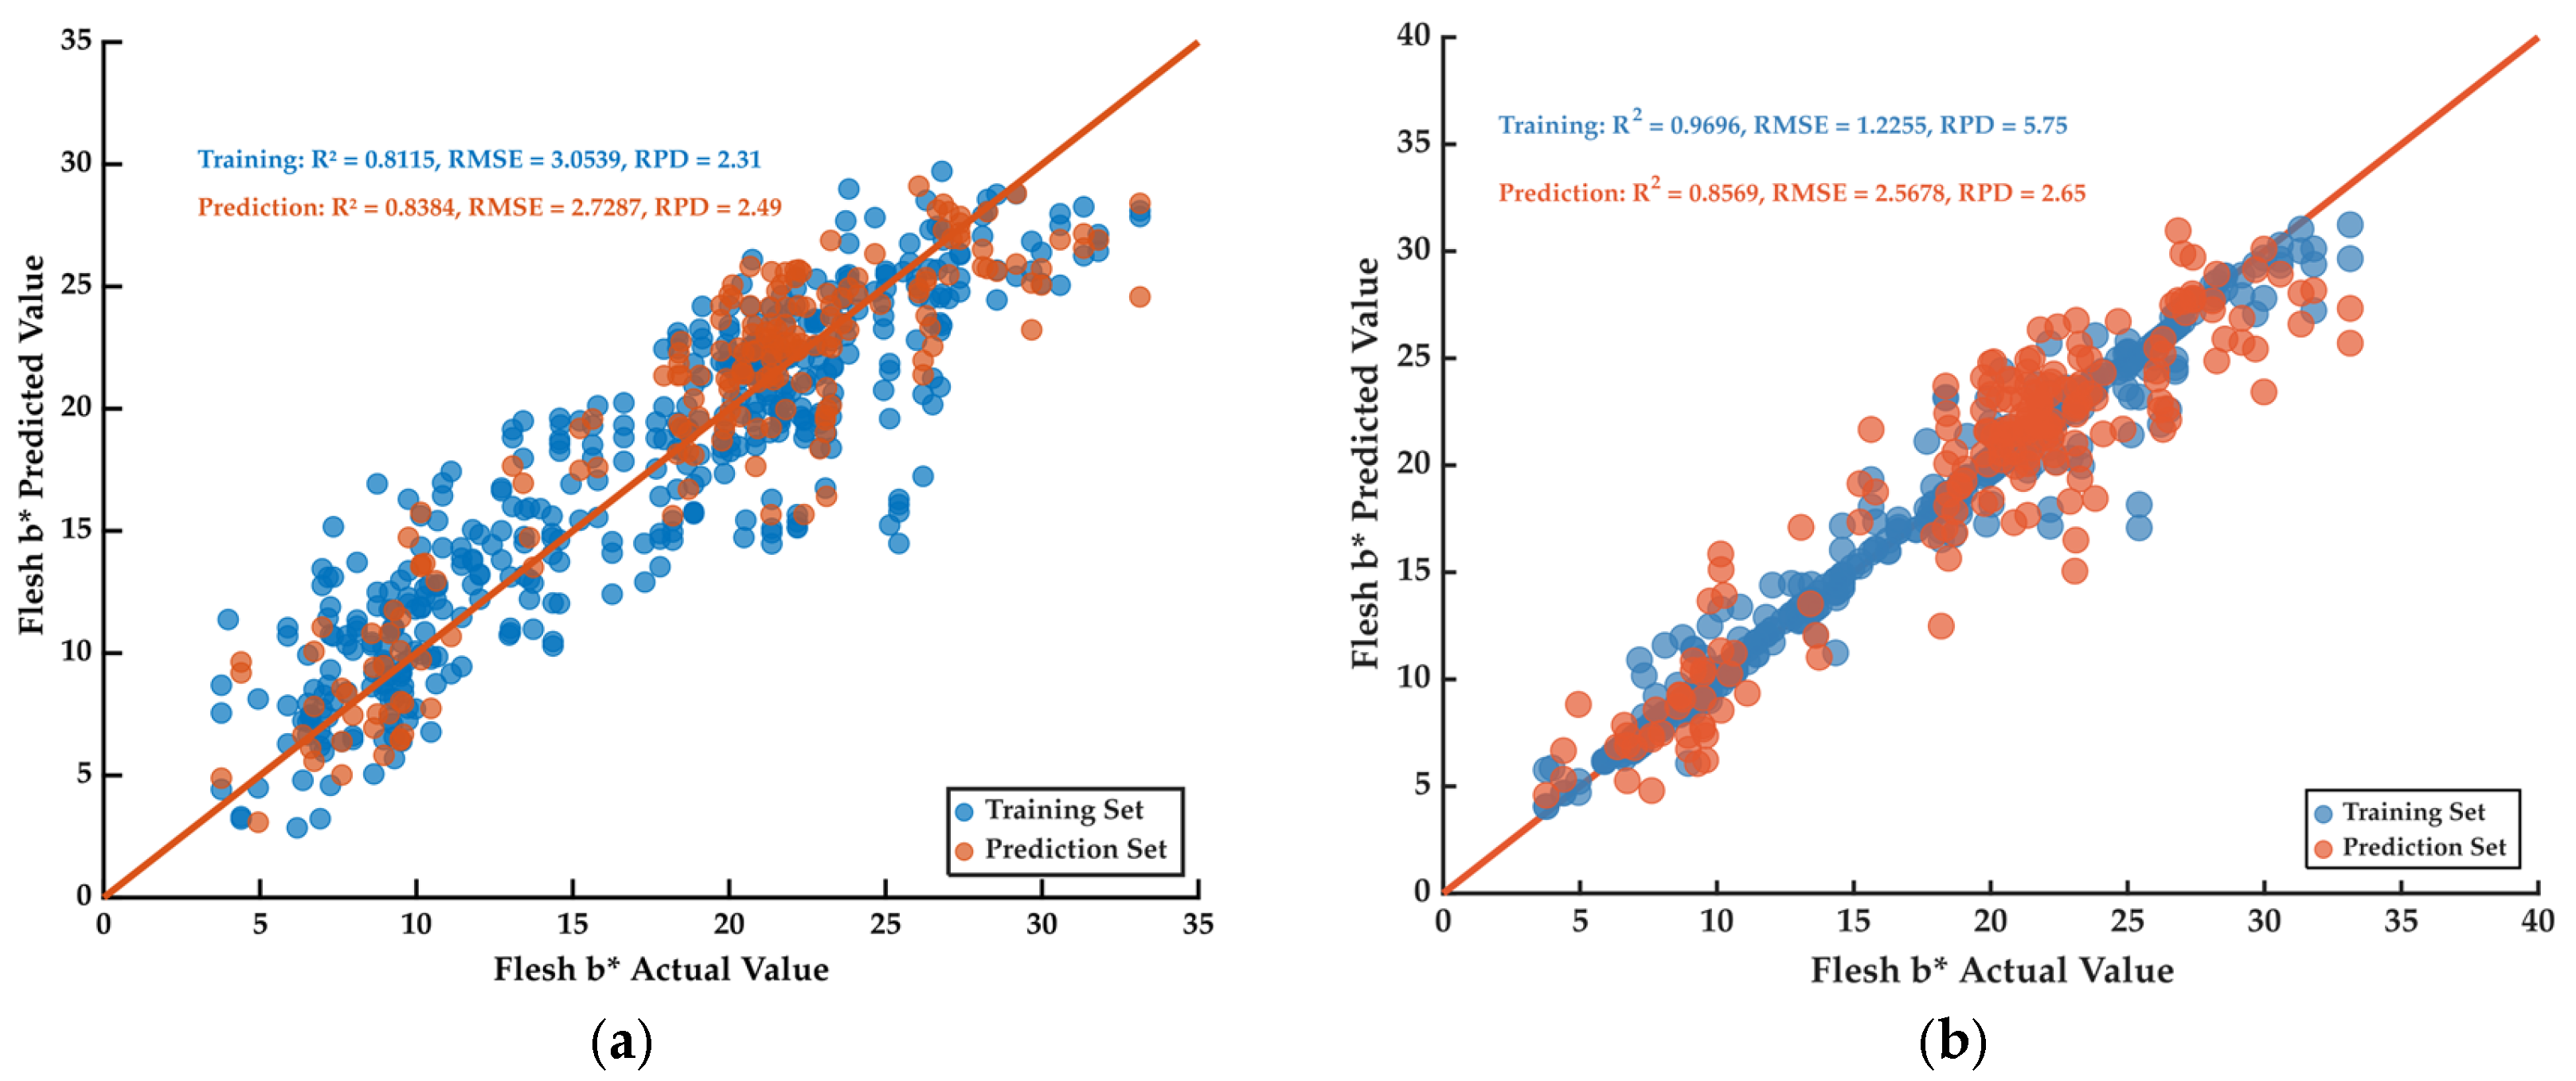
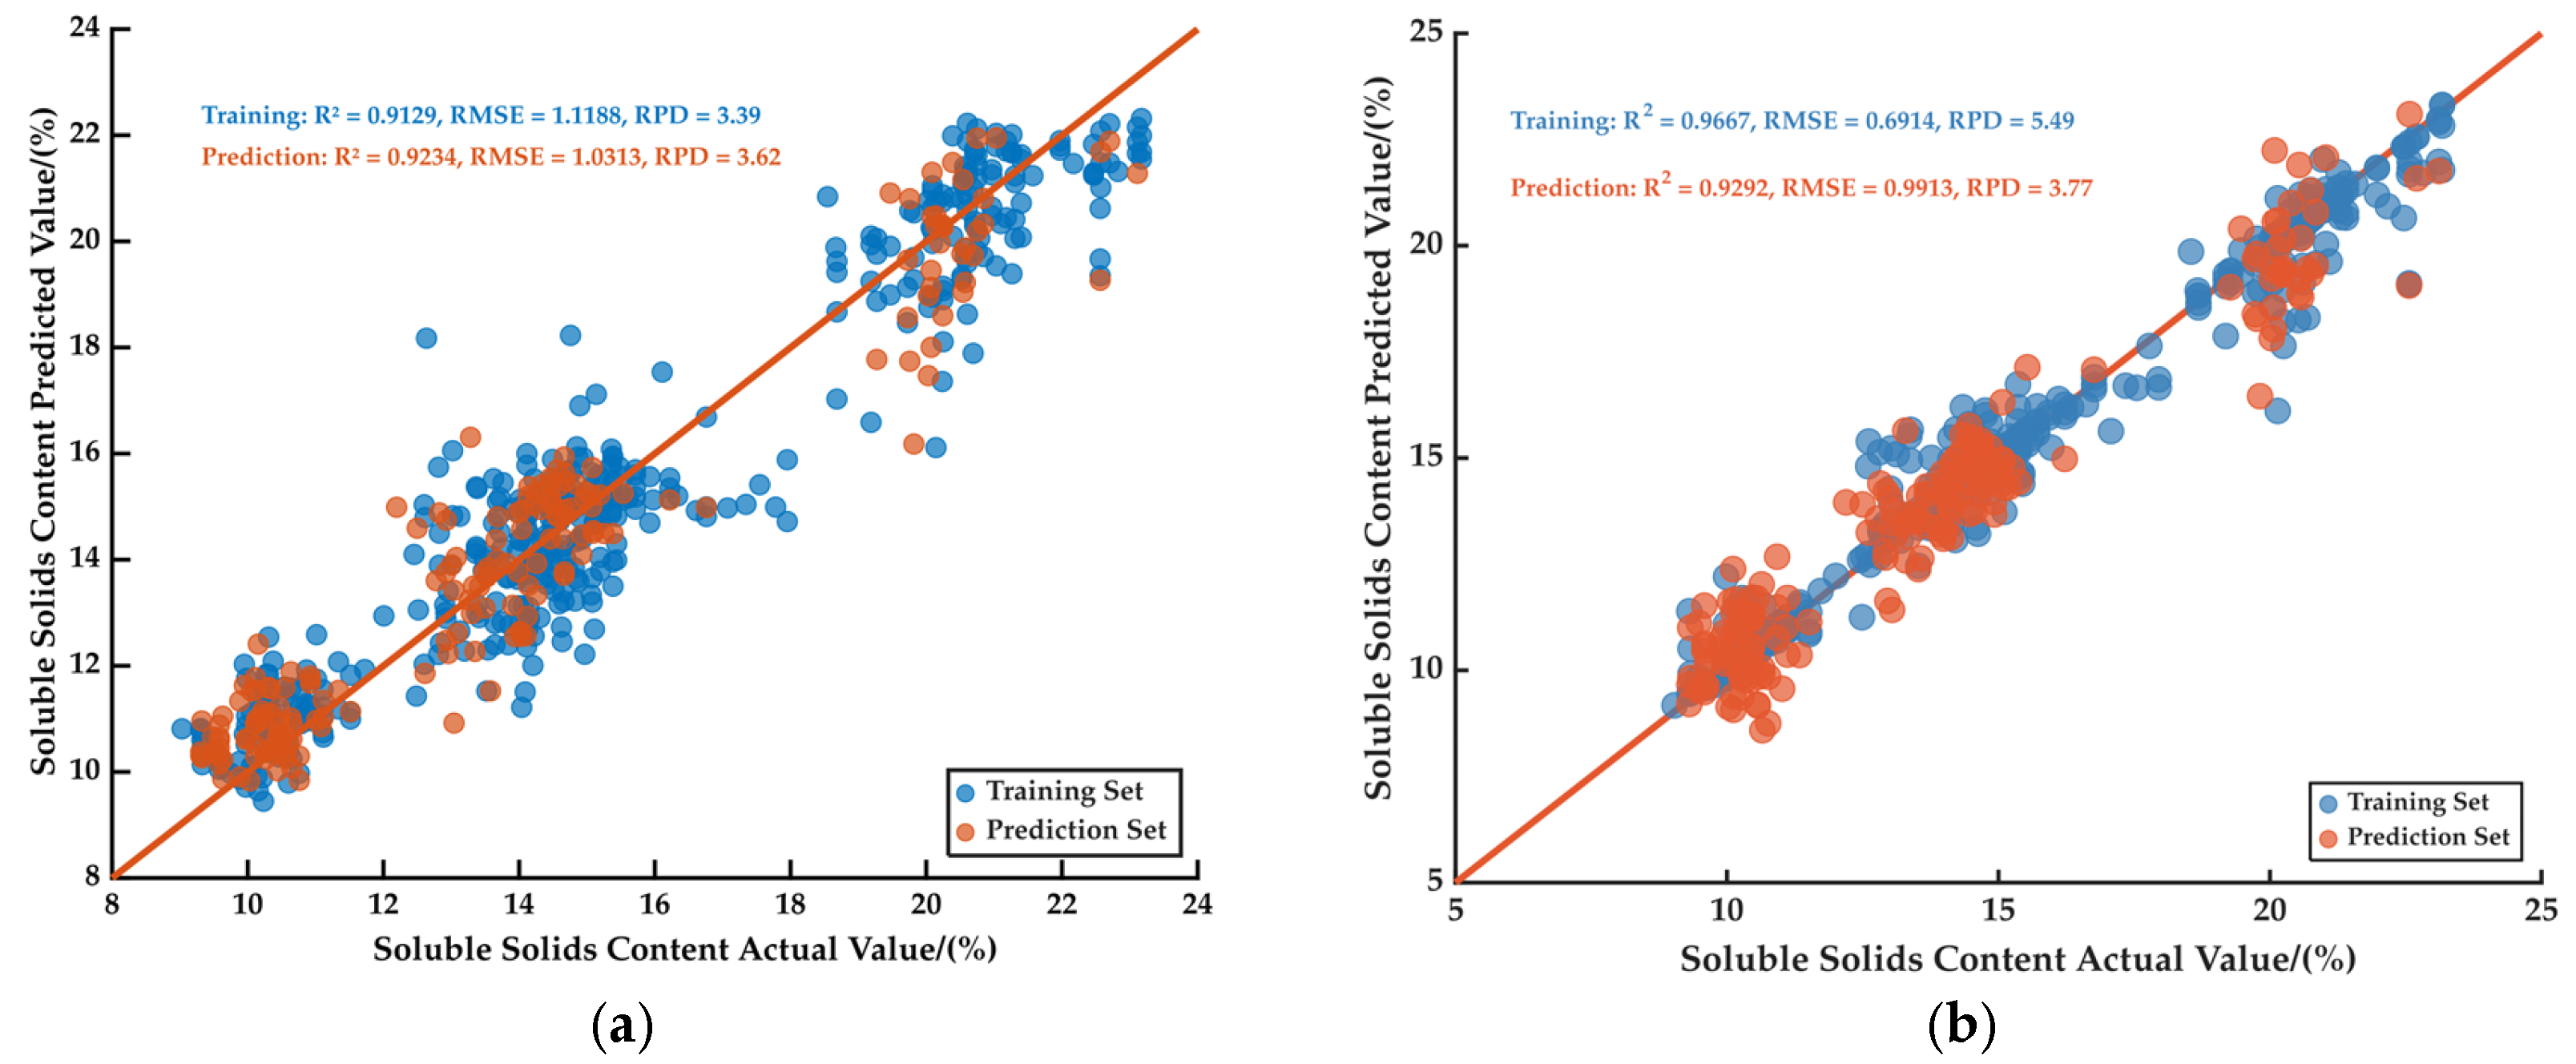
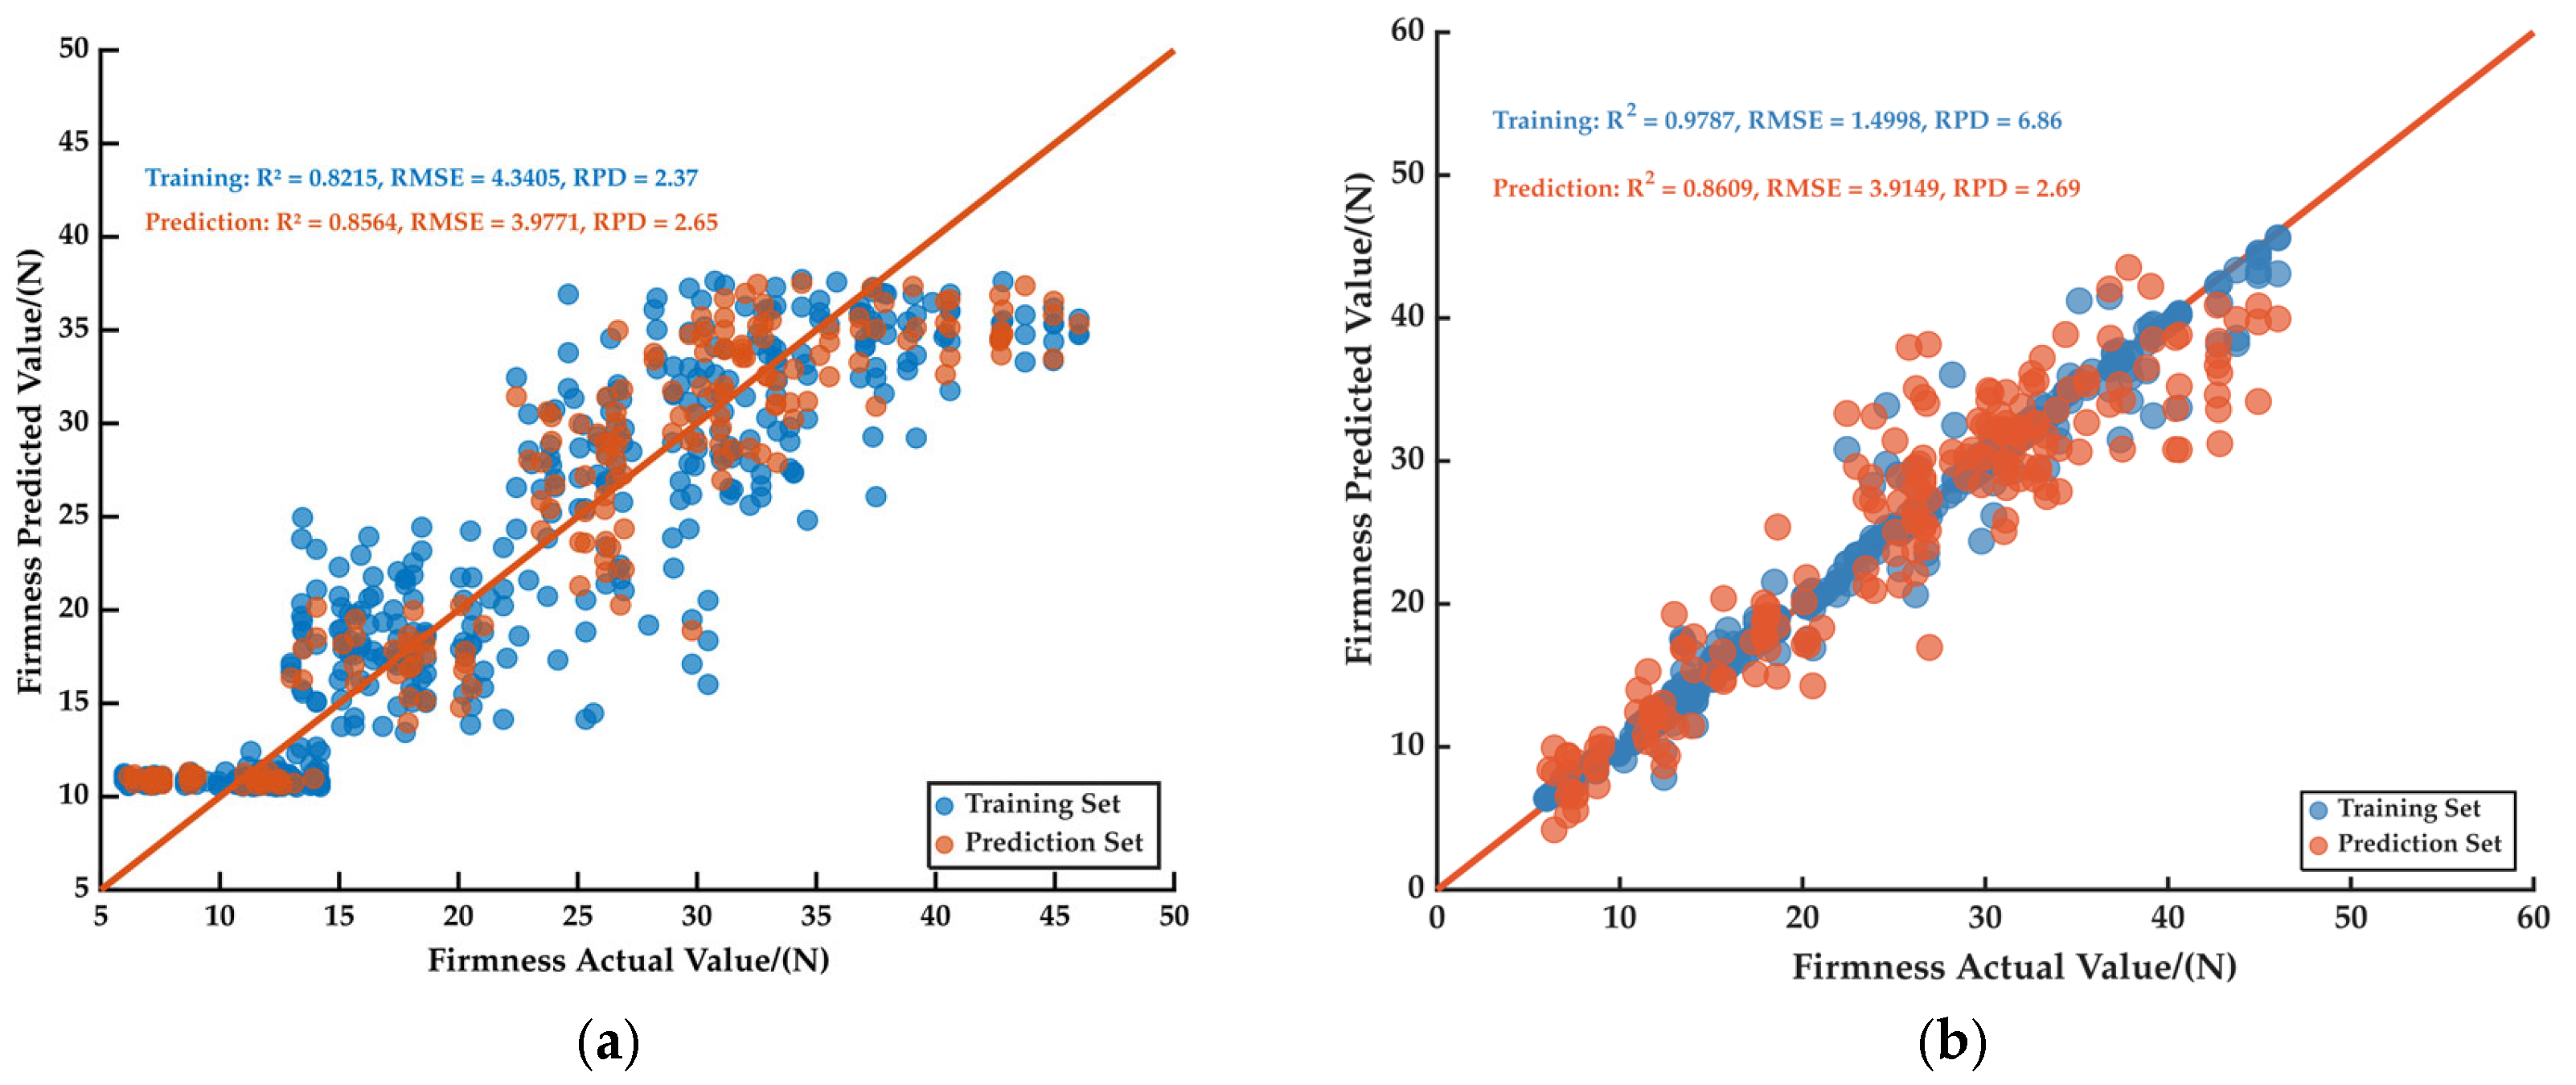
Similarly, the SVM model for dry matter content (Figure 17b) showed an R P 2 of 0.757, an RMSEP of 1.332, and an RPD of 2.03, reflecting normal predictive performance. However, the SVM models for titratable acid content (Figure 18b) and sugar–acid ratio (Figure 19b) yielded RPD values of 1.94 and 1.84, respectively, indicating poor predictive accuracy and stability. Consequently, the overall predictive performance of these SVM models was inferior to that of the corresponding BPNN models. Figure 20a shows the BPNN model for Peel a* of apricot–plum fruits, with an R P 2 of 0.809, an RMSEP of 2.068, and an RPD of 2.25. Figure 21a presents the BPNN model for flesh b*, with an R P 2 of 0.838, an RMSEP of 2.729, and an RPD of 2.49. As the RPD values are slightly lower than 2.5, these models exhibit moderate accuracy and stability, indicating an overall acceptable predictive performance, and are suitable only for rough estimation of peel a* and flesh b* in apricot–plum fruits. Figure 22a shows the BPNN model for soluble solids content (SSC), with an R P 2 of 0.923, an RMSEP of 1.031, and an RPD of 3.62. An RPD value greater than 3.0 indicates very high prediction accuracy and stability, and the overall predictive performance of this model can be considered excellent. Figure 23a presents the BPNN model for firmness, with an R P 2 of 0.856, an RMSEP of 3.977, and an RPD of 2.65, which is higher than 2.5, suggesting good accuracy and stability and indicating that the model can reliably predict fruit firmness. Figure 22b shows the SVM model for soluble solids content, with an R P 2 of 0.929, an RMSEP of 0.991, and an RPD of 3.77, demonstrating excellent prediction accuracy and stability. Figure 20b shows the SVM model for peel a*, with an R P 2 of 0.821, an RMSEP of 2.568, and an RPD of 2.65. Figure 21b presents the SVM model for flesh b*, with an R P 2 of 0.857, an RMSEP of 2.697, and an RPD of 2.65. Figure 23b shows the SVM model for firmness, with an R P 2 of 0.861, an RMSEP of 3.915, and an RPD of 2.69. As all RPD values are greater than 2.5, these SVM models show acceptable accuracy and stability, and their overall predictive performance is superior to that of the corresponding BPNN models.
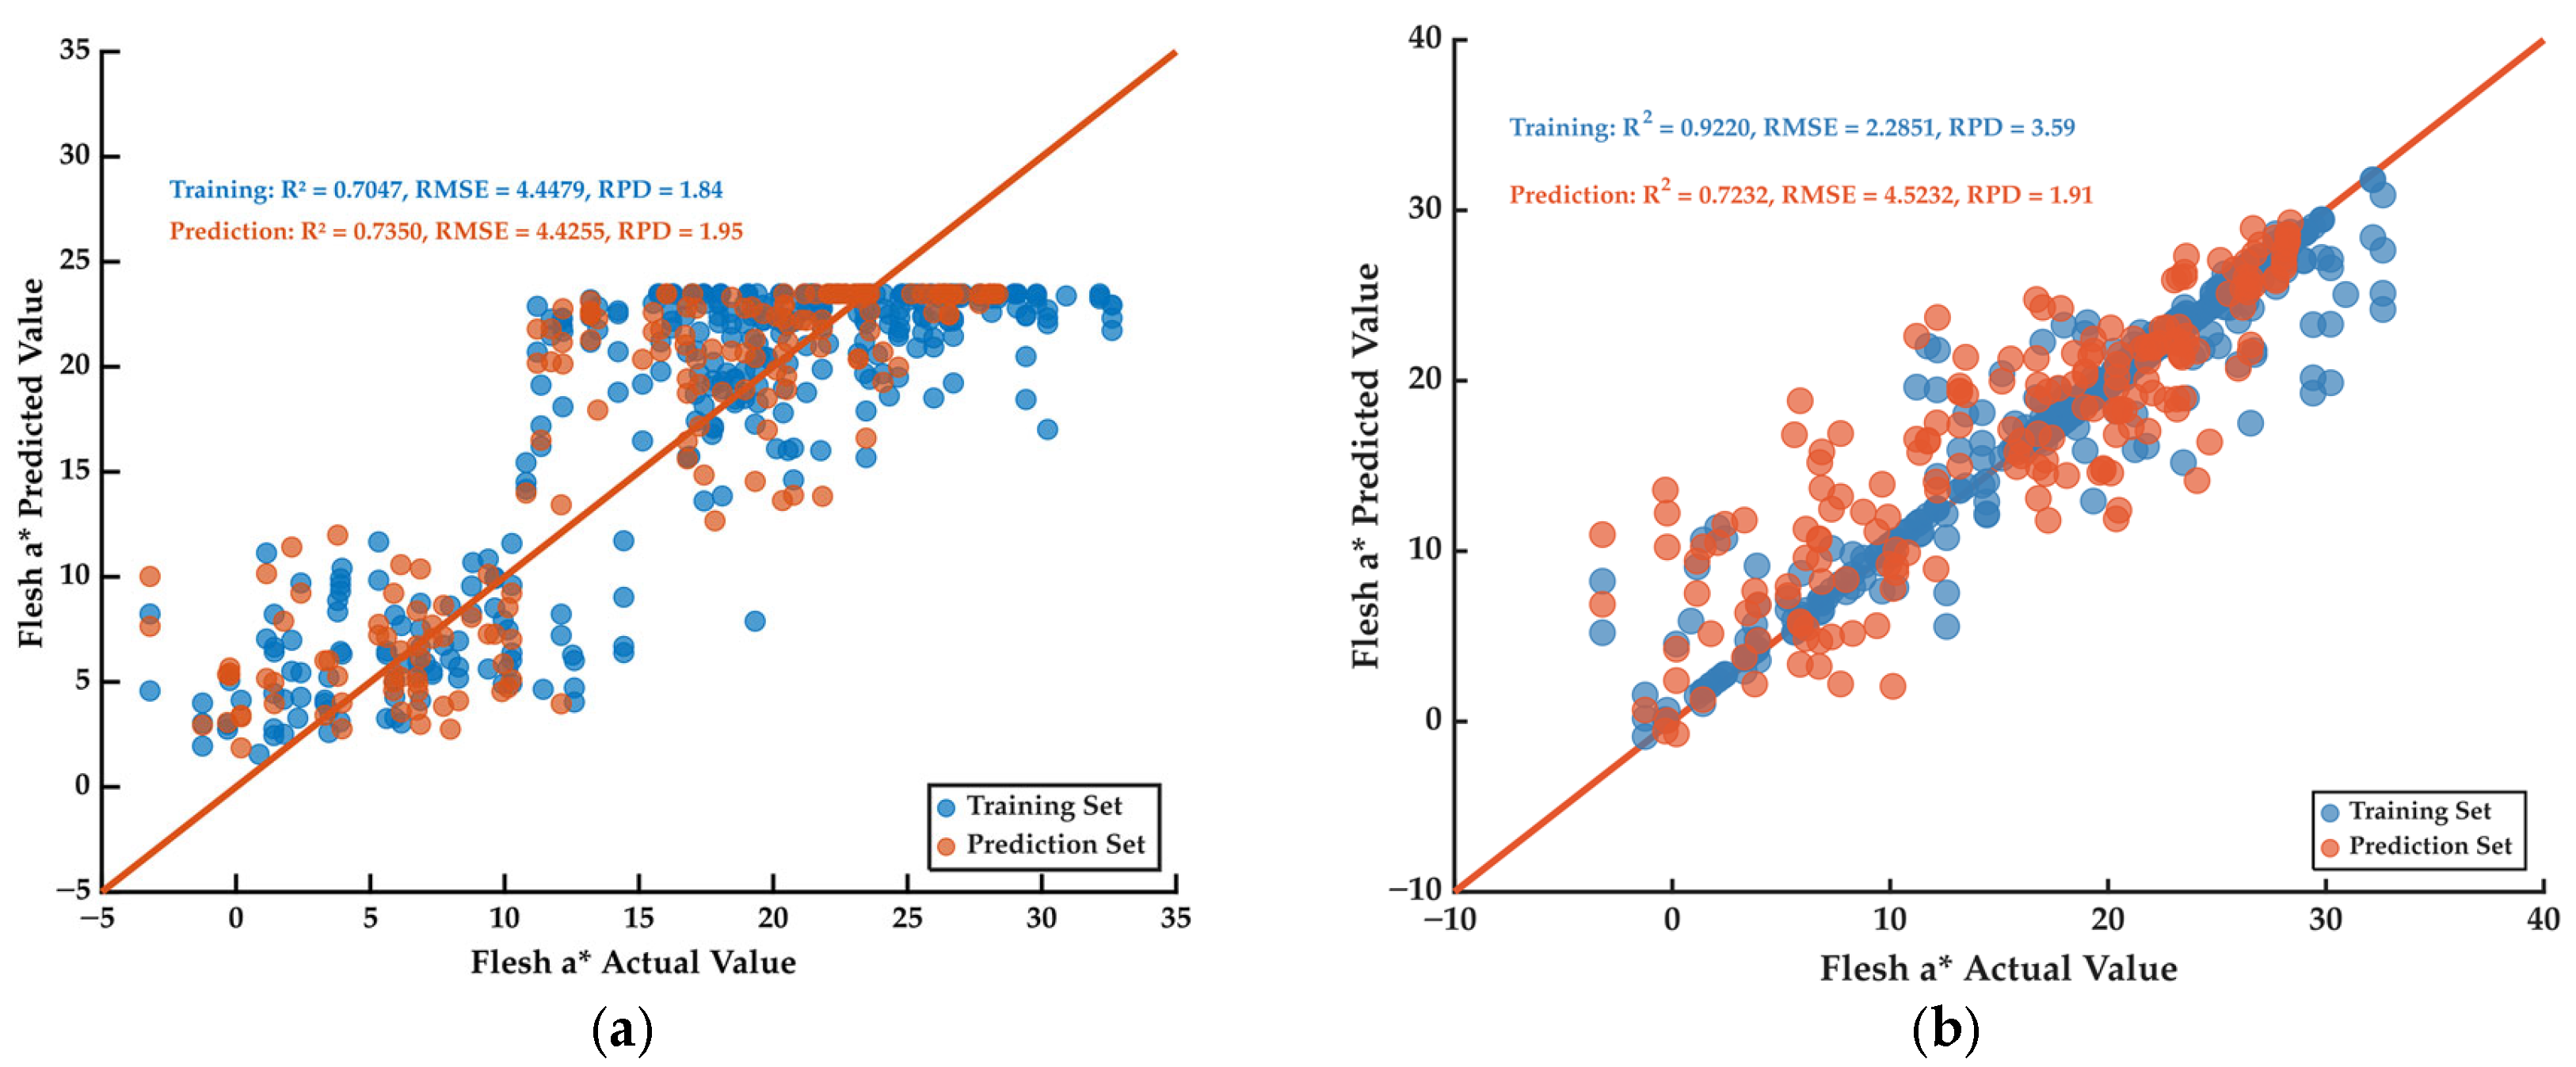
Figure 24a shows the BPNN model for flesh a*, with an R P 2 of 0.735, an RMSEP of 4.426, and an RPD of 1.95. Figure 24b presents the SVM model for flesh a*, yielding an R P 2 of 0.723 and an RMSEP of 4.52. As the RPD values of both models were lower than 2.0, the predictive accuracy and stability for flesh a* were relatively poor. Moreover, the overall predictive performance of the SVM model was inferior to that of the BPNN model.
A comprehensive comparison of the two prediction models revealed that the BPNN model generally outperformed the SVM model for the majority of quality indices. However, the SVM model exhibited superior predictive performance for specific attributes, including peel a*, flesh b*, soluble solids content (SSC), and firmness. Conversely, the SVM models for TA and sugar–acid ratio yielded R P 2 values of 0.734 and 0.702, with corresponding RPD values of 1.94 and 1.84, respectively. As both RPD values fell below 2.0, these models demonstrated poor predictive accuracy and stability. Overall, the BPNN architecture offered higher accuracy and stability, resulting in superior overall predictive efficacy. It is worth noting, however, that the BPNN model for flesh a* ( R P 2 = 0.735, RMSEP = 4.426, RPD = 1.95) showed a low correlation coefficient and an RPD below 2.0, indicating limited predictive capability. Nevertheless, the models developed in this study for the period from color-turning to full maturity demonstrated robust performance for total phenols, peel L*, peel b*, vitamin C, flavonoids, SSC, soluble sugars, and soluble protein. Specifically, the R P 2 values for these indicators were 0.968, 0.966, 0.950, 0.939, 0.939, 0.923, 0.921, and 0.905, respectively, while the RPD values were 5.64, 5.41, 4.48, 4.07, 4.07, 3.62, 3.58, and 3.25. These results confirm the feasibility of using this method for the rapid prediction of these quality attributes in ‘Fengweimeigui’ and ‘Weidi’ apricot–plum hybrids. Rapid identification of different fruit maturity levels can reduce the probability of premature harvesting, making near-infrared spectroscopy a viable tool for rapid, non-destructive detection and maturity monitoring.
Multiple studies have demonstrated that combining appropriate spectral preprocessing methods (such as multiple scattering correction, standard normal variable transformation, SG smoothing, etc.) with feature wavelength extraction algorithms (such as CARS, SPA, GA, etc.) can effectively enhance the predictive accuracy and robustness of models [52,53]. Liqiao Li et al. [54] employed SPXY for sample partitioning in citrus sugar content detection, achieving an R P 2 of 0.881 via PLS modeling. In contrast, this study attained an R P 2 of 0.950 for SS, indicating superior predictive performance of the BPNN model. The BPNN model developed in this study for predicting the titratable acid content of apricot–plum achieved an R P 2 value of 0.756, indicating a relatively modest correlation. Nevertheless, this performance was superior to that reported by Duckena et al. [55], who used a PLS model to predict total acid content in tomatoes, obtaining a prediction correlation coefficient of 0.70 and an RMSE of 4.08. However, the predictive accuracy of the present model was lower than that reported by Zhao Zhilei et al. [29], who established a total acid content model for the ‘Angeleno’ plum using a BP-ANN algorithm, achieving a prediction correlation coefficient of 0.900. Yunhai Wang et al. [30] employed competitive adaptive reweighted sampling (CARS) combined with the shuffled frog-leaping algorithm (SFLA) to select key wavelengths and developed partial least squares regression (PLSR) models for soluble solids content (SSC) and firmness (FF) of ‘Konglongdan’ fruit, achieving R P 2 values of 0.930 for SSC and 0.799 for FF. The SSC prediction performance obtained in the present study was comparable to that reported by Wang et al. [30], while the FF model developed here yielded a higher R P 2 value of 0.856, indicating improved predictive performance.

4. Discussion

Rapid identification of fruit maturity levels can reduce the probability of premature harvesting, making near-infrared spectroscopy a viable approach for swift, non-destructive testing and maturity monitoring. However, most apricot–plum quality prediction studies have focused on traditional measurement methods, with limited attention given to non-destructive testing. In contrast, this research demonstrates for the first time the feasibility of using near-infrared spectroscopy for a quantitative analysis of quality and maturity in apricot–plum varieties from the color change stage through to full maturity.
Furthermore, establishing a BPNN model incorporating 16 quality indicators—including soluble solids, soluble sugars, and titratable acid content—holds significant importance for screening key indicators for maturity prediction. This study determined optimal harvest timing by developing quantitative models based on changes in soluble solids, soluble sugars, firmness, and sugar–acid ratio. However, limitations persist in developing practical models due to restricted sample sizes, a single harvest season, and fixed production areas. While this approach minimizes fruit quality variation, it constrains the construction of robust models with high field applicability. Future research should therefore focus on developing integrated models encompassing multiple harvest time points, seasons, and production areas, thereby enhancing the practical utility through robust modelling.

5. Conclusions

During the color change process of apricot–plum fruits, the soluble solids, soluble sugars, titratable acids, flavonoids, soluble proteins, total phenols, dry matter content, skin-to-flesh color difference, sugar–acid ratio, and firmness change. Analysis of variance and Pearson correlation analysis revealed significant differences in all quality indicators except dry matter content during the color change period. Correlations and mutual influences were observed among these indicators.
Principal component analysis was performed on spectral data from apricot–plum quality samples. Based on the scores of the top 15 principal components, BPNN and SVM models were established for 16 quality indicators. Comprehensive comparison of these two prediction models revealed that the BPNN model demonstrated higher accuracy and stability, yielding superior overall prediction performance.
A quantitative model for rapid fruit quality assessment during the apricot–plum color transition was established using NIR spectroscopy. The BPNN model delivered optimal predictions for total phenols content, peel L*, peel b*, vitamin C content, flavonoids content, soluble solids content, soluble sugars content, and soluble protein content yielded the best predictive results using BPNN models. However, the model performance for flesh a* requires further optimization and improvement. This study provides technical support for rapid quality assessment and maturity detection of the apricot–plum during color transition in practical production.

Author Contributions

Conceptualization, L.D. and Y.S.; methodology, L.D.; validation, L.D. and H.X.; formal analysis, M.W.; investigation; resources, Y.S.; data curation, L.D., Z.F., Q.L. and H.X.; writing—original draft preparation, L.D.; writing—review and editing, Y.S. and W.G.; visualization, L.D.; supervision, M.W.; project administration, Y.S.; funding acquisition, Y.S. and F.C. All authors have read and agreed to the published version of the manuscript.

Funding

This research was funded by Research and Demonstration on Breeding and Propagation Techniques for High-Quality Varieties of Xinjiang European plum and apricot–plum under the Autonomous Region Key R&D Programme, grant number 2023B02016; Autonomous Region’s Rural Development Key Personnel Training Programme: Integrated Application and Demonstration of Green and Efficient Cultivation Management Techniques for the Apricot–Plum, grant number 2023SNGGCY023.

Institutional Review Board Statement

Not applicable.

Informed Consent Statement

Not applicable.

Data Availability Statement

The original contributions presented in the study are included in the article.

Conflicts of Interest

The authors declare no conflicts of interest.

References

  1. Popova, A.; Mihaylova, D.; Pandova, S.; Doykina, P. Research-Gap-Spotting in Plum–Apricot Hybrids—Bioactive Compounds, Antioxidant Activities, and Health Beneficial Properties. Horticulturae 2023, 9, 584. [Google Scholar] [CrossRef] [Scilit]
  2. Nicolás-Almansa, M.; Ruiz, D.; Salazar, J.A.; Guevara, A.; Cos, J.; Martínez-Gómez, P.; Rubio, M. Phenotypic and molecular characterization of new interspecific Japanese plum × apricot hybrids (plumcots). Sci. Hortic. 2023, 318, 112131. [Google Scholar] [CrossRef] [Scilit]
  3. Fu, D.; Li, F.; Du, H.; Yang, S.; Du, L.; Fu, J.; Li, F. ‘Weidi’ a new cultivar of hybrid between the species of plum and apricot. Acta Hortic. Sin. 2005, 32, 369. [Google Scholar]
  4. Popova, A.; Doykina, P.; Mihaylova, D.; Dimitrova-Dimova, M. Assessment of Pudding Formulations Using Lyophilized Apricot, Plum, and Plum–Apricot Powders: Texture, Bioactivity, and Sensory Quality. Dairy 2024, 5, 688–701. [Google Scholar] [CrossRef] [Scilit]
  5. Liu, X.S.; Li, J.; Pan, Z. Effects of 1-MCP on Post Harvest Physiology and Storage Quality of Pluot to USA Fruits. North. Hortic. 2010, 02, 205–208. [Google Scholar]
  6. Nicolaï, B.M.; Beullens, K.; Bobelyn, E.; Peirs, A.; Saeys, W.; Theron, K.I.; Lammertyn, J. Nondestructive measurement of fruit and vegetable quality by means of optical spectroscopy: A review. Postharvest Biol. Technol. 2007, 46, 99–118. [Google Scholar] [CrossRef] [Scilit]
  7. Walsh, K.B.; Blasco, J.; Zude-Sasse, M.; Sun, X. Visible-NIR ‘point’ spectroscopy in postharvest fruit and vegetable assessment: The science behind three decades of commercial use. Postharvest Biol. Technol. 2020, 168, 111246. [Google Scholar] [CrossRef] [Scilit]
  8. Lu, R. Multispectral imaging for predicting firmness and soluble solids content of apple fruit. Postharvest Biol. Technol. 2004, 31, 147–157. [Google Scholar] [CrossRef] [Scilit]
  9. Merzlyak, M.N.; Solovchenko, A.E.; Gitelson, A.A. Reflectance spectrophotometry in the fruit quality assessment. J. Agric. Food Chem. 2003, 51, 6317–6323. [Google Scholar]
  10. Li, X.; Wei, Y.; Xu, J.; Feng, X.; Wu, F.; Zhu, R.; He, Y. Non-destructive determination of soluble solids content and firmness in European plums by near-infrared spectroscopy. Postharvest Biol. Technol. 2018, 141, 8–18. [Google Scholar] [CrossRef] [Scilit]
  11. Bureau, S.; Ruiz, D.; Reich, M.; Gouble, B.; Bertrand, D.; Audergon, J.M.; Renard, C.M. Application of ATR-FTIR spectroscopy for chemical characterization of apricot fruit and rapid determination of major compounds. Food Chem. 2009, 115, 1130–1140. [Google Scholar] [CrossRef] [Scilit]
  12. Rébufa, C.; Pany, I.; Bombarda, I. NIR spectroscopy for the quality control of Moringa oleifera (Lam.) leaf powders: Prediction of minerals, protein and moisture contents. Food Chem. 2018, 261, 311–321. [Google Scholar] [CrossRef] [Scilit] [PubMed]
  13. Sánchez, M.T.; Pérez-Marín, D.; Torres, I.; Gil, B.; Garrido-Varo, A.; De la Haba, M.J. Use of NIRS technology for on-vine measurement of nitrate content and other internal quality parameters in intact summer squash for baby food production. Postharvest Biol. Technol. 2017, 125, 122–128. [Google Scholar] [CrossRef] [Scilit]
  14. Graham, S.F.; Haughey, S.A.; Ervin, R.M.; Cancouët, E.; Bell, S.; Elliott, C.T. The application of near-infrared (NIR) and Raman spectroscopy to detect adulteration of oil used in animal feed production. Food Chem. 2012, 132, 1614–1619. [Google Scholar] [CrossRef] [Scilit]
  15. Liu, Z.B.; Ji, H.H.; Li, Z.Y.; Jiang, S.J. Medicine discrimination of NIRS based on a regularized collaborative representation identification with the gabor optimizer. Optik 2019, 180, 549–558. [Google Scholar] [CrossRef] [Scilit]
  16. Srivastava, H.K.; Wolfgang, S.; Rodriguez, J.D. Expanding the analytical toolbox for identity testing of pharmaceutical ingredients: Spectroscopic screening of dextrose using portable Raman and near infrared spectrometers. Anal. Chim. Acta 2016, 914, 91–99. [Google Scholar] [CrossRef] [Scilit]
  17. Balabin, R.M.; Syunyaev, R.Z. Petroleum resins adsorption onto quartz sand: Near infrared (NIR) spectroscopy study. J. Colloid Interface Sci. 2008, 318, 167–174. [Google Scholar] [CrossRef] [Scilit]
  18. Cayuela, J.A.; García-Martín, J.F. Sorting olive oil based on alpha-tocopherol and total tocopherol content using near-infra-red spectroscopy (NIRS) analysis. J. Food Eng. 2017, 202, 79–88. [Google Scholar] [CrossRef] [Scilit]
  19. Katuwal, S.; Knadel, M.; Norgaard, T.; Moldrup, P.; Greve, M.H.; de Jonge, L.W. Predicting the dry bulk density of soils across Denmark: Comparison of single-parameter, multi-parameter, and vis-NIR based models. Geoderma 2020, 361, 114080. [Google Scholar] [CrossRef] [Scilit]
  20. Pino-Torres, C.; Maspoch, S.; Castillo-Felices, R.; Pérez-Rivera, M.; Aranda-Bustos, M.; Peña-Farfal, C. Evaluation of NIR and Raman spectroscopies for the quality analytical control of a solid pharmaceutical formulation with three active ingredients. Microchem. J. 2020, 154, 104576. [Google Scholar] [CrossRef] [Scilit]
  21. Wang, R.Y.; Luo, S.S.; Zhen, Z.Y. Study on methods for judging different maturity of Prunus domestica × armeniaca in ‘Konglongdan’ Fruits. Xinjiang Agric. Sci. 2025, 62, 1408–1420. [Google Scholar]
  22. Lin, X.H.; Sun, D.W. Recent developments in vibrational spectroscopic techniques for tea quality and safety analyses. Trends Food Sci. Technol. 2020, 104, 163–176. [Google Scholar] [CrossRef] [Scilit]
  23. Jaywant, S.A.; Singh, H.; Arif, K.M. Sensors and Instruments for Brix Measurement: A Review. Sensors 2022, 22, 2290. [Google Scholar] [CrossRef] [Scilit] [PubMed]
  24. Kharbach, M.; Mansouri, M.A.; Taabouz, M.; Yu, H.W. Current Application of Advancing Spectroscopy Techniques in Food Analysis: Data Handling with Chemometric Approaches. Foods 2023, 12, 2753. [Google Scholar] [CrossRef] [Scilit]
  25. Ma, T.; Xia, Y.; Inagaki, T.; Tsuchikawa, S. Rapid and nondestructive evaluation of apple SSC and firmness using Vis-NIR spectroscopy. Postharvest Biol. Technol. 2021, 173, 111417. [Google Scholar] [CrossRef] [Scilit]
  26. Mishra, P.; Passos, D.; Marini, F.; Roger, J.M. Deep learning for near-infrared spectral data modelling: Hypes and benefits. TrAC Trends Anal. Chem. 2022, 157, 116804. [Google Scholar] [CrossRef] [Scilit]
  27. Fan, S.; Zhang, B.; Li, J.; Huang, W.; Wang, C. Prediction of apple soluble solids content using combined spectral and texture data. J. Food Eng. 2020, 286, 110093. [Google Scholar]
  28. Xu, M.; Sun, J.; Cheng, J.H.; Yao, K.N.; Wu, X.H.; Zhou, X. Non-destructive prediction of total soluble solids and titratable acidity in Kyoho grape using hyperspectral imaging and deep learning algorithm. Int. J. Food Sci. Technol. 2023, 58, 9–21. [Google Scholar] [CrossRef] [Scilit]
  29. Zhao, Z.L.; Wang, X.W.; Liu, D.D.; Wang, Y.W.; Gu, Y.H.; Teng, J.X.; Niu, X.Y. Quantitative analysis of SSC and titratable acidity in plum using NIR spectroscopy. Spectrosc. Spectral Anal. 2022, 42, 2836–2842. [Google Scholar]
  30. Wang, Y.; Zhu, Z.; Mao, W.; Cui, K.; Yang, L.; Sun, L.; Ma, W.; Ma, W.; Xiang, B. Multivariate Quantitative Prediction of Soluble Solids Content, Moisture Content, and Fruit Firmness in ‘Dinosaur Egg’ Apricot Plum via Near-Infrared Spectroscopy with Cross-Parameter Feature Fusion and SHapley Additive exPlanations-Based Optimization. Foods 2025, 14, 4118. [Google Scholar] [CrossRef] [Scilit]
  31. Travers, S.; Bertelsen, M.G.; Petersen, K.K.; Kucheryavskiy, S.V. Predicting pear (cv. Clara Frijs) dry matter and soluble solids content with near infrared spectroscopy. LWT—Food Sci. Technol. 2014, 59, 1107–1113. [Google Scholar] [CrossRef] [Scilit]
  32. Arianti, N.D.; Saputra, E.; Sitorus, A. Automatic generation of pre-processing strategy combined with machine learning multivariate analysis for NIR spectral data. J. Agric. Food Res. 2021, 13, 100625. [Google Scholar] [CrossRef] [Scilit]
  33. Galvão, R.K.H.; Araujo, M.C.U.; José, G.E.; Pontes, M.J.C.; Silva, E.C.; Saldanha, T.C.B. A method for calibration and validation subset partitioning. Talanta 2005, 67, 736–740. [Google Scholar] [CrossRef] [Scilit]
  34. Mishra, P.; Lohumi, S.; Khan, H.A.; Nordon, A. Close-range hyperspectral imaging of whole plants for digital phenotyping: Recent applications and illumination correction approaches. Comput. Electron. Agric. 2020, 178, 105780. [Google Scholar] [CrossRef] [Scilit]
  35. Contreras, J.; Bocklitz, T. Explainable artificial intelligence for spectroscopy data: A review. Pflügers Arch. Eur. J. Physiol. 2025, 477, 603–615. [Google Scholar] [CrossRef] [Scilit]
  36. Sabzi, S.; Pourdarbani, R.; Rohban, M.H.; García-Mateos, G.; Arribas, J. Estimation of nitrogen content in cucumber plant (Cucumis sativus L.) leaves using hyperspectral imaging data with neural network and partial least squares regressions. Chemometr. Intell. Lab. Syst. 2021, 217, 104404. [Google Scholar] [CrossRef] [Scilit]
  37. Bedin, F.C.B.; Faust, M.V.; Guarneri, G.A.; Assmann, T.S.; Lafay, C.B.B.; Soares, L.F.; de Oliveira, P.A.V.; dos Santos-Tonial, L.M. NIR associated to PLS and SVM for fast and non-destructive determination of C, N, P, and K contents in poultry litter. Spectrochim. Acta A Mol. Biomol. Spectrosc. 2021, 245, 118834. [Google Scholar] [CrossRef] [Scilit] [PubMed]
  38. Meng, Q.L.; Shang, J.; Huang, R.S.; Zhang, Y. Determination of soluble solids content and firmness in plum using hyperspectral imaging and chemometric algorithms. J. Food Process Eng. 2021, 44, e13611. [Google Scholar] [CrossRef] [Scilit]
  39. Sun, Y.L.; Yu, F.; Wang, Y.T.; Li, J.Q.; Fan, Y.P. Analysis and comprehensive evaluation of fruit quality of 65 Prunus cerasifera Ehrh germplasm resources in Xinjiang. Food Ferment. Ind. 2022, 1–13. [Google Scholar]
  40. Xia, Y.L.; Qu, Q.; Yang, Z.; Bao, J.K. The QTL Mapping Analysis of Fruit Total Flavonoids and Phenols in Jujube. Mol. Plant Breed. 2022, 1–16. [Google Scholar]
  41. Wang, R.Y.; Hu, H.; Luo, S.S.; Zhen, Z.Y.; Xu, Y.Y.; Hu, X.J. Fruit Quality Analysis of Prunus domestica × armeniaca at Different Harvest Maturity Levels. J. Agric. Sci. Technol. 2025, 27, 158–169. [Google Scholar]
  42. Ma, P.Q.; Wang, W.; Wang, P.; Tang, X.L.; Huang, Y.J. Relationship between the color change of Citrus Gonggan flesh and the maturity in harvest time. Guangdong Agric. Sci. 2010, 37, 63–64. [Google Scholar] [CrossRef]
  43. Cherian, S.; Figueroa, C.R.; Nair, H. ‘Movers and shakers’ in the regulation of fruit ripening: A cross-dissection of climacteric versus non-climacteric fruit. J. Exp. Bot. 2014, 65, 4705–4722. [Google Scholar] [CrossRef] [Scilit] [PubMed]
  44. Kan, E.E.L.; Sargent, S.A.; Cantliffe, D.J.; Berry, A.D.; Shaw, N.L. Harvest Maturity and Storage Temperature Affect Postharvest Quality of ‘Wanda’ Datil Hot Pepper Grown Under Protected Culture. HortTechnology 2019, 29, 402–407. [Google Scholar] [CrossRef] [Scilit]
  45. Xue, X.M.; Hu, X.; Wang, G.P.; Wang, J.Z. Effects of different maturities on characteristics of plum fruit quality. Non-Wood For. Res. 2020, 38, 26–36. [Google Scholar]
  46. Zhang, Z.G.; Yan, L.; Chang, C.; Li, H.; Cheng, P.; Yang, L. Effect of different maturity on fruit quality of apricot. Acta Agric. Zhejiangensis 2021, 33, 1402–1408. [Google Scholar]
  47. Wang, G.P.; Wang, J.; Xue, X.M. Analysis of Fruit Quality and Aromatic Components of Plum New Variety “Jinhong” in Different Harvest Times. Acta Agric. Jiangxi 2015, 27, 88–91. [Google Scholar]
  48. E, J.; Zhai, C.; Jiang, X.; Xu, Z.; Wudan, M.; Li, D. Non-destructive detection of chilled mutton freshness using a dual-branch hierarchical spectral feature-aware network. Foods 2025, 14, 1379. [Google Scholar] [CrossRef] [Scilit]
  49. Zhai, H.; Xie, P.; Xie, X.; Sha, S.S. Deep learning-enabled hyperspectral imaging for high-accuracy non-destructive quantification of nutritional components in multi-variety apples. Front. Plant Sci. 2025, 16, 1634785. [Google Scholar] [CrossRef] [Scilit]
  50. Osborne, B.G.; Fearn, T.; Hindle, P.H. Practical NIR Spectroscopy with Applications in Food and Beverage Analysis; Longman Scientific & Technical: Harlow, UK, 1993. [Google Scholar]
  51. Williams, P.; Norris, K. Near-Infrared Technology in the Agricultural and Food Industries; American Association of Cereal Chemists: St. Paul, MN, USA, 2001. [Google Scholar]
  52. Liu, H.J.; Wei, C.Y.; Han, W.; Yao, Y. Determination of Huanghua Pear’s Harvest Time Based on Convolutional Neural Networks by Visible-Near Infrared Spectroscopy. Spectrosc. Spectral Anal. 2020, 40, 2932–2936. [Google Scholar]
  53. Qiu, Z.; Ma, Q.; Wu, Z.; Yao, J.; Sang, L.; Ma, Y.; Huang, Y.; Li, Y. Determination of Fruit Ripening Degree Based on Convolutional Neural Network and Hyperspectral Imaging Technology. Mod. Food Sci. Technol. 2025, 41, 313–322. [Google Scholar] [CrossRef]
  54. Li, L.; Zhang, G.; Shi, R.; Nie, J.; Chai, J.; Liu, W. Online detection of citrus sugar content based on visible-near-infrared reflectance spectroscopy. Food Mach. 2025, 41, 81–87. [Google Scholar]
  55. Duckena, L.; Alksnis, R.; Erdberga, I.; Alsina, I.; Dubova, L.; Duma, M. Non-Destructive Quality Evaluation of 80 Tomato Varieties Using Vis-NIR Spectroscopy. Foods 2023, 12, 1990. [Google Scholar] [CrossRef] [Scilit]
Figure 1. Near-infrared spectral acquisition and BPNN and SVM modeling workflow.
Agriculture 16 00602 g001
Figure 2. Changes in fruit quality of ‘Fengweimeigui’ fruits during color transition periods: (a) soluble solids, vitamin C, flavonoids, total phenols, soluble sugar, titratable acid, sugar–acid ratio, soluble protein; (b) dry matter, firmness, peel L*, peel a*, peel b*, flesh L*, flesh a*, flesh b*. Notes: Data are expressed as mean ± standard deviation (SD). Different letters indicate significant differences at the p < 0.05 level.
Agriculture 16 00602 g002
Figure 3. Changes in fruit quality of ‘Weidi’ fruits during color transition periods: (a) soluble solids, vitamin C, flavonoids, total phenols, soluble sugar, titratable acid, sugar–acid ratio, soluble protein; (b) dry matter, firmness, peel L*, peel a*, peel b*, flesh L*, flesh a*, flesh b*.
Agriculture 16 00602 g003
Figure 4. External traits of apricot–plum fruits at different color transition stages.
Agriculture 16 00602 g004
Figure 5. Coefficient of variation of apricot–plum fruit quality during fruit color transition period.
Agriculture 16 00602 g005
Figure 6. Pearson correlation analysis of apricot–plum fruit quality traits.
Agriculture 16 00602 g006
Figure 7. Absorbance spectra of wavelengths of 725–974 nm for all samples: (a) the raw near-infrared spectra; (b) Savitzky–Golay Smoothing spectra.
Agriculture 16 00602 g007
Figure 8. PCA Feature wavelength selection.
Agriculture 16 00602 g008
Figure 9. Correlation between actual and predicted values for peel L*: (a) BPNN; (b) SVM.
Agriculture 16 00602 g009
Figure 10. Correlation between actual and predicted values for peel b*: (a) BPNN; (b) SVM.
Agriculture 16 00602 g010
Figure 11. Correlation between actual and predicted values for vitamin C content: (a) BPNN; (b) SVM.
Agriculture 16 00602 g011
Figure 12. Correlation between actual and predicted values for flavonoids content: (a) BPNN; (b) SVM.
Agriculture 16 00602 g012
Figure 13. Correlation between actual and predicted values for total phenols content: (a) BPNN; (b) SVM.
Agriculture 16 00602 g013
Figure 14. Correlation between actual and predicted values for soluble sugars content: (a) BPNN; (b) SVM.
Agriculture 16 00602 g014
Figure 15. Correlation between actual and predicted values for soluble protein content: (a) BPNN; (b) SVM.
Agriculture 16 00602 g015
Figure 16. Correlation between actual and predicted values for flesh L*: (a) BPNN; (b) SVM.
Agriculture 16 00602 g016
Figure 17. Correlation between actual and predicted values for dry matter content: (a) BPNN; (b) SVM.
Agriculture 16 00602 g017
Figure 18. Correlation between actual and predicted values for titratable acid content: (a) BPNN; (b) SVM.
Agriculture 16 00602 g018
Figure 19. Correlation between actual and predicted values for sugar–acid ratio: (a) BPNN; (b) SVM.
Agriculture 16 00602 g019
Figure 20. Correlation between actual and predicted values for peel a*: (a) BPNN; (b) SVM.
Agriculture 16 00602 g020
Figure 21. Correlation between actual and predicted values for flesh b*: (a) BPNN; (b) SVM.
Agriculture 16 00602 g021
Figure 22. Correlation between actual and predicted values for soluble solids content: (a) BPNN; (b) SVM.
Agriculture 16 00602 g022
Figure 23. Correlation between actual and predicted values for firmness: (a) BPNN; (b) SVM.
Agriculture 16 00602 g023
Figure 24. Correlation between actual and predicted values for flesh a*: (a) BPNN; (b) SVM.
Agriculture 16 00602 g024
Table 1. Sampling information for apricot–plum varieties.
CultivarFirst SamplingSecond SamplingThird SamplingFourth Sampling
‘Fengweimeigui’21 June 202528 June 20255 July 202512 July 2025
‘Weidi’19 June 202526 June 20253 July 202510 July 2025
Table 2. Data statistics of sample set partitioned by the SPXY algorithm.
ClassificationIndicator (Statistical Quantity)MinimumMaximumMean
Training setSoluble solids content/(%) (448)9.0323.1715.41
Vitamin C content/(mg/100 g) (448)9.5341.2928.37
Soluble sugar content/(%) (448)6.3710.848.35
Titratable acid content/(%) (448)1.382.412.02
Sugar–acid ratio (448)2.646.174.28
Soluble protein content/(mg/g) (448)0.401.620.87
Flavonoids content/(mg/g) (448)0.411.790.95
Total phenols content/(mg/g) (448)0.751.581.06
Dry matter content/(%) (448)22.3738.9129.35
Firmness/(N) (448)5.9946.0122.22
Peel L* (448)27.2357.4145.55
Peel a* (448)−12.8110.23−2.06
Peel b* (448)−7.0530.8017.14
Flesh L* (448)22.3755.9939.57
Flesh a* (448)−3.2032.6118.78
Flesh b* (448)3.7633.1317.36
Prediction setSoluble solids content/(%) (192)9.3023.1113.91
Vitamin C content/(mg/100 g) (192)10.0340.8921.53
Soluble sugar content/(%) (192)6.4410.647.73
Titratable acid content/(%) (192)1.432.392.12
Sugar–acid ratio (192)2.706.143.81
Soluble protein content/(mg/g) (192)0.401.540.66
Flavonoids content/(mg/g) (192)0.481.731.02
Total phenols content/(mg/g) (192)0.761.551.17
Dry matter content/(%) (192)22.3736.4828.86
Firmness/(N) (192)6.1746.0125.49
Peel L* (192)29.3456.3149.86
Peel a* (192)−12.419.27−4.65
Peel b* (192)−4.7829.5220.02
Flesh L* (192)22.3755.9943.43
Flesh a* (192)−3.2028.3718.48
Flesh b* (192)3.7633.1317.42
Disclaimer/Publisher’s Note: The statements, opinions and data contained in all publications are solely those of the individual author(s) and contributor(s) and not of MDPI and/or the editor(s). MDPI and/or the editor(s) disclaim responsibility for any injury to people or property resulting from any ideas, methods, instructions or products referred to in the content.