Article

Intelligent Evaluation of Environmental Impacts and Agricultural Resource Inputs to Promote Sustainable Orchard Construction
1
Interdisciplinary Research Center for Agriculture Green Development in Yangtze River Basin, College of Resources and Environment, Southwest University, Chongqing 400715, China
2
Key Laboratory of Agricultural Biosafety and Green Production of Upper Yangtze River (Ministry of Education), College of Plant Protection, Southwest University, Chongqing 400715, China
3
Southwest Mountain Regions Intelligent Agricultural Machinery Equipment Innovation Center, Southwest University, Chongqing 400715, China
4
Key Laboratory of Agricultural Equipment for Hilly and Mountain Areas, College of Engineering and Technology, Southwest University, Chongqing 400715, China
*
Author to whom correspondence should be addressed.
Agriculture 2026, 16(5), 525; https://doi.org/10.3390/agriculture16050525
Submission received: 28 January 2026 / Revised: 24 February 2026 / Accepted: 25 February 2026 / Published: 27 February 2026

Abstract

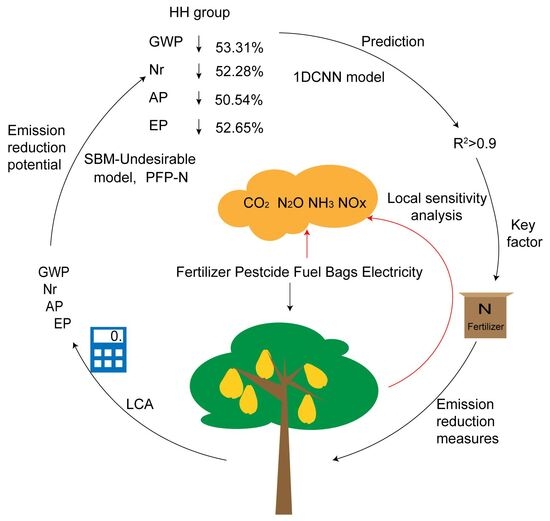
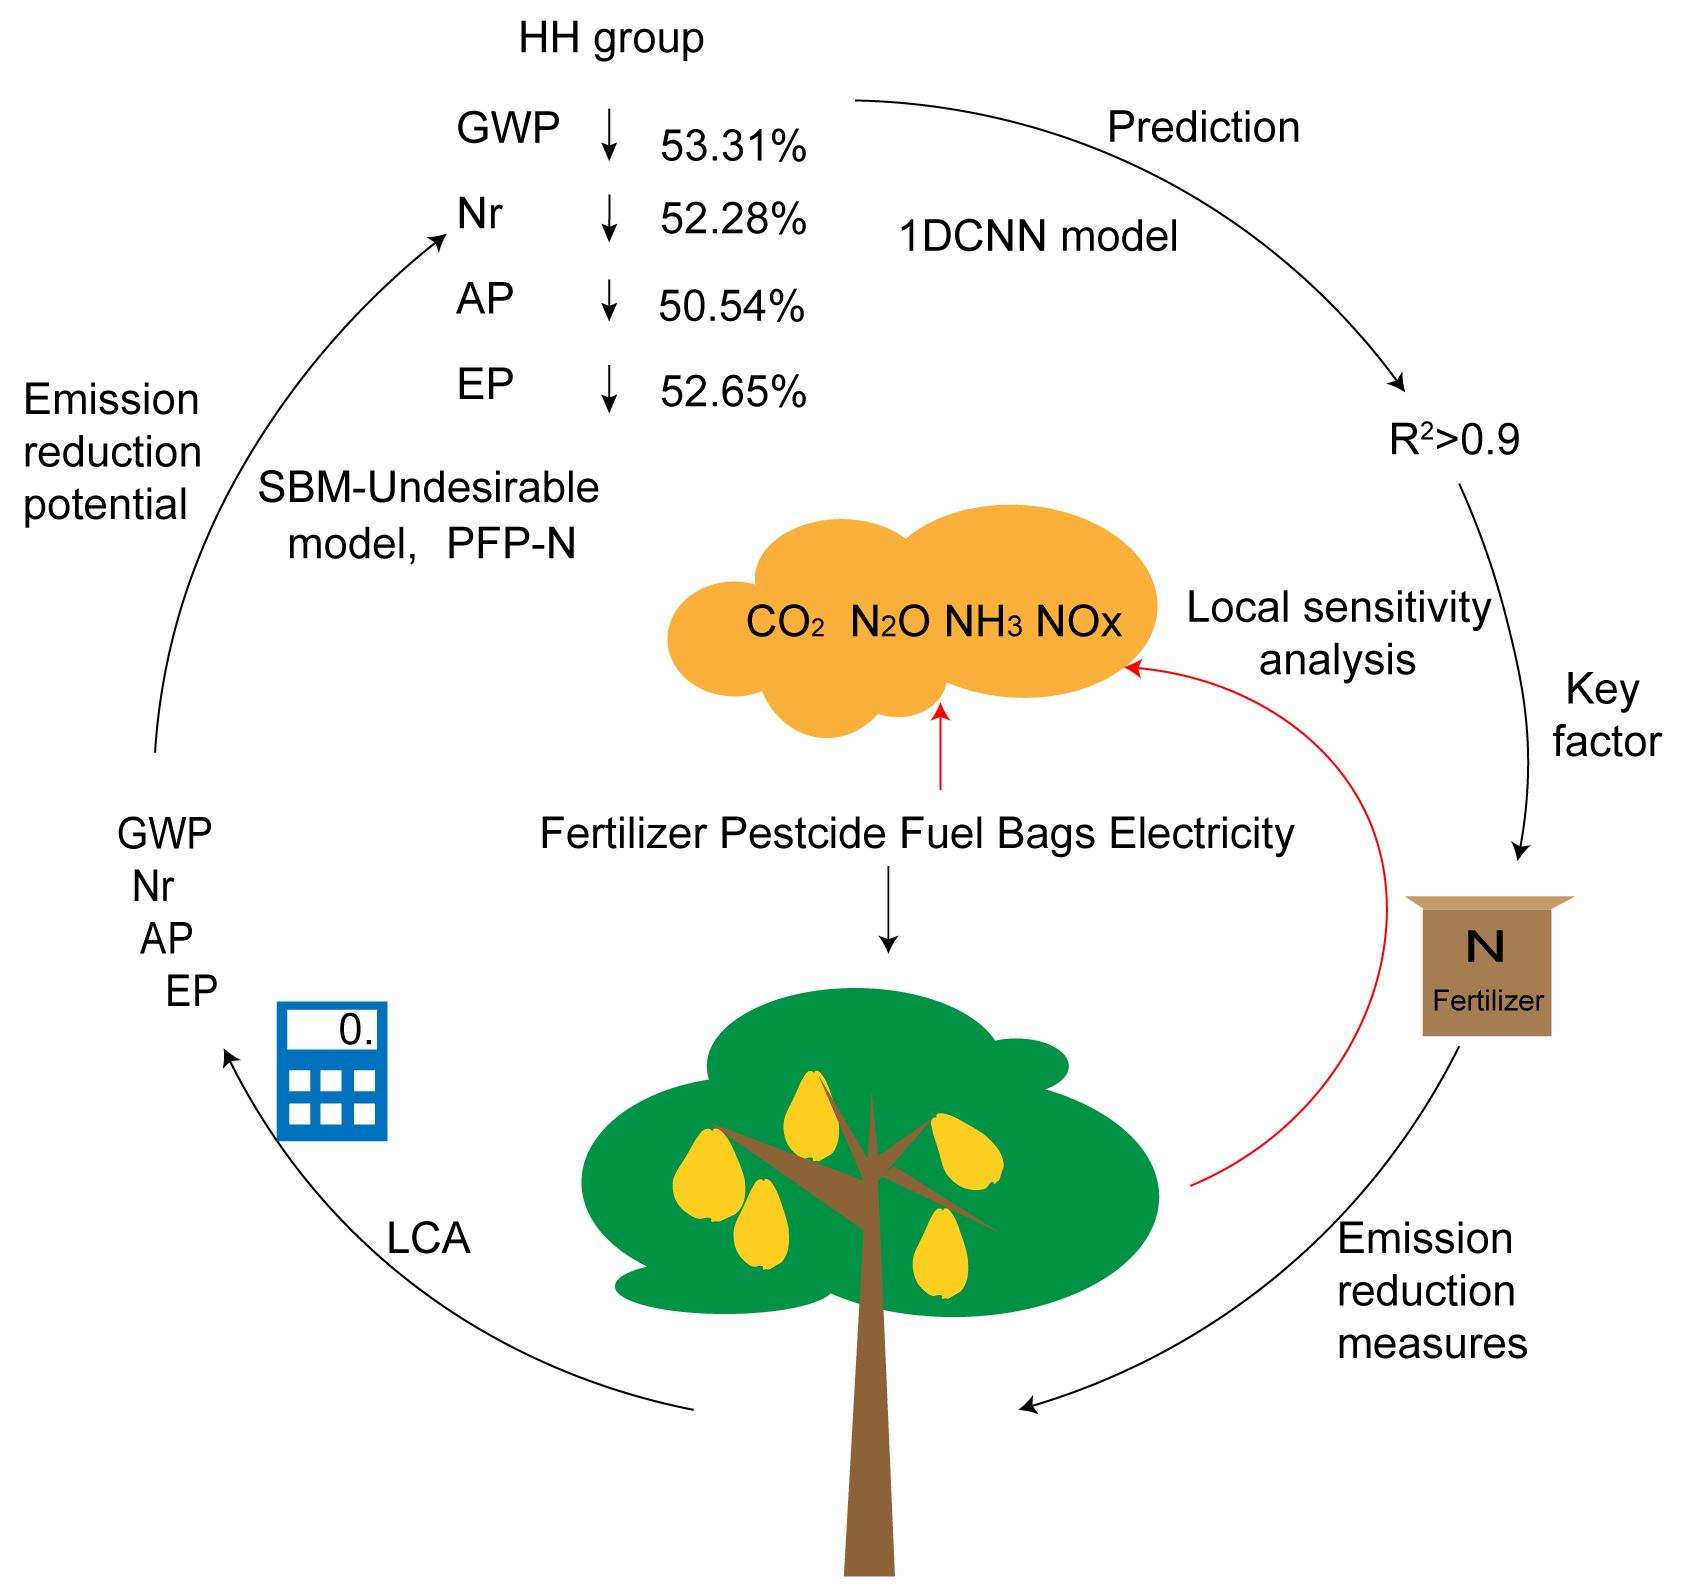
Elevated nutrient inputs exacerbate the conflict between the advancement of fruit production and environmental sustainability. Quantifying the emission-reduction potential of fruit production systems, predicting environmental impacts, and identifying key orchard management practices are critical to promoting the sustainability of fruit production. However, predictive models for orchard environmental impact are primarily based on machine-learning approaches and fail to adopt an efficiency-oriented perspective to quantify emission reductions in orchards with high yields and high partial factor productivity of nitrogen fertilizer (PFP-N). Therefore, this study adopts life-cycle assessment, a deep-learning predictive model, and a slack-based measure (SBM)-undesirable model to evaluate and forecast the environmental impacts of orchards, which encompasses global warming potential (GWP), reactive nitrogen losses (Nr), acidification potential (AP), and eutrophication potential (EP), while also identifying the mitigation potential of orchards. In addition, local sensitivity analysis reveals the extent to which each input variable affects the model predictions. The results indicated that the emission-reduction potential for the high yield and high PFP-N group was quantified as 53.31%, 52.28%, 50.54%, and 52.65% for GWP, Nr, AP, and EP, respectively. The application amount of nitrogen fertilizer is the largest contributing factor among the four environmental impacts (GWP, Nr, AP and EP). These findings are helpful for assessing and predicting environmental impacts, quantifying emission-reduction potential, and determining the relative importance of agricultural input factors associated with environmental impacts, thereby providing potential theoretical support for promoting sustainable orchard development.

Graphical Abstract

1. Introduction

Intensive orchards are characterized by high tree density and high chemical inputs aimed at maximizing orchard productivity and enhancing economic competitiveness [1]. In recent years, intensive orchard systems have expanded rapidly in China; however, associated intensive agricultural practices, such as drainage and unbalanced fertilization, have exacerbated environmental pressures [2], including eutrophication, soil acidification, reactive nitrogen losses, and greenhouse gas (GHG) emissions [3,4,5]. Therefore, clarifying the current status of agricultural inputs in orchards and quantifying the environmental risks and optimization potential of orchards are conducive to achieving green, healthy and sustainable fruit production. Pear (Pyrus L., Rosaceae) is one of the fruit trees with the largest cultivated area in China, and its cultivated area has basically stabilized at about 900 thousand hectares [6]. This study takes pear orchards as a representative case and provides a theoretical basis for advancing research on the sustainable development of the fruit industry by quantifying environmental impacts, assessing emission reduction potential, establishing environmental prediction models, and identifying the key factors influencing environmental impacts.
To evaluate the environmental impacts of agricultural systems, a variety of assessment approaches have been developed, including agro-environmental indicators, ecosystem services assessment, energy analysis, ecological footprint analysis, ecological risk assessment, the water footprint, and life-cycle assessment (LCA) [5,7,8,9]. Among these methods, LCA has become one of the most widely used approaches for assessing the environmental impact potentials of orchard production systems, as it enables the quantitative evaluation of various environmental impacts associated with agricultural production stages, such as global warming potential (GWP), eutrophication potential (EP), acidification potential (AP), reactive nitrogen losses (Nr), ozone formation potential and aquatic and terrestrial ecotoxicity potentials [4,10,11,12,13]. In studies applying LCA to perennial crop systems, research data are predominantly obtained through field surveys, farmer questionnaires, or interviews [14,15], and approximately 70% of these studies are based on a single production cycle (one year) [16]. However, LCA, an ISO 14040-based methodology [17], can be used to estimate environmental impacts of agricultural systems, such as GWP and Nr, as well as to identify contribution hotspots; however, it cannot simultaneously integrate agricultural inputs and outputs, including crop yield and environmental impacts, to assess eco-efficiency or the mitigation potential of environmental impacts [4,10,18,19]. To address these limitations, this study combines LCA, partial factor productivity of nitrogen fertilizer (PFP-N), and through the SBM-undesirable model to calculate orchard eco-efficiency, analyze redundancies among undesirable outputs (GWP, Nr, AP, EP), and assess emission reduction potential. The PFP-N is an important indicator for evaluating nitrogen use efficiency. It is calculated as the yield of each surveyed orchard (kg ha−1) divided by its nitrogen fertilizer application rate (kg ha−1) [4]. The slack-based measure (SBM)-undesirable model is a non-radial, non-directional data envelopment analysis (DEA) method that effectively distinguishes between efficient and inefficient input–output relationships [20]. Eco-efficiency aims to achieve the maximum desirable output at the minimum environmental cost (lower resource consumption and minimal undesirable outputs). An efficiency score further below 1 indicates greater potential for improvement in terms of agricultural resource inputs, desirable outputs, or undesirable outputs (environmental impacts) of the orchard system [21,22].
The application of artificial intelligence (AI) in environmental-impact prediction has increased significantly [23]. Machine learning (ML) and deep learning (DL), as subfields of AI, when integrated with LCA, facilitate rapid quantification and analysis for environmental management, thereby supporting decision-making. Predictive models of agricultural environmental impacts have been applied to a variety of crops, such as potatoes [11], oranges [24], onions [25], sugarcane [26], paddy [27], wheat [28], strawberries [29], watermelon [30], kiwi [31], apples [32], tomatoes and cucumbers [33]. Common predictive targets include global warming potential, eutrophication potential, and energy inputs. However, existing predictive models primarily rely on traditional statistical methods or AI approaches [34,35], such as linear regression, logistic regression, the Cobb–Douglas model, as well as random forest, support vector machine, gradient boosting regression, artificial neural networks (ANN), and adaptive neuro-fuzzy inference systems [26,28,36,37,38]. Traditional statistical approaches often perform poorly when handling complex nonlinear relational data, while machine learning models require manual feature extraction, limiting their scalability [39]. Deep-learning models, in contrast, can automatically extract features from raw data, reducing dependence on manual feature engineering [40]. Nevertheless, studies that combine deep learning with LCA remain limited, mainly involving models such as ANN, Long Short-Term Memory and Gated Recurrent Unit [26,41]. The One-Dimensional Convolutional Neural Network (1DCNN) is a deep learning model that extracts deep features from datasets through kernel learning [42]. To the best of our knowledge, no studies have integrated 1DCNN with life-cycle assessment (LCA) to predict multiple environmental impact potentials in orchard systems. Therefore, this study employs the one-dimensional convolutional neural network (1DCNN) model from the field of deep learning to evaluate its predictive performance in assessing environmental impacts of orchard systems. In addition, local sensitivity analysis was conducted to identify the relative sensitivity of the input variables with respect to the model predictions.
This study aims to quantitatively assess the environmental impacts of pear orchard production systems based on survey data and life-cycle assessment (LCA), evaluate their environmental risk mitigation potential, and develop an intelligent assessment framework integrating the SBM model and a 1DCNN model, thereby providing a feasible methodological approach for sustainability analysis of orchard systems.

2. Materials and Methods

2.1. Survey Region and Data Sources

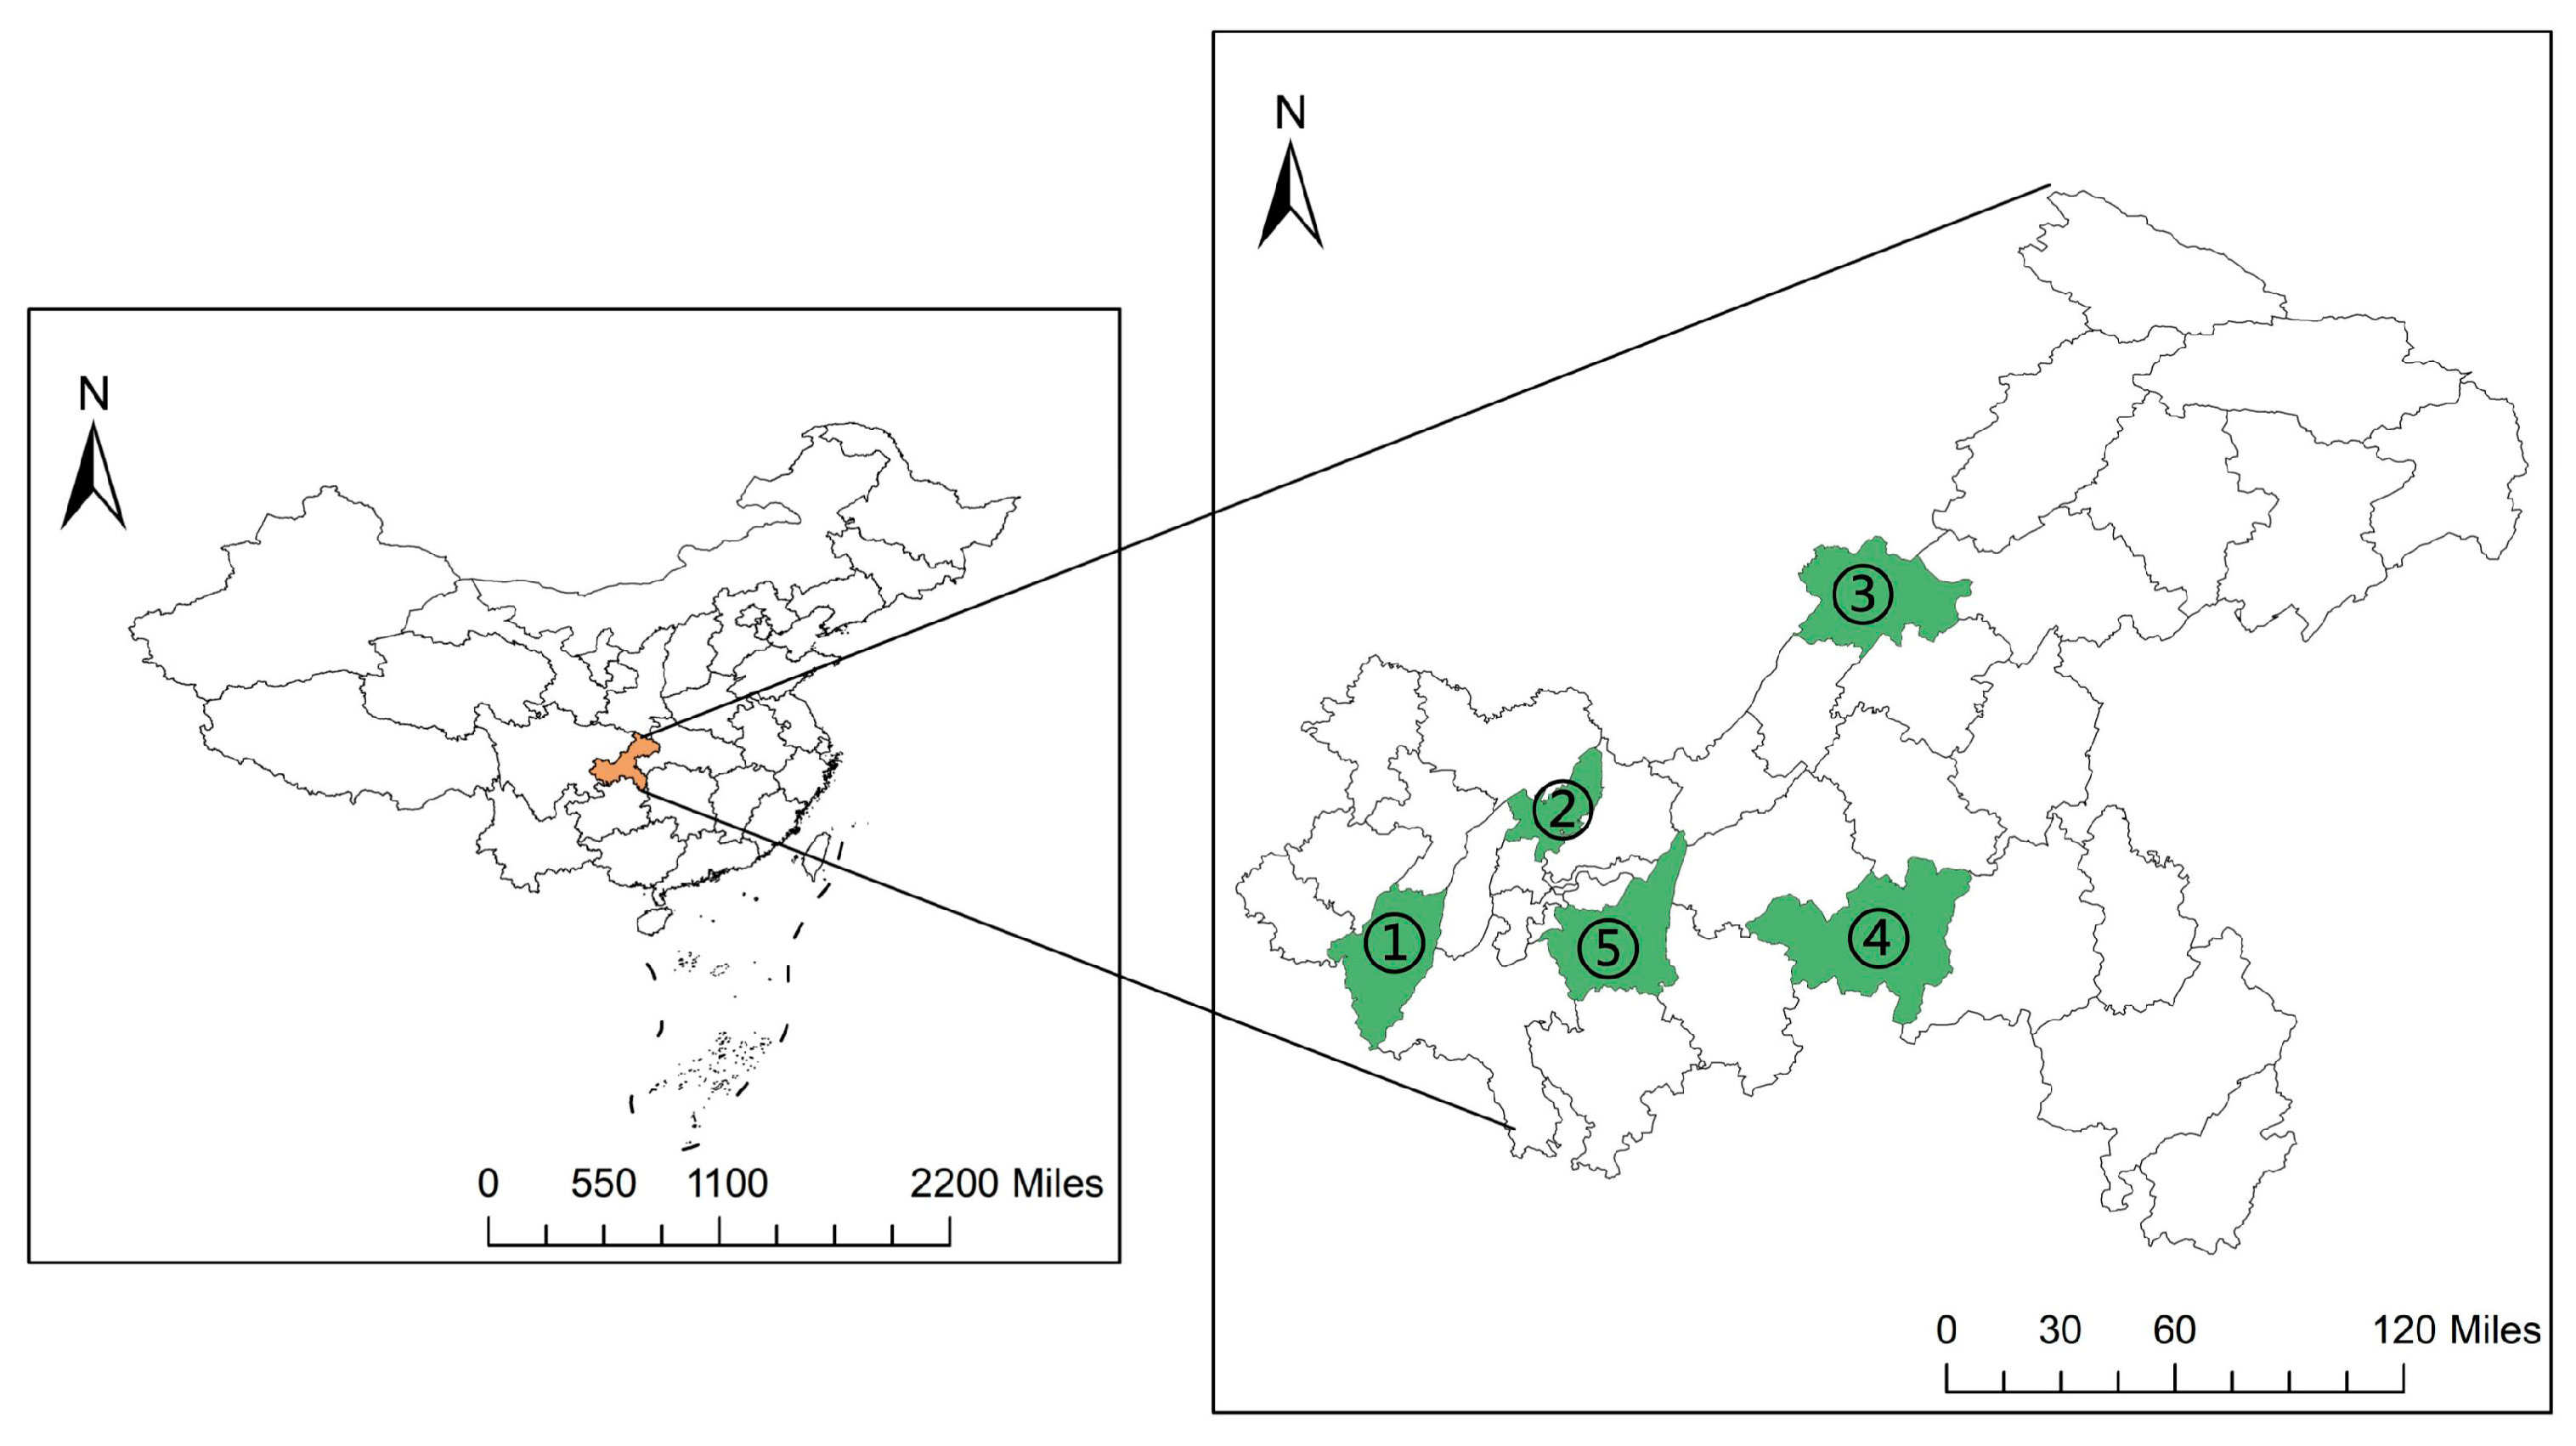
This study was conducted in five major pear-producing districts of Chongqing Municipality (28°10′–32°13′ N, 105°17′–110°11′ E), namely Beibe, Yongchua, Banan, Liangpin, and Wulong Districts (Figure 1). The region has a subtropical humid monsoon climate, with an annual mean temperature of 17.7 °C, an average annual precipitation of 1136.5 mm, and a mean annual relative humidity of 79.9%. Chongqing is characterized by complex topography, dominated by mountainous terrain. Due to the humid and rainy climate, the surveyed pear orchards mainly rely on natural rainfall for irrigation. The primary insect pests in the pear orchards are pear psylla (Cacopsylla chinensis) and oriental fruit moth (Grapholita molesta), while diseases such as pear scab and pear rust occur occasionally.
This study employed a questionnaire survey, with one to three townships randomly selected in each district. The surveyed pear orchards mainly grew the ‘Cuiguan’ pear variety, a widely cultivated pear cultivar in southern China. A total of 138 valid questionnaires were collected, including 35 from Yongchuan, 26 from Liangping, 24 from Banan, 31 from Beibei, and 22 from Wulong. The questionnaire covered basic information for each pear orchard as well as the main agricultural inputs during 2024 (corresponding to a full growing season) (Table A1). Questionnaires containing obviously unrealistic values or missing data were considered invalid and excluded from the analysis.

2.2. Methodological Framework

LCA is a method used to evaluate the environmental impacts of a product throughout its entire life cycle, from cradle to grave [14,43]. The primary purpose of applying LCA in this study is to quantify the environmental impacts of pear production, including GWP, Nr, AP and EP, and to provide a basis for subsequent mitigation potential analysis and the development of predictive models. The system boundary comprises the Agricultural Material Stage (AMS) and the Agricultural Farming Stage (AFS). The AMS includes the production and transportation of agricultural inputs such as fertilizers, pesticides, fuel and fruit bags; and the AFS, which involves orchard management activities such as pest and disease control, fertilizer application, weed management, and the operation of agricultural machinery.
This study focused on the 2024 production phase of mature orchards, excluding inputs from the orchard-establishment phase as well as post-harvest fruit consumption and waste management. The functional unit was defined as orchard production per unit area (per hectare). No co-products were considered, so environmental burdens did not require allocation. The calculated input indicators included fertilizers, pesticides, fruit bags, fuel, and electricity. Fertilizer types mainly comprised nitrogen, phosphorus, and potassium; pesticides included insecticides, fungicides, and herbicides; fruit bags referred to paper bags; fuel consisted of diesel, primarily consumed by machinery for tillage, weeding, and pesticide application; and electricity was mainly consumed by machinery for pesticide application and weeding. It is worth noting that the nitrogen, phosphorus, and potassium contents of chemical fertilizers were calculated based on the nutrient ratios indicated on the fertilizer packaging used by farmers at the time of the survey [44]. The emission factors for GWP, Nr, AP and EP (Table 1) were selected from the relevant literature on life-cycle assessment of orchard systems.
The formulas for assessing each environmental impact are as follows:
    E p i = E p A M S i + E p A F S i
where Epi represents the environmental impacts, and i includes GWP, Nr, AP, and EP. EpAMS and EpAFS represent the environmental impacts calculated for the AMS and AFS, respectively.
The formula for calculating   E p A M S i is as follows [10]:
  E p A M S i = k i j × E p r i j
where kj represents the amount of the jth agricultural input per hectare (with units of kg ha−1 for fertilizers, pesticides, fuel, and fruit bag consumption, and kWh ha−1 for electricity). Eprj represents the emission factor of the jth input during its production and transportation processes (Table 1).
At the AFS, the EpAFS of Nr is calculated as follows [10,18]:
D i r e c t   N 2 O   e m i s s i o n s   =   1.16 %   ×   N c   +   0.6 %   ×   N o
N H 3   v o l a t i l i z a t i o n = 4.46 % × N c + 29.3 % × N o
N O 3     l e a c h i n g = 23.26 % × ( N c + N o )
I n d i r e c t   N 2 O   e m i s s i o n s = 10 % × N H 3   v o l a t i l i z a t i o n + 2.5 % × N O 3   l e a c h i n g
N O x   e m i s s i o n s = 10 % × ( D i r e c t   N 2 O   e m i s s i o n s + I n d i r e c t   N 2 O   e m i s s i o n s )
where Nc and No are the nitrogen content of input chemical and organic fertilizers.
The EpAFS of GWP is calculated as follows [10,18]:
E p A F S G W P     =   ( D i r e c t   N 2 O   e m i s s i o n s +   I n d i r e c t   N 2 O   e m i s s i o n s )   ×   44 / 28   ×   265
where 265 is the conversion factor for 1 kg of N2O equivalent CO2. The factor 44/28 converts the amount of N into its equivalent N2O amount.
The EpAFS of AP is calculated as follows [45,46]:
E p A F S A P     =   1.88   ×   N H 3   v o l a t i l i z a t i o n ×   17 / 14
where 1.88 is the conversion factor for 1 kg of NH3 equivalent SO2.17/14 is the conversion factor for 1 kg of N equivalent NH3.
The EpAFS of EP is calculated as follows [4,45,46]:
E p A F S E P     =   0.33   ×   N H 3   v o l a t i l i z a t i o n   ×   17 / 14   +   0.42   × N O 3     l e a c h i n g   +   0.2 %   × P i n p u t
where 0.33 is the conversion factor for 1 kg of NH3 equivalent PO4. 0.42 is the conversion factor for 1 kg of NO3 equivalent PO4. Pinput represents the total phosphorus fertilizer input per hectare. A conversion factor of 0.2% was used to estimate PO4 emissions from phosphorus fertilizer input.
Table 1. Emission factors for environmental impacts of different inputs at the agricultural materials stage.
Emission SourceUnitGlobal Warming
kg CO2-eq Unit−1
Reactive Nitrogen Losses
kg N Unit−1
Acidification
kg SO2-eq Unit−1
Eutrophication
kg PO4-eq Unit−1
References
N fertilizerkg8.30.007150.02520.00303[10]
P2O5 fertilizerkg0.790.0001840.00060.00008[10]
K2O fertilizerkg0.550.0001460.000480.00006[10]
Pesticidekg19.10.004690.01050.00194[10,47]
Fuelkg3.750.02860.06580.0001[10,48]
ElectricitykWh0.750.001970.01450.00084[10]
Paper bagskg1.770.005710.00231[10]
N2O emission from manure 0.6%[18,49]
NH3 emission from manure 29.3%[18,49]
Manure production
N
kg2.7[50]
To determine the relationship between different orchard-practice measures and the four environmental impacts, 138 orchards were categorized into low yield and low PFP-N (LL), low yield and high PFP-N (LH), high yield and low PFP-N (HL), and high yield and high PFP-N (HH) groups based on average yield and PFP-N. PFP-N is an important indicator for assessing nitrogen fertilizer use efficiency, and the corresponding calculation formula is given as follows [4]:
P F P N = Y i e l d / T N
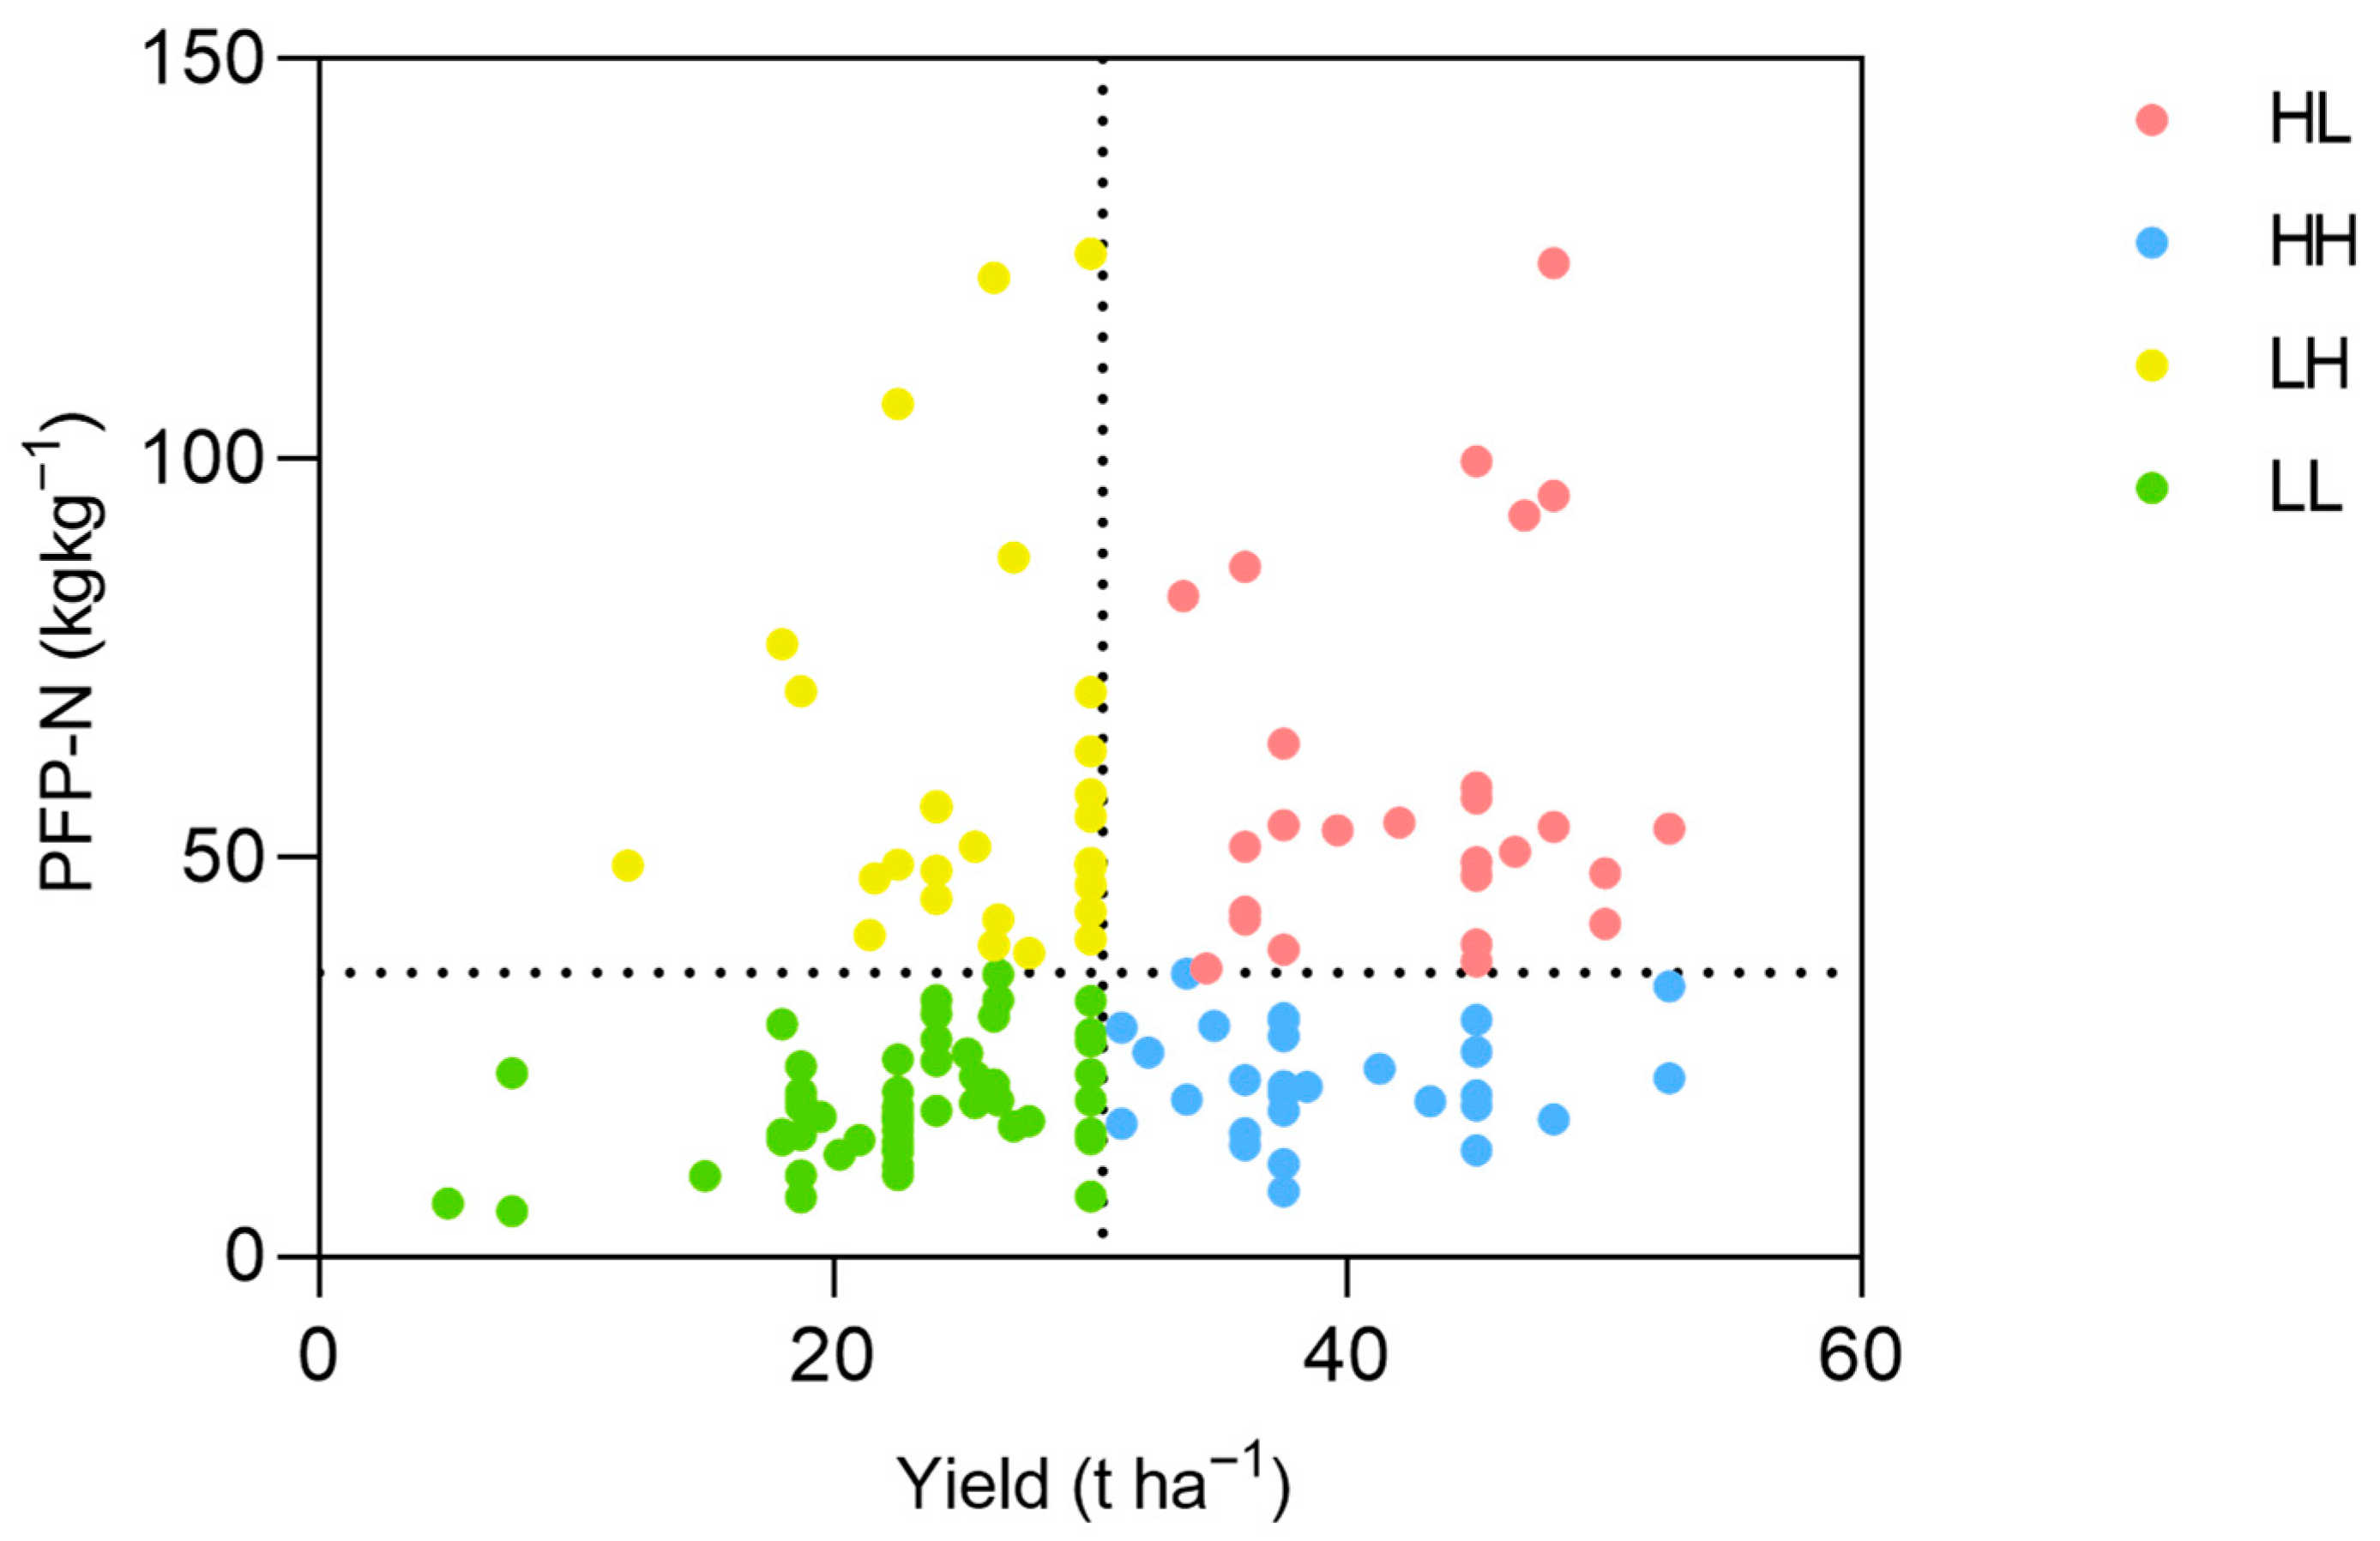
where TN (kg ha−1) represents the total nitrogen fertilizer input per hectare in orchards. Based on an average orchard yield of 30.47 kg ha−1 and an average PFP-N of 35.66 kg kg−1, the orchards were classified into four groups, with sample sizes of 56 (LL), 28 (LH), 28 (HL), and 26 (HH), respectively (Figure 2).
Each surveyed sample was regarded as a decision-making unit (DMU), and the SBM-undesirable model has been widely applied to assess the eco-efficiency (ρ*) of decision-making units in complex systems with multiple inputs and outputs. Suppose there are n DMUs, and each DMU has m inputs, q1 desired outputs, and q2 undesired outputs, which are represented by vectors xhRm, ytRq1, and yfRq2. We defined the matrices X, Yt, Yf as: X = [x1,…, xn]R(m×n), Yt = [y1t,…, ynt]R(q1×n) and Yf = [y1f,…, ynf]R(q2×n), the production possibility set P [51]:
  P = x , y t , y f | x X λ , y t Y t λ , y f Y f λ , λ 0
Thus, the SBM-undesirable model is defined as:
            ρ * = m i n ( 1 1 m i = 1 m s i x i 0 ) / 1 + 1 q 1 + q 2   r = 1 q 1 s r t y r 0 t + r = 1 q 2 s r f y r 0 f   s . t .             x 0 = X λ , + s     y 0 t = Y t λ s t y 0 f = Y f λ + s f s 0 ,     s t 0 ,     s f 0 ,   λ 0
where λ is the intensity vector, st, indicates a deficiency in good outputs, while s and sf represent the excess inputs and undesirable outputs, respectively. 0 ≤ ρ* ≤ 1, when ρ* = 1, the DMU is fully effective; if ρ* < 1, it means that the DMU is not effective, and it indicates that the DMU is inefficient and that there is potential for improvement through input reduction or output adjustment. In this study, the environmental risk reduction potential, namely the undesirable output redundancy rate, is defined as the ratio of the slack variable of undesirable output (sf) to the corresponding environmental impact, indicating the achievable scope for reducing environmental impacts under current production conditions [20,22].
In this study, nitrogen fertilizer (kg ha−1), phosphate fertilizer (kg ha−1), potash fertilizer (kg ha−1), pesticide (kg ha−1), fuel (kg ha−1), fruit bags (kg ha−1), and electricity (kWh ha−1) as input indicators, and the orchard yield (t ha−1 year−1) as the desirable output indicator, GWP, Nr, AP and EP were considered undesirable output indicators.
Artificial neural network models are a widely used mathematical method for predicting and simulating nonlinear systems [11,52]. In this study, the 1DCNN model was selected to predict four environmental impacts related to fruit production. Generally, 1DCNN models are composed of an input layer, convolutional layers, batch normalization (BN) layers, fully connected layers, an output layer, and other parts [53].
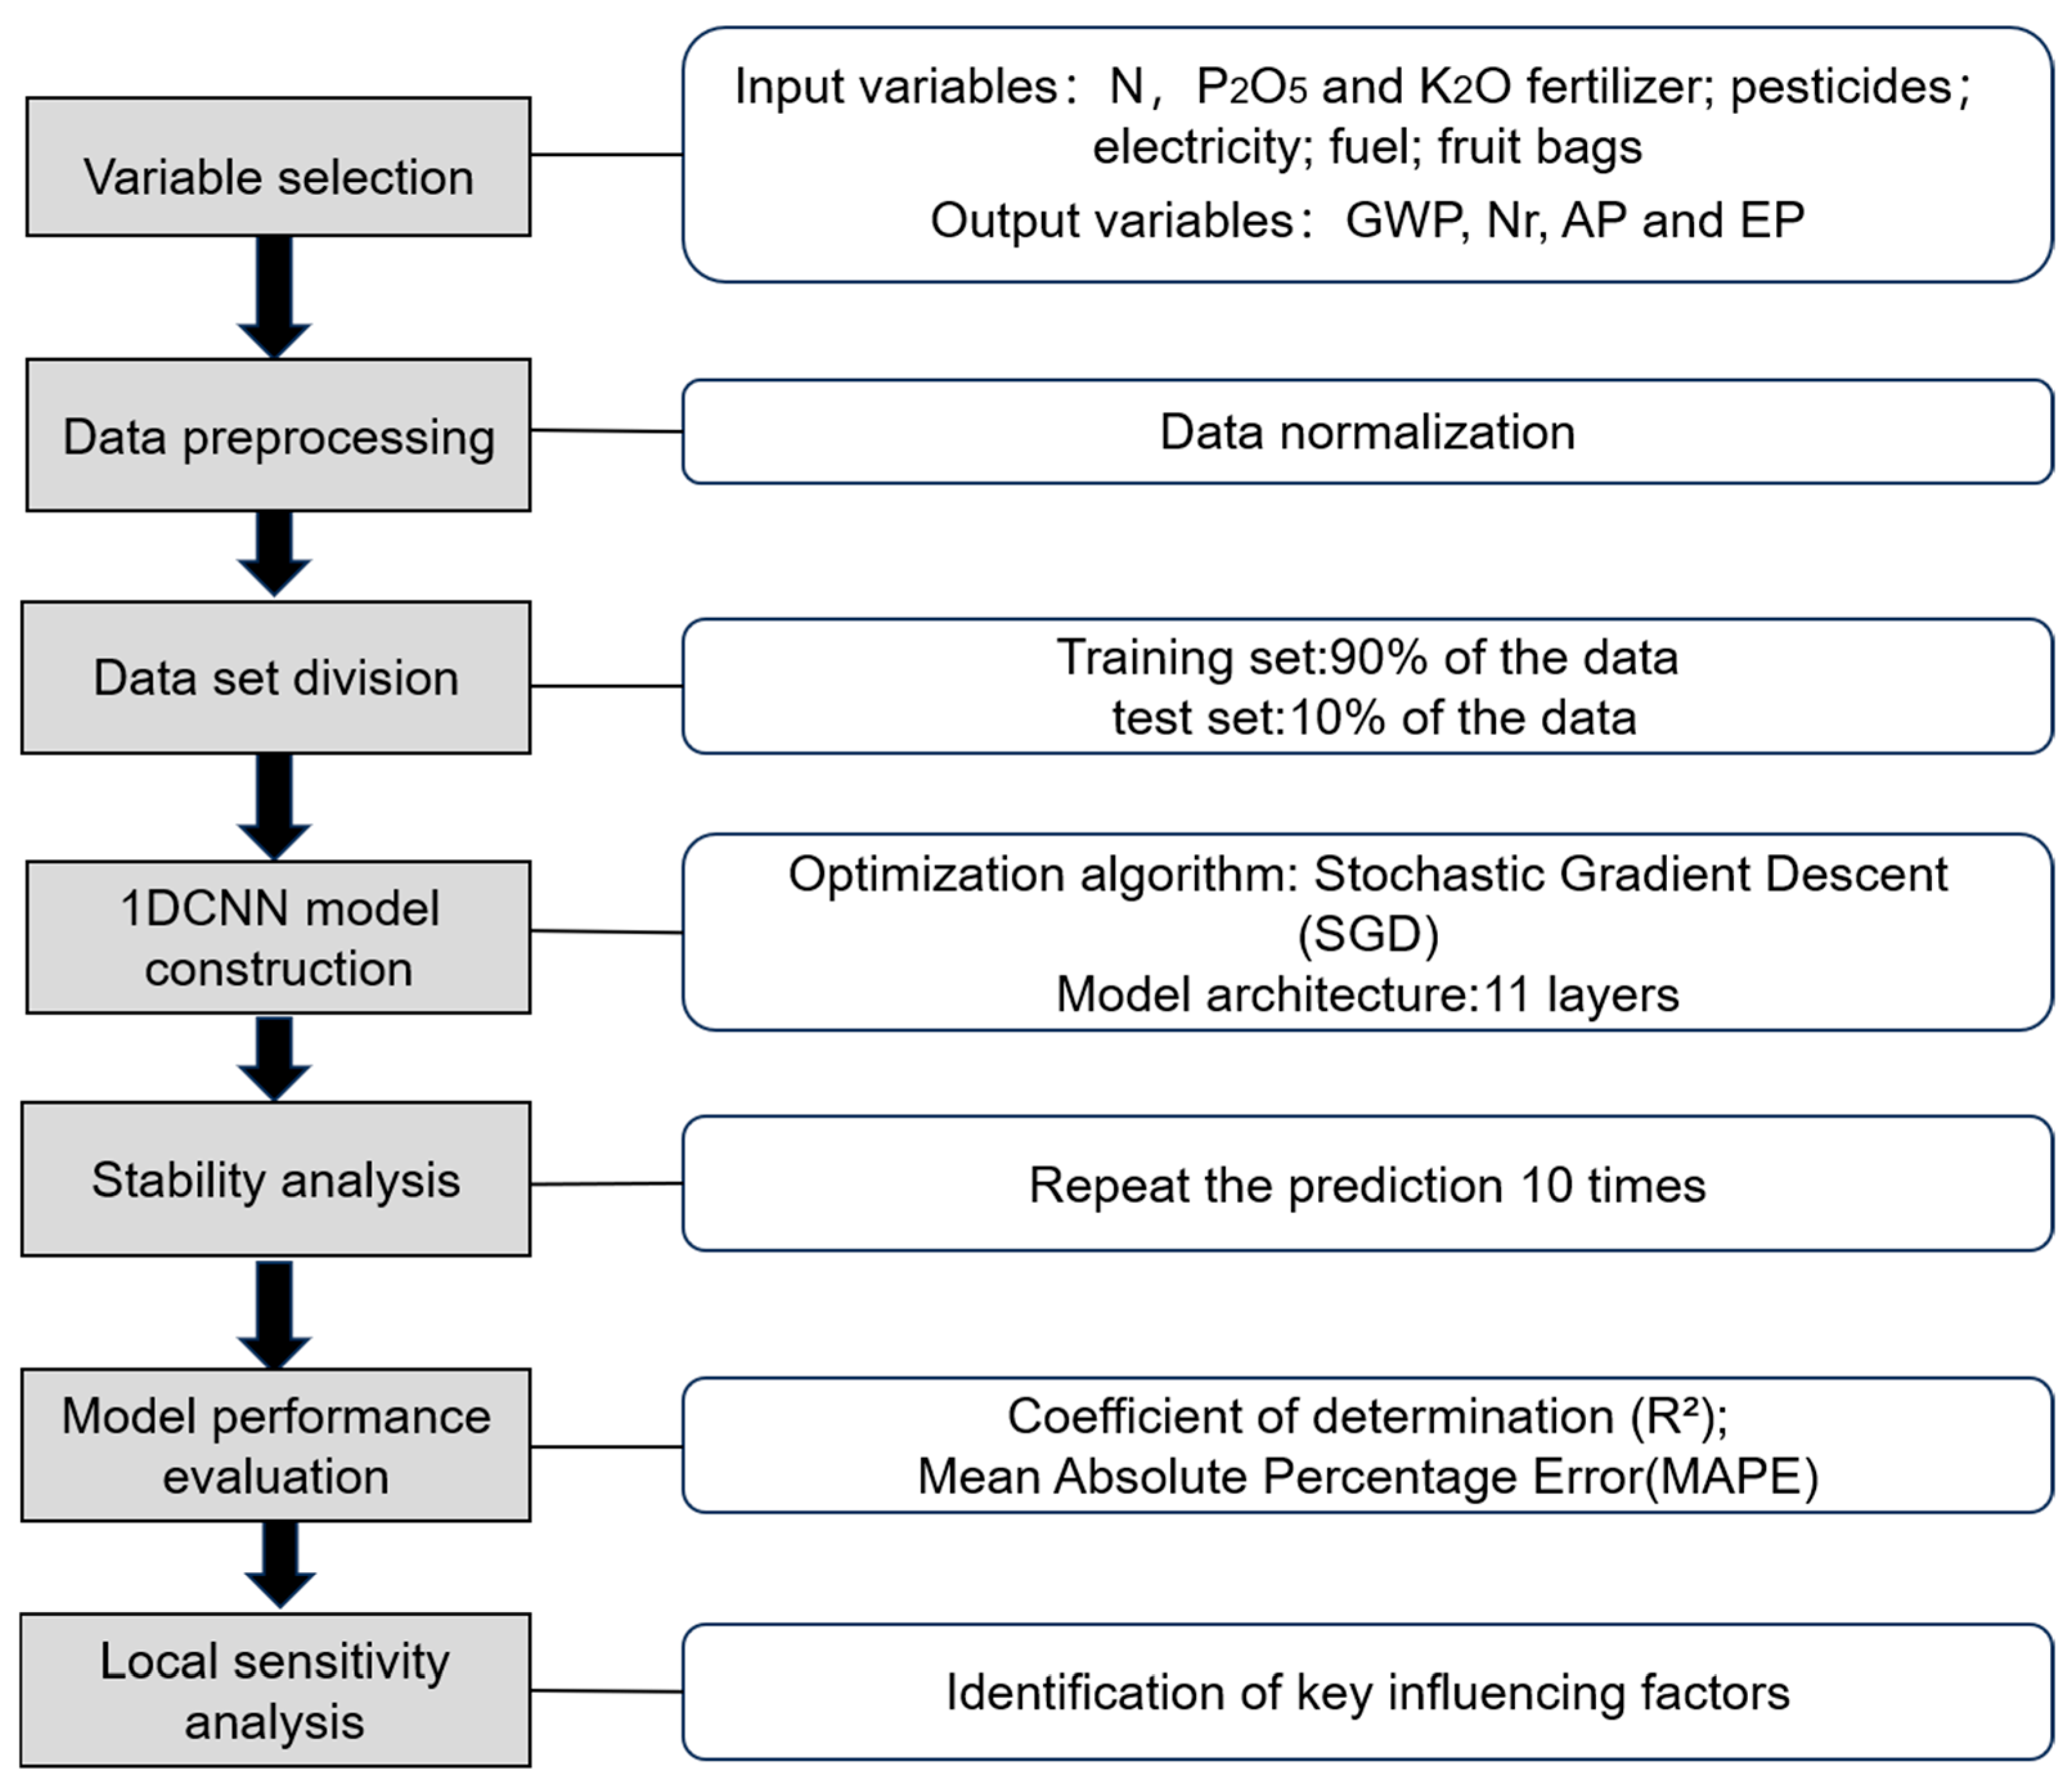
The first step in developing the model involved selecting appropriate independent variables [11]. Therefore, agricultural inputs (nitrogen, phosphorus, potassium fertilizers, pesticides, fuel, electricity, and fruit bags) were used as input variables for the model, while GWP, Nr, AP, and EP were used as output variables. A total of 90% of the sample data (124 out of 138 orchards) was randomly selected as the training set, with the remaining 10% (14 samples) used as the test set. Before model training, preprocessing was applied to all input variables to minimize uncertainties associated with missing data or extreme values. The examination indicated that all variables were complete and within reasonable ranges, and no outliers were identified. All input variables were then standardized to improve the stability of the model. In terms of training parameters, the stochastic gradient descent with momentum (SGDM) optimizer was adopted, with a mini-batch size of 32 and a maximum of 800 training epochs. The initial learning rate was set to 0.01 and decayed by a factor of 0.1 after the 500th epoch. During training, the data were shuffled at each epoch (Supplementary File S1).
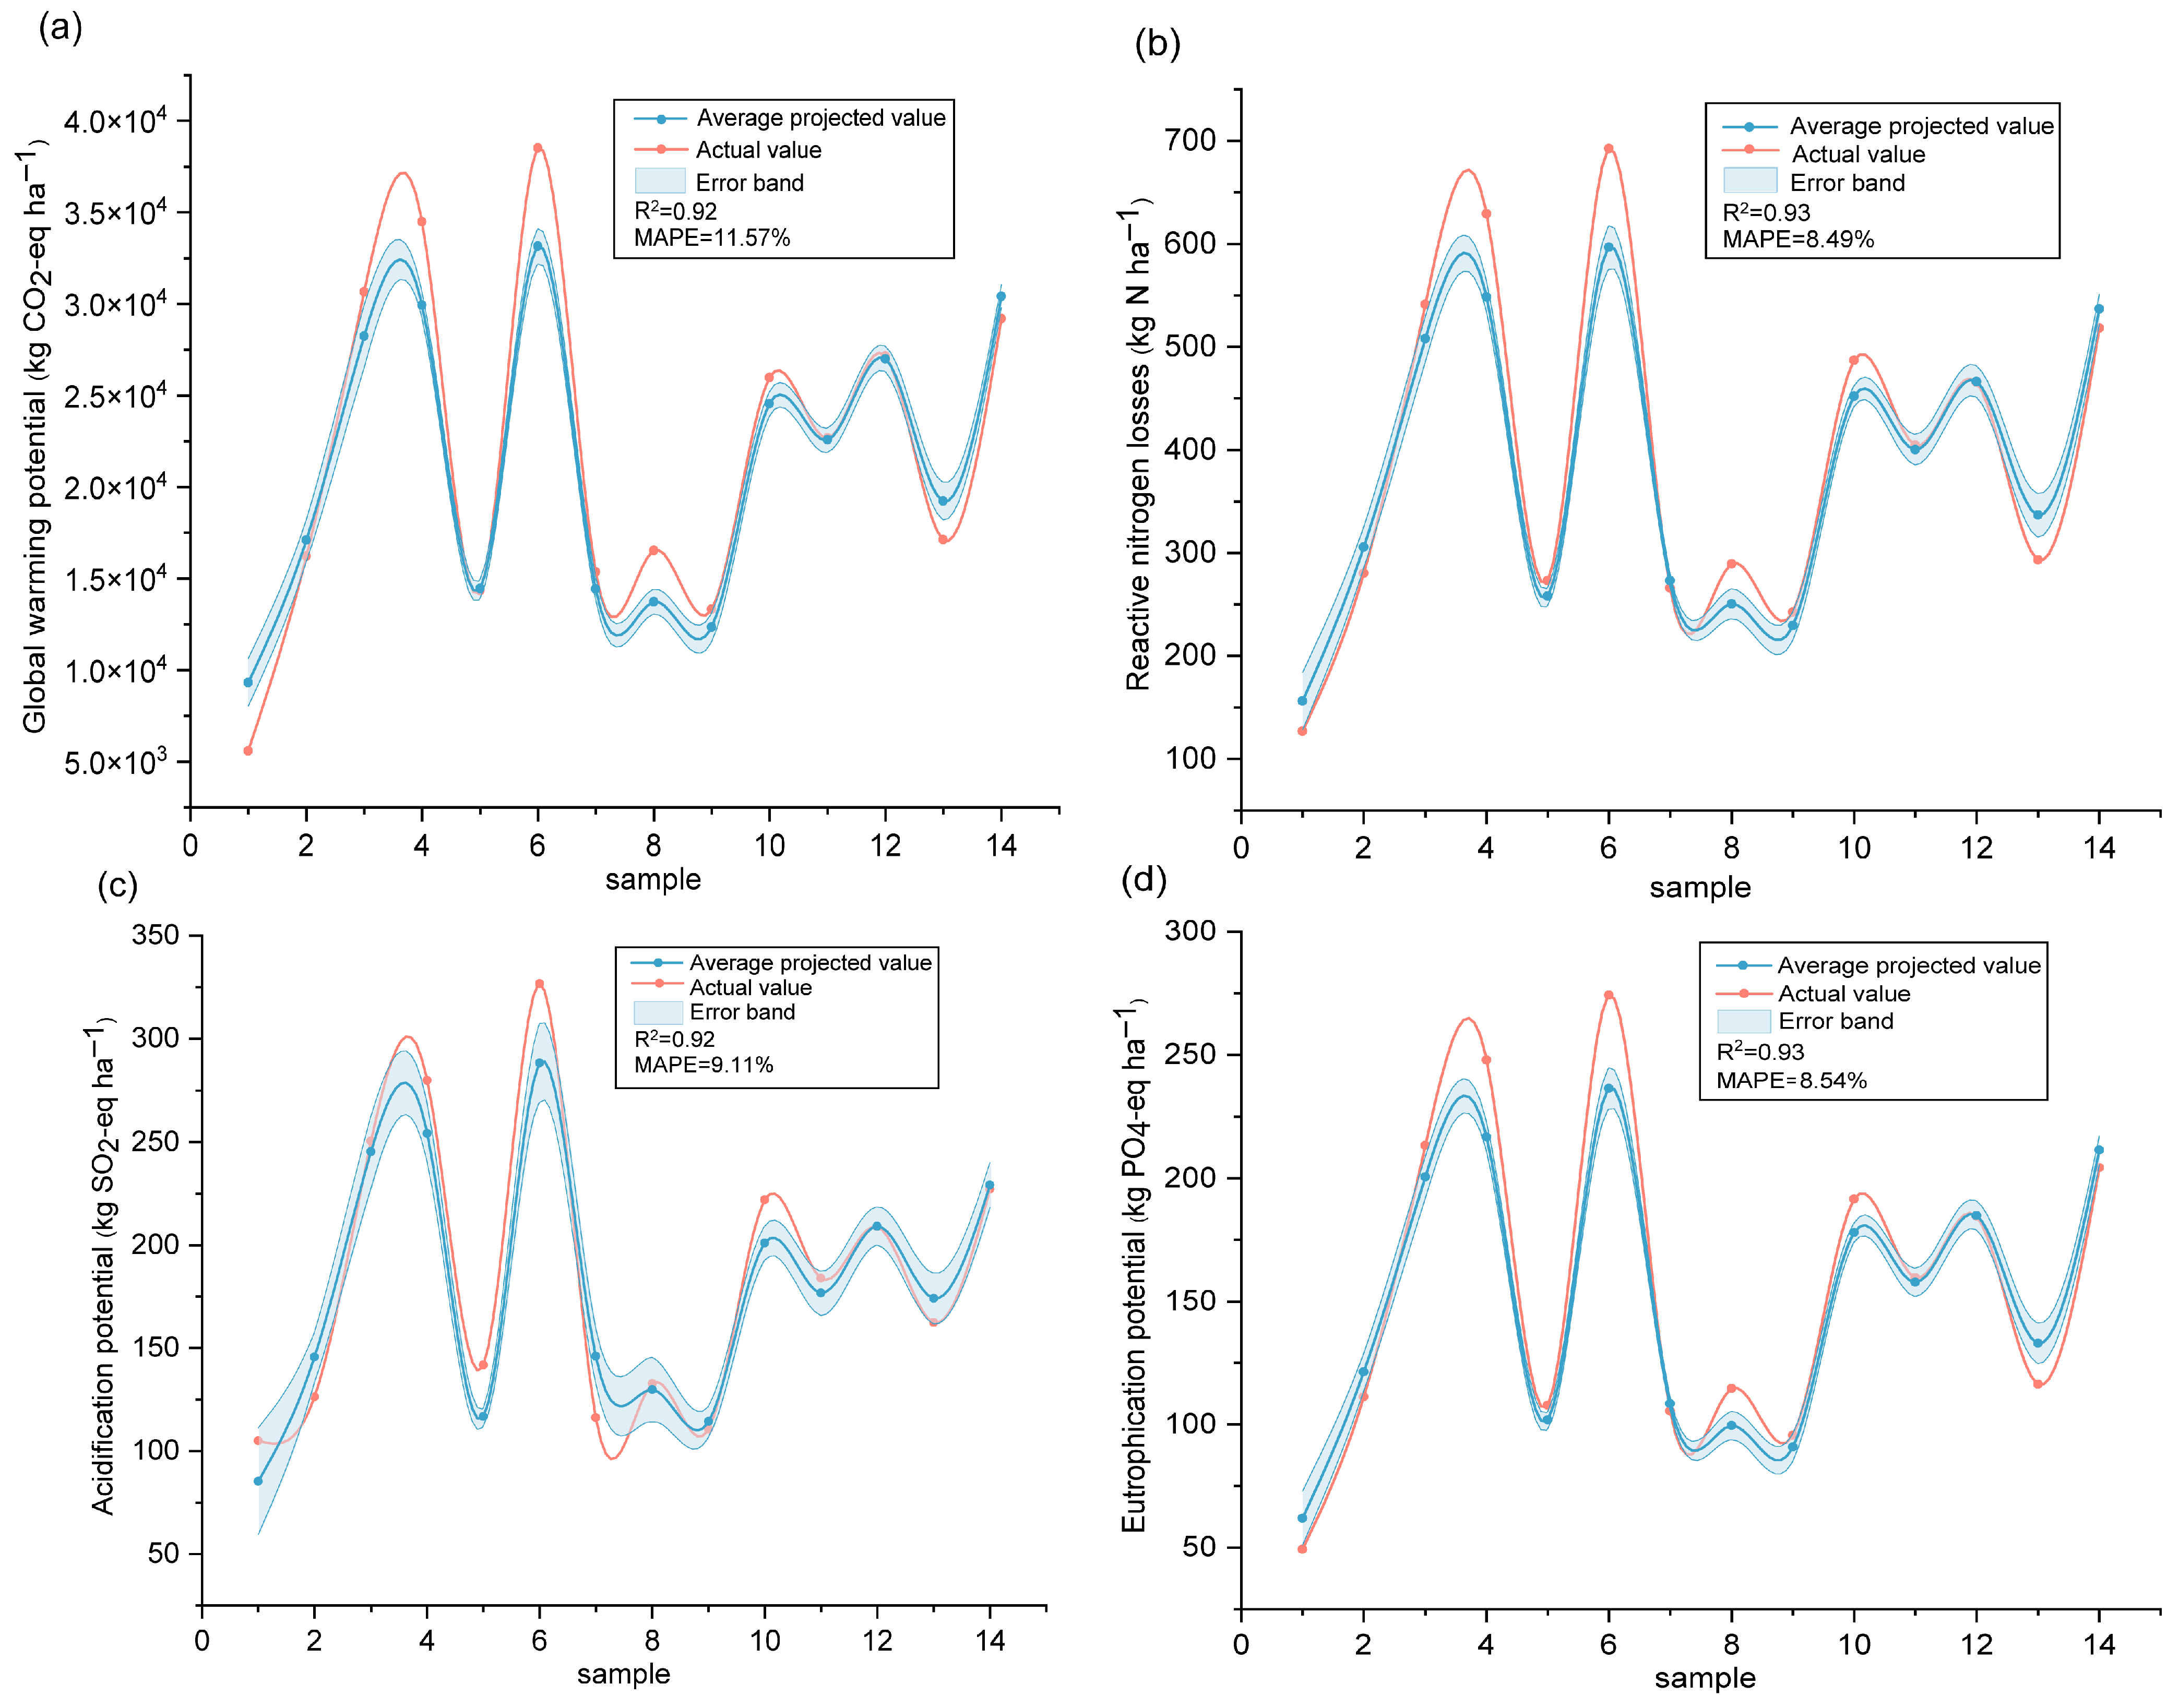
To evaluate the stability and reliability of the model’s predictive performance, the prediction process was repeated ten times. The model operation process is shown in Figure 3.
The coefficient of determination (R2) and the mean absolute percentage error (MAPE) are important indicators of model performance and are calculated as follows [32,54]:
R 2 = 1 ( i = 1 n T i t i 2 / i = 1 n ( T i T i ¯ ) 2 )
M A P E = 1 n i = 1 n t i T i T i
where n is the total number of training samples, and Ti, ti are the actual and predicted values of the ith training sample, respectively. Ti is the average of the actual values.
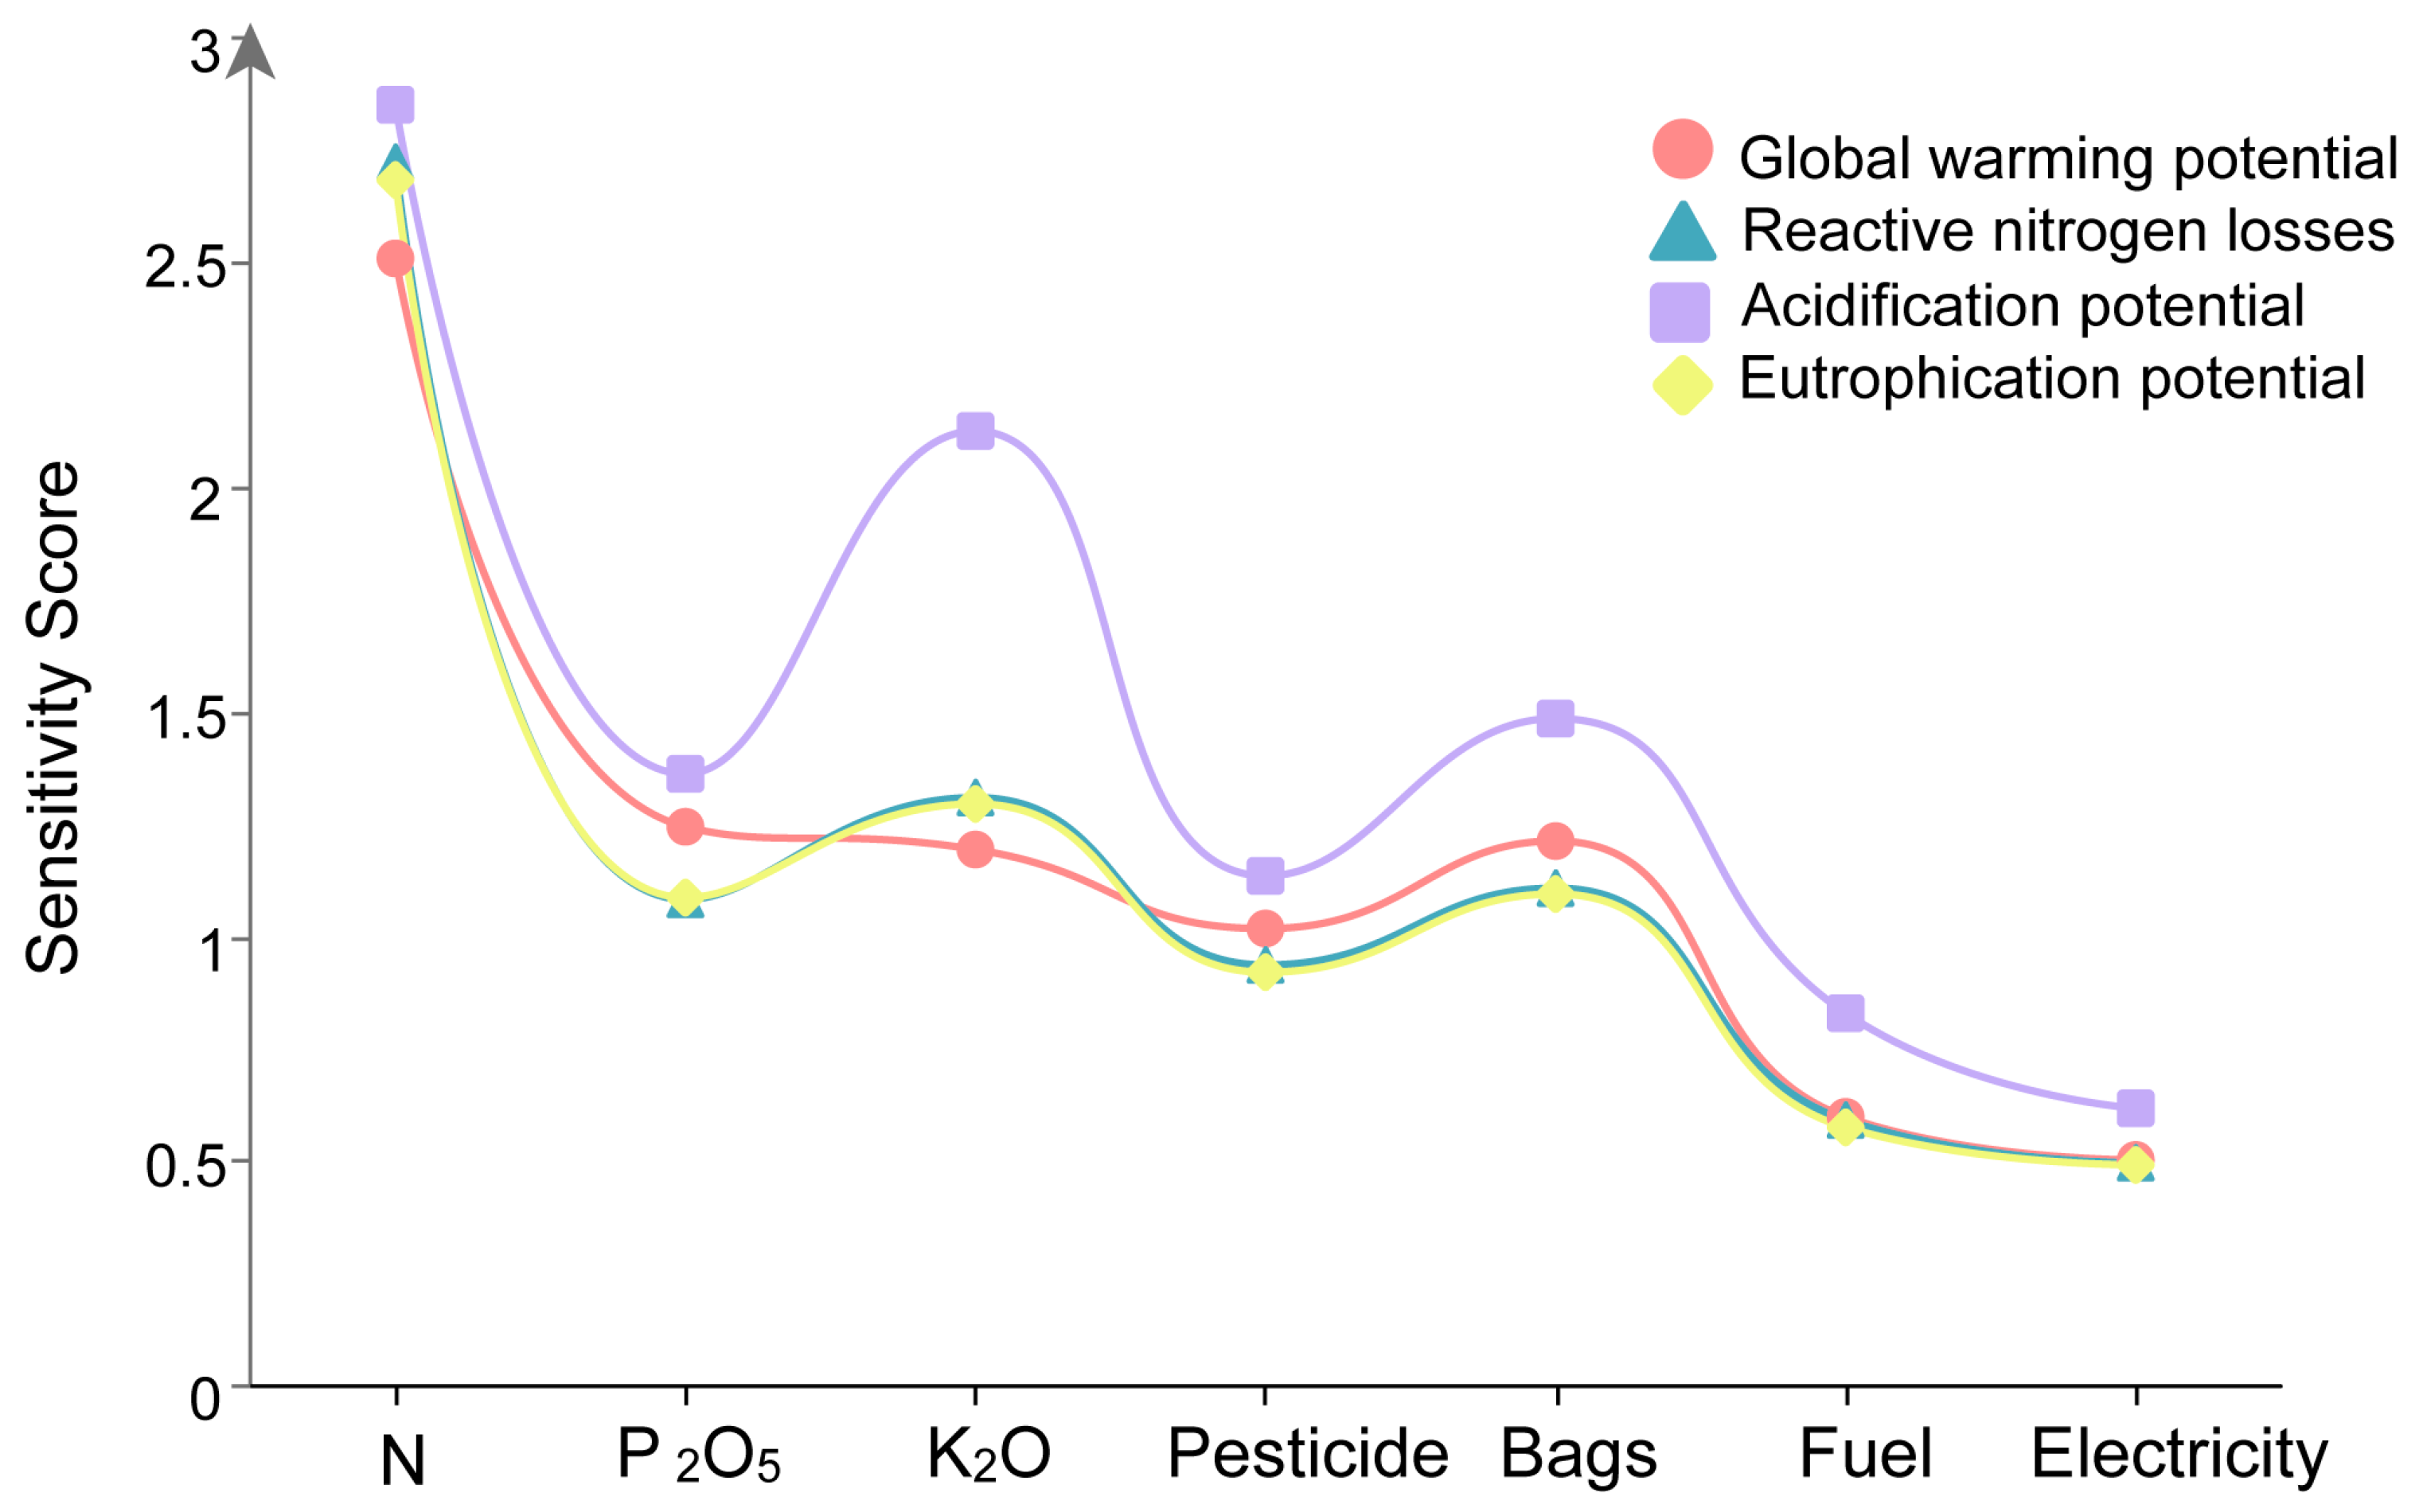
In addition, a local sensitivity analysis was conducted for the 1DCNN model to quantify the influence of different input variables on the model outputs [31]. The above models (the 1DCNN model and the SBM-undesirable model) were all created using MATLAB R2018b (The MathWorks, Inc., Natick, MA, USA) software.

3. Results

3.1. Inputs, Output, and Environmental Impacts of the Pear Production System

To facilitate the calculation of environmental impacts, Table 2 quantifies the average inputs and outputs of the orchards. The average yield was 30.47 t ha−1 year−1 (5–52.5 t ha−1 year−1). The average application rates of total nitrogen, phosphorus, and potassium fertilizers were 1188.59 kg ha−1, 657.67 kg ha−1, and 1097.13 kg ha−1, respectively. In terms of pest and disease control, the average application rate of pesticides was 24.95 kg ha−1 (ranging from 6 to 60 kg ha−1), while the use of fruit bagging materials averaged 374.99 kg ha−1 (0 to 1875 kg ha−1). For mechanized orchard management, the average diesel fuel consumption was 12.69 kg ha−1 (ranging from 0 to 132.7 kg ha−1), and the average electricity consumption was 79.17 kWh ha−1 (0 to 1040 kWh ha−1).
To clarify the environmental impacts of orchards, four environmental impacts (GWP, Nr, AP, and EP) were calculated using LCA. As shown by the results, the average values were 20,733.60 kg CO2-eq ha−1 for GWP, 372.41 kg N ha−1 for Nr, 179.43 kg SO2-eq ha−1 for AP, and 147.50 kg PO4-eq ha−1 for EP. Notably, all four environmental impacts of the fruit production system are high.
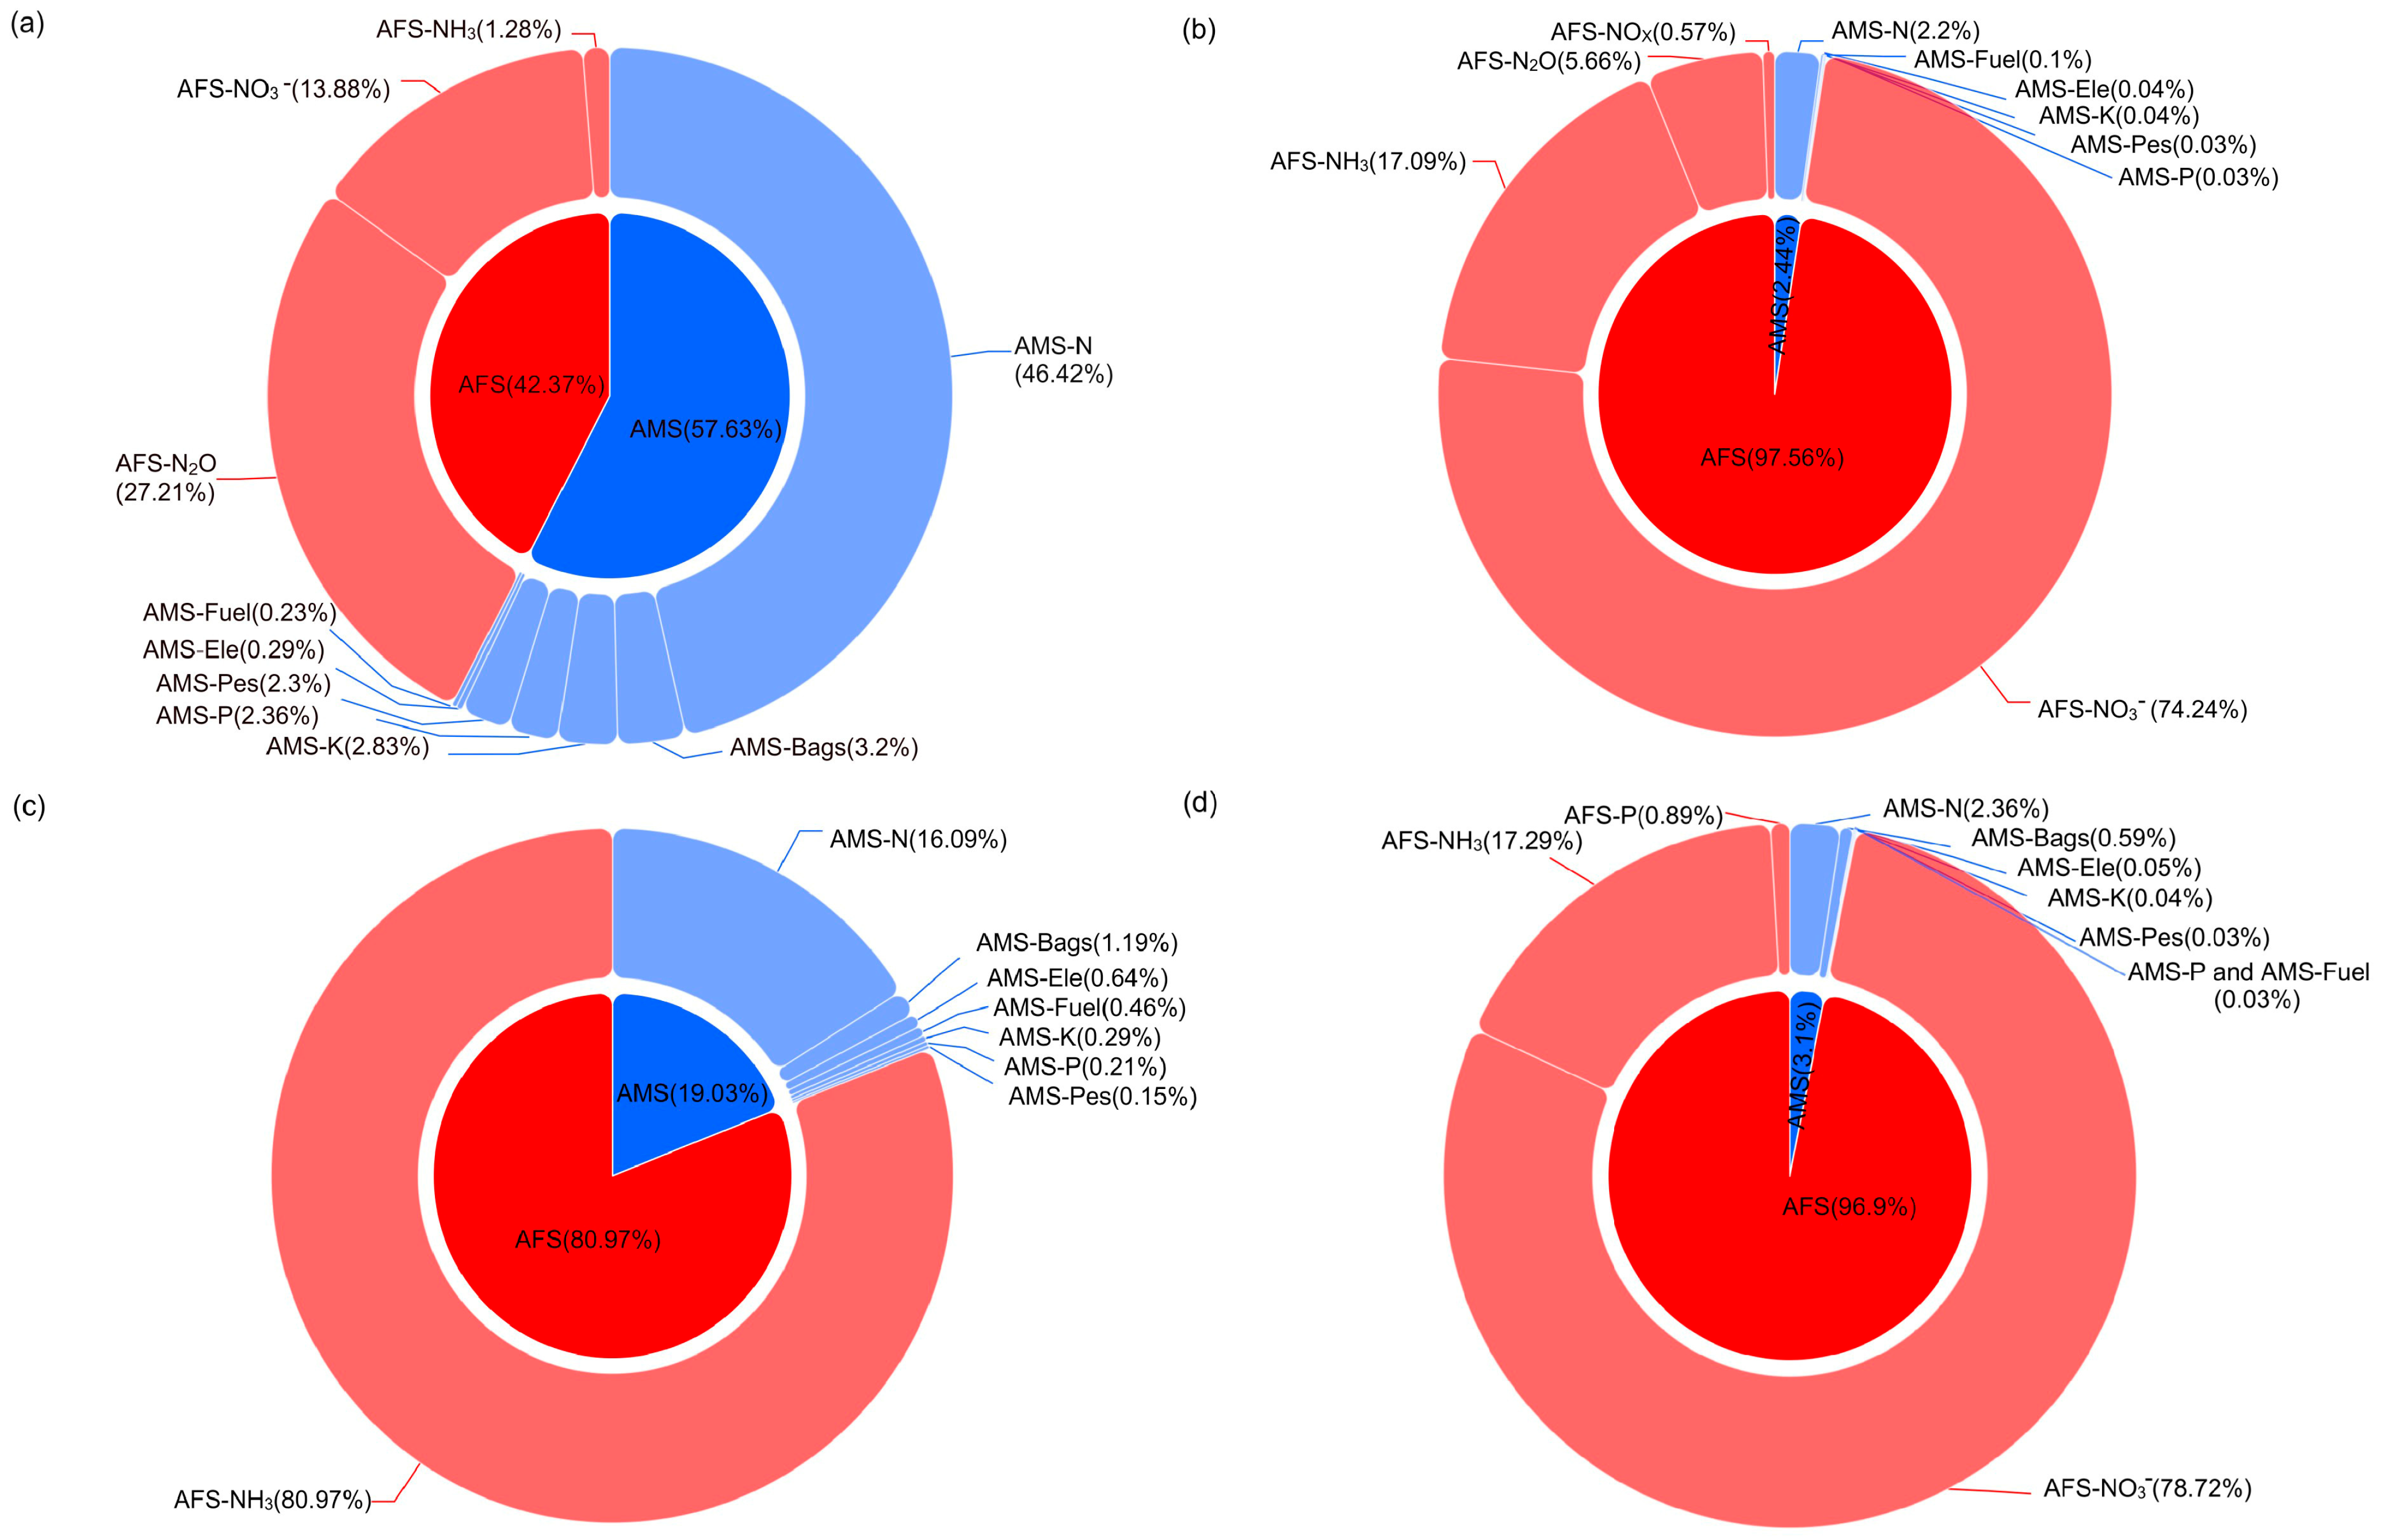
To identify the main contributing factors to environmental impacts, the contributions of various agricultural inputs during the AMS and AFS to the four environmental impacts (GWP, Nr, AP, and EP) were quantified (Figure 4). The production and use of nitrogen fertilizer were the largest contributors to GWP, accounting for 46.42% and 42.37% of the total GWP in the AMS and AFS, respectively. Regarding reactive nitrogen losses, nitrate leaching resulting from nitrogen fertilizer application was the largest contributor, accounting for 74.24% of total Nr losses, followed by ammonia volatilization (17.09%). Similarly, ammonium volatilization induced by nitrogen fertilizer use was the dominant contributor to acidification potential (80.97%), while nitrate leaching associated with nitrogen fertilizer application was the main contributor to eutrophication potential (78.72%). Overall, nitrogen fertilizer was identified as the primary contributor to all four environmental impacts (GWP, Nr, AP, and EP).

3.2. Identification of HH Orchards and Quantification of Emission Reduction Potential

Based on grouping by yield and PFP-N, the HH group exhibited a mean yield of 42.73 t ha−1 and a PFP-N value of 59.90 kg kg−1, which were 40.24% and 67.98% higher, respectively, than the corresponding averages of the 138 orchards. The average inputs of nitrogen, phosphorus, and potassium fertilizers in the HH group were 33.48%, 23.65%, and 29.38% lower, respectively, than the overall averages of the 138 orchards (Table A2).
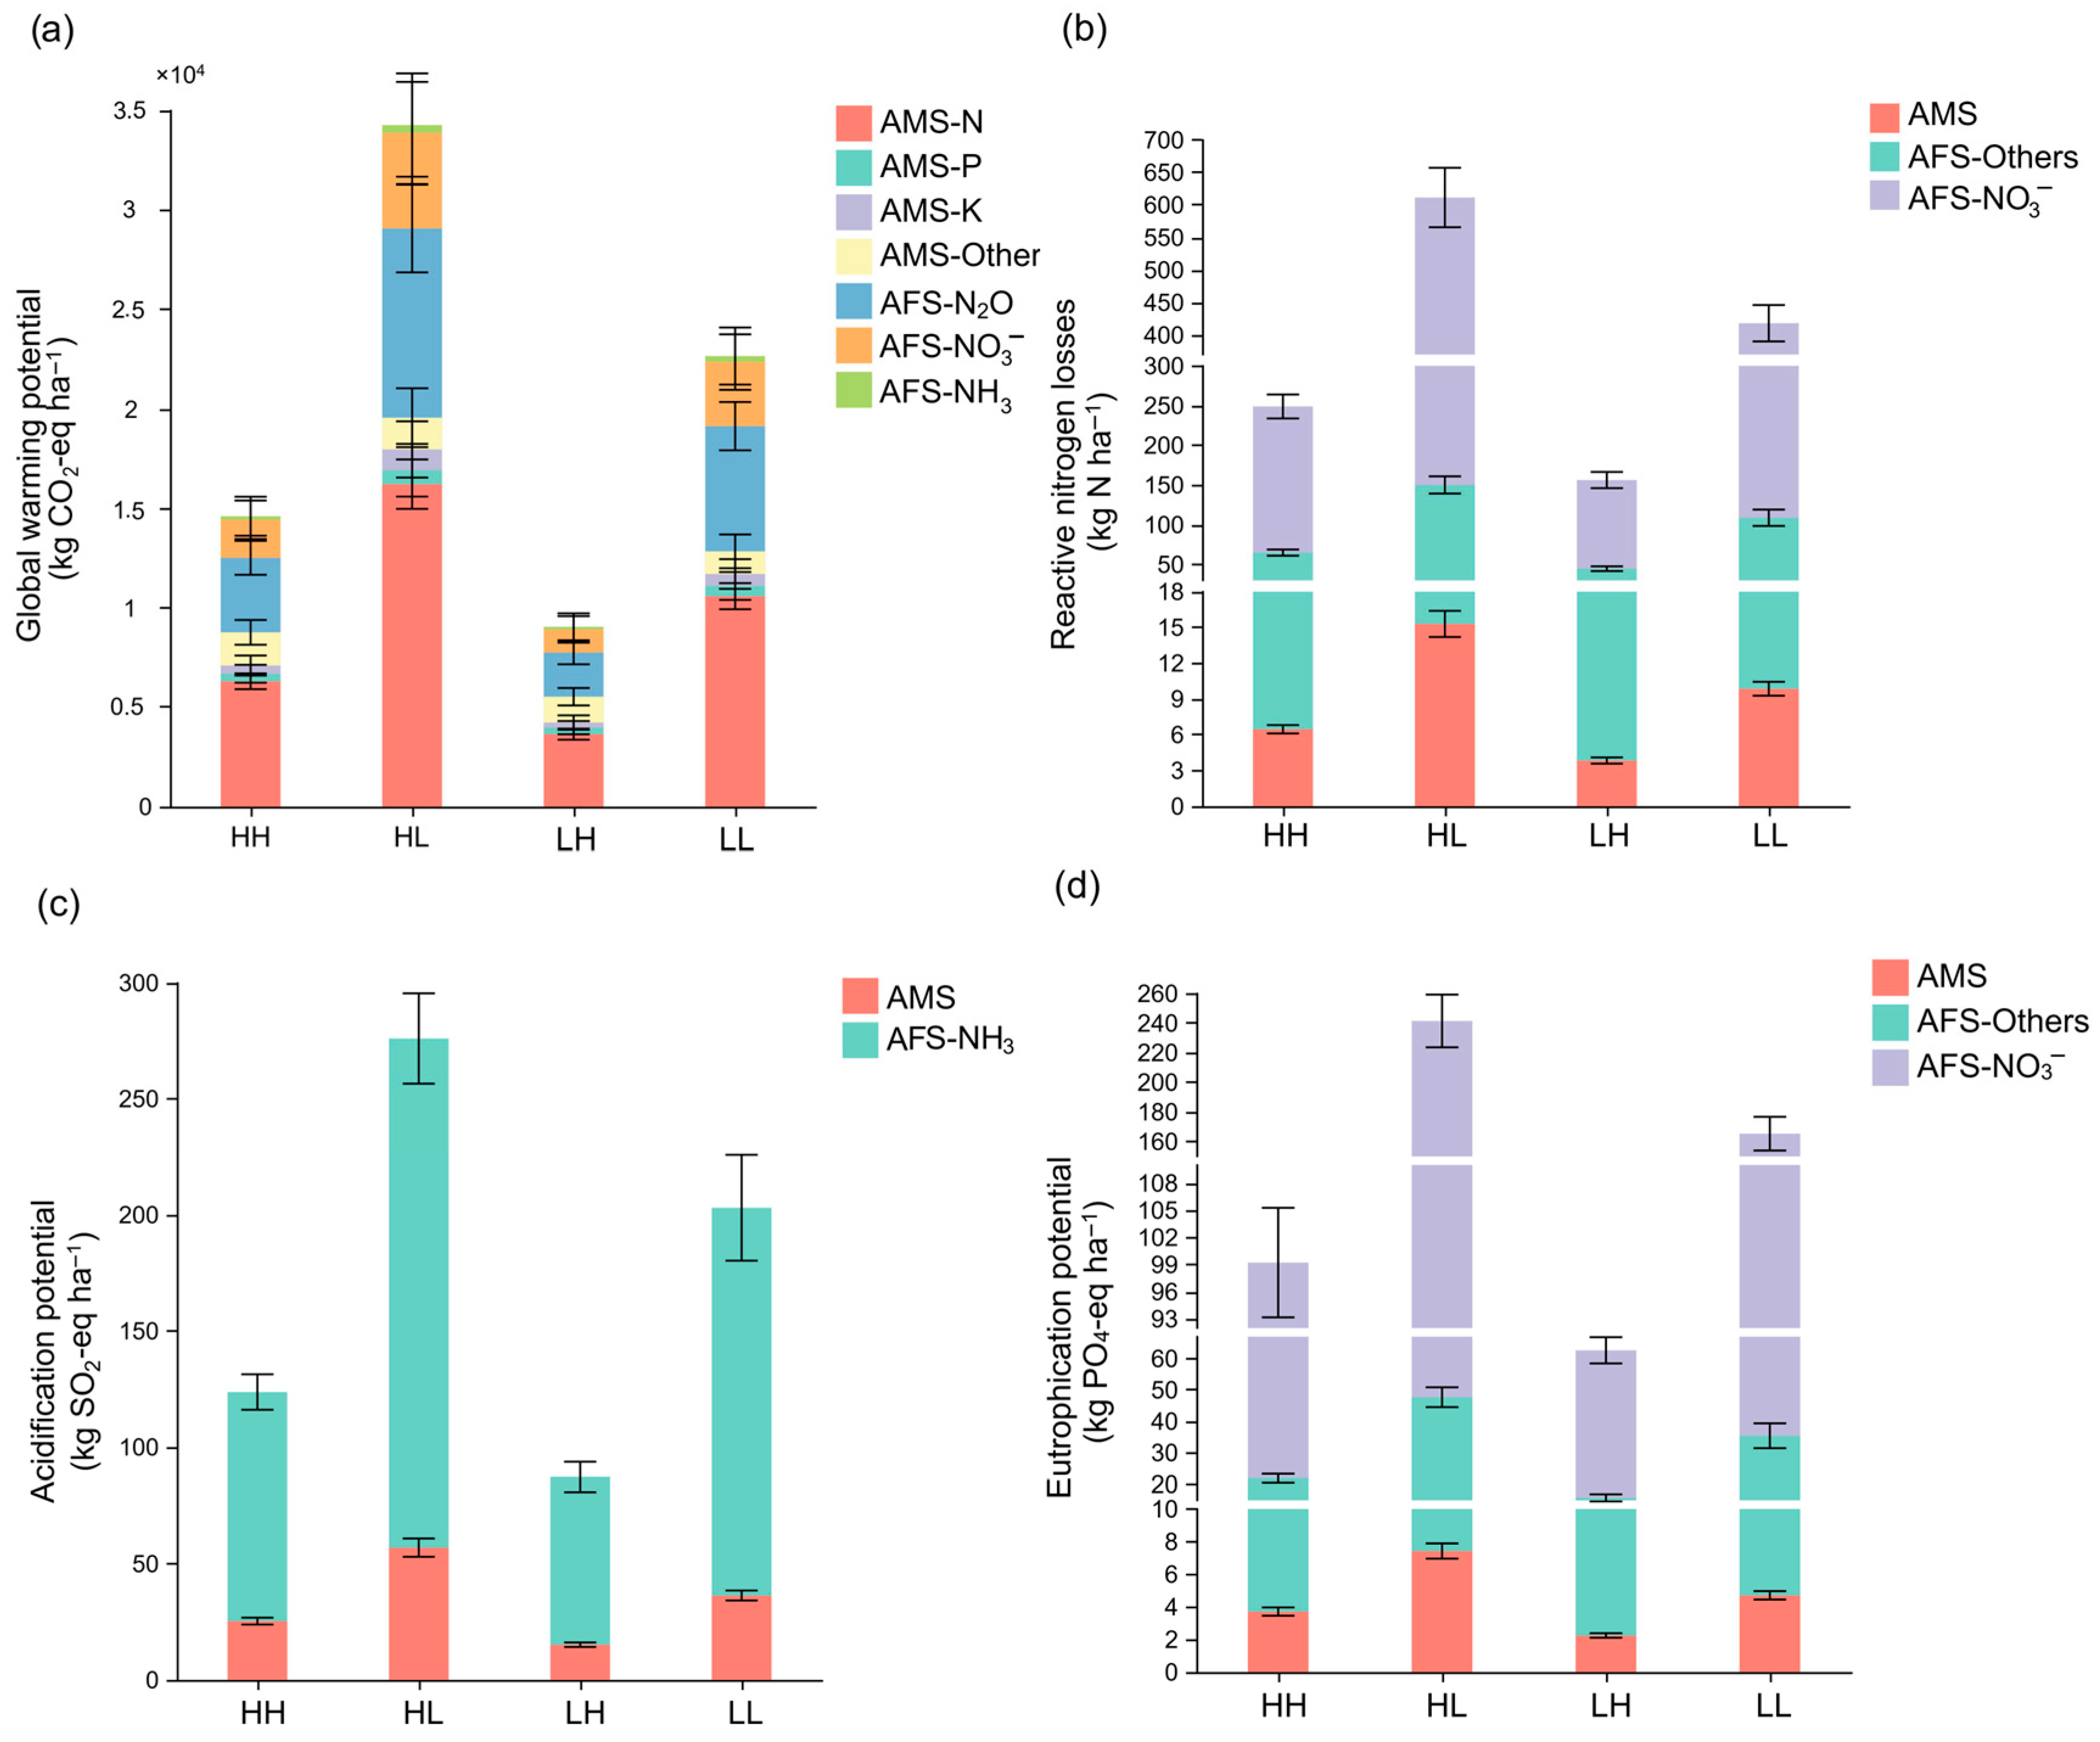
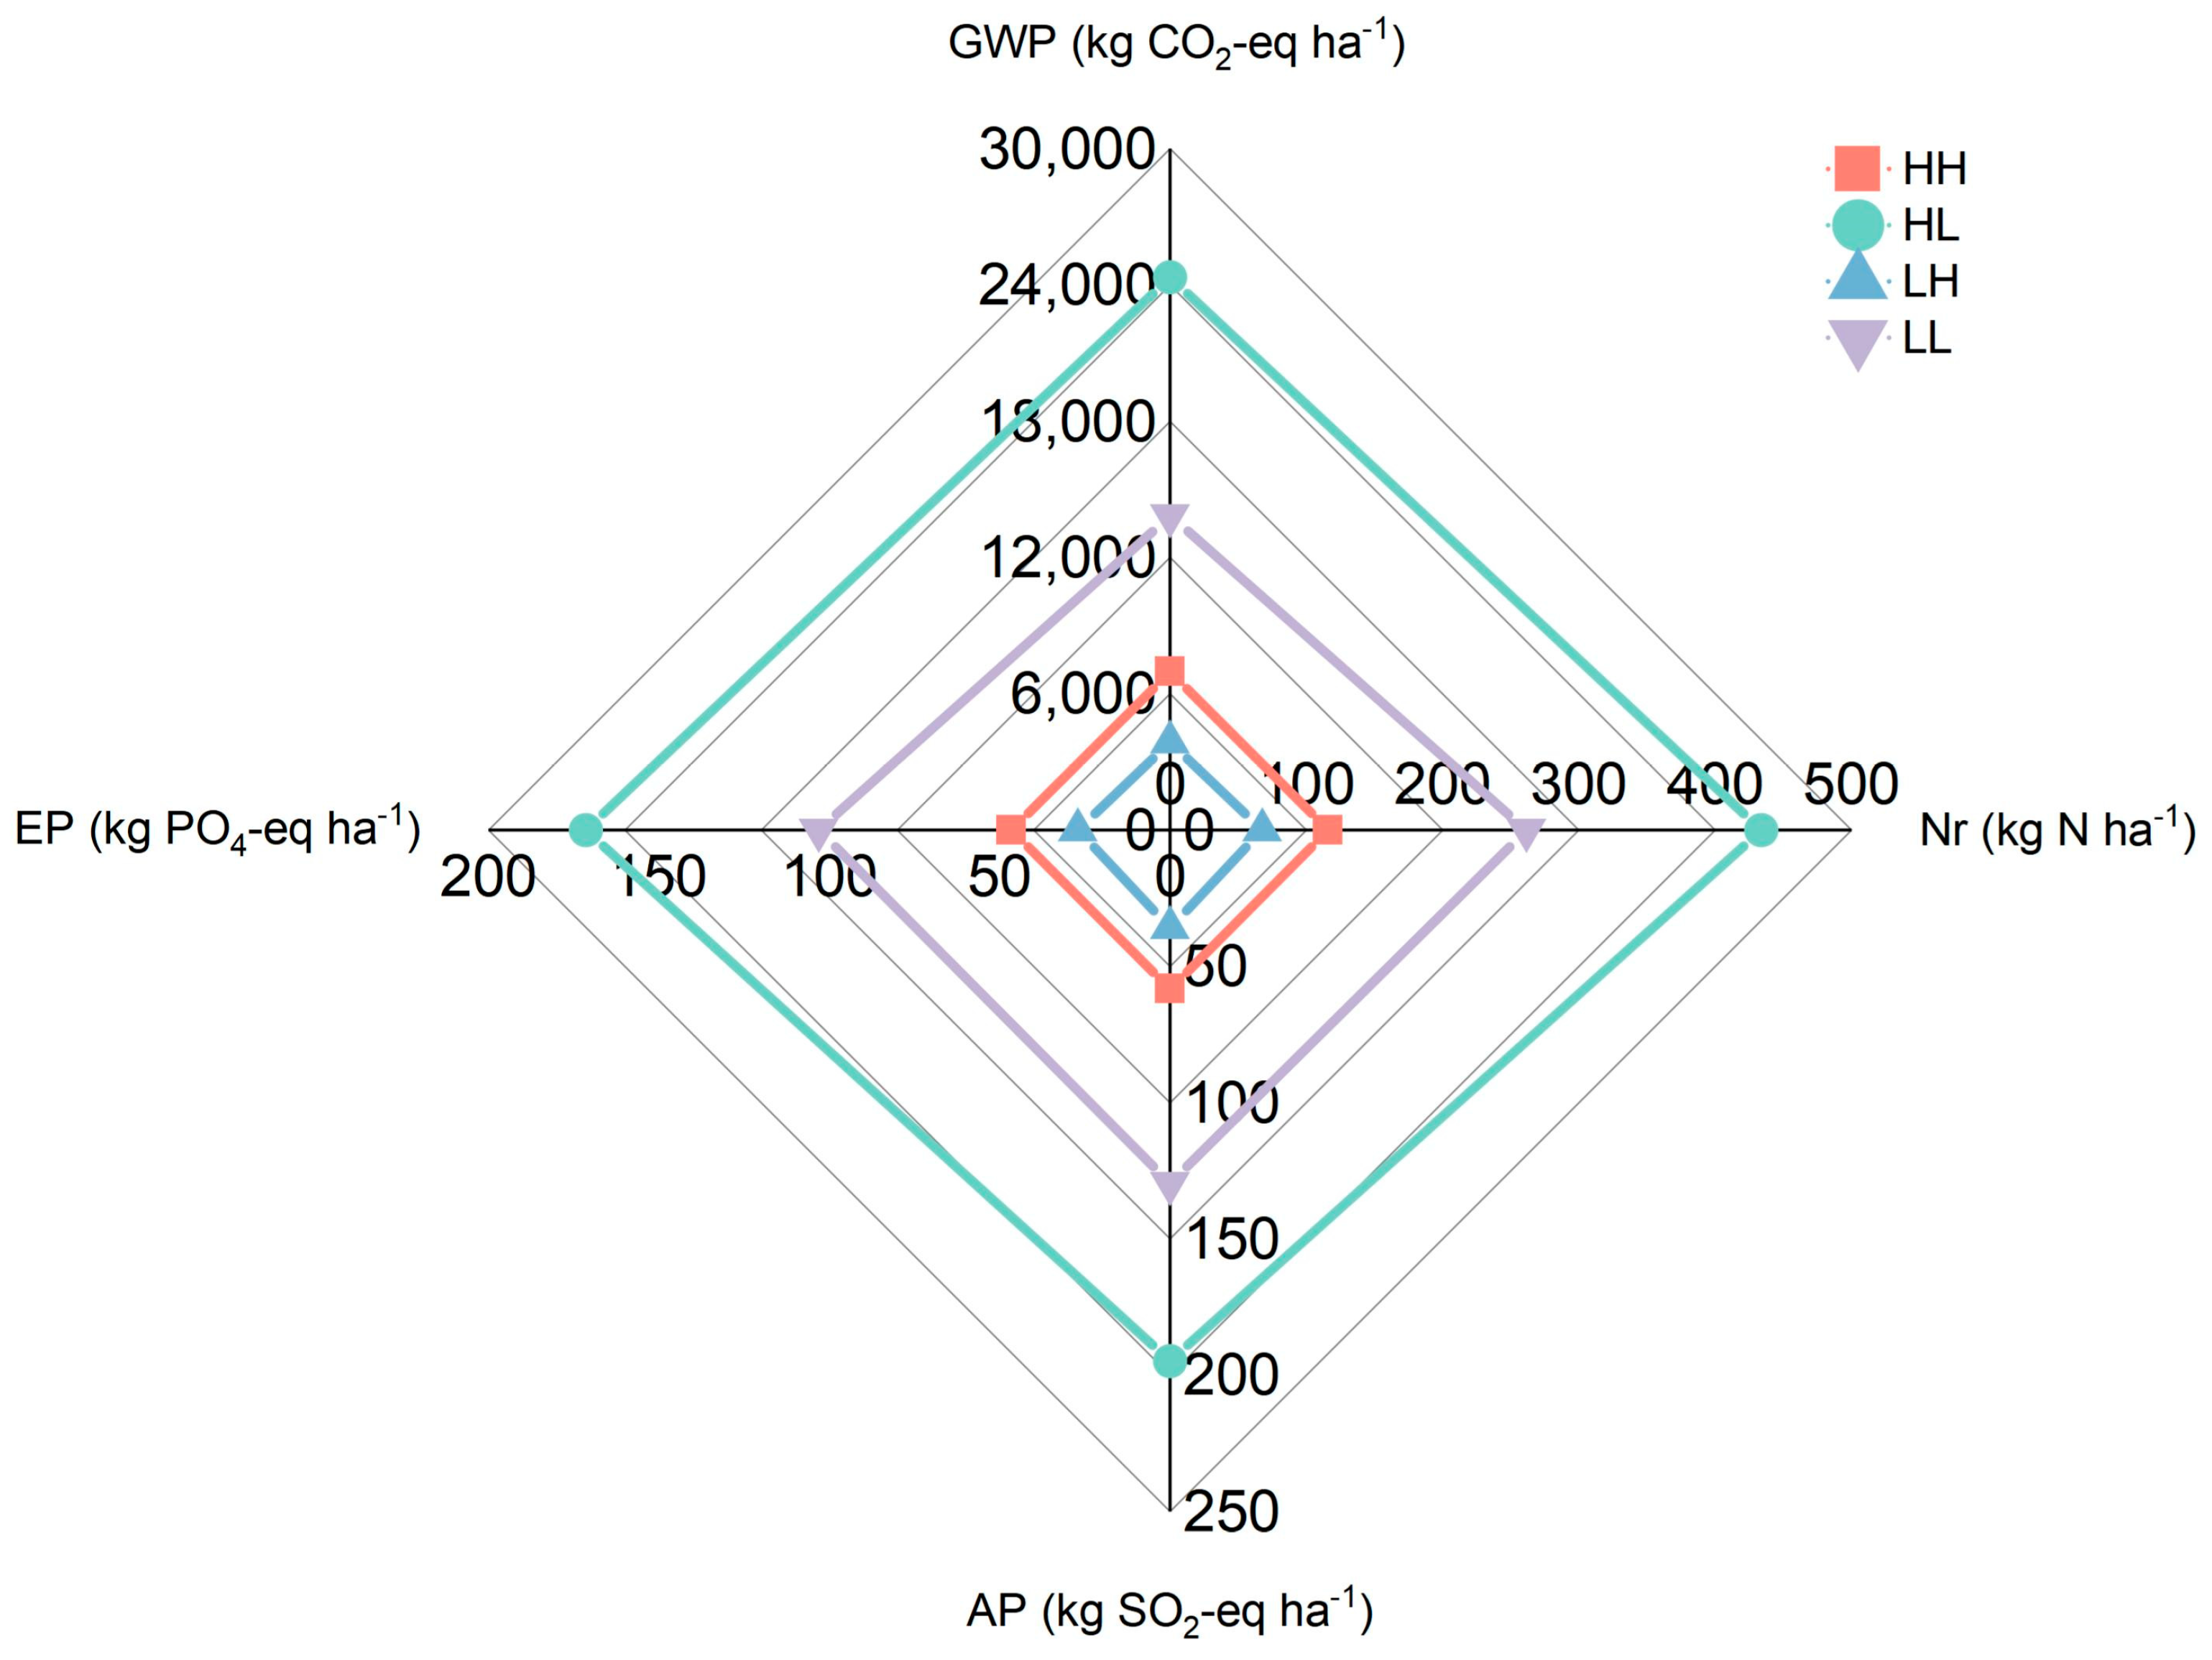
Further comparison of the environmental impacts among the orchard groups revealed significant differences in the potential values of GWP, Nr, AP, and EP across the four groups, as shown in Figure 5. The mean GWP in the HH group was reduced by 57.39% and 35.55% compared to the HL and LL groups, respectively. Similarly, the mean potentials of Nr decreased by 59.30% and 40.49%, AP decreased by 54.21% and 37.75%, and EP decreased by 58.91% and 39.99%, respectively. However, GWP, Nr, AP and EP were 62.31%, 59.99%, 44.87% and 59.15% higher in the HH group than in the LH group, respectively. However, the yield of the HH group was 65.75% higher than that of the LH group. This indicates that the lower environmental impacts observed in the LH group were achieved at the expense of yield, as insufficient fertilizer inputs in these orchards failed to meet the nutrient requirements for tree growth, resulting in both low yields and low environmental impacts. In contrast, the HH group achieved higher yields while maintaining relatively lower environmental impacts, making it more representative of sustainable orchard production systems.
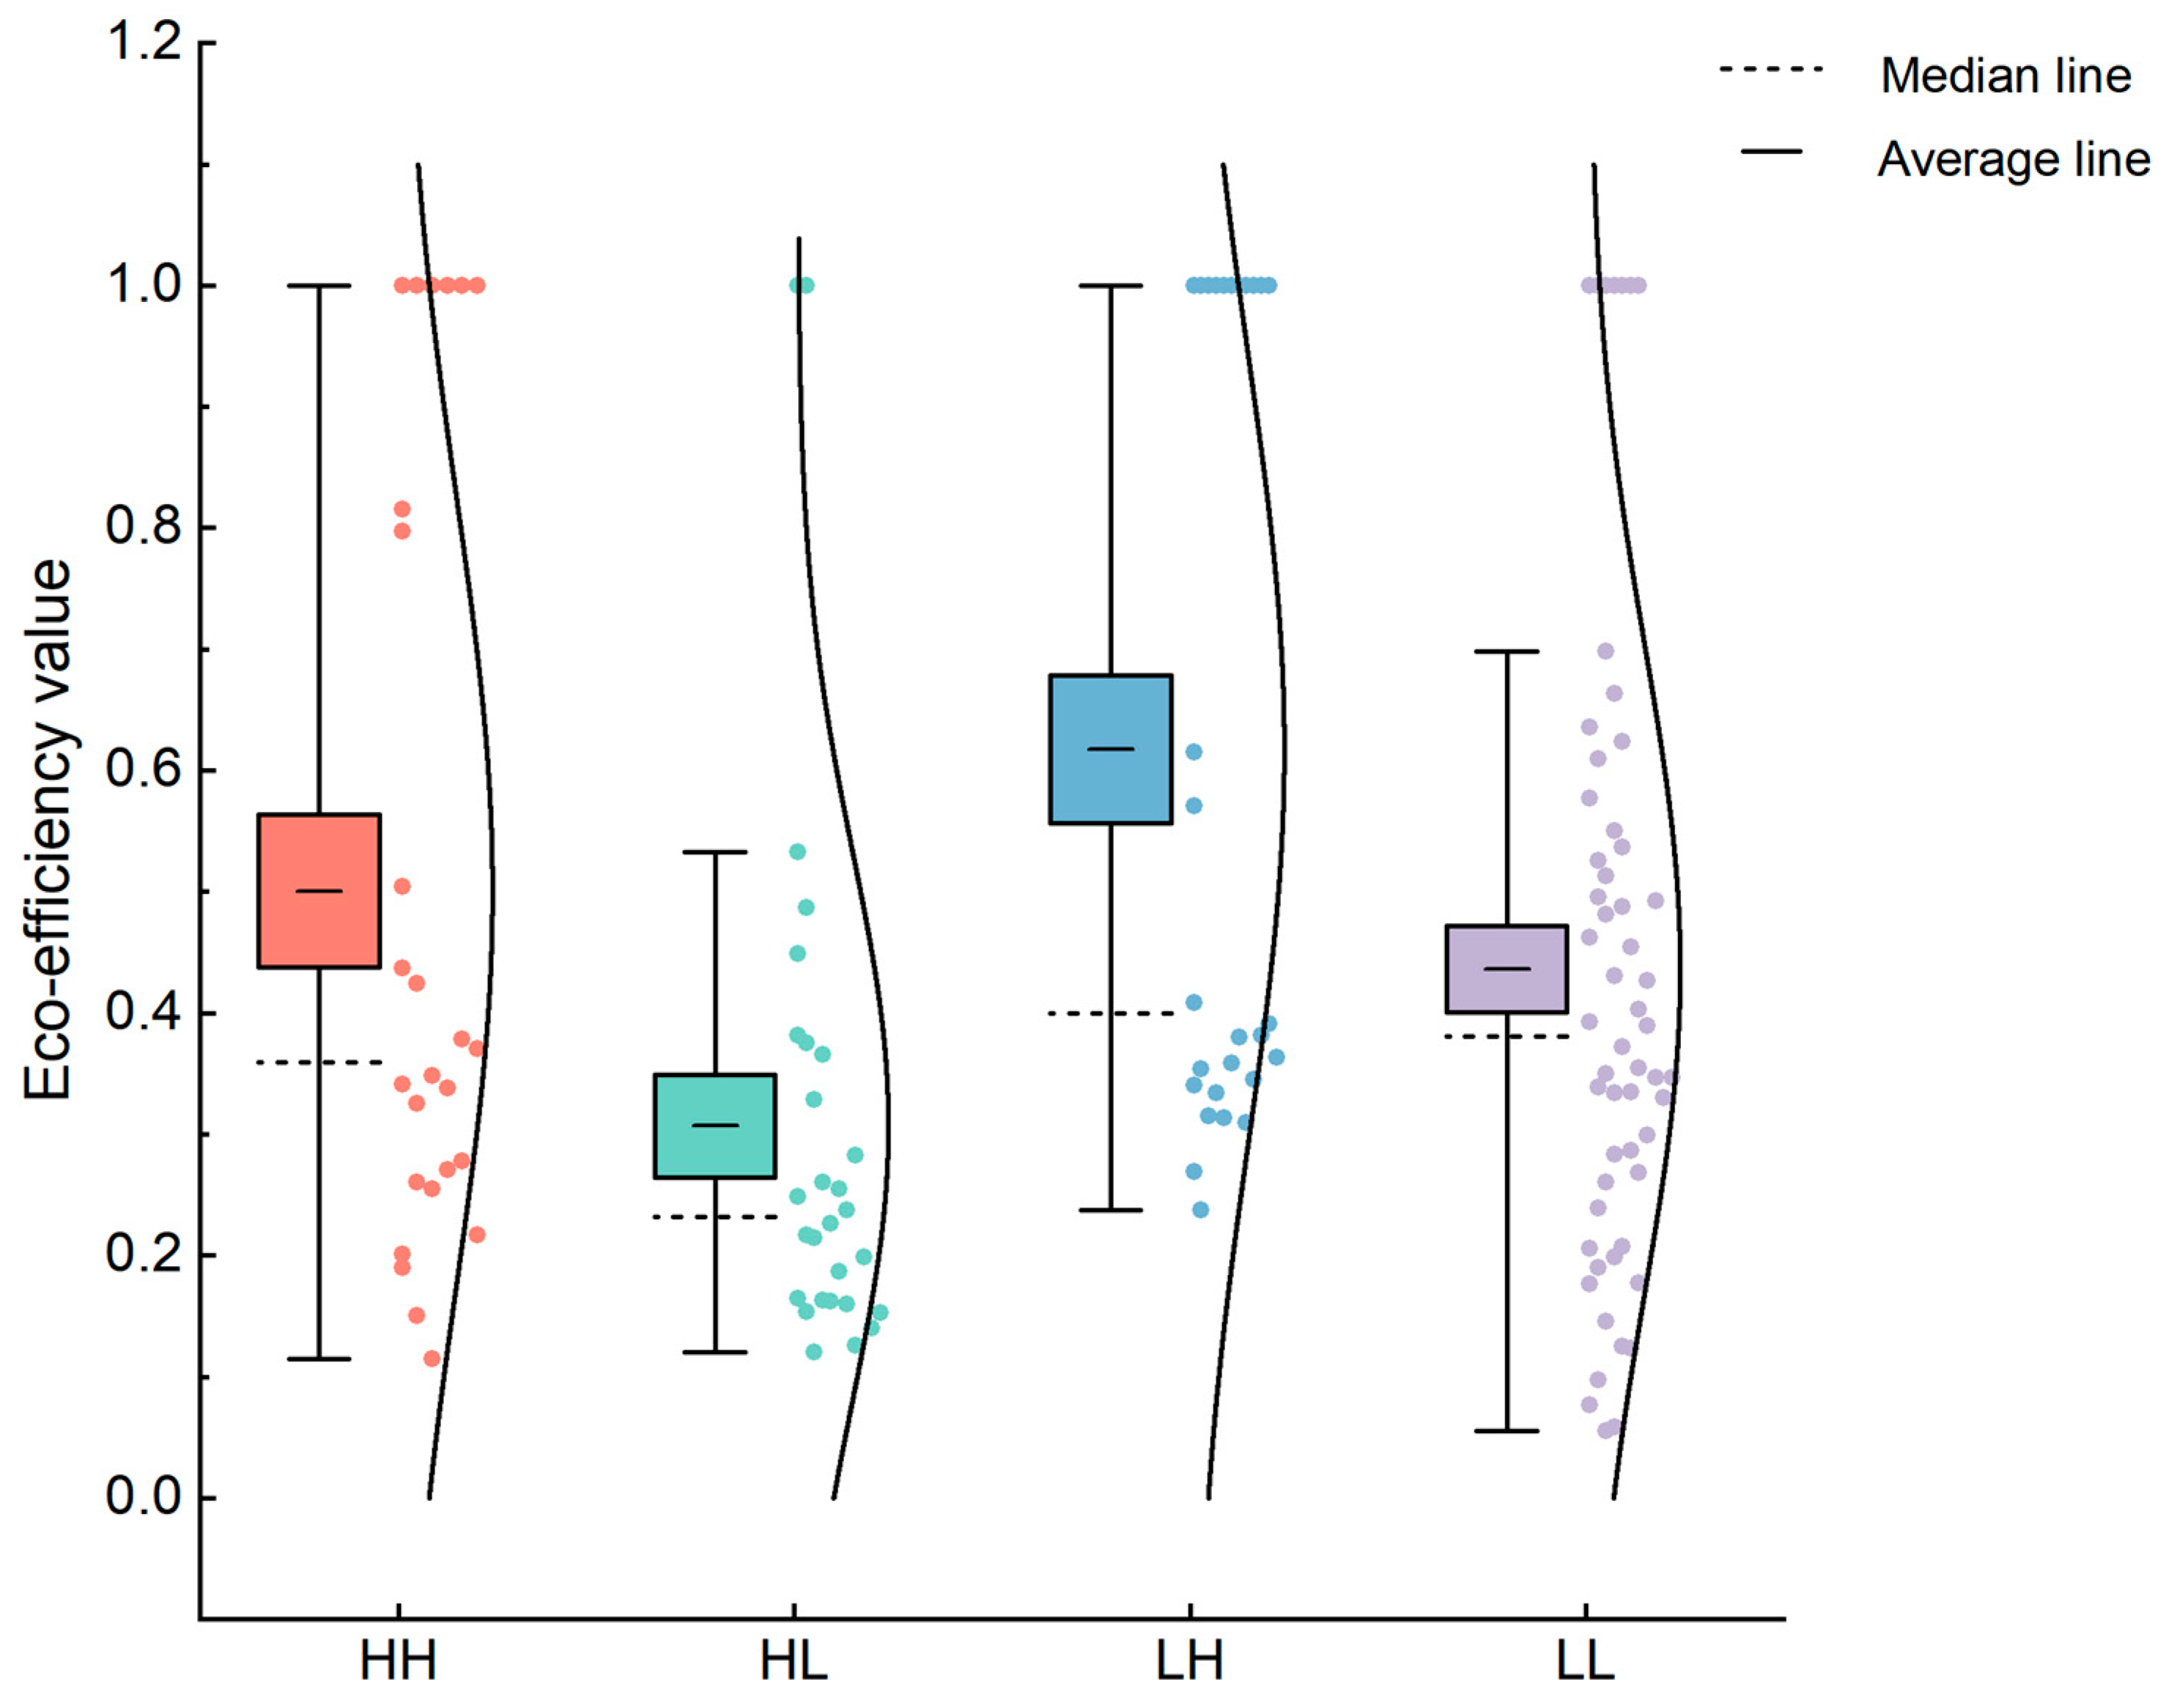
To explore the emission-reduction potential of fruit production systems, the eco-efficiency values (ρ*) of four groups (HH, HL, LH, and LL) were calculated using the SBM undesirable model (Figure 6; Supplementary File S2). The average eco-efficiency values were 0.50 for the HH group, 0.31 for the HL group, 0.62 for the LH group and 0.44 for the LL group. The eco-efficiency values for all four groups are less than 1, indicating that there is significant potential for improvement in terms of inputs and outputs. By calculating the redundancy of the four environmental effects in 138 orchards (Figure 7), the mean redundancy of GWP, Nr, AP and EP in HH group were 6959.32 kg CO2-eq ha−1, 116.16 kg N ha−1, 58.33 kg SO2-eq ha−1 and 46.59 kg PO4-eq ha−1 respectively. Based on the environmental impact values (GWP, Nr, AP and EP) of the HH group orchards and their corresponding redundancy values, further calculations showed that the average abatement potentials of the HH group were 53.31%, 52.28%, 50.54%, and 52.65% for GWP, Nr, AP, and EP, respectively. Therefore, although the nutrient management practices in the HH group orchards satisfy the criteria of high yield, low agricultural input, and low environmental impact, there is still considerable potential for emission reduction.

3.3. Environmental Impacts Prediction Based on the 1DCNN Model

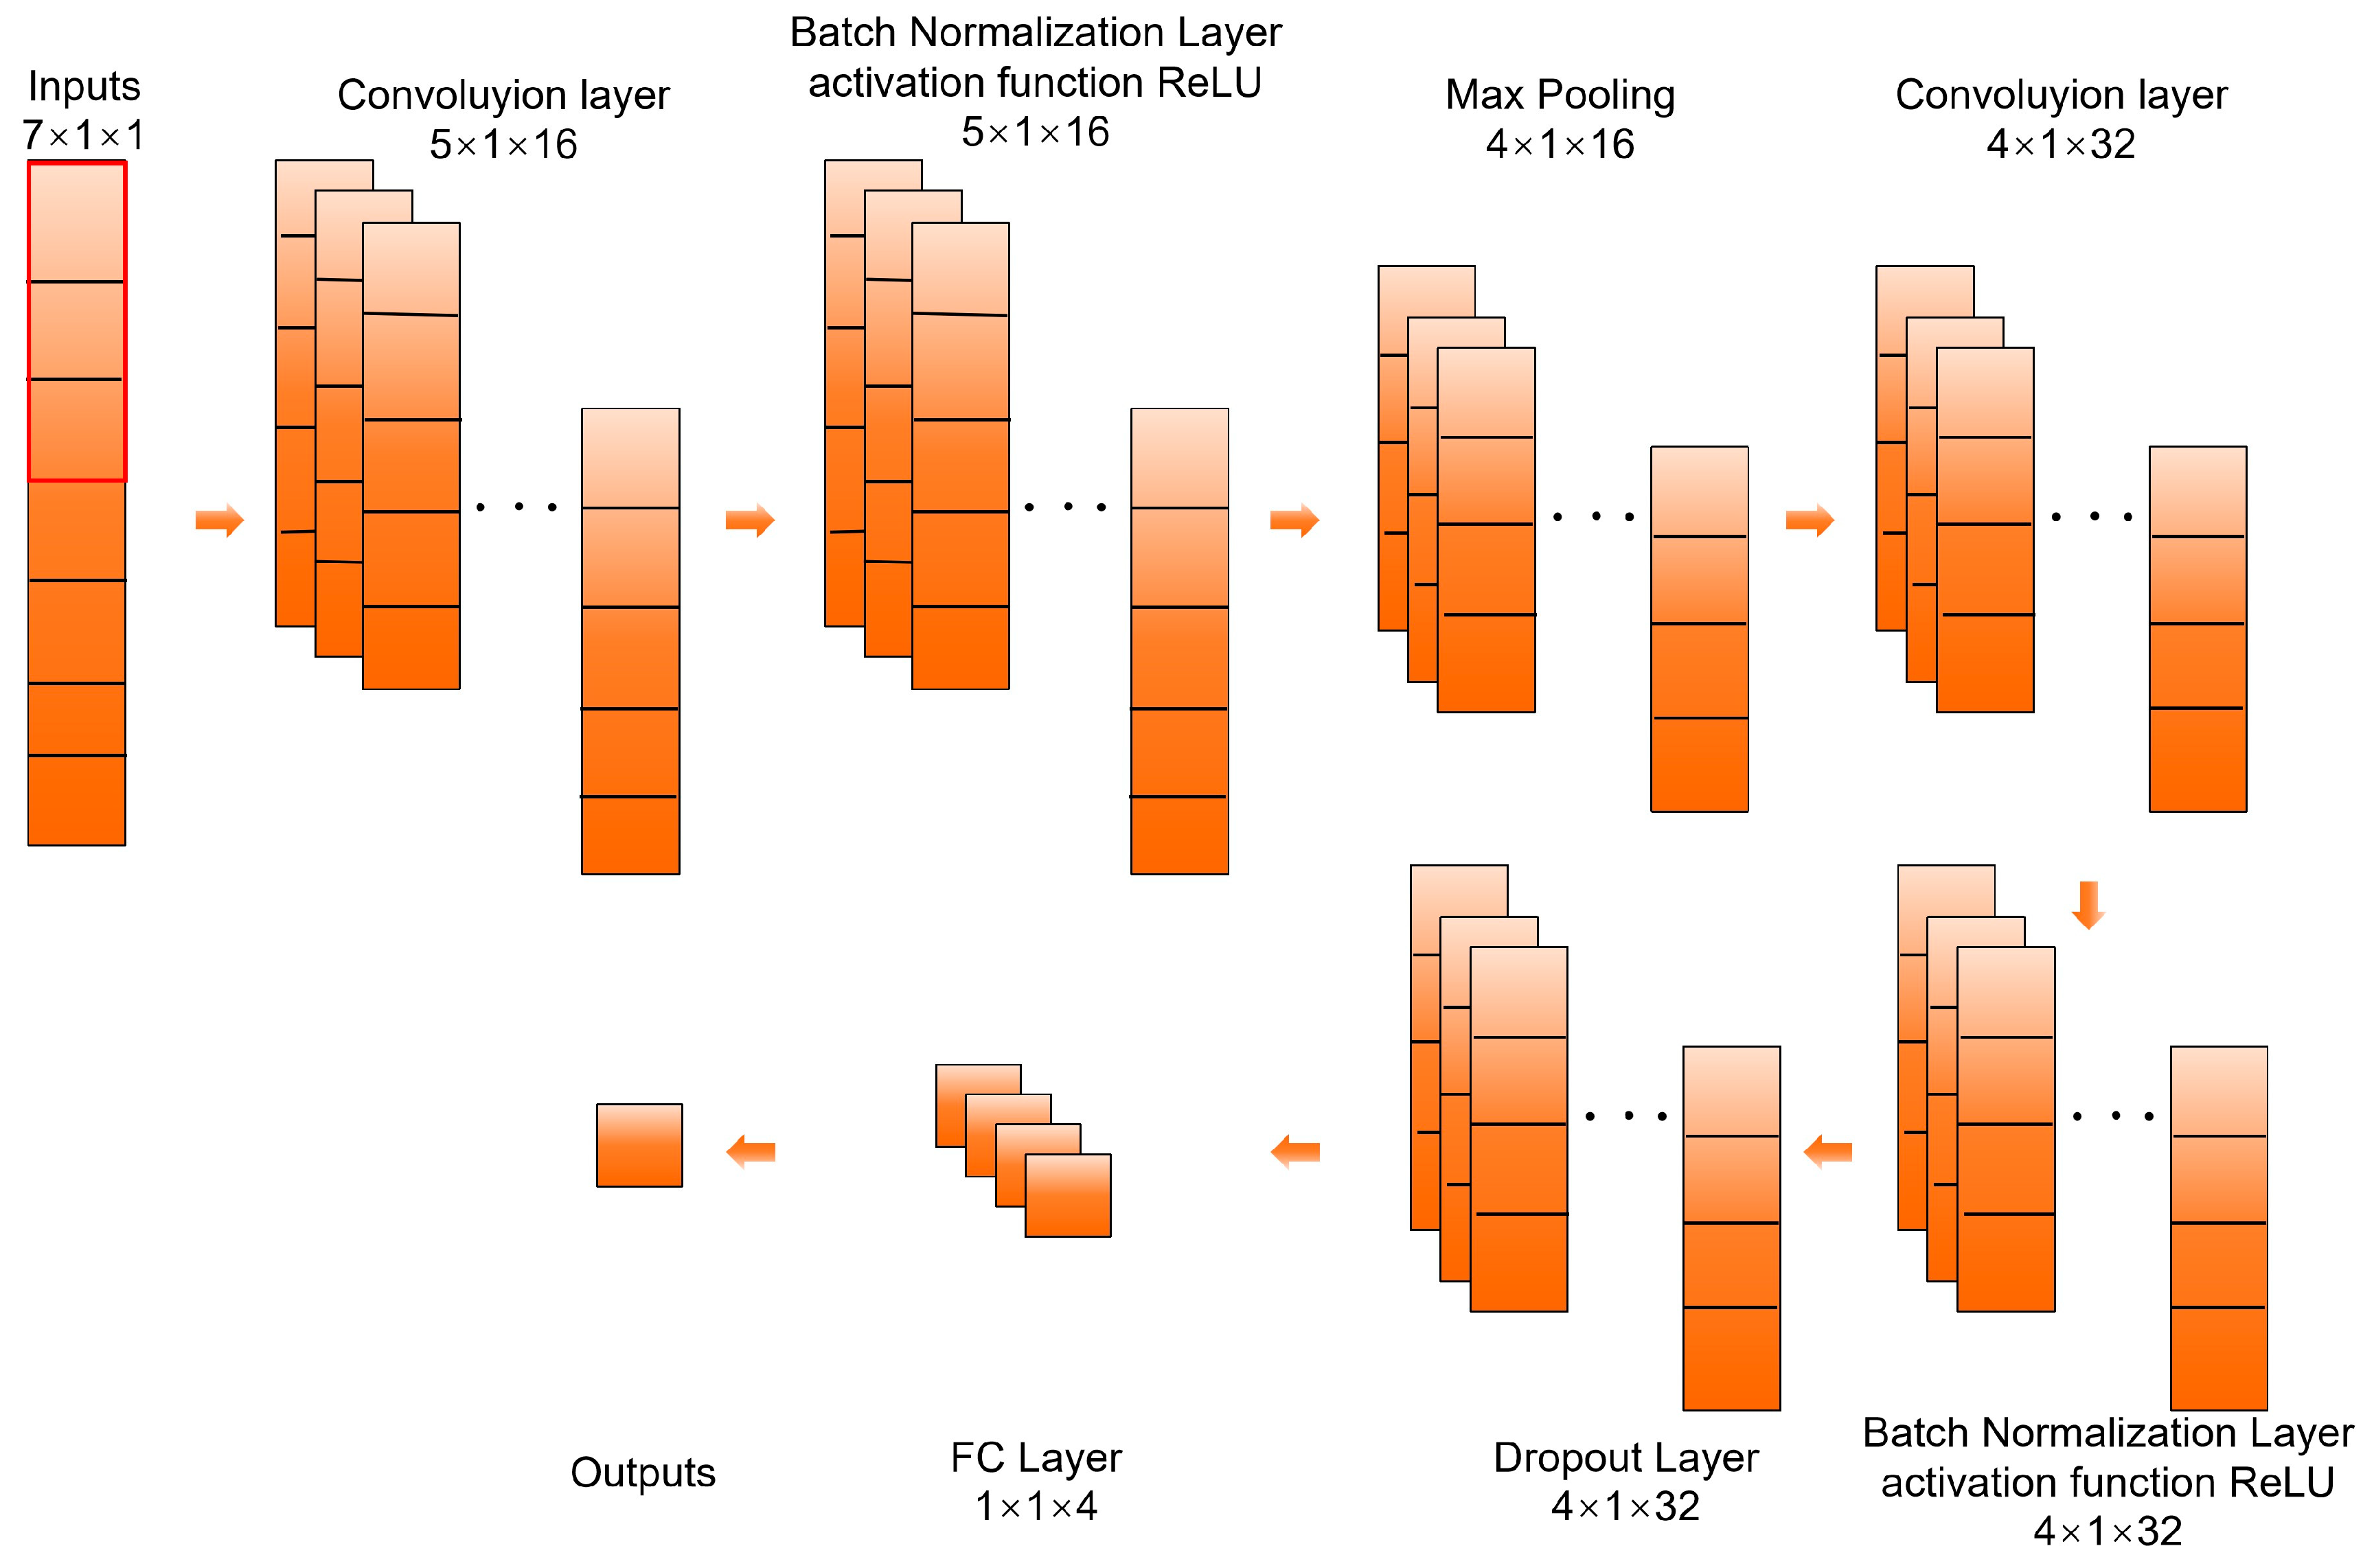
The modeling results show that the structure of the 1DCNN model consisted of 11 layers (Figure A1), which are one input layer, two convolutional layers, two Batch Normalization (BN) layers, two Rectified Linear Unit (ReLU) layers, one Max pooling layer, one Dropout layer, one fully connected layer, and one output layer. The prediction results indicate that, averaged over ten prediction runs, the 1D-CNN model achieved mean R2 > 0.9 and mean MAPE < 0.1 for the four environmental impacts (GWP, Nr, AP and EP). There was no significant difference between the predicted and actual values of the model (Figure 8). These results demonstrate the feasibility of using a deep-learning model (1DCNN) to accurately predict environmental impacts.
To enhance the interpretability of the prediction results, a local sensitivity analysis was conducted on the 1DCNN model. The results show that different agricultural inputs have varying relative sensitivities with respect to the outputs of the various environmental impacts (Figure 9). Among them, nitrogen fertilizer exhibits high sensitivity scores across all four environmental impacts, indicating that it is the most sensitive input with respect to the model predictions and a relatively important factor in the predictions. This finding is consistent with the results of the LCA, further validating the rationality of the model predictions. In addition, phosphorus fertilizer, potassium fertilizer, and fruit bagging also exhibit relatively high local sensitivity to GWP, Nr, AP and EP.

4. Discussion

4.1. High Nitrogen Fertilizer Inputs and Environmental Risks in Orchards

Based on the results calculated using the LCA method, the fruit production system exhibits relatively high environmental risks. Similar to the results of other related studies in China [10,55,56], greenhouse gas emissions in this study were 1.2 to 7.15 times higher than in other orchards, reactive nitrogen losses were 1.75 times higher, acidification effects were 1.02 to 1.82 times higher, and eutrophication effects were 1.41 to 1.72 times higher. Compared with the fruit production systems of some major agricultural nations [12,57,58,59,60,61], the GWP, AP, and EP of orchards in this study were 2.53 to 21.26, 2.83 to 83.84, and 35.98 to 3.81 times higher, respectively.
The nitrogen fertilizer input of orchards in this study is higher than that of other orchards (1.25 to 23 times), while the main contributing factors to the environmental effects of orchards in other countries are more from the energy consumed by electricity and irrigation, and the nitrogen fertilizer inputs are only 4–15% of the nitrogen fertilizer inputs in this study (1188.59 kg ha−1) [58].
Based on orchard grouping according to yield and PFP-N, the PFP-N of the HH group was 59.90 kg kg−1, which was not significantly different from that of the Chinese citrus PFP-N (58 kg kg−1) [4] and that of the pomelo orchard (57 kg kg−1), but only 8.14–26.9% of theirs when compared with the relevant studies in other countries [18,62]. These results indicate that the relatively high environmental impacts observed in the studied orchards are mainly driven by excessive nitrogen fertilizer inputs, while the effective utilization efficiency of nitrogen remains low.

4.2. Promoting Sustainable Orchard Development Through Model-Based Intelligent Assessment

Based on LCA and in combination with the SBM-undesirable model, HH orchards exhibited relatively superior eco-efficiency. Therefore, the input-management practices of HH orchards can serve as stage-based optimization benchmarks for other orchards, guiding them toward higher yields and lower environmental impacts. Nevertheless, the production systems of HH orchards still possess additional potential for further emission reduction. After completing the quantitative LCA, the introduction of deep learning models enables rapid prediction of environmental impact potentials. For orchard production systems, this predictive capability offers technical support for anticipating environmental risks under different input combinations, helping to identify potential high environmental burden scenarios at an early decision-making stage.
In addition, the results of the local sensitivity analysis of the 1DCNN model can be used to identify relatively important input factors based on the predictive model, providing a possible reference for focusing on key inputs in sustainable orchard management.

4.3. Limitations

The data used in this study were obtained from farmer questionnaires, which may involve certain uncertainties, such as inaccuracies in farmers’ memory. In addition, the scope of the life-cycle assessment in this study is limited to the production phase and does not cover post-harvest stages, including transportation, storage, processing, and marketing. The potential impacts of these stages on environmental outcomes require further investigation. Although the proposed framework was developed and validated based on the pear orchard data from a specific region in China, its methodology is essentially universal. However, when applying it to other fruit crops or regions with different management practices and climatic conditions, additional calibration and validation using multi-crop and multi-region datasets are required. Finally, this study did not include carbon sequestration processes such as tree biomass accumulation and soil carbon storage. Future research could incorporate carbon sequestration and other ecosystem services to provide a more comprehensive assessment of orchard sustainability.

5. Conclusions

The primary objective of this study was to develop a model-based quantitative assessment framework by integrating LCA, the SBM-undesirable model, and a 1DCNN predictive model to systematically evaluate the environmental impacts and eco-efficiency of orchard production systems. To verify the applicability and analytical performance of the proposed framework under real production conditions, a representative pear-producing region was selected as an empirical case, through which mitigation potential and key agricultural input factors were further assessed. The results indicate that orchard production systems exhibit high environmental risks and relatively low average yields. The management practices of the HH group offer valuable reference, but their agricultural inputs still exhibit considerable redundancy, indicating substantial potential for improvement. The application of the 1DCNN model expands the framework for predicting environmental impacts in orchard agriculture. Finally, nitrogen fertilizer was not only the primary contributor to environmental impacts in orchard systems, but also the input variable to which predicted environmental impacts outcomes are most sensitive. This finding indicates that nitrogen fertilizer is a key input factor that warrants focused attention in the pursuit of sustainable orchard development.

Supplementary Materials

The following supporting information can be downloaded at: https://www.mdpi.com/article/10.3390/agriculture16050525/s1. File S1: SBM-undesirable model.m; File S2: 1DCNN.m.

Author Contributions

Conceptualization, P.W. and Y.Y.; methodology, Y.L. (Yameng Lu) and J.R.; validation, Y.L. (Yameng Lu); formal analysis, Y.L. (Yameng Lu), J.R. and Y.L. (Yinghui Liu); investigation, Y.L. (Yameng Lu), J.R. and Y.L. (Yinghui Liu); resources, T.Z.; data curation, Y.L. (Yameng Lu), J.R. and Y.L. (Yinghui Liu); writing—original draft preparation, Y.L. (Yameng Lu); writing—review and editing, Y.L. (Yameng Lu), P.W., Y.Y. and T.Z.; supervision, Y.Y. and T.Z.; project administration, P.W.; funding acquisition, Y.Y. and T.Z. All authors have read and agreed to the published version of the manuscript.

Funding

This research was funded by the National Key Research and Development Program of China (2022YFD1901402, 2023YFD1900602), the Fundamental Research Funds for the Central Universities (SWU-KF25017), and the New Great Wall Support Program for Science and Technology Backyard.

Institutional Review Board Statement

Not applicable.

Data Availability Statement

The original contributions presented in this study are included in the Supplementary Materials. Further inquiries can be directed to the corresponding author.

Conflicts of Interest

The authors declare no conflicts of interest.

Abbreviations

The following abbreviations are used in this manuscript:
LCALife Cycle Assessment
AIArtificial Intelligence
PFP-NPartial Factor Productivity of Nitrogen Fertilizer
GWPGlobal Warming Potential
NrReactive Nitrogen Losses
APAcidification Potential
EPEutrophication Potential
1DCNN One-dimensional convolutional neural network
DMUDecision Making Unit
SBM-undesirable modelslack-based measure-undesirable model
AMSAgricultural Material Stage
AFSAgricultural Farming Stage
HH grouphigh yield and high PFP-N group
LL grouplow yield and low PFP-N group
HL group high yield and low PFP-N group
LH grouplow yield and low PFP-N group
Epienvironment impacts (GWP, Nr, AP, EP)
EpAMSenvironment impacts in the AMS
EpAFSenvironment impacts in the AFS
kjthe jth agricultural input
Epr-jthe environment impacts emission factors
Pinputthe total phosphorus fertilizer input
TNthe total nitrogen fertilizer input
λthe intensity vector
sta deficiency in good outputs
sthe excess inputs
sf undesirable outputs
ρ*eco-efficiency value

Appendix A. Materials

Table A1. Example of survey content for orchard investigation questionnaire.
Serial Number:Variety:
Weeding method:Yield:
Chemical nitrogen fertilizer (kg ha−1 year−1):
Chemical phosphate fertilizer (kg ha−1 year−1):
Chemical potash fertilizer (kg ha−1 year−1):
Organic phosphorus fertilizer (kg ha−1 year−1):
Organic nitrogen fertilizer (kg ha−1 year−1):
Organic potassium fertilizer (kg ha−1 year−1)
Total pesticide input (kg ha−1 year−1):
Fuel consumption (kg ha−1 year−1):
Electricity consumption (kWh ha−1 year−1):
Table A2. Inputs and outputs of pear orchard production systems in different groups.
InputsGroups
HHHLLHLL
Total fertilizer (kg ha−1)
N790.69 ± 240.101983.78 ± 778.65479.79 ± 161.491330.13 ± 563.48
P2O5502.11 ± 347.89907.18 ± 530.11437.23 ± 339.25715.36 ± 513.49
K2O774.80 ± 489.141922.12 ± 849.21492.51 ± 267.631136.60 ± 604.67
Manure fertilizer (kg ha−1)
N36.37 ± 30.1530.17 ± 22.5941.01 ± 46.2055.23 ± 238.84
P2O525.47 ± 28.2120.93 ± 18.3422.41 ± 18.8465.30 ± 387.08
K2O25.65 ± 19.5621.24 ± 16.0223.65 ± 25.0042.24 ± 197.35
Chemical fertilizer (kg ha−1)
N754.33 ± 235.421953.61 ± 778.25438.79 ± 175.131274.91 ± 586.04
P2O5524.13 ± 309.45886.25 ± 528.92414.83 ± 344.69650.06 ± 426.94
K2O886.32 ± 409.801900.87 ± 845.34468.86 ± 275.181094.36 ± 620.22
Pesticide (kg ha−1)27.65 ± 7.3224.21 ± 5.8527.72 ± 9.2522.69 ± 7.27
Fruit bags (kg ha−1)525.79 ± 336.53497.42 ± 122.56327.18 ± 173.85267.66 ± 121.20
Fuel (kg ha−1)20.20 ± 26.6617.30 ± 18.4411.25 ± 15.927.61 ± 20.03
Electricity (kWh ha−1)62.98 ± 190.11141.48 ± 265.6449.89 ± 106.7070.16 ± 193.36
Output
Yield (t ha−1 year−1) 42.73 ± 5.4739.49 ± 5.7525.78 ± 4.5222.60 ± 5.45
Figure A1. The 1DCNN model structure. The input layer consists of seven input variables (total nitrogen, phosphorus, potassium fertilizers, pesticides, fuel, electricity, and fruit bag inputs); the output layer comprises four output variables (GWP, Nr, AP, and EP).
Agriculture 16 00525 g0a1

References

  1. Alaphilippe, A.; Boissy, J.; Simon, S.; Godard, C. Environmental impact of intensive versus semi-extensive apple orchards: Use of a specific methodological framework for Life Cycle Assessments (LCA) in perennial crops. J. Clean. Prod. 2016, 127, 555–561. [Google Scholar] [CrossRef]
  2. Yang, Y.; Chen, T.; Xiao, R.; Chen, X.; Zhang, T. A quantitative evaluation of the biochar’s influence on plant disease suppress: A global meta-analysis. Biochar 2022, 4, 43. [Google Scholar] [CrossRef]
  3. Zhang, Z.X.; Zhao, J.R.; Hou, L.Y.; Xu, X.P.; Zhu, Y.J.; Zhai, B.N.; Liu, Z.J. Comparative assessment of environmental impacts, mitigation potentials, and economic benefits of rain-fed and irrigated apple production systems on China’s Loess Plateau. Sci. Total Environ. 2023, 869, 161791. [Google Scholar] [CrossRef]
  4. Yang, M.; Long, Q.; Li, W.L.; Wang, Z.C.; He, X.H.; Wang, J.; Wang, X.Z.; Xiong, H.Y.; Guo, C.Y.; Zhang, G.C.; et al. Mapping the Environmental Cost of a Typical Citrus-Producing County in China: Hotspot and Optimization. Sustainability 2020, 12, 1827. [Google Scholar] [CrossRef]
  5. Pergola, M.; Persiani, A.; D’Ammaro, D.; Pastore, V.; D’Adamo, C.; Palese, A.M.; Celano, G. Environmental and Energy Analysis of Two Orchard Systems: A Case Study in Mediterranean Environment. Agronomy 2022, 12, 2556. [Google Scholar] [CrossRef]
  6. FAO. Food and Agriculture Organization of the United Nations. Available online: http://www.fao.org/faostat/zh/#home (accessed on 16 December 2024).
  7. Cerutti, A.K.; Bagliani, M.; Beccaro, G.L.; Bounous, G. Application of Ecological Footprint Analysis on nectarine production: Methodological issues and results from a case study in Italy. J. Clean. Prod. 2010, 18, 771–776. [Google Scholar] [CrossRef]
  8. Bergez, J.E.; Béthinger, A.; Bockstaller, C.; Cederberg, C.; Ceschia, E.; Guilpart, N.; Lange, S.; Müller, F.; Reidsma, P.; Riviere, C.; et al. Integrating agri-environmental indicators, ecosystem services assessment, life cycle assessment and yield gap analysis to assess the environmental sustainability of agriculture. Ecol. Indic. 2022, 141, 109107. [Google Scholar] [CrossRef]
  9. Yang, Y.; Chen, T.; Liu, X.; Wang, S.; Wang, K.; Xiao, R.; Chen, X.; Zhang, T. Ecological risk assessment and environment carrying capacity of soil pesticide residues in vegetable ecosystem in the Three Gorges Reservoir Area. J. Hazard. Mater. 2022, 435, 128987. [Google Scholar] [CrossRef]
  10. Wang, J.; Zhang, L.; He, X.; Zhang, Y.; Wan, Y.; Duan, S.; Xu, C.; Mao, X.; Chen, X.; Shi, X. Environmental mitigation potential by improved nutrient managements in pear (Pyrus pyrifolia L.) orchards based on life cycle assessment: A case study in the North China Plain. J. Clean. Prod. 2020, 262, 121273. [Google Scholar] [CrossRef]
  11. Khoshnevisan, B.; Rafiee, S.; Omid, M.; Mousazadeh, H.; Sefeedpari, P. Prognostication of environmental indices in potato production using artificial neural networks. J. Clean. Prod. 2013, 52, 402–409. [Google Scholar] [CrossRef]
  12. Mouron, P.; Scholz, R.W.; Nemecek, T.; Weber, O. Life cycle management on Swiss fruit farms: Relating environmental and income indicators for apple-growing. Ecol. Econ. 2006, 58, 561–578. [Google Scholar] [CrossRef]
  13. Alishah, A.; Motevali, A.; Tabatabaeekoloor, R.; Hashemi, S.J. Multiyear life energy and life cycle assessment of orange production in Iran. Environ. Sci. Pollut. Res. 2019, 26, 32432–32445. [Google Scholar] [CrossRef]
  14. Cerutti, A.K.; Beccaro, G.L.; Bruun, S.; Bosco, S.; Donno, D.; Notarnicola, B.; Bounous, G. Life cycle assessment application in the fruit sector: State of the art and recommendations for environmental declarations of fruit products. J. Clean. Prod. 2014, 73, 125–135. [Google Scholar] [CrossRef]
  15. Cerutti, A.K.; Bruun, S.; Beccaro, G.L.; Bounous, G. A review of studies applying environmental impact assessment methods on fruit production systems. J. Environ. Manag. 2011, 92, 2277–2286. [Google Scholar] [CrossRef] [PubMed]
  16. Goossens, Y.; Annaert, B.; De Tavernier, J.; Mathijs, E.; Keulemans, W.; Geeraerd, A. Life cycle assessment (LCA) for apple orchard production systems including low and high productive years in conventional, integrated and organic farms. Agric. Syst. 2017, 153, 81–93. [Google Scholar] [CrossRef]
  17. ISO 14040:2006; Environmental Management; Life-Cycle Assessment; Principles and Framework. ISO: Geneva, Switzerland, 2006.
  18. Chen, X.; Xu, X.; Lu, Z.; Zhang, W.; Yang, J.; Hou, Y.; Wang, X.; Zhou, S.; Li, Y.; Wu, L.; et al. Carbon footprint of a typical pomelo production region in China based on farm survey data. J. Clean. Prod. 2020, 277, 124041. [Google Scholar] [CrossRef]
  19. Ramteke, S.V.; Varadwaj, P.K.; Tiwari, V. Optimizing UAV Spraying for Sustainable Agriculture: A Life Cycle and Efficiency Analysis in India. Sustainability 2025, 17, 6211. [Google Scholar] [CrossRef]
  20. Tao, X.; Wang, P.; Zhu, B. Provincial green economic efficiency of China: A non-separable input–output SBM approach. Appl. Energy 2016, 171, 58–66. [Google Scholar] [CrossRef]
  21. Zhou, Y.; Kong, Y.; Zhang, T. The spatial and temporal evolution of provincial eco-efficiency in China based on SBM modified three-stage data envelopment analysis. Environ. Sci. Pollut. Res. 2020, 27, 8557–8569. [Google Scholar] [CrossRef]
  22. Sun, R.; Zhang, J. Exploring a comprehensive environmental efficiency evaluation of pig production sector in China: Combination of LCA and undesirable output SBM model. Environ. Impact Assess. Rev. 2025, 112, 107779. [Google Scholar] [CrossRef]
  23. Gachkar, D.; Gachkar, S.; García Martínez, A.; Angulo, C.; Aghlmand, S.; Ahmadi, J. Artificial intelligence in building life cycle assessment. Archit. Sci. Rev. 2024, 67, 484–502. [Google Scholar] [CrossRef]
  24. Nabavi-Pelesaraei, A.; Abdi, R.; Rafiee, S.; Shamshirband, S.; Yousefinejad-Ostadkelayeh, M. Resource management in cropping systems using artificial intelligence techniques: A case study of orange orchards in north of Iran. Stoch. Environ. Res. Risk Assess. 2015, 30, 413–427. [Google Scholar] [CrossRef]
  25. Elhami, B.; Ghasemi Nejad Raeini, M.; Taki, M.; Marzban, A.; Heidarisoltanabadi, M. Application of classic and soft computing for modeling yield and environmental final impact in vegetable production (a case study: Transplanting onion in Isfahan province, Iran). Environ. Sci. Pollut. Res. 2022, 29, 35314–35337. [Google Scholar] [CrossRef]
  26. Kaab, A.; Sharifi, M.; Mobli, H.; Nabavi-Pelesaraei, A.; Chau, K.W. Combined life cycle assessment and artificial intelligence for prediction of output energy and environmental impacts of sugarcane production. Sci. Total Environ. 2019, 664, 1005–1019. [Google Scholar] [CrossRef] [PubMed]
  27. Nabavi-Pelesaraei, A.; Rafiee, S.; Mohtasebi, S.S.; Hosseinzadeh-Bandbafha, H.; Chau, K.-w. Integration of artificial intelligence methods and life cycle assessment to predict energy output and environmental impacts of paddy production. Sci. Total Environ. 2018, 631–632, 1279–1294. [Google Scholar] [CrossRef]
  28. Ghasemi-Mobtaker, H.; Kaab, A.; Rafiee, S.; Nabavi-Pelesaraei, A. A comparative of modeling techniques and life cycle assessment for prediction of output energy, economic profit, and global warming potential for wheat farms. Energy Rep. 2022, 8, 4922–4934. [Google Scholar] [CrossRef]
  29. Khoshnevisan, B.; Rafiee, S.; Mousazadeh, H. Environmental impact assessment of open field and greenhouse strawberry production. Eur. J. Agron. 2013, 50, 29–37. [Google Scholar] [CrossRef]
  30. Nabavi-Pelesaraei, A.; Abdi, R.; Rafiee, S. Neural network modeling of energy use and greenhouse gas emissions of watermelon production systems. J. Saudi Soc. Agric. Sci. 2016, 15, 38–47. [Google Scholar] [CrossRef]
  31. Nabavi-Pelesaraei, A.; Rafiee, S.; Hosseinzadeh-Bandbafha, H.; Shamshirband, S. Modeling energy consumption and greenhouse gas emissions for kiwifruit production using artificial neural networks. J. Clean. Prod. 2016, 133, 924–931. [Google Scholar] [CrossRef]
  32. Taghavifar, H.; Mardani, A. Prognostication of energy consumption and greenhouse gas (GHG) emissions analysis of apple production in West Azarbayjan of Iran using Artificial Neural Network. J. Clean. Prod. 2015, 87, 159–167. [Google Scholar] [CrossRef]
  33. Khoshnevisan, B.; Rajaeifar, M.A.; Clark, S.; Shamahirband, S.; Anuar, N.B.; Mohd Shuib, N.L.; Gani, A. Evaluation of traditional and consolidated rice farms in Guilan Province, Iran, using life cycle assessment and fuzzy modeling. Sci. Total Environ. 2014, 481, 242–251. [Google Scholar] [CrossRef]
  34. Safa, M.; Samarasinghe, S. Determination and modelling of energy consumption in wheat production using neural networks: “A case study in Canterbury province, New Zealand”. Energy 2011, 36, 5140–5147. [Google Scholar] [CrossRef]
  35. Salla, J.V.E.; de Almeida, T.A.; Silva, D.A.L. Integrating machine learning with life cycle assessment: A comprehensive review and guide for predicting environmental impacts. Int. J. Life Cycle Assess. 2025, 30, 2423–2445. [Google Scholar] [CrossRef]
  36. Romeiko, X.X.; Zhang, X.; Pang, Y.; Gao, F.; Xu, M.; Lin, S.; Babbitt, C. A review of machine learning applications in life cycle assessment studies. Sci. Total Environ. 2024, 912, 168969. [Google Scholar] [CrossRef] [PubMed]
  37. Taheri-Rad, A.; Khojastehpour, M.; Rohani, A.; Khoramdel, S.; Nikkhah, A. Energy flow modeling and predicting the yield of Iranian paddy cultivars using artificial neural networks. Energy 2017, 135, 405–412. [Google Scholar] [CrossRef]
  38. Harsányi, E.; Mirzaei, M.; Arshad, S.; Alsilibe, F.; Vad, A.; Nagy, A.; Ratonyi, T.; Gorji, M.; Al-Dalahme, M.; Mohammed, S. Assessment of Advanced Machine and Deep Learning Approaches for Predicting CO2 Emissions from Agricultural Lands: Insights Across Diverse Agroclimatic Zones. Earth Syst. Environ. 2024, 8, 1109–1125. [Google Scholar] [CrossRef]
  39. Chhoeum, V.; Min, S.D. Joint Angles Estimation Based on Center of Force with Artificial Neural Network and Convolutional Neural Network. IEEE Sens. J. 2023, 23, 29761–29773. [Google Scholar] [CrossRef]
  40. Guo, T.; Xu, F.; Ma, J.; Ge, F.; Cozzolino, D. Component Prediction of Antai Pills Based on One-Dimensional Convolutional Neural Network and Near-Infrared Spectroscopy. J. Spectrosc. 2022, 2022, 6875022. [Google Scholar] [CrossRef]
  41. Singh, N.; Biswas, R.; Banerjee, M. Life cycle carbon accounting and waste valorisation in litchi supply chains for climate-resilient food systems. Sustain. Food Technol. 2025. [Google Scholar] [CrossRef]
  42. Saberioon, M.; Gholizadeh, A.; Ghaznavi, A.; Chabrillat, S.; Khosravi, V. Enhancing soil organic carbon prediction of LUCAS soil database using deep learning and deep feature selection. Comput. Electron. Agric. 2024, 227, 109494. [Google Scholar] [CrossRef]
  43. Tsalidis, G.A.; Kryona, Z.-P.; Tsirliganis, N. Selecting south European wine based on carbon footprint. Resour. Environ. Sustain. 2022, 9, 100066. [Google Scholar] [CrossRef]
  44. Yu, W.; Yu, J.; Chen, X. Research on the Mechanism of the Influence of Farm Scale on the Environmental Efficiency of Apple Production—Tests Based on a Life Cycle Assessment Perspective. Land 2025, 14, 516. [Google Scholar] [CrossRef]
  45. Huijbregts, M.A.J.; Thissen, U.; Guinée, J.B.; Jager, T.; Kalf, D.; van de Meent, D.; Ragas, A.M.J.; Sleeswijk, A.W.; Reijnders, L. Priority assessment of toxic substances in life cycle assessment. Part I: Calculation of toxicity potentials for 181 substances with the nested multi-media fate, exposure and effects model USES-LCA. Chemosphere 2000, 41, 541–573. [Google Scholar] [CrossRef]
  46. Smith Cooper, J. Life-cycle assessment and sustainable development indicators. J. Ind. Ecol. 2003, 7, 12. [Google Scholar] [CrossRef]
  47. Clark, S.; Khoshnevisan, B.; Sefeedpari, P. Energy efficiency and greenhouse gas emissions during transition to organic and reduced-input practices: Student farm case study. Ecol. Eng. 2016, 88, 186–194. [Google Scholar] [CrossRef]
  48. Pishgar-Komleh, S.H.; Omid, M.; Heidari, M.D. On the study of energy use and GHG (greenhouse gas) emissions in greenhouse cucumber production in Yazd province. Energy 2013, 59, 63–71. [Google Scholar] [CrossRef]
  49. Zhang, D.; Shen, J.; Zhang, F.; Li, Y.e.; Zhang, W. Carbon footprint of grain production in China. Sci. Rep. 2017, 7, 4126. [Google Scholar] [CrossRef] [PubMed]
  50. Zhao, H.; Dong, Z.; Liu, B.; Xiong, H.; Guo, C.; Lakshmanan, P.; Wang, X.; Chen, X.; Shi, X.; Zhang, F.; et al. Can citrus production in China become carbon-neutral? A historical retrospect and prospect. Agric. Ecosyst. Environ. 2023, 348, 108412. [Google Scholar] [CrossRef]
  51. Ma, D.; He, F.; Li, G.; Deng, G. Does haze pollution affect public health in China from the perspective of environmental efficiency? Environ. Dev. Sustain. 2021, 23, 16343–16357. [Google Scholar] [CrossRef]
  52. Salooti, M.B.; Norouzi, G.; Feizabadi, Y. Sustainability assessment and optimization of citrus production using eco-efficiency index. Russ. Agric. Sci. 2021, 47, 504–512. [Google Scholar] [CrossRef]
  53. Meena, K.; Chaitra, B. A Novel Framework Using Deep Learning Techniques for Ragi Price Prediction in Karnataka. IEEE Access 2024, 12, 136103–136119. [Google Scholar] [CrossRef]
  54. Jalaee, S.A.; Shakibaei, A.; Akbarifard, H.; Horry, H.R.; GhasemiNejad, A.; Robati, F.N.; Zarin, N.A.; Derakhshani, R. A novel hybrid method based on Cuckoo optimization algorithm and artificial neural network to forecast world’s carbon dioxide emission. MethodsX 2021, 8, 101310. [Google Scholar] [CrossRef] [PubMed]
  55. Fu, H.; Ma, Z.; Wang, X.; Chen, K.; Han, K.; Ma, Q.; Wu, L. Sustainable strategies related to soil fertility, economic benefit, and environmental impact on pear orchards at the farmer scale in the Yangtze River Basin, China. Environ. Sci. Pollut. Res. 2022, 30, 17316–17326. [Google Scholar] [CrossRef]
  56. Yan, M.; Cheng, K.; Yue, Q.; Yan, Y.; Rees, R.M.; Pan, G. Farm and product carbon footprints of China’s fruit production—Life cycle inventory of representative orchards of five major fruits. Environ. Sci. Pollut. Res. 2015, 23, 4681–4691. [Google Scholar] [CrossRef]
  57. Alaphilippe, A.; Simon, S.; Brun, L.; Hayer, F.; Gaillard, G. Life cycle analysis reveals higher agroecological benefits of organic and low-input apple production. Agron. Sustain. Dev. 2012, 33, 581–592. [Google Scholar] [CrossRef]
  58. Basset-Mens, C.; Vannière, H.; Grasselly, D.; Heitz, H.; Braun, A.; Payen, S.; Koch, P.; Biard, Y. Environmental impacts of imported and locally grown fruits for the French market: A cradle-to-farm-gate LCA study. Fruits 2016, 71, 93–104. [Google Scholar] [CrossRef]
  59. Beccali, M.; Cellura, M.; Iudicello, M.; Mistretta, M. Resource Consumption and Environmental Impacts of the Agrofood Sector: Life Cycle Assessment of Italian Citrus-Based Products. Environ. Manag. 2009, 43, 707–724. [Google Scholar] [CrossRef] [PubMed]
  60. Sanjuán, N.; Ubeda, L.; Clemente, G.; Mulet, A.; Girona, F. LCA of integrated orange production in the Comunidad Valenciana (Spain). Int. J. Agric. Resour. Gov. Ecol. 2005, 4, 163–177. [Google Scholar] [CrossRef]
  61. Hessampour, R.; Bastani, A.; Hassani, M.; Failla, S.; Vaverková, M.D.; Halog, A. Joint life cycle assessment and data envelopment analysis for the benchmarking of energy, exergy, environmental effects, and water footprint in the canned apple supply chain. Energy 2023, 278, 127795. [Google Scholar] [CrossRef]
  62. Qin, W.; Assinck, F.B.T.; Heinen, M.; Oenema, O. Water and nitrogen use efficiencies in citrus production: A meta-analysis. Agric. Ecosyst. Environ. 2016, 222, 103–111. [Google Scholar] [CrossRef]
Figure 1. The geographical distribution of the surveyed area in Chongqing City, China. The data in the green areas represent the five districts of Chongqing City: Yongchuan District (1), Beibei District (2), Liangping District (3), Wulong District (4), and Bapan District (5).
Agriculture 16 00525 g001
Figure 2. Based on 138 questionnaires, the orchard yields and PFP-N were used to group the orchards. The black dotted lines represent the average values of output and PFP-N respectively. HL, high yield and low PFP-N; HH, high yield and high PFP-N; LH, high yield and high PFP-N; LL, low yield and low PFP-N.
Agriculture 16 00525 g002
Figure 3. Workflow of the 1DCNN model. Agricultural input variables were used as model inputs, and environmental impact indicators were predicted as outputs. The model was trained using stochastic gradient descent and repeated ten times to reduce randomness.
Agriculture 16 00525 g003
Figure 4. Contribution of different agricultural inputs in orchards to four environmental impacts. (a), global warming potential; (b), reactive nitrogen losses; (c), acidification potential; (d), eutrophication potential. AMS-N, production and transportation of nitrogen fertilizer in the agricultural material stage. AMS-P, production and transportation of phosphorus fertilizer in the agricultural material stage. AMS-K, production and transportation of potash fertilizer in the agricultural material stage. AFS-N, nitrogen fertilizer application in the agricultural farming stage. AFS-P, phosphorus fertilizer application in the agricultural farming stage. AMS-Bags, production and transportation of fruit bags in the agricultural materials stage. AMS-Ele, electricity consumption in the agricultural materials stage. AMS-Pes, pesticides consumption in the agricultural material stage. AMS-Fuel, fuel consumption in the agricultural materials stage. AFS-NH3, ammonia volatilization at the agricultural farming stage. AFS-NO2, NO2 emissions at the agricultural farming stage. AFS-NOx, NOx emissions at the agricultural farming stage.
Agriculture 16 00525 g004
Figure 5. Environmental impacts in the four groups of orchards. HH, HL, LH and LL, orchard groups; (a), global warming potential (GWP); (b), reactive nitrogen losses (Nr); (c), acidification potential (AP); (d), eutrophication potential (EP). AMS -N, production and transportation of nitrogen fertilizer in the agricultural material stage. AMS-P, production and transportation of phosphorus fertilizer in the agricultural material stage. AFS-N, nitrogen fertilizer application in the nitrogen fertilizer at the agricultural farming stage. AFS-P, phosphorus fertilizer application in the agricultural farming stage. AMS-Bags, production and transportation of fruit bags in the agricultural materials stage. AMS-Ele, electricity consumption in the agricultural materials stage. AMS-Pes, pesticides consumption in the agricultural material stage. AMS-Fuel, fuel consumption in the agricultural materials stage. AFS-others (B) includes AFS-NH3, ammonia volatilization at the agricultural farming stage; AFS-NO2, NO2 emissions at the agricultural farming stage; AFS-NOx, NOx emissions at the agricultural farming stage. AFS-others (D) includes AFS-NH3, ammonia volatilization at the agricultural farming stage; AFS-P, phosphorus fertilizer application in the agricultural farming stage.
Agriculture 16 00525 g005
Figure 6. Average ecological efficiency values of the four orchard groups. HH, HL, LH and LL, orchard groups; The scattered dots in different colors represent the sample points of the corresponding groups.
Agriculture 16 00525 g006
Figure 7. Environmental impact slack values of the four orchard groups. HH, HL, LH and LL, orchard groups; GWP, global warming potential; Nr, reactive nitrogen losses; AP, acidification potential; EP, eutrophication potential.
Agriculture 16 00525 g007
Figure 8. The 1DCNN model: Comparison between the average of ten predictions and observed values for four environmental impacts. (a), global warming potential (GWP); (b), reactive nitrogen losses (Nr); (c), acidification potential (AP); (d), eutrophication potential (EP).
Agriculture 16 00525 g008
Figure 9. Local Sensitivity Scores of the Model for Four Environmental impacts.
Agriculture 16 00525 g009
Table 2. Average agricultural material inputs and outputs of the orchard production system.
InputsMeanRangeStandard Deviation
Total fertilizer (kg ha−1)
N1188.59210.6–4584.9734.93
P2O5657.6712.54–2934.9490.21
K2O1097.1331.36–4206768.80
Manure fertilizer (kg ha−1)
N43.70–1819.8155.35
C40.090–2934.9248.95
K2O31.080–1500.3127.52
Chemical fertilizer (kg ha−1)
N1144.890–4565.4743.23
P2O5626.530–2608.5446.43
K2O1091.890–4166756.14
Pesticide (kg ha−1)24.956–607.84
Fruit bags (kg ha−1)374.990–1875222.03
Fuel (kg ha−1)12.690–132.721.12
Electricity (kWh ha−1)79.170–1040199.86
Output
Yield (t ha−1 year−1)30.475–52.510.19
Disclaimer/Publisher’s Note: The statements, opinions and data contained in all publications are solely those of the individual author(s) and contributor(s) and not of MDPI and/or the editor(s). MDPI and/or the editor(s) disclaim responsibility for any injury to people or property resulting from any ideas, methods, instructions or products referred to in the content.