1. Introduction
Faced with the global challenges of climate change, energy transition, and the sustainable management of natural resources, European Union (EU) countries have been intensively improving their agri-environmental and energy policies over the past few decades [
1]. Agriculture, as one of the most significant sectors with an impact on the environment, plays a dual role—on the one hand, it is a source of greenhouse gas emissions, and on the other, it offers opportunities to introduce innovations in renewable energy sources and environmental efficiency. This is precisely why measuring and comparing agri-environmental and energy indicators is of crucial importance for monitoring progress and improving sustainable development policies within the EU [
2].
The primary purpose of this study was to evaluate disparities and convergence among EU member states in key climate, energy, and agri-environmental indicators. By applying an integrated methodological framework that combines the Entropy Index and the PROMETHEE–GAIA multi-criteria decision-making method, the study aims to provide an objective, data-driven assessment of country performance in terms of agricultural sustainability, energy efficiency, and environmental impact. The entropy method allows for an objective determination of the weight coefficients for each indicator based on information theory and data variability, without the influence of subjective assessments. The weights thus obtained serve as input parameters in the PROMETHEE–GAIA methodology, which allows for countries to be ranked by sustainability level and the graphical visualisation of the influence of the criteria in the GAIA plane.
Despite the growing body of research on agri-environmental and energy indicators in the EU, existing studies often focus on a limited set of countries, specific sectors, or single dimensions of sustainability (environmental, economic, or social), while comprehensive, multi-dimensional analyses that integrate energy efficiency, agricultural sustainability, and environmental impact across all EU member states remain scarce. Furthermore, while several studies applied multi-criteria decision-making (MCDM) methods or entropy-based weighting separately, few have combined these approaches into a unified framework that allows for both the objective weighting of indicators and visualisation of relative performance, as enabled by the Entropy–PROMETHEE–GAIA methodology.
This gap highlights the need for an integrated, data-driven assessment that can provide policymakers and researchers with a clear understanding of disparities and convergence trends in key climate, energy, and agri-environmental indicators across the EU, offering insights into the effectiveness of existing policies and identifying areas for improvement.
Accordingly, the main aim of this study was to explicitly address this research gap by evaluating the performance, disparities, and convergence patterns among EU member states in selected agri-environmental, energy, and climate indicators. By explicitly addressing these gaps, the study contributes both methodologically—by integrating entropy and PROMETHEE–GAIA approaches for a multidimensional assessment—and practically—by generating insights relevant to EU-level policy evaluation and decision-making. To achieve this goal, the study focused on specific research objectives: (i) evaluating disparities in climate, energy, and agri-environmental indicators across EU member states with harmonised data; (ii) analysing convergence trends from 2017 to 2023 using entropy-based variability measures; and (iii) ranking EU countries based on their agri-environmental performance with the PROMETHEE–GAIA framework, highlighting the leading and lagging groups.
After the introductory presentations, an overview of relevant research on agro-ecological indicators and empirical studies on the convergence of EU countries in energy and climate follows. Next, the research methodology is presented, along with the empirical results and a discussion of the findings. The conclusion contains recommendations and directions for future research.
2. Theoretical Background
Agri-environmental indicators (AEIs) have been developed as analytical tools for assessing the relationship between agriculture and the environment [
2,
3]. According to the OECD (2001) [
4], AEIs serve as an instrument for designing and evaluating sustainable agriculture policies as they enable the monitoring of long-term trends in resource use, environmental impacts, and management efficiency. Initially, AEIs focused on monitoring soil degradation, biodiversity loss, and water pollution, whereas contemporary approaches expand the scope to include climate change, the circular economy, and ecosystem services. The Eurostat Report [
5] emphasises that the development of indicators has become an integral part of the EU’s Common Agricultural Policy (CAP), within which indicators are used to assess the effectiveness of green measures, rural development, and the transition to sustainable production systems. The literature particularly highlights the need for AEI to be compatible, measurable, and relevant to ensure international comparability and robust assessments [
6].
On the other hand, some of the literature has focused on classifying indicators according to the “pressure–state–response” (PSR) conceptual framework. Pressure indicators include the use of fertilisers and pesticides, soil tillage intensity, livestock emissions, and greenhouse gas (GHG) emissions, reflecting the pressures that agricultural activities exert on the environment. State indicators refer to soil, water, and biodiversity quality, capturing the current condition of natural resources. Response indicators include the policies, management practices, and technological measures implemented to mitigate negative impacts and promote sustainability. Studies in the European context show that it is precisely the combination of these indicators that enables the most accurate understanding of the ecological performance of agriculture [
7], highlighting the importance of explicitly linking each indicator to the PSR framework to clarify its role in environmental assessment.
Sustainable agriculture is a rapidly growing field, reflecting the increasing global attention, research efforts, and policy initiatives aimed at developing farming systems that produce food and energy efficiently while minimising negative environmental impacts and ensuring that resources are available for current and future generations. Traditionally, sustainable agriculture is defined in terms of three dimensions: economic, environmental, and social. Although it has been widely studied over the past 25 years, recent research still lacks comprehensive attempts to integrate all indicators into a single framework. In addition, indicator sets require regular updates, as they change over time.
The authors of [
8] identified 101 indicators reported in earlier studies across the three sustainability dimensions. The paper proposes a refined set of key indicators and provides an overview of the analysed literature by publication year, geographic distribution, and research focus. The measurement of sustainability in the agri-food sector has been addressed to understand how indicators are applied and for which specific purposes; in this context, an integrated approach combining environmental, social, and economic indicators is considered the most effective pathway to facilitate the transition to sustainability [
9]. An analysis of European agri-environmental policy highlights key lessons from experience and outlines potential directions for future research and policy to enhance the EU’s achievement of agri-environmental and climate objectives [
10].
Building upon the existing literature on agri-environmental indicators (AEIs) and their role in monitoring sustainability in the European agricultural sector, the present study extends prior research by focusing specifically on the Climate & Energy dimension of agri-environmental performance. While earlier studies have highlighted the importance of integrating environmental, social, and economic indicators to assess agricultural sustainability, there remains a gap in applying advanced multi-criteria decision-making (MCDM) methods to rank EU countries using comparable energy-related metrics quantitatively. By combining the Entropy Index with the PROMETHEE–GAIA method, this research not only determines objective weights for selected indicators but also provides a comprehensive country-level ranking and a temporal comparison between 2017 and 2023. This approach addresses the limitations of previous studies that either considered individual indicators in isolation or lacked a systematic weighting framework, thereby offering a more robust, data-driven assessment of convergence and disparities in agri-environmental performance across EU member states.
2.1. Empirical Research on the Convergence of EU Countries: Energy & Climate
The empirical literature on convergence in energy and climate indicators within the EU has significantly expanded over the past two decades, particularly following the implementation of key strategies such as the European Green Deal [
11,
12,
13,
14]. The authors of [
15] developed a methodology to assess sustainable energy and climate development in the EU-27 countries. The results confirm a high degree of differentiation among EU-27 countries in terms of sustainability, identifying both leading and low-sustainability countries. The results allow interpretation through both the analysis of changes in individual indicators and a comprehensive assessment of sustainable development in each country. The progress of European Union countries toward achieving the Sustainable Development Goals (SDGs) has been assessed using multi-criteria decision-making (MCDM) methods [
16]. The evaluation covered 27 countries and was based on 15 indicators for the period 2019–2021. Notably, the rankings varied across scenarios, highlighting the strong influence of methodological choices on the final assessment results. The essential question is whether member states are gradually reducing the disparities in their energy performance and emissions—that is, whether convergence toward common European objectives is occurring. The sustainability of agriculture is difficult to measure and evaluate because it is a multidimensional concept encompassing economic, social, and environmental aspects, and it depends on temporal dynamics and geographical differences. Existing studies assessing agricultural sustainability are burdened by numerous limitations that limit their relevance to policymakers. Specifically, most of them focused on the farm level or included only a small number of countries. In contrast, the few studies that have covered a broader group of countries examined only part of the sustainability dimensions or relied on cross-sectional data.
Furthermore, existing studies on the interplay between the agricultural economy and ecosystems often addressed only isolated factors, such as economic growth or ecological sustainability, or were limited to specific provinces or regions, resulting in a lack of comprehensive nationwide analysis. To address this gap, ref. [
17] used spatial data from 31 provincial-level regions in China from 2008 to 2022 and developed a multidimensional framework encompassing economic input, structure, efficiency, benefits, vitality, ecological conditions, and pressure. Their results indicate the following: First, the level of coupling coordination has gradually increased, leading to reduced regional disparities; second, these disparities mainly arise from differences among the eastern, central, and western regions, with the nature of these structural gaps shifting from interregional contrasts to high-density variability; and third, development exhibits a pattern of “club convergence”, in which upward mobility is difficult, and the risk of decline remains significant. Major obstacles include farmland scale, land-use efficiency, afforestation capacity, and soil erosion management.
Based on panel data on agricultural production in China from 2004 to 2015, ref. [
18] selected 21 indicators to construct a five-dimensional index system for sustainable agricultural green development, encompassing population, society, economy, environment, and resources. By applying the entropy method and the coupling coordination degree model, this study investigated the spatiotemporal evolution and coordination level of the Agricultural Green Development Index (AGDI). The findings reveal that sustainable agricultural green development is most strongly influenced by the sustainability of the population system, followed by the environmental, resource, economic, and social systems. Spatially, the AGDI varies significantly across regions. In terms of coordination among the five dimensions, the AGDI coordination level exhibits a pattern of “continuous decline followed by fluctuating growth” from 2004 to 2015. The spatial distribution of coordination levels shows an increasing number of provinces achieving “coordination” or “comparative coordination” across sustainability subsystems. To analyse the impact of modern agriculture on the environment, ref. [
19] calculated the “agro-environmental vulnerability index” for 40 Asian countries by applying principal component analysis to secondary data on 7 agro-environmental indicators (related to pre- and post-production agricultural activities). The study showed that countries in the southern and eastern regions were more vulnerable than those in the central and western parts of Asia.
Such research and similar studies are becoming increasingly common across Europe. The EEU’s emphasis on environmental issues in the agricultural sector—through strategies such as the European Green Deal, the Biodiversity Strategy, and the “Farm to Fork” initiative—provides new guidance for the CAP, shifting EU agricultural practices toward a more environmentally and climate-friendly model. The revised support rules and obligations for farmers will require adopting new farm management methods [
20,
21,
22,
23].
The Agri-Environmental Footprint Index (AFI) has been proposed as a tool for identifying the current environmental status and monitoring changes and achievements at the farm level [
24]. The proposed approach was applied in a case study in Lithuania for the year 2017. Farm-level data from the Lithuanian Farm Accountancy Data Network were used. The study relied on multiple statistical techniques (Shannon entropy and Principal Component Analysis—PCA) and a multi-criteria approach (Simple Additive Weighting) to construct composite indicators. The most favourable ecological effects were identified in medium-sized farms (economically) specialising in mixed crop–livestock systems (meadow–pasture system). The highest proportion of farms with low AFI values was found among the largest farms and among those specialising in horticulture (using Shannon entropy) and fruit production (using the PCA method). The agro-environmental sustainability of the Baltic countries—Lithuania, Latvia, and Estonia—was assessed by analysing agricultural biodiversity, greenhouse gas emissions, land use, energy consumption, and water management, with evaluations and rankings conducted using the TOPSIS (Technique for Order Preference by Similarity to Ideal Solution) method applied to a set of agri-environmental indicators (AESs) [
25]. According to the findings, the highest AES value was assigned to Latvia, followed by Lithuania and Estonia. The TOPSIS method was applied to evaluate the EU’s performance in addressing the challenges of the low-carbon energy transition in 2015 and 2020 [
26]. The results showed that energy justice, mitigation costs, land use, and lack of infrastructure represent the most significant social, economic, environmental, institutional, and technical challenges. The hybrid Fuzzy AHP-TOPSIS decision-making model for assessing sustainable agricultural strategies was also applied to the case of Iran [
27].
Annual data on 12 indicators (5 economic, 3 social, and 4 environmental) for 26 EU countries over the period 2004–2018 were used, and group-based multivariate trajectory modelling was applied to identify clusters of countries with common trends in sustainable objectives [
28]. The results highlight three groups of countries characterised by different strong and weak sustainability goals. Strong goals common to all groups include improvements in productivity, increases in personal income in rural areas, reductions in rural poverty, growth in renewable energy production, expansion of organic farming, and reductions in nitrogen balance. In contrast, improvements in managerial turnover and reductions in greenhouse gas emissions represent weak goals common to all country groups. A total of 14 indicators representing four main areas (dimensions) related to energy and climate sustainability were analysed [
29]. For this research, entropy and complex proportional assessment methods were used, which belong to the family of multi-criteria decision-making techniques. Based on the results, EU countries were grouped according to similar levels of energy and climate sustainability. The obtained results constitute a dataset that enables multi-criteria analysis. This also allows for a comprehensive assessment of the effects of sustainable development policies in EU countries and the current status in the context of the European Green Deal Strategy and Agenda 2030.
Competitiveness efficiency in the context of climate change was assessed through a case study of a European Union region, employing the Data Envelopment Analysis (DEA) model and Shannon entropy [
30]. The results showed that the proposed DEA–Entropy model enabled the construction of a regional climate change competitiveness index for all regions by applying a set of standard weights. The structure of the standard weights in the proposed model demonstrated greater discriminative power than those obtained using pure DEA or DEA-like methods.
From a methodological perspective, ref. [
31] presented a novel original method—Entropy–Evolutionary Evaluation of Sustainability (E
3)—based on a multidimensional approach to the study and assessment of sustainable energy development in the EU-27 countries over the period 2014–2023. By integrating 19 indicators representing the adopted research dimensions (energy, economic, environmental, and social), the method enabled both a static assessment and a dynamic analysis of the energy transition process across space and time. The results, expressed in terms of overall index values and dimensional indices, revealed significant diversity among the EU-27 countries regarding sustainable energy development. The best-performing countries were Sweden, Finland, Denmark, Latvia, and Austria. At the same time, the lowest-performing were Cyprus, Malta, Ireland, and Luxembourg—countries highly dependent on energy imports, with limited diversification of their energy mix and high energy costs.
The agro-environmental situation in the EU was assessed at the national level [
32]. The ranking results indicate that Portugal, Estonia, and Ireland lead in agro-environmental performance, while Malta, the Netherlands, Slovenia, and Cyprus are ranked lowest. The EU’s CAP should be designed to improve the position of certain countries, drawing on the experiences and sustainable agricultural practices of leading countries in this field while taking into account the research findings.
The application of multi-criteria decision analysis (MCDA) methods is among the most suitable and promising approaches for comprehensively capturing the complex, wide-ranging effects of agricultural practices and food supply chains [
33]. A systematised conceptual analysis was employed to integrate different MCDM techniques, methodological trends, and integration challenges in energy and agricultural systems, highlighting that, given the presence of multifunctionality, circularity, climate sensitivity, and strong social characteristics, agriculture represents an ideal candidate to serve as a system-level testbed for the development of integrated MCDM frameworks [
34]. This paper emphasises the need to address structural deficiencies so that MCDM can evolve from sectoral, fragmented analytical frameworks into cohesive decision-support systems capable of guiding the transition of energy and agricultural systems towards equity, circularity, and climate change adaptation. A systematic search of Web of Science (WoS), Scopus, Google Scholar, Semantic Scholar, CrossRef, and OpenAlex was conducted using terms such as “MCDM”, “forest management”, and “decision support” [
35]. They found that the Analytical Hierarchy Process (AHP) and the Technique for Order of Preference by Similarity to Ideal Solution (TOPSIS) were the most commonly used methods, followed by the Preference Ranking Organisation Method for Enrichment Evaluation (PROMETHEE), Analytic Network Process (ANP), GIS, and Goal Programming (GP). The adoption of these methods varied by region, with advanced models such as AHP and GIS being less frequently used in developing countries due to technological constraints. These findings highlight emerging trends and gaps in MCDM applications, emphasising the need for context-specific frameworks to support sustainable management under climate change conditions.
While previous studies offer valuable insights into agri-environmental indicators, convergence dynamics, and the use of MCDM techniques, they tended to examine these areas separately. In contrast, this study combines these aspects by using entropy-based weighting alongside the PROMETHEE–GAIA method to evaluate climate- and energy-related agri-environmental performance across all EU Member States, utilising harmonised data. This integrated approach provides both objective indicator weighting and easy-to-interpret visualisations of country performance, thereby advancing existing research and offering a stronger foundation for policy-relevant analysis.
2.2. Research Gap and Research Questions
Based on the reviewed literature, it is evident that existing studies on agri-environmental and energy indicators in the EU remain fragmented in terms of indicator coverage, spatial scope, and methodological integration. In particular, comprehensive EU-wide analyses that jointly address climate and energy indicators using objective weighting and multi-criteria decision-making approaches remain limited. To address these gaps, this study formulated the following research questions (RQ).
RQ1: How much do EU Member States vary in their climate and energy agri-environmental indicators, and have these differences lessened from 2017 to 2023? RQ2: Which climate and energy agri-environmental indicators are most influential in distinguishing EU Member States when using objective entropy-based weighting? RQ3: How does combining entropy-based weighting with the PROMETHEE–GAIA method improve the evaluation and visualisation of the relative agri-environmental performance of EU countries? These research questions inform the methodological framework and empirical analysis outlined in the section below.
4. Results and Discussion
According to the presented results of the descriptive statistics (
Table 2), it is already evident that the differences for the climate dimension in the greenhouse gas emissions from agriculture indicator are very pronounced. The GHG indicator ranged from 4.20 to 33.10 in 2017. In 2023, the differences were even more pronounced, ranging from 3.70 to 36.2.
Table 2 presents that among the energy indicators, GAE intensity showed substantial variability, with a wide range of values in both years. The decline in the mean value from 14.97 in 2017 to 11.64 in 2023 suggests an overall improvement in energy efficiency relative to agricultural output, although the standard deviation remained high, pointing to continued structural heterogeneity in national energy–agriculture linkages. Such dispersion in min and max values indicates profound structural differences in energy consumption levels across countries [
51], determined by the size of the individual economy [
52] and the degree of industrialisation [
53].
Renewable energy production intensity (REPP) displayed lower absolute values but pronounced dispersion, reflecting heterogeneous progress in integrating renewable energy into national energy systems relevant for agriculture. The decrease in both the mean and standard deviation between 2017 and 2023 suggests a modest reduction in cross-country disparities, although differences remain substantial. This indicator points to different national policies in the field of energy transition [
54,
55].
The GIC indicator exhibited a notable decline in both mean and dispersion over the observed period, indicating a general reduction in gross inland energy consumption intensity relative to agricultural GVA. This trend points to partial convergence in overall energy use efficiency, though the remaining range of values confirms that national energy structures continue to differ significantly.
The range of values for all indicators remains wide, indicating persistent cross-country heterogeneity in agri-environmental and energy intensity patterns across the EU [
56]. Moreover, the REPP indicator continues to exhibit the highest variability, suggesting pronounced differences in the integration of renewable energy within national energy contexts relevant for agriculture [
57]. These results justify the application of entropy-based methods to quantitatively assess indicator dispersion and derive objective weights for the subsequent multi-criteria evaluation of agro-environmental performance among EU Member States.
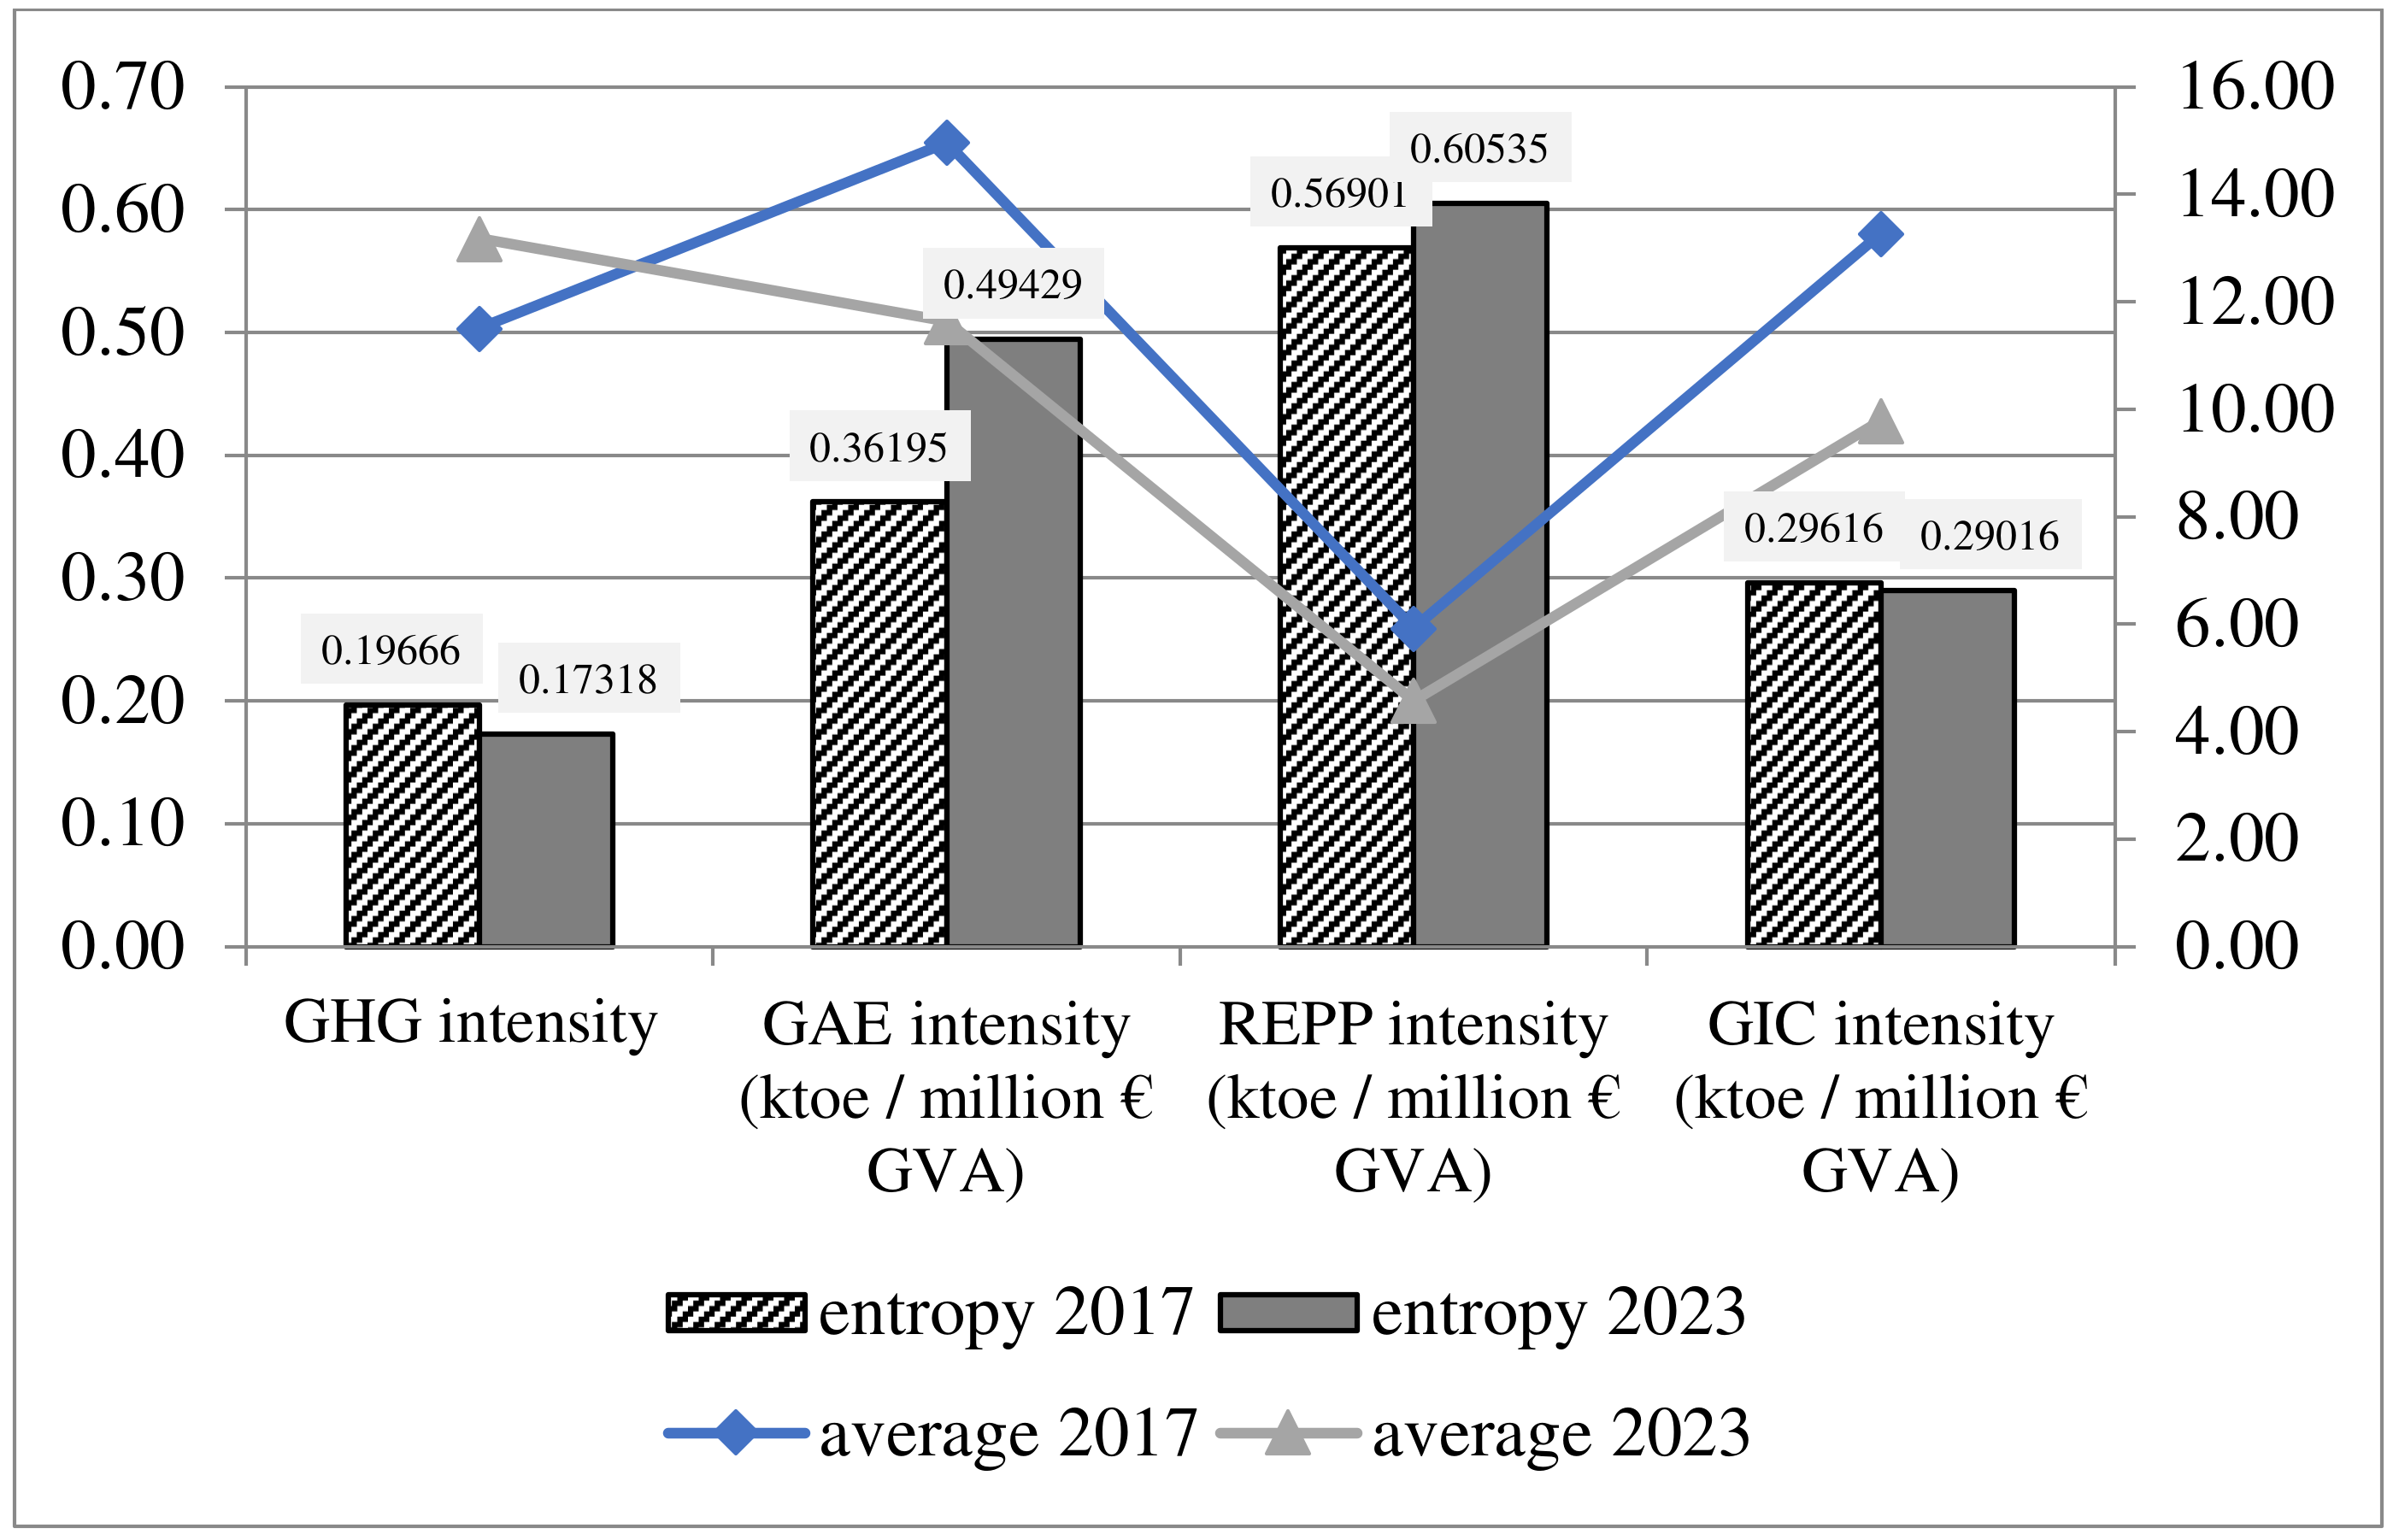
Figure 1 presents the entropy values (shown on the primary axis, left side) and average values (observed on the secondary axis, right side) for agri-environmental intensity indicators in 2017 and 2023. All energy indicators are expressed as intensities relative to Gross Value Added in agriculture (ktoe per million EUR GVA), while GHG represents emission intensity.
The entropy results presented in
Table 3 indicate heterogeneous convergence patterns across agri-environmental dimensions. A decrease in GHG intensity entropy suggests partial convergence in climate-related performance, reflecting the impact of coordinated EU climate policies in agriculture. In contrast, rising entropy values for GAE and REPP intensities point to increasing divergence in how efficiently Member States use energy and develop renewable energy relative to agricultural economic output. The GIC indicator showed stable but relatively high entropy, indicating that structural differences in inland energy consumption efficiency remain largely unchanged. Overall, these findings confirm that convergence within the EU agro-environmental system is dimension-specific, with stronger alignment observed in emission intensity than in energy-related indicators. The most significant progress in convergence was seen in GHG, which reflects coordinated policies to reduce emissions [
58]. On the other hand, REPP retained high and raising entropy, indicating that renewable energy sources still vary across countries [
59] and suggesting potential for greater harmonisation in this area. These findings indicate that convergence processes within the EU agro-environmental system are dimension-specific, with climate-related pressures showing stronger alignment than energy structure indicators.
In the next step, the PROMETHEE–GAIA methodology was applied to the multi-criteria ranking of EU member states in 2023 based on their climate and energy performance in agriculture. It is used to rank alternatives (in this case, EU member states) based on multiple criteria of different natures and scales of measurement. The climate and energy AEIs that were used in this study are shown in
Table 4. The dataset consisted of 4 indicators designated by the symbols C1–C4.
The final calculation results obtained by applying the PROMETHEE–GAIA method, along with the corresponding ranking orders, are shown in
Table 5.
The 2023 EU country ranking based on the PROMETHEE method revealed significant differences in agri-environmental climate and energy performance when indicators were expressed as intensities relative to agricultural gross value added (GVA). The net preference flow (Φ) ranged from 0.2430 (highest-ranked country) to −0.5397 (lowest-ranked country), indicating pronounced heterogeneity across Member States.
Based on the obtained Φ values, EU countries were classified into three performance groups: leading performers (Φ > 0.15), moderate performers (Φ between 0.05 and 0.15), and low-performing countries (Φ < 0.05). Unlike rankings based on absolute energy values, the intensity-based approach highlights countries that achieved relatively favourable climate and energy outcomes per unit of agricultural economic output. The results show that Romania (Φ = 0.2430), Italy and Greece stand out as leading countries in the use of renewable energy sources. At the same time, most southern European and smaller economies recorded lower performances, indicating the need for stronger energy integration and climate policies [
58,
60]. The leading group was dominated by southern and central European countries, and these countries achieved positive net flows primarily due to relatively lower energy and emission intensities in agriculture, as well as favourable balances between renewable energy use and agricultural value creation [
61].
Moderate performing countries, including Denmark, Croatia, Hungary, Czechia, Bulgaria, Portugal, France, and the Netherlands, showed balanced but less pronounced advantages across the observed indicators. Their Φ values suggest partial progress in reducing energy and emission intensities, although not sufficient to reach the leading group. In several cases, relatively high positive flows were offset by comparable negative flows, indicating structural trade-offs between energy consumption, renewable production, and emission intensity [
62,
63,
64,
65]. For example, France performed moderate well thanks to a combination of relatively low GHG emissions and strong renewable energy production [
64].
Low performing countries were characterised by weak net preference flows, reflecting higher energy and GHG intensities relative to agricultural value added. Notably, Germany (Φ = −0.0327) fell into this group, indicating that despite its large renewable energy production in absolute terms, its agri-environmental performance appears less favourable once adjusted for agricultural economic output. Germany has started, so from this point, it is working on developing energy infrastructure, high investments in renewable energy, and a firm policy to decarbonise agriculture [
65]. Similarly, Luxembourg (Φ = −0.5095) and Malta (Φ = −0.5397), which recorded the lowest Φ values, exhibited structural limitations related to scale, specialisation, and dependence on external energy sources. This reflects the structural dependence on fossil fuels and the low capacity for energy production in the agricultural sector [
66,
67,
68].
Bearing in mind that the period between 2017–2023 also includes significant exogenous shocks (COVID-19, the energy crisis, and the war in Ukraine), the observed reduction in the variability of agro-ecological and energy indicators cannot be unambiguously interpreted as evidence of long-term structural convergence among EU member states, but also as a possible consequence of synchronised adjustments of national policies and production structures in conditions of common exogenous crisis shocks.
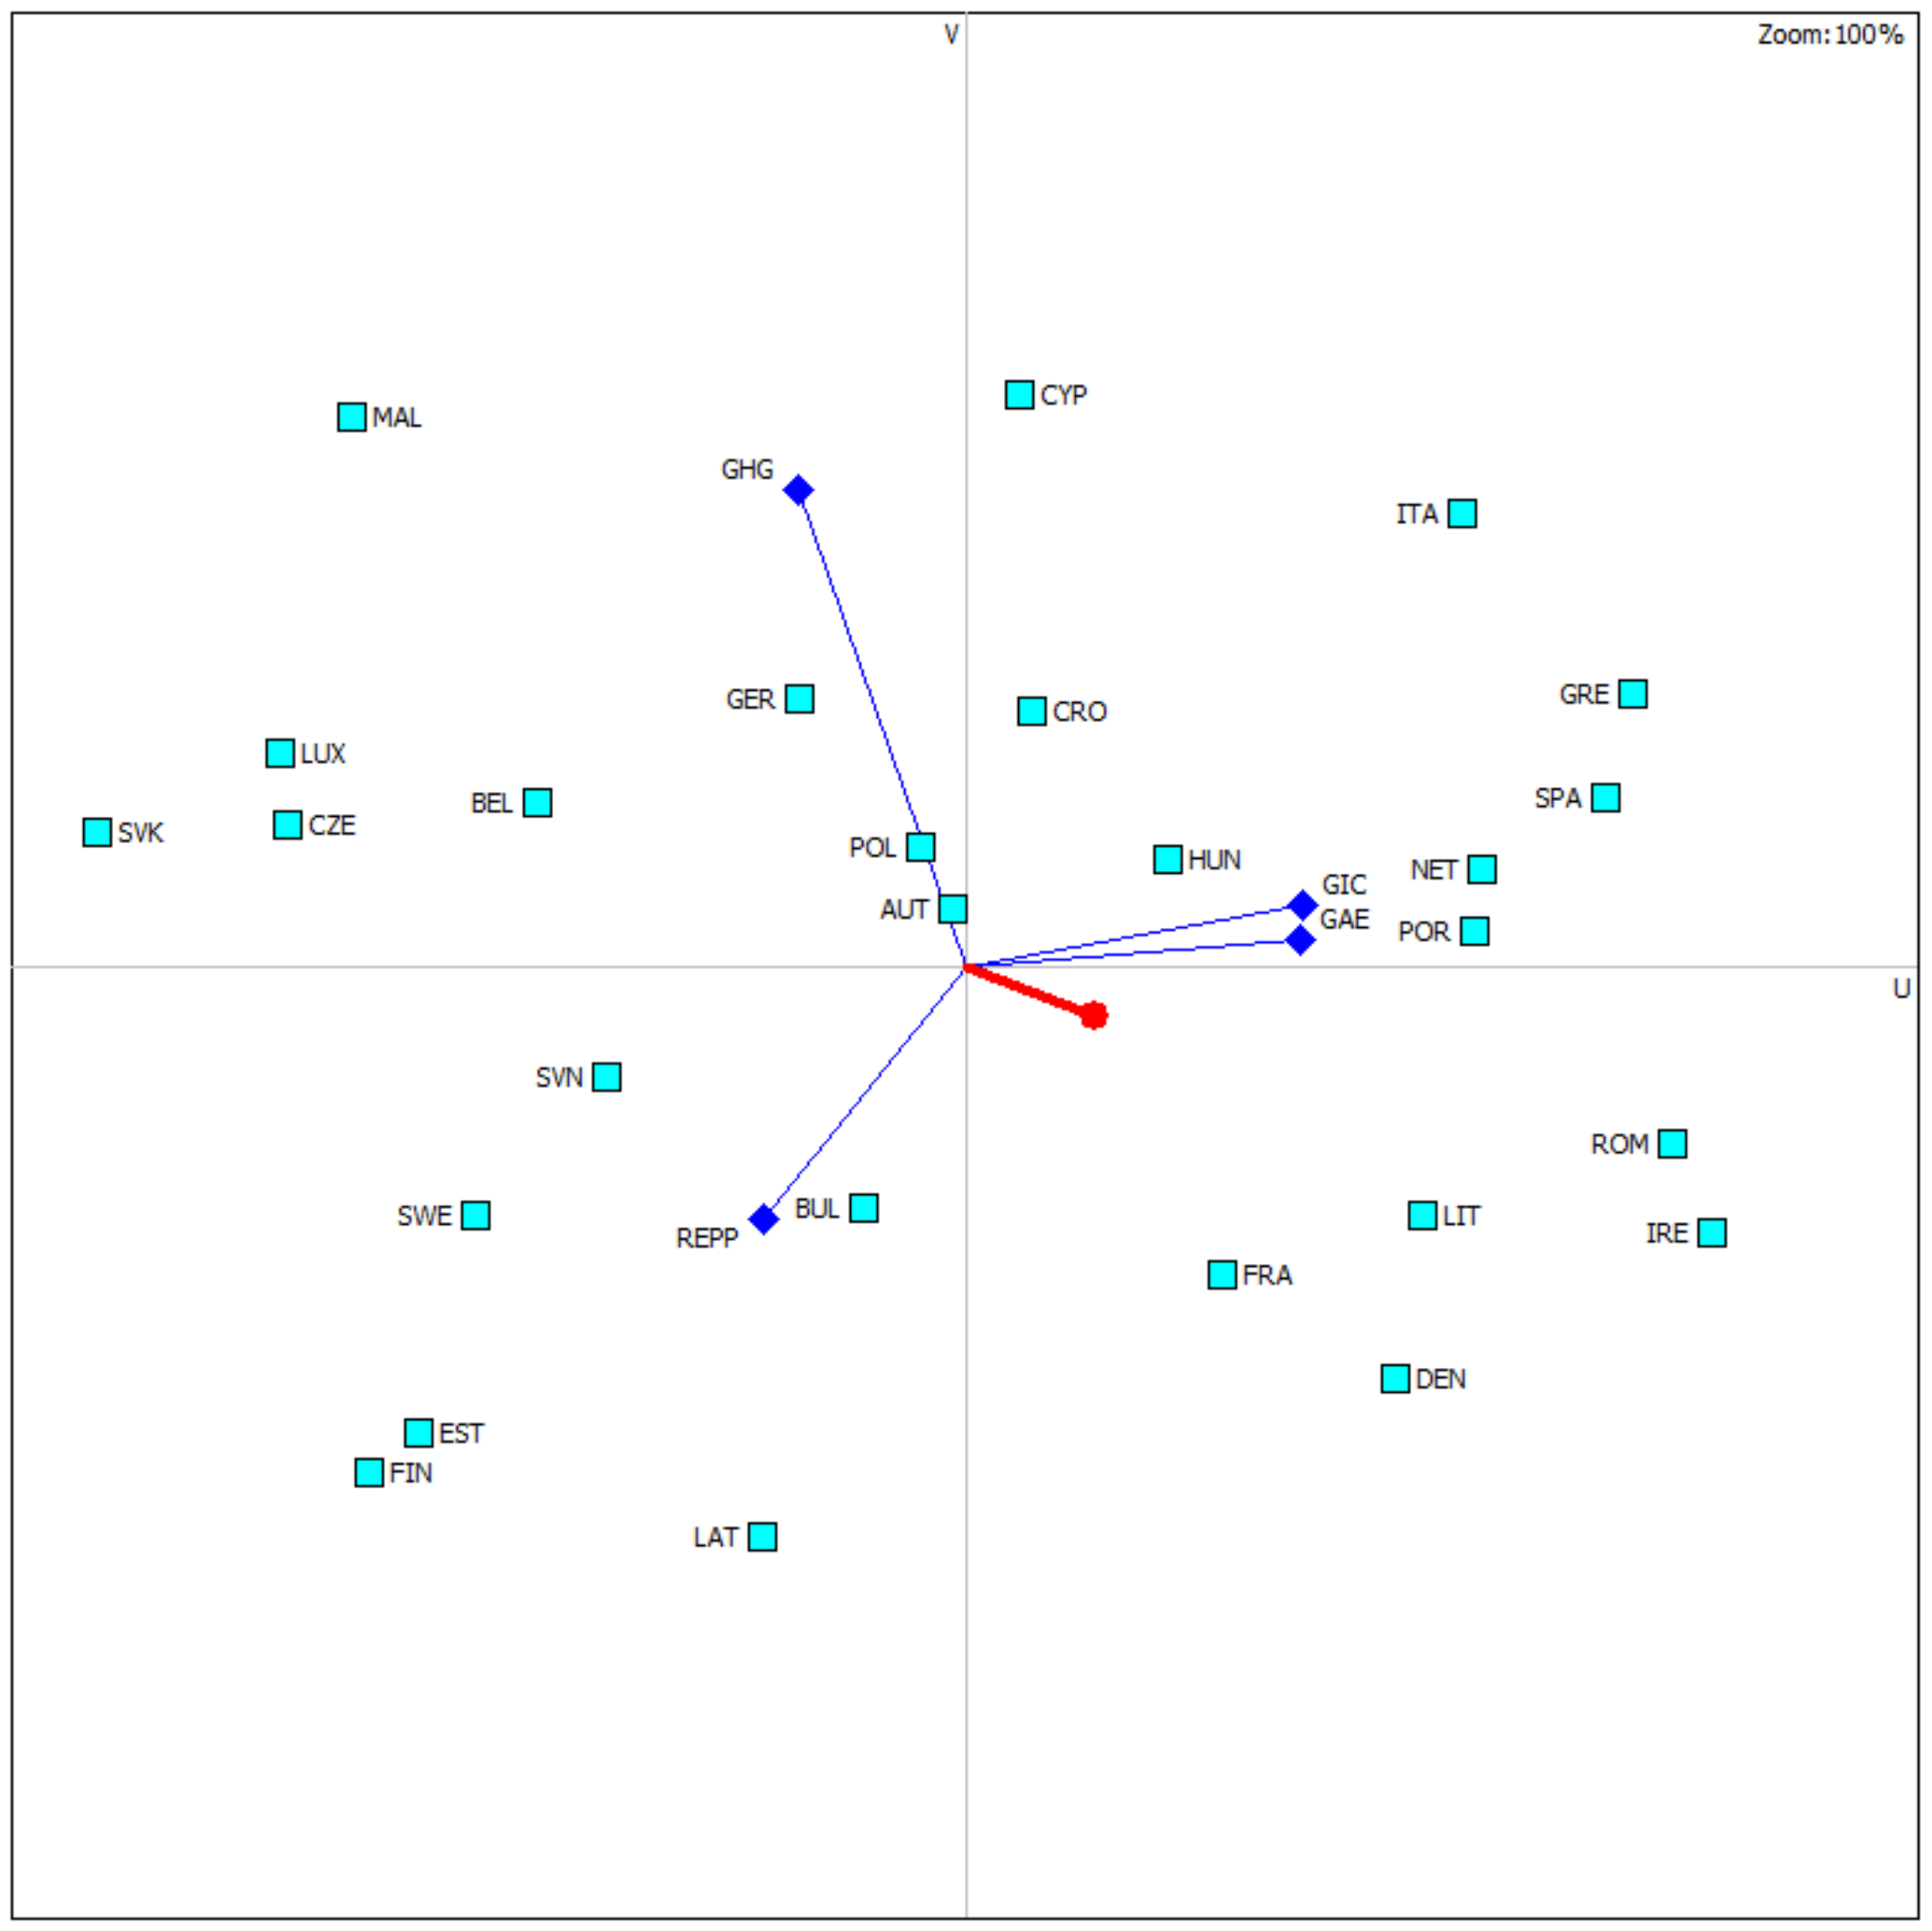
To further interpret the results and understand the relationships between countries and criteria, a GAIA analysis was applied as an integral part of the PROMETHEE methodology. The GAIA plane is a graphical projection of the multidimensional space of criteria onto a two-dimensional plane (F1 and F2), allowing for an intuitive understanding of the complex relationships among countries, criteria, and decision-makers. The GAIA plane in
Figure 2 illustrates the multidimensional relationships between EU Member States and the selected climate and energy agri-environmental indicators, expressed as intensity measures relative to agricultural gross value added (GVA).
The decision axis was primarily aligned with the energy intensity indicators, particularly gross inland consumption (GIC/GVA) and gross available energy (GAE/GVA), indicating that differences in energy use efficiency per unit of agricultural value added play a dominant role in shaping overall country performance. The vector representing greenhouse gas emission intensity (GHG) was oriented in the opposite direction, confirming its role as a cost-type criterion that negatively affects the composite assessment. Renewable energy primary production intensity (REPP/GVA) showed a distinct but weaker alignment with the decision axis, suggesting a heterogeneous contribution across Member States and reinforcing the presence of structural differences in renewable energy deployment within agriculture. Countries positioned in the positive quadrant of the GAIA plane (such as Romania, Italy, Greece, Spain and Poland) exhibited favourable combinations of lower emission intensity and more efficient energy use relative to agricultural output. In contrast, countries located in the opposite direction (including Malta, Luxembourg, and Sweden) were characterised by unfavourable energy and emission intensity profiles, reflecting structural constraints related to scale, energy systems and sectoral composition.
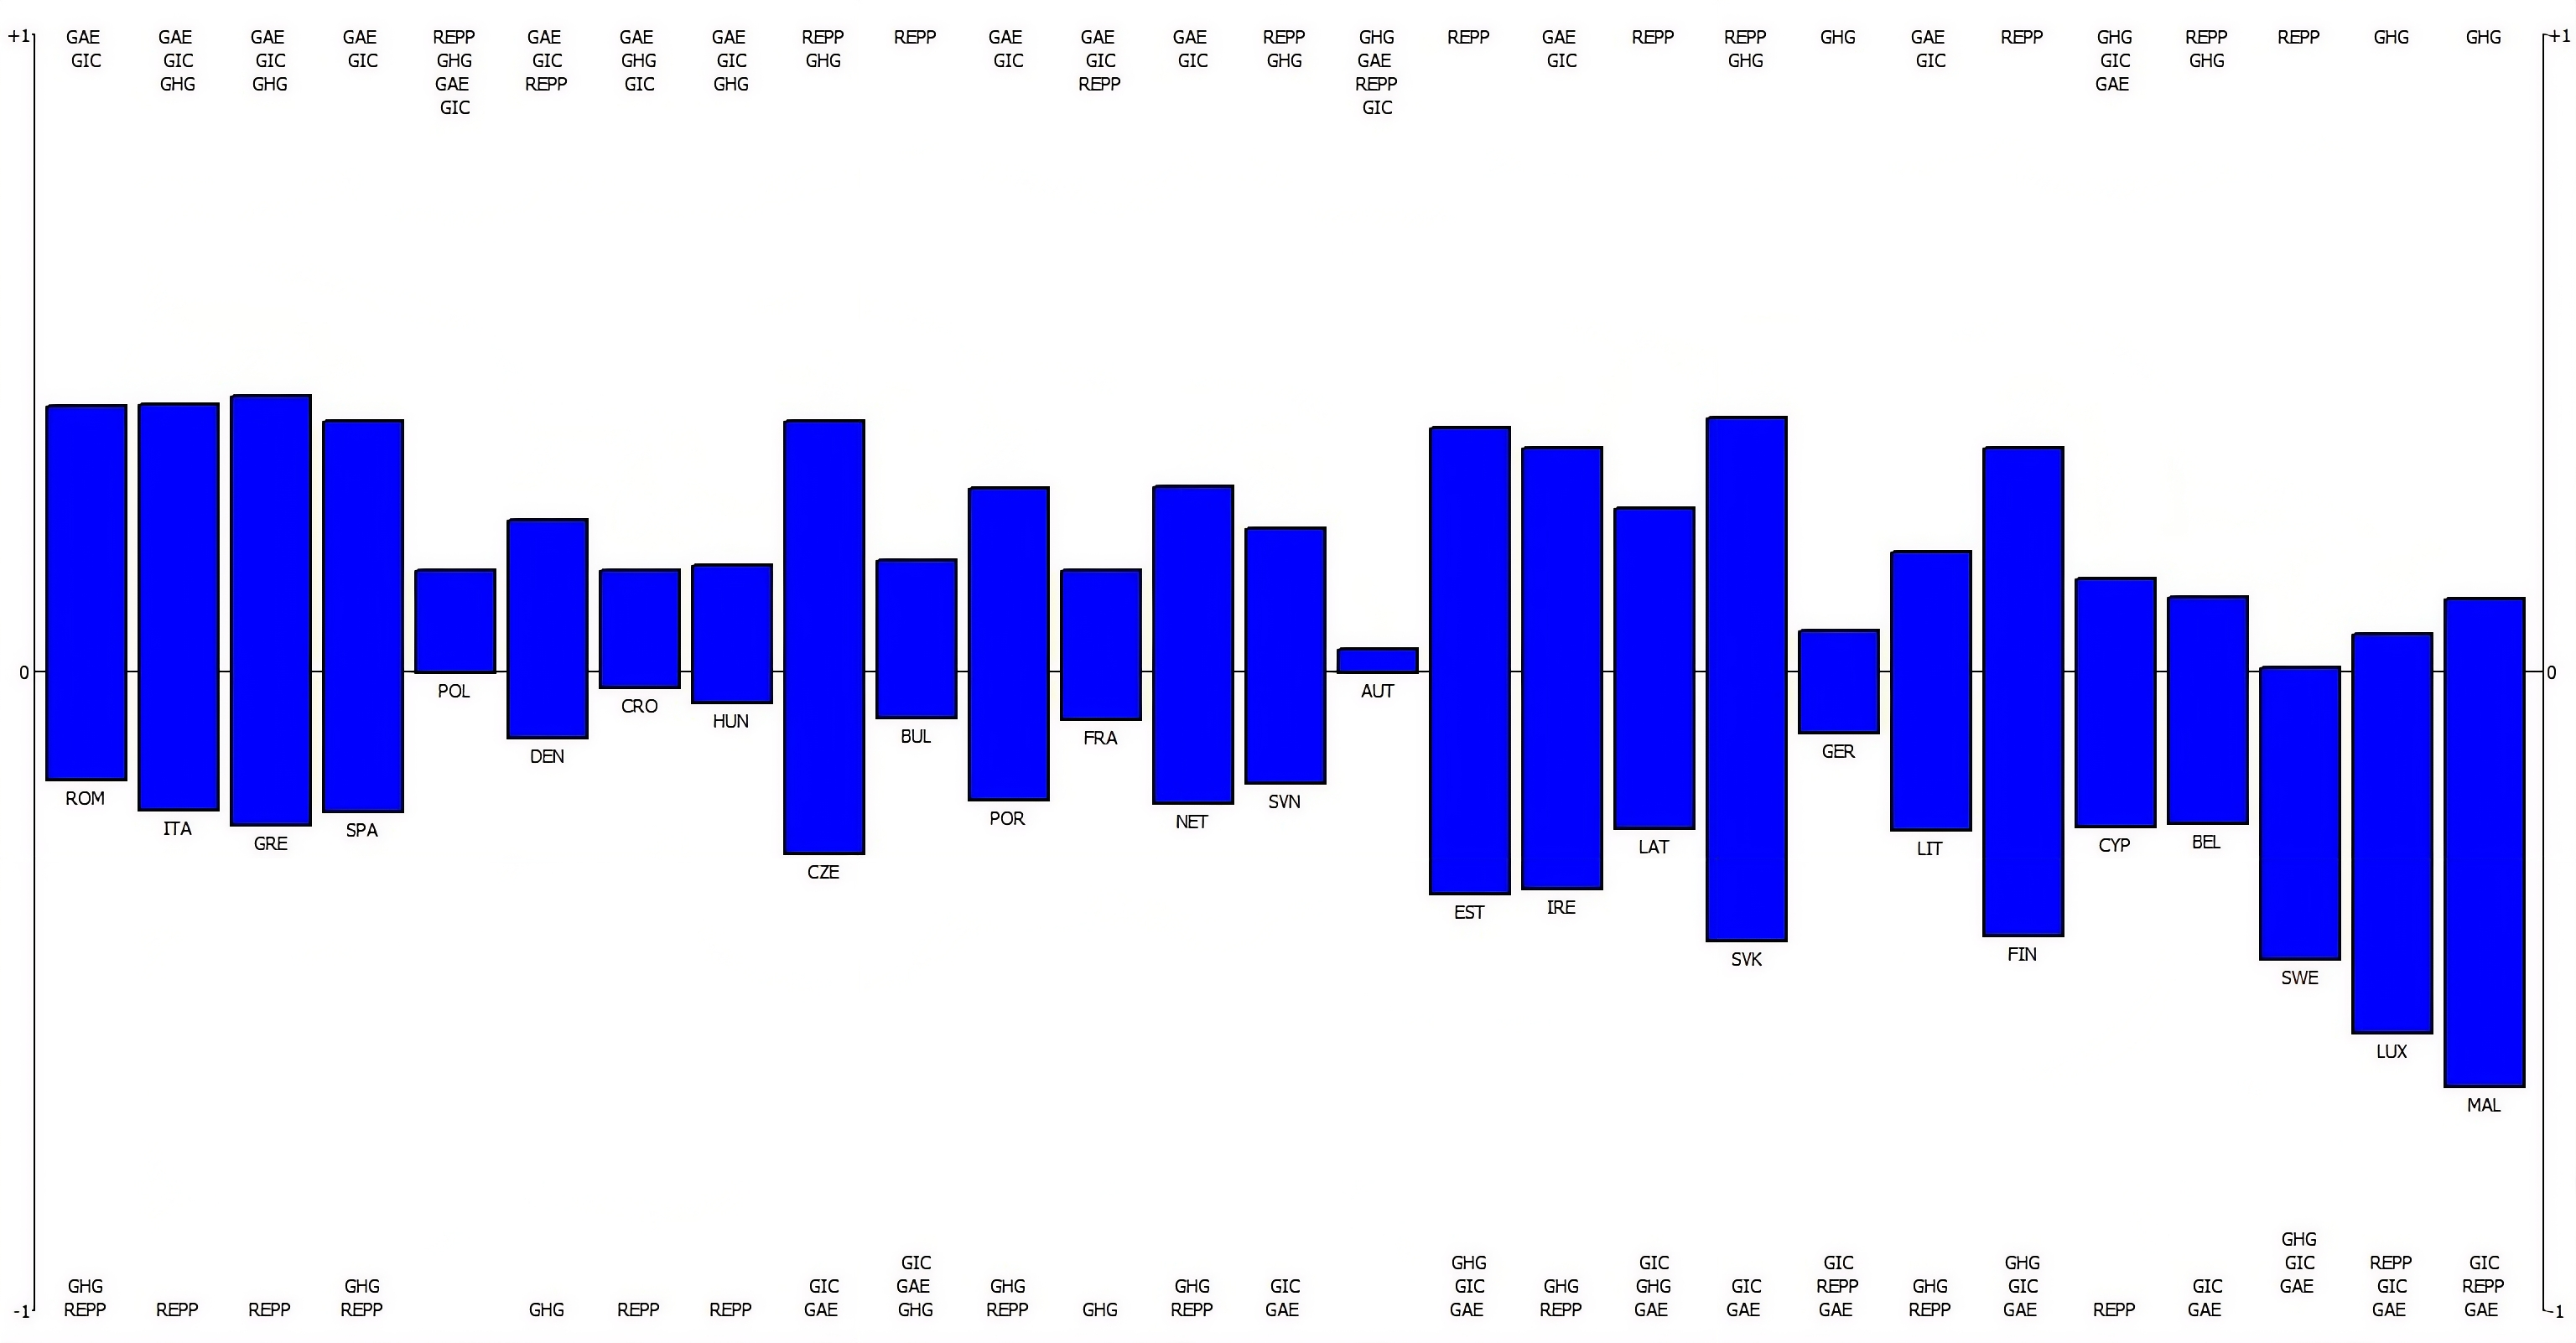
To further interpret the structure of the total net preferential flows (Φ), the PROMETHEE Rainbow diagram was employed (
Figure 3). The diagram revealed that leading countries achieved positive net flows primarily due to favourable contributions from energy efficiency-related indicators (GAE/GVA and GIC/GVA), rather than from exceptionally high renewable energy production intensity alone. In line with previous studies, these results confirm that energy efficiency relative to agricultural value added is a crucial driver of improved agri-environmental performance [
69].
Low-performing countries exhibited dominant negative contributions driven mainly by high greenhouse gas emission intensity (GHG), combined with weak or insufficient compensating effects from renewable energy production intensity (REPP/GVA). This pattern was particularly evident for Malta, Luxembourg, and Sweden, where structural limitations and scale effects significantly constrain agri-energy performance [
21].
The observed convergence patterns differed substantially across indicators. While greenhouse gas emission intensity showed signs of partial convergence among EU Member States, energy related intensity indicators remained heterogeneous. This suggests that although climate policy objectives are increasingly aligned at the EU level, national differences in energy systems, agricultural structures and investment capacity continue to shape divergent trajectories in energy use efficiency. This suggests that national structural factors, such as farm size distribution, energy infrastructure, and access to investment capital, heavily influence technological adoption and policy efforts for circular energy use in agriculture [
70]. Recent research supports this view, highlighting that convergence in agri-environmental performance is often driven by regulatory alignment [
71]. At the same time, divergence persists in areas where investments and innovation capacities differ significantly among countries [
72].
The PROMETHEE ranking clearly differentiated leading, moderate, and low-performing countries based on the composite climate and energy agri-environmental assessment. In 2023, Romania, Italy, Greece, Spain, and Poland occupied the top positions, reflecting favourable combinations of relatively low greenhouse gas emission intensity and more efficient energy use per unit of agricultural value added. Their performance was not driven by a single indicator, but rather by a balanced profile across climate and energy dimensions. Conversely, structurally constrained economies such as Malta, Luxembourg and Sweden consistently ranked at the bottom, primarily due to high emission intensity and unfavourable energy efficiency profiles. These results suggest that absolute agri-environmental performance is closely linked to national energy systems and the scale and structure of agricultural production, rather than solely to sector-specific policy measures [
71].
A distinct group of countries, including Romania, Italy, Greece, Spain and Poland, recorded positive net preference flows across the observed climate and energy agri-environmental indicators in 2023. Their results indicate relatively favourable energy efficiency and emission intensity profiles when indicators are expressed relative to agricultural value added. Germany, Belgium and the Czech Republic, despite strong absolute energy systems, recorded lower net preference flows once indicators were normalised by GVA. These findings support existing research indicating that absolute performance on agri-environmental indicators is more closely linked to national energy systems and the size of agricultural sectors than to specific agrarian policies. In this framework, convergence does not mean that all countries improve equally, but rather a trend towards less variation, driven by common policy goals.
Romania stood out as a leading country due to the dominance of the GIC and GAE energy indicators. The literature confirms Romania’s high potential for wind energy utilisation, particularly in rural areas, while EU funding programs have supported the installation of photovoltaic systems on farms, improving energy efficiency and reducing dependence on fossil fuels [
73]. These findings highlight Romania’s significant contribution to the energy transition, whereas similar practices in Poland and Slovakia have focused on the development of biogas infrastructure.
In the climate dimension, Poland recorded positive net preference flows in 2023, despite a cumulative increase in agricultural CO
2 emissions from 8.2% (2017) to 9.8% (2023). This increase remains lower than in many other EU Member States, indicating a relatively favourable emission intensity trajectory. From the energy perspective, Poland’s positive performance is associated with the strategic framework defined by the “Energy Policy of Poland until 2040”, which promotes gradual decarbonisation through the expansion of renewable and nuclear energy. The share of renewable energy in the electricity mix reached 20.6%, supporting Poland’s improved position despite continued dependence on energy imports [
74]. These findings are consistent with previous evidence of Poland’s upward movement in agri-environmental performance rankings [
75].
Although Italy ranked second overall, it showed a weaker net flow only for the REPP indicator. This outcome can be explained in light of Italy’s long-term climate strategy, which defines clear pathways toward climate neutrality by 2050. Italy accounted for 12.5% of the EU’s net greenhouse gas emissions and achieved a substantial net emissions reduction of 34.8% between 2005 and 2023, exceeding the EU average reduction of 30.5% over the same period. The country successfully met its 2020 EU targets related to greenhouse gas emissions, the share of renewable energy, and energy consumption. Moreover, renewable energy sources accounted for 19.5% of final energy consumption in 2023. Due to the rapid expansion of renewable energy capacity between 2010 and 2013, Italy reached its 2020 renewable energy target six years ahead of schedule [
76].
Greece ranked third, primarily due to its strong performance in greenhouse gas emissions reduction and the increasing role of renewable energy in its energy mix. In 2023, Greece accounted for 2.3% of the EU’s net GHG emissions and achieved a substantial net emissions reduction of 48.5% between 2005 and 2023, significantly exceeding the EU average reduction of 30.5% over the same period. Renewable energy sources, mainly wind and solar, represented 10% of total energy supply in 2023 and accounted for 24% of final energy consumption. Greece’s energy transition strategy relies on the further expansion of renewable energy in combination with energy storage technologies, as well as on biogas and liquid biofuels to address hard-to-electrify sectors, which supports its high overall ranking [
77].
There is no doubt that European agriculture plays a central role in addressing energy, climate, and environmental challenges [
78]. In this context, the general conclusion is that Spânu et al. are right to emphasise that agro-environmental indicators (AEIs) must be developed within a transdisciplinary framework that integrates agricultural and environmental dimensions to provide the most effective and sustainable solutions to the current challenges facing the agricultural system [
79]. Moreover, we also agree with Kelemen et al., who highlight that one of the most important challenges for the future functioning and implementation of the Common Agricultural Policy is the limited budget available under its second pillar [
80].
A key methodological contribution of this study is the implementation of entropy based weights. Unlike approaches that assign equal weights or rely on expert judgment, entropy weighting captures each indicator’s actual information content. The elevated weights for renewable energy indicators emphasise their increasing role in distinguishing agri-environmental performance among EU nations. This aligns with recent studies that identify renewable energy adoption as a crucial factor in advancing sustainable agricultural practices and enhancing policy outcomes [
81].
Overall, the results show that the EU is moving closer to harmonising climate and energy standards in agriculture. However, targeted and tailored policy measures remain crucial. Specifically, increased support for circular energy solutions and technology transfer in less advanced countries is vital to turn this convergence into truly sustainable and inclusive agricultural progress.
5. Conclusions and Policy Recommendations
This study contributes to the scientific literature by demonstrating that integrating entropy-based weighting into the PROMETHEE–GAIA method provides a framework for assessing EU-level agri-environmental performance within the Climate & Energy dimension. The results point to selective, indicator-specific alignment trends rather than uniform long-term convergence while simultaneously revealing persistent structural disparities among EU member states. From a methodological perspective, the proposed approach enhances objectivity in sustainability assessment and provides a reproducible, flexible analytical framework for future comparative research on agri-environmental and energy transitions.
The main contribution of this research lies in offering a comparative, methodologically transparent assessment of Climate & Energy performance in EU agriculture by integrating entropy-based weighting with the PROMETHEE–GAIA framework, thereby bridging quantitative rigour with interpretability in agri-environmental analysis.
This study highlights key findings:
- -
First, the agri-environmental performance of EU Member States shows selective and indicator-specific convergence, with a significant reduction in dispersion observed for greenhouse gas emission intensity, indicating a relative equalisation of climate pressure in agriculture.
- -
Second, energy-related indicators remain highly structurally heterogeneous, with only weak signs of convergence, pointing to persistent differences in energy mix, energy efficiency, and infrastructure across Member States.
- -
Third, leading countries consistently combine lower emission intensity with more efficient energy use and a balanced renewable energy profile, while lagging countries generally face structural and scale constraints that limit their capacity to improve agri-environmental performance.
The PROMETHEE results clearly indicate that Romania, Italy, Greece, Spain and Poland occupied the top positions in 2023, reflecting favourable combinations of relatively low greenhouse gas emission intensity and efficient energy use per unit of agricultural gross value added. Their performance was not driven by a single indicator, but rather by a balanced profile across climate and energy dimensions. In contrast, countries such as Germany and France, despite strong absolute energy systems and high levels of renewable energy production, recorded lower net preference flows once indicators were normalised by agricultural value added. This confirms that strong absolute climate and energy performance at the national level does not necessarily translate into superior relative efficiency within the agricultural sector once output adjusted indicators are applied. Low-performing countries, including Malta, Cyprus and Luxembourg, consistently ranked at the bottom of the distribution, primarily due to high energy and emission intensities relative to agricultural output, structural limitations related to scale, and limited diversification of renewable and recovered energy sources.
These findings suggest that EU Climate & Energy policies, including CAP eco-schemes and renewable energy support mechanisms, should adopt a more differentiated design that accounts for country-specific structural conditions, rather than relying on uniform convergence oriented targets. In this framework, convergence should not be interpreted as uniform improvement across all Member States, but rather as a gradual reduction in performance dispersion driven by common policy objectives, while national energy systems, agricultural structures and investment capacities continue to shape heterogeneous adjustment pathways.
This research has shown that the application of objective weights derived from entropy, in combination with the PROMETHEE–GAIA method, is a practical analytical framework for assessing sustainability. However, there are some limitations. The analysis was based on data from only two time points (2017 and 2023), which did not allow for monitoring dynamics over a more extended period. It may also be interesting for future research to exclude Malta due to a large data gap—an economy that is not focused on agriculture. On the other hand, Malta encounters considerable difficulties in conserving biodiversity, largely due to its limited land area and scarce natural resources [
58].
Despite its contributions, this study has several limitations that should be systematically acknowledged. First, the analysis was based on only two time points, which limits the ability to capture long-term dynamics. Second, the exclusion of additional AEIs limited a more comprehensive and multidimensional interpretation of agro-ecological indicators. Accordingly, future research should address the key limitations of this study by extending the time horizon to distinguish structural convergence from short-term crisis effects and by expanding the indicator set to include soil, water, and farm-level technological variables. Additionally, comparative analyses with non-EU countries could test whether the observed convergence patterns are specific to the EU policy context. While the results indicate progress toward a sustainable agri-energy transition, persistent regional disparities highlight the need for targeted and differentiated policy support [
82].
Overall, the results clearly address the research questions. First, notable differences persist among EU Member States in climate, energy, and agri-environmental indicators, although some convergence occurred from 2017 to 2023, especially concerning greenhouse gas emissions, highlighting the influence of EU policy frameworks. Second, the entropy-based weighting shows that renewable and circular energy indicators primarily differentiate national performance, underscoring the role of the energy transition in shaping agri-environmental outcomes. Third, the combined entropy–PROMETHEE–GAIA approach effectively assigns weights to indicators and provides transparent country rankings, with visualisations that intuitively illustrate performance patterns. These findings indicate that, despite EU regulatory harmonisation, structural differences in energy systems and agriculture continue to produce varied sustainability results across EU countries. Finally, while normalisation by agricultural gross value added enhances cross country comparability, alternative scaling variables (such as UAA-utilised agricultural area) could be explored in future research to further test the robustness of relative performance rankings.