


Abstract
The cacao tree (Theobroma cacao L.) is a crop of great economic importance to Brazil and has undergone several breeding processes that, among other things, have made it possible to obtain several self-compatible genotypes, ensuring that there is no genotypic variation in the crop, with the differences observed in the plants being caused only by the environment. For this to continue, the proper and reliable execution of scientific experiments is essential, and quantifying the material needed to carry out these experiments, i.e., the plot size, is an important step. This requires a scientific justification for choosing the plot size. In the literature, various plot sizes are adopted in experiments with seedlings. Therefore, the objective was to determine the optimal plot size for experiments with clonal cacao seedlings. The method adopted was the modified maximum curvature method using a bootstrap resampling simulation with 2000 replacements. The genotypes CCN10, CCN51, CP2204, CP2176, PS1319, and PH16 were evaluated based on 13 morphological characteristics and three quality indices used in morphological characterization studies of seedlings. The optimal plot size for experimentation with cocoa seedlings is nine plants per experimental plot.
1. Introduction
The cacao tree (Theobroma cacao L.) is a crop of great economic importance to Brazil, as the country ranks fifth in the world with 296,145 tons produced in 2023, behind only Ivory Coast, Ghana, Indonesia and Ecuador, according to the FAO [1]. Regarding domestic production, the state of Espírito Santo stands out as the third largest producer among the states, where the municipality of Linhares is the largest producer, with 8321 tons produced in 2023 [2].
This relevance is merely a reflection of Brazil’s long history with cocoa production, which dates back to the mid-1930s. Since then, the species has undergone several improvement processes, as described by Souza Junior [3], which have allowed the production of plants with high productivity, resistance to diseases and pests, and quality fruits and seeds, and have overcome the challenge of the species’ self-incompatibility, obtaining self-compatible plants. This innovation has contributed to the reorganization of the cocoa production system, as well as the expansion of its agricultural frontiers.
These innovations have made possible the existence of a considerable number of cocoa tree genotypes, which in itself represents a great variability that must be taken into account not only in the field, but also in conducting scientific experiments with clonal seedlings. Therefore, it is important that experiments that aim to work with clonal seedlings are properly planned, prioritizing high experimental precision, as well as the reliability of the results obtained.
In the planning process, according to Ribeiro et al. [4], after defining the characteristics to be studied, researchers need to quantify the material necessary to carry out an experiment, and it is essential to determine both the design to be adopted and the size of each plot. Several plot sizes are used in experiments with cocoa seedlings, such as one [5], three [6], five [7] and twelve [8], for example. This highlights the need for a scientific justification on which to base the choice of plot size. Therefore, characterizing the optimal plot size is an important tool to provide information that will assist future experiments, since if the plot size is smaller than necessary, less precise estimates will be obtained, and if plots are used in excessive sizes, more time and resources will be spent than necessary [9].
In the literature, there are different methodologies for determining the optimal plot size, most of which vary from the modified maximum curvature method developed by Meier and Lessman [10], for which several species have had their optimal plot sizes determined, such as conilon LB1 coffee (Coffea canephora Pierre ex A. Froehner) [11], millet (Pennisetum glaucum L.), Crotalaria ochroleuca and Crotalaria spectabilis [12], chickpea (Cicer arietinum L.) [13], Arabica coffee (Coffea arabica) [9], purple passion fruit (Passiflora edulis Sims f. edulis) [14], chili pepper (Capsicum chinense Jacq.) [15], and sunflower (Helianthus annuus) [16], among others. Despite the evident relevance of the subject, no studies have yet been found that have been conducted with clonal cocoa seedlings aimed at determining the optimal plot size. Therefore, in order to increase the efficiency and optimize the cost–benefit ratio of experiments conducted with clonal cocoa seedlings, studies that seek to determine the optimal plot size for the species are essential. It should be noted that studies with vegetatively propagated seedlings, forming clones, show genetic uniformity, drastically reducing random variation in experiments. This uniformity influences the ideal plot size requirements, allowing, in many cases, the adoption of smaller plots, increasing the precision of the evaluation.
Given the above, this study aimed to determine the optimal plot size for the cocoa genotypes CCN10, CCN51, CP2204, CP2176, PS1319, and PH16, using the maximum curvature method modified according to Meier and Lessman [10] and a bootstrap resampling simulation with 2000 replacements as per Celanti et al. [17], to evaluate 13 morphological characteristics and three quality indices.
2. Materials and Methods
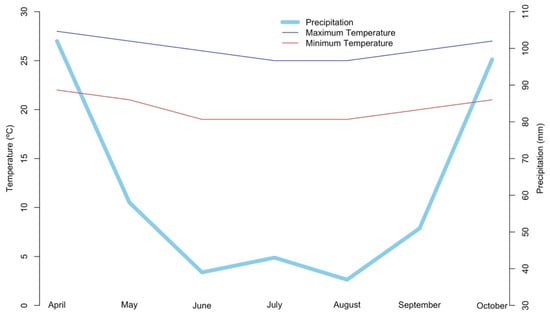
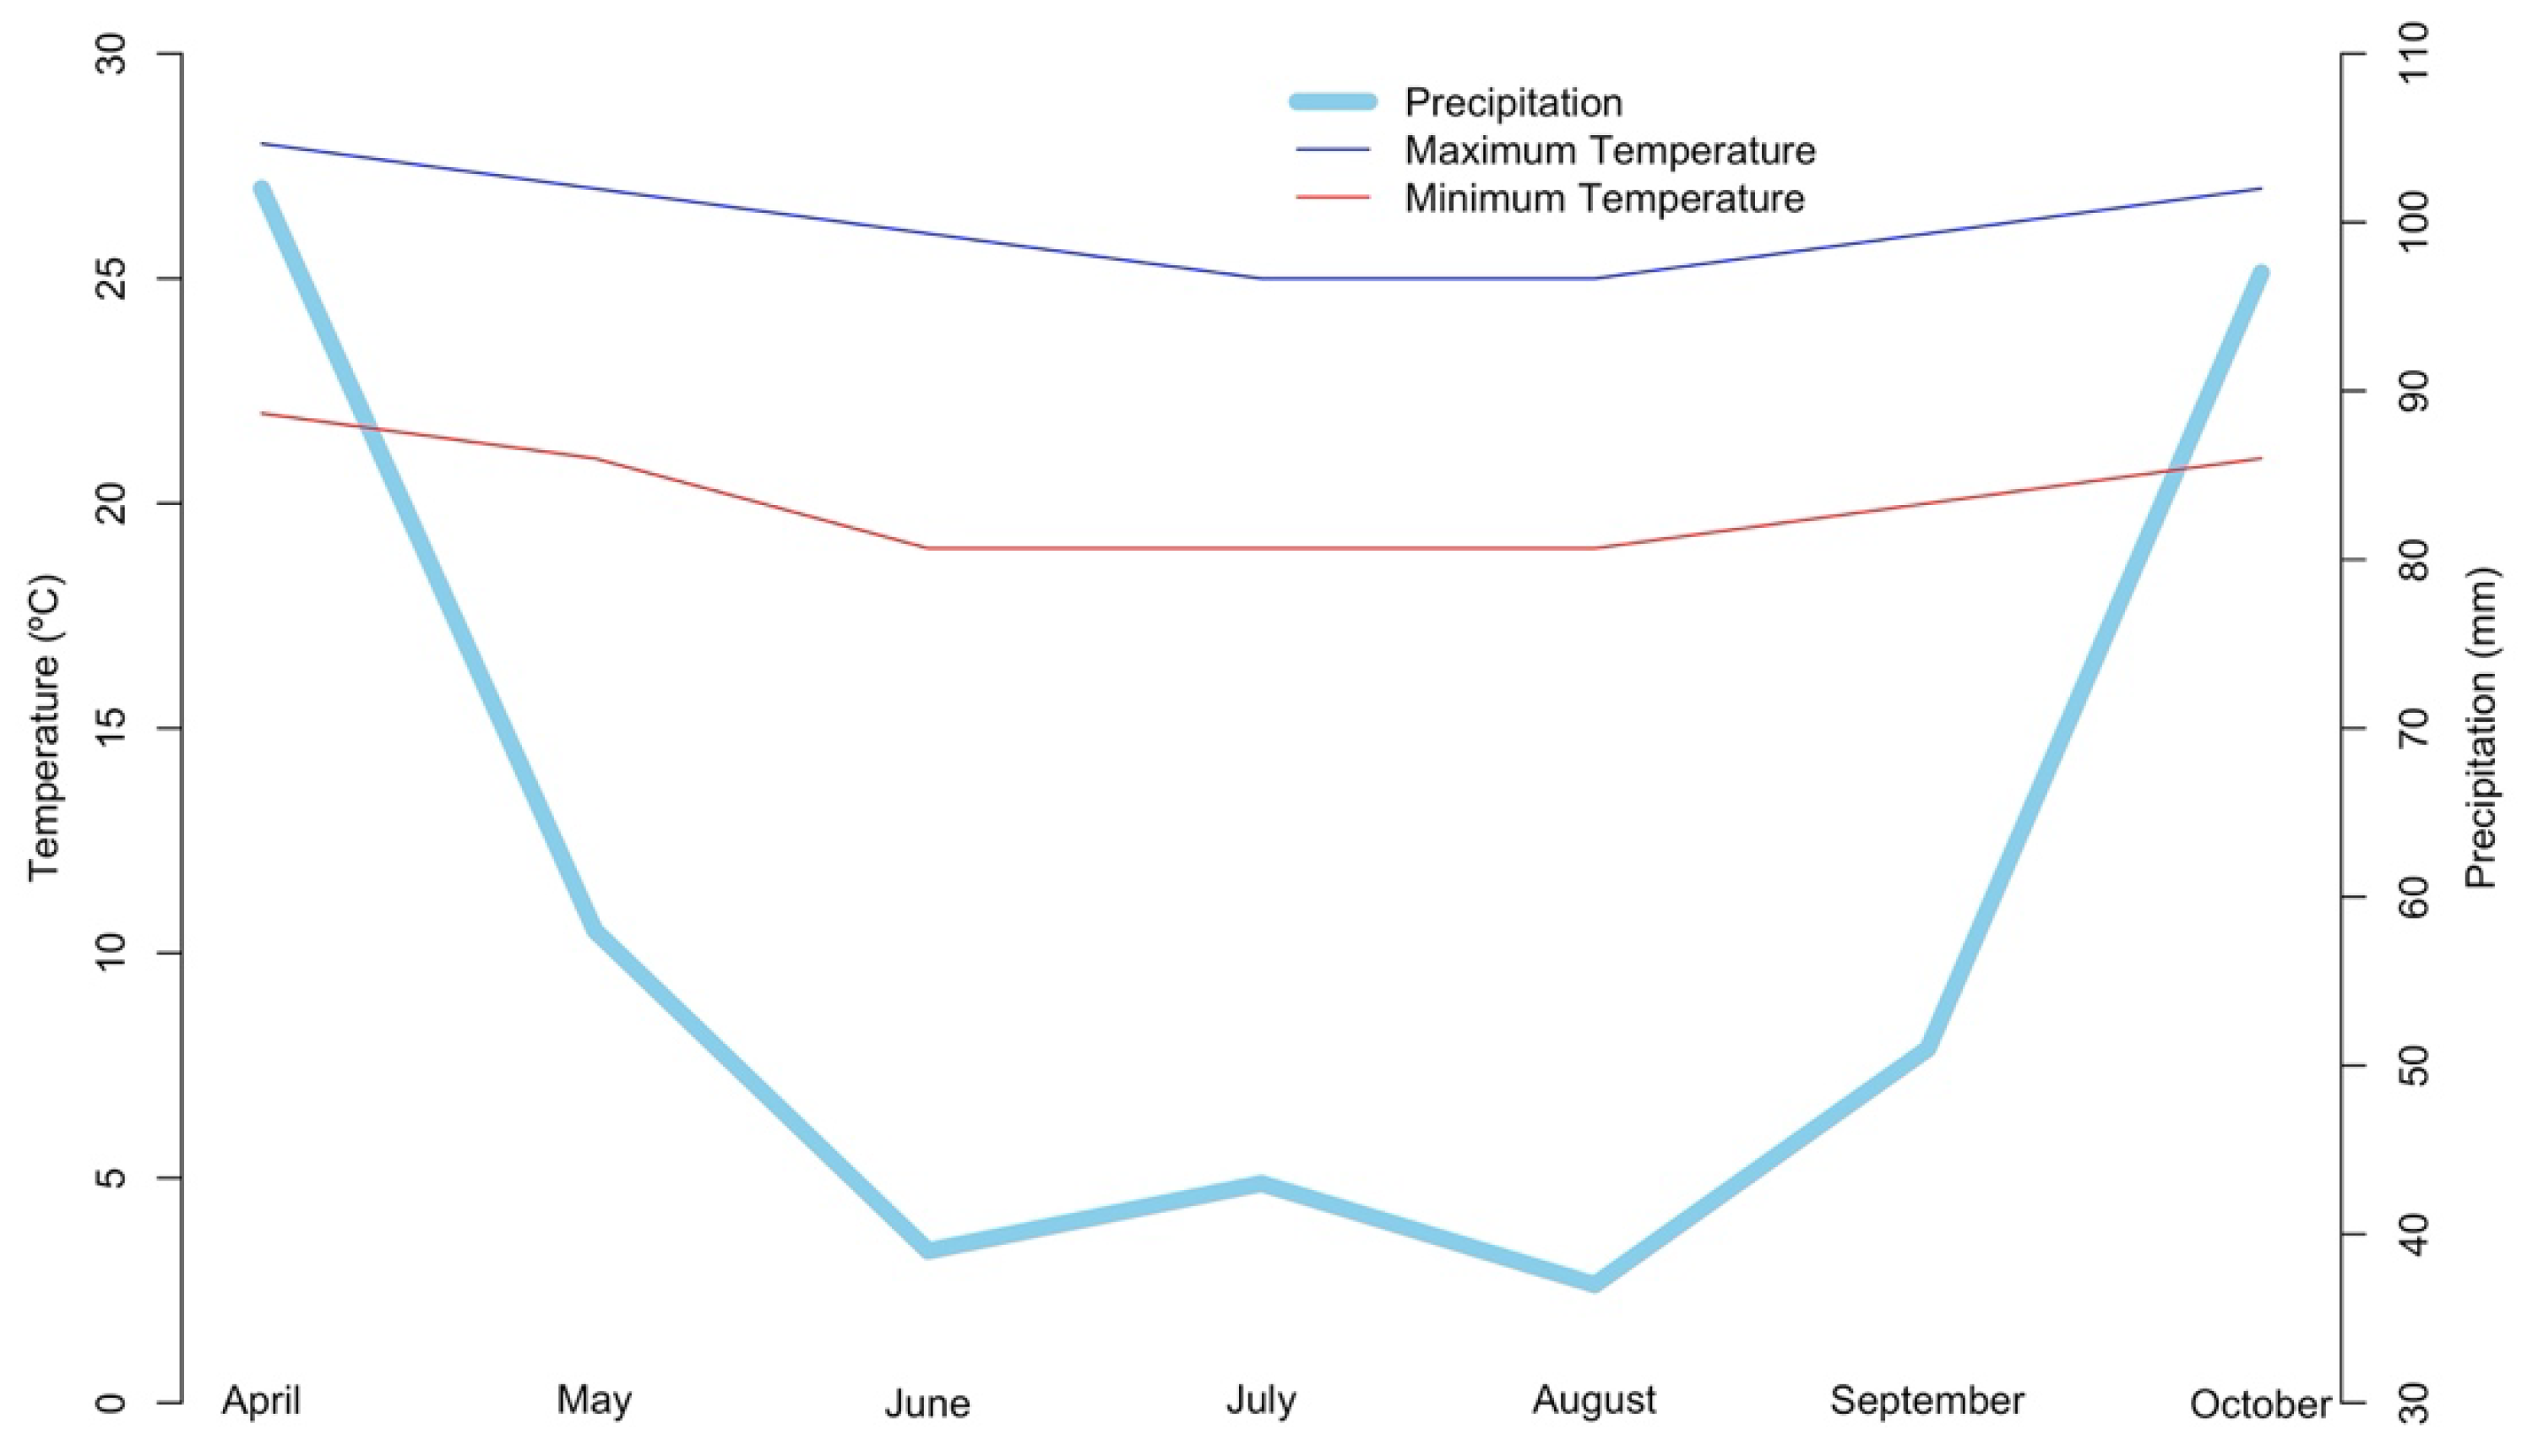
The study was conducted with clonal cacao seedlings (Theobroma cacao L.), totaling 300 plants divided into 50 seedlings for each of the six different genotypes. These plants were obtained from the Aliança nursery, located in the municipality of Linhares, in the north of the state of Espírito Santo, Brazil. The climate of the region, according to Köppen, is type Aw: hot humid tropical with rain in the summer and a dry winter [18]. The annual temperature during the experimental period ranged between 21 °C and 26 °C. The precipitation during the experimental period ranged between 37 mm and 102 mm [19] (Figure 1).
Figure 1.
Monthly variation in maximum and minimum temperatures (°C) and precipitation (mm) from April to October, in the experimental area, in the municipality of Linhares, northern Espírito Santo state.
The seedlings used are of the genotypes recommended by CEPLAC (Executive Commission of the Cacao Farming Plan) [20]: CCN10, CCN51, CP2204, CP2176, PS1319 and PH16. All these genotypes exhibit resistance to witches’ broom (Moniliophthora perniciosa), one of the main diseases affecting the crop, in addition to having high productivity and being self-compatible plants, which, according to Souza Junior [3], means that there will be no genotypic variation in the crop, only environmental variation. This highlights the importance of evaluating each clone separately. As rootstock, the TSH1188 genotype, obtained via seed propagation, was used.
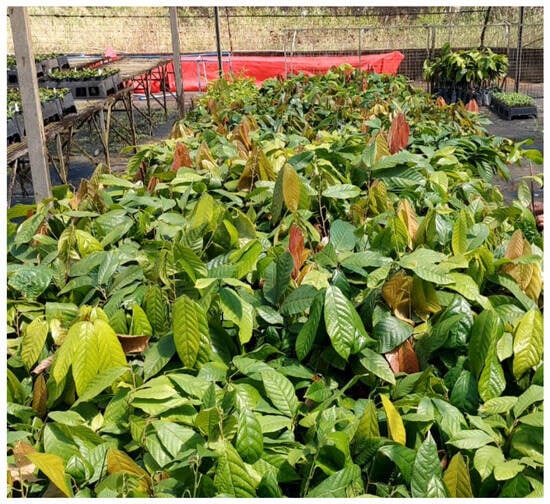
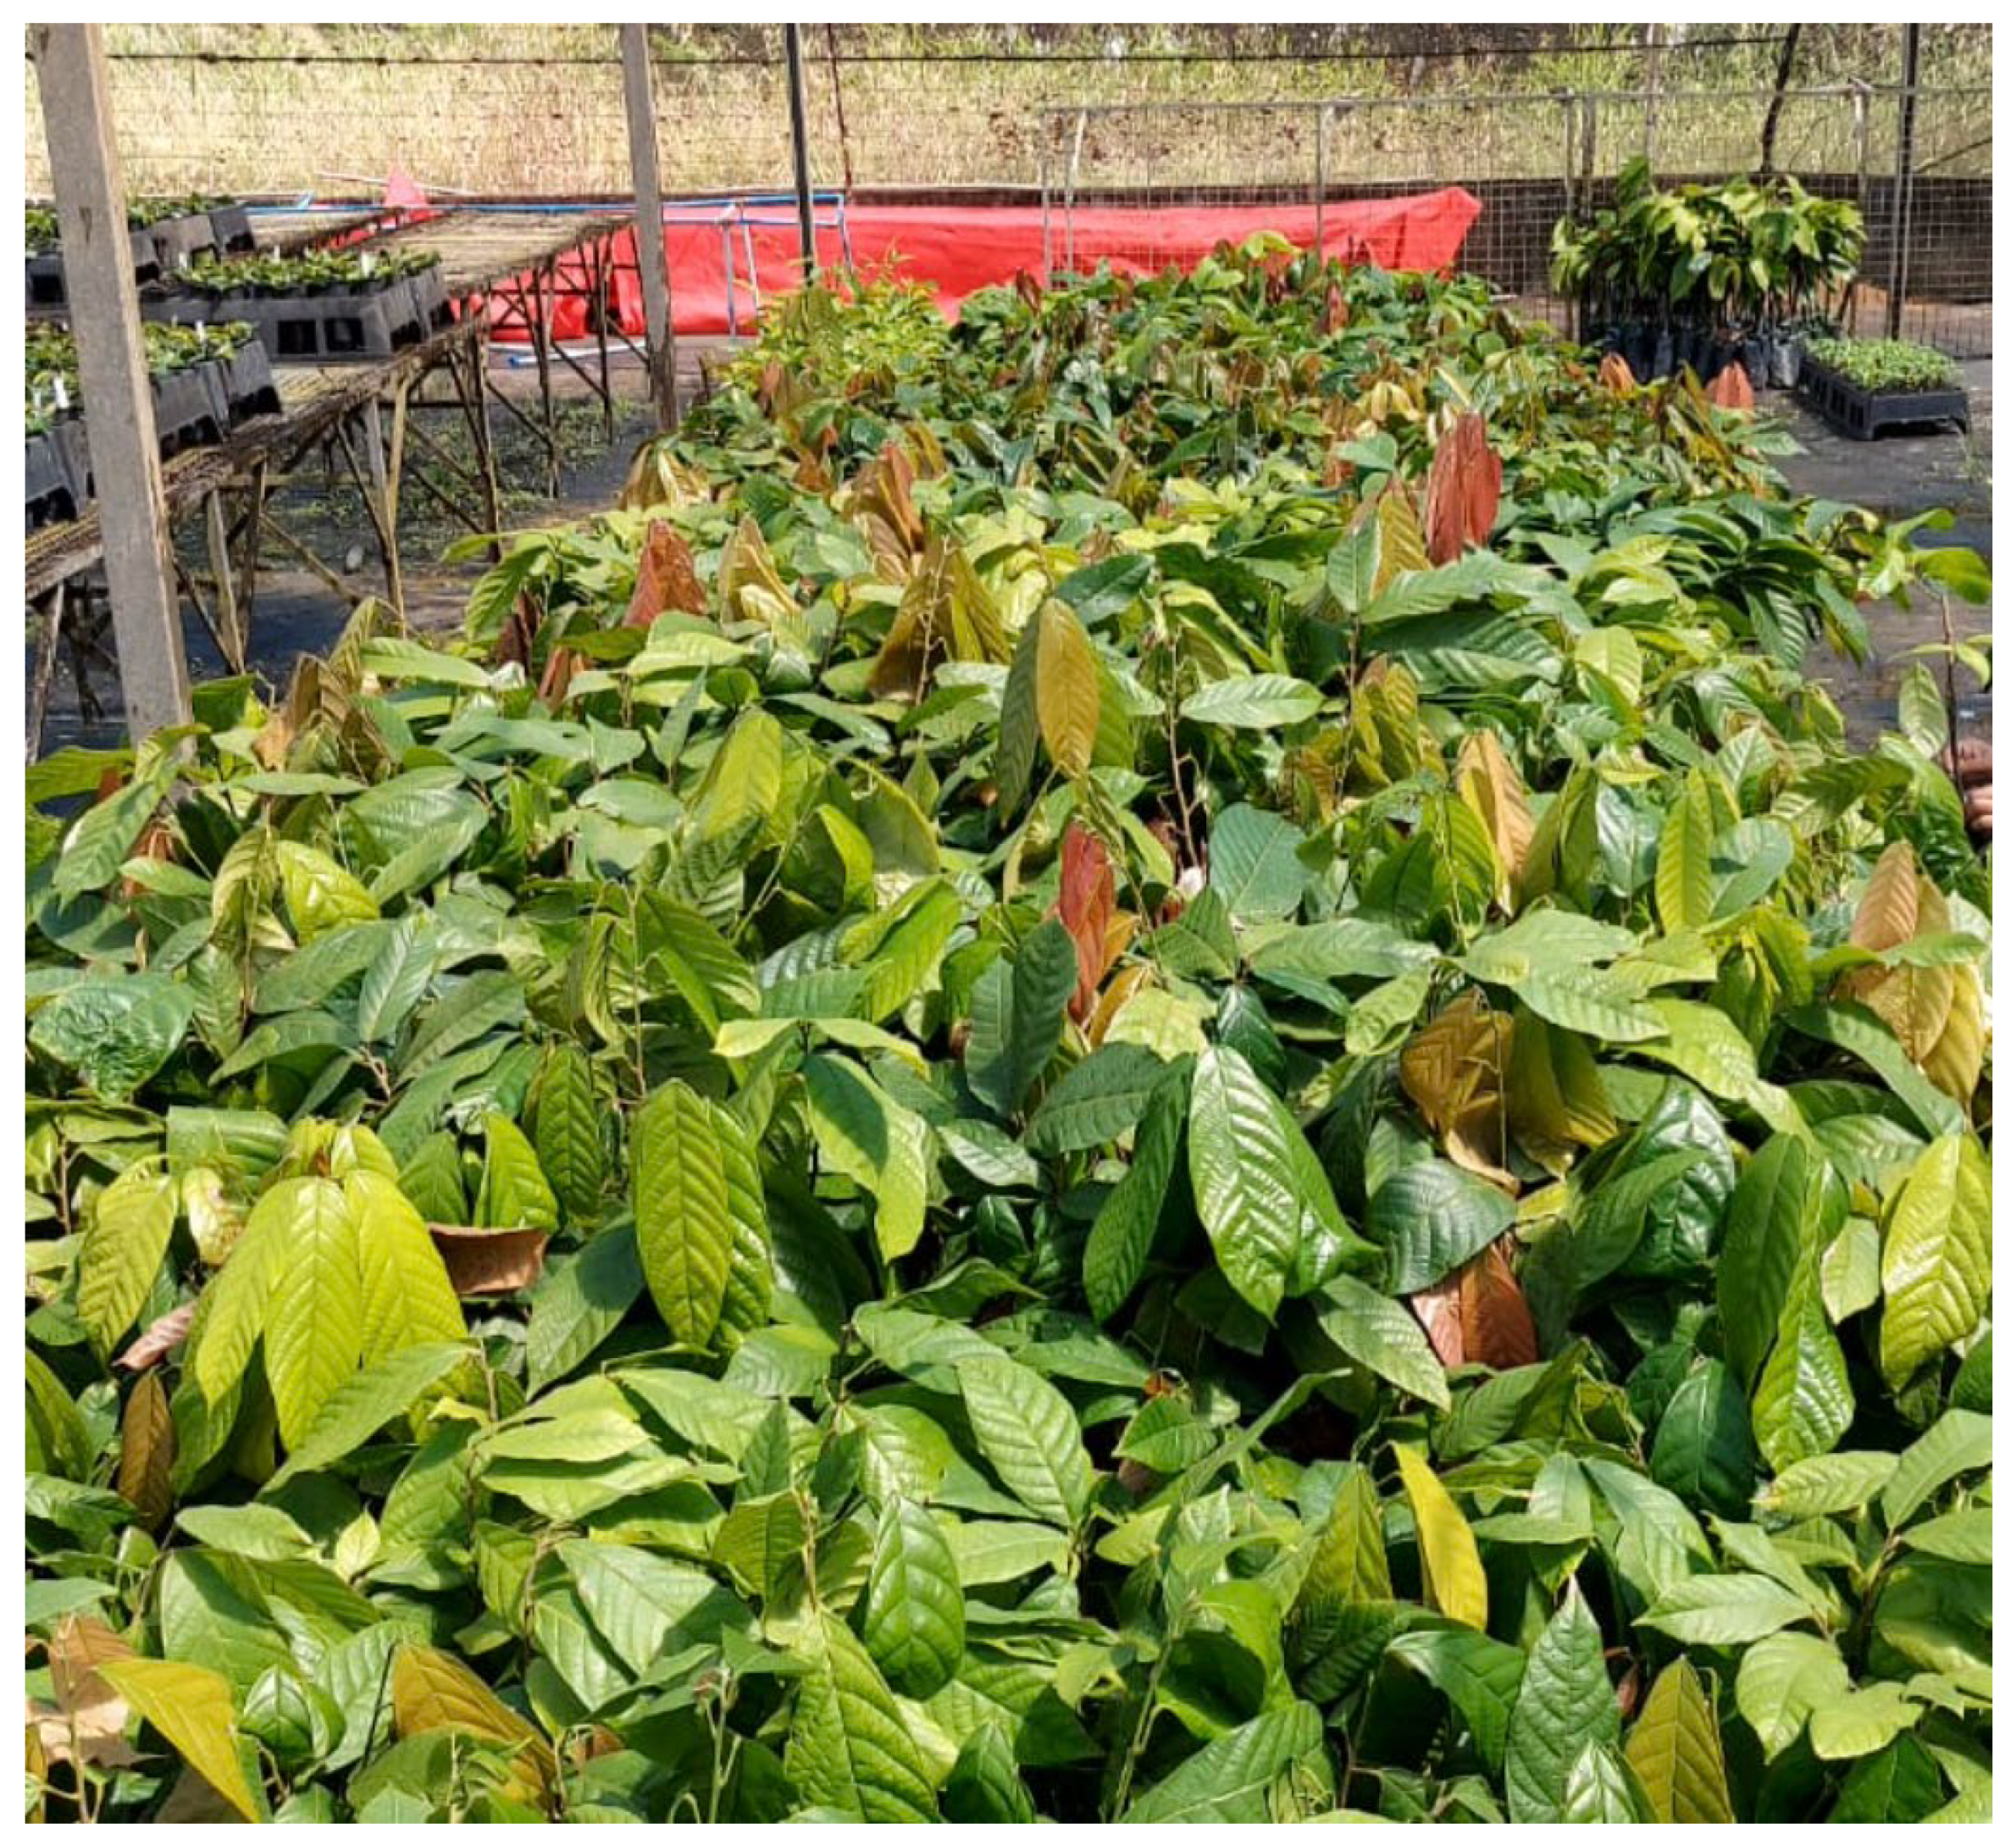
For seedling production, the seeds were previously selected and moistened to initiate embryo development, and subsequently sown in polyethylene bags measuring 15 × 20 cm containing 1000 to 1200 g of bioplant® substrate (Bioplant Misturadora Agrícola, Minas Gerais, Brazil). Between the 3rd and 4th month, when the seedlings reached a height of 20 cm and a diameter of 0.8 to 1.0 cm, they were grafted with the desired genetic material. Irrigation was carried out using an automated system activated every 20 min for one minute, ensuring adequate water supply to the seedlings throughout the experimental period. After 6 to 7 months of age, the plants were subjected to experimental evaluations (Figure 2).
Figure 2.
General view of the experiment with cocoa seedlings to determine the optimal plot size.
The seedlings were evaluated at the Linhares Experimental Farm of the Capixaba Institute for Research, Technical Assistance and Rural Extension, also located in the municipality of Linhares. The evaluations carried out aimed at the morphological characterization of the seedlings, therefore the following characteristics were evaluated: stem length (SL), using a ruler graduated in centimeters (cm) and measuring from the base of the stem to the apex of the plant; stem diameter (SD), using a precision digital caliper in millimeters (mm) and measuring in the stem region; root length (RL), using a ruler graduated in centimeters (cm) and measuring from the base to the apex of the main root; number of roots (NR) through counting; root volume (RV) by placing the roots in a graduated cylinder (mL), containing a known volume of water and measuring the displaced volume; number of leaves (NL) by counting the leaves of each plant; leaf area (LA) measured using the SCANER AREA METER LI-3100C (LI-COR Biosciences, Lincoln, NE, USA) in square centimeters (cm2); and the relative chlorophyll content, estimated using the SPAD portable meter (model 502, Konica Minolta®, Tokyo, Japan). The evaluations were performed on fully expanded leaves from the measured third of the seedlings.
The dry matter accumulation of the seedlings was also determined. Each plant organ was properly fractionated and dried in a forced-air oven at 65 °C until constant weight. Subsequently, the fractionated organs were weighed on a precision analytical balance in grams (g), obtaining the leaf dry matter (LDM), stem dry matter (STDM), root dry matter (RDM), shoot dry matter (SDM) by adding LDM and STDM, and total dry matter (TDM) by summing SDM and RDM. From this, some indices were calculated: Dickson Seedling Quality Index (DQI) according to Equation (1) [21]; the Specific Leaf Area Index (SLA), given by the division between LA and LDM [22]; and the Robustness Index calculated from the ratio between SL and SD [23].
Before determining the optimal plot size, a descriptive statistical analysis was performed on each of the sixteen characteristics for the 50 clonal seedlings of each of the six cocoa genotypes: mean (); median (Md), minimum value (min); maximum value (max); standard deviation (s); coefficient of variation (CV).
The determination of the optimal plot size was made for each of the sixteen variables using the modified maximum curvature methodology, according to Meier and Lessman [10], using a bootstrap resampling simulation with data from 50 individual seedlings and 2000 replacements, according to Celanti et al. [17]. This configuration meets the guidelines of Chernick and LaBudde [24], who indicate that, for bootstrap simulations, an initial sample size of at least n = 20 and at least 2000 resamplings should be used.
The analysis of the data for each variable for each projected plot size (Xi) generates coefficient of variation (CVi) values. The relationship between the CVi values and the respective Xi allows the generation of the power model equation as shown in Equation (2), where the values of and are estimated using the logarithmic transformation of the power function.
Meier and Lessman [10] estimated the optimum plot size for maximum curvature (X0) as per Equation (3).
The optimal plot size was graphically represented along with the relationship between the coefficient of variation values and the plot sizes.
To verify the correlation between contiguous plots, the heterogeneity index (b) was determined according to Smith [25], given by Equation (4), as per Lorentz et al. [26], where values of b closer to zero indicate high correlation and values closer to one indicate low correlation.
Based on the estimates and obtained from Equation (2), and taking into account the optimal plot size () found by Equation (3), the coefficient of variation corresponding to the optimal plot size () was estimated according to Equation (5) for each of the sixteen characteristics in the clonal seedlings of the six cocoa varieties.
Considering that the analyses will provide different optimal plot sizes () among the sixteen variables, and that, when setting up the experiment, a single plot size will be defined, this size was used from the characteristic that presented the largest average optimal plot size ().
In order to verify the applicability of the optimal plot size, Tukey’s mean test was performed, allowing for the comparative evaluation of the six varieties (I = 6) for the sixteen variables under study in a completely randomized design with four replications (J = 4), a number necessary to satisfy the minimum number of experimental plots according to Pimentel-Gomes [27] guidelines. The least significant difference (LSD) for Tukey’s test is presented in Equation (6).
In Equation (6), q is the total studentized range, obtained at 5% probability for I treatments and I(J − 1) degrees of freedom of the residual; MSRes is the mean square value of the residual, obtained according to Equation (7), where () is the average value obtained from the () of the six varieties. These values use , found previously, for the simulated parcel size and represents the average of the six varieties for the characteristics.
As suggested by Ribeiro et al. [4], the LSD was determined for other scenarios, in this case, for situations where the number of seedlings per plot was less than the optimum size of the experiment, affecting the ability to distinguish the means.
The analyses were performed using the R programming language [28], and for the bootstrap simulation, procedures were used according to the script published by Celanti et al. [17]. Because it is a discrete random variable, the optimal final plot size was presented as an integer, rounding up to the nearest integer [4].
3. Results
Table A1 presents the descriptive statistics (maximum, minimum, mean, and median values), standard deviation, and coefficient of variation for the 16 characteristics evaluated in seedlings of the cocoa genotypes CCN10, CCN51, CP2204, CP2176, PS1319, and PH16. The values demonstrate variability among the genotypes for all characteristics, evidenced by the high coefficient of variation (CV) values in characteristics such as root length, root volume, dry mass, and Dickson Quality Index. Genotypes CP2176, CP2204, and PH16 showed higher averages for stem length and biomass and growth characteristics. Genotype CP2204 presented high values for root volume and root dry mass. Genotype PS1319 showed the lowest average values for structural variables (stem length, leaf area, and biomass), in addition to a lower Dickson Quality Index, characterizing less robust seedlings.
The estimated equations and values of the coefficient of determination (R2, in %), Smith heterogeneity index (b), optimum plot size () and the coefficient of variation for ( obtained from the relationship between the different plot sizes and their respective CV values can be seen in Table 1 and Table 2. It is noted that the X0 values obtained for characteristics related to counting (number of roots and number of leaves), weighing characteristics (leaf dry mass, stem dry mass, root dry mass, shoot dry mass and total dry mass) and leaf area showed higher values, varying approximately between five and nine. The measurement characteristics (stem length, root length and stem diameter) showed lower X0 values, varying between three and six, approximately. Regarding the calculated indices, Dickson Quality Index and Specific Leaf Area, the obtained values were higher, ranging from approximately five to nine, while the Robustness Index presented values close to four.
Table 1.
Estimated equation, coefficient of determination (R2, in %) for simulated media with noise removal, Smith heterogeneity index (b), optimum plot size () and coefficient of variation for () of stem length (SL) (cm), number of roots (NR), root length (RL) (cm), stem diameter (SD) (mm), number of leaves (NL), leaf area (LA), root volume (RV) and relative chlorophyll index (RCI) in seedlings of the cocoa genotypes CCN10, CCN51, CP2204, CP2176, PS1319 and PH16, using the Meier and Lessman methodology with bootstrap simulation.
Table 2.
Estimated equation, coefficient of determination (R2, in %), Smith heterogeneity index (b), optimum plot size () and coefficient of variation for () of leaf dry mass (LDM), stem dry mass (STDM), root dry mass (RDM), shoot dry mass (SDM), total dry mass (TDM), Dickson Quality Index (DQI), Specific Leaf Area (SLA) and Robustness Index (RI), in seedlings of the cocoa genotypes CCN10, CCN51, CP2204, CP2176, PS1319 and PH16, using the Meier and Lessman methodology with bootstrap simulation.
Table 3 presents the results of Tukey’s test for the six genotypes evaluated. The results show statistically significant differences between the genotypes for most of the variables analyzed. Genotype PH16 stood out for its greater number of leaves, higher relative chlorophyll index, and high Dickson Quality Index values, indicating physiologically more balanced seedlings. CP2204 showed higher values for root volume and root dry mass, suggesting better root system development. CP2176 and CCN10 showed greater stem lengths and higher shoot dry mass values. In contrast, PS1319 showed lower values for characteristics such as stem length, leaf area, and Dickson Quality Index, being consistently allocated to the groups with the lowest average.
Table 3.
Tukey’s test, at 5% probability, for the comparison of seedling means of the cocoa genotypes CCN10, CCN51, CP2204, CP2176, PS1319 and PH16 for the characteristics for stem length (SL) (cm), number of roots (NR), root length (RL) (cm), stem diameter (SD) (mm), number of leaves (NL), leaf area (LA) (cm2), root volume (RV) (mL), relative chlorophyll index (RCI), leaf dry mass (LDM) (g), stem dry mass (STDM) (g), root dry mass (RDM) (g), shoot dry mass (SDM) (g), total dry mass (TDM) (g); Dickson Quality Index (DQI), Specific Leaf Area (SLA), and Robustness Index (RI) in a completely randomized experiment with four replications of nine seedlings per plot.
Table 4 demonstrates the effect of experimental plot size on the sensitivity of Tukey’s test. An increase in least significant difference values is observed as the number of seedlings per plot decreases, indicating a loss of experimental precision. Variables such as root volume, leaf area, total dry mass, and specific leaf area showed a significant increase in least significant difference in smaller plots, demonstrating a greater dependence on adequate sample size. Structural characteristics such as stem diameter and robustness index, in turn, maintained significance even with a reduction in plot size, suggesting greater stability.
Table 4.
Value of the minimum significant difference, according to Tukey’s test for stem length (SL) (cm), number of roots (NR), root length (RL) (cm), stem diameter (SD) (mm), number of leaves (NL), leaf area (LA) (cm2), root volume (RV) (mL), relative chlorophyll index (RCI), leaf dry mass (LDM) (g), stem dry mass (STDM) (g), root dry mass (RDM) (g), shoot dry mass (SDM) (g), total dry mass (TDM) (g); Dickson Quality Index (DQI), Specific Leaf Area (SLA), and Robustness Index (RI) in the comparison of means in cocoa seedlings of the genotypes CCN10, CCN51, CP2204, CP2176, PS1319 and PH16 in a completely randomized experiment with four replications and different plot sizes (PS, number of seedlings per plot−1).
4. Discussion
The choice of the ideal plot size to be used in experiments is fundamental for the planning and success of conducting scientific studies with precision and reduced cost [29]. In the literature, several studies with fruit species are found that seek to determine the ideal plot size. For example, for apple (Malus domestica Borkh), six plants per experimental plot were indicated [4]. For pineapple (Ananas comosus var. comosus), Leonardo et al. [30] determined 15 to 20 experimental units to evaluate leaves and fruits. Storck et al. [31] indicated fewer than five plants per plot to determine characteristics of yellow passion fruit (Passiflora edulis Sims). Note that the number of plants indicated for the species is variable, and individual characterization is recommended to achieve greater experimental precision [29].
For studies of optimal plot size using the methodology of Meier and Lessman [10], the mean does not influence the outcome, but rather the variability indicated by the values of the coefficient of variation. Therefore, smaller optimal plot sizes are expected for genotypes whose characteristics have a coefficient of variation close to 10%, and larger ones for those with a CV greater than 20%.
In our studies, in general, the greatest variation was observed in characteristics related to the root system of cocoa seedlings, indicating that if the objective of the study was solely to evaluate root characteristics, the number of plants per plot should be greater. The higher CV values observed for root system characteristics are associated with the root washing process, which can cause material loss and consequently leads to great variability. Furthermore, the quantification of these characteristics is difficult due to overlapping during image acquisition, requiring a larger number of samples [32].
Although the calculated values for the b index do not directly enter into the methodology of Meier and Lessman [10], it is related to the determination of the optimal plot size, since the term , which is in Equation (3), is an estimate of a parameter present in Equations (1) and (2), responsible for estimating the optimal plot size according to the methodology used. It should be noted that the b index is important because it indicates the relationship between neighboring plants, where values close to zero indicate homogeneous conditions between plants, according to the characteristics of the analysis, while values close to one indicate heterogeneity between neighboring plants.
In our studies, the values obtained for b are close to unity for most determinations, indicating the presence of heterogeneity among neighboring plants. Therefore, the use of the b index determined through bootstrap simulation according to Celanti et al. [17] is recommended when working with seedlings of the cocoa genotypes CCN10, CCN51, CP2204, CP2176, PS1319, and PH16. In practice, the use of values equivalent to unity is less costly because it eliminates the need for grouping plants, since the adoption of simulation allows for random resampling with replacement.
Thus, in this research, it is assumed that a plot size of nine plants per experimental unit is adequate considering the sixteen variables studied for the cocoa genotypes CCN10, CCN51, CP2204, CP2176, PS1319, and PH16. However, the X0 value may change depending on the variables planned for the experiment, as well as the genotype under study. For example, to evaluate only the characteristics of stem length, stem diameter, and root length in an experiment with the CP2204 variety, five plants should be adopted, since the X0 values obtained for stem length, stem diameter, and root length are 3.91, 3.92, and 5.39, respectively. If the objective is to evaluate the relative chlorophyll index, four plants would be sufficient. However, it should be noted that, for practical purposes, it is essential to use whole numbers when estimating the ideal plot size to avoid sublimation [29]. This observation is important because it allows researchers to plan and conduct scientific studies focused on each purpose, reducing costs related to space, labor, vegetative materials, energy resources, irrigation, and fertilization, making the experiment more financially viable.
The use of inference through comparison of means by Tukey’s test at a 5% probability level for the sixteen variables evaluated for the cocoa genotypes CCN10, CCN51, CP2204, CP2176, PS1319, and PH16, demonstrated that the characteristics root length and total dry mass presented statistically similar values. Conversely, it was possible to obtain greater differentiation between the genotypes for most variables, mainly for stem diameter, number of leaves, root volume, Dickson Quality Index, and the relative chlorophyll index, the latter being the one that allowed the greatest differentiation between the genotypes. When analyzing the minimum significant difference using Tukey’s test at a 5% significance level, it is possible to observe that, for most variables, when using plot sizes with two or one plant, there is no minimum significant difference between variables, which is expected, since the minimum X0 values obtained were from three plants onwards. This finding corroborates Pimentel Gomes [27], who states that four repetitions is the necessary number to obtain the minimum number of plots.
Therefore, based on the results obtained in this study, the use of the Meier and Lessman [10] method with bootstrap simulation according to Celanti et al. [17] is recommended, mainly because it is less costly compared to the original methodology, as it does not require identifying the position of the plants in the experimental area.
It is important to highlight that the optimal size of the experimental plot of nine cocoa seedlings should be considered for the genotypes CCN10, CCN51, CP2204, CP2176, PH16, and PS1319, considering the 16 characteristics analyzed in this study. Such advancements are important due to the considerable number of available genotypes, which in itself represents a large variability that must be taken into account when conducting scientific experiments with cocoa seedlings, ensuring high experimental precision and, consequently, reliability in the results obtained. Furthermore, quantifying the material needed to carry out the experiment is important both to guarantee reliable results and to avoid unnecessary expenditure of resources. Another important point to mention is that the seedlings used in our study were produced through vegetative propagation, giving rise to clones where genetic variability is low or non-existent, which can reduce the number of seedlings per experimental plot. Therefore, although we believe that nine plants per experimental plot is sufficient to meet the needs of most cocoa genotypes, if the experiment is conducted under conditions different from those presented in our studies, we recommend making further adjustments.
5. Conclusions
For experimental accuracy, the optimal experimental plot size for clonal cocoa seedlings of the genotypes CCN10, CCN51, CP2204, CP2176, PH16, and PS1319, evaluating the characteristics stem length, number of roots, root length, stem diameter, number of leaves, leaf area, root volume, relative chlorophyll index, leaf dry mass, stem dry mass, root dry mass, shoot dry mass, total dry mass, Dickson Quality Index, Specific Leaf Area, and Robustness Index, is nine plants. It is worth noting that nine is the maximum number of plants recommended for evaluation in studies involving all the characteristics mentioned above; if specific characteristics are evaluated, the number of plants used may be lower.
For future studies with clonal cocoa seedlings of the genotypes CCN10, CCN51, CP2204, CP2176, PH16 and PS1319, it is not necessary to use large quantities of plants above nine, since large plots do not provide gains in experimental precision and result in expenses of time, space and financial resources in conducting the experiment.
Author Contributions
Conceptualization, L.G.M. and S.D.-A.; methodology, L.G.M. and E.R.S.; software, E.R.S. and V.d.S.O.; validation, J.T., E.R.S. and V.d.S.O.; formal analysis, E.R.S., V.d.S.O. and L.d.O.A.; investigation, C.d.S.D. and K.T.K.; resources, V.d.S.O.; data curation, S.D.-A.; writing—original draft preparation, L.G.M., J.T., V.d.S.O. and S.D.-A.; writing—review and editing, C.d.S.D. and C.A.S.S.; visualization, L.d.O.A.; supervision, E.R.S., E.N.d.S. and C.A.S.S.; project administration, S.D.-A. and C.A.S.S.; funding acquisition, E.N.d.S. and K.T.K. All authors have read and agreed to the published version of the manuscript.
Funding
This research was funded by Secretaria da Agricultura, Abastecimento, Aquicultura e Pesca (SEAG) e Fundação de Amparo à Pesquisa e Inovação do Espírito Santo—FAPES, grant number DI 004/2022 SEAG/FAPES—Banco de projetos Fase III.
Data Availability Statement
The original contributions presented in this study are included in the article. Further inquiries can be directed to the corresponding author.
Conflicts of Interest
The authors declare no conflicts of interest.
Abbreviations
The following abbreviations are used in this manuscript:
| SL | stem length |
| NR | number of roots |
| RL | root length |
| SD | stem diameter |
| NL | number of leaves |
| LA | leaf area |
| RV | root volume |
| RCI | relative chlorophyll index |
| LDM | leaf dry mass |
| STDM | stem dry mass |
| RDM | root dry mass |
| SDM | shoot dry mass |
| TDM | total dry mass |
| DQI | Dickson quality index |
| SLA | specific leaf area |
| RI | robustness index |
| mean | |
| Md | median |
| min | minimum value |
| max | maximum value |
| s | standard deviation |
| CV | coefficient of variation |
| R2 | coefficient of determination |
| b | Smith heterogeneity index |
| optimum plot size | |
| LSD | least significant difference |
Appendix A
Table A1.
Mean (), median (Md), minimum value (min), maximum value (max), standard deviation (s) and coefficient of variation (CV, in %) for stem length (SL) (cm), number of roots (NR), root length (RL) (cm), stem diameter (SD) (mm), number of leaves (NL), leaf area (LA) (cm2), root volume (RV) (mL), relative chlorophyll index (RCI), leaf dry mass (LDM) (g), stem dry mass (STDM) (g), root dry mass (RDM) (g), shoot dry mass (SDM) (g), total dry mass (TDM) (g); Dickson Quality Index (DQI), Specific Leaf Area (SLA), and Robustness Index (RI) in seedlings of the cocoa genotypes CCN10, CCN51, CP2204, CP2176, PS1319, and PH16, evaluated in 50 plants of each genotype.
References
- FAO—Food and Agriculture Organizations of the United Nations. Available online: https://www.fao.org/faostat/en/#data/QCL (accessed on 20 May 2025).
- IPEA—IBGE (IPEA—Instituto De Pesquisa Econômica Aplicada; IBGE—Instituto Brasileiro De Geografia E Estatística). Relatório Econômico; IPEA, IBGE: Brasília, Brazil, 2025.
- Souza Junior, J.O. Cacau: Cultivo, Pesquisa e Inovação; Editus: Ilhéus, Brazil, 2018. [Google Scholar]
- Ribeiro, G.C.; Carrafa, M.P.; Bonelá, E.S.; Schmildt, O.; Czepak, M.P.; Schmildt, E.R. Optimal plot size in the experiment with low-cold demanding apple trees. Rev. Ceres 2024, 71, e71048. [Google Scholar] [CrossRef] [Scilit]
- Freitas, J.; Jardim, I.; Guedes, M. Desenvolvimento de mudas de cacau em função da concentração de biostimulante d’raz®. Divers. J. 2024, 9, 2. [Google Scholar] [CrossRef] [Scilit]
- N’dafá, G.; Pinto, C.; Pinto, O.; Silva, L.G. Crescimento inicial de mudas de cacaueiro fertilizado com doses de esterco bovino. Encicl. Biosf. 2022, 19, 42. [Google Scholar] [CrossRef] [Scilit]
- Pimentel, J.V.M. Desenvolvimento de Clones de Cacau Utilizados Para Porta-Enxertos; Instituto Federal do Espírito Santo, Campus Itapina: Colatina, Brazil, 2022.
- Souza Júnior, J.O.; Carmello, Q.A.C.; Sodré, G.A. Substrato e adubação fosfatada para a produção de mudas clonais de cacau. Rev. Bras. Ciênc. Solo 2011, 35, 1. [Google Scholar] [CrossRef] [Scilit]
- Guarçoni, R.C.; Alixandre, F.T.; Sousa, D.G.; Pereira, L.; Brioschi Junior, D.; Sousa, L.H.B.P.D.; Favarato, L.F.; Marcate, J.P.P. Plot size for evaluation of agronomic and sensorial characteristics of Arabica coffee. BJB 2020, 38, 1. [Google Scholar] [CrossRef] [Scilit]
- Meier, V.D.; Lessman, K.J. Estimation of optimum field plot shape and size for testing yield in Crambe abyssinica Hochst. Crop Sci. 1971, 11, 5. [Google Scholar]
- Carrafa, P.M.; Morais, L.G.; Schmildt, O.; Schmildt, E.R. Optimal plot size with conilon LB1 coffee tree clonal seedlings produced in tubes. Pesqui. Agropecu. Trop. 2024, 54, e77706. [Google Scholar] [CrossRef] [Scilit]
- Cargnelutti Filho, A.; Loregian, M.V.; Bubans, V.E.; Somavilla, F.; Costa, S.L.D. Comparison of methods for estimating the optimum plot size for pearl millet, slender leaf rattlebox, and showy rattlebox. Rev. Caatinga 2021, 34, 6. [Google Scholar] [CrossRef] [Scilit]
- Magalhães, J.R.; Azevedo, A.M.; Valadares, N.R.; Fernandes, A.C.G.; Alves, R.A.; Freitas, I.C.D.; Costa, C.A.D. Optimum plot size and number of replications for experiments with the chickpea. Rev. Ciênc. Agron. 2023, 54, e20228506. [Google Scholar] [CrossRef] [Scilit]
- Lopes, B.G.; Savian, V.S.; Faria, G.A. Optimal plot size estimation in field experiment with purple passion fruit. Rev. Bras. Frutic. 2023, 45, e-753. [Google Scholar] [CrossRef] [Scilit]
- Alves, S.R.M.; Lopes, R.; Meneses, C.; Valente, M.S.F.; Martins, C.C.; Ramos, S.F.; Oliveira, I.; De Jesus Pinto Fraxe, T.; Costa, L.; Lopes, M.T.G. Morpho-Agronomic Characterization, Sample Size, and Plot Size for the Evaluation of Capsicum chinense Genotypes. Horticulturae 2022, 8, 785. [Google Scholar] [CrossRef] [Scilit]
- Lohmor, N.; Khan, M.; Kapoor, K.; Bishnoi, S. Estimation of optimum plot size and shape from a uniformity trial for field experiment with sunflower (Helianthus annuus) crop in soil of hisar. Int. J. Plant Soil Sci. 2017, 15, 5. [Google Scholar] [CrossRef] [Scilit]
- Celanti, H.F.; Schmildt, E.R.; Schmildt, O.; Alexandre, R.S.; Cattaneo, L.F. Optimal plot size in the evaluation of papaya scions: Proposal and comparison of methods. Rev. Ceres 2016, 63, 4. [Google Scholar] [CrossRef] [Scilit]
- Alvares, C.A.; Stape, J.L.; Sentelhas, P.C.; Gonçalves, J.L.M.; Sparovek, G. Koppen’s climate classification map for Brazil. Meteorol. Z. 2014, 22, 6. [Google Scholar] [CrossRef] [Scilit]
- Climatologia e Histórico de Previsão do Tempo em São Mateus, BR. Available online: https://www.climatempo.com.br/climatologia/75/linhares-es (accessed on 30 December 2025).
- Brazil. Ministério de Agricultura, Pecuária e Abastecimento (MAPA). Clones Autocompatíveis Recomendados Pela CEPLAC; CEPLAC/SEREX: Teolândia, Brazil, 2018.
- Dickson, A.; Leaf, A.L.; Hosner, J.F. Quality appraisal of white spruce and white pine seedling stock in nurseries. For. Chron. 1960, 36, 1. [Google Scholar] [CrossRef] [Scilit]
- Poorter, H.; Niklas, K.J.; Reich, P.B.; Oleksyn, J.; Poot, P.; Mommer, L. Biomass allocation to leaves, stems and roots: Meta-analyses of interspecific variation and environmental control. New Phytol. 2011, 193, 1. [Google Scholar] [CrossRef] [Scilit] [PubMed]
- Carneiro, J.G.A. Produção e Controle de Qualidade de Mudas Florestais; UFPR/FUPEF: Curitiba, Brazil, 1995; 451p. [Google Scholar]
- Chernick, M.R.; Labudde, R.A. An Introduction to Bootstrap Methods with Applications to R; John Wiley & Sons: Hobekan, NJ, USA, 2011; p. 216. [Google Scholar]
- Smith, H.F. Uma lei empírica que descreve a heterogeneidade nos rendimentos de culturas agrícolas. J. Agric. Sci. 1938, 28, 1. [Google Scholar] [CrossRef] [Scilit]
- Lorentz, L.H.; Erichsen, R.; Lúcio, A.D. Proposta de método para definir tamanho de parcela para culturas agrícolas. Rev. Ceres 2012, 59, 6. [Google Scholar] [CrossRef] [Scilit]
- Pimentel-Gomes, F. Curso de Estatística Experimental, 15th ed.; FEALQ: Piracicaba, Brazil, 2009; 451p. [Google Scholar]
- R Core Team. R: A Language and Environment for Statistical Computing; R Version 4.4.1 (2024-06-14); R Foundation for Statistical Computing: Vienna, Austria, 2024; Available online: https://www.R-project.org/ (accessed on 20 May 2025).
- Magalhães, J.R.; Valadares, N.R.; Alves, R.A.; Fernandes, A.C.G.; Rodrigues, C.H.O.; Athayde, A.L.M.; Azevedo, A.M. Estimation of optimal plot size for chickpea experiments using Bayesian approach with prior information. Acta Sci. Agron. 2025, 47, e69264. [Google Scholar] [CrossRef] [Scilit]
- Leonardo, F.A.P.; Pereira, W.E.; Silva, S.d.M.; Araújo, R.C.; Mendonça, R.M.N. Tamanho ótimo da parcela experimental de abacaxizeiro ‘Vitória’. Rev. Bras. Frutic. 2014, 36, 4. [Google Scholar] [CrossRef] [Scilit]
- Storck, L.; Lúcio, A.D.; Krause, W.; Araújo, D.V.; Silva, C.A. Scaling the number of plants per plot and number of plots per genotype of yellow passion fruit plants. Acta Sci. Agron. 2014, 36, 1. [Google Scholar] [CrossRef] [Scilit]
- Gonçalves, G.R.; Prins, C.L.; Diel, M.I.; Lúcio, A.D. Plot and sample sizes for biometric variables in lettuce seedlings. Ciência Rural. 2024, 54, 7. [Google Scholar] [CrossRef] [Scilit]

Disclaimer/Publisher’s Note: The statements, opinions and data contained in all publications are solely those of the individual author(s) and contributor(s) and not of MDPI and/or the editor(s). MDPI and/or the editor(s) disclaim responsibility for any injury to people or property resulting from any ideas, methods, instructions or products referred to in the content. |
© 2026 by the authors. Licensee MDPI, Basel, Switzerland. This article is an open access article distributed under the terms and conditions of the Creative Commons Attribution (CC BY) license.