


Abstract
Grain quality inspection is crucial for seed stored, with image segmentation playing a key role in this process. However, existing methods face challenges such as high computational costs, expensive data annotation, and data privacy concerns, which hinder the acquisition of large-scale labeled datasets and limit model performance. To overcome these challenges, we propose a novel semi-supervised learning (SSL) paradigm for seed segmentation. Our approach integrates VMUNet and UNet into a unified framework, combining UNet’s capacity for fine-grained detail extraction with VMUNet’s strengths in global semantic model, enabling richer pixel-level feature representation. We introduce an orthogonal attention mechanism into the VMUNet encoder to model feature dependencies across channel, spatial, and scale dimensions, improving information fusion and feature enhancement. Additionally, a perturbation strategy is applied in the dual-branch decoder, combined with consistency regularization, to enhance robustness and generalization. This helps mitigate overfitting and reduces excessive reliance on boundary details during decoding. Experimental results on a corn seed dataset show that the proposed method achieves 91.2% accuracy with 100% labeled data and 91.9% with only 50% labeled data, outperforming fully supervised methods by 0.6%. These results demonstrate the method’s high segmentation performance and practical potential while maintaining data privacy. These results confirm that OAMamba provides an accurate, robust, and annotation-efficient solution for corn seed segmentation, showing strong potential for practical deployment in agricultural intelligent inspection systems.
1. Introduction
Corn is one of the most widely cultivated and highest-yielding cereal crops globally. As a crucial agricultural product and industrial raw material in China, its quality is directly linked to national food security. With the advancement of agricultural mechanization, mechanical damage during harvesting, compounded by environmental factors, often leads to mold growth and insect infestation in corn seeds, posing significant risks to food storage safety. However, current manual or mechanical screening methods suffer from low efficiency and high labor costs, making them inadequate for the quality control demands of large-scale grain storage. Therefore, it is imperative to develop a highly efficient, accurate, and real-time automated detection model based on grain quality indicators to enable intelligent identification of corn kernel defects and ensure quality assurance.
Over the past decade, Convolutional Neural Networks (CNNs) have dominated agricultural image segmentation tasks, widely applied in crop production, storage, and breeding. Models like [1], U-Net [2] and their various extensions have demonstrated strong local feature extraction capabilities, benefiting from structural simplicity and stable convergence, thus achieving excellent performance in agricultural intelligent detection. However, CNNs are inherently limited by their local receptive fields and inductive biases, making it difficult to capture long-range dependencies and global context, especially when segmenting small targets like corn kernels, which exhibit significant variations in size, texture, and shape [2,3,4,5,6,7]. To overcome these limitations, the emergence of self-attention mechanisms, represented by Vision Transformers (ViTs) [8], has provided a new direction. ViT excels at modeling global information and achieves superior performance on large-scale datasets, inspiring hybrid architectures like TransUNet [9] and Swin-Unet [10] that balance global and local feature extraction. Nevertheless, ViT-based models typically require large amounts of high-quality labeled data, which is costly and difficult to obtain in agricultural scenarios, limiting their practical applicability.
To overcome the “small-sample” challenge in agricultural intelligent detection, weakly supervised learning (WSL) and semi-supervised learning (SSL) have attracted growing attention. By incorporating strategies such as consistency regularization, pseudo-labeling, and adversarial learning, SSL methods effectively leverage unlabeled data, mitigating the reliance on annotated samples [11,12,13,14]. Compared with traditional fully supervised approaches, semi-supervised methods offer a promising balance between high accuracy and low annotation dependency, demonstrating greater potential for practical deployment in agricultural intelligent detection tasks. To address the scarcity of labeled data in corn seed image segmentation, this study proposes a semi-supervised segmentation method incorporating an orthogonal attention mechanism into the Mamba network (OAMamba) for robust corn seed segmentation. OAMamba optimizes pixel-level segmentation through consistency regularization and local contrast loss, while its dual-branch architecture (VMamba-UNet and UNet) explicitly captures complementary shape and texture features. In addition, the Vectorized Polygonal Attention (VPA) mechanism leverages seed contour information to enforce local–global consistency. Unlike existing agricultural segmentation methods based on FixMatch or Mean Teacher, which primarily rely on global consistency constraints or teacher–student averaging strategies, OAMamba introduces structure-aware attention and contour-guided supervision to better handle small, irregular, and highly variable corn seeds. Experimental results demonstrate that OAMamba achieves superior accuracy and robustness compared with conventional semi-supervised approaches, highlighting its novelty and practical advantages in agricultural image segmentation.
Our main contributions are as follows:
- The semi-supervised learning framework is applied for the first time to corn seed segmentation, achieving high-precision defect segmentation especially under few-shot and data-privacy-restricted environments.
- We propose an Orthogonal Attention Mechanism (OAM) and apply it to the Mamba encoder for the first time. By jointly modeling feature long-range dependencies across multiple dimensions such as channel, space, and scale, we address the issues of insufficient information utilization and incomplete feature representation.
- We introduce a perturbation strategy and consistency regularization constraint in the dual-branch decoder, enhancing the model’s adaptability to input changes, reducing overfitting, and improving performance and generalization on unlabeled data.
- Experimental results show that OAMamba achieves 91.9% segmentation accuracy on the corn seed segmentation task with only 50% labeled data, improving by 0.6% compared to fully supervised methods, significantly enhancing segmentation performance in data-privacy-restricted environments.
The rest of the paper is organized as follows. Section 2 reviews related work on corn seed image segmentation and introduces the proposed OAMamba network architecture. Section 3 presents the experimental design and discussion, including comparative experiments, generalization experiments, and ablation studies, to demonstrate the qualitative and quantitative evaluation results as well as visualization analyses on corn seed image segmentation benchmarks. Finally, Section 4, summarizes the whole paper.
2. Materials and Methods
2.1. Corn Seed Segmentation with Limited Annotations
In the field of agriculture, neural network technology has made significant progress, with many scholars applying traditional algorithms for corn seed quality detection [15]. Quan et al. [16] used image labeling and multi-scale wavelet analysis to achieve segmentation, localization and shape recognition of corn seeds. Cheng et al. [17] further identified the embryo and endosperm feature regions of corn seeds using a color space model combined with morphological operations. Shi et al. [18] applied genetic algorithms and SPSS methods in the HSI color space, utilizing the area ratio of damaged kernels to identify corn varieties. To address the detection of broken kernels, K. Ding et al. [19] successfully distinguished intact from broken kernels by analyzing contour parameters such as symmetry and curvature. Ni B et al. [20] developed a grading system based on histogram distribution analysis, enabling the identification of concave and convex features of corn seeds. Ng H. F [21] efficiently identified moldy corn seeds with mechanical stress cracks by staining and employing a triple-layer neural network. Lastly, I. Zayas et al. [22] analyzed 12 morphological parameters and established a Mahalanobis distance discriminant function to distinguish intact from broken seeds. These studies showcase the wide application of traditional image processing and analysis techniques in corn seed quality detection, providing valuable insights for research in this field.
While traditional algorithms offer certain advantages in corn quality detection, deep neural networks, particularly segmentation networks based on CNN, ViT and Mamba, are more efficient in handling complex backgrounds and fine-grained segmentation tasks. However, these networks typically rely on large datasets with expert annotations, which are challenging to obtain in practical scenarios. As a result, improving performance with limited annotated data has become a key challenge.
To address this challenge, semi-supervised learning (SSL) has proven to be an effective solution. By combining a small amount of labeled data with a large volume of unlabeled data, SSL enhances the model’s performance and generalization capability, making it particularly suitable for tasks where obtaining annotations is costly or time-consuming. Among various SSL strategies, consistency regularization has emerged as a key technique, ensuring that the model’s predictions remain stable under different perturbations, such as geometric transformations, noise injection, or feature-level augmentations. This stability encourages the network to learn more robust and discriminative image features while minimizing inference discrepancies between labeled and unlabeled samples, ultimately improving segmentation accuracy and reliability [23,24,25]. In the context of corn seed image analysis, where seeds exhibit high variability in shape, size, and surface texture, semi-supervised learning (SSL) not only reduces the reliance on extensive manual annotations but also enhances the model’s ability to generalize across different seed types and imaging conditions. Motivated by these advantages, this study introduces the OAMamba architecture, which leverages the SSL paradigm to optimize feature representation and segmentation precision, particularly when only limited labeled data are available.
Specifically, OAMamba adopts a dual-branch design composed of VMamba-UNet and UNet, which complement each other in modeling shape- and texture-related features. The VMamba-UNet branch emphasizes long-range dependency modeling and structured shape representation, enabling robust capture of seed contours and global morphology, while the UNet branch focuses on local convolutional feature extraction to preserve fine-grained texture and boundary details. Through collaborative learning under the SSL framework, these two branches jointly enhance feature consistency and discrimination. By integrating this complementary dual-branch strategy with domain-specific prior knowledge and advanced attention mechanisms, OAMamba further improves segmentation efficiency and robustness, providing a practical solution for high-throughput corn seed phenotyping and related agricultural applications.
2.2. Vision Mamba Unet in Corn Seed Segmentation
Since the introduction of the UNet architecture, convolutional neural networks (CNNs [1]) have demonstrated remarkable capabilities in capturing local features for image segmentation tasks, driving the development of numerous derivative models [3,5,6,9,10,26,27,28,29,30,31]. Meanwhile, the Transformer architecture, originally designed to model long-range dependencies [32], has also been widely adopted in computer vision. Representative models such as ViT [8] and hybrid CNN-Transformer networks [10,14,28,33,34,35] have attracted considerable attention in image segmentation. However, the high computational complexity and training cost of Transformers remain a significant challenge, particularly in agricultural scenarios with limited annotated data. To improve efficiency and adaptability, the recently proposed Mamba architecture has emerged as a lightweight alternative. By combining state-space models (SSMs) [36] with gating mechanisms, Mamba effectively captures both long- and short-term dependencies, while the use of the SiLU activation function enhances its ability to model nonlinear features [37]. In addition, layer normalization and residual connections ensure training stability and significantly mitigate issues of vanishing and exploding gradients [38].
Building on this, cross-modal segmentation methods further demonstrate the advantages of fusing multi-source information. For instance, approaches that integrate multi-temporal remote sensing images with DEM data for winter wheat mapping illustrate that combining complementary modalities can effectively improve segmentation accuracy [39]. Situating the present work within these recent advances in multi-modal and remote sensing image segmentation highlights the potential and practical value of our method in fully leveraging spectral–spatial and temporal information for agricultural image analysis.
For the corn seed segmentation task, this paper focuses on the Mamba architecture and integrates it with semi-supervised learning (SSL) techniques. Although traditional SSL methods can improve model performance with limited labeled data, they are often influenced by data distribution biases and noise, leading to overfitting and limiting the model’s generalization and feature representation capabilities. To address these challenges, this paper introduces consistency regularization constraints, which are further combined with pseudo-labeling strategies to ensure that the model’s predictions remain consistent under input perturbations. This improves the model’s learning efficiency and accuracy with a small amount of labeled data. Additionally, a distance function is designed to reduce the impact of unreliable pseudo-labels, thereby enhancing the model’s adaptability to various perturbations and overall generalization ability.
2.3. OAMamba Framework
The proposed OAMamba framework adopts a dual-branch semi-supervised architecture composed of a supervised U-Net branch and a pseudo-label-guided Visual Mamba-UNet branch, enabling effective utilization of both labeled and unlabeled data. An Orthogonal Attention Module (OAM) is embedded in the encoder to decouple and complement spatial and semantic features, thereby enhancing the representation of complex grain structures. Meanwhile, Mamba-based state-space modeling is employed to capture long-range dependencies and global contextual information. Through perturbation-aware contrastive learning and consistency regularization, OAMamba achieves robust and accurate segmentation under limited-label and degraded imaging conditions.
To formalize the underlying sequential modeling mechanism, we briefly introduce the state-space formulation adopted in Mamba. Traditional State Space Models (SSMs), including Structured State Space Sequence Models (S4) and Mamba, are both built upon a classical continuous-time system denoted as . This system is typically formulated as a linear time-invariant (LTI) system function. By leveraging a hidden state variable , it enables the mapping of a one-dimensional input function or sequence to an output . The mapping process is illustrated through the evolution of . This process can be formulated as a Linear Ordinary Differential Equation (ODE) with constant coefficients:
where A ∈ RN×N is the state transition matrix, B ∈ RN×1 maps the input to the hidden state, C ∈ R1×N maps the hidden state to the output, and D ∈ R represents the direct input-to-output (feedthrough) term. To enable the use of SSMs in deep learning applications, the continuous-time system is discretized using the Zero-Order Hold (ZOH) method, which assumes that the input remains constant over each discrete time interval Δt. The resulting discrete-time system is given by:
After discretization, the system can be represented in the following form:
Traditional SSMs rely on fixed parameters, which limits their ability to adapt to complex and high-dimensional data such as images. Mamba addresses this limitation by making the input projection B, output projection C, and discretization scaling dynamically dependent on the input. This design enables the model to adaptively modulate feature representations, selectively retain relevant information, and efficiently model long-range dependencies.
Although the Mamba method may lead to computational resource overload when processing high-resolution images, and the self-attention mechanism of ViT could introduce information redundancy, thereby affecting boundary precision, the introduction of the OAM helps address these issues. By applying OAM to multiple directional angles over specific object regions, the model’s ability to perceive local details is enhanced, thereby improving both the accuracy and efficiency of image segmentation, particularly in complex scenarios.
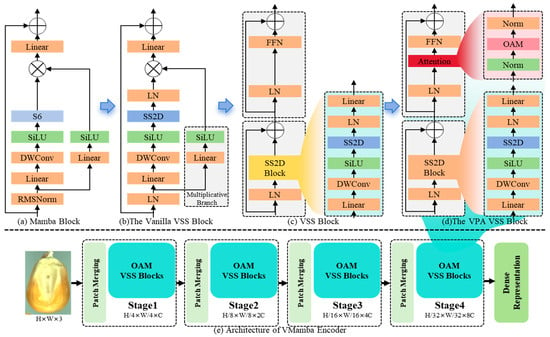
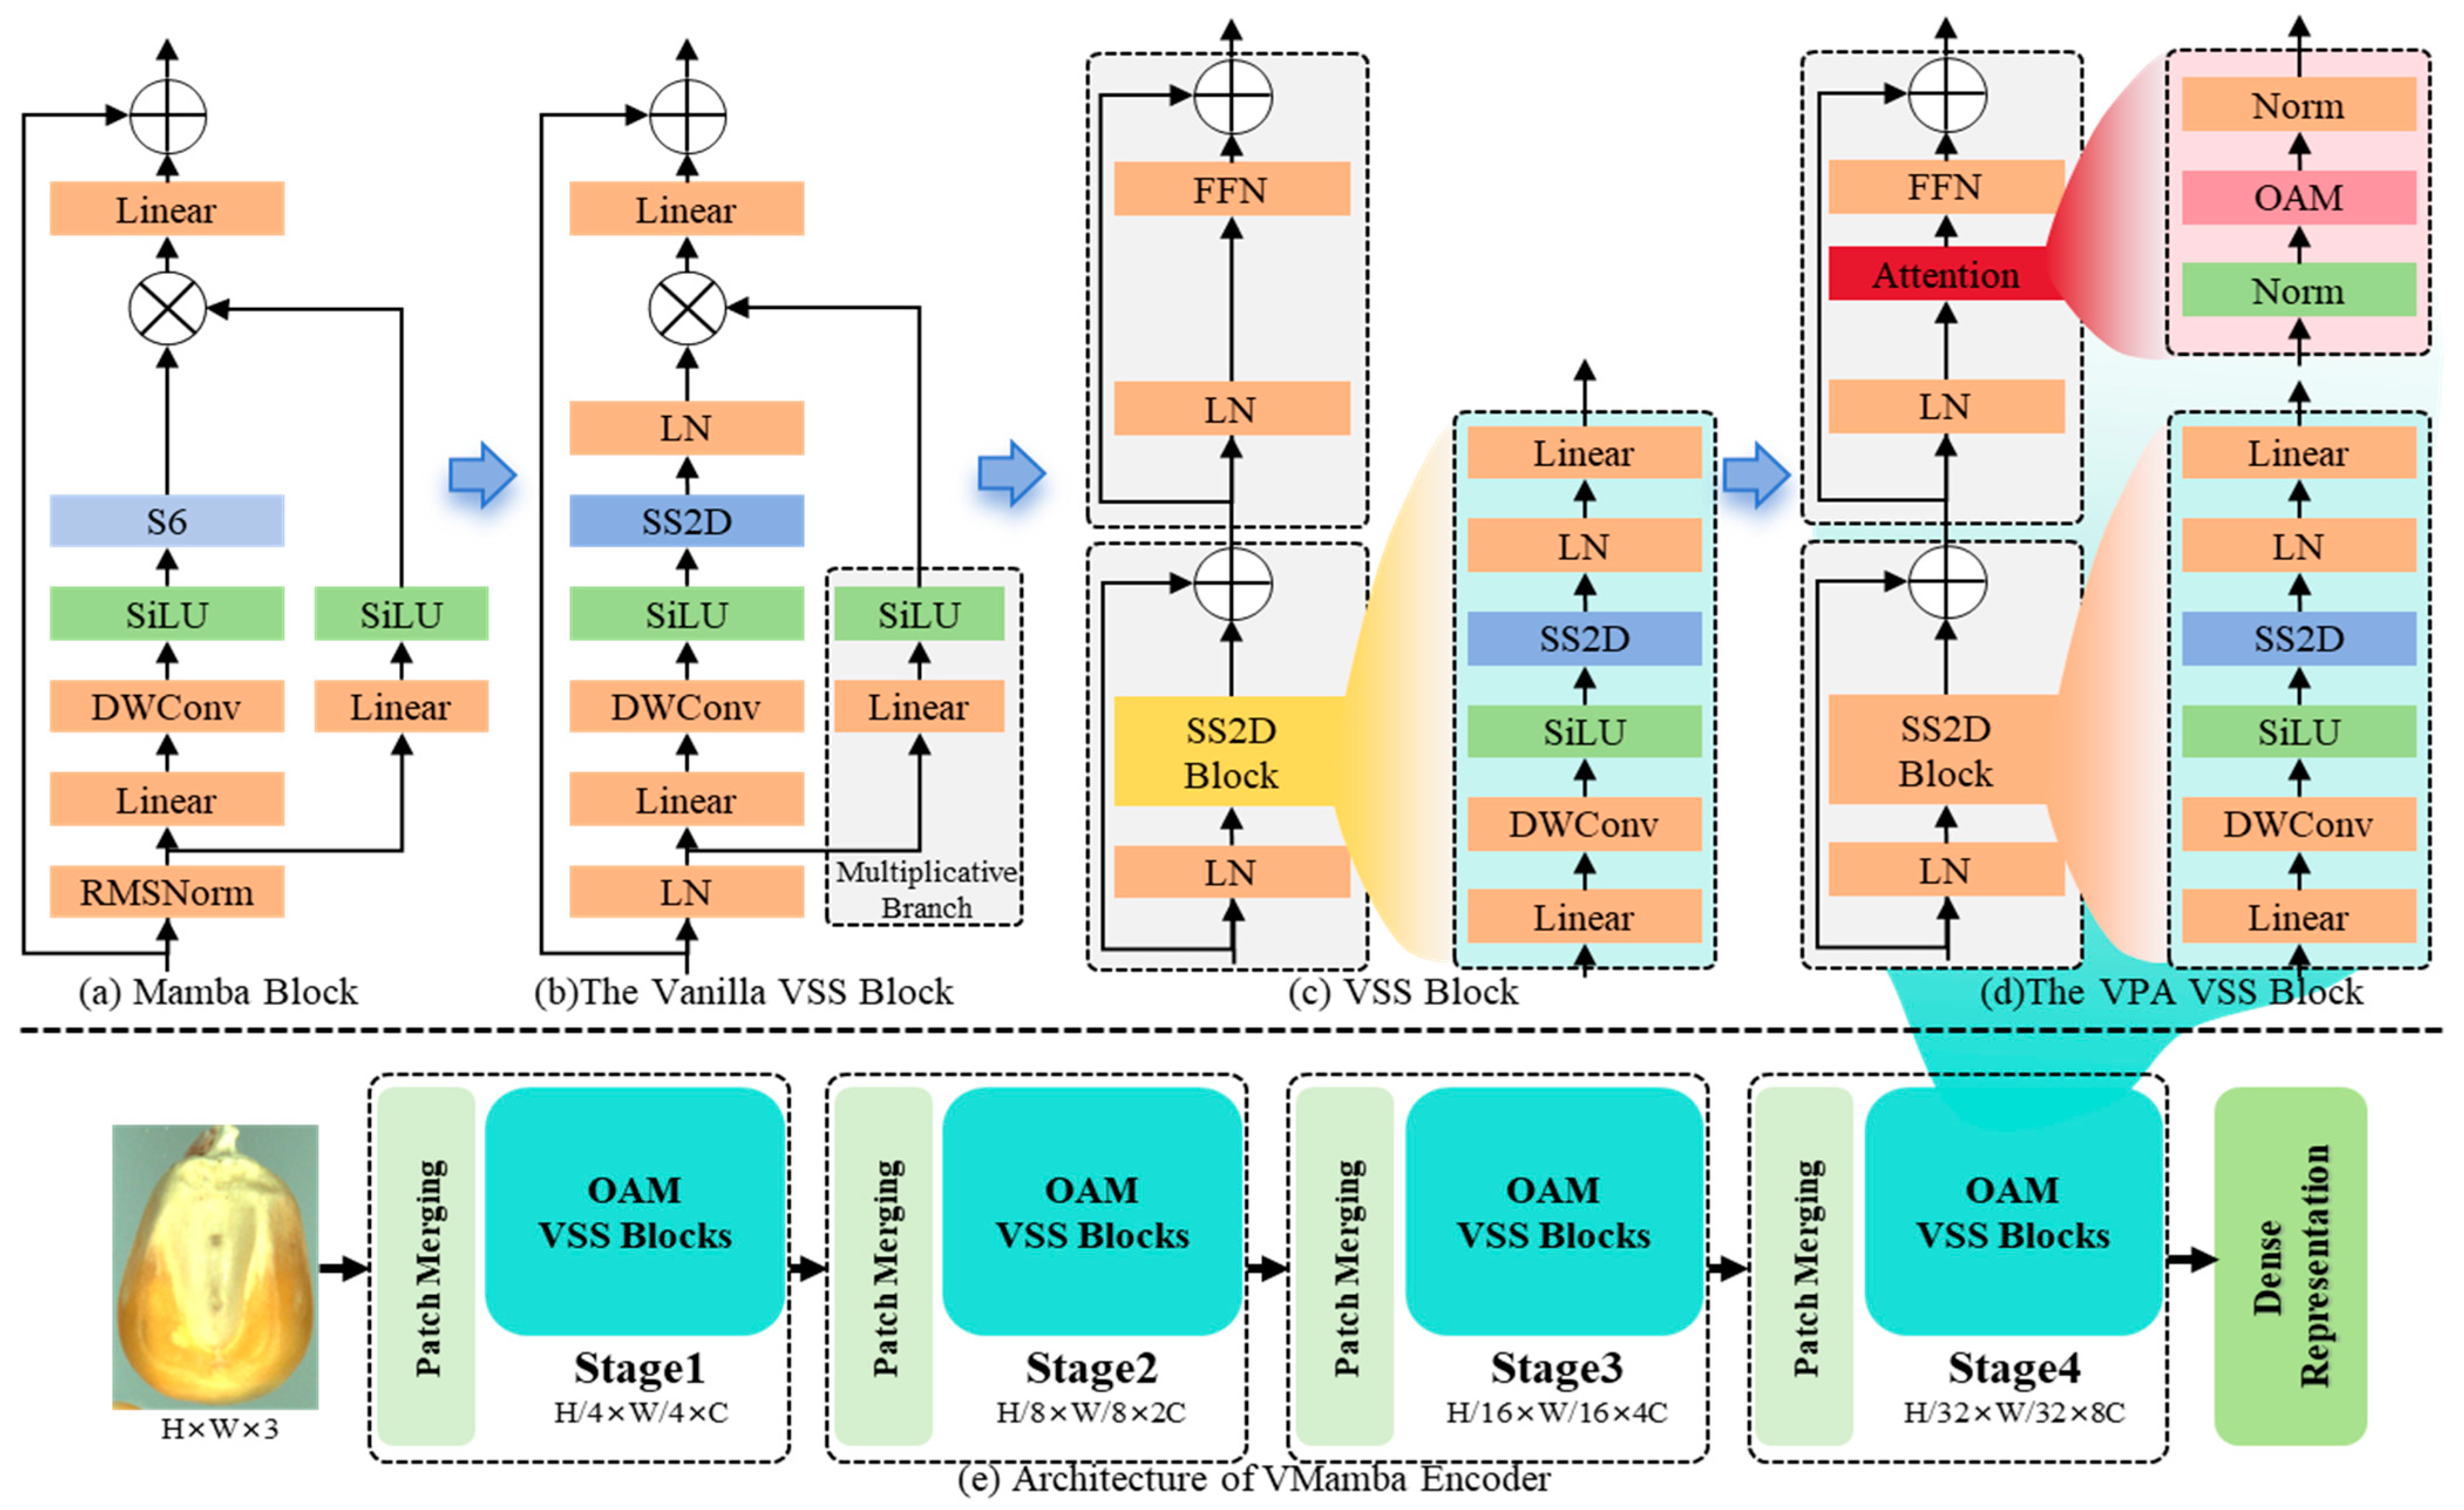
This paper compares three versions of the VMamba network, considering three common model scales: small-scale VMamba-T, medium-scale VMamba-S, and base-scale VMamba-B. The core module is the Visual State Space (VSS) module, which is inspired by the Mamba module and serves as its counterpart in the visual domain for efficient feature representation learning, as shown in Figure 1a. The VSS module was initially constructed by replacing the key submodule S6 of Mamba, a structure also known as the “vanilla VSS Block”. The S6 module in Mamba features a global receptive field, a dynamic weight mechanism (selectivity), and linear computational complexity. To adapt to image data, it was replaced with a 2D selective scanning module (SS2D), as indicated by the dashed box in Figure 1b. Since SS2D implements a similar gating selective mechanism, the multiplication branch was removed, reducing computational overhead. Subsequently, the authors further improved the VSS structure by referencing the traditional Transformer module architecture, employing a main branch combined with two residual modules to form the final version of the VSS Block, as shown in Figure 1c. The paper also introduces the OAM attention mechanism, as shown in Figure 1d. First, the input image I ∈ RH×W×3 is divided into multiple blocks using the stem module, yielding a 2D feature map with spatial dimensions of H/4 × W/4. Without additional positional embeddings, multiple network stages are used to create hierarchical representations with resolutions of H/8 × W/8, H/16 × W/16, and H/32 × W/32. In other words, each stage performs down-sampling operation followed by the execution of the Visual State Space (VSS) block. Our OAM attention mechanism enhances the model’s ability to model visual tasks while simultaneously improving its contextual awareness.
Figure 1.
Overview of the Mamba blocks integrated with the proposed Orthogonal Attention Module (OAM). “⊕” indicates feature addition, while “⊗” represents element-wise multiplication. (a) Mamba block; (b) vanilla VSS block; (c) VSS block; (d) VPA-VSS block; (e) VMamba encoder architecture.
2.4. Orthogonal Attention Module
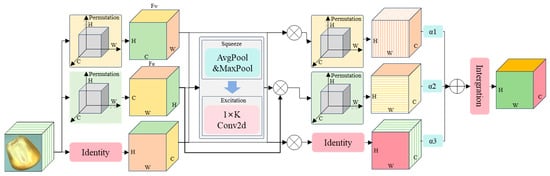
To enable the network to more effectively focus on the detailed features of grain kernels, the Encoder section of Mamba incorporates multi-dimensional collaborative attention (MCA) [40], which establishes dependencies between the height (H), width (W), and channel (C) dimensions of feature maps through rotation operations and residual transformation modules. B uilding on this, the proposed Orientation-Aware Mamba (OAM) module further enhances the Encoder by explicitly modeling orientation-dependent features, capturing directional cues that are critical for elongated or irregular structures such as grain edges and surface textures. In addition, OAM employs multi-scale hierarchical attention aggregation, allowing global context to guide local feature refinement, thereby improving the segmentation of fine-grained structures while preserving overall shape integrity. Structurally, OAM consists of three parallel branches that integrate feature channels into the attention process, strengthening information interaction across spatial and channel dimensions.
On this basis, we further introduce an orthogonal attention mechanism to explicitly decouple spatial and semantic feature interactions, facilitating complementary feature learning within the dual-branch Mamba-UNet architecture. Unlike conventional multi-dimensional attention, which typically aggregates features along multiple axes without explicitly enforcing orthogonality, this mechanism minimizes redundancy between spatial and semantic channels, effectively promoting complementary feature extraction. This design enhances the model’s capability to handle complex defect structures and degraded image quality, improving segmentation accuracy and robustness. Overall, the OAM module combines multi-dimensional collaborative attention, orientation-aware feature modeling, multi-scale hierarchical aggregation, and orthogonal attention mechanisms. This integration not only significantly enhances the Encoder’s ability to extract critical grain kernel features but also improves the model’s expressive efficiency and computational performance, particularly in semi-supervised scenarios with limited labeled data (Figure 2).
Figure 2.
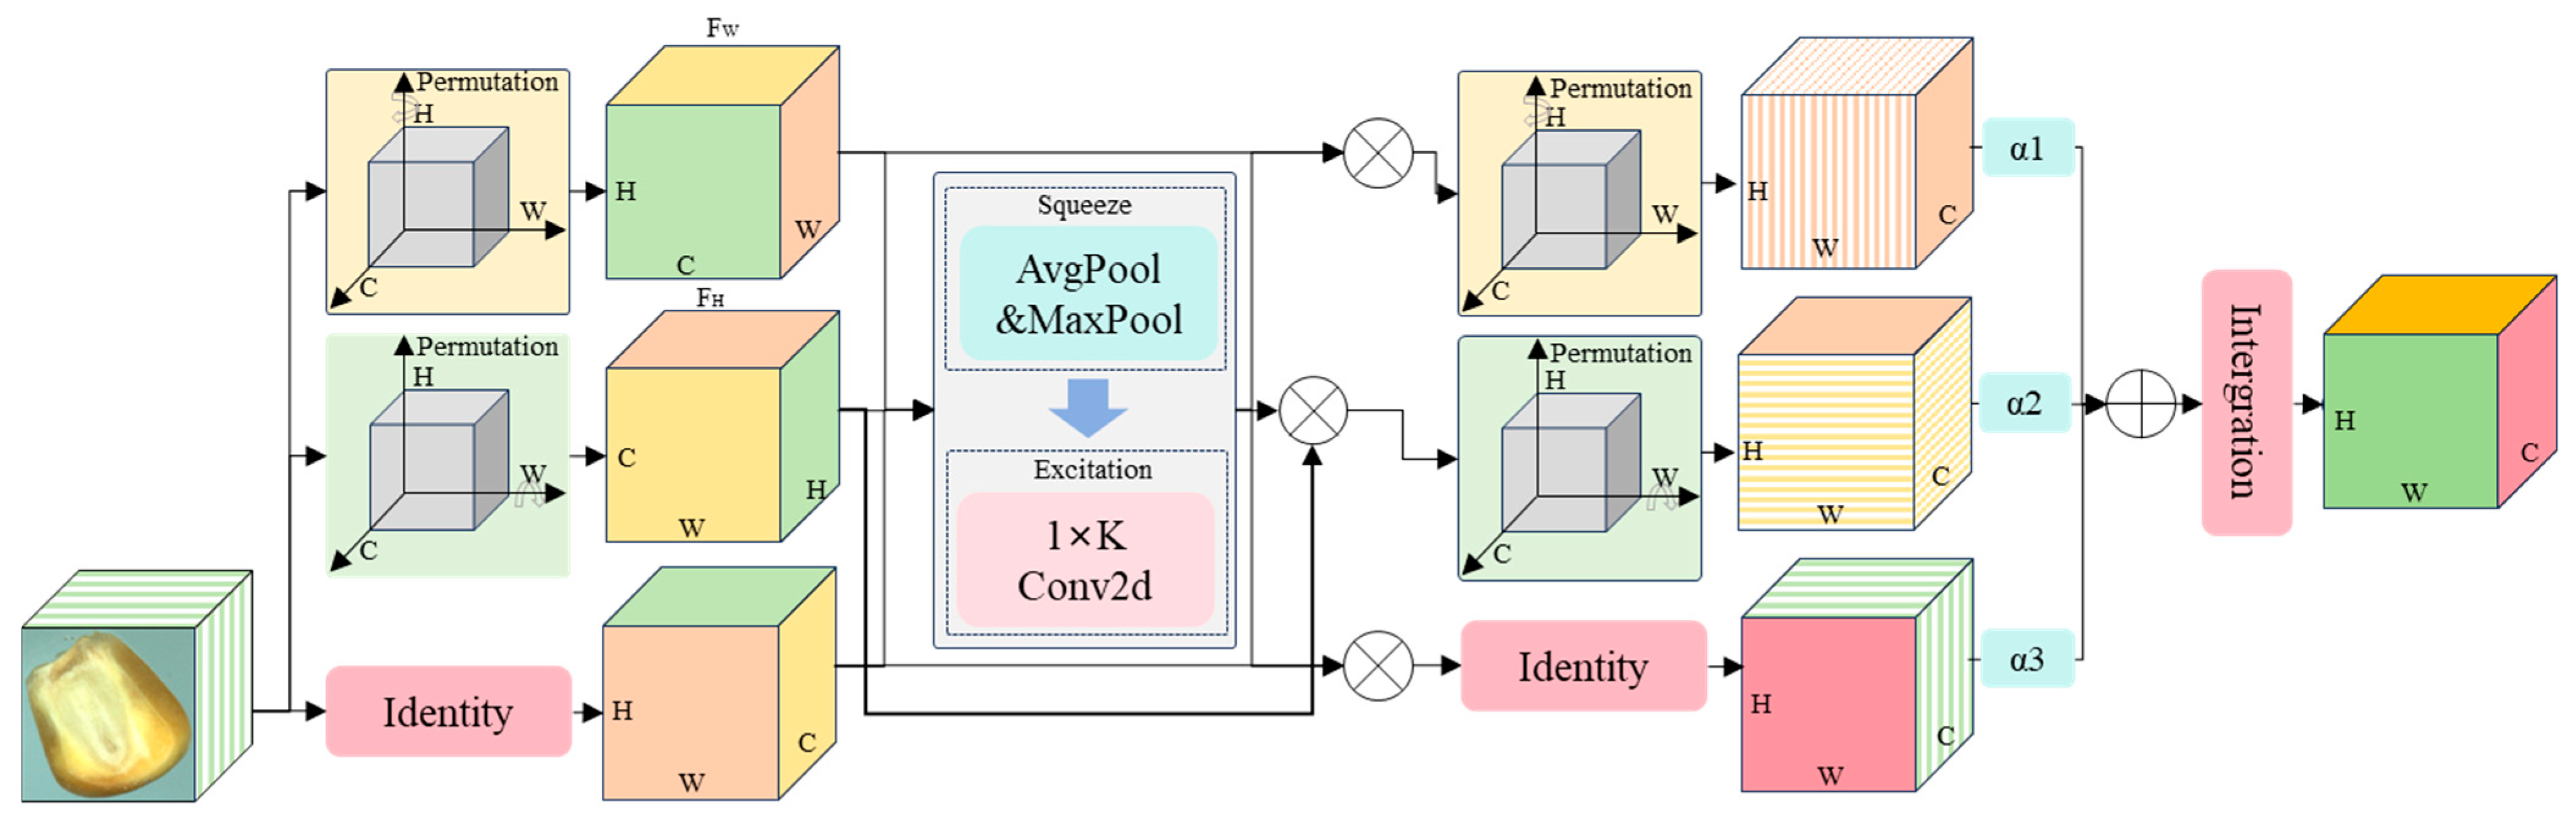
Orthogonal Attention Module (OAM). “⊕” and “⊗” denote feature addition and element-wise multiplication, respectively. The green, yellow, and orange colors indicate feature extraction on the HC, CW, and HW planes along the W, H, and C directions, respectively. Arrows indicate the data flow.
The computational process of the OAM is explained in detail below. First, the feature map is defined as , and then it is fed into the three branches of the OAM module to extract important features, which are computed as follows:
Branch 1: First, the input feature map is rotated 90° counterclockwise along the H-axis to obtain the rotated feature map . The module then undergoes a series of transformations, including Squeeze, Excitation, and the Sigmoid activation function, to obtain the feature weights along the width direction. During the compression phase, average pooling and max pooling features are effectively fused to enhance the statistical representation ability of the features and aggregate the input information, thereby improving the information interaction between features and the completeness of the output features. Next, the excitation transformation uses an adaptive mechanism to determine the interaction range, capturing local dependencies along the channel dimension and further enhancing the semantic modeling ability of the features. Finally, by element-wise multiplying the generated width direction weights with the original feature map, followed by a clockwise rotation operation, the feature map is reconstructed and enhanced, resulting in an output feature map with richer information and stronger expressive power, which is defined as follows:
Branch 2: The input feature map is rotated 90° counterclockwise to obtain the feature map . is then sequentially passed through the Squeeze, Excitation, and Sigmoid activation functions. Afterward, the enhanced feature map is rotated 90° clockwise to obtain a feature map with the same shape as the initial input, which is defined as follows:
Branch 3: An identical feature map is generated through an identity mapping. is then sequentially passed through the compression transformation, excitation transformation, and Sigmoid activation function to obtain specific channel attention weights. By performing element-wise multiplication between the feature map and the channel attention weights, followed by a secondary identity mapping, the more information-rich output feature map is obtained, which is defined as follows:
Equations (4)–(6) are defined as follows, where denotes a 90° counterclockwise rotation along the H-axis, denotes a 90° clockwise rotation along the H-axis, denotes a 90° counterclockwise rotation along the W-axis, denotes a 90° clockwise rotation along the W-axis, represents the Sigmoid activation function, and and correspond to the Squeeze and Excitation transformations, respectively. Additionally, denotes the identity mapping function.
Finally, by averaging the output of the attention weights generated by the three branches across different dimensions, deeper feature information can be extracted across channels, leading to more accurate localization and recognition of the target. The augmented feature maps , and generated from the three branches are fused effectively. Specifically, ⊗ represents element-wise multiplication with broadcasting, and ⊕ represents element-wise addition with broadcasting. , and are used to adjust the weights of the three branches. Ultimately, a weighted average is performed to aggregate the outputs from all three branches, resulting in a feature map with rich semantic information, which is defined as follows:
Inspired by the idea of cross-dimensional information interaction, this paper proposes an improved, lightweight, and efficient multi-dimensional collaborative attention module that integrates information from three orthogonal methods. Without adding extra network parameters, the module effectively helps the network learn key information from the input feature map, thereby enhancing the model’s feature representation capability. Especially in small object segmentation, where the background is complex and the object size is small, the collaborative attention mechanism can significantly improve the segmentation ability of the target area and effectively suppress background interference. By explicitly modeling orthogonal feature interactions, OAM differs from conventional collaborative attention mechanisms and achieves efficient information selection without additional computational cost.
2.5. Local Contrastive Loss
2.5.1. Cross-Supervised Learning
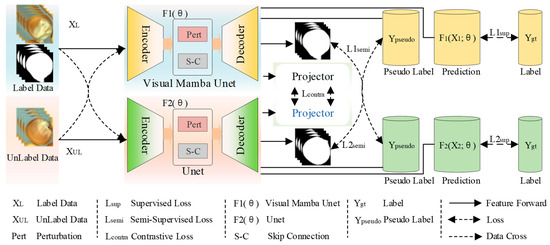
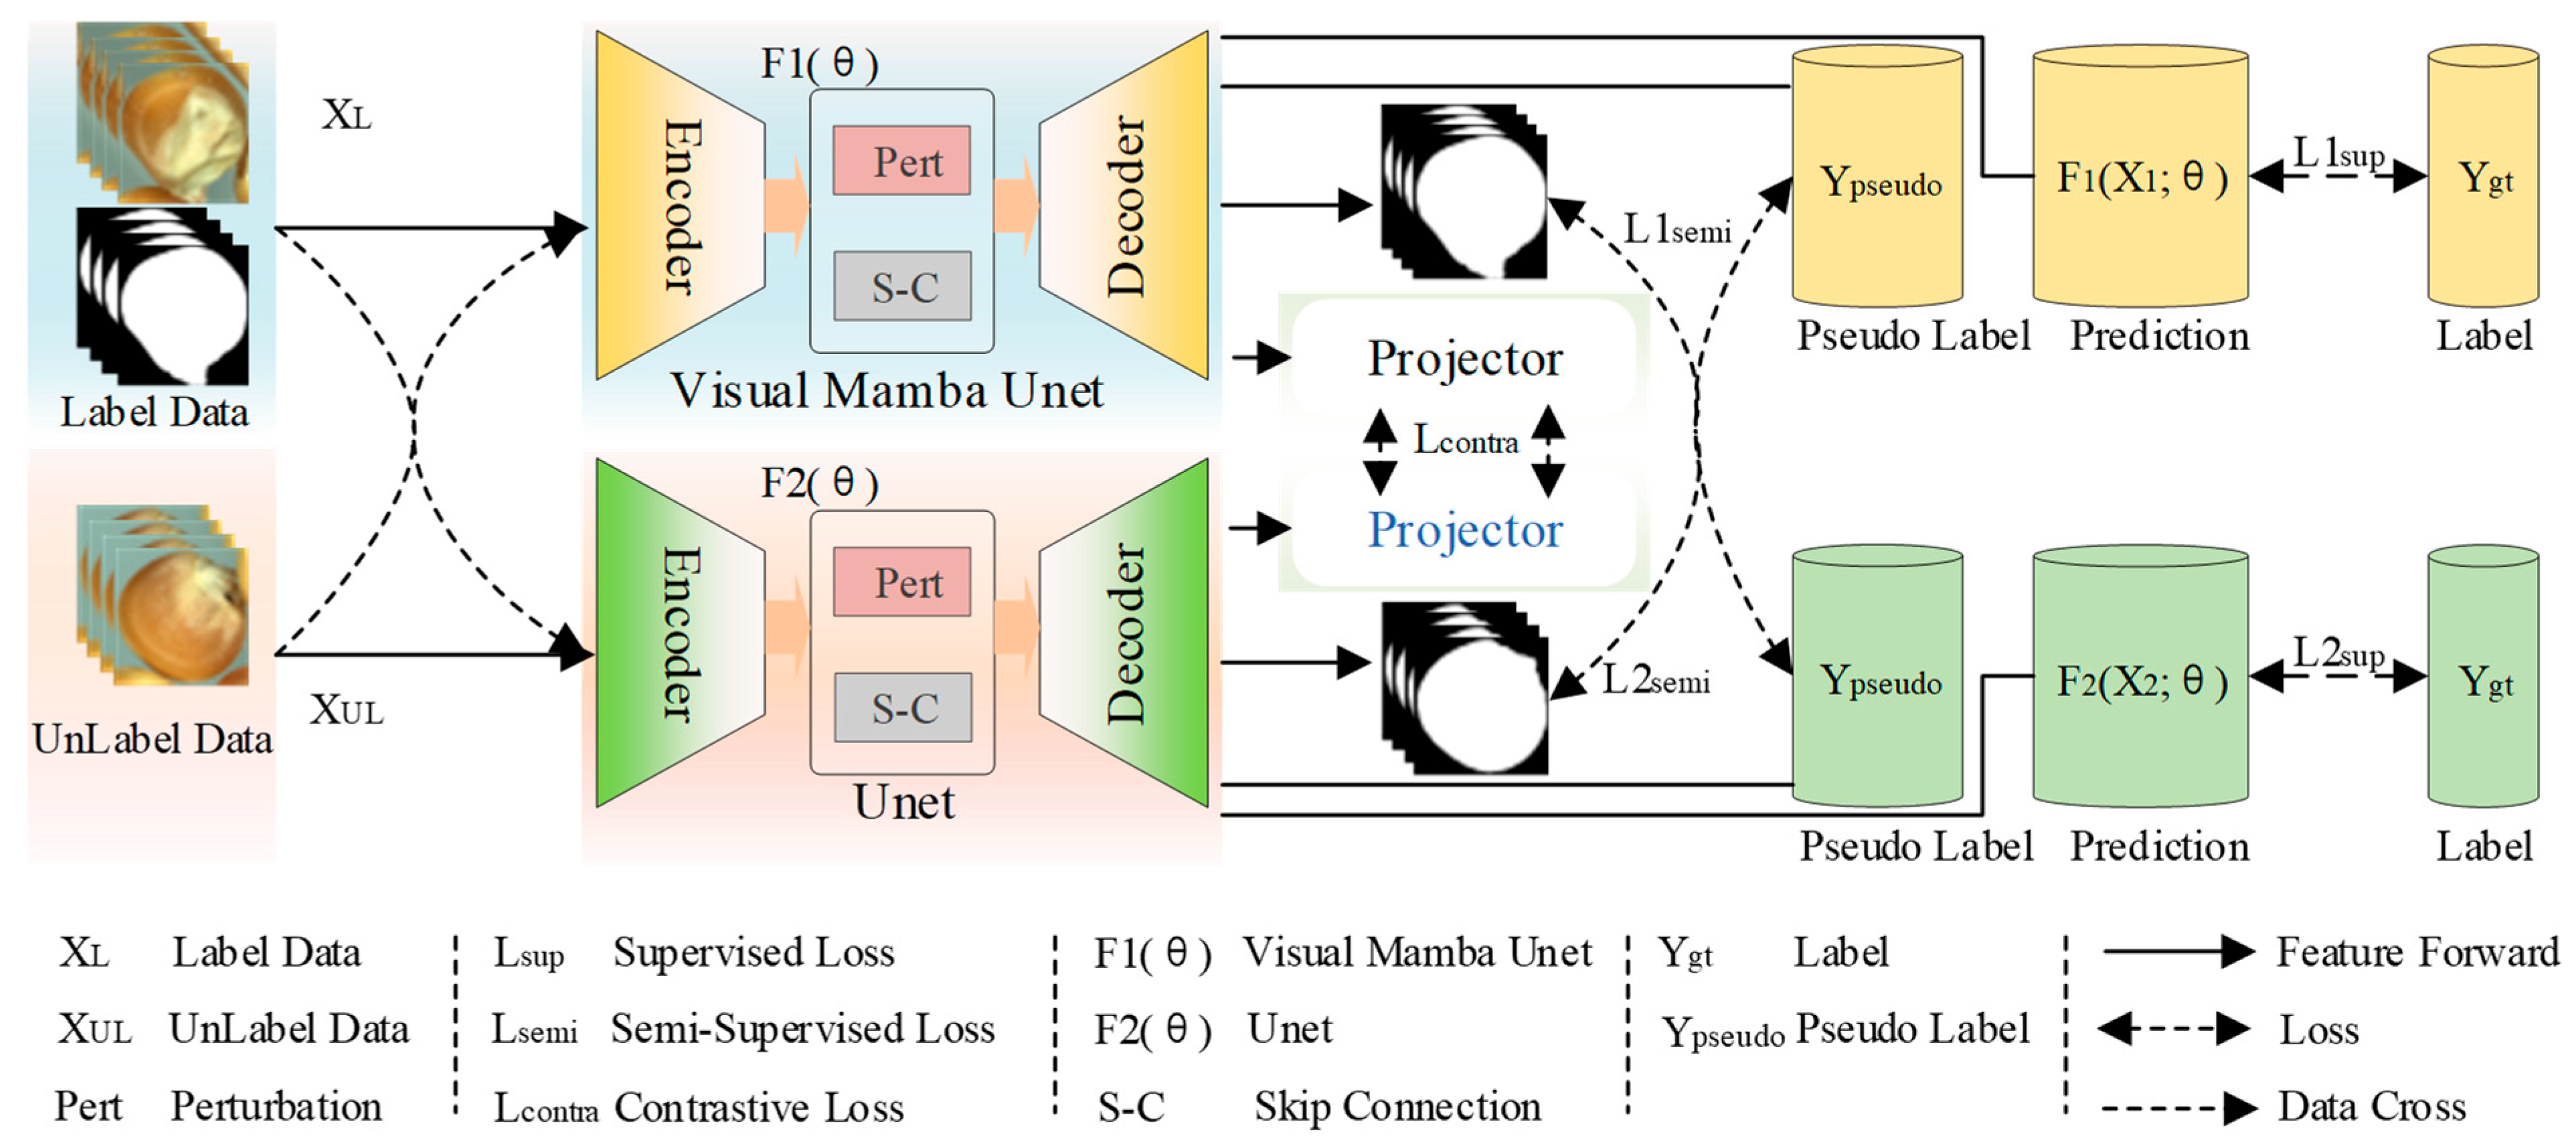
The attention mechanism enhances the model’s ability to express target features by focusing on key areas. However, relying solely on feature enhancement is not sufficient to ensure model accuracy. Therefore, combining a well-designed loss function helps guide the network to more accurately optimize boundary, region, and semantic information during training, ultimately improving the final segmentation or recognition performance. The framework of OAMamba is shown in Figure 3.
Figure 3.
Framework for consistency regularization and Local contrastive loss for semi-supervised corn seed segmentation.
denotes the training dataset containing label. denotes the unlabeled training dataset. denotes the test dataset containing label. denotes a two-dimensional grayscale image with height h and width w. denotes four types of segmentation templates containing markers with pixel values from 0 to 3. The segmentation template predicted by the segmentation network given is and is the parameter. VMamba-Unet and UNet are denoted by and , respectively. The prediction of a network can be viewed as a pseudo-label that extends the unlabeled dataset to to train another network. A pair of projectors is introduced in each network to extract features from the training set for comparison learning. The overall loss is categorized into supervised loss , semi-supervised loss and self-supervised contrast loss . Evaluation is performed by measuring the difference of in the test set. The training objective is to minimize the total loss minimum by updating the network parameters , denoted as:
For all symbols in Figure 3, dashed lines indicate for loss, where is the supervised loss of the training set containing markers for and . The design of combines the Dice coefficients and the cross-entropy (CE) loss as follows:
where , and are semi-supervised losses based on the unlabeled training sets and . The predictions of the networks are considered to be pseudo-labels to extend the unlabeled data , and the other network is retrained. is the self-supervised comparative learning loss, and we propose a Projector pair to extract features between the predictions of the two networks.
2.5.2. Contrastive Learning
Contrastive learning has become a powerful framework for learning robust and discriminative features, representing a significant advancement in self-supervised learning [41]. The core idea behind contrastive learning is the discrimination between positive and negative samples. Positive and negative samples are constructed based on prior knowledge and mapped into a feature embedding space. A metric function is then applied to bring positive samples closer together while pushing negative samples further apart. This approach has demonstrated remarkable success in a wide range of applications [42,43,44].
Contrastive learning has proven to be an effective approach in image analysis, addressing the challenges of sparse annotations and significantly improving feature extraction, which in turn enhances model performance [45,46]. Recent methods typically generate positive and negative samples by applying different perturbations to the same sample or using multiple encoders, emphasizing the variability within the samples. To better capture the pixel-level differences between samples, we propose a novel contrastive learning method.
Given the small size of the corn seed dataset and the prevalence of background pixels, the consistency of these background pixels has minimal impact on network training. To address this, adaptive mean pooling is used to filter out irrelevant background pixels, thereby enhancing the focus on the target region. Additionally, L2 regularization is applied along the channel dimension to sparsify the features, improving the model’s resilience to perturbations. Similarity evaluation is conducted as described in [47], formalized as follows:
2.5.3. Consistency Regularization
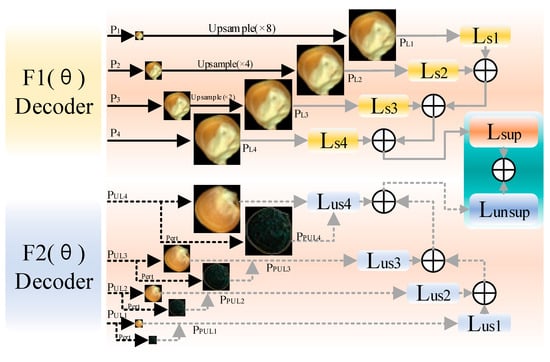
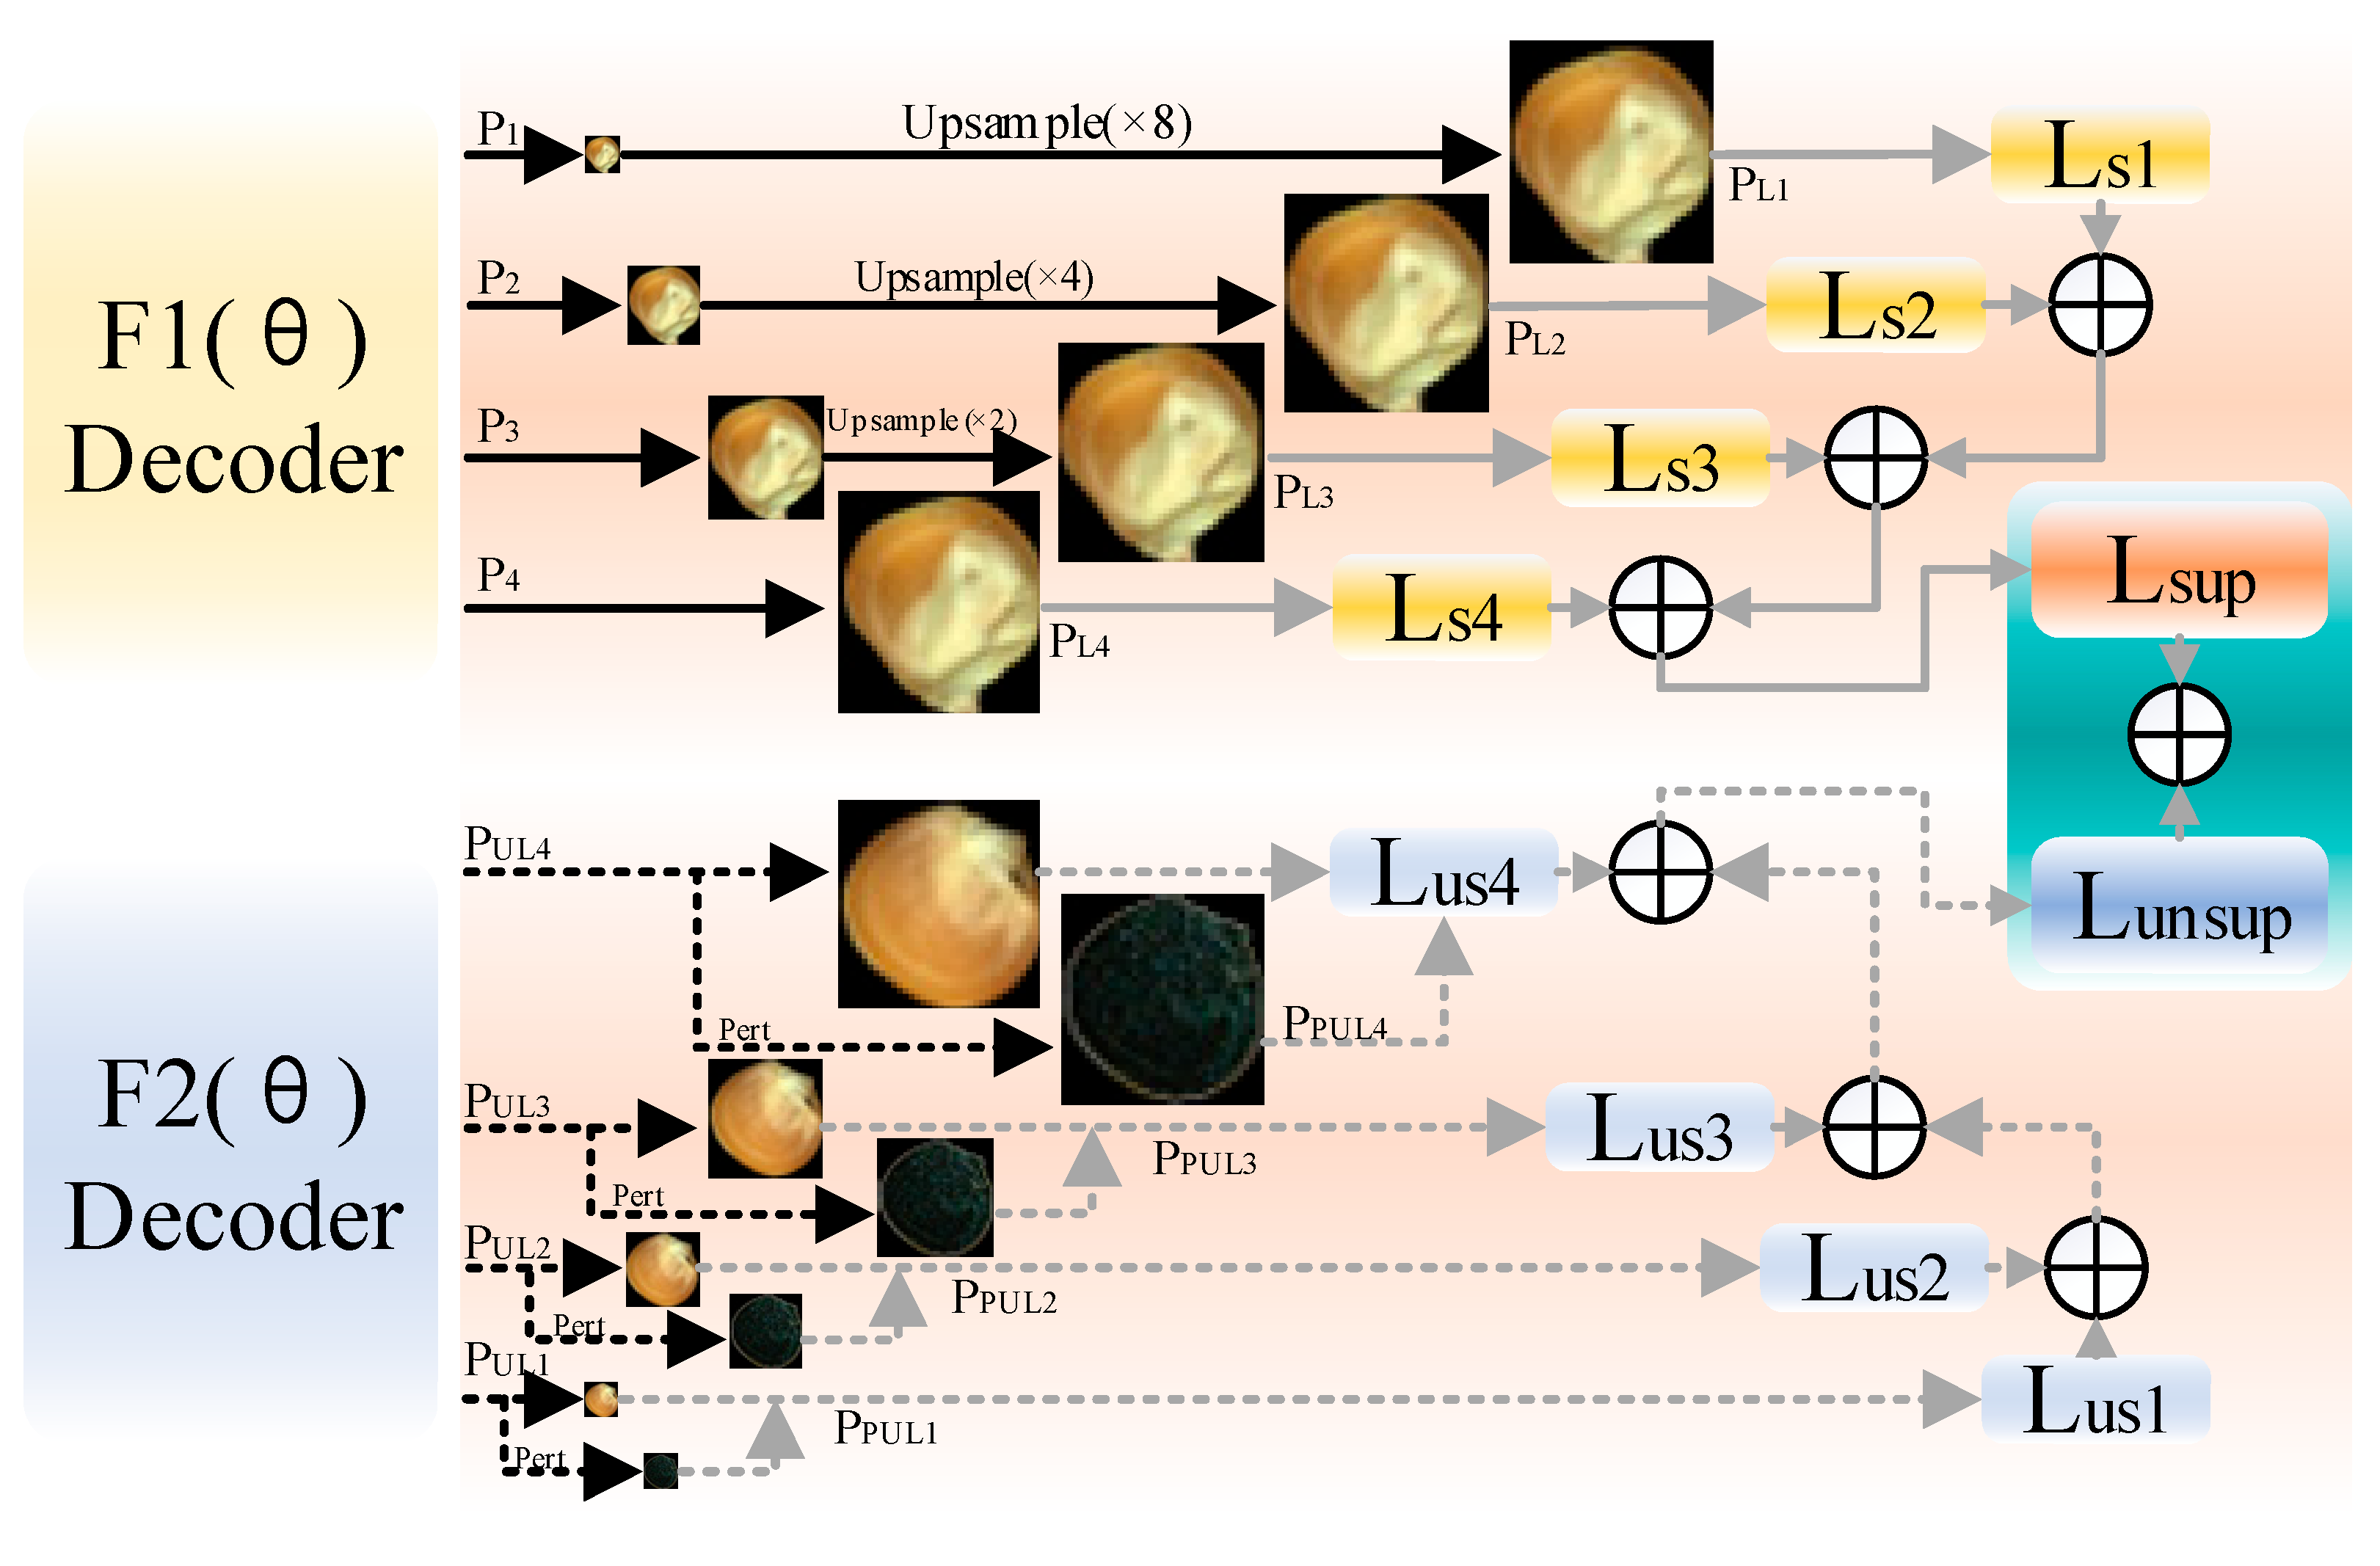
Inspired by the principle of consistency regularization and multi-view learning, the self-supervised comparison learning loss in Figure 3 is jointly composed of the multi-scale supervised loss and the multi-scale unsupervised loss , and the computational process is shown in Figure 4, where denotes the different scale prediction results of the decoder with the supervised branch, denotes the prediction results after up-sampling, denotes the different scale loss of the supervised branch, and denotes the loss of the supervised branch. Pert is the perturbation, denotes the different scales of prediction of the decoder of the unsupervised branch, denotes the different scales of prediction of the decoder of the unsupervised branch after the perturbation, denotes the different scales of the unsupervised branch with the total loss, and denotes the unsupervised branch with the total loss. Two independently initialized networks generate and exchange pseudo-labels for mutual supervision; this study takes advantage of the complementary strengths of the different architectures. One network uses augmented data as a supervisor for the other network for semi-supervised learning.
Figure 4.
Illustration of contrastive loss function computation. “⊕” denotes feature addition, and arrows indicate the data flow. The upper orange–red region represents the supervised decoding module, while the lower light-blue region corresponds to the unsupervised learning module.
We introduce a simple yet effective cross-supervised learning strategy that enables VMamba-Unet and UNet to directly assist each other. is denoted as:
where , is used for pixel-level segmentation, and the supervised loss is partially based on the cross-entropy loss, calculated as:
where denotes the amount of training data, denotes the true label of the sample , and denotes the predicted output of the sample . Since this study employs a multi-scale output training strategy, the loss between the predicted labels at different scales and the ground truth labels is first computed. Then, these losses are combined into a multi-scale supervision loss , as shown in the following formula:
In the formula, is used to compute the loss between the predicted output and the ground truth labels , where represents the supervision loss at the l-th layer, and represents the label at the l-th layer. Consistency serves as a constraint on the model, by predicting the same distribution for perturbed data outputs. Many breakthroughs in semi-supervised learning are achieved based on consistency regularization. Consistency regularization enables the model to acquire more high-dimensional feature information from unlabeled data. Additionally, consistency constraints enhance the model’s robustness to interference. A well-designed loss function not only improves the model’s training efficiency but also ensures the consistency between feature learning and the final prediction results, laying a solid foundation for the overall system performance.
3. Results and Discussion
3.1. Experimental Preparation
All experiments were conducted using Python 3.8 with PyTorch 2.0.0 as the deep learning framework. The hardware setup included an NVIDIA GeForce RTX 3060 GPU and an Intel Core i7-12700K @ 3.60 GHz CPU. We employed Stochastic Gradient Descent (SGD) as the optimizer, with a batch size of 4 and a momentum of 0.9. A polynomial learning rate schedule was used, starting at 0.001 with a power factor of 2. The model was trained for 100 epochs. To mitigate overfitting, L2 regularization was applied with a weight decay of 0.001. Model performance was evaluated on the validation set every 100 iterations, and the best-performing checkpoint was selected for final testing. All baseline models and the proposed OAMamba were trained under the same hyperparameter settings, including the segmentation architecture, optimizer, learning rate, batch size and number of iterations, to ensure fair and consistent comparisons.
3.1.1. Datasets
To evaluate the effectiveness of the proposed model, three datasets of corn seed images were utilized: 20,000 low-quality images (LQD), 30,000 middle-quality images (MQD) and 50,000 high-quality images (HQD). The detailed distribution of these datasets is presented in Table 1. The quality levels were determined based on image resolution, noise levels and illumination conditions: LQD samples contain motion blur, low resolution and significant background noise; MQD samples exhibit moderate clarity and noise; HQD samples are well-illuminated, high resolution and captured under controlled environments.
Table 1.
Dataset distribution.
Prior to model training, all raw images and corresponding labels were preprocessed, including center cropping to 256 × 256 pixels, normalization of pixel values to the [0, 1] range, and label encoding for segmentation tasks. Each dataset was randomly split into training, validation, and test subsets in a 7:2:1 ratio to ensure fair evaluation and generalization. Corn seeds in our dataset were classified according to the National Standard of the People’s Republic of China (State Administration for Market Regulation and China National Standardization Administration, 2018) into normal kernels (NORMAL, NOR) and abnormal kernels, with the latter further divided into six subtypes: wilted (FUSARIUM, FM), sprouted (SPROUTED, SD), moldy (MOULDY, MY), broken (BN), pest-damaged (ATTACKED by PESTS, AP), and black point (BP). To support robust semi-supervised training, pseudo-labels for unlabeled samples were filtered using a confidence threshold (e.g., 0.9), with low-confidence predictions either ignored or weighted in the consistency regularization loss. Class imbalance among abnormal kernel subclasses (BN ≈ 15%, FM ≈ 10%, SD ≈ 5%) was addressed via class-balanced sampling and loss weighting, ensuring that under-represented classes contributed adequately to gradient updates.
3.1.2. Evaluation Index
In this paper, we employed several evaluation metrics, including Dice Similarity Coefficient (DSC), Intersection over Union (IoU), F2-Score (F2), Precision (PRE), Recall (RE) and Hausdorff Distance (HD), to quantitatively assess the results. All results are averaged from five-fold cross-validation.
The F2-Score balances precision and recall, with a greater emphasis on recall. Hausdorff Distance (HD) measures the spatial distance between the predicted and true label boundaries, with smaller values indicating more accurate boundary alignment.
where P denotes the predicted value, G denotes the true labeled value, is the distance paradigm, p is the element in set P, g is the element in set G, and are the unidirectional HD distances from set P to set G and from set G to set P, respectively, and is the calculation of the HD distances between the two sets P and G. The above metrics can more intuitively reflect the performance of the model in the segmentation task.
3.2. Main Results
In this section, we systematically evaluate the performance of the proposed OAMamba on the corn seed image segmentation task and conduct comprehensive comparisons with state-of-the-art methods. To meet the input requirements of U-Net and VMamba-UNet, all images are uniformly resized to 224 × 224 pixels. The dataset is split with 10% reserved for testing and the remaining 90% used for training and validation.
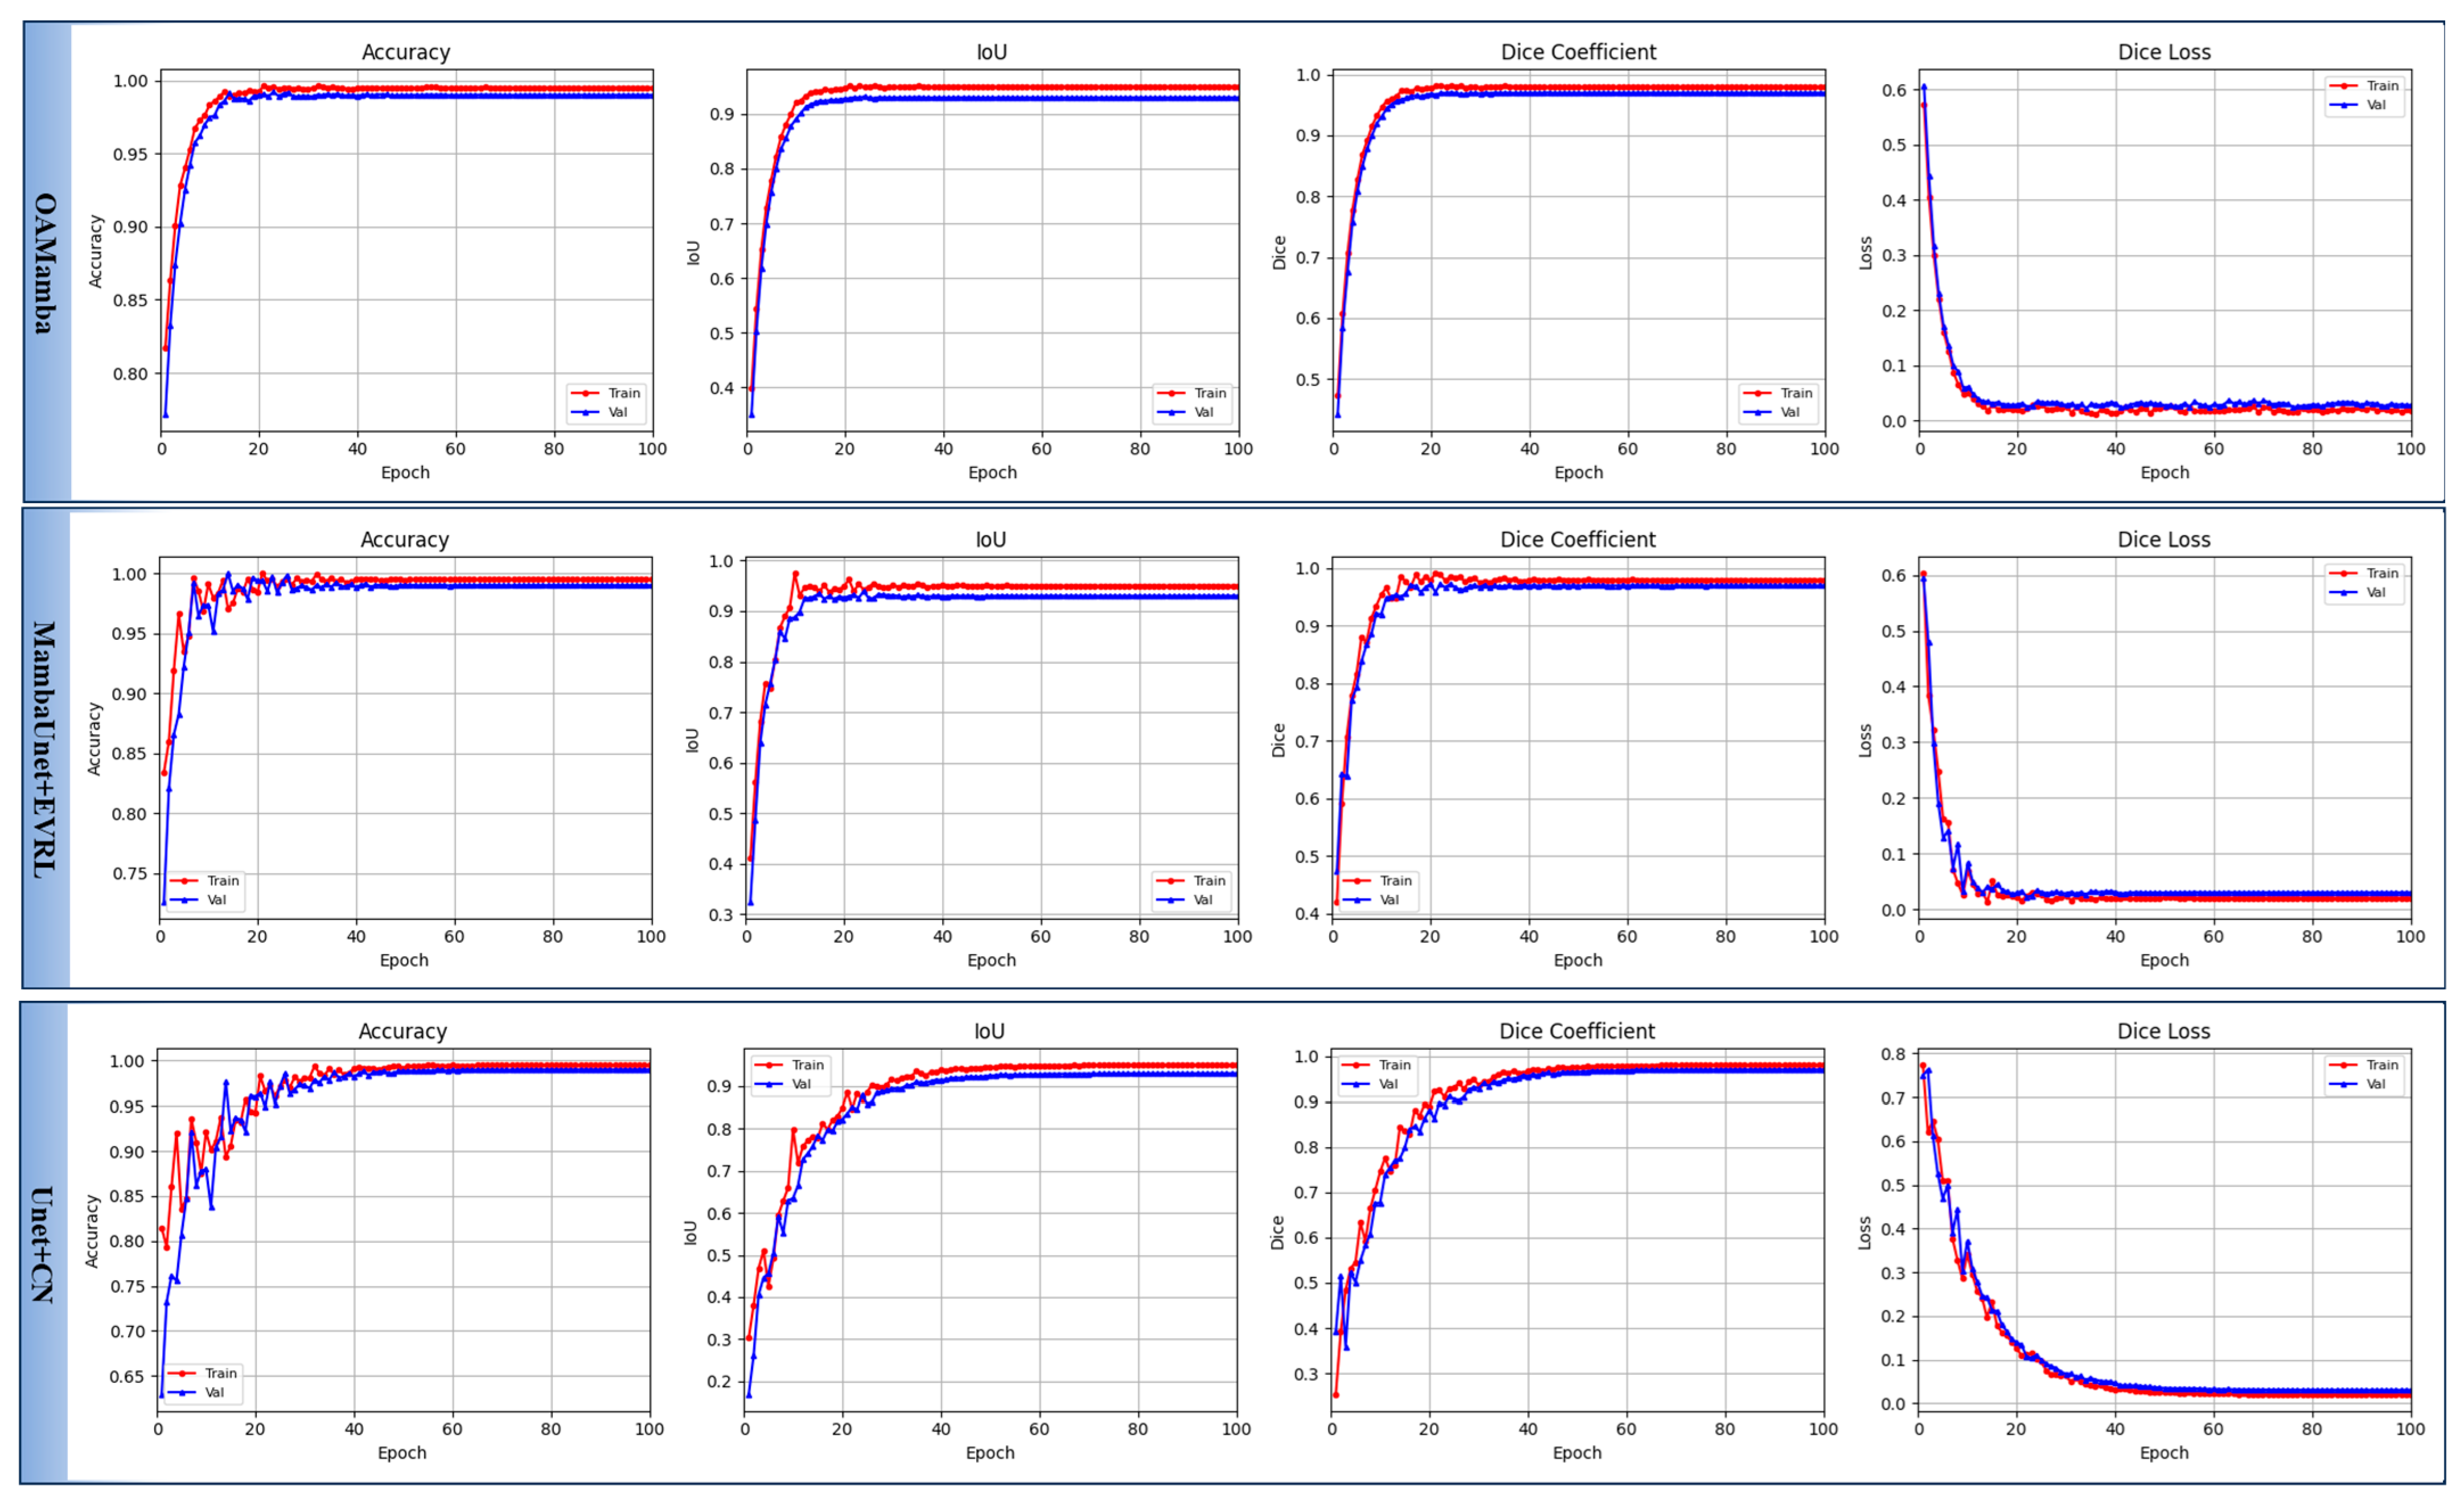
First, comparative experiments are conducted on a single corn seed dataset to verify the effectiveness of OAMamba in terms of segmentation accuracy and stability. Subsequently, experiments on multiple corn seed datasets are performed to further assess the generalization capability and robustness of the proposed method. In addition, a series of carefully designed ablation studies are carried out to systematically analyze the contribution of each key component to the overall performance improvement. Unless otherwise specified, the proportion of labeled data is fixed at 50% in all experiments. To further highlight the advantages of OAMamba, the convergence behavior of different methods during training is also compared. As shown in Figure 5, OAMamba achieves superior training and validation performance in terms of accuracy, Intersection over Union (IoU), and Dice coefficient, while exhibiting faster convergence and significantly lower final loss values compared with Mamba-UNet and U-Net. These results convincingly demonstrate the effectiveness and advanced performance of the proposed method in corn seed segmentation tasks.
Figure 5.
Plot of loss function variation during model training.
3.2.1. Baseline Segmentation Networks
To evaluate the advantages of the OAMamba method, we compare the convergence speeds of both models during training. The model is trained for 100 epochs, the loss function variation curve on the middle quality dataset is shown in Figure 5. As observed, the proposed method converges faster and achieves stability more quickly.
3.2.2. Qualitative Results
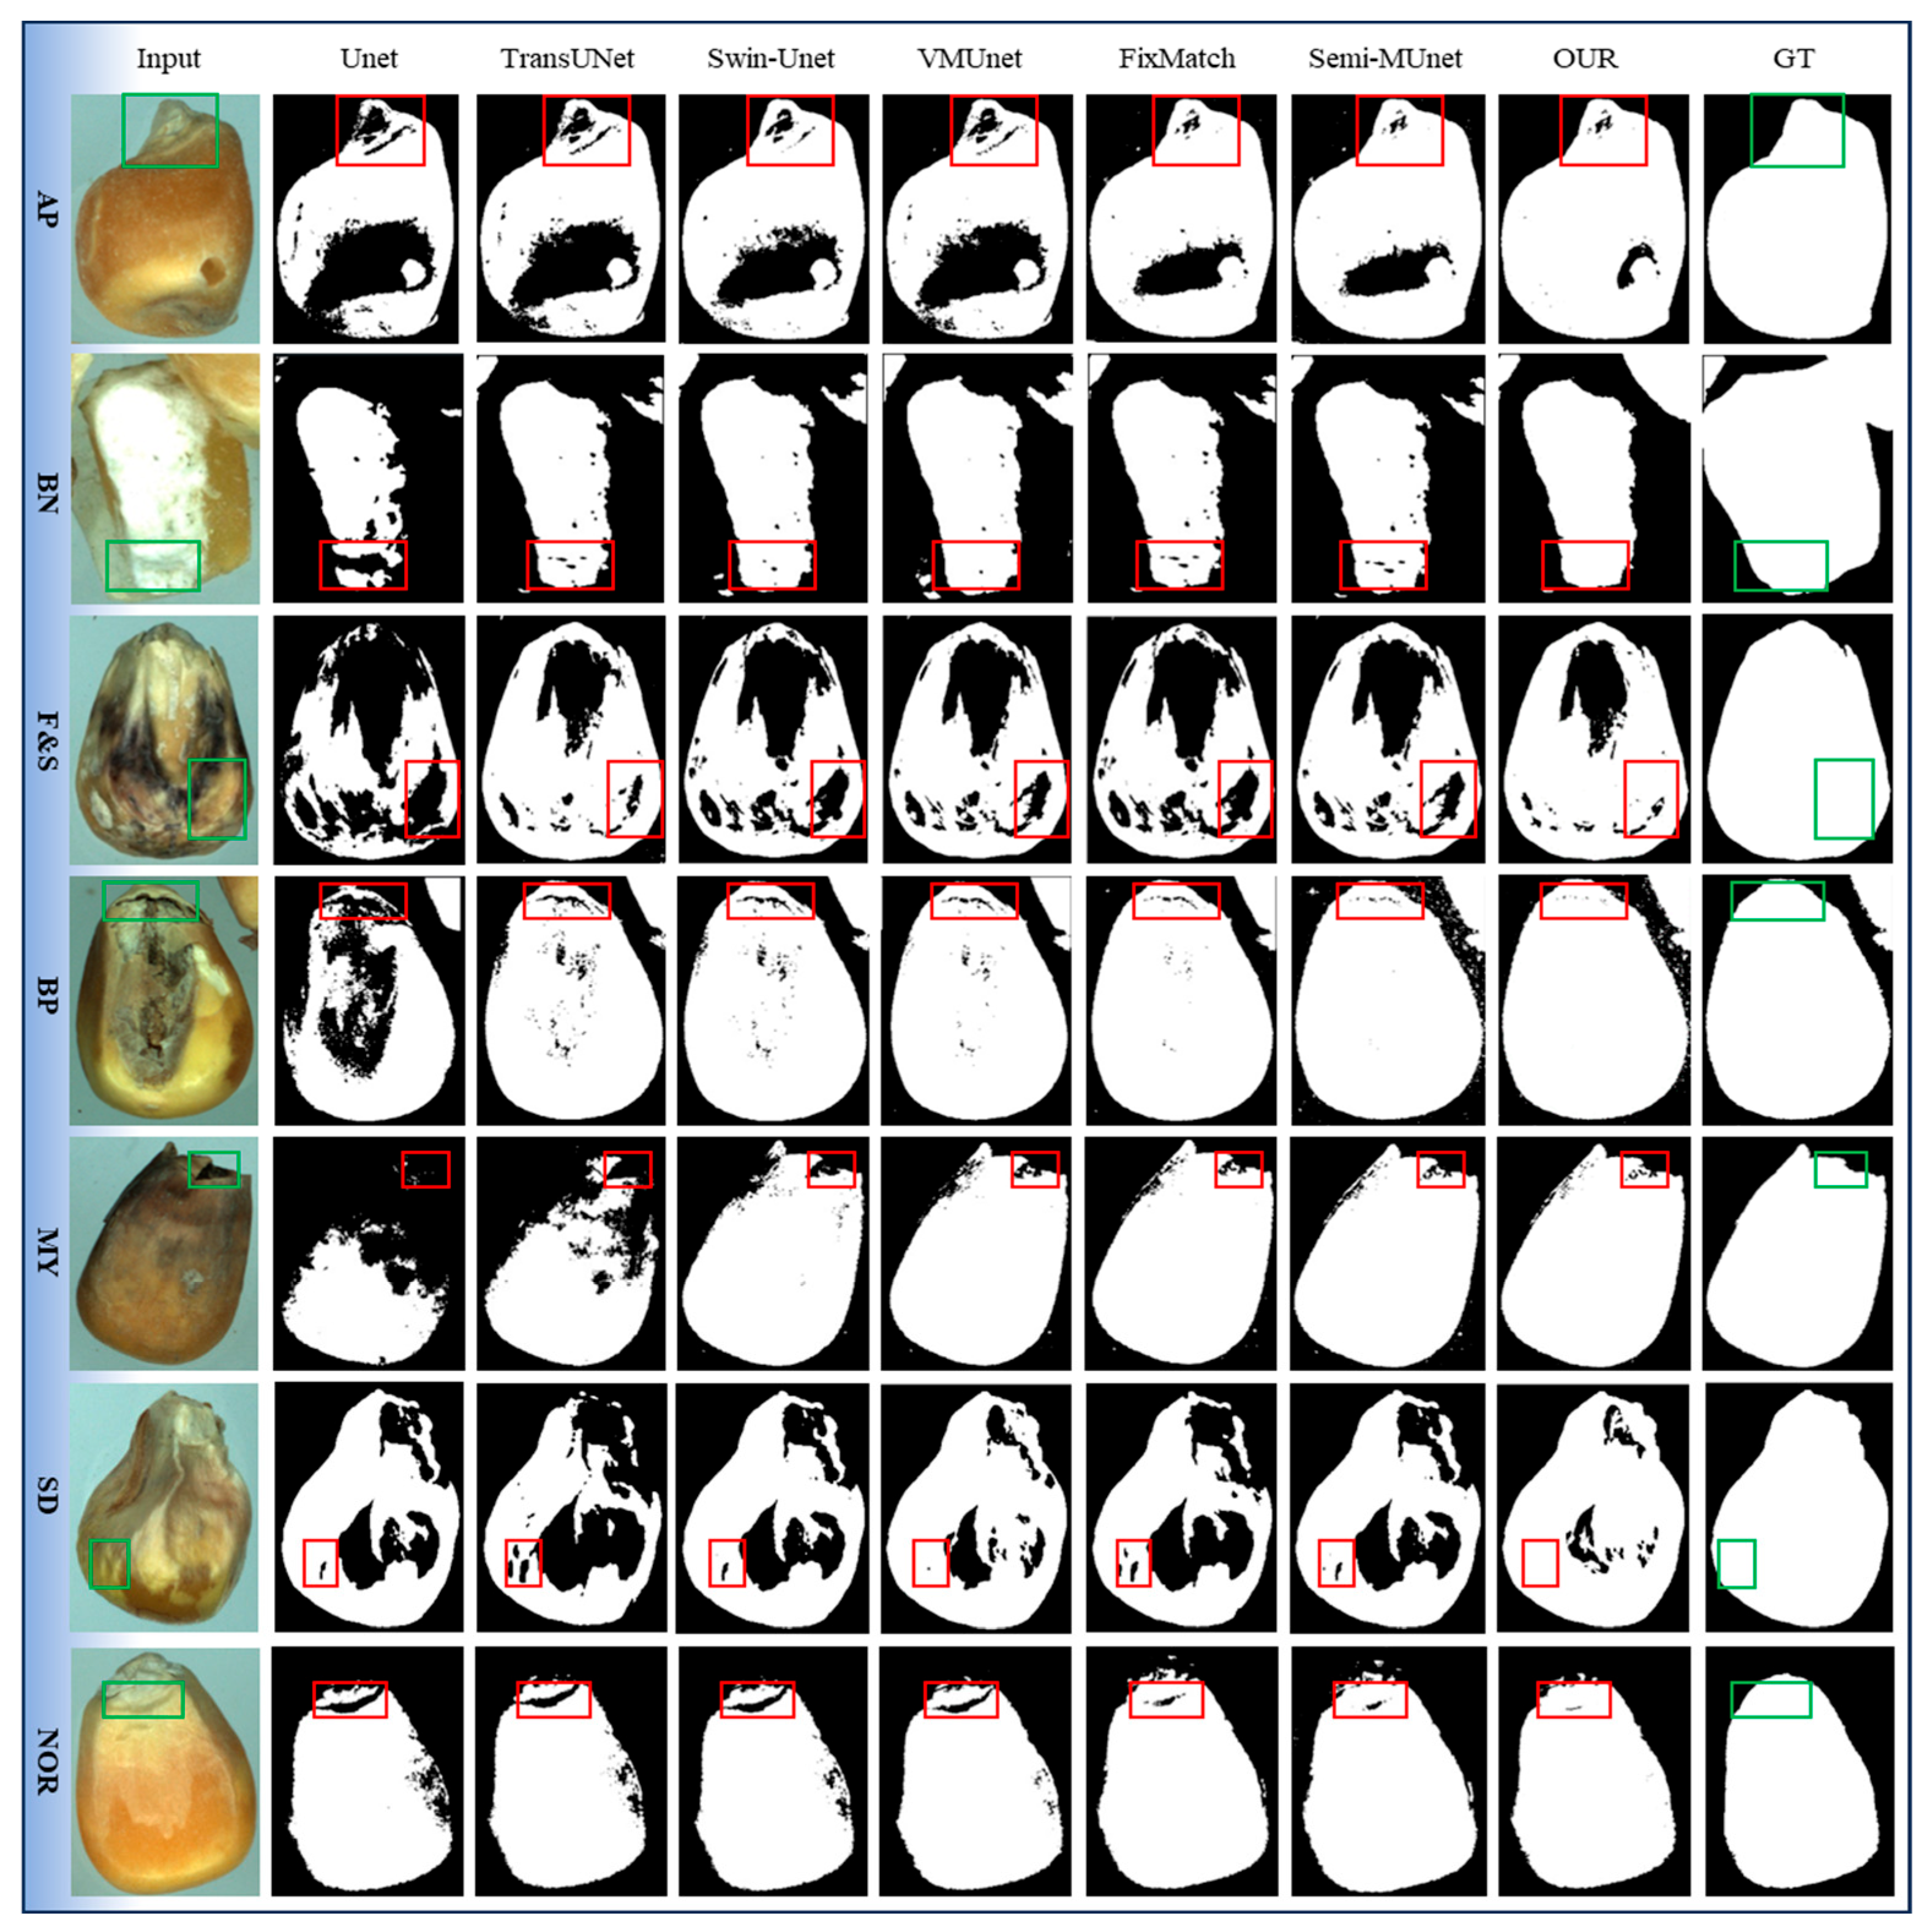
This section demonstrates the performance of OAMamba for corn seed segmentation under various experimental conditions. For a fair comparison, we conducted evaluations using a mid-quality corn seed dataset, which includes one set of normal (NOR) corn seeds and six sets of abnormal (Unsound Corn, UC) kernels. The test results for the seven corn seed datasets, using three baseline methods, are shown in Figure 6.
Figure 6.
Comparison of qualitative results between OAMamba and the existing models on the corn seed segmentation task. To better visualize the differences between segmentation predictions and ground truths, key regions are highlighted using colored bounding boxes. Specifically, the red boxes indicate the same comparison regions across different models, while the green boxes denote the corresponding regions in the ground-truth annotations.
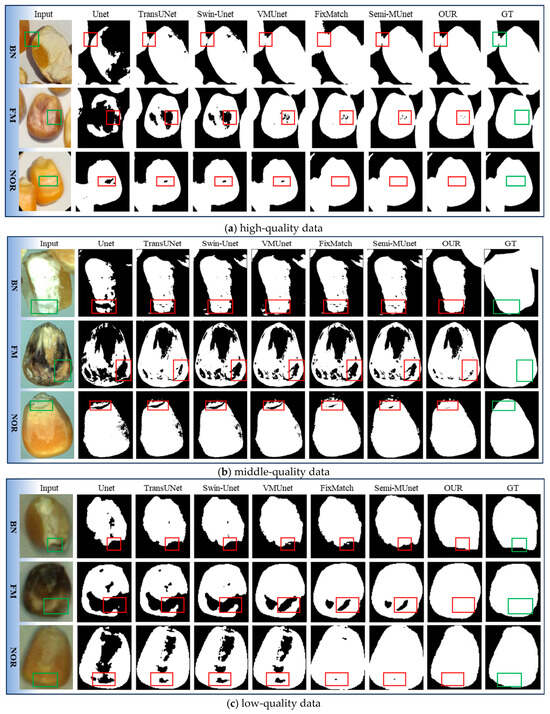
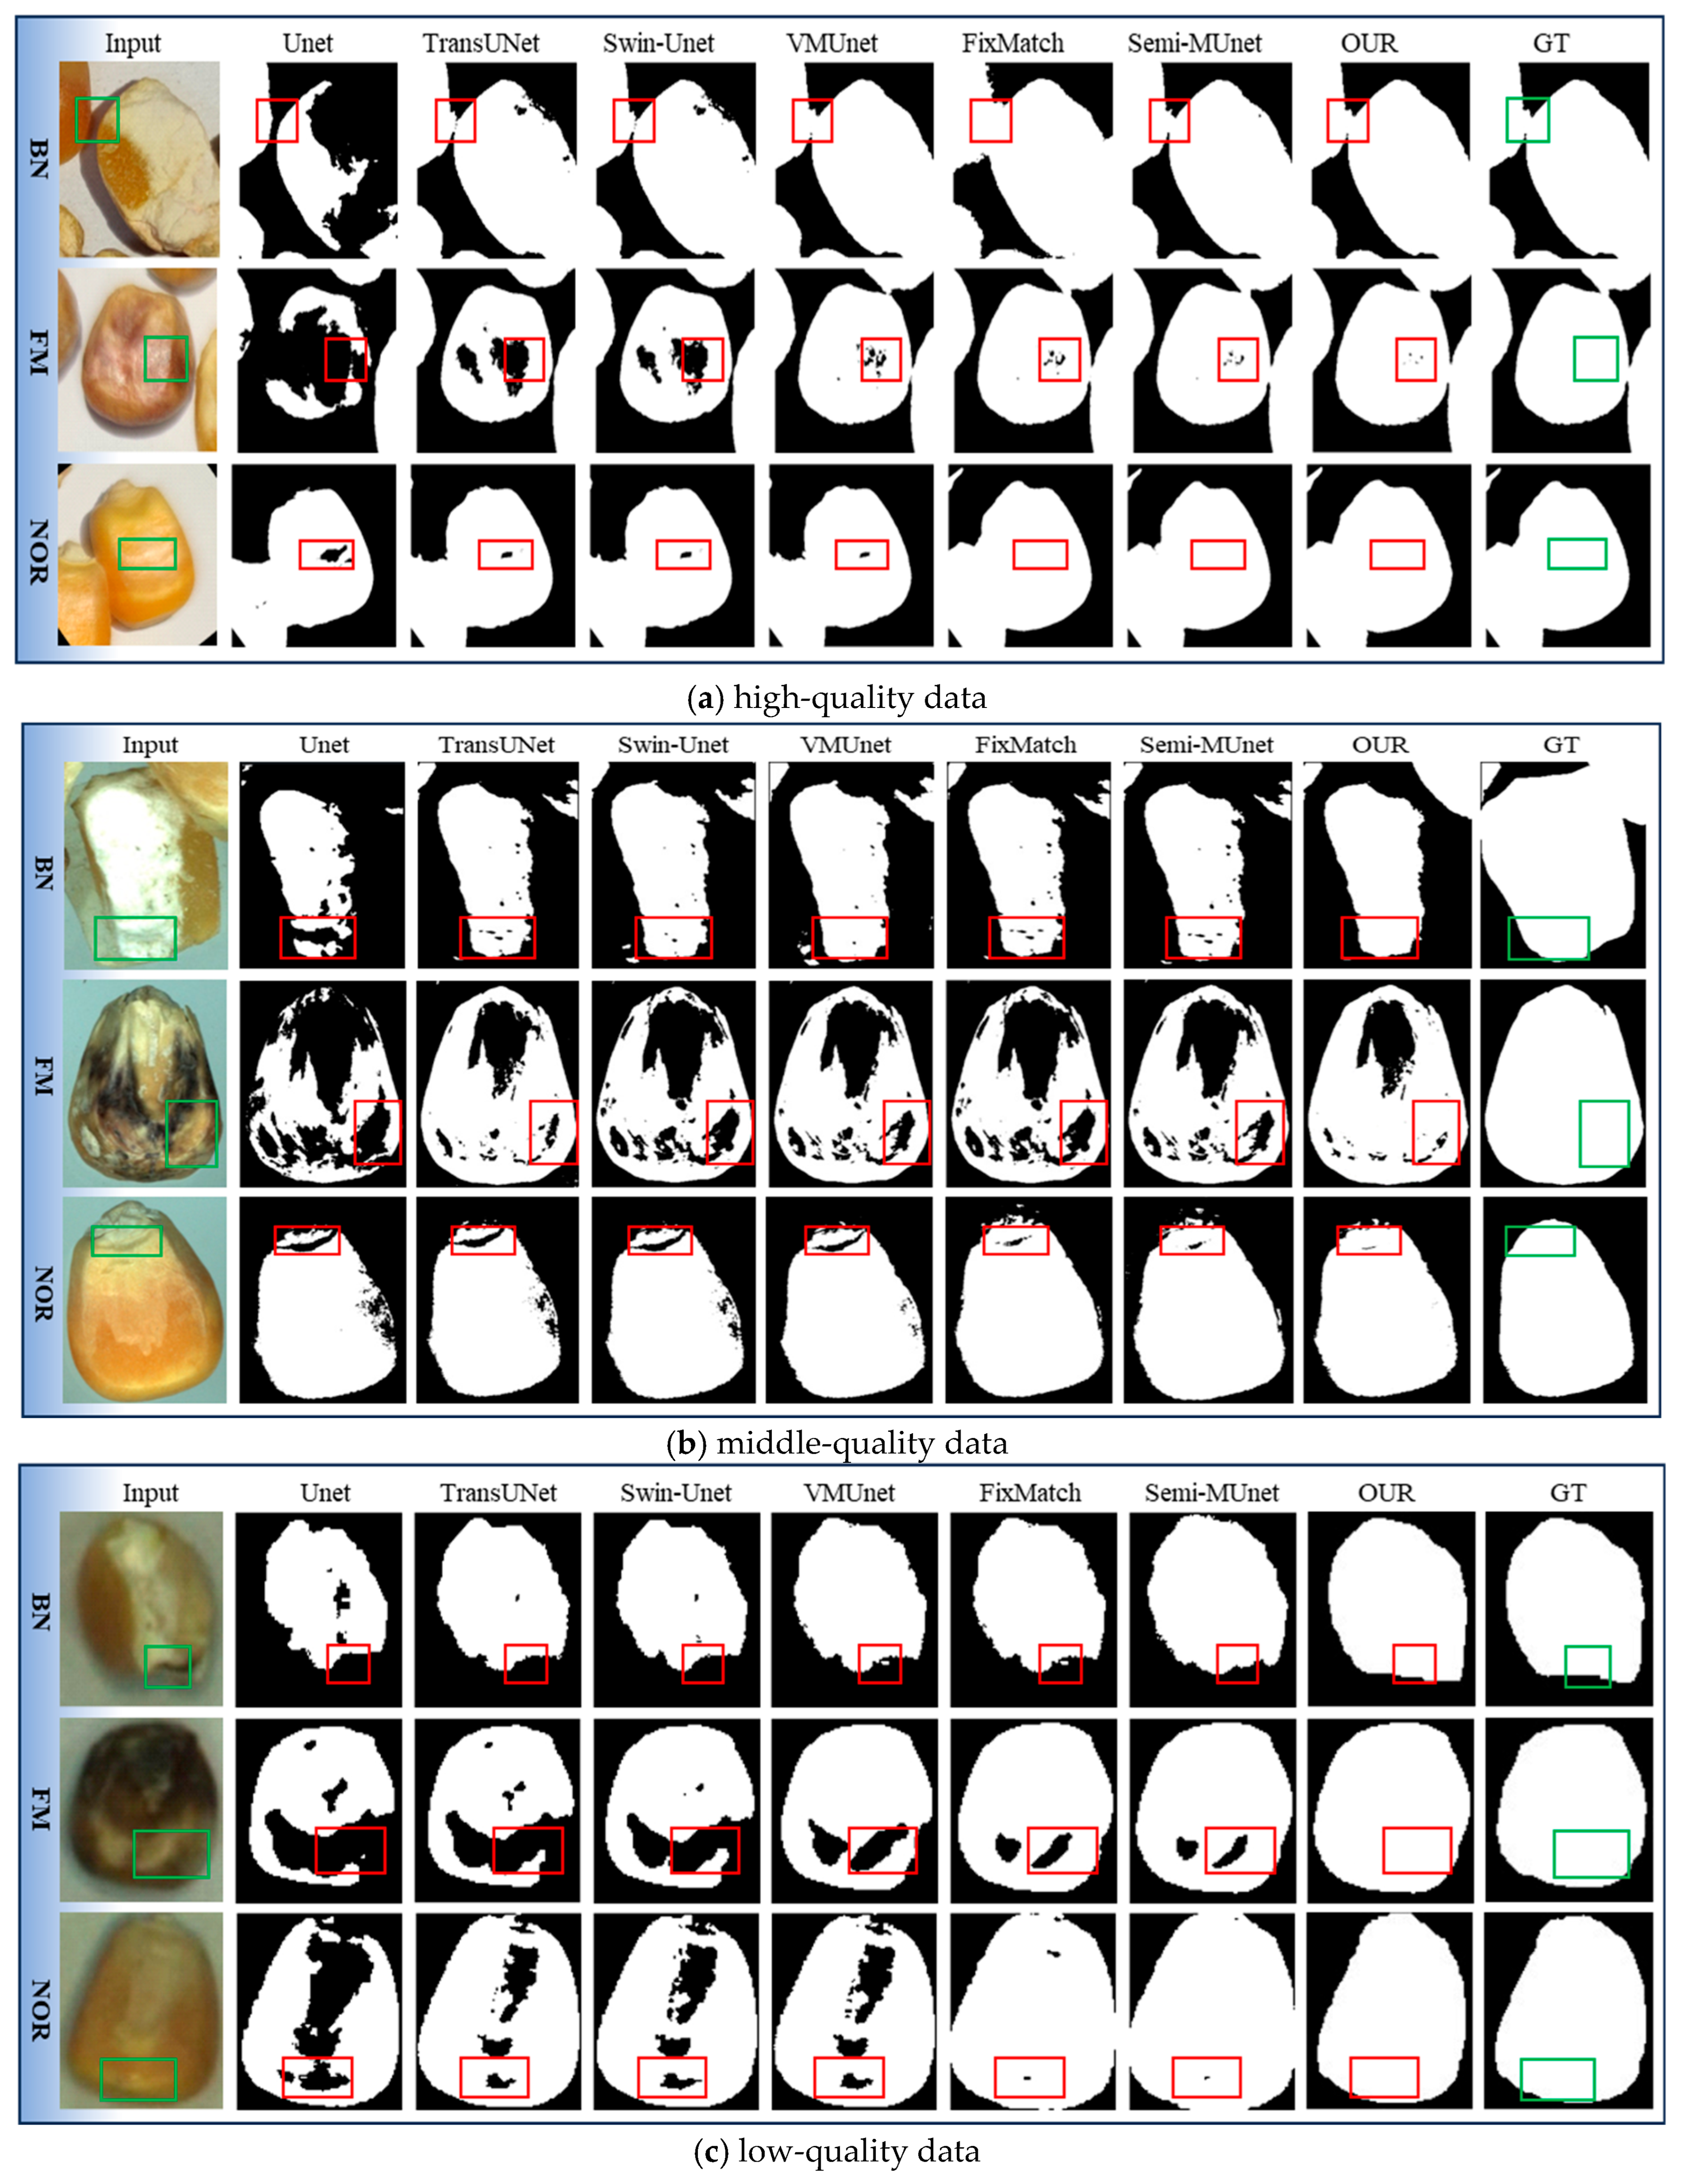
To further assess the generalization performance of the OAMamba method, Figure 7 illustrates the results for corn seeds under varying shooting conditions and three levels of image quality. It displays the predictions from all SSL baseline models, including Unet and several variants of UNet, with a focus on the proposed OAMamba. The dataset is divided into a training set (70%) and a test set (30%) across high-quality, middle-quality and low-quality datasets. These training sets were then labeled with 50%, 30% and 20% of the total data, respectively, for comparison during training.
Figure 7.
Qualitative results of OAMamba on image segmentation tasks with three different quality levels compared with other models: (a) high-quality data (b) middle-quality data and (c) low-quality data. To better visualize the differences between segmentation predictions and ground truths, we highlight the key region with appropriate boxes. Specifically, the red boxes indicate the same comparison regions across different models, while the green boxes denote the corresponding regions in the ground-truth annotations.
Based on the experimental results, we observed that various UNet variants and different semi-supervised learning (SSL) methods achieved varying degrees of success on the corn seed dataset compared to the standard UNet model. Specifically, all baseline methods successfully segmented both normal seed (NOR) and abnormal seed (AP) data. However, for lower-quality abnormal kernel data, the VMamba-Unet model outperformed the UNet-based models. Notably, the TransUNet model performed excellently on most data, with the exception of BN and SD data, where it underperformed. Additionally, SSL-based methods like FixMatch and Semi-MUnet showed strong results across all data, though they performed less well on BN and SD data. Across other independent datasets, the proposed OAMamba method consistently outperformed the other approaches on nearly all data.
As shown in Table 2, the IoU and DSC evaluation metrics are provided for one normal seed and six abnormal seed categories. The first two rows of the table correspond to the benchmark models for the two branches of the OAMamba method: Unet and VMamba-Unet. It is evident that the VMamba-Unet method outperforms the Unet-based method across all test data, yielding higher metrics. The subsequent rows display the mIoU and mDCS metrics for the proposed OAMamba method at various levels of labeled data: 80%, 50%, 30%, 20% and 10%. The results indicate a clear trend: as the percentage of labeled data increases, both mIoU and mDCS improve, with the highest values observed at 80% labeled data. Notably, under the 50% labeled data setting, OAMamba consistently outperforms the fully supervised baseline models (Unet and VMamba-Unet) presented in the first two rows of the table. This superior performance can be attributed to its dual-branch semi-supervised learning architecture: the Unet branch is trained on labeled data, while the Visual Mamba Unet branch leverages pseudo-labels, effectively exploiting information from unlabeled data. In addition, perturbation-aware contrastive learning and consistency regularization enhance feature stability and generalization, and the orthogonal attention mechanism ensures that spatial and semantic features are decoupled and complementary, enabling the model to capture richer and more discriminative representations.
Table 2.
Quantitative results of the corn seed segmentation task. The IoU and DSC metrics are compared across seven different seed categories, with the best results highlighted in bold.
All other methods yield better results overall. In summary, the SSL-based approach achieves superior segmentation performance across all three types of seed data, demonstrating the advantages of semi-supervised learning for this task. This improvement can be attributed to the complementary strengths of the two branches in the network model, which work together to extract multi-source features with greater robustness. The performance of our proposed OAMamba method closely aligns with the true values, outperforming other state-of-the-art methods.
To quantify the computational efficiency of the proposed method, we compared several representative segmentation models in terms of FLOPs, parameter count, and single-image inference time, as summarized in Table 3. The traditional UNet has relatively low parameter count (31 MB) and FLOPs (14.3 GB) with an inference time of 0.012 s, but its capacity for global semantic modeling is limited. Transformer-based models such as TransUNet and Swin-Unet achieve better global feature representation, but their FLOPs, parameter count, and inference time increase substantially, reaching 32.5–42.3 GB FLOPs, 48.6–67.1 MB parameters, and 0.021–0.035 s inference time.
Table 3.
Computational complexity comparison of different segmentation models.
In contrast, state-space modeling-based VMUnet and its semi-supervised variant Semi-MUnet offer improved global–local feature modeling, but their computational complexity and inference time are still higher than those of OAMamba. The proposed OAMamba, incorporating the Mamba architecture and orthogonal attention mechanism, achieves 27.6 GB FLOPs, 33.4 MB parameters, and 0.009 s inference time, significantly reducing computational cost and latency while maintaining high segmentation performance. These results demonstrate that OAMamba achieves an optimal trade-off between pixel-level segmentation accuracy and computational efficiency, making it well-suited for practical deployment in agricultural inspection and large-scale data processing tasks.
3.2.3. Quantitative Results
To evaluate the overall performance of OAMamba, several metrics were used, including mIoU, mDSC, accuracy (Acc), precision (Pre), sensitivity (Sen) and specificity (Spe), with higher values indicating better performance. Additionally, Hausdorff distance (HD) and average surface distance (ASD) were used as measures of difference, where lower values are preferred. For a fair comparison, all the following experimental results of quantitative evaluation were based on 50% labeled data.
Table 4 presents the performance of OAMamba evaluated through cross-validation with different data splits. With a 5:5 training-to-test ratio (five-fold cross-validation), the model already achieves high segmentation performance (IoU 0.911, DSC 0.923), demonstrating strong small-sample adaptability. Increasing the training data to a 7:3 split results in minimal changes in overall metrics, with IoU and DSC remaining largely stable and HD slightly decreasing (6.325 → 6.267), indicating that additional data primarily provides marginal improvement in boundary precision while having limited impact on overall semantic segmentation performance.
Table 4.
Performance comparison under different cross-validation datasets.
Table 5 compares the segmentation performance of different methods on high-quality, medium-quality, and low-quality datasets. The metrics mIoU and mDSC evaluate regional consistency, while ASD and HD measure boundary accuracy. Overall, the proposed OAMamba consistently achieves the best or second-best performance across all data quality levels, demonstrating its robustness and effectiveness under varying imaging conditions. On the high-quality dataset, OAMamba achieves competitive mIoU (0.913) and mDSC (0.923) values compared with state-of-the-art methods, while obtaining the lowest ASD (3.101) and HD (6.325). This indicates that OAMamba is capable of more accurate boundary modeling when sufficient image details are available. On the medium-quality dataset, OAMamba further demonstrates clear superiority, achieving the highest mIoU and mDSC values (0.899 and 0.902, respectively), together with substantially reduced ASD and HD. These results verify the robustness of the proposed orthogonal attention mechanism combined with Mamba-based state-space modeling in handling image degradation and structural ambiguity. On the low-quality dataset, where segmentation becomes more challenging due to noise and blurred boundaries, OAMamba maintains leading performance in terms of mIoU (0.922) and mDSC (0.932), while also achieving lower ASD (3.511) and HD (8.359) than most competing methods. This highlights its strong adaptability to severe quality degradation.
Table 5.
Quantitative results of the high-quality data (bold indicates the best).
To evaluate the cross-dataset generalization capability of the proposed model, we systematically analyze the performance variations of models trained under different data quality conditions when tested on heterogeneous datasets. As shown in Table 6, the model trained on the high-quality dataset (HQD-M) experiences moderate performance degradation on middle- and low-quality datasets, while still maintaining relatively high mIoU and mDSC values. In contrast, the model trained on the middle-quality dataset (MQD-M) exhibits more balanced performance across different validation datasets, demonstrating stronger cross-dataset generalization ability. Meanwhile, the model trained on the low-quality dataset (LQD-M) performs most stably on low-quality data but shows limited performance gains when transferred to middle- and high-quality datasets. Overall, these results indicate that the proposed method achieves robust and consistent performance under varying data quality conditions, further confirming its effectiveness in complex real-world application scenarios.
Table 6.
Cross-dataset validation performance of the models on the HQD, MQD, and LQD datasets. Bold font indicates the best performance for the IoU and mDSC metrics.
The qualitative results shown in Figure 7a–c further support these quantitative findings. OAMamba effectively integrates multi-scale contextual information and captures both global and local features, leading to more accurate and coherent segmentation results. Notably, OAMamba achieves the highest average mDSC of 0.923, outperforming MT (0.905), ICT (0.918), and DCN (0.921) by 1.8%, 0.5%, and 0.2%, respectively, while also improving the average mIoU by 1.8%. As illustrated in Figure 7b, OAMamba exhibits superior performance in segmenting damaged kernels (BN), producing more precise boundaries and better preserving texture details. Furthermore, as shown in Figure 7c, OAMamba consistently outperforms other methods on BN, FM, and NOR datasets under low-quality conditions, achieving the highest average mIoU (0.922) and mDSC (0.932), with improvements of 2.6% and 2.1% over other advanced SSL-based approaches. In summary, OAMamba delivers superior segmentation accuracy, robust generalization ability, and enhanced boundary awareness across different data quality levels, confirming its effectiveness and robustness for corn kernel image segmentation in complex scenarios.
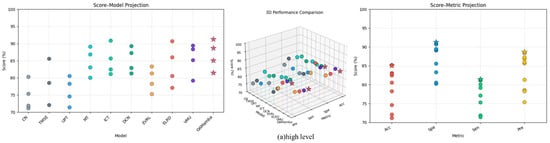
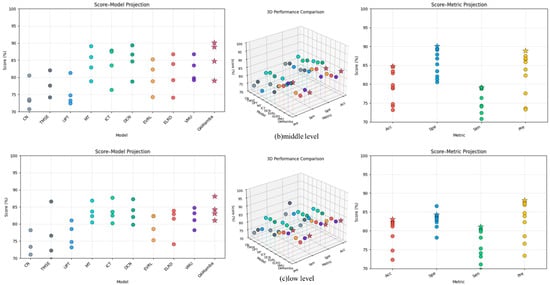
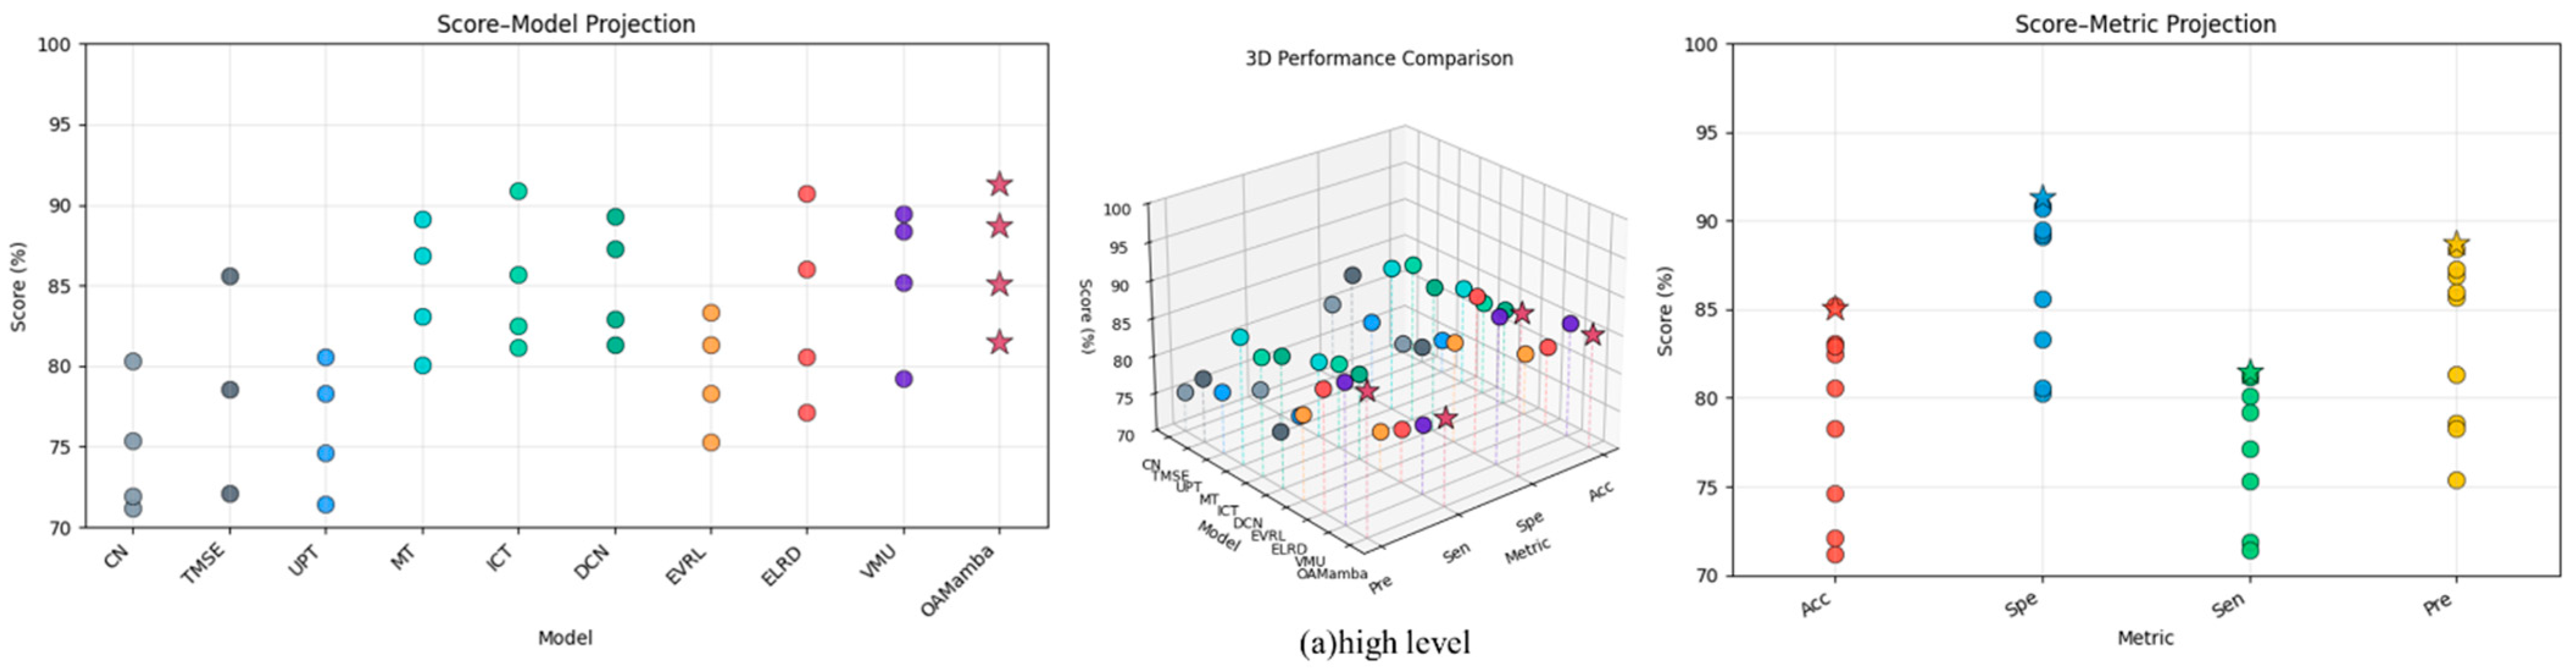
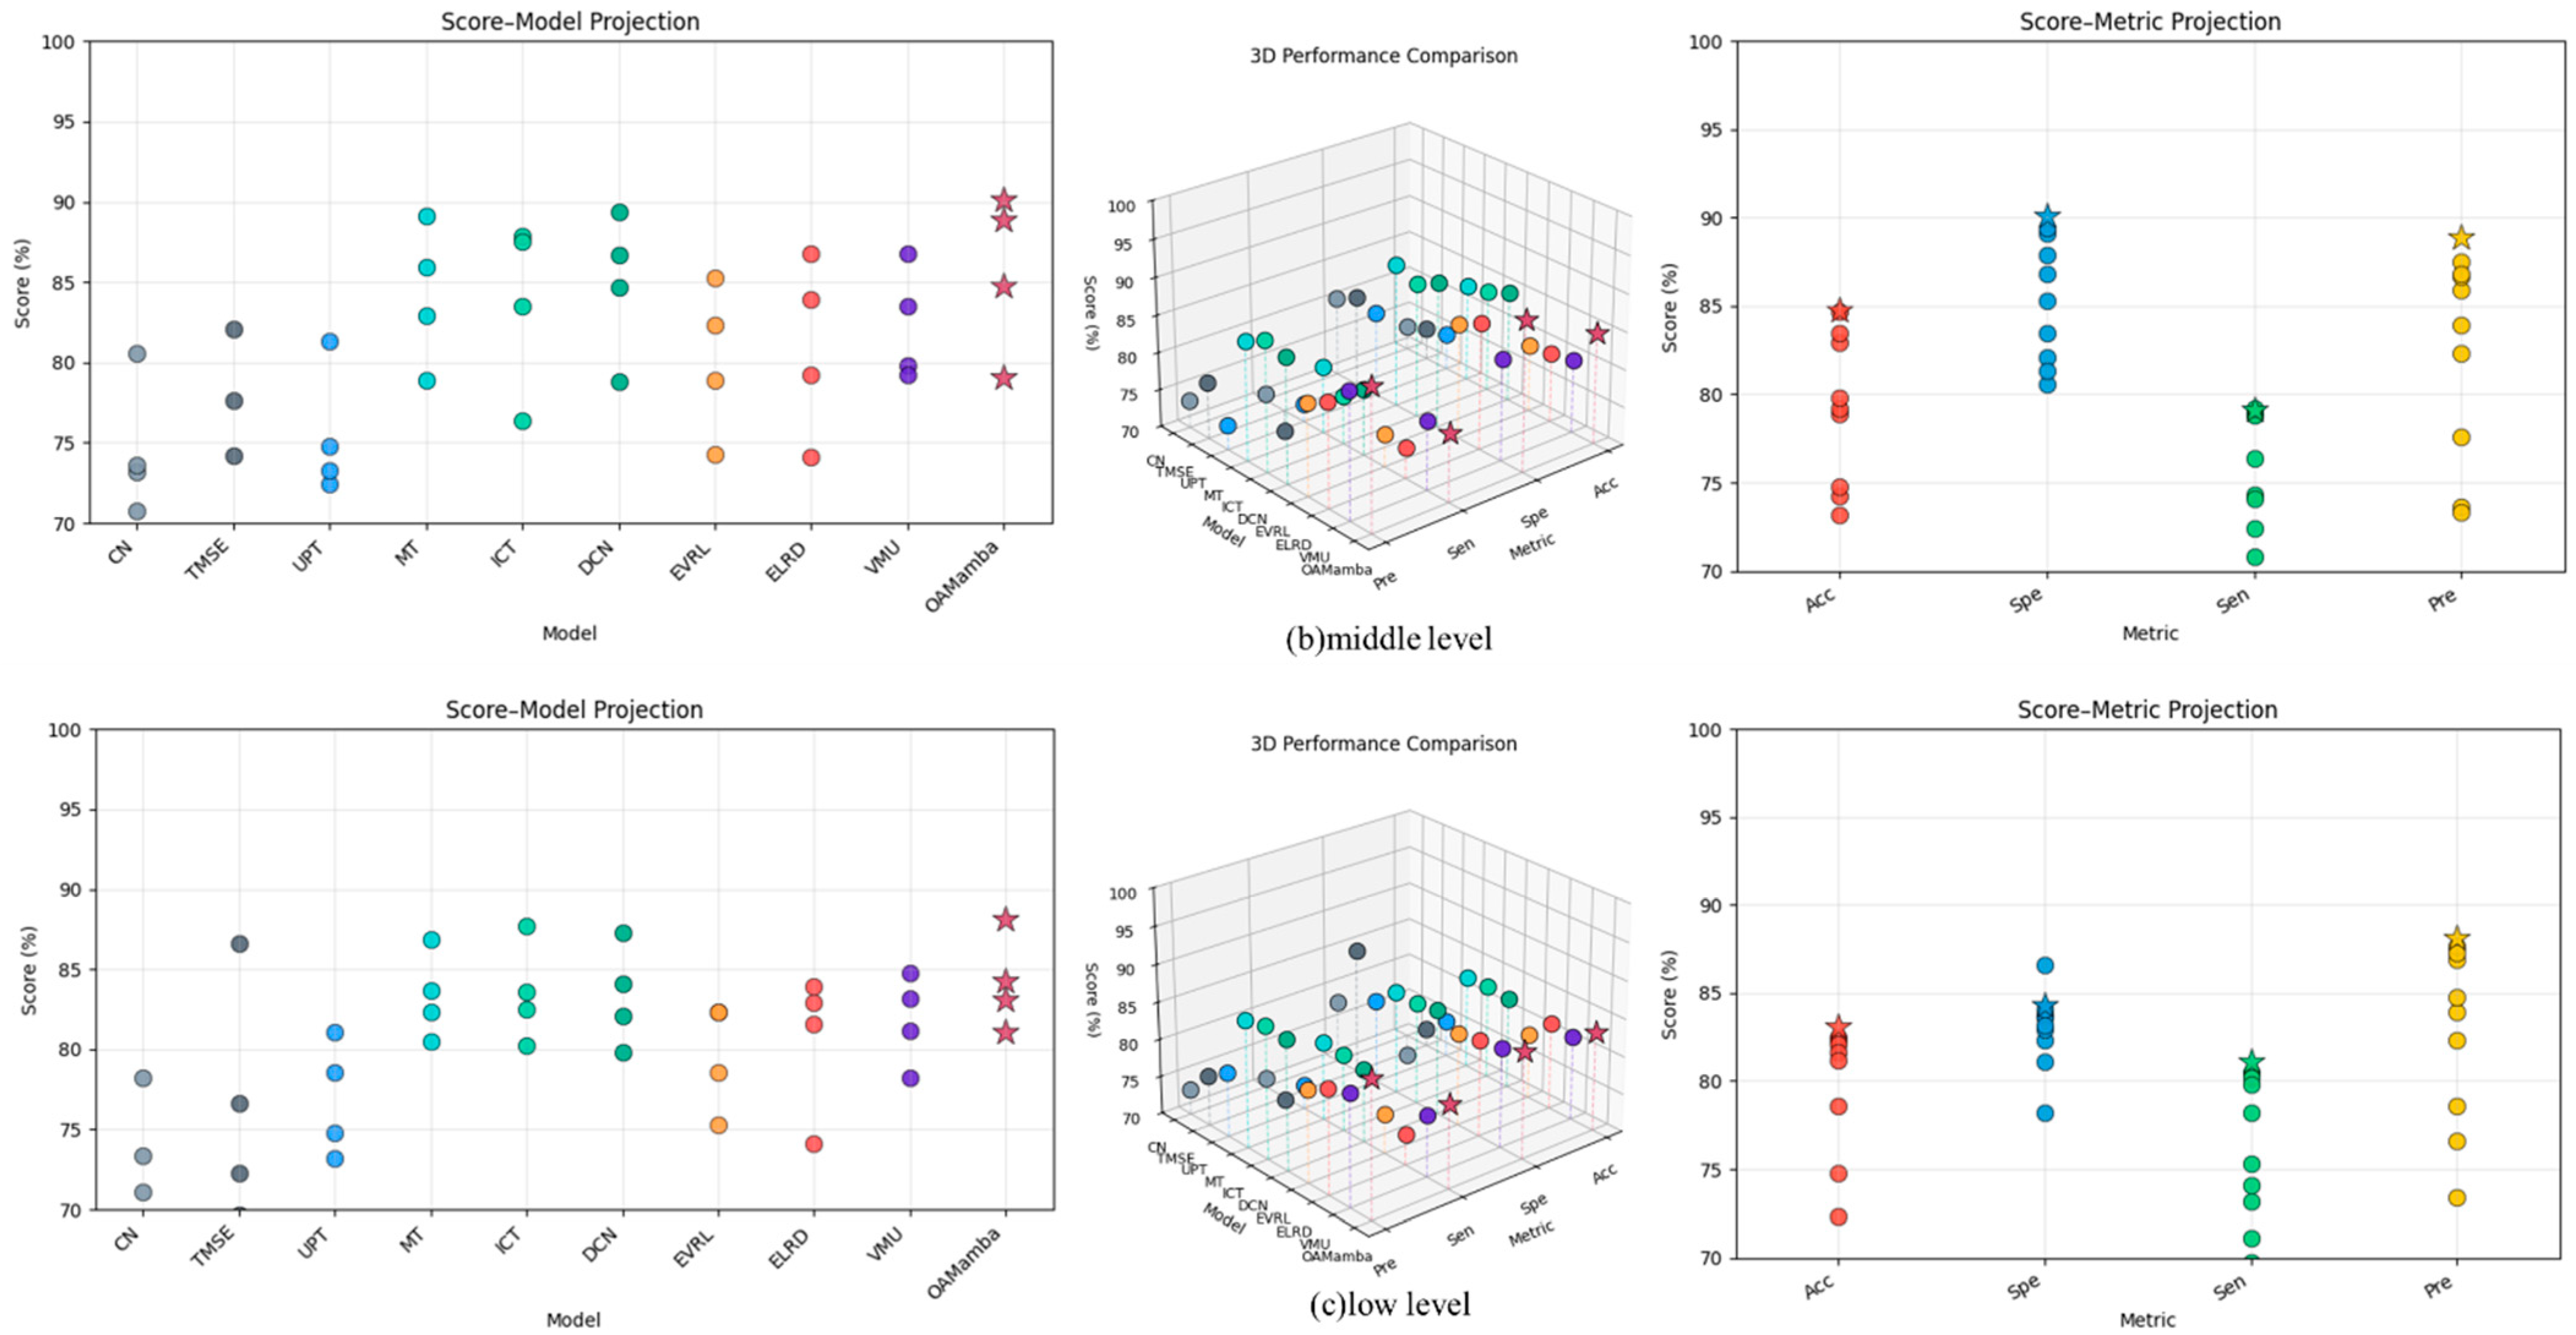
To further validate the superiority of the proposed method, we conduct a systematic performance comparison under three data-quality conditions, namely high-quality, middle-quality, and low-quality. Figure 8 presents the overall performance of different models on the three datasets in terms of Accuracy (Acc), Specificity (Spe), Sensitivity (Sen), and Precision (Pre).
Figure 8.
Performance comparison of different models on high-quality, medium-quality, and low-quality datasets. The colors indicate the metrics as follows: red for Acc, blue for Spe, green for Sen, and yellow for Pre.
From the 3D performance comparison, it can be clearly observed that under all three data-quality conditions, the proposed OAMamba (marked with “✩”) consistently occupies the upper region of the performance space across all four metrics. Its corresponding vertical projections are generally higher than those of the competing methods, indicating that OAMamba maintains a leading position in terms of overall performance. In particular, OAMamba forms prominent “peaks” on both Specificity (Spe) and Precision (Pre) across the three datasets, highlighting its strong capability in reducing false positives and improving prediction reliability. Under the high-quality dataset setting, the 2D Score–Metric projection shows that the performance distributions of different models are relatively concentrated. Nevertheless, OAMamba still achieves the best or second-best results on Acc, Spe, and Pre, with its star-shaped markers stably located along the upper envelope of the scatter distribution. This indicates that even with high-quality samples, the proposed method is able to further exploit discriminative features and deliver more refined performance gains. When the data quality decreases to the middle-quality level, the scatter distribution in the 2D projection becomes noticeably more dispersed, and most competing methods exhibit varying degrees of performance degradation on Acc and Sen.
In contrast, OAMamba remains at a consistently high and stable position, with relatively small performance gaps among the four metrics, demonstrating superior metric balance and robustness. In the low-quality dataset scenario, these differences become even more pronounced. As shown in the Score–Model projection, several methods suffer from significant drops in Sen or Pre, causing the overall performance distribution to shift downward. By comparison, OAMamba continues to maintain high scores across all metrics, with its star-shaped markers persistently positioned above the performance distributions of other models. The advantage is particularly evident on Spe and Pre, indicating that the proposed method retains stable and reliable discriminative capability even under noisy and low-quality data conditions.
3.3. Ablation Studies
In this section, we further evaluate the performance of the OAMamba framework through ablation experiments. Based on the comparative results, the middle-quality corn seed dataset showed the best performance. Therefore, we selected this dataset for the ablation studies to assess the contribution of each module in the proposed OAMamba framework.
The SSL framework proposed in this paper is an enhancement based on the integration of the U-Net and Visual Mamba U-Net frameworks. First, supervised training is performed on labeled datasets within the U-Net branch, followed by supervised training using pseudo-labels in the Visual Mamba U-Net branch. After both branches complete feature extraction, a deep perturbation Projector module is introduced to enable the model to learn a broad spectrum of perturbed spatial features. Additionally, the perturbation Projector module is applied in both branches, and the exchange of contrast loss further improves the model’s learning capacity, enhancing the feature representation in SSL learning. The experimental results, shown in Table 7, present the performance of two learning strategies, labeled M-1 and M-2. Both strategies contribute to improving the model’s performance and further validate the effectiveness of the proposed OAMamba framework.
Table 7.
Quantitative results of corn seed segmentation task.
Here, U-Net is considered as a generic baseline. “U-M” denotes the U model based on the Mamba encoder. “U-Net + M” denotes the network model based on SSL architecture. When M-1 is presented with “√”, it indicates the addition of the first learning strategy, when M-2 is presented with “√”, it indicates the addition of the second learning strategy. When M-1 and M-2 are presented with “×”, it indicates that no learning strategy is added. When both M-1 and M-2 are presented with “√”, it indicates that the proposed OAMamba method is added. From Table 6, it can be concluded that the smaller the number of labels, the smaller the value of mIoU. mIoU with both strategies is 0.842 when containing 50% labeled data, which is 6.1% higher than that without both strategies. In terms of the average mDSC score, the mDSC containing both strategies is 0.936, which is 10.5% higher than that without both strategies.
Furthermore, the mIoU and mDSC values improved by 9.1% and 11.3%, respectively, when 50% of the data was labeled compared to when only 20% was labeled. These results from the ablation experiments highlight the essential role of all the components in the proposed model for effective corn seed image segmentation.
To further quantify the contributions of each component in OAMamba, including Dice loss (DL), cross-entropy loss (CEL), local contrastive loss (LCL), and consistency regularization (CR), we conducted ablation experiments by removing each component individually, with the results summarized in Table 8. Using only LCL significantly improves fine-detail segmentation, increasing mIoU from 0.786 to 0.851 and mDSC from 0.806 to 0.905, although boundary errors (ASD and HD) remain relatively high. In contrast, using only CR enhances the model’s robustness on unlabeled samples, achieving higher mIoU (0.914) and mDSC (0.921), but ASD remains elevated, indicating imperfect boundary delineation. Partial combinations of components show gradual improvements, demonstrating that each module contributes complementary strengths to segmentation. Notably, the full combination of DL, CEL, LCL, and CR achieves the best overall performance, with mDSC reaching 0.936, ASD 3.101, and HD 6.325. These results clearly illustrate the complementary effects of all modules, confirming that LCL primarily enhances fine-grained feature discrimination, CR improves stability and generalization on unlabeled data, and their combined use ensures accurate, robust, and boundary-precise segmentation.
Table 8.
Ablation Study on DL, Cel, LCL and CR Components.
3.4. Discussion
The experimental results demonstrate that the proposed OAMamba framework consistently outperforms U-Net-based, SSL-based, and Transformer-based methods across different corn seed categories and image quality levels. Notably, OAMamba achieves superior segmentation accuracy even with only 50% labeled data, surpassing fully supervised baselines, which highlights its ability to effectively exploit unlabeled data and alleviate overfitting under limited annotation conditions.
These performance gains stem from the synergy between the dual-branch Mamba–UNet architecture and the orthogonal attention mechanism. Mamba-based state-space modeling enhances long-range dependency modeling and global context awareness, while orthogonal attention promotes complementary learning of spatial and semantic features. This combination enables robust segmentation in challenging scenarios involving complex defects, blurred boundaries, and degraded image quality.
To further clarify the role of the proposed attention design, Table 9 provides a conceptual comparison between Orthogonal Attention and representative attention mechanisms, including SE-based variants, multi-dimensional collaborative attention, and other cross-dimensional attention designs. Existing methods mainly rely on adaptive reweighting or feature aggregation across channel and spatial dimensions, without explicitly constraining redundancy among attention branches. In contrast, the proposed Orthogonal Attention Module explicitly enforces orthogonality across multiple orientation-aware branches, enabling effective decoupling and complementarity between spatial and semantic features. This design suppresses redundant responses while preserving critical structural cues, which is particularly beneficial for accurately segmenting elongated, irregular, and defect-prone grain kernels.
Table 9.
Comparison between Orthogonal Attention and representative attention mechanisms.
From a practical perspective, higher mIoU and mDSC values correspond to more accurate delineation of defective regions, which is critical for reliable defect quantification in grain quality inspection and storage assessment. Moreover, the reduced Hausdorff Distance indicates improved boundary precision, allowing finer localization of cracks, broken edges, and irregular kernel contours. Such boundary-aware segmentation provides more trustworthy inputs for downstream decision-making, including automated sorting, defect severity evaluation, and storage risk control.
To further substantiate these advantages, a paired t-test was conducted to evaluate the statistical significance of the observed performance improvements. As reported in Table 10, OAMamba consistently outperforms the baseline across all segmentation metrics in multiple comparative experiments. Specifically, OAMamba achieves an overall improvement of approximately 0.6–2% in overlap-based metrics such as IoU and DSC, while simultaneously yielding notable reductions in boundary-related errors (ASD and HD). These results demonstrate superior regional consistency and boundary delineation capability, highlighting the effectiveness and robustness of the proposed approach in capturing fine structural details.
Table 10.
Statistical significance analysis of OAMamba models using paired t-tests.
Furthermore, ablation studies verify that both learning strategies (M-1 and M-2) contribute positively to performance, with their joint use yielding the largest gains, particularly under low-label regimes. This confirms the effectiveness of perturbation-aware contrastive learning and consistency regularization in stabilizing feature representations and improving boundary accuracy. Overall, OAMamba offers a robust and practically applicable solution for corn seed segmentation in realistic and complex imaging environments.
4. Conclusions
This paper addresses two key challenges in grain storage and quality prediction: (1) the high cost of acquiring large-scale, high-quality labeled data, and (2) the high rates of false detections and omissions in segmentation algorithms under complex environments. To tackle these issues, we propose OAMamba, a semi-supervised segmentation framework for few-shot unsound corn kernels based on an orthogonal attention mechanism. The framework adopts a dual-branch encoder–decoder architecture, where each branch is designed based on a U-shaped network variant, effectively integrating diverse feature representations. This design significantly improves the accuracy and robustness of corn kernel segmentation while reducing the labor and time costs associated with quality detection. Experimental results demonstrate that OAMamba achieves excellent segmentation performance on low-, medium-, and high-quality corn kernel datasets using only 50% of labeled data, fully validating its effectiveness and reliability in limited-label scenarios.
In future work, we plan to extend the OAMamba framework to multi-variety grain quality detection tasks, with a particular focus on maintaining high segmentation accuracy under minimal labeling requirements. We will further explore more generalizable backbone architectures for grain quality analysis by incorporating advanced paradigms such as self-supervised learning and unsupervised contrastive learning to enhance feature representation and training efficiency. In addition, inspired by recent studies on unmanned aerial vehicle (UAV)-based hyperspectral imaging for environmental monitoring—such as enhanced assessment of chlorophyll-a and total nitrogen dynamics in coastal wetland waters—we aim to investigate the applicability of OAMamba to broader hyperspectral perception scenarios [50]. This includes extending the proposed framework to multi-scale, multi-platform hyperspectral data analysis, thereby improving its robustness, generalization capability, and practical value in both agricultural and environmental remote sensing applications.
Author Contributions
Conceptualization, K.Z. and L.L.; methodology, H.G.; software, K.Z.; validation, K.Z. and J.L.; formal analysis, K.Z.; investigation, K.Z.; resources, L.L.; data curation, J.L.; writing—original draft preparation, P.L.; writing—review and editing, H.G.; visualization, K.Z.; supervision, L.L.; project administration, L.L.; funding acquisition, L.L. All authors have read and agreed to the published version of the manuscript.
Funding
This research was funded by the National Natural Science Foundation of China (62375078), the Key Research Project Plan for Higher Education Institutions in Henan Province (24ZX011), the Cultivation Programme for Young Backbone Teachers in Henan University of Technology, and the Science and Technology Innovation Project of Chinese Academy of Traditional Chinese Medicine (ZN2024A02).
Data Availability Statement
The raw data supporting the conclusions of this article will be made available by the authors on request.
Conflicts of Interest
The authors declare no conflicts of interest.
References
- Long, J.; Shelhamer, E.; Darrell, T. Fully convolutional networks for semantic segmentation. In Proceedings of the IEEE Conference on Computer Vision and Pattern Recognition, Boston, MA, USA, 7–12 June 2015; pp. 3431–3440. [Google Scholar]
- Ronneberger, O.; Fischer, P.; Brox, T. U-net: Convolutional networks for biomedical image segmentation. In Proceedings of the Medical Image Computing and Computer-Assisted Intervention–MICCAI 2015: 18th International Conference, Munich, Germany, 5–9 October 2015; pp. 234–241. [Google Scholar]
- Zhou, Z.; Rahman Siddiquee, M.M.; Tajbakhsh, N.; Liang, J. Unet++: A nested u-net architecture for medical image segmentation. In Proceedings of the Deep Learning in Medical Image Analysis and Multimodal Learning for Clinical Decision Support: 4th International Workshop, DLMIA 2018, and 8th International Workshop, ML-CDS 2018, Held in Conjunction with MICCAI 2018, Granada, Spain, 20 September 2018; pp. 3–11. [Google Scholar]
- Fan, D.-P.; Ji, G.-P.; Zhou, T.; Chen, G.; Fu, H.; Shen, J.; Shao, L. Pranet: Parallel reverse attention network for polyp segmentation. In Proceedings of the International Conference on Medical Image Computing and Computer-Assisted Intervention, Lima, Peru, 4–8 October 2020; pp. 263–273. [Google Scholar]
- Huang, H.; Lin, L.; Tong, R.; Hu, H.; Zhang, Q.; Iwamoto, Y.; Han, X.; Chen, Y.-W.; Wu, J. Unet 3+: A full-scale connected unet for medical image segmentation. In Proceedings of the ICASSP 2020–2020 IEEE International Conference on Acoustics, Speech and Signal Processing (ICASSP), Barcelona, Spain, 4–8 May 2020; pp. 1055–1059. [Google Scholar]
- Lou, A.; Guan, S.; Loew, M. DC-UNet: Rethinking the U-Net architecture with dual channel efficient CNN for medical image segmentation. In Proceedings of the Medical Imaging 2021: Image Processing, Online, 5 February 2021; pp. 758–768. [Google Scholar]
- Oktay, O. Attention u-net: Learning where to look for the pancreas. arXiv 2018, arXiv:1804.03999. [Google Scholar] [CrossRef] [Scilit]
- Dosovitskiy, A. An image is worth 16x16 words: Transformers for image recognition at scale. arXiv 2020, arXiv:2010.11929. [Google Scholar] [CrossRef] [Scilit]
- Chen, J.; Lu, Y.; Yu, Q.; Luo, X.; Adeli, E.; Wang, Y.; Lu, L.; Yuille, A.L.; Zhou, Y. Transunet: Transformers make strong encoders for medical image segmentation. arXiv 2021, arXiv:2102.04306. [Google Scholar] [CrossRef] [Scilit]
- Wang, Z.; Su, M.; Zheng, J.-Q.; Liu, Y. Densely connected swin-unet for multiscale information aggregation in medical image segmentation. In Proceedings of the 2023 IEEE International Conference on Image Processing (ICIP), Kuala Lumpur, Malaysia, 8–11 October 2023; pp. 940–944. [Google Scholar]
- Chen, B.; Jiang, J.; Wang, X.; Wan, P.; Wang, J.; Long, M. Debiased self-training for semi-supervised learning. Adv. Neural Inf. Process. Syst. 2022, 35, 32424–32437. [Google Scholar]
- Peng, J.; Estrada, G.; Pedersoli, M.; Desrosiers, C. Deep co-training for semi-supervised image segmentation. Pattern Recognit. 2020, 107, 107269. [Google Scholar] [CrossRef] [Scilit]
- Souly, N.; Spampinato, C.; Shah, M. Semi supervised semantic segmentation using generative adversarial network. In Proceedings of the IEEE International Conference on Computer Vision, Venice, Italy, 22–29 October 2017; pp. 5688–5696. [Google Scholar]
- Abuduweili, A.; Li, X.; Shi, H.; Xu, C.-Z.; Dou, D. Adaptive consistency regularization for semi-supervised transfer learning. In Proceedings of the IEEE/CVF Conference on Computer Vision and Pattern Recognition (CVPR), Nashville, TN, USA, 20–25 June 2021; pp. 6923–6932. [Google Scholar] [CrossRef] [Scilit]
- Wang, W.; Xie, E.; Li, X.; Fan, D.-P.; Song, K.; Liang, D.; Lu, T.; Luo, P.; Shao, L. Pyramid vision transformer: A versatile backbone for dense prediction without convolutions. In Proceedings of the IEEE/CVF International Conference on Computer Vision, Montreal, QC, Canada, 10–17 October 2021; pp. 568–578. [Google Scholar]
- Quan, L.-z.; Xiao-yu, M. Adjusting the shape of corn kernels based on wavelet analysis. J. Agric. Mech. Res. Pap. 2006, 2, 154–156. [Google Scholar]
- Cheng, H.; Shi, Z.; Yin, H.; Feng, J.; Li, Y. Detection of multi-corn kernel embryos characteristic using machine vision. Trans. Chin. Soc. Agric. Eng. 2013, 29, 145–151. [Google Scholar]
- Shi ZhiXing, S.Z.; Cheng Hong, C.H.; Li JiangTao, L.J.; Feng Juan, F.J. Characteristic parameters to identify varieties of corn seeds by image processing. Trans. Chin. Soc. Agric. Eng. 2008, 24, 193–195. [Google Scholar]
- Ding, K.; Gunasekaran, S. Shape feature extraction and classification of food material using computer vision. Trans. ASAE 1994, 37, 1537–1545. [Google Scholar] [CrossRef] [Scilit]
- Ni, B.; Paulsen, M.; Reid, J. Corn kernel crown shape identification using image processing. Trans. ASAE 1997, 40, 833–838. [Google Scholar] [CrossRef] [Scilit]
- Ng, H.; Wilcke, W.; Morey, R.; Lang, J. Machine vision evaluation of corn kernel mechanical and mold damage. Trans. ASAE 1998, 41, 415–420. [Google Scholar] [CrossRef] [Scilit]
- Converse, H.; Steele, J. Discrimination of whole from broken corn kernels with image analysis. Trans. ASAE 1990, 33, 1642–1646. [Google Scholar] [CrossRef] [Scilit]
- Tarvainen, A.; Valpola, H. Mean teachers are better role models: Weight-averaged consistency targets improve semi-supervised deep learning results. Adv. Neural Inf. Process. Syst. 2017, 30, 1195–1204. [Google Scholar]
- Verma, V.; Kawaguchi, K.; Lamb, A.; Kannala, J.; Solin, A.; Bengio, Y.; Lopez-Paz, D. Interpolation consistency training for semi-supervised learning. Neural Netw. 2022, 145, 90–106. [Google Scholar] [CrossRef] [Scilit] [PubMed]
- French, G.; Laine, S.; Aila, T.; Mackiewicz, M.; Finlayson, G. Semi-supervised semantic segmentation needs strong, varied perturbations. arXiv 2019, arXiv:1906.01916. [Google Scholar]
- Wang, Z.; Zhang, Z.; Voiculescu, I. RAR-U-Net: A residual encoder to attention decoder by residual connections framework for spine segmentation under noisy labels. In Proceedings of the 2021 IEEE International Conference on Image Processing (ICIP), Anchorage, AK, USA, 19–22 September 2021; pp. 21–25. [Google Scholar]
- Chaurasia, A.; Culurciello, E. Linknet: Exploiting encoder representations for efficient semantic segmentation. In Proceedings of the 2017 IEEE Visual Communications and Image Processing (VCIP), St. Petersburg, FL, USA, 10–13 December 2017; pp. 1–4. [Google Scholar]
- Cao, H.; Wang, Y.; Chen, J.; Jiang, D.; Zhang, X.; Tian, Q.; Wang, M. Swin-unet: Unet-like pure transformer for medical image segmentation. In Proceedings of the European Conference on Computer Vision; Springer: Cham, Switzerland, 2022; pp. 205–218. [Google Scholar]
- Wang, Z.; Zheng, J.-Q.; Zhang, Y.; Cui, G.; Li, L. Mamba-unet: Unet-like pure visual mamba for medical image segmentation. arXiv 2024, arXiv:2402.05079. [Google Scholar]
- Ruan, J.; Xiang, S. Vm-unet: Vision mamba unet for medical image segmentation. arXiv 2024, arXiv:2402.02491. [Google Scholar] [CrossRef] [Scilit]
- Huang, T.; Pei, X.; You, S.; Wang, F.; Qian, C.; Xu, C.L. Visual state space model with windowed selective scan. arXiv 2024, arXiv:2403.09338. [Google Scholar] [CrossRef] [Scilit]
- Vaswani, A. Attention is all you need. Adv. Neural Inf. Process. Syst. 2017, 30. [Google Scholar]
- Gao, Y.; Zhou, M.; Metaxas, D.N. UTNet: A hybrid transformer architecture for medical image segmentation. In Proceedings of the Medical Image Computing and Computer Assisted Intervention–MICCAI 2021: 24th International Conference, Strasbourg, France, 27 September–1 October 2021; pp. 61–71. [Google Scholar]
- Hatamizadeh, A.; Tang, Y.; Nath, V.; Yang, D.; Myronenko, A.; Landman, B.; Roth, H.R.; Xu, D. Unetr: Transformers for 3d medical image segmentation. In Proceedings of the IEEE/CVF Winter Conference on Applications of Computer Vision, Waikoloa, HI, USA, 3–8 January 2022; pp. 574–584. [Google Scholar]
- Zhou, H.-Y.; Guo, J.; Zhang, Y.; Han, X.; Yu, L.; Wang, L.; Yu, Y. nnformer: Volumetric medical image segmentation via a 3d transformer. IEEE Trans. Image Process. 2023, 32, 4036–4045. [Google Scholar] [CrossRef] [Scilit]
- Ramachandran, P.; Zoph, B.; Le, Q.V. Swish: A self-gated activation function. arXiv 2017, arXiv:1710.05941. [Google Scholar]
- Hendrycks, D.; Gimpel, K. Gaussian error linear units (gelus). arXiv 2016, arXiv:1606.08415. [Google Scholar]
- Çiçek, Ö.; Abdulkadir, A.; Lienkamp, S.S.; Brox, T.; Ronneberger, O. 3D U-Net: Learning dense volumetric segmentation from sparse annotation. In Proceedings of the Medical Image Computing and Computer-Assisted Intervention–MICCAI 2016: 19th International Conference, Athens, Greece, 17–21 October 2016; pp. 424–432. [Google Scholar]
- Wang, N.; Wu, Q.; Gui, Y.; Hu, Q.; Li, W. Cross-Modal Segmentation Network for Winter Wheat Mapping in Complex Terrain Using Remote-Sensing Multi-Temporal Images and DEM Data. Remote Sens. 2024, 16, 1775. [Google Scholar] [CrossRef] [Scilit]
- Yu, Y.; Zhang, Y.; Cheng, Z.; Song, Z.; Tang, C. MCA: Multidimensional collaborative attention in deep convolutional neural networks for image recognition. Eng. Appl. Artif. Intell. 2023, 126, 107079. [Google Scholar] [CrossRef] [Scilit]
- Oord, A.v.d.; Li, Y.; Vinyals, O. Representation learning with contrastive predictive coding. arXiv 2018, arXiv:1807.03748. [Google Scholar]
- Chen, T.; Kornblith, S.; Norouzi, M.; Hinton, G. A simple framework for contrastive learning of visual representations. In Proceedings of the International Conference on Machine Learning, Online, 13–18 July 2020; pp. 1597–1607. [Google Scholar]
- He, K.; Fan, H.; Wu, Y.; Xie, S.; Girshick, R. Momentum contrast for unsupervised visual representation learning. In Proceedings of the IEEE/CVF Conference on Computer Vision and Pattern Recognition, Seattle, WA, USA, 13–19 June 2020; pp. 9729–9738. [Google Scholar]
- Kang, G.; Jiang, L.; Yang, Y.; Hauptmann, A.G. Contrastive adaptation network for unsupervised domain adaptation. In Proceedings of the IEEE/CVF Conference on Computer Vision and Pattern Recognition, Long Beach, CA, USA, 15–20 June 2019; pp. 4893–4902. [Google Scholar]
- Chaitanya, K.; Erdil, E.; Karani, N.; Konukoglu, E. Contrastive learning of global and local features for medical image segmentation with limited annotations. Adv. Neural Inf. Process. Syst. 2020, 33, 12546–12558. [Google Scholar] [CrossRef] [Scilit]
- Wang, Z.; Ma, C. Dual-contrastive dual-consistency dual-transformer: A semi-supervised approach to medical image segmentation. In Proceedings of the IEEE/CVF International Conference on Computer Vision, Paris, France, 2–6 October 2023; pp. 870–879. [Google Scholar]
- Laine, S.; Aila, T. Temporal ensembling for semi-supervised learning. arXiv 2016, arXiv:1610.02242. [Google Scholar]
- Zhu, L.; Liao, B.; Zhang, Q.; Wang, X.; Liu, W.; Wang, X. Vision mamba: Efficient visual representation learning with bidirectional state space model. arXiv 2024, arXiv:2401.09417. [Google Scholar] [CrossRef] [Scilit]
- Ma, J.; Li, F.; Wang, B. U-mamba: Enhancing long-range dependency for biomedical image segmentation. arXiv 2024, arXiv:2401.04722. [Google Scholar] [CrossRef] [Scilit]
- Peng, S.; Bao, N.; Gu, N.; Qian, H.; Han, Z.; Zhou, B.; Chang, L. Enhanced assessment of chlorophyll-a and total nitrogen dynamics using unmanned aerial vehicle-based model and hyperspectral imagery in coastal wetland water. Environ. Technol. Innov. 2025, 40, 104521. [Google Scholar] [CrossRef] [Scilit]

Disclaimer/Publisher’s Note: The statements, opinions and data contained in all publications are solely those of the individual author(s) and contributor(s) and not of MDPI and/or the editor(s). MDPI and/or the editor(s) disclaim responsibility for any injury to people or property resulting from any ideas, methods, instructions or products referred to in the content. |
© 2026 by the authors. Licensee MDPI, Basel, Switzerland. This article is an open access article distributed under the terms and conditions of the Creative Commons Attribution (CC BY) license.