


Abstract
Light quantity and spectral quality regulate plant growth and may influence crop–weed interactions by altering plant morphology, biomass allocation, and physiology. This study evaluated the combined effects of photosynthetic photon flux density (PPFD) and far-red (FR) radiation on the morphological, biomass, physiological, and hyperspectral responses of Pisum sativum L. and Datura stramonium L. grown separately under controlled hydroponic conditions. A 2 × 2 × 2 factorial experiment was conducted using two species, two PPFD levels, and two FR treatments. Morphological traits, biomass production, root mass fraction, SPAD chlorophyll content, hyperspectral reflectance (350–2500 nm), and vegetation indices were analyzed using multivariate statistics, principal component analysis, and Random Forest classification. Species identity explained most of the variation in morphology, biomass allocation, and spectral characteristics. FR supplementation increased mean shoot height in D. stramonium by 62.5% under high PPFD and 101.2% under low PPFD, whereas shoot height in P. sativum was not significantly affected. Red wavelengths between 649 and 668 nm provided the strongest discriminatory information, while short-wave infrared wavelengths contributed complementary biochemical information. The Random Forest model achieved an overall accuracy of 75.7%, an AUC of 0.839, and a Cohen’s κ of 0.489. These findings demonstrate that D. stramonium exhibits greater FR-induced morphological plasticity than P. sativum and that hyperspectral sensing provides useful, although not yet field-validated, crop–weed discrimination.
1. Introduction
Weed–crop competition is a major constraint on agricultural productivity because weeds compete with crops for essential resources such as light, water, and nutrients, reducing growth and yield [1,2]. In many cases, weeds exhibit greater phenotypic plasticity and resource-use efficiency than cultivated species, allowing them to dominate under variable environmental conditions [3,4]. Among these resources, light plays a particularly important role, as changes in light availability and spectral quality can modify plant morphology, biomass allocation, and physiological performance through shade avoidance responses [5]. Therefore, understanding species-specific responses to light intensity and far-red radiation is essential for improving crop–weed discrimination and supporting the development of sustainable weed management strategies.
Light intensity is a crucial environmental factor that regulates plant growth and development, affecting both photosynthetic activity and morphological characteristics. Photosynthetic photon flux density (PPFD), reflective of the light available for photosynthesis, directly influences carbon consumption, biomass accumulation, and overall plant productivity. Higher light intensities typically enhance photosynthetic rates and stimulate increases in leaf area, stem expansion, and overall biomass production [6,7]. In contrast, reduced light intensity might constrain photosynthetic efficiency, leading to slower development, reduced chlorophyll levels, and decreased production, especially during critical developmental stages [8].
Light intensity also affects biomass allocation patterns in plants. In high-light applications, plants often allocate more resources to root and reproductive systems, while low-light conditions generally promote shoot elongation and leaf expansion [9,10]. The correlation between light intensity and plant development is not strictly linear; light levels that are too high can cause photoinhibition, decreasing photosynthetic efficiency and overall performance [11]. Therefore, controlling light intensity is crucial for enhancing plant growth and resource-use efficiency in both natural and managed settings.
Besides light intensity, spectral quality significantly influences plant signaling, especially via far-red (FR) radiation. Plants perceive alterations in the red-to-far-red ratio (R: FR) through the phytochrome system, predominantly via phytochrome B (phyB), which is inactivated under low-R:FR circumstances commonly linked to canopy shadowing or higher plant density [12,13]. This spectral shift triggers a suite of morphological and physiological responses termed shade avoidance syndrome (SAS), which includes stem elongation, increased petiole length, and altered biomass allocation that favors shoot growth to optimize light capture [14,15]. These reactions are primarily governed by Phytochrome-Interacting Factors (PIFs), which regulate gene expression and hormone pathways, including auxin production, hence facilitating elongation growth in competitive light conditions [16,17].
In addition to morphological changes, low-R:FR conditions affect plant architecture by reducing branching and increasing leaf orientation, thereby enhancing light interception in dense vegetation [18,19]. These responses have trade-offs, since excessive elongation may compromise mechanical stability and resource efficiency. Consequently, plants have developed regulatory mechanisms, such as phytochrome A (phyA), to adjust shade avoidance responses in deep canopy environments [20,21]. Moreover, spectrum changes linked to low R:FR can inhibit defense-related pathways and modify blooming time, indicating a reallocation of resources from defense to development in competitive environments [22,23]. Together, these responses improve plant competitiveness in mixed communities, such as crop–weed systems, where light quality is pivotal in shaping species interactions.
PPFD and far-red radiation represent distinct but interacting components of the light environment. PPFD determines the photon energy available for photosynthesis, whereas the red-to-far-red ratio acts mainly as a phytochrome-mediated signal of neighboring vegetation. Consequently, background PPFD can influence the carbon available to support FR-induced stem elongation, leaf expansion, and biomass production. Ref. [24] found that PPFD and FR independently regulated several seedling-growth responses but interacted in regulating development, while [25] showed that FR effects on growth, morphology, and pigmentation depended on the background fluxes of red and blue light. At the canopy level, FR may improve photon capture and contribute to photosynthetic carbon fixation when combined with conventional photosynthetic wavelengths [26,27]. However, FR responses vary among species and treatments: lettuce has shown changes in biomass, photochemical efficiency, leaf morphology, and optical properties [28,29], whereas spinach showed limited morphological responses across contrasting photon fluxes [30]. These findings demonstrate that PPFD × FR responses are species-dependent. Nevertheless, most previous studies have focused on individual horticultural crops, while comparative crop–weed studies integrating growth, physiology, and hyperspectral reflectance remain scarce.
Pisum sativum and Datura stramonium were selected as an agriculturally relevant crop–weed pair with contrasting ecological strategies and responses to light. P. sativum is an important cool-season pulse crop whose development and productivity are sensitive to environmental conditions [31]. Its short growth cycle, well-defined developmental stages, and responsiveness to spectral composition make it suitable for controlled studies of plant–light interactions [32]. In contrast, D. stramonium is a fast-growing annual weed with substantial morphological and physiological plasticity. Light and other environmental conditions can alter its growth, biomass allocation, and reproductive output [33,34], potentially enhancing its competitive ability. Comparing these species under identical hydroponic conditions therefore allowed us to test whether the weed responds more strongly to changes in PPFD and far-red radiation and whether their contrasting responses support hyperspectral crop–weed discrimination. Such integrated comparisons remain limited.
Crop and weed species show divergent adaptive strategies in response to environmental variables, especially in competitive light conditions. Crop species like P. sativum are generally chosen for yield stability and consistent growth; however, they often show limited competitive capacity and reduced morphological flexibility under stressful or shaded conditions [35,36]. Their growth is highly responsive to competition, with decreased biomass accumulation and productivity when adjacent plants constrain light availability [37]. Conversely, weed species like D. stramonium show greater physiological and morphological flexibility, enabling rapid adaptation to changing light conditions and improved resource acquisition [3,4]. These species often respond more strongly to reduced red-to-far-red ratios by increasing stem elongation, altering leaf orientation, and shifting biomass toward above-ground structures to optimize light absorption [4]. These characteristics enable weeds to sustain or enhance biomass in competitive environments, thereby inhibiting crop development. These differences highlight how crops and weeds respond to light intensity and spectral composition, shaping competitive interactions and defining crop–weed dynamics.
Hyperspectral reflectance techniques have emerged as powerful, non-destructive instruments for evaluating plant physiological conditions by acquiring comprehensive spectral data throughout a wide spectrum of wavelengths. These methodologies improve the computation of vegetation indices, including the Normalized Difference Vegetation Index (NDVI), Renormalized Difference Vegetation Index (RDVI), Enhanced Vegetation Index (EVI), and Photochemical Reflectance Index (PRI), which yield essential information on chlorophyll content, canopy architecture, pigment composition, and water status [38,39,40]. Numerous indices are closely associated with plant responses to light conditions because they are affected by reflectance in the red, near-infrared, and green spectral ranges. The NDVI and RDVI are responsive to chlorophyll absorption and canopy architecture, whereas the PRI correlates with photosynthetic efficiency and light-utilization dynamics across different light intensities [41,42]. Moreover, spectral reflectance can detect changes in plant water status and stress responses, which are frequently affected by light availability and spectral composition [33,39]. Importantly, differences in spectral signatures between crop and weed species provide a basis for their discrimination. Integrating spectral analysis with physiological measurements offers a powerful approach to improving weed management strategies. By leveraging the unique spectral signatures of crops and weeds, precision agriculture can achieve targeted weed control, reduce herbicide use, and enhance crop productivity while minimizing environmental impact [43,44,45].
Despite extensive research on light-mediated plant responses, relatively few studies have simultaneously examined the interactive effects of photosynthetic photon flux density (PPFD) and far-red (FR) radiation on the morphological, physiological, and spectral characteristics of both crop and weed species under controlled conditions. Moreover, comparative studies integrating growth traits, biomass allocation, chlorophyll measurements, and hyperspectral reflectance within a factorial PPFD × FR experimental design remain limited. This study combines these approaches to characterize species-specific responses of P. sativum and D. stramonium, providing new insights into their differential adaptation to contrasting light environments and their spectral differentiation.
The objective of this study was to evaluate the combined effects of photosynthetic photon flux density (PPFD) and far-red (FR) radiation on the morphological, biomass, physiological, and hyperspectral responses of P. sativum and D. stramonium grown separately under controlled hydroponic conditions. Specifically, the study investigated species-specific changes in plant growth, biomass allocation, chlorophyll status, and spectral vegetation indices under contrasting light environments and assessed whether these responses could facilitate spectral differentiation between crop and weed species. Accordingly, we hypothesized that (H1) D. stramonium would exhibit greater FR-induced morphological plasticity than P. sativum; (H2) PPFD and FR would exert both independent and interactive effects on plant growth, biomass allocation, and spectral characteristics; and (H3) species-specific reflectance characteristics would permit hyperspectral discrimination between P. sativum and D. stramonium.
2. Materials and Methods
2.1. Experimental Conditions
The experiment was conducted in a custom-built hydroponic controlled-environment growth chamber (locally manufactured in Budapest, Hungary) at the Agronomy Institute of the Hungarian University for Agriculture and Life Sciences (MATE), Gödöllő, Hungary (2100 Gödöllő, Páter Károly str. 1). Environmental conditions were maintained at an average temperature of 23 ± 2 °C and relative humidity of 75 ± 5% throughout the experiment, as shown in Figure 1.
Figure 1.
Controlled-environment growth chamber used for the experiment, showing (a) overall chamber layout, (b) hydroponic system with P. sativum, and (c) growth conditions of D. stramonium under LED lighting.
2.2. Plant Material and Establishment
Seeds of P. sativum and D. stramonium were used in this study. P. sativum seeds were soaked in distilled water for 2 h before being placed directly into hydroponic pots, as this species germinates rapidly and uniformly under hydroponic conditions. In contrast, D. stramonium seeds were soaked in distilled water for two weeks to overcome seed dormancy and improve germination uniformity. The seeds were subsequently germinated in soil, and the seedlings were transferred to hydroponic pots after emergence. These species-specific establishment protocols ensured successful, uniform seedling establishment. Before initiating the light treatments, seedlings of both species were standardized to a comparable developmental stage (e.g., similar seedling size and/or leaf stage) and grown under the same hydroponic conditions. Thus, differences in establishment procedures were not experimental treatments and were used solely to obtain healthy, uniform plants before applying the light treatments.
2.3. Hydroponic System
Plants were grown in a hydroponic system designed to ensure optimal growth conditions. Soilless culture systems provide a controlled root-zone environment. They are widely used to investigate early plant growth and physiological responses under controlled environmental conditions, and appropriate nutrient-solution management is essential to maintain consistent plant growth and experimental reliability [46]. Hydroponic clay pebbles were used as the growing medium because of their high drainage capacity and moisture retention. Plants were grown in 10 L pots measuring 19 cm in diameter and 22 cm in height, positioned above nutrient-solution tanks measuring 117 × 60 cm. Each container was filled with 60 L of nutrient solution (2:1:1 composition). The nutrient solution was managed by regularly monitoring electrical conductivity (EC) and pH throughout the experiment to maintain suitable conditions for plant growth, following established hydroponic practices [47]. An automated irrigation system used an electric pump rated at 1000 L h−1 (Newa Maxi IP68, Loreggia, PD, Italy; 220–240 V, 13 W) to deliver nutrient solution every 30 min through pipes positioned above the containers to ensure uniform distribution.
2.4. Light Treatments and Experimental Design
The experimental design consisted of a factorial combination of two light intensity levels (high and low PPFD) and two far-red treatments (present and absent far-red radiation). The growth chamber was divided into four compartments corresponding to the treatment combinations:
A: High light intensity, no far-red (NH)
B: High light intensity with far-red (YH)
C: Low light intensity, no far-red (NL)
D: Low light intensity with far-red (YL)
To ensure consistent delivery of the intended light treatments, PPFD was measured at multiple positions within each compartment to verify light-intensity distribution and minimize spatial variability. Maintaining light uniformity is essential in controlled-environment experiments to ensure that observed plant responses are attributable to the imposed treatments rather than differences in light distribution [48]. The spatial arrangement of the experimental units and measurement positions within the growth chamber is illustrated in Figure S1.
The experiment was initially designed with 14 plants of each species per treatment. However, several P. sativum seeds failed to germinate, or the resulting seedlings did not establish successfully. Consequently, the final sample sizes for P. sativum were 11, 10, 11, and 9 plants in the NH, YH, NL, and YL treatments, respectively (total n = 41). For D. stramonium, we retained 14 plants in each treatment (total n = 56). Thus, the unequal sample sizes were unplanned and resulted from differences in seedling establishment rather than deliberate unequal allocation or exclusion based on experimental outcomes. The two species were grown separately.
Photon irradiance was measured at each occupied plant position within the four treatment compartments using a MAVOSPEC BASE spectroradiometer (GOSSEN Foto- und Lichtmesstechnik GmbH, Nürnberg, Germany). Measurements were obtained from 97 positions: 25 in NH, 24 in YH, 25 in NL, and 23 in YL. The principal illumination was provided by custom-made Grow-LED horticultural lighting system fixtures by (Bed Rock Farm Ltd., Budapest, Hungary).
According to the instrument’s spectral-band definitions, PPFD was integrated over 400–700 nm and comprised blue (400–500 nm), green (500–600 nm), and red (600–700 nm) photon fluxes. The higher-PPFD treatments averaged 104.00 ± 9.27 µmol m−2 s−1 without supplemental FR (NH) and 106.48 ± 10.44 µmol m−2 s−1 with supplemental FR (YH). The corresponding lower-PPFD treatments averaged 79.24 ± 5.61 µmol m−2 s−1 (NL) and 79.21 ± 4.36 µmol m−2 s−1 (YL). Based on the 12-h photoperiod, the respective DLIs were 4.49 ± 0.40, 4.60 ± 0.45, 3.42 ± 0.24, and 3.42 ± 0.19 mol m−2 d−1.
The lower-PPFD treatments therefore represented an approximately 24–26% reduction relative to the corresponding higher-PPFD treatments. Both levels were selected to represent low-light controlled-environment conditions rather than full-sun field irradiance. The purpose was to examine plant responses under reduced photon availability and assess growth under lower lighting inputs. The moderate PPFD gradient created two distinct photon environments without introducing a large irradiance contrast that could dominate or obscure responses to FR supplementation. Accordingly, “higher” and “lower” refer only to the relative PPFD levels within this experiment and not to the broader irradiance range occurring under natural field conditions. Reduced R:FR was investigated because it acts as an important phytochrome-mediated signal of neighboring vegetation and developing canopy shade [49,50].
FR photon flux was integrated over 700–780 nm, corresponding to the upper spectral limit of the MAVOSPEC BASE. It increased from 6.63 ± 0.49 µmol m−2 s−1 in NH to 15.99 ± 2.94 µmol m−2 s−1 in YH and from 5.48 ± 0.45 µmol m−2 s−1 in NL to 11.55 ± 0.83 µmol m−2 s−1 in YL. The R:FR ratio was calculated by dividing red photon flux integrated over 600–700 nm by FR photon flux integrated over 700–780 nm. Consequently, R:FR decreased from 5.97 ± 0.15 in NH to 2.61 ± 0.33 in YH and from 5.54 ± 0.47 in NL to 2.65 ± 0.12 in YL. These measurements confirmed that FR supplementation established distinct lower-R:FR conditions while maintaining comparable PPFD within each irradiance level.
2.5. Nutrient Solution Monitoring
The nutrient solution was prepared using three commercial liquid fertilizers: Dutch Formula 1 (Grow), 2 (Bloom), and 3 (Micro) (Advanced Hydroponics of Holland, Best, The Netherlands). The pH and electrical conductivity (EC) of the nutrient solution were monitored weekly throughout the experimental period using an AD12 pH meter and an AD31 EC/TDS meter (ADWA Instruments, Szeged, Hungary) respectively as shown in Table 1. Measurements were conducted for all treatment combinations (YH, YL, NH, NL) to ensure stable growth conditions. The pH ranged from 6.3 to 8.13, while EC values ranged from 1497 to 1765 µS cm−1.
Table 1.
Light intensity and spectral characteristics across experimental treatments (mean ± SD).
2.6. Morphological and Spectral Data Measurements
All morphological, physiological, biomass, and hyperspectral measurements were performed 4 weeks after transplanting into the hydroponic system, ensuring that all plants were evaluated after the same chronological growth period, such as shoot height (cm), root length (cm), shoot diameter (mm), number of leaves, and leaf chlorophyll content, which was estimated using a SPAD meter (Soil Plant Analysis Development, Konica-Minolta, Tokyo, Japan). In addition, Fresh weight (WW) of shoots, roots, and whole plants was measured. Dry weight (DW) was determined after oven-drying samples at 70 °C until constant weight. Leaf area (cm2) was calculated from digital images using ImageJ software (version 1.54p; National Institutes of Health, Bethesda, MD, USA).
Spectral reflectance was measured at the leaf level using an ASD FieldSpec® 3 spectroradiometer (Analytical Spectral Devices Inc., Boulder, CO, USA) over 350–2500 nm. The second fully expanded leaf from the top of each plant was selected to standardize leaf position and developmental stage across species and treatments. Selected leaves were intact, sufficiently large to cover the measurement area, and free from visible damage, disease symptoms, or chlorosis. Three spectral measurements were obtained from each selected leaf and averaged to produce one representative spectrum per plant. Measurements were performed using an 8° field-of-view fiber-optic probe positioned at a fixed distance of 5 cm above the selected leaf to maintain consistent measurement geometry. The instrument was allowed to stabilize for 20 min before measurement. Radiometric calibration was performed using a Spectralon white reference panel (Labsphere, Inc., North Sutton, NH, USA) before measurements and repeated at 15 min intervals throughout data acquisition to maintain measurement accuracy. For each sample, three consecutive scans were recorded and averaged to obtain a representative reflectance spectrum. All spectral measurements were conducted under direct sunlight on the same day between 10:00 and 14:00 under stable weather conditions, as shown in Figure 2. To minimize variation associated with changes in solar angle and irradiance, a fixed sensor geometry was maintained throughout the measurements, and care was taken to avoid shading, background interference, and probe disturbance. All spectra were visually inspected, and noisy measurements were excluded prior to further analysis.
Figure 2.
Spectral reflectance measurement setup: (a) ASD FieldSpec® 3 spectroradiometer system, (b) fiber-optic probe mounted on a support frame for stable measurements, and (c) in situ leaf reflectance measurement using a handheld probe.
2.7. Spectral Data Processing and Index Calculation
Hyperspectral reflectance data were collected using an ASD FieldSpec 3 spectroradiometer (Analytical Spectral Devices Inc., Boulder, CO, USA). Reflectance values were extracted at specific wavelengths to calculate a set of vegetation indices representing structural, pigment-related, physiological, and water-status characteristics of the plants. Structural and greenness indices, including the Normalized Difference Vegetation Index (NDVI), Renormalized Difference Vegetation Index (RDVI), and Enhanced Vegetation Index (EVI), were used to assess vegetation vigor and canopy structure. Chlorophyll-related indices, such as the Modified Chlorophyll Absorption in Reflectance Index (MCARI), were calculated as proxies for leaf chlorophyll content and nitrogen status. Pigment- and stress-related indices, including the Carotenoid Reflectance Index (CRI), Anthocyanin Reflectance Index (ARI), Structure-Insensitive Pigment Index (SIPI), and Photochemical Reflectance Index (PRI), were used to evaluate pigment composition and physiological stress responses. Water-related indices, including the Plant Water Index (PWI) and Simple Ratio Water Index (SRWI), were used to estimate leaf water content. All vegetation indices were calculated using established formulas based on reflectance values at specific wavelengths, as shown in Table 2.
Table 2.
Spectral vegetation indices grouped by functional categories (structural, pigment-related, and water-related) with corresponding formulas and references. Reflectance at wavelength x is denoted as Rx (nm).
2.8. Statistical Analysis
All statistical analyses were performed using IBM SPSS Statistics (Version 29.0.1.0; IBM Corp., Armonk, NY, USA) and R software (version 4.4.2; R Core Team, Vienna, Austria) within the RStudio (version 2024.09.1+394; Posit Software, PBC, Boston, MA, USA) environment. The experiment followed a fully factorial 2 × 2 × 2 design with three fixed factors: species (P. sativum and D. stramonium), light intensity (high and low photosynthetic photon flux density, PPFD), and far-red light supplementation (present or absent).
Assumption Tests for Residuals
Normality test:
The assumption of normality was evaluated before conducting MANOVA and ANOVA to ensure the validity of parametric analyses. Given the sample size (n ≥ 50), normality was assessed primarily using the Kolmogorov–Smirnov test [61], supplemented by visual inspection of Q–Q plots and evaluation of skewness and kurtosis statistics [62] for each group separately. Kolmogorov–Smirnov tests indicated significant deviations from normality (p < 0.05) for several variables, including shoot diameter (df(97) = 0.115, p = 0.003), root length (df(97) = 0.112, p = 0.004), leaf area (df(97) = 0.172, p < 0.001), dry weight of shoot (df(97) = 0.130, p < 0.001), dry weight of root (df(97) = 0.135, p < 0.001), wet weight of shoot (df(97) = 0.156, p < 0.001), wet weight of root (df(97) = 0.145, p < 0.001), Anthocyanin Reflectance Index (ARI; df(97) = 0.098, p = 0.022), and Plant Water Index (PWI; Df(97) = 0.097, p = 0.026). The remaining variables did not show significant departures from normality.
However, skewness and kurtosis values for all variables were within acceptable thresholds. As a rule of thumb, absolute skewness values below 2 and kurtosis values below 4 indicate approximate normality, particularly for larger sample sizes. Therefore, the data were deemed suitable for parametric analyses. To further improve distributional properties where necessary, a logarithmic (ln) transformation was applied to shoot diameter and leaf area, and a square-root transformation was applied to dry and wet biomass variables (DW_shoot, DW_root, WW_shoot, and WW_root). Following the transformation, all variables met normality assumptions and were used in subsequent analyses.
Homogeneity of Variance:
Homogeneity of variance was evaluated using Levene’s [63] test for all dependent variables across the factors Species, Light Intensity, and Far-Red Light within each analytical subgroup (morphology, biomass, allocation, and spectral components). When Levene’s test indicated significant heterogeneity (p < 0.05), additional evaluation was conducted using the variance ratio criterion [64].
The variance ratio was calculated as:
Homogeneity was considered acceptable when the variance ratio was less than 2. However, in cases where the ratio of the largest to smallest sample size was below 1.5, variance ratios up to 6 were considered tolerable. In the present study, sample size ratios were below 1.5 across treatment combinations, and all observed variance ratios were below the acceptable threshold (F < 6). Therefore, homogeneity of variance was considered satisfied for subsequent parametric analyses.
Spectral preprocessing: Raw reflectance spectra covering 350–2500 nm were visually inspected for discontinuities, extreme values, and wavelength-dependent noise. Three wavelength intervals exhibiting consistently poor signal quality 1350–1390, 1820–1940, and 2440–2500 nm were excluded from all subsequent analyses. The first two intervals corresponded to strong water-vapor absorption regions, whereas the final interval exhibited a low signal-to-noise ratio near the upper spectral limit of the instrument. Savitzky–Golay smoothing was evaluated during preliminary data inspection but did not sufficiently correct the severely affected regions. Therefore, these wavelength intervals were excluded rather than reconstructed or smoothed. No smoothing was applied to the retained wavelengths. The same exclusion criteria were applied consistently to every spectrum before calculating vegetation indices and conducting PCA and Random Forest classification. Representative spectra before and after band removal are presented in Figure S2.
A completely randomized factorial design was employed to examine the effects of Species (P. sativum and D. stramonium), Light Intensity (High vs. Low PPFD), and Far-Red Light supplementation (Present vs. Absent) on plant growth and physiological performance. To account for potential correlations among related biological variables and to reduce inflation of Type I error, a structured analytical framework was adopted. Dependent variables were grouped into biologically meaningful categories and analyzed separately.
a. Morphological Traits: Morphological variables (shoot height, leaf number, shoot diameter, root length, and leaf area) were analyzed using a three-way multivariate analysis of variance (MANOVA), with Species, Light Intensity, and Far-Red Light as fixed factors. When significant multivariate effects were detected (Wilks’ Lambda, p < 0.05), follow-up univariate ANOVAs were conducted to identify the contributing traits.
b. Biomass Production: Dry biomass components (DW_shoot and DW_root) and total dry biomass (DW_total) were analyzed separately using three-way MANOVA. Wet biomass variables (WW_shoot and WW_root) were analyzed using MANOVA.
c. Biomass Allocation: Biomass allocation was quantified using Root Mass Fraction (RMF):
RMF was analyzed using three-way ANOVA. The root-to-shoot ratio was calculated for descriptive comparison but was not included in multivariate analyses due to mathematical dependency with RMF.
d. Spectral and Physiological Variables: Spectral reflectance indices (NDVI, RDVI, EVI, MCARI, CRI, ARI, SIPI, PRI, PWI, and SRWI) together with SPAD values were initially calculated for each sample. PCA was used as an exploratory dimension-reduction method because the spectral vegetation indices were correlated and represented overlapping aspects of pigment composition, leaf structure, and water status. The purpose of PCA was to identify the principal multivariate gradients underlying spectral and physiological variation and to determine whether these gradients were associated with species, PPFD, and FR treatments. Spectral indices and SPAD values were standardized using z-scores before PCA to ensure equal contribution of variables measured on different scales. Components with eigenvalues greater than 1, supported by scree-plot inspection, were retained. Scores for PC1–PC3 were subsequently analyzed using three-way MANOVA and univariate ANOVAs, with species, PPFD, and FR as fixed factors. PCA was used to summarize and interpret multivariate variation rather than to evaluate classification accuracy.
The relationship between SPAD and the MCARI was further evaluated using linear regression. Species-specific regressions were fitted, and a model containing the MCARI, species, and their interaction was used to test whether the MCARI–SPAD relationship differed between species. An additional model included FR and PPFD as covariates. Regression assumptions were assessed using residual diagnostic plots.
e. Random Forest Classification: Whereas PCA was used to summarize multivariate variation among spectral and physiological indices, Random Forest (RF) classification was used to test whether the cleaned wavelength-level reflectance data contained sufficient predictive information to distinguish the crop P. sativum from the weed D. stramonium. Wavelength regions strongly affected by atmospheric water absorption and sensor noise (1350–1390, 1820–1940, and 2440–2500 nm) were excluded as described in the spectral-preprocessing section. Species identity was used as the response variable, and reflectance at each retained wavelength was used as a predictor. The dataset was divided into 69 training samples and 28 held-out test samples. Model tuning was performed on the training set using five-fold cross-validation repeated ten times, implemented with the caret package (Version 7.0-1) in R. The final RF model was fitted with 1000 trees, and five candidate values of the mtry parameter were evaluated. Performance on the held-out test set was assessed using the confusion matrix, AUC, overall accuracy, Cohen’s κ, sensitivity, specificity, precision, F1-score, and false-positive and false-negative rates. Variable importance was calculated to identify the wavelengths contributing most strongly to species discrimination.
3. Results
3.1. Morphological Responses to Light and Far-Red Light
Descriptive statistics in Table 3 and the distribution of individual observations in Figure 3 revealed clear differences between species and treatments. P. sativum generally exhibited greater shoot height than D. stramonium, whereas D. stramonium had substantially greater shoot diameter and leaf area. FR supplementation significantly increased D. stramonium shoot height from 17.49 ± 4.46 to 28.42 ± 6.63 cm under higher PPFD (p < 0.001) and from 15.10 ± 2.29 to 30.38 ± 7.56 cm under lower PPFD (p < 0.001). In contrast, shoot height in P. sativum remained relatively stable across treatments, ranging from 33.22 ± 9.74 to 35.30 ± 9.35 cm, with no significant FR effect.
Table 3.
Morphological traits of P. sativum and D. stramonium under different PPFD and far-red (FR) treatments.
Figure 3.
Effects of light intensity (photosynthetic photon flux density, PPFD; high and low) and far-red light supplementation (FR; present and absent) on the morphological traits of P. sativum and D. stramonium. Boxplots show the distribution of shoot height, shoot diameter, root length, leaf number, and leaf area for each treatment combination. The center line represents the median, the box indicates the interquartile range (IQR), whiskers extend to 1.5 × IQR, and individual points represent measurements from individual plants. Sample sizes were n = 14 per treatment for D. stramonium and n = 11, 10, 11, and 9 for P. sativum under NH, YH, NL, and YL, respectively.
Leaf number varied only slightly across treatments, and no significant FR effects were detected in either species. Shoot diameter was consistently greater in D. stramonium than in P. sativum. Under lower PPFD, FR supplementation significantly increased D. stramonium shoot diameter from 6.28 ± 1.50 to 7.82 ± 1.45 mm (p < 0.05). The corresponding increase under higher PPFD, from 6.51 ± 1.64 to 7.47 ± 1.92 mm, was not significant. Shoot diameter in P. sativum remained comparatively stable. Root length varied among treatment means, but none of the FR comparisons was statistically significant.
D. stramonium also exhibited substantially greater leaf area than P. sativum. The largest mean leaf area was recorded for D. stramonium under FR supplementation and lower PPFD (908.81 ± 404.26 cm2). However, the apparent differences in leaf area between FR and non-FR treatments were not statistically significant. Leaf area in P. sativum ranged from 180.47 ± 77.38 to 202.57 ± 78.32 cm2 and showed no significant response to FR supplementation.
3.1.1. Multivariate Results (MANOVA, Wilks’ Lambda)
A three-way MANOVA, as shown in Table 4, revealed a significant multivariate effect of species on morphological traits (Wilks’ Lambda = 0.040, F(5, 84) = 405.14, p < 0.001), indicating clear differences between P. sativum and D. stramonium. Far-red light also had a significant multivariate effect (Wilks’ Lambda = 0.718, F(5, 84) = 6.61, p < 0.001). In contrast, light intensity (PPFD) did not significantly affect the combined morphological variables (Wilks’ Lambda = 0.900, F(5, 84) = 1.88, p = 0.107).
Table 4.
Multivariate effects of species, far-red light (FR), and light intensity (PPFD) on plant morphological traits, based on Wilks’ Lambda.
A significant interaction between species and far-red light was detected (Wilks’ Lambda = 0.764, F(5, 84) = 5.18, p < 0.001), suggesting that the response to far-red radiation differed between the two species. However, no significant interactions were observed for species × light intensity (Wilks’ Lambda = 0.930, F(5, 84) = 1.27, p = 0.284), far-red × light intensity (Wilks’ Lambda = 0.919, F(5, 84) = 1.48, p = 0.206), or the three-way interaction (Wilks’ Lambda = 0.950, F(5, 84) = 0.884, p = 0.495).
3.1.2. Trait-Specific Effects
Following the significant multivariate effects, univariate ANOVAs were conducted to identify which morphological traits contributed to these differences, as shown in Table 5.
Table 5.
Results of three-way ANOVA examining the effects of species, far-red light (FR), and light intensity (PPFD) on plant morphological traits. Values are F-statistics with partial η2 in parentheses.
Species significantly affected shoot height (F(1, 88) = 58.74, p < 0.001), leaf area (log-transformed; F(1, 88) = 104.25, p < 0.001), and stem diameter (log-transformed; F(1, 88) = 690.50, p < 0.001), indicating clear morphological differences between P. sativum and D. stramonium. In contrast, species had no significant effect on leaf number (F(1, 88) = 2.49, p = 0.118) or root length (F(1, 88) = 0.89, p = 0.347). Far-red radiation (FR) significantly affected shoot height (F(1, 88) = 24.42, p < 0.001) but had no significant effects on leaf number (F(1, 88) = 1.37, p = 0.245), root length (F(1, 88) = 2.90, p = 0.092), leaf area (F(1, 88) = 0.08, p = 0.776), or stem diameter (F(1, 88) = 2.31, p = 0.132). Light intensity (PPFD) did not significantly affect any measured morphological trait (p > 0.05).
A significant Species × FR interaction was observed for both shoot height (F(1, 88) = 16.92, p < 0.001) and stem diameter (F(1, 88) = 6.98, p = 0.010). Simple-effects analysis showed that far-red radiation significantly increased shoot height in D. stramonium (estimate = 13.10 cm, p < 0.001), whereas no significant effect was detected in P. sativum (p = 0.723). Similarly, far-red radiation significantly increased shoot diameter in D. stramonium (p = 0.0017), while no significant effect was observed in P. sativum (p = 0.370). These results indicate that D. stramonium exhibited a stronger morphological response to far-red radiation than P. sativum under the experimental conditions. The Species × PPFD interaction was significant for leaf area (F(1, 88) = 4.02, p = 0.048), whereas the FR × PPFD and Species × FR × PPFD interactions were not significant for any measured trait (p > 0.05).
3.2. Biomass Responses to Light Intensity and Far-Red
Biomass allocation patterns differed markedly between species and treatments (Figure S3; Table 6). Overall, D. stramonium produced greater mean shoot and root biomass than P. sativum under all conditions.
Table 6.
Biomass traits of P. sativum and D. stramonium under different PPFD and far-red (FR) treatments.
Shoot dry weight showed a species-specific numerical response to FR supplementation. In D. stramonium, shoot dry weight increased under lower PPFD from 2.66 ± 1.95 g without FR to 3.93 ± 2.45 g with FR, although this difference was not statistically significant (p = 0.124). A smaller, nonsignificant increase was observed under higher PPFD. In contrast, P. sativum exhibited relatively low and stable shoot dry weight across treatments, ranging from 0.77 ± 0.35 to 1.06 ± 0.69 g, with no significant FR effects.
Root dry weight responded differently between species. In P. sativum, root dry weight increased slightly under FR supplementation, particularly under lower PPFD, reaching 1.30 ± 0.15 g; however, these differences were not significant. In D. stramonium, FR significantly increased root dry weight under higher PPFD, from 1.37 ± 0.80 to 2.21 ± 0.80 g (p < 0.001). Under lower PPFD, root dry weight was similar between the non-FR and FR treatments (1.68 ± 0.42 and 1.69 ± 0.43 g, respectively).
Whole-plant dry biomass followed patterns similar to shoot dry weight. D. stramonium produced greater mean whole-plant dry biomass than P. sativum under all treatments. The highest value was recorded in D. stramonium under combined FR supplementation and lower PPFD (5.61 ± 2.82 g), followed by FR supplementation under higher PPFD (4.30 ± 2.63 g). However, the FR simple effects on whole-plant dry biomass were not statistically significant. In contrast, P. sativum exhibited relatively small differences among treatments, with whole-plant dry biomass ranging from 1.86 ± 0.46 to 2.35 ± 0.75 g.
PPFD had little effect on biomass in P. sativum. In FR-treated D. stramonium, however, lower PPFD resulted in significantly greater shoot dry weight (p = 0.008) but significantly lower root dry weight (p = 0.035) compared with higher PPFD. No significant PPFD effect was detected for whole-plant dry biomass.
3.2.1. Multivariate Biomass Effects
A three-way MANOVA (Table 7) showed significant multivariate effects of species and far-red radiation (FR) on biomass traits (shoot, root, and whole-plant dry weight). Species had a strong effect on biomass (Wilks’ Lambda = 0.685, F(3, 87) = 13.32, p < 0.001), indicating clear differences between P. sativum and D. stramonium. Far-red radiation also significantly affected biomass (Wilks’ Lambda = 0.854, F(3, 87) = 4.94, p = 0.003). In contrast, light intensity (PPFD) did not significantly influence biomass overall (Wilks’ Lambda = 0.949, F(3, 87) = 1.56, p = 0.206).
Table 7.
Multivariate effects of species, far-red light (FR), and light intensity (PPFD) on shoot DW, root DW, and whole plant DW, based on Wilks’ Lambda.
Significant interactions were observed between species and light intensity (Wilks’ Lambda = 0.844, F(3, 87) = 5.35, p = 0.002), as well as between far-red radiation and light intensity (Wilks’ Lambda = 0.859, F(3, 87) = 4.75, p = 0.004), indicating that biomass responses to light conditions differed depending on species and treatment combinations.
The interaction between species and far-red radiation was not significant (Wilks’ Lambda = 0.976, F(3, 87) = 0.72, p = 0.546). Likewise, the three-way interaction among species, PPFD, and far-red radiation was not significant (Wilks’ Lambda = 0.932, F(3, 87) = 2.11, p = 0.105), indicating that the combined effect of all three factors on biomass traits was limited.
3.2.2. Trait-Specific Effects (ANOVA, Biomass)
Following the significant multivariate effects, univariate ANOVAs were conducted to determine which biomass traits contributed to these patterns (Table 8). Species had a significant effect on shoot biomass (F(1, 89) = 33.39, p < 0.001), root biomass (F(1, 89) = 29.78, p < 0.001), and whole-plant biomass (F(1, 89) = 32.19, p < 0.001), indicating clear differences in biomass production between P. sativum and D. stramonium. Far-red radiation (FR) significantly affected root biomass (F(1, 89) = 13.71, p < 0.001) and whole-plant biomass (F(1, 89) = 4.29, p = 0.041) but had no significant effect on shoot biomass (F(1, 89) = 1.82, p = 0.181). Light intensity (PPFD) showed a marginal effect on shoot biomass (F(1, 89) = 3.75, p = 0.056) but did not significantly influence root biomass (F(1, 89) = 0.21, p = 0.647) or whole-plant biomass (F(1, 89) = 2.28, p = 0.134).
Table 8.
Results of three-way ANOVA examining the effects of species, far-red light (FR), and light intensity (PPFD) on shoot, root dry, and whole plant biomass (square-root-transformed). Values are F-statistics with partial η2 in parentheses.
A significant interaction between species and light intensity (Species × PPFD) was observed for shoot biomass (F(1, 89) = 7.40, p = 0.008), indicating that the effect of light intensity differed between the two species. In contrast, this interaction was not significant for root biomass or whole-plant biomass. The interaction between far-red radiation and light intensity (FR × PPFD) significantly affected root biomass (F(1, 89) = 6.31, p = 0.014), suggesting that the effect of far-red radiation on root growth depended on light intensity conditions. No significant effects were observed for the Species × FR interaction or the three-way interaction (Species × FR × PPFD) for shoot, root, or whole-plant biomass (p > 0.05).
3.3. Biomass Allocation Strategy
3.3.1. Root Mass Fraction (RMF)
Descriptive statistics (Table 9) and the distribution of individual observations (Figure S4) revealed clear differences in biomass allocation between species and treatments. Overall, P. sativum exhibited consistently higher root mass fraction (RMF) than D. stramonium across most conditions, indicating a greater proportional investment in belowground biomass.
Table 9.
Mean ± standard deviation (SD) of root mass fraction (RMF) of P. sativum and D. stramonium under different combinations of far-red light (FR) and light intensity (PPFD).
Across all treatments, RMF values were generally higher in P. sativum (approximately 0.51–0.57) compared to D. stramonium (approximately 0.42–0.55), suggesting contrasting biomass allocation strategies between the two species. Far-red light influenced RMF differently between species. In Pisum sativum, RMF slightly increased under far-red conditions across both light intensities (e.g., from 0.512 to 0.556 under high light, and from 0.560 to 0.571 under low light). In contrast, D. stramonium showed a decrease in RMF under far-red light at low light intensity (from 0.469 to 0.416), while RMF increased slightly under high light (from 0.496 to 0.553), indicating a more variable response to light quality. Light intensity had contrasting effects on RMF between species. In Pisum sativum, RMF tended to increase under low light conditions, particularly under far-red supplementation. Conversely, in D. stramonium, RMF decreased under low light, especially with far-red radiation, suggesting reduced allocation to roots under combined shade-like conditions.
The interaction between far-red light and light intensity was particularly evident in D. stramonium, where RMF declined sharply under the combined treatment of low light and far-red radiation. In contrast, P. sativum showed relatively stable or slightly increasing RMF across treatments, indicating a more conservative allocation strategy. These RMF patterns suggest contrasting biomass allocation strategies between the two species, with D. stramonium allocating proportionally less biomass to roots under low light combined with far-red radiation.
3.3.2. Trait-Specific Effects on Root Mass Fraction (RMF)
Following the descriptive patterns, a three-way ANOVA was conducted to assess the effects of species, far-red light (FR), and light intensity (PPFD) on root mass fraction (RMF) (Table 10).
Table 10.
Results of three-way ANOVA examining the effects of species, far-red light (FR), and light intensity (PPFD) on root mass fraction (RMF).
Species significantly affected RMF (F(1, 89) = 13.19, p < 0.001), indicating clear differences in biomass allocation between P. sativum and D. stramonium. In contrast, neither far-red light (F(1, 89) = 0.66, p = 0.418) nor light intensity (PPFD) (F(1, 89) = 1.90, p = 0.172) had a significant main effect on RMF.
A significant interaction between species and light intensity was observed (F(1, 89) = 9.65, p = 0.003), indicating that the effect of light intensity on RMF differed between the two species. Additionally, a marginal interaction between far-red light and light intensity was detected (F(1, 89) = 3.81, p = 0.054), suggesting a weak combined effect of these factors on biomass allocation. No significant interactions were found for species × far-red light (F(1, 89) = 0.49, p = 0.488) or for the three-way interaction (F(1, 89) = 1.10, p = 0.297).
3.4. Spectral and Physiological Responses (PCA-Based)
3.4.1. Principal Component Analysis of Spectral Indices
Principal component analysis (PCA) was conducted to reduce dimensionality and summarize variation among the measured spectral and physiological indices (SPAD, NDVI, RDVI, EVI, MCARI, CRI, ARI, SIPI, PRI, PWI, and SRWI). Prior to PCA, all variables were standardized (z-score transformation; mean = 0 and standard deviation = 1) to ensure equal contribution of variables measured on different scales. The first three principal components explained 72.4% of the total variance, with PC1 accounting for 30.6% and PC2 for 27.0% (Table S1, Figure S5). Therefore, interpretation focused primarily on these two components, which together explained 57.6% of the variation. Accordingly, PCA was interpreted as an exploratory representation of the dominant species- and treatment-related spectral gradients rather than as a classification model.
PC1 was positively associated with vegetation and greenness indices (Table S2), including the NDVI (R800, R670), RDVI (R800, R670), EVI (R840, R670, R450), MCARI (R800, R670, R550), PRI (R531, R570), and SRWI (R860, R1240), and negatively associated with the ARI (R550, R700), SIPI (R800, R445), and PWI (R970, R900). These indices are primarily driven by reflectance in the red (~670 nm) and near-infrared (~800–840 nm) regions, indicating that PC1 represents a gradient related to plant vigor, chlorophyll content, and canopy structure, rather than pigment- and water-related responses.
In contrast, PC2 explained 27.0% of the variance and was primarily influenced by indices such as the CRI (R510, R550), PRI (R531, R570), SRWI (R860, R1240), and NDVI (R800, R670). PC2 therefore represented optical contrast involving carotenoid-sensitive and photochemical-reflectance indices, along with water-, structural-, and greenness-related indices. These loadings describe covariance among spectral indicators but do not directly demonstrate changes in carotenoid activity or photosynthetic efficiency.
3.4.2. Species Differentiation in PCA Space
The PCA biplot revealed a clear separation between species along the first principal component (Figure 4). P. sativum samples were predominantly distributed on the positive side of PC1 and were associated with higher values of the NDVI, RDVI, and MCARI as well as related indices, including the EVI, indicating stronger chlorophyll absorption in the red region (~670 nm) and higher reflectance in the near-infrared (~800 nm). These spectral characteristics are consistent with differences in chlorophyll-related reflectance and canopy properties between the two species, although they do not directly indicate differences in photosynthetic efficiency.
Figure 4.
Principal component analysis (PCA) biplot showing the distribution of P. sativum and D. stramonium based on spectral and physiological indices. SPAD, Soil–Plant Analysis Development chlorophyll index; NDVI, normalized difference vegetation index; RDVI, renormalized difference vegetation index; EVI, enhanced vegetation index; MCARI, modified chlorophyll absorption ratio index; PRI, photochemical reflectance index; CRI, carotenoid reflectance index; SRWI, simple ratio water index; PWI, plant water index; ARI, anthocyanin reflectance index; SIPI, structure-insensitive pigment index.
In contrast, D. stramonium samples were mainly located on the negative side of PC1 and were associated with indices such as the ARI and SIPI, which are linked to reflectance in the green (~550 nm) and red-edge (~700 nm) regions. This suggests a greater role of pigment regulation and stress-related spectral responses in this species. These results indicate that species identity was the primary source of separation in the PCA, whereas treatment effects contributed to variation within each species rather than driving the overall clustering.
The CRI, PRI, and NDVI loaded positively within the first two principal components, although their relative contributions differed. The CRI was more strongly associated with PC2, whereas the NDVI contributed more strongly to PC1, with the PRI occupying an intermediate position. Thus, the biplot did not indicate a strictly inverse relationship among these indices. Instead, their different orientations suggest that they captured partly distinct optical information related to carotenoid-sensitive absorption, photochemical reflectance, chlorophyll absorption, and structural scattering. These vector relationships represent covariance among the indices and not direct physiological causation.
3.4.3. Effects of Light Treatments on PCA Patterns
Grouping of samples by far-red (FR) treatment and PPFD levels showed partial overlap among treatment groups (Figure 5, Figure 6 and Figure S6), indicating that treatment effects were less pronounced than species differences in the multivariate space. Thus, PCA primarily reflected species-related variation, while FR and PPFD influenced sample distribution within species. However, some directional trends were observed. Plants exposed to far-red radiation tended to align more closely with indices related to pigment composition, such as the PRI and CRI, suggesting adjustments in carotenoid-related spectral responses. Variations in PPFD also influenced sample distribution across PC1 and PC2, although separation remained less distinct than between species. Overall, the substantial overlap among treatment groups indicates that FR and PPFD modified spectral characteristics without fully separating the multivariate space. These findings suggest that light treatments influenced the spectral and physiological responses of both species, but their effects were secondary to the inherent differences between P. sativum and D. stramonium.
Figure 5.
Principal component analysis (PCA) biplot showing the distribution of samples under far-red radiation treatments (absence, N; presence, Y) based on spectral and physiological indices. SPAD, Soil–Plant Analysis Development chlorophyll index; NDVI, normalized difference vegetation index; RDVI, renormalized difference vegetation index; MSAVI, modified soil-adjusted vegetation index; EVI, enhanced vegetation index; PRI, photochemical reflectance index; CRI, carotenoid reflectance index; RWI, ratio water index; PWI, plant water index; ARI, anthocyanin reflectance index; SIPI, structure-insensitive pigment index.
Figure 6.
Principal component analysis (PCA) biplot showing the distribution of samples under different light intensity treatments (high, H; low, L) based on spectral and physiological indices. PPFD, photosynthetic photon flux density; SPAD, Soil–Plant Analysis Development chlorophyll index; NDVI, normalized difference vegetation index; RDVI, renormalized difference vegetation index; MSAVI, modified soil-adjusted vegetation index; EVI, enhanced vegetation index; PRI, photochemical reflectance index; CRI, carotenoid reflectance index; RWI, ratio water index; PWI, plant water index; ARI, anthocyanin reflectance index; SIPI, structure-insensitive pigment index.
3.4.4. Contribution of Spectral Indices
Analysis of variable contributions (Figure 7) showed that the NDVI, RDVI, EVI, and MCARI contributed strongly to PC1, confirming that chlorophyll-related and structural indices primarily drove variation. Indices such as the CRI and PRI contributed more strongly to PC2, reflecting their role in pigment composition and physiological regulation. In contrast, the ARI and SIPI were negatively associated with PC1, highlighting their contrasting role in pigment-related variation. These results demonstrate that variation in chlorophyll content, canopy reflectance, and pigment composition collectively structure the multivariate spectral responses observed in this study.
Figure 7.
Variable factor map showing the contribution of spectral and physiological indices to the first two principal components (PC1 and PC2). SPAD, Soil–Plant Analysis Development chlorophyll index; NDVI, normalized difference vegetation index; RDVI, renormalized difference vegetation index; MCARI, modified chlorophyll absorption ratio index; PRI, photochemical reflectance index; CRI, carotenoid reflectance index; SRWI, simple ratio water index; PWI, plant water index; ARI, anthocyanin reflectance index; SIPI, structure-insensitive pigment index.
3.4.5. Statistical Analysis of Principal Components
To validate the patterns observed in the PCA, multivariate analysis of variance (MANOVA) was performed on the principal component scores (PC1–PC3), followed by univariate ANOVA for each component.
The multivariate analysis (Table 11) revealed a strong effect of species on the combined principal components (Wilks’ Lambda = 0.463, F(3, 87) = 33.61, p < 0.001), indicating clear physiological and spectral divergence between P. sativum and D. stramonium. Significant effects were also detected for FR (Wilks’ Lambda = 0.861, F(3, 87) = 4.68, p = 0.004), PPFD (Wilks’ Lambda = 0.710, F(3, 87) = 11.84, p < 0.001) and the interaction between species and FR (Wilks’ Lambda = 0.790, F(3, 87) = 7.69, p < 0.001). In contrast, the interaction between species and PPFD (Wilks’ Lambda = 0.950, F(3, 87) = 1.53, p = 0.212), the interaction FR × PPFD (Wilks’ Lambda = 0.925, F(3, 87) = 2.34, p = 0.079), and the three-way interaction (Species × PPFD × FR) (Wilks’ Lambda = 0.964, F(3, 87) = 1.09, p = 0.359) were not statistically significant.
Table 11.
Multivariate analysis of variance (MANOVA) showing the effects of species, far-red light (FR), and light intensity (PPFD) on principal component scores (PC1–PC3).
Univariate ANOVA (Table 12) further clarified how experimental factors influenced individual principal components. PC1 was strongly affected by species (F(1, 89) = 32.09, p < 0.001), confirming that this axis primarily represents species-related variation, as observed in the PCA biplot. In addition, far-red radiation (FR) significantly affected PC1 (F(1, 89) = 5.21, p = 0.025), and a significant interaction between species and FR was detected (F(1, 89) = 13.99, p < 0.001), indicating species-specific responses to far-red light. A smaller but significant interaction between FR and PPFD was also observed (F(1, 89) = 4.10, p = 0.046), whereas PPFD alone did not significantly affect PC1 (F(1, 89) = 1.82, p = 0.180).
Table 12.
Results of three-way ANOVA examining the effects of species, far-red light (FR), and light intensity (PPFD) on principal component scores (PC1–PC3).
PC2 was significantly influenced by species (F(1, 89) = 42.38, p < 0.001) and light intensity PPFD (F(1, 89) = 32.71, p < 0.001), suggesting that this component reflects both inherent species differences and responses to light intensity. In contrast, far-red radiation and all interaction terms had no significant effects on PC2 (p > 0.05).
PC3 showed weaker and less consistent responses. Although significant effects of FR (F(1, 89) = 7.28, p = 0.008) and the interaction between species and FR (F(1, 89) = 9.95, p = 0.002) were observed, this component explained a relatively small proportion of total variance and lacked a clear biological interpretation. Therefore, subsequent analyses focused primarily on PC1 and PC2.
Because the PCA indicated a weak association between SPAD and the hyperspectral indices, an additional regression analysis was performed for SPAD and the MCARI (Figure 8). The MCARI was positively associated with SPAD in D. stramonium (slope = 8.56, 95% CI = 3.17–13.95, R2R^2 = 0.158, p = 0.002), whereas the relationship was not significant in P. sativum (slope = −1.96, 95% CI = −6.22–2.29, R2R^2 = 0.022, p = 0.356). The MCARI × species interaction was significant (p = 0.0027) and remained significant after accounting for FR and PPFD (p = 0.016). The pooled relationship was nonsignificant (R2R^2 = 0.016, p = 0.213), indicating that the relationship between the MCARI and SPAD was species-dependent.
Figure 8.
Relationship between MCARI and SPAD in P. sativum and D. stramonium. Lines represent species-specific linear regressions, and shaded areas represent 95% confidence intervals (n = 41 for P. sativum and n = 56 for D. stramonium).
3.4.6. Random Forest Classification of Crop and Weed Species
To evaluate discrimination between P. sativum and D. stramonium, a Random Forest classifier was developed using the cleaned hyperspectral dataset. Model tuning was performed on 69 training samples using five-fold cross-validation repeated ten times, and classification performance was evaluated using 28 held-out test samples. The model achieved an AUC of 0.839 (Figure 9), an overall test accuracy of 75.0%, and a Cohen’s κ of 0.473, indicating good discriminatory ability and moderate agreement beyond chance. The confusion matrix showed that 14 of 16 D. stramonium samples and 7 of 12 P. sativum samples were correctly classified. With D. stramonium defined as the positive class, sensitivity was 87.5%, specificity was 58.3%, precision was 73.7%, and the F1-score was 80.0%. The false-negative and false-positive rates were 12.5% and 41.7%, respectively, indicating that the model was more successful at detecting D. stramonium than correctly identifying P. sativum.
Figure 9.
Receiver operating characteristic (ROC) curve of the Random Forest classifier for discriminating P. sativum and D. stramonium. The model achieved an area under the curve (AUC) of 0.839, indicating good classification performance. The black dashed diagonal line represents the performance of a random classifier (AUC = 0.5), serving as a reference for evaluating the model’s discriminatory ability.
Variable importance analysis showed that wavelengths primarily in the red spectral region (649–668 nm) contributed most to species classification (Figure 10), corresponding to the major chlorophyll absorption region and reflecting differences in leaf optical properties between the crop and weed species. A secondary important wavelength was identified near 2009 nm, suggesting that differences in biochemical composition and dry matter characteristics also contributed to species discrimination.
Figure 10.
Top 20 wavelengths contributing to Random Forest classification of P. sativum and D. stramonium based on variable importance.
Examination of wavelength importance across the full spectrum (Figure 11) showed that, although useful information was distributed throughout the hyperspectral range, the strongest discriminatory signal occurred around 650–670 nm, with additional contributions in the short-wave infrared region near 1450–1500 nm and 2000–2400 nm. These findings are consistent with the PCA results, confirming that species identity was primarily associated with differences in chlorophyll absorption and leaf biochemical characteristics.
Figure 11.
Variable importance across the hyperspectral range (350–2500 nm) derived from the Random Forest classifier. Peaks indicate wavelengths contributing most strongly to species discrimination.
4. Discussion
4.1. Species-Specific Morphological Responses to Light Intensity and Far-Red Radiation
Light quality and quantity are major environmental signals regulating plant growth, architecture, and resource acquisition through coordinated photoreceptor-mediated pathways. In the present study, however, morphological responses were driven primarily by species identity and far-red (FR) radiation rather than by PPFD alone, as evidenced by the significant multivariate effects of species and FR, whereas PPFD had no significant overall effect on the measured morphological traits. This distinction matters because it indicates that light spectrum had a greater influence on plant architecture than irradiance under the experimental conditions. Similar responses have been reported in horticultural crops, where FR radiation promotes stem elongation and leaf expansion through phytochrome-mediated signaling [24,65,66].
The clearest morphological response was observed for shoot height. FR supplementation increased D. stramonium shoot height by 62.5% under higher PPFD and 101.2% under lower PPFD, whereas P. sativum showed no significant response, consistent with the significant Species × FR interaction. This response is characteristic of shade-avoidance syndrome, in which a reduced R:FR ratio shifts phytochrome B (phyB) toward its inactive form and decreases phyB-mediated suppression of phytochrome-interacting factors, including PIF4, PIF5, and PIF7 [67,68]. Increased PIF activity regulates auxin biosynthesis and signaling, thereby promoting cell expansion and stem elongation [68,69]. Shade-induced elongation is not regulated by auxin alone, however, but involves coordinated signaling among auxin, gibberellins, and brassinosteroids. BZR1, ARF6, and PIF4 form an interacting transcriptional module that integrates brassinosteroid, auxin, and light signals, while gibberellins promote elongation by inducing DELLA degradation and consequently releasing DELLA-mediated inhibition of PIF and BZR1 activity [70,71]. Ethylene may also interact with gibberellin signaling during phytochrome-mediated shade avoidance, as demonstrated in tobacco, and can promote petiole elongation and hyponastic leaf movement [72,73,74]. Nevertheless, ethylene-driven hyponasty is particularly well established under flooding and other stress conditions, whereas low-R:FR-induced hyponasty is regulated primarily through phytochrome, PIF, and auxin signaling, including differential auxin transport within the leaf and petiole [67,75]. These interacting pathways plausibly explain the pronounced FR response of D. stramonium. However, because hormone concentrations, gene expression, cellular elongation, and leaf-angle responses were not measured, this interpretation remains supported by the literature rather than directly demonstrated in D. stramonium.
PIF-mediated regulation of shade-induced elongation has also been demonstrated in tomato, suggesting that related mechanisms operate beyond Arabidopsis [76]. These interacting hormonal and transcriptional pathways plausibly explain the pronounced FR response of D. stramonium. However, because hormone concentrations, phytochrome activity, gene expression, cellular elongation, and leaf-angle responses were not measured, this explanation remains supported by the literature rather than directly demonstrated in D. stramonium. Nevertheless, its stronger response indicates greater sensitivity to neighbor-associated light signals and greater morphological plasticity than P. sativum, consistent with its ecological strategy as a rapidly growing annual weed in competitive environments.
Stem diameter also differed substantially between species, with D. stramonium consistently producing thicker stems than P. sativum. FR significantly increased D. stramonium stem diameter under lower PPFD, whereas its effect under higher PPFD was not significant. This increase in absolute diameter does not necessarily contradict the shade-avoidance response because longitudinal growth was proportionally much greater than radial expansion. Under higher and lower PPFD, FR increased mean shoot height by 62.5% and 101.2%, respectively, while mean stem diameter increased by only approximately 14.7% and 24.5%. Thus, axial elongation remained the dominant response, even though modest absolute thickening occurred. Previous studies have shown that low R:FR or FR supplementation can increase internode growth together with stem dry-matter accumulation or allocation, although the magnitude and direction of these responses depend on species and the background light environment [65,77,78,79]. The diameter increase observed here may therefore represent an allometric adjustment accompanying greater plant size and stem biomass rather than a canonical component of shade avoidance or evidence of enhanced secondary growth. Because cambial activity, stem tissue allocation, carbon availability, and mechanical properties were not measured, the physiological mechanism underlying this diameter response remains unresolved.
Leaf area differed markedly between species, with D. stramonium producing considerably larger leaves than P. sativum across all treatments. Although mean leaf area tended to increase under FR supplementation, particularly under low PPFD, this trend was not statistically significant in the univariate analysis. Therefore, interpret the observed increase cautiously. Previous studies have shown that FR radiation frequently promotes leaf expansion through phytochrome-mediated regulation of cell expansion [13,50,66]. The relatively high variability in leaf area observed in D. stramonium may have limited the statistical detection of FR effects despite an apparent numerical trend.
Root length showed relatively limited responses to the experimental treatments. Although P. sativum exhibited a numerical increase in root length under FR supplementation, this response was not statistically significant. Root development is regulated indirectly by aboveground light perception through long-distance signaling involving phytochromes, hormonal regulation, and carbohydrate allocation [80,81]. The relatively stable root responses observed here therefore suggest that FR primarily altered shoot architecture while belowground development remained comparatively conserved during the experimental period.
Leaf number remained remarkably consistent across treatments in both species, indicating that this trait was less responsive to changes in PPFD and far-red radiation than plant size-related characteristics. Leaf initiation is generally more developmentally regulated than leaf expansion and is largely determined by photosynthate availability at the shoot apical meristem rather than by changes in light quality alone [82]. In contrast, far-red radiation primarily modifies plant architecture by promoting stem elongation and leaf expansion rather than increasing new leaf production [24,66]. Similarly, ref. [65] demonstrated that the morphological effects of far-red radiation depend on the interaction with PPFD and are expressed mainly through changes in organ size rather than leaf initiation. Therefore, the stable leaf number observed in the present study suggests that far-red radiation influenced plant architecture primarily by altering organ expansion instead of stimulating the formation of additional leaves during the experimental period.
Overall, species identity explained the greatest proportion of morphological variation, followed by FR radiation, whereas PPFD alone had relatively little influence under the conditions of this experiment. The significant Species × FR interactions demonstrate that the response to altered light quality was strongly species-dependent, with D. stramonium exhibiting substantially greater morphological plasticity than Pisum sativum. Rather than inducing uniform changes across all traits, FR primarily affected shoot elongation and stem diameter, while leaf number, root length, and leaf area remained comparatively stable. These findings highlight D. stramonium’s greater capacity to modify its architecture in response to neighbor-associated light signals, which may contribute to its competitive success in mixed plant communities.
4.2. Biomass Production and Biomass Allocation Under Contrasting Light Environments
Biomass accumulation reflects the integrated outcome of photosynthetic carbon assimilation, respiratory demand, and assimilate partitioning, making it a robust indicator of plant performance under different light environments. In the present study, species identity was the primary determinant of biomass production, with D. stramonium consistently producing greater shoot, root, and whole-plant biomass than Pisum sativum. Far-red (FR) radiation also significantly influenced biomass production, whereas PPFD alone had no significant overall effect. These findings indicate that intrinsic differences between species influenced biomass accumulation more than changes in light intensity, while supplemental FR further modified plant growth. Similar species-dependent responses have been reported in controlled-environment studies, where interactions between species-specific growth characteristics and light quality regulate biomass accumulation [25,66].
Across all treatments, D. stramonium consistently produced greater shoot, root, and whole-plant dry biomass than P. sativum. This greater biomass production is consistent with the characteristics of rapidly growing species with efficient resource acquisition and considerable phenotypic plasticity [83]. Phytochrome-mediated perception of FR can influence biomass accumulation by coordinating shoot development, photosynthetic carbon assimilation, and assimilate partitioning [84,85,86]. Previous studies show that FR supplementation can enhance shoot and whole-plant biomass by promoting leaf expansion, improving light interception, and increasing radiation-use efficiency, although these responses strongly depend on species and the background light environment [87,88,89]. However, FR-induced leaf expansion may be accompanied by reduced leaf thickness or leaf mass per area and increased specific leaf area; therefore, a larger leaf area does not necessarily correspond to a proportional increase in leaf dry mass [90]. FR may also redistribute biomass from leaves toward elongating stems and, under some environmental conditions, reduce overall growth [79]. In the present study, treatment-related differences in leaf area were not statistically significant, although D. stramonium maintained substantially greater biomass than P. sativum. Because leaf thickness, specific leaf area, and leaf mass per area were not measured, it was not possible to determine whether the morphological response to FR was accompanied by leaf thinning or altered tissue-level biomass investment.
Although descriptive statistics indicated greater shoot biomass in D. stramonium following FR supplementation, the univariate analysis showed that FR did not significantly affect shoot biomass. Instead, the significant Species × PPFD interaction indicates that the influence of light intensity on shoot biomass differed between the two species. This finding suggests that D. stramonium and P. sativum responded differently to changes in irradiance, irrespective of FR supplementation. Previous studies have demonstrated that reduced irradiance may alter carbon assimilation and shoot growth in a species-dependent manner through differences in photosynthetic capacity and developmental plasticity [25,91]. Therefore, the apparent increase in shoot biomass under FR should be interpreted as a numerical trend rather than evidence of a significant treatment effect.
Far-red radiation exerted the strongest influence on shoot biomass, particularly in D. stramonium. Under low PPFD, far-red supplementation substantially increased shoot and whole-plant dry biomass, coinciding with the marked increase in shoot height observed in the morphological analysis. These coordinated responses suggest that far-red radiation promoted both structural elongation and greater biomass accumulation rather than merely producing taller but less productive plants. Perception of reduced red:far-red ratios by phytochrome photoreceptors activates shade-avoidance pathways that regulate auxin, gibberellin, and other growth-promoting hormones, stimulating cell expansion and shoot development [86,92]. Recent studies have shown that the combination of low PPFD and supplemental far-red radiation enhances leaf expansion, improves light interception, and increases whole-plant biomass in several crop species [25,93,94]. The stronger biomass response observed in D. stramonium therefore suggests a greater capacity to convert far-red-induced morphological adjustments into biomass production than P. sativum, reflecting its higher developmental plasticity under simulated shade conditions.
Root biomass exhibited a different response pattern from shoot biomass. The significant FR × PPFD interaction indicates that the influence of FR on root growth depended on the prevailing light intensity, highlighting the importance of considering both spectral quality and irradiance when evaluating belowground responses. Root development is regulated indirectly through shoot perception of light via phytochrome-mediated signaling, hormonal regulation, and carbohydrate allocation between above- and belowground organs [80]. Previous studies have similarly reported that interactions between FR radiation and PPFD modify biomass partitioning by influencing carbon allocation and source–sink relationships rather than root growth alone [65,95]. The relatively modest changes in root biomass observed in the present study suggest that both species maintained belowground investment while adjusting growth according to the surrounding light environment.
An important finding of this study is that PPFD alone had relatively little influence on biomass production, whereas FR and its interaction with PPFD explained more of the observed variation. This result supports growing evidence that light quality functions as an important developmental signal in addition to its role in photosynthesis. Rather than acting independently, irradiance and spectral composition interact to regulate carbon assimilation, biomass accumulation, and resource allocation through phytochrome-mediated pathways [65,86]. Consequently, manipulating light quality alongside PPFD may better represent canopy light environments than altering irradiance alone.
Overall, the present study demonstrates that species identity was the dominant factor determining biomass production, while supplemental FR further modified biomass accumulation under contrasting light environments. Although D. stramonium consistently produced greater biomass than P. sativum, the absence of a significant Species × FR interaction indicates that the overall biomass response to FR was comparable between species. Instead, biomass responses were characterized primarily by significant effects of FR on root and whole-plant biomass, together with significant interactions between species and PPFD for shoot biomass and between FR and PPFD for root biomass. Collectively, these findings demonstrate that biomass production under simulated canopy conditions depends on both intrinsic species characteristics and the interaction between light quality and irradiance, emphasizing the importance of considering multiple components of the light environment when evaluating crop–weed competition.
4.3. Spectral and Physiological Responses to Light Treatments
Hyperspectral reflectance offers a rapid, non-destructive way to characterize plant physiological and structural variation because leaf spectra integrate information on pigment composition, internal anatomy, water status, and biochemical constituents [96,97]. In this study, principal component analysis (PCA) summarized variation across SPAD measurements and spectral vegetation indices, with the first two principal components explaining 57.6% of the total variance. The clear separation of P. sativum and D. stramonium in PCA space, together with the strong multivariate species effect, indicates that intrinsic differences between the two species were the primary source of spectral variation.
The predominance of species effects likely reflects differences in leaf anatomy, pigment concentration, internal scattering, water relations, and biochemical composition. These properties influence absorption in the visible spectrum and scattering in the near-infrared region, thereby producing species-specific optical signatures [98,99]. Similar studies show that structural and biochemical differences among species can account for substantial spectral variation, sometimes exceeding variation caused by environmental treatments [100,101]. The separation observed along PC1 should therefore be interpreted primarily as a species-related spectral gradient, although the significant effects of FR, PPFD, and Species × FR demonstrate that the light treatments also modified spectral responses.
PC1 was primarily associated with the NDVI, RDVI, EVI, and MCARI, all of which use reflectance in the red, red-edge, or near-infrared regions and are sensitive to variation in chlorophyll absorption, leaf structure, greenness, and vegetation development [97,102]. Their positive loadings indicate that chlorophyll- and structure-related optical characteristics strongly contributed to separating P. sativum and D. stramonium. In contrast, the negative loadings of the ARI, SIPI, and PWI indicate an opposing pattern associated with anthocyanin-related reflectance, carotenoid-to-chlorophyll relationships, and water-sensitive spectral variation [98,103]. Collectively, these loadings suggest that PC1 captured a broad contrast between greenness and structural characteristics on one side and pigment- and water-associated optical properties on the other.
PC2 represented an additional contrast among pigment-related and structural indices. In the present PCA, the MCARI and EVI had strong negative loadings on PC2, whereas the CRI and PRI loaded positively; the RDVI also contributed negatively. This pattern suggests that PC2 captured variation between chlorophyll- and canopy-related reflectance on one side and carotenoid- and photochemical-sensitive reflectance on the other. The CRI is sensitive to carotenoid-related absorption, while the PRI responds to changes in reflectance near 531 and 570 nm that may be associated with pigment composition and xanthophyll-cycle activity [104]. However, interpret these indices as optical indicators rather than direct measures of photosynthetic efficiency or photoprotection.
PC2 represented an additional contrast among pigment- and structure-sensitive indices. The MCARI, EVI, and RDVI had negative loadings on PC2, whereas the CRI and PRI loaded positively. However, the orientations of the CRI, PRI, and NDVI did not indicate a strictly inverse relationship because all three contributed positively to the first two components, although their relative contributions differed. The CRI was more strongly associated with PC2, whereas the NDVI contributed more strongly to PC1. These differences are physiologically plausible because the CRI is primarily sensitive to carotenoid-related absorption, whereas the NDVI combines red chlorophyll absorption with near-infrared scattering associated with greenness and leaf structure [97,104]. The PRI responds to reflectance near 531 and 570 nm and can reflect both short-term changes in xanthophyll-cycle activity and longer-term variation in carotenoid-to-chlorophyll ratios [105,106]. The PRI may also vary among species and with pigment composition, illumination, and leaf optical properties [107,108,109]. Consequently, the different vector orientations probably represent partially distinct pigment and structural optical signals rather than direct physiological antagonism. Because PCA describes covariance, these loadings should not be interpreted as direct evidence of changes in carotenoid activity, photosynthetic efficiency, or photoprotection.
The MANOVA and univariate analyses showed that light treatments significantly contributed to the multivariate spectral response. FR significantly affected the combined PC scores and PC1, while PPFD strongly affected PC2. The significant Species × FR interaction for the multivariate response, PC1, and PC3 further indicates that the spectral response to FR differed between P. sativum and D. stramonium. Thus, although species separation was visually more distinct than treatment separation in the PCA biplots, the overlap among treatment groups should not be interpreted as evidence that the treatments were biologically unimportant. Rather, FR and PPFD modified different dimensions of the spectral phenotype within the broader species-specific optical profiles.
The strong effect of FR on PC1 suggests that supplemental FR altered the combination of greenness-, structure-, pigment-, and water-sensitive characteristics represented by this axis. Some FR-treated samples were positioned closer to the PRI and CRI vectors, which may indicate treatment-associated changes in pigment balance or light acclimation. However, this interpretation should be cautious because PCA loadings describe covariance among indices and do not establish direct biochemical changes. FR-induced spectral responses may depend on species, background spectrum, FR intensity, developmental stage, and exposure duration [28,110,111].
PPFD primarily influenced PC2 rather than PC1, indicating that irradiance affected a different combination of optical traits than those most strongly associated with species separation. Given the opposing loadings of the EVI, MCARI, and RDVI relative to the CRI and PRI, this response may reflect acclimation involving chlorophyll-related absorption, leaf structural properties, and carotenoid-sensitive reflectance. The non-significant Species × PPFD interaction suggests that the overall effect of PPFD on the principal components was broadly comparable between the two species, even though their mean spectral profiles remained distinct.
SPAD contributed relatively little to the first three principal components compared with several hyperspectral indices. This indicates that localized estimates of relative chlorophyll content explained only a limited proportion of the overall multivariate spectral variation. SPAD measurements primarily reflect chlorophyll-associated transmittance over a small leaf area, whereas hyperspectral indices integrate broader information on pigments, anatomy, water status, and biochemical composition [96,97]. Species differences in leaf thickness, pigment distribution, and internal structure may also alter relationships between SPAD and reflectance-based indices [112,113]. SPAD and hyperspectral measurements should therefore be considered complementary rather than interchangeable measures of plant physiological status.
To investigate the limited contribution of SPAD observed in the PCA, an additional regression analysis evaluated its relationship with the MCARI and showed that the physiological interpretation of the MCARI was species-dependent. The MCARI was positively associated with SPAD in D. stramonium but not in P. sativum, and the significant MCARI × species interaction confirmed that the relationships differed between species. The MCARI was developed as a reflectance index sensitive to chlorophyll absorption [114]. However, relationships between optical indices and chlorophyll measurements can vary with species-specific leaf thickness, cellular structure, pigment distribution, and other optical characteristics [115,116,117]. Differences in leaf optical properties between crops and weeds and across developmental stages may further affect spectral-index performance [118]. Thus, although the MCARI showed strong sensitivity to chlorophyll status in D. stramonium, it did not consistently proxy SPAD across both species.
Overall, PCA showed that P. sativum and D. stramonium had distinct multivariate spectral characteristics. Species identity was the primary source of separation, while FR and PPFD modified specific components of the spectral response, and FR effects differed between species. Contributions from chlorophyll-, structural-, pigment-, and water-sensitive indices indicate that species differentiation arose from multiple optical properties rather than chlorophyll variation alone. In relation to the study objectives, PCA therefore supported the evaluation of species- and treatment-related spectral responses but, as an exploratory method, did not determine whether individual samples could be classified reliably. This predictive objective was subsequently evaluated using Random Forest classification.
4.4. Random Forest Classification for Crop–Weed Discrimination
Random Forest classification complemented PCA by directly addressing the study’s predictive objective. Whereas PCA summarized covariance among SPAD and selected vegetation indices and visualized the dominant sources of spectral variation, Random Forest used the cleaned wavelength-level reflectance data to determine whether species identity could be predicted and to identify the wavelengths contributing most strongly to that prediction. Random Forest is suitable for hyperspectral data because it can model nonlinear relationships, accommodate numerous correlated predictors, and estimate the relative contribution of individual wavelengths without requiring strict distributional assumptions [93,119]. Previous studies have successfully applied RF to crop–weed and plant-species discrimination, often identifying the red-edge and near-infrared regions as important sources of discriminatory information [120,121].
The classifier achieved an AUC of 0.839, an overall test accuracy of 75.0%, and a Cohen’s κ of 0.473, indicating useful discrimination with moderate agreement beyond chance. The confusion matrix revealed unequal classification performance between species. The model correctly identified 14 of 16 D. stramonium samples, corresponding to 87.5% sensitivity and a 12.5% false-negative rate. In comparison, the model correctly classified 7 of 12 P. sativum samples, yielding a specificity of 58.3% and a false-positive rate of 41.7%. Thus, the model was more reliable for detecting D. stramonium than for correctly identifying P. sativum. In practical weed-management applications, false negatives would mean missed weeds, whereas false positives could lead to unnecessary treatment of crop plants.
Wavelengths between approximately 649 and 668 nm contributed most strongly to classification. This region overlaps the principal chlorophyll absorption feature in the red spectrum, where differences in pigment concentration, leaf anatomy, and internal optical scattering can produce substantial reflectance variation [104]. Previous crop–weed classification studies have similarly identified the red and red-edge regions as important for distinguishing plant species because these wavelengths are sensitive to chlorophyll-related absorption and species-specific leaf properties [122,123,124]. The prominence of these wavelengths is also consistent with the PCA, in which the NDVI, RDVI, EVI, and MCARI contributed strongly to PC1. This physiological interpretation is partially supported by the species-specific MCARI–SPAD relationship, although chlorophyll-sensitive indices did not respond consistently across both species.
In addition to the visible region, a wavelength near 2009 nm contributed to species classification. This part of the short-wave infrared spectrum is influenced by absorption features associated with water, proteins, cellulose, lignin, and other dry-matter constituents [125,126]. Additional important peaks in water- and biochemical-sensitive regions suggest that the classifier did not rely exclusively on pigment-related differences. Instead, species discrimination likely resulted from complementary variation in chlorophyll absorption, internal leaf structure, tissue water relations, and biochemical composition. This interpretation agrees with the PCA results, which identified contributions from both greenness-related and water- or pigment-sensitive indices.
Several factors may have contributed to the observed misclassification. Although the plants were grown under controlled hydroponic conditions, hyperspectral measurements were acquired under direct sunlight. Variation in solar irradiance, solar angle, leaf orientation, and measurement geometry may therefore have increased within-species spectral variability and overlap between classes [127,128]. Spectral discrimination may also vary with leaf age and developmental stage, which can alter the degree of separation between crop and weed spectra [129]. Differences in leaf size may have introduced additional measurement variability. The relatively large leaves of D. stramonium more readily filled the sensor field of view, whereas the smaller P. sativum leaflets provided a more limited reflective area. Consequently, background contamination, leaf-edge effects, shadows, and small differences in sensor positioning may have contributed to greater spectral variability among pea samples. The lower specificity for P. sativum may therefore reflect both genuine spectral overlap and greater measurement uncertainty associated with its smaller leaflets. Leaf morphology and the relationship between target size and sensor spatial resolution are important considerations in close-range hyperspectral measurements and species discrimination [99,130].
PCA and Random Forest provided complementary information linking biological responses to potential crop–weed detection. PCA summarized the major dimensions of species- and treatment-related spectral variation, whereas Random Forest demonstrated that these differences contained useful predictive information and identified the wavelengths most relevant to discrimination. The pronounced FR-induced elongation of D. stramonium highlights its capacity to respond to neighbor-associated light signals and provides a biological basis for future investigations of crop–weed competition in mixed stands. From an applied perspective, the strong discriminatory contribution of wavelengths between 649 and 668 nm identifies candidate spectral features for developing reduced-band crop–weed detection systems. If validated across growth stages, crop–weed combinations, and field environments, these features could support weed mapping and site-specific control, potentially reducing unnecessary herbicide application. However, the remaining spectral overlap and the misclassification of some crop plants as weeds indicate that further model development is required before treatment decisions can safely rely on this approach.
The strong FR-induced elongation of D. stramonium indicates that low R:FR may stimulate a competitive escape response rather than suppress weed growth. Therefore, spectral manipulation alone cannot yet be recommended for weed control. Future studies should test whether earlier canopy closure achieved through crop density, row spacing, cultivar architecture, or intercropping can reduce light availability to weeds [36]. More immediately, the identified red wavelengths may support reduced-band sensing for early weed detection and site-specific control.
The hydroponic system enabled examination of PPFD and FR effects under uniform water and nutrient conditions but did not reproduce soil mechanical resistance, resource heterogeneity, microbial interactions, or unrestricted root exploration. Moreover, the species were grown separately without direct crop–weed competition or complex field backgrounds. Consequently, neither the biological responses nor the observed hyperspectral discrimination should be interpreted as direct predictions of field performance. Before applying the method in precision weed management, it should be validated in natural soil, mixed crop–weed stands, multiple growth stages, variable illumination, and replicated field environments.
Overall, hyperspectral reflectance showed clear potential for distinguishing P. sativum from D. stramonium in plants grown under controlled conditions. Nevertheless, the moderate Cohen’s κ, unequal class performance, and remaining spectral overlap indicate that further validation is required. Under field conditions, soil background, canopy architecture, overlapping leaves, mixed pixels, variable illumination, and additional weed species may further affect model performance [131,132]. Future studies should combine standardized leaf-level measurements using a controlled internal light source with canopy-level hyperspectral or imaging measurements under field conditions.As highlighted by [133], translating weed detection into site-specific weed management requires spatial mapping of infestations to support targeted interventions and reduce unnecessary herbicide application. Validation across growth stages, environmental conditions, and field backgrounds, along with wavelength selection and integration with spatial or RGB information, may improve classification robustness before applying the method to operational precision weed management.
In summary, the results provided different levels of support for the three hypotheses. H1 was supported because FR supplementation increased shoot height and stem diameter more strongly in D. stramonium than in P. sativum, as demonstrated by significant Species × FR interactions. However, this greater plasticity was not evident for every morphological trait. H2 was partially supported: FR and PPFD produced independent and interactive effects, but these effects were trait-specific rather than consistent across all measured variables. FR significantly influenced several morphological, biomass, and spectral responses, whereas PPFD had a comparatively limited independent effect on morphology and biomass. Interactions were detected for particular responses, including the Species × FR effect on morphology, Species × PPFD effect on shoot biomass, and FR × PPFD effect on root biomass. H3 was supported under controlled conditions because the Random Forest model differentiated the species with an AUC of 0.839, an overall accuracy of 75%, and a Cohen’s κ of 0.473. Nevertheless, these performance measures indicate moderate-to-good discrimination rather than a field-ready classification system.
5. Conclusions
This study produced three principal findings regarding the morphological, bio-mass, physiological, and hyperspectral responses of P. sativum and D. stramonium to contrasting photosynthetic photon flux density (PPFD) and far-red (FR) radiation un-der controlled hydroponic conditions.
First, FR supplementation induced substantially greater morphological plasticity in D. stramonium than in P. sativum. Specifically, FR increased D. stramonium shoot height by 62.5% under higher PPFD and 101.2% under lower PPFD, whereas P. sativum showed no significant shoot-height response. This contrast highlights the spe-cies-specific sensitivity of plant architecture to FR radiation and the potential im-portance of neighbor-associated spectral signals in regulating weed growth.
Second, PPFD and FR influenced plant growth, biomass allocation, and physiolog-ical and spectral characteristics in a trait- and species-dependent manner. Significant main and interaction effects were observed for selected traits, but these responses were not consistent across all measured variables. In particular, root mass fraction differed significantly between species and exhibited a significant Species × PPFD interaction, whereas neither PPFD nor FR had a significant overall main effect on this trait. The physiological and spectral measurements further revealed species-dependent variation in responses to contrasting light environments. Together, these findings indicate that light intensity and spectral quality affect plant performance through distinct and in-teracting processes rather than producing uniform responses across traits.
Third, hyperspectral reflectance showed potential for distinguishing P. sativum from D. stramonium, particularly using red wavelengths (646–668 nm). The Random Forest model achieved 75.7% classification accuracy and an AUC of 0.839, demon-strating promising potential for crop–weed discrimination.
Future research should validate these findings in soil-grown, mixed crop–weed stands and across additional crop–weed combinations. Hormonal and molecular analyses could clarify the mechanisms underlying the pronounced FR response of D. stramonium, particularly the proposed phyB–PIF–auxin signaling pathway. Developing UAV-based hyperspectral monitoring systems with optimized wavelength selection and integrated RGB or spatial information could further support precision weed man-agement.
Supplementary Materials
The following supporting information can be downloaded at: https://www.mdpi.com/article/10.3390/agriculture16212382/s1, Figure S1: Layout of photon irradiance measurement positions and experimental design within the growth chamber, showing treatment combinations of light intensity (high and low) and far-red radiation (presence/absence); Figure S2: Hyperspectral reflectance spectra of P. sativum and D. stramonium: (a) raw spectra (350–2500 nm) before spectral preprocessing; (b) noise-filtered spectra after removal of wavelength regions affected by atmospheric water absorption and sensor noise; Figure S3: Effects of light intensity (photosynthetic photon flux density, PPFD; high and low) and far-red light supplementation (FR; present and absent) on shoot, root, and whole-plant dry biomass of P. sativum and D. stramonium. Boxplots show the distribution of shoot dry weight, root dry weight, and whole-plant dry weight for each treatment combination. The center line represents the median, the box indicates the interquartile range (IQR), whiskers extend to 1.5 × IQR, and individual points represent measurements from individual plants. Sample sizes were n = 14 per treatment for D. stramonium and n = 11, 10, 11, and 9 for P. sativum under NH, YH, NL, and YL, respectively; Figure S4: Effects of light intensity (photosynthetic photon flux density, PPFD; high and low) and far-red light supplementation (FR; present and absent) on root mass fraction (RMF) in P. sativum and D. stramonium. Boxplots show the distribution of RMF values for each treatment combination. The center line represents the median, the box indicates the interquartile range (IQR), whiskers extend to 1.5 × IQR, and individual points represent measurements from individual plants; Figure S5: Scree plot showing variance explained by principal components; Figure S6: Principal component analysis (PCA) biplot showing the distribution of samples across treatment combinations (species × PPFD × far-red radiation) based on spectral and physiological indices. SPAD, Soil Plant Analysis Development chlorophyll index; NDVI, normalized difference vegetation index; RDVI, renormalized difference vegetation index; MSAVI, modified soil-adjusted vegetation index; EVI, enhanced vegetation index; PRI, photochemical reflectance index; CRI, carotenoid reflectance index; RWI, ratio water index; PWI, plant water index; ARI, anthocyanin reflectance index; SIPI, structure-insensitive pigment index; Table S1: Eigenvalues and percentage of variance explained by principal components; Table S2: Loadings of spectral and physiological indices on the first three principal components (PC1–PC3).
Author Contributions
Conceptualization, S.Y.H. and G.M.; methodology, S.Y.H., L.B., R.L. and M.L.; software, S.Y.H.; validation, S.Y.H. and G.M.; formal analysis, S.Y.H.; investigation, S.Y.H. and L.B.; resources, S.Y.H. and G.M.; data curation, S.Y.H.; writing—original draft preparation, S.Y.H.; writing—review and editing, S.Y.H., Z.K. and L.B.; visualization, S.Y.H.; supervision, G.P.K. and G.M.; project administration, G.P.K. and G.M.; funding acquisition, G.P.K. and G.M. All authors have read and agreed to the published version of the manuscript.
Funding
This research received no external funding.
Institutional Review Board Statement
Not applicable.
Data Availability Statement
The datasets generated and/or analyzed during the current study are available from the corresponding author upon request.
Acknowledgments
The authors gratefully acknowledge the support of the Hungarian University of Agriculture and Life Sciences (MATE) and the Stipendium Hungaricum Scholarship Programme. Sherwan Yassin Hammad expresses his heartfelt gratitude to his father, whose unwavering encouragement, love, and belief in him have been a constant source of strength throughout this research.
Conflicts of Interest
The authors declare no conflicts of interest.
Abbreviations
The following abbreviations are used in this manuscript:
| ANOVA | Analysis of Variance |
| ARF6 | Auxin Response Factor 6 |
| ARI | Anthocyanin Reflectance Index |
| ASD | Analytical Spectral Devices |
| AUC | Area Under the Receiver Operating Characteristic Curve |
| BZR1 | Brassinazole-Resistant 1 |
| CRI | Carotenoid Reflectance Index |
| DELLA | DELLA Growth-Repressor Proteins |
| DLI | Daily Light Integral |
| DW | Dry Weight |
| EC | Electrical Conductivity |
| EVI | Enhanced Vegetation Index |
| FNR | False-Negative Rate |
| FPR | False-Positive Rate |
| FR | Far-Red Radiation |
| GA | Gibberellin |
| IQR | Interquartile Range |
| LED | Light-Emitting Diode |
| LMA | Leaf Mass per Area |
| MANOVA | Multivariate Analysis of Variance |
| MCARI | Modified Chlorophyll Absorption in Reflectance Index |
| NDVI | Normalized Difference Vegetation Index |
| NIR | Near-Infrared |
| PAR | Photosynthetically Active Radiation |
| PCA | Principal Component Analysis |
| PIF | Phytochrome-Interacting Factor |
| PIF4, PIF5, PIF7 | Phytochrome-Interacting Factors 4, 5, and 7 |
| phyB | Phytochrome B |
| PPFD | Photosynthetic Photon Flux Density |
| PRI | Photochemical Reflectance Index |
| PWI | Plant Water Index |
| R:FR | Red-to-Far-Red Ratio |
| RDVI | Renormalized Difference Vegetation Index |
| RF | Random Forest |
| RGB | Red–Green–Blue |
| RMF | Root Mass Fraction |
| ROC | Receiver Operating Characteristic |
| SAS | Shade Avoidance Syndrome |
| SD | Standard Deviation |
| SIPI | Structure-Insensitive Pigment Index |
| SLA | Specific Leaf Area |
| SPAD | Soil–Plant Analysis Development |
| SRWI | Simple Ratio Water Index |
| SWIR | Short-Wave Infrared |
| WW | Wet Weight |
References
- Kasonta, A.A.; Thakur, S.S.; Shukuru, B. Weeds in agricultural and non-agricultural systems: Media influence, impacts and trends for a better systematic control against alternate and collateral hosts of crop pests. Plant Sci. Today 2025, 12. [Google Scholar] [CrossRef] [Scilit]
- Hirani, A.K.; Korav, S.; Rajanna, G.A.; Elansary, H.O.; Mahmoud, E.A. Determination of critical crop-weed competition period: Impact on growth, nutrient dynamics and productivity of green gram (Vigna radiata). Heliyon 2024, 10, e36855. [Google Scholar] [CrossRef] [Scilit] [PubMed]
- Savić, A.; Popović, A.; Đurović, S.; Pisinov, B.; Ugrinović, M.; Todorović, M.J. A Framework for Understanding Crop–Weed Competition in Agroecosystems. Agronomy 2025, 15, 2366. [Google Scholar] [CrossRef] [Scilit]
- Colbach, N.; Gardarin, A.; Moreau, D. The response of weed and crop species to shading: Which parameters explain weed impacts on crop production? Field Crop. Res. 2019, 238, 45–55. [Google Scholar] [CrossRef] [Scilit]
- McDonald, G.K.; Gill, G.S. Improving Crop Competitiveness with Weeds: Adaptations and Trade-offs. In Crop Physiology: Applications for Genetic Improvement and Agronomy; Academic Press: Cambridge, MA, USA, 2009; pp. 449–488. [Google Scholar]
- Almoshileh, A.M.; Al-Dhuwaian, M.A. Light manipulating in greenhouses for plant requirements. Acta Hortic. 2014, 1037, 869–874. [Google Scholar] [CrossRef] [Scilit]
- Kamrani, L.Y.; Ghobadi, M.E.; Ghobadi, M.; Honarmand, S.J. The effect of light quantity at different growth stages on agronomic traits of chickpea (Cicer arietinum L.). Environ. Stress. Crop Sci. 2026, 19, 41–55. [Google Scholar]
- Dong, C.; Fu, Y.; Liu, G.; Liu, H. Low light intensity effects on the growth, photosynthetic characteristics, antioxidant capacity, yield and quality of wheat (Triticum aestivum L.) at different growth stages in BLSS. Adv. Sp. Res. 2014, 53, 1557–1566. [Google Scholar] [CrossRef] [Scilit]
- Walter, A.; Nagel, K.A. Root growth reacts rapidly and more pronounced than shoot growth towards increasing light intensity in tobacco seedlings. Plant Signal. Behav. 2006, 1, 225–226. [Google Scholar] [CrossRef] [Scilit] [PubMed]
- Esmaeili, S.; Aliniaeifard, S.; Dianati Daylami, S.; Karimi, S.; Shomali, A.; Didaran, F.; Telesiński, A.; Sierka, E.; Kalaji, H.M. Elevated light intensity compensates for nitrogen deficiency during chrysanthemum growth by improving water and nitrogen use efficiency. Sci. Rep. 2022, 12, 10002. [Google Scholar] [CrossRef] [Scilit] [PubMed]
- Chen, S.; Wang, D.; Lin, J.; Xu, Z. The Comprehensive Regulation of Light Intensity and Photoperiod on Growth and Yield of Virus-Free Potato Under the Same Daily Light Integral. Agronomy 2025, 15, 898. [Google Scholar] [CrossRef] [Scilit]
- Franklin, K.A.; Praekelt, U.; Stoddart, W.M.; Billingham, O.E.; Halliday, K.J.; Whitelam, G.C. Phytochromes B, D, and E act redundantly to control multiple physiological responses in Arabidopsis. Plant Physiol. 2003, 131, 1340–1346. [Google Scholar] [CrossRef] [Scilit] [PubMed]
- de Wit, M.; Keuskamp, D.H.; Bongers, F.J.; Hornitschek, P.; Gommers, C.M.M.; Reinen, E.; Martínez-Cerón, C.; Fankhauser, C.; Pierik, R. Integration of Phytochrome and Cryptochrome Signals Determines Plant Growth during Competition for Light. Curr. Biol. 2016, 26, 3320–3326. [Google Scholar] [CrossRef] [Scilit] [PubMed]
- Mizuno, T.; Oka, H.; Yoshimura, F.; Ishida, K.; Yamashino, T. Insight into the mechanism of end-of-day far-red light (EODFR)-induced Shade avoidance responses in Arabidopsis thaliana. Biosci. Biotechnol. Biochem. 2015, 79, 1987–1994. [Google Scholar] [CrossRef] [Scilit] [PubMed]
- Goel, P.K.; Prasher, S.O.; Landry, J.A.; Patel, R.M.; Bonnell, R.B.; Viau, A.A.; Miller, J.R. Potential of airborne hyperspectral remote sensing to detect nitrogen deficiency and weed infestation in corn. Comput. Electron. Agric. 2003, 38, 99–124. [Google Scholar] [CrossRef] [Scilit]
- Herritt, M.; Dhanapal, A.P.; Fritschi, F.B. Identification of Genomic Loci Associated with the Photochemical Reflectance Index by Genome-Wide Association Study in Soybean. Plant Genome 2016, 9. [Google Scholar] [CrossRef] [Scilit] [PubMed]
- Sharma, A.; Pridgeon, A.J.; Liu, W.; Segers, F.; Sharma, B.; Jenkins, G.I.; Franklin, K.A. ELONGATED HYPOCOTYL5 (HY5) and HY5 HOMOLOGUE (HYH) maintain shade avoidance suppression in UV-B. Plant J. 2023, 115, 1394–1407. [Google Scholar] [CrossRef] [Scilit] [PubMed]
- Izaguirre, M.M.; Mazza, C.A.; Biondini, M.; Baldwin, I.T.; Ballaré, C.L. Remote sensing of future competitors: Impacts on plants defenses. Proc. Natl. Acad. Sci. USA 2006, 103, 7170–7174. [Google Scholar] [CrossRef] [Scilit] [PubMed]
- Ma, L.; Li, Y.; Li, X.; Xu, D.; Lin, X.; Liu, M.; Li, G.; Qin, X. FAR-RED ELONGATED HYPOCOTYLS3 negatively regulates shade avoidance responses in Arabidopsis. Plant Cell Environ. 2019, 42, 3280–3292. [Google Scholar] [CrossRef] [Scilit] [PubMed]
- Yang, C.; Xie, F.; Jiang, Y.; Li, Z.; Huang, X.; Li, L. Phytochrome A Negatively Regulates the Shade Avoidance Response by Increasing Auxin/Indole Acidic Acid Protein Stability. Dev. Cell 2018, 44, 29–41.e4. [Google Scholar] [CrossRef] [Scilit] [PubMed]
- Fraser, D.P.; Panter, P.E.; Sharma, A.; Sharma, B.; Dodd, A.N.; Franklin, K.A. Phytochrome A elevates plant circadian-clock components to suppress shade avoidance in deep-canopy shade. Proc. Natl. Acad. Sci. USA 2021, 118, e2108176118. [Google Scholar] [CrossRef] [Scilit] [PubMed]
- Ballaré, C.L. Light regulation of plant defense. Annu. Rev. Plant Biol. 2014, 65, 335–363. [Google Scholar] [CrossRef] [Scilit] [PubMed]
- Cerdán, P.D.; Chory, J. Regulation of flowering time by light quality. Nature 2003, 423, 881–885. [Google Scholar] [CrossRef] [Scilit] [PubMed]
- Park, Y.; Runkle, E.S. Far-red radiation and photosynthetic photon flux density independently regulate seedling growth but interactively regulate flowering. Environ. Exp. Bot. 2018, 155, 206–216. [Google Scholar] [CrossRef] [Scilit]
- Meng, Q.; Runkle, E.S. Far-red radiation interacts with relative and absolute blue and red photon flux densities to regulate growth, morphology, and pigmentation of lettuce and basil seedlings. Sci. Hortic. 2019, 255, 269–280. [Google Scholar] [CrossRef] [Scilit]
- Zhen, S. Substituting Far-Red for Traditionally Defined Photosynthetic Photons Results in Equal Canopy Quantum Yield for CO2 Fixation and Increased Photon Capture During Long-Term Studies: Implications for Re-Defining PAR. Front. Plant Sci. 2020, 11, 581156. [Google Scholar] [CrossRef] [Scilit] [PubMed]
- Liu, J.; van Iersel, M.W. Far-red Photons Increase Light Capture but Have Lower Photosynthetic Capacity Than Red Photons. J. Am. Soc. Hortic. Sci. 2023, 148, 253–265. [Google Scholar] [CrossRef] [Scilit]
- Van de Velde, E.; Steppe, K.; Van Labeke, M.-C. Leaf morphology, optical characteristics and phytochemical traits of butterhead lettuce affected by increasing the far-red photon flux. Front. Plant Sci. 2023, 14, 1129335. [Google Scholar] [CrossRef] [Scilit] [PubMed]
- Yan, Z.; Li, X.; Li, Z.; Qi, Y.; Song, J.; Cheng, F.; Dou, H.; Yang, Y. Partially Substituting Photosynthetic Photon Flux Density with Far-red Photons Differentially Alters Biomass Accumulation and Photochemical Efficiency of Greenhouse Lettuce. HortScience 2024, 59, 1691–1699. [Google Scholar] [CrossRef] [Scilit]
- Skabelund, H.A.; Langenfeld, N.J.; Bugbee, B. On the Lack of Morphological Response to Far-red at High and Low Photon Flux in Spinach. HortScience 2025, 60, 415–418. [Google Scholar] [CrossRef] [Scilit]
- Lambrecht, D.M.; Diel, M.I.; Lucio, A.D.; Tischler, A.L.; Sgarbossa, J.; Peripolli, M. Plastochron, phenology, and production of green pea in different growing seasons. Cienc. Agrotecnologia 2023, 47, e008222. [Google Scholar] [CrossRef] [Scilit]
- Smolikova, G.N.; Stepanova, N.V.; Kamionskaya, A.M.; Medvedev, S.S. Photochemical activity in developing pea (Pisum sativum L.) cotyledons depends on the light transmittance of covering tissues and the spectral composition of light. Vavilovskii Zhurnal Genet. Sel. 2023, 27, 980–987. [Google Scholar] [CrossRef] [Scilit] [PubMed]
- Chadha, A.; Florentine, S.; Javaid, M.; Welgama, A.; Turville, C. Influence of elements of climate change on the growth and fecundity of Datura stramonium. Environ. Sci. Pollut. Res. 2020, 27, 35859–35869. [Google Scholar] [CrossRef] [Scilit] [PubMed]
- Hirano, I.; Iida, H.; Ito, Y.; Park, H.-D.; Takahashi, K. Effects of light conditions on growth and defense compound contents of Datura inoxia and D. stramonium. J. Plant Res. 2019, 132, 473–480. [Google Scholar] [CrossRef] [Scilit] [PubMed]
- McDonald, G.K. Competitiveness against grass weeds in field pea genotypes. Weed Res. 2003, 43, 48–58. [Google Scholar] [CrossRef] [Scilit]
- Colbach, N.; Felten, E.; Gée, C.; Klein, A.; Lannuzel, L.; Lecomte, C.; Maillot, T.; Strbik, F.; Villerd, J.; Moreau, D. Tracking Ideal Varieties and Cropping Techniques for Agroecological Weed Management: A Simulation-Based Study on Pea. Front. Plant Sci. 2022, 13, 809056. [Google Scholar] [CrossRef] [Scilit] [PubMed]
- Qadir, S.; Khan, A.; Salam, I.U. Biomass yield and growth allometry of some crops growing under weed stress. Biodiversitas 2020, 21, 5621–5629. [Google Scholar] [CrossRef] [Scilit]
- Boshkovski, B.; Tzerakis, C.; Doupis, G.; Zapolska, A.; Kalaitzidis, C.; Koubouris, G. Relationship between physiological and biochemical measurements with spectral reflectance for two Phaseolus vulgaris L. genotypes under multiple stress. Int. J. Remote Sens. 2021, 42, 1230–1249. [Google Scholar] [CrossRef] [Scilit]
- Liu, C.; Sun, P.-S.; Liu, S.-R. A review of plant spectral reflectance response to water physiological changes. Chin. J. Plant Ecol. 2016, 40, 80–91. [Google Scholar] [CrossRef] [Scilit]
- Im, J.; Jensen, J.R. Hyperspectral remote sensing of vegetation. Geogr. Compass 2008, 2, 1943–1961. [Google Scholar] [CrossRef] [Scilit]
- Meroni, M.; Rossini, M.; Picchi, V.; Panigada, C.; Cogliati, S.; Nali, C.; Colombo, R. Assessing steady-state fluorescence and PRI from hyperspectral proximal sensing as early indicators of plant stress: The case of ozone exposure. Sensors 2008, 8, 1740–1754. [Google Scholar] [CrossRef] [Scilit] [PubMed]
- Dmitriev, P.A.; Kozlovsky, B.L.; Dmitrieva, A.A.; Lysenko, V.S.; Chokheli, V.A.; Varduni, T.V. Indication of Light Stress in Ficus elastica Using Hyperspectral Imaging. AgriEngineering 2023, 5, 2253–2265. [Google Scholar] [CrossRef] [Scilit]
- Lencina, A.; Weber, C. Support Vector Classification Applied to Wheat and Ryegrass Spectral Signatures Discrimination: Dimensionality Reduction Analysis. J. Indian Soc. Remote Sens. 2026, 54, 49–60. [Google Scholar] [CrossRef] [Scilit]
- Pignatti, S.; Casa, R.; Harfouche, A.; Huang, W.; Palombo, A.; Pascucci, S. Maize crop and weeds species detection by using UAV VNIR hyperpectral data. In International Geoscience and Remote Sensing Symposium (IGARSS); IEEE: Piscataway, NJ, USA, 2019; pp. 7235–7238. [Google Scholar]
- Ronay, I.; Lati, R.N.; Kizel, F. Weed Species Identification: Acquisition, Feature Analysis, and Evaluation of a Hyperspectral and RGB Dataset with Labeled Data. Remote Sens. 2024, 16, 2808. [Google Scholar] [CrossRef] [Scilit]
- Abd Ghani, R.; Omar, S.; Jolánkai, M.; Tarnawa, Á.; Kende, Z.; Khalid, N.; Gyuricza, C.; Kassai, M.K. Soilless Culture Applications for Early Development of Soybean Crop (Glycine max L. Merr). Agriculture 2023, 13, 1713. [Google Scholar] [CrossRef] [Scilit]
- Abd Ghani, R.; Omar, S.; Jolánkai, M.; Tarnawa, Á.; Khalid, N.; Kassai, M.K.; Kende, Z. Response of Shoot and Root Growth, Yield, and Chemical Composition to Nutrient Concentrations in Soybean Varieties Grown under Soilless and Controlled Environment Conditions. Agriculture 2023, 13, 1925. [Google Scholar] [CrossRef] [Scilit]
- Balázs, L.; Kovács, G.P.; Gyuricza, C.; Piroska, P.; Tarnawa, Á.; Kende, Z. Quantifying the effect of light intensity uniformity on the crop yield by pea microgreens growth experiments. Horticulturae 2023, 9, 1187. [Google Scholar] [CrossRef] [Scilit]
- Casal, J.J. Photoreceptor signaling networks in plant responses to shade. Annu. Rev. Plant Biol. 2013, 64, 403–427. [Google Scholar] [CrossRef] [Scilit] [PubMed]
- Ballaré, C.L.; Pierik, R. The shade-avoidance syndrome: Multiple signals and ecological consequences. Plant. Cell Environ. 2017, 40, 2530–2543. [Google Scholar] [CrossRef] [Scilit] [PubMed]
- Rouse, J.W., Jr.; Haas, R.H.; Deering, D.W.; Schell, J.A.; Harlan, J.C. Monitoring the Vernal Advancement and Retrogradation (Greenwave Effect) of Natural Vegetation; Contractor Report (CR); NASA: Washington, DC, USA, 1973. Available online: https://ntrs.nasa.gov/citations/19750020419 (accessed on 15 July 2026).
- Roujean, J.-L.; Breon, F.-M. Estimating PAR absorbed by vegetation from bidirectional reflectance measurements. Remote Sens. Environ. 1995, 51, 375–384. [Google Scholar] [CrossRef] [Scilit]
- Huete, A.; Didan, K.; Miura, T.; Rodriguez, E.P.; Gao, X.; Ferreira, L.G. Overview of the radiometric and biophysical performance of the MODIS vegetation indices. Remote Sens. Environ. 2002, 83, 195–213. [Google Scholar] [CrossRef] [Scilit]
- Haboudane, D.; Miller, J.R.; Tremblay, N.; Zarco-Tejada, P.J.; Dextraze, L. Integrated narrow-band vegetation indices for prediction of crop chlorophyll content for application to precision agriculture. Remote Sens. Environ. 2002, 81, 416–426. [Google Scholar] [CrossRef] [Scilit]
- Gitelson, A.A.; Merzlyak, M.N. Non-destructive assessment of chlorophyll carotenoid and anthocyanin content in higher plant leaves: Principles and algorithms. In Remote Sensing for Agriculture and the Environment; Stamatiadis, S., Lynch, J.M., Schepers, J.S., Eds.; Peripheral Editions: Ella, Greece, 2004. [Google Scholar]
- Gitelson, A.A.; Merzlyak, M.N.; Zur, Y.; Stark, R.; Gritz, U. Non-destructive and remote sensing techniques for estimation of vegetation status. In Proceedings of the 3rd European Conference on Precision Agriculture; Wiley: Hoboken, NJ, USA, 2001. [Google Scholar]
- Penuelas, J.; Baret, F.; Filella, I. Semi-empirical indices to assess carotenoids/chlorophyll a ratio from leaf spectral reflectance. Photosynthetica 1995, 31, 221–230. [Google Scholar]
- Gamon, J.A.; Penuelas, J.; Field, C.B. A narrow-waveband spectral index that tracks diurnal changes in photosynthetic efficiency. Remote Sens. Environ. 1992, 41, 35–44. [Google Scholar] [CrossRef] [Scilit]
- Penuelas, J.; Pinol, J.; Ogaya, R.; Filella, I. Estimation of plant water concentration by the reflectance water index WI (R900/R970). Int. J. Remote Sens. 1997, 18, 2869–2875. [Google Scholar] [CrossRef] [Scilit]
- Zarco-Tejada, P.J.; Rueda, C.A.; Ustin, S.L. Water content estimation in vegetation with MODIS reflectance data and model inversion methods. Remote Sens. Environ. 2003, 85, 109–124. [Google Scholar] [CrossRef] [Scilit]
- Mishra, P.; Pandey, C.M.; Singh, U.; Gupta, A.; Sahu, C.; Keshri, A. Descriptive statistics and normality tests for statistical data. Ann. Card. Anaesth. 2019, 22, 67–72. [Google Scholar] [CrossRef] [Scilit] [PubMed]
- Kim, H.-Y. Statistical notes for clinical researchers: Assessing normal distribution (2) using skewness and kurtosis. Restor. Dent. Endod. 2013, 38, 52–54. [Google Scholar] [CrossRef] [Scilit] [PubMed]
- Sthle, L.; Wold, S. Analysis of variance (ANOVA). Chemom. Intell. Lab. Syst. 1989, 6, 259–272. [Google Scholar] [CrossRef] [Scilit]
- Lachenbruch, P.A.; Clements, P.J. Anova, kruskal-wallis, normal scores and unequal variance. Commun. Stat.—Theory Methods 1991, 20, 107–126. [Google Scholar] [CrossRef] [Scilit]
- Kusuma, P.; Bugbee, B. On the contrasting morphological response to far-red at high and low photon fluxes. Front. Plant Sci. 2023, 14, 1185622. [Google Scholar] [CrossRef] [Scilit] [PubMed]
- Park, Y.; Runkle, E.S. Far-red radiation promotes growth of seedlings by increasing leaf expansion and whole-plant net assimilation. Environ. Exp. Bot. 2017, 136, 41–49. [Google Scholar] [CrossRef] [Scilit]
- Fernández-Milmanda, G.L.; Ballaré, C.L. Shade Avoidance: Expanding the Color and Hormone Palette. Trends Plant Sci. 2021, 26, 509–523. [Google Scholar] [CrossRef] [Scilit] [PubMed]
- Huang, X.; Zhang, Q.; Jiang, Y.; Yang, C.; Wang, Q.; Li, L. Shade-induced nuclear localization of PIF7 is regulated by phosphorylation and 14-3-3 proteins in Arabidopsis. eLife 2018, 7, e31636. [Google Scholar] [CrossRef] [Scilit]
- Iglesias, M.J.; Sellaro, R.; Zurbriggen, M.D.; Casal, J.J. Multiple links between shade avoidance and auxin networks. J. Exp. Bot. 2018, 69, 213–228. [Google Scholar] [CrossRef] [Scilit] [PubMed]
- Bai, M.-Y.; Shang, J.-X.; Oh, E.; Fan, M.; Bai, Y.; Zentella, R.; Sun, T.-P.; Wang, Z.-Y. Brassinosteroid, gibberellin and phytochrome impinge on a common transcription module in Arabidopsis. Nat. Cell Biol. 2012, 14, 810–817. [Google Scholar] [CrossRef] [Scilit] [PubMed]
- de Lucas, M.; Prat, S. PIFs get BRright: PHYTOCHROME INTERACTING FACTORs as integrators of light and hormonal signals. New Phytol. 2014, 202, 1126–1141. [Google Scholar] [CrossRef] [Scilit] [PubMed]
- Pierik, R.; Cuppens, M.L.C.; Voesenek, L.A.C.J.; Visser, E.J.W. Interactions between ethylene and gibberellins in phytochrome-mediated shade avoidance responses in tobacco. Plant Physiol. 2004, 136, 2928–2936. [Google Scholar] [CrossRef] [Scilit] [PubMed]
- Polko, J.K.; Pierik, R.; Van Zanten, M.; Tarkowská, D.; Strnad, M.; Voesenek, L.A.C.J.; Peeters, A.J.M. Ethylene promotes hyponastic growth through interaction with ROTUNDIFOLIA3/CYP90C1 in Arabidopsis. J. Exp. Bot. 2013, 64, 613–624. [Google Scholar] [CrossRef] [Scilit] [PubMed]
- Polko, J.K.; van Rooij, J.A.; Vanneste, S.; Pierik, R.; Ammerlaan, A.M.H.; Vergeer-Van Eijk, M.H.; McLoughlin, F.; Gühl, K.; Van Isterdael, G.; Voesenek, L.A.C.J.; et al. Ethylene-mediated regulation of A2-type CYCLINs modulates hyponastic growth in Arabidopsis. Plant Physiol. 2015, 169, 194–208. [Google Scholar] [CrossRef] [Scilit] [PubMed]
- Li, J.; Yang, J.; Gao, Y.; Zhang, Z.; Gao, C.; Chen, S.; Liesche, J. Parallel auxin transport via PINs and plasmodesmata during the Arabidopsis leaf hyponasty response. Plant Cell Rep. 2024, 43, 4. [Google Scholar] [CrossRef] [Scilit] [PubMed]
- Sun, W.; Han, H.; Deng, L.; Sun, C.; Xu, Y.; Lin, L.; Ren, P.; Zhao, J.; Zhai, Q.; Li, C. Mediator subunit MED25 physically interacts with PHYTOCHROME INTERACTING FACTOR4 to regulate shade-induced hypocotyl elongation in tomato. Plant Physiol. 2020, 184, 1549–1562. [Google Scholar] [CrossRef] [Scilit] [PubMed]
- Kurepin, L.V.; Emery, R.J.N.; Pharis, R.P.; Reid, D.M. Uncoupling light quality from light irradiance effects in Helianthus annuus shoots: Putative roles for plant hormones in leaf and internode growth. J. Exp. Bot. 2007, 58, 2145–2157. [Google Scholar] [CrossRef] [Scilit] [PubMed]
- Mazzella, M.A.; Zanor, M.I.; Fernie, A.R.; Casal, J.J. Metabolic responses to red/far-red ratio and ontogeny show poor correlation with the growth rate of sunflower stems. J. Exp. Bot. 2008, 59, 2469–2477. [Google Scholar] [CrossRef] [Scilit] [PubMed][Green Version]
- Jeong, S.J.; Zhang, Q.; Niu, G.; Zhen, S. Synergistic enhancement of biomass allocation from leaves to stem by far-red light and warm temperature can lead to growth reductions. Environ. Exp. Bot. 2024, 228, 106024. [Google Scholar] [CrossRef] [Scilit]
- Van Gelderen, K.; Kang, C.; Pierik, R. Light signaling, root development, and plasticity. Plant Physiol. 2018, 176, 1049–1060. [Google Scholar] [CrossRef] [Scilit] [PubMed]
- Lee, H.-J.; Ha, J.-H.; Kim, S.-G.; Choi, H.-K.; Kim, Z.H.; Han, Y.-J.; Kim, J.-I.; Oh, Y.; Fragoso, V.; Shin, K.; et al. Stem-piped light activates phytochrome B to trigger light responses in Arabidopsis thaliana roots. Sci. Signal. 2016, 9, ra106. [Google Scholar] [CrossRef] [Scilit] [PubMed]
- Savvides, A.; Ntagkas, N.; Van Ieperen, W.; Dieleman, J.A.; Marcelis, L.F.M. Impact of light on leaf initiation: A matter of photosynthate availability in the apical bud? Funct. Plant Biol. 2014, 41, 547–556. [Google Scholar] [CrossRef] [Scilit] [PubMed]
- Poorter, H.; Niinemets, Ü.; Poorter, L.; Wright, I.J.; Villar, R. Causes and consequences of variation in leaf mass per area (LMA): A meta-analysis. New Phytol. 2009, 182, 565–588. [Google Scholar] [CrossRef] [Scilit] [PubMed]
- Yang, D.; Seaton, D.D.; Krahme, J.; Halliday, K.J. Photoreceptor effects on plant biomass, resource allocation, and metabolic state. Proc. Natl. Acad. Sci. USA 2016, 113, 7667–7672. [Google Scholar] [CrossRef] [Scilit] [PubMed]
- Demotes-Mainard, S.; Péron, T.; Corot, A.; Bertheloot, J.; Le Gourrierec, J.; Pelleschi-Travier, S.; Crespel, L.; Morel, P.; Huché-Thélier, L.; Boumaza, R.; et al. Plant responses to red and far-red lights, applications in horticulture. Environ. Exp. Bot. 2016, 121, 4–21. [Google Scholar] [CrossRef] [Scilit]
- Pastor-Andreu, P.; Moreno-Romero, J.; Urdin-Bravo, , M.; Urdin-Bravo, M.; Palau-Rodriguez, J.; Paulisic, S.; Kastanaki, E.; Vives-Peris, V.; Gomez-Cadenas, A.; Esteve-Codina, A.; et al. Temporal and spatial frameworks supporting plant responses to vegetation proximity. Plant Physiology 2024, 196, 2048–2063. [Google Scholar] [CrossRef] [Scilit]
- Zhang, Y.-T.; Zhang, Y.-Q.; Yang, Q.-C.; Li, T. Overhead supplemental far-red light stimulates tomato growth under intra-canopy lighting with LEDs. J. Integr. Agric. 2019, 18, 62–69. [Google Scholar] [CrossRef] [Scilit]
- Zou, J.; Zhang, Y.; Zhang, Y.; Bian, Z.; Fanourakis, D.; Yang, Q.; Li, T. Morphological and physiological properties of indoor cultivated lettuce in response to additional far-red light. Sci. Hortic. 2019, 257, 108725. [Google Scholar] [CrossRef] [Scilit]
- Kelly, N.; Runkle, E.S. Dependence of far-red light on red and green light at increasing growth of lettuce. PLoS ONE 2024, 19, e0313084. [Google Scholar] [CrossRef] [Scilit] [PubMed]
- Liu, L.; Gai, S.; Liu, C.; Zeng, Z.; Tan, X.; Li, J.; Zhou, Z. The Effect of Far-Red Light on the Growth of Tobacco Leaves. Plants 2025, 14, 2520. [Google Scholar] [CrossRef] [Scilit] [PubMed]
- Dou, H.; Li, X.; Li, Z.; Song, J.; Yang, Y.; Yan, Z. Supplementary Far-Red Light for Photosynthetic Active Radiation Differentially Influences the Photochemical Efficiency and Biomass Accumulation in Greenhouse-Grown Lettuce. Plants 2024, 13, 2169. [Google Scholar] [CrossRef] [Scilit] [PubMed]
- Surya, K.; Krishnan, R.; Saitheja, V.; Janaki, P.; Parameswari, E.; Kumar, G.S.; Gnanachitra, M.; Suresh, K.; Paul, R.A.I.; Anbazhagan, A. Phytochrome-mediated shade-avoidance responses and its impact on growth and physiology in crops—A review. Photochem. Photobiol. 2026. online. [Google Scholar] [CrossRef] [Scilit] [PubMed]
- Bai, C.; Zhang, R.; Xu, Z.; Jin, B.; Chen, J.; Zhang, S.; Qian, L. Kernel Low-Rank Entropic Component Analysis for Hyperspectral Image Classification. IEEE J. Sel. Top. Appl. Earth Obs. Remote Sens. 2020, 13, 5682–5693. [Google Scholar] [CrossRef] [Scilit]
- Wang, Q.; Ning, Z.; Awan, S.A.; Gao, J.; Chen, J.; Lei, Y.; Tan, X.; Wu, X.; Wu, Y.; Liu, C.; et al. Far-red light mediates light energy capture and distribution in soybeans (Glycine max L.) under the shade. Plant Physiol. Biochem. 2023, 204, 108130. [Google Scholar] [CrossRef] [Scilit] [PubMed]
- Hitz, T.; Hartung, J.; Graeff-Hönninger, S.; Munz, S. Morphological response of soybean (Glycine max (L.) Merr.) cultivars to light intensity and red to far-red ratio. Agronomy 2019, 9, 428. [Google Scholar] [CrossRef] [Scilit]
- Mohd Asaari, M.S.; Mertens, S.; Verbraeken, L.; Dhondt, S.; Inzé, D.; Bikram, K.; Scheunders, P. Non-destructive analysis of plant physiological traits using hyperspectral imaging: A case study on drought stress. Comput. Electron. Agric. 2022, 195, 106806. [Google Scholar] [CrossRef] [Scilit]
- Yendrek, C.R.; Tomaz, T.; Montes, C.M.; Cao, Y.; Morse, A.M.; Brown, P.J.; McIntyre, L.M.; Leakey, A.D.B.; Ainsworth, E.A. High-throughput phenotyping of maize leaf physiological and biochemical traits using hyperspectral reflectance. Plant Physiol. 2017, 173, 614–626. [Google Scholar] [CrossRef] [Scilit] [PubMed]
- Falcioni, R.; Moriwaki, T.; Pattaro, M.; Herrig Furlanetto, R.; Nanni, M.R.; Camargos Antunes, W. High resolution leaf spectral signature as a tool for foliar pigment estimation displaying potential for species differentiation. J. Plant Physiol. 2020, 249, 153161. [Google Scholar] [CrossRef] [Scilit] [PubMed]
- Panigrahy, S.; Kumar, T.; Manjunath, K.R. Hyperspectral leaf signature as an added dimension for species discrimination: Case study of four tropical mangroves. Wetl. Ecol. Manag. 2012, 20, 101–110. [Google Scholar] [CrossRef] [Scilit]
- Feilhauer, H.; Somers, B.; van der Linden, S. Optical trait indicators for remote sensing of plant species composition: Predictive power and seasonal variability. Ecol. Indic. 2017, 73, 825–833. [Google Scholar] [CrossRef] [Scilit]
- Corbin, J.P.M.; Best, R.J.; Garthwaite, I.J.; Cooper, H.F.; Doughty, C.E.; Gehring, C.A.; Hultine, K.R.; Allan, G.J.; Whitham, T.G. Hyperspectral Leaf Reflectance Detects Interactive Genetic and Environmental Effects on Tree Phenotypes, Enabling Large-Scale Monitoring and Restoration Planning Under Climate Change. Plant Cell Environ. 2025, 48, 1842–1857. [Google Scholar] [CrossRef] [Scilit] [PubMed]
- Wang, Q.; Moreno-Martínez, Á.; Muñoz-Marí, J.; Campos-Taberner, M.; Camps-Valls, G. Estimation of vegetation traits with kernel NDVI. ISPRS J. Photogramm. Remote Sens. 2023, 195, 408–417. [Google Scholar] [CrossRef] [Scilit]
- Wijewardane, N.K.; Zhang, H.; Yang, J.; Schnable, J.C.; Schachtman, D.P.; Ge, Y. A leaf-level spectral library to support high-throughput plant phenotyping: Predictive accuracy and model transfer. J. Exp. Bot. 2023, 74, 4050–4062. [Google Scholar] [CrossRef] [Scilit]
- Blackburn, G.A. Hyperspectral remote sensing of plant pigments. J. Exp. Bot. 2007, 58, 855–867. [Google Scholar] [CrossRef] [Scilit] [PubMed]
- Filella, I.; Porcar-Castell, A.; Munné-Bosch, S.; Bäck, J.; Garbulsky, M.F.; Peñuelas, J. PRI assessment of long-term changes in carotenoids/chlorophyll ratio and short-term changes in de-epoxidation state of the xanthophyll cycle. Int. J. Remote Sens. 2009, 30, 4443–4455. [Google Scholar] [CrossRef] [Scilit]
- Garrity, S.R.; Eitel, J.U.H.; Vierling, L.A. Disentangling the relationships between plant pigments and the photochemical reflectance index reveals a new approach for remote estimation of carotenoid content. Remote Sens. Environ. 2011, 115, 628–635. [Google Scholar] [CrossRef] [Scilit]
- Guo, J.; Trotter, C.M. Estimating photosynthetic light-use efficiency using the photochemical reflectance index: Variations among species. Funct. Plant Biol. 2004, 31, 255–265. [Google Scholar] [CrossRef] [Scilit] [PubMed]
- Wong, C.Y.S.; Gamon, J.A. Three causes of variation in the photochemical reflectance index (PRI) in evergreen conifers. New Phytol. 2015, 206, 187–195. [Google Scholar] [CrossRef] [Scilit] [PubMed]
- Nakamura, Y.; Tsujimoto, K.; Ogawa, T.; Noda, H.M.; Hikosaka, K. Correction of photochemical reflectance index (PRI) by optical indices to predict non-photochemical quenching (NPQ) across various species. Remote Sens. Environ. 2024, 305, 114062. [Google Scholar] [CrossRef] [Scilit]
- Lisina, T.N.; Chetina, O.A.; Parfenkova, V.A.; Burdysheva, O.V.; Sholgin, E.S. The Ratio of Red to Far-Red Light Affects Growth, Pigment Content, and Photosynthetic Rates in Cress Plants. Russ. J. Plant Physiol. 2024, 71, 27. [Google Scholar] [CrossRef] [Scilit]
- Kreslavski, V.D.; Pashkovskiy, P.P.; Shmarev, A.N.; Khudyakova, A.Y.; Strokina, V.V.; Ivanov, A.A.; Kosobryukhov, A.A.; Allakhverdiev, S.I. Additional far-red light improves the growth and resistance of the photosynthetic apparatus of Lactuca sativa L. to high-intensity light. Photosynthetica 2025, 63, 322–331. [Google Scholar] [CrossRef] [Scilit] [PubMed]
- Ji, T.; Wang, B.; Yang, J.-Y.; Liu, X.-N.; Wang, H.-W.; Wang, C.-L.; Pan, D.-R.; Xu, J. Hyperspectral-Based Estimation on the Chlorophyll Content of Turfgrass. Guang Pu Xue Yu Guang Pu Fen Xi/Spectroscopy Spectr. Anal. 2020, 40, 2571–2577. [Google Scholar]
- Ma, J.; Wang, H. Relationship analysis between executive motivation and digital transformation in Chinese A-Share companies: An empirical study. Heliyon 2024, 10, e25011. [Google Scholar] [CrossRef] [Scilit] [PubMed]
- Daughtry, C.S.T.; Walthall, C.L.; Kim, M.S.; de Colstoun, E.B.; McMurtrey, J.E. Estimating Corn Leaf Chlorophyll Concentration from Leaf and Canopy Reflectance. Remote Sens. Environ. 2000, 74, 229–239. [Google Scholar] [CrossRef] [Scilit]
- Xiong, D.; Chen, J.; Yu, T.; Gao, W.; Ling, X.; Li, Y.; Peng, S.; Huang, J. SPAD-based leaf nitrogen estimation is impacted by environmental factors and crop leaf characteristics. Sci. Rep. 2015, 5, 13389. [Google Scholar] [CrossRef] [Scilit] [PubMed]
- Uddling, J.; Gelang-Alfredsson, J.; Piikki, K.; Pleijel, H. Evaluating the relationship between leaf chlorophyll concentration and SPAD-502 chlorophyll meter readings. Photosynth. Res. 2007, 91, 37–46. [Google Scholar] [CrossRef] [Scilit] [PubMed]
- Falcioni, R.; Antunes, W.C.; Berti de Oliveira, R.; Chicati, M.L.; Demattê, J.A.M.; Nanni, M.R. Hyperspectral and Chlorophyll Fluorescence Analyses of Comparative Leaf Surfaces Reveal Cellular Influences on Leaf Optical Properties in Tradescantia Plants. Cells 2024, 13, 952. [Google Scholar] [CrossRef] [Scilit]
- Ma, L.; Upadhyaya, M.K. Changes in leaf optical properties during tomato, common lamb’s-quarters, and redroot pigweed plant development. Agron. J. 2021, 113, 2534–2543. [Google Scholar] [CrossRef] [Scilit]
- Tong, F.; Zhang, Y. Spectral-Spatial and Cascaded Multilayer Random Forests for Tree Species Classification in Airborne Hyperspectral Images. IEEE Trans. Geosci. Remote Sens. 2022, 60, 4411711. [Google Scholar] [CrossRef] [Scilit]
- Mudereri, B.T.; Dube, T.; Niassy, S.; Kimathi, E.; Landmann, T.; Khan, Z.; Abdel-Rahman, E.M. Is it possible to discern Striga weed (Striga hermonthica) infestation levels in maize agro-ecological systems using in-situ spectroscopy? Int. J. Appl. Earth Obs. Geoinf. 2020, 85, 102008. [Google Scholar] [CrossRef] [Scilit]
- Fernandes, P.; Pereira da Silva, S.D.; Fantinel, R.A.; Junior, N.B.; de Sousa-Baracho, I.P.; Schuh, M.S.; Pereira, R.S.; Eugenio, F.C. Use of hyperspectral sensor and random forest for broadleaf and narrowleaf weed differentiation. New For. 2025, 56, 46. [Google Scholar] [CrossRef] [Scilit]
- Liu, B.; Fang, J.-Y.; Liu, X.; Zhang, L.-F.; Zhang, B.; Tong, Q.-X. Research on crop-weed discrimination using a field imaging spectrometer. Guang Pu Xue Yu Guang Pu Fen Xi/Spectroscopy Spectr. Anal. 2010, 30, 1830–1833. [Google Scholar]
- Eddy, P.R.; Smith, A.M.; Hill, B.D.; Peddle, D.R.; Coburn, C.A.; Blackshaw, R.E. Weed and crop discrimination using hyperspectral image data and reduced bandsets. Can. J. Remote Sens. 2014, 39, 481–490. [Google Scholar] [CrossRef] [Scilit]
- Johnson, R.M.; Orgeron, A.J.; Spaunhorst, D.J.; Huang, I.-S.; Zimba, P. V Discrimination of weeds from sugarcane in Louisiana using hyperspectral leaf reflectance data and pigment analysis. Weed Technol. 2023, 37, 123–131. [Google Scholar] [CrossRef] [Scilit]
- Rapaport, T.; Hochberg, U.; Shoshany, M.; Karnieli, A.; Rachmilevitch, S. Combining leaf physiology, hyperspectral imaging and partial least squares-regression (PLS-R) for grapevine water status assessment. ISPRS J. Photogramm. Remote Sens. 2015, 109, 88–97. [Google Scholar] [CrossRef] [Scilit]
- Osono, T.; Lin, W.; Hasegawa, M.; Uchida, M. Characterization and discrimination of tundra plant leaves by Attenuated Total Reflection Fourier transform infrared spectroscopy. Polar Sci. 2024, 41, 101037. [Google Scholar] [CrossRef] [Scilit]
- Zhang, Y.; Slaughter, D.C. Hyperspectral species mapping for automatic weed control in tomato under thermal environmental stress. Comput. Electron. Agric. 2011, 77, 95–104. [Google Scholar] [CrossRef] [Scilit]
- He, L.; Liu, M.-R.; Guo, Y.-L.; Wei, Y.-K.; Zhang, H.-Y.; Song, X.; Feng, W.; Guo, T.-C. Angular effect of algorithms for monitoring leaf nitrogen concentration of wheat using multi-angle remote sensing data. Comput. Electron. Agric. 2022, 195, 106815. [Google Scholar] [CrossRef] [Scilit]
- Basinger, N.T.; Jennings, K.M.; Hestir, E.L.; Monks, D.W.; Jordan, D.L.; Everman, W.J. Phenology affects differentiation of crop and weed species using hyperspectral remote sensing. Weed Technol. 2020, 34, 897–908. [Google Scholar] [CrossRef] [Scilit]
- Villegas, G.; Liao, W.; Criollo, R.; Philips, W.; Ochoa, D. Detection of leaf structures in close-range hyperspectral images using morphological fusion. Geo-Spat. Inf. Sci. 2017, 20, 325–332. [Google Scholar] [CrossRef] [Scilit]
- Darvishzadeh, R.; Skidmore, A.; Atzberger, C.; van Wieren, S. Estimation of vegetation LAI from hyperspectral reflectance data: Effects of soil type and plant architecture. Int. J. Appl. Earth Obs. Geoinf. 2008, 10, 358–373. [Google Scholar] [CrossRef] [Scilit]
- Qiu, L.; Ke, X.; Sun, X.; Lu, Y.; Shi, S.; Liu, W. Investigating the Influence of the Weed Layer on Crop Canopy Reflectance and LAI Inversion Using Simulations and Measurements in a Sugarcane Field. Remote Sens. 2025, 17, 2014. [Google Scholar] [CrossRef] [Scilit]
- Hammad, S.Y.; Kovács, G.P.; Milics, G. Ambrosia artemisiifolia in Hungary: A Review of Challenges, Impacts, and Precision Agriculture Approaches for Sustainable Site-Specific Weed Management Using UAV Technologies. AgriEngineering 2026, 8, 30. [Google Scholar] [CrossRef] [Scilit]
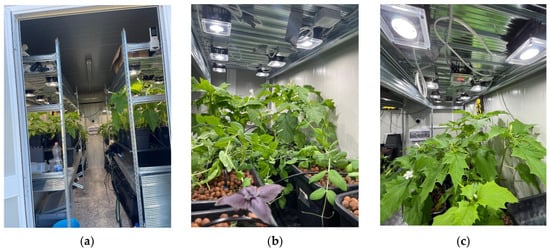
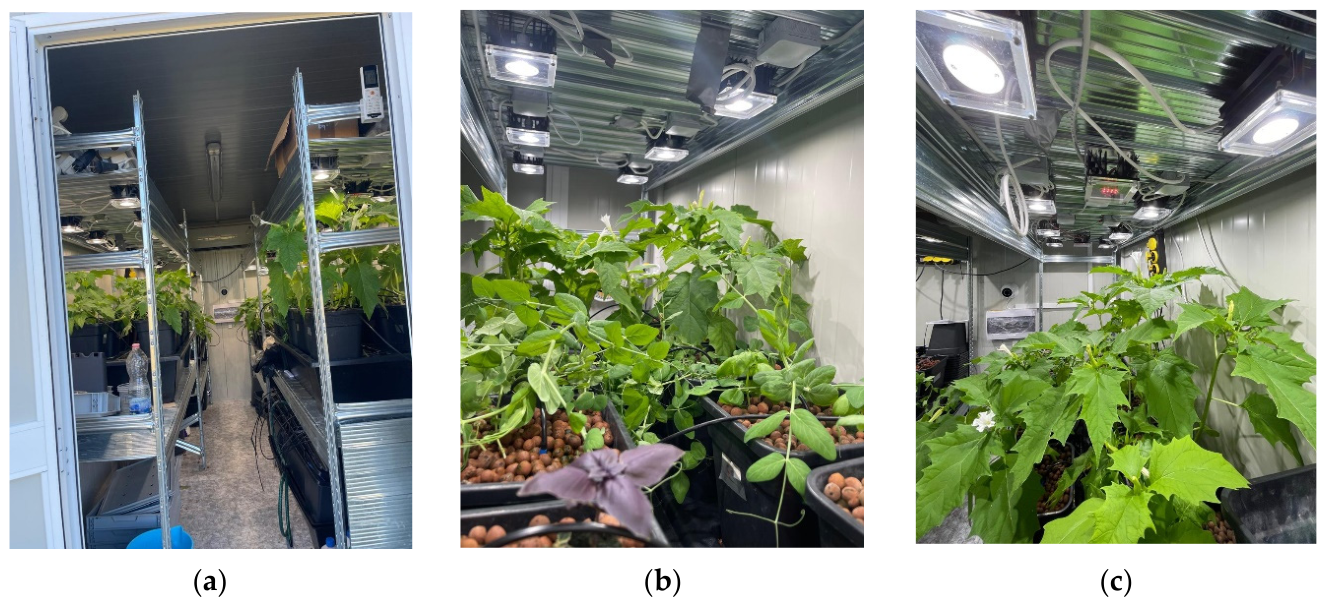
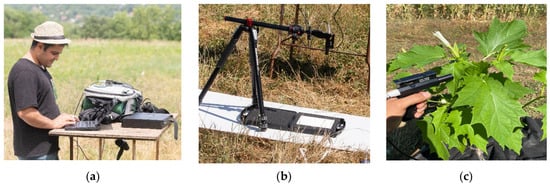
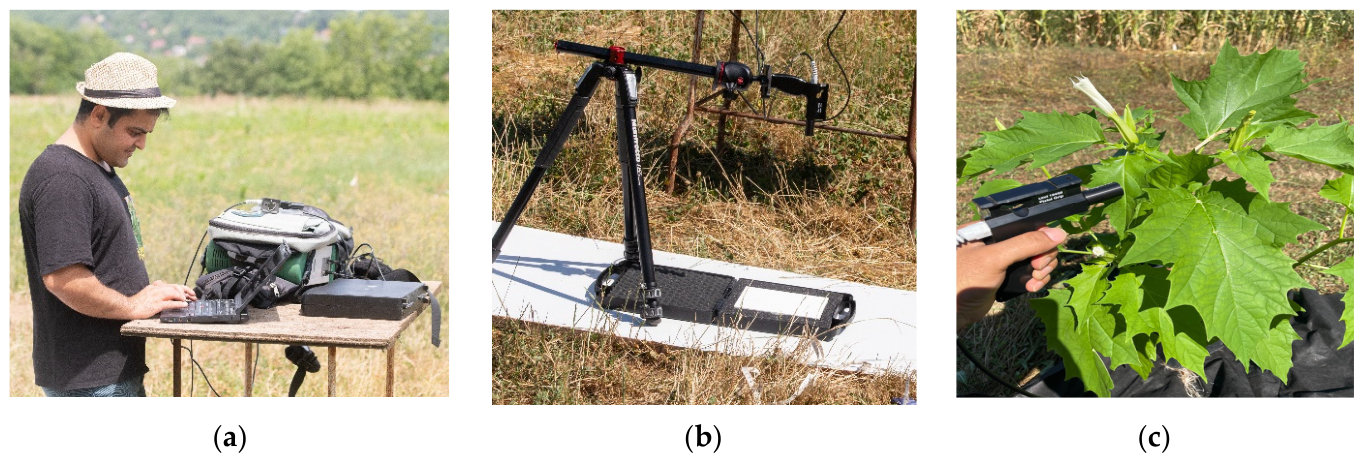
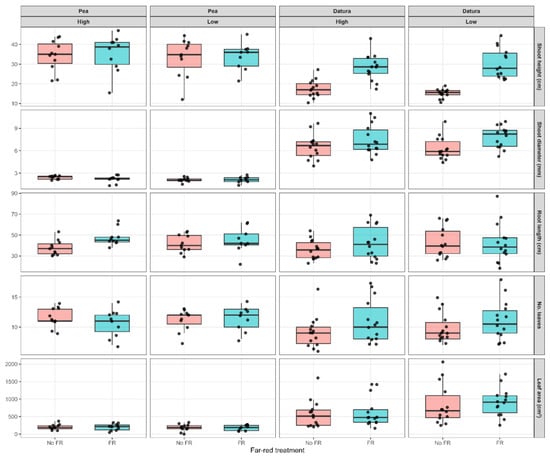
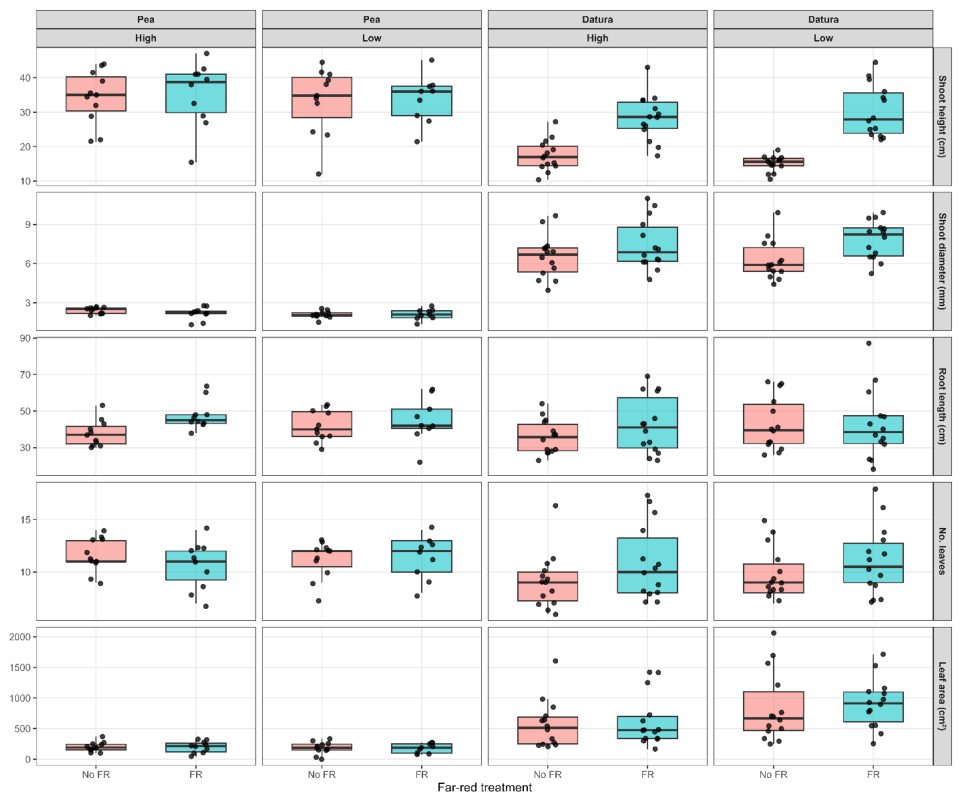
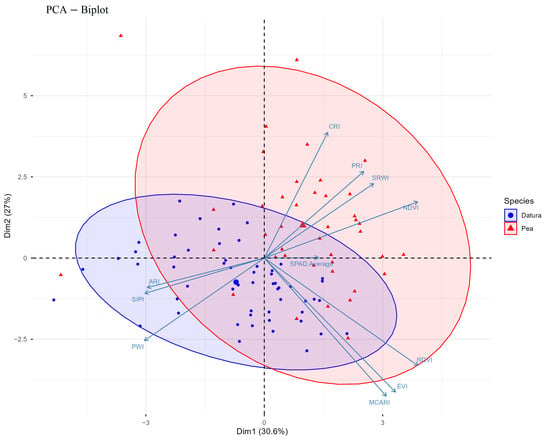
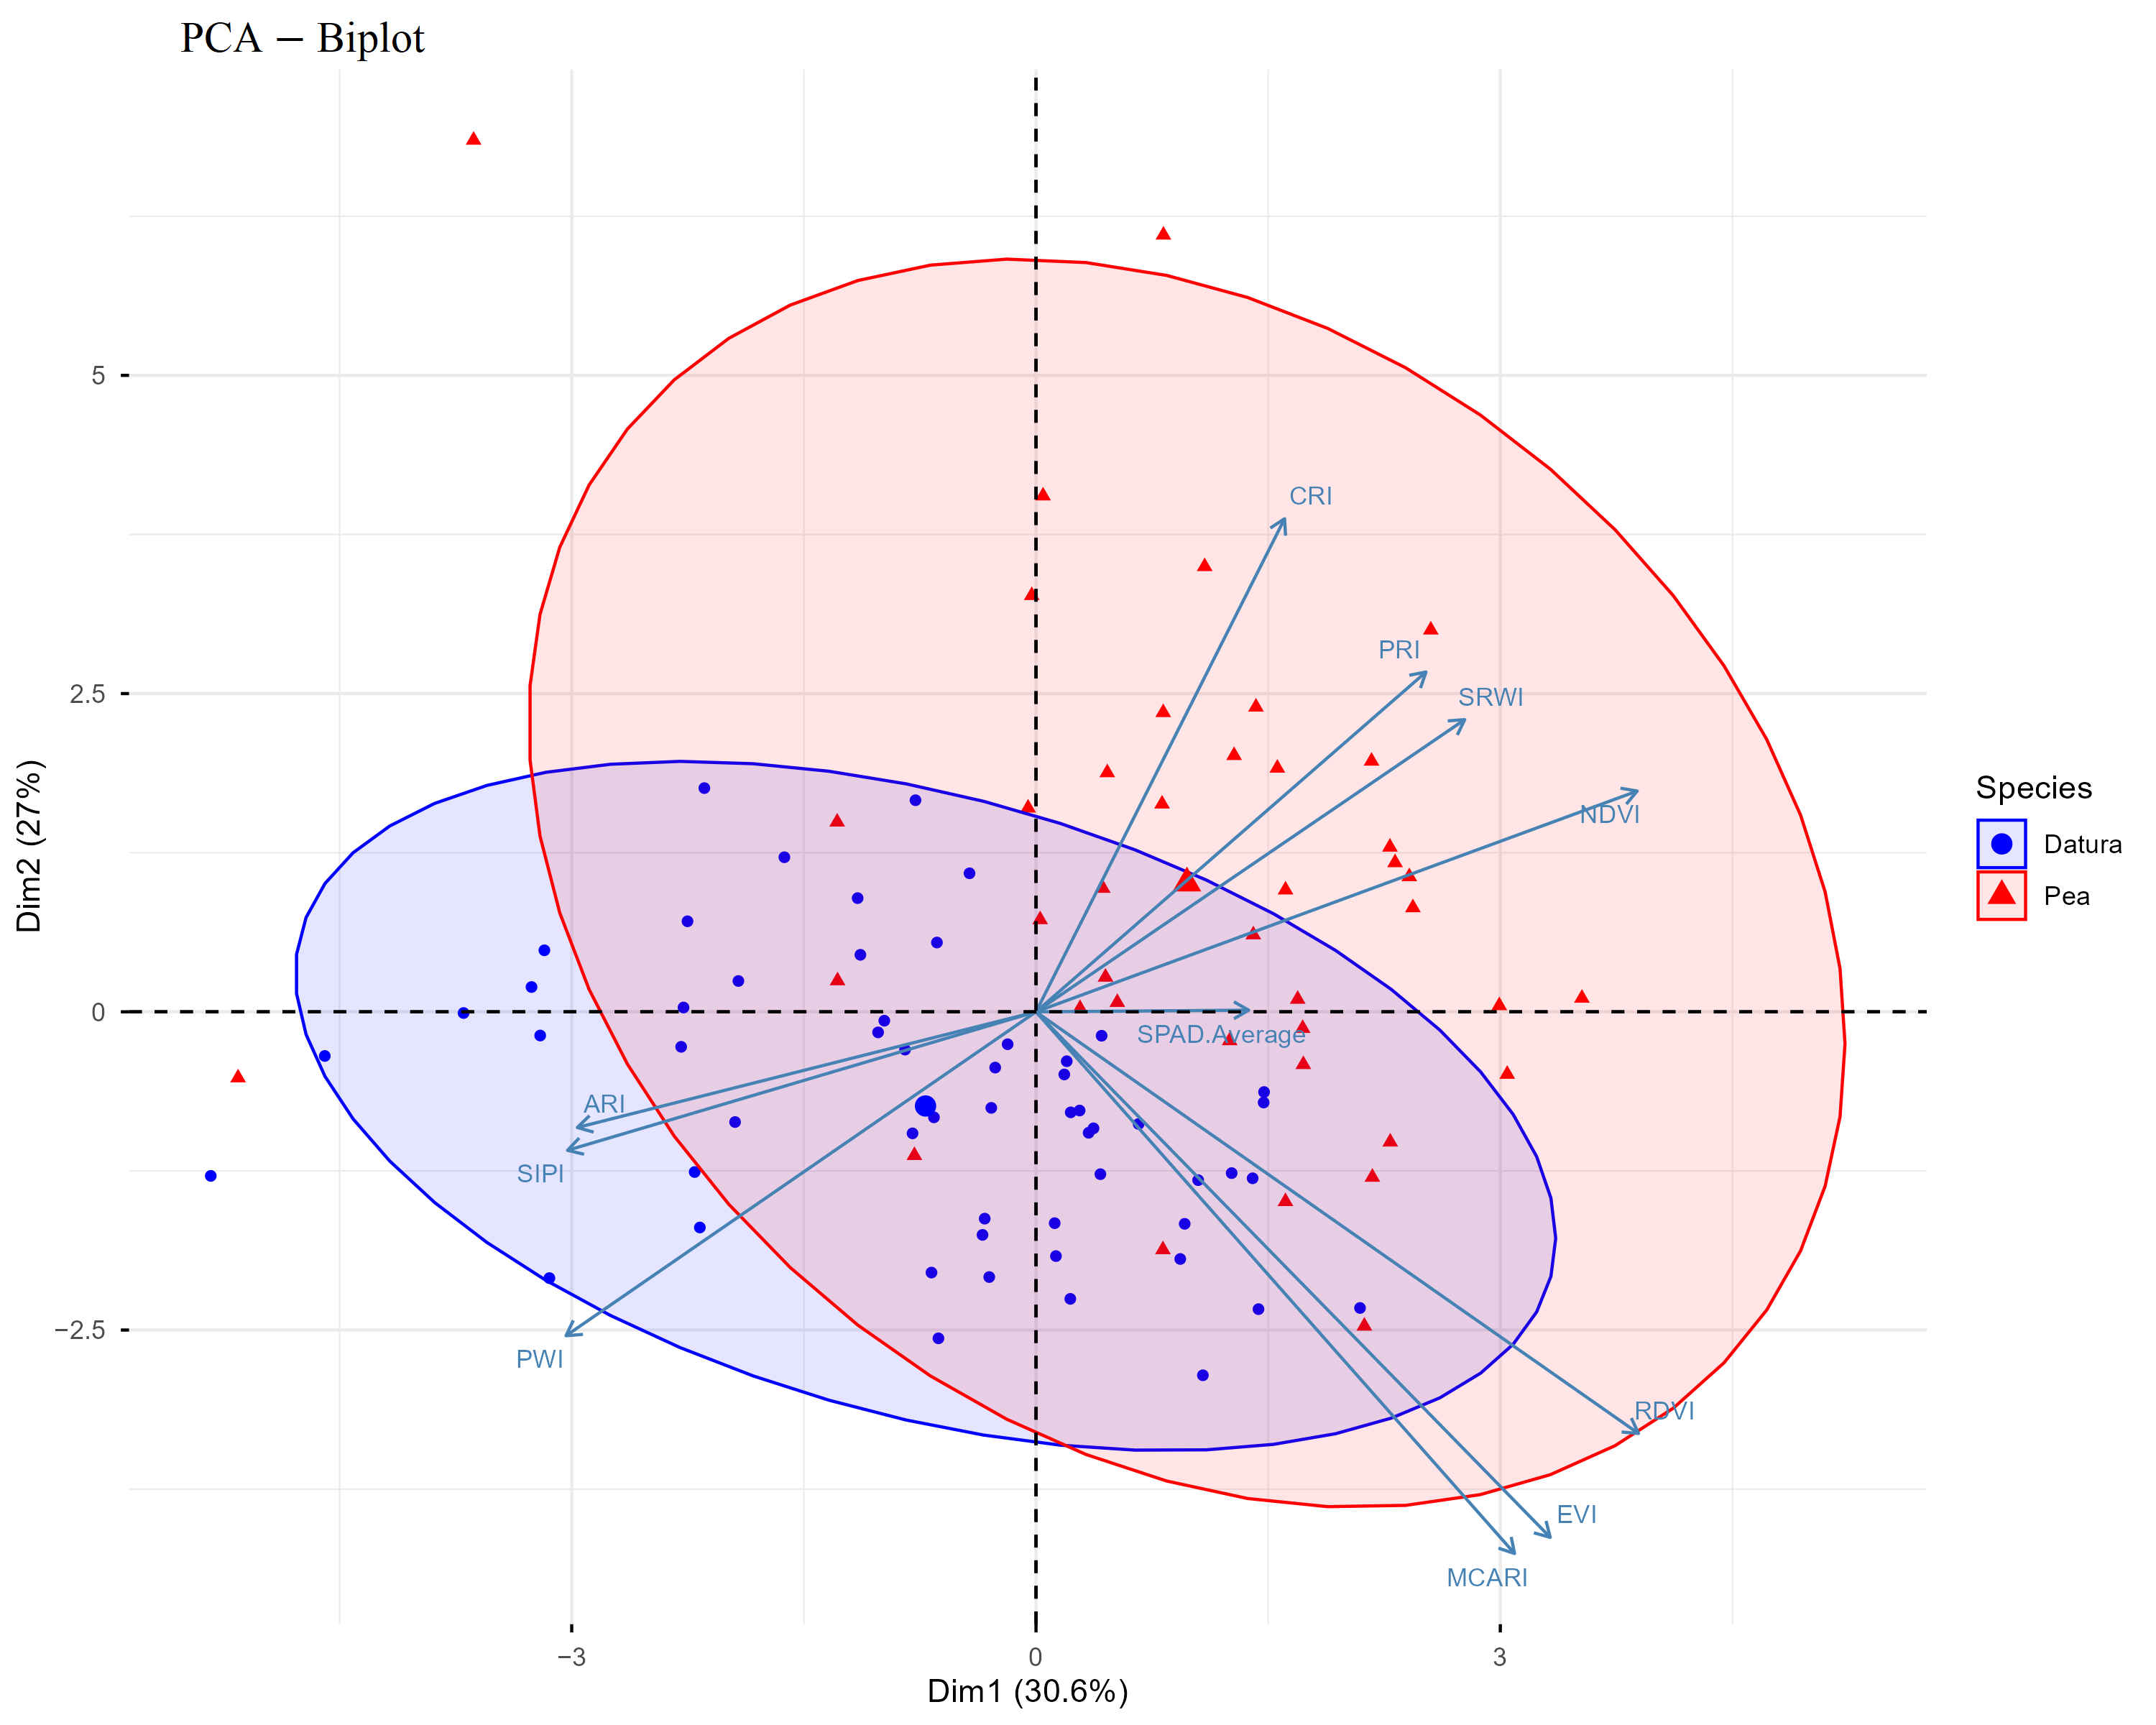
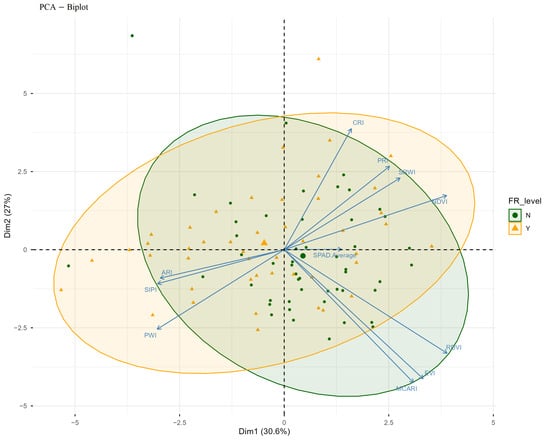
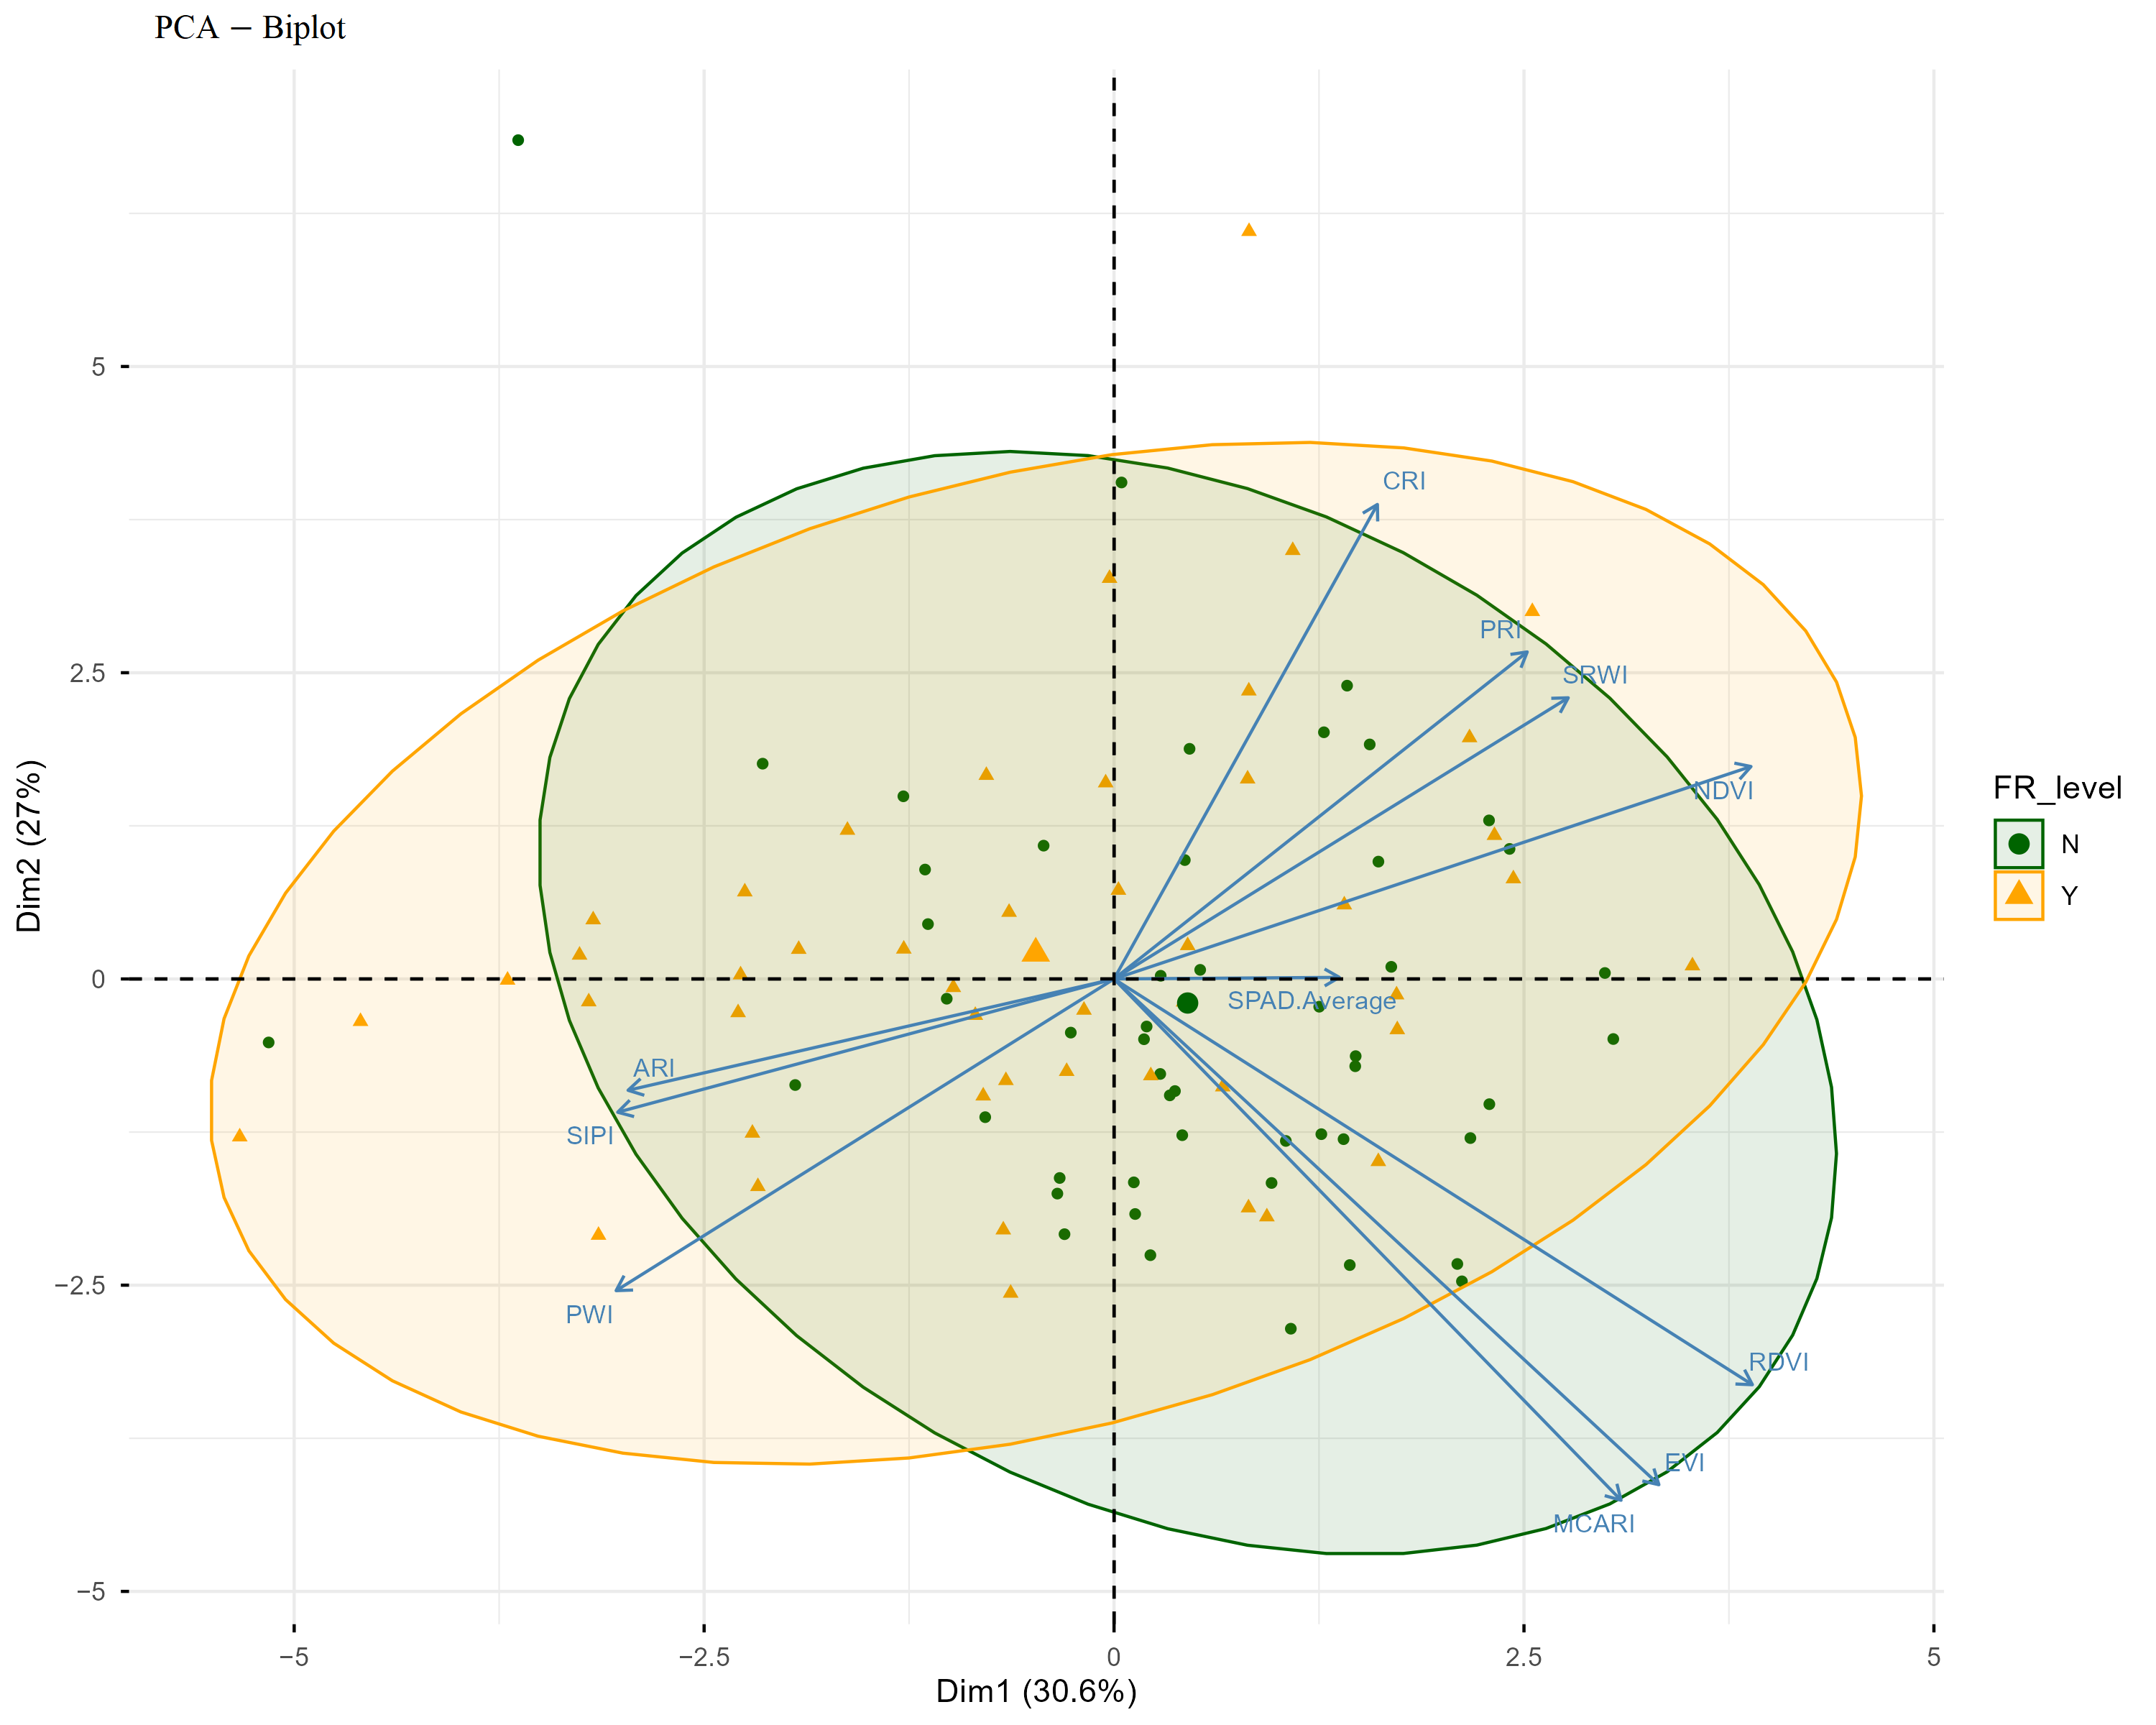
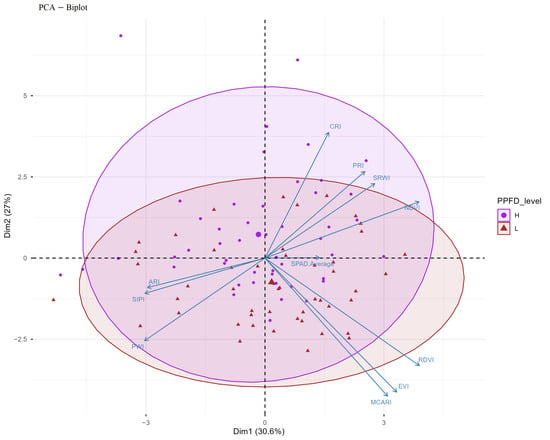
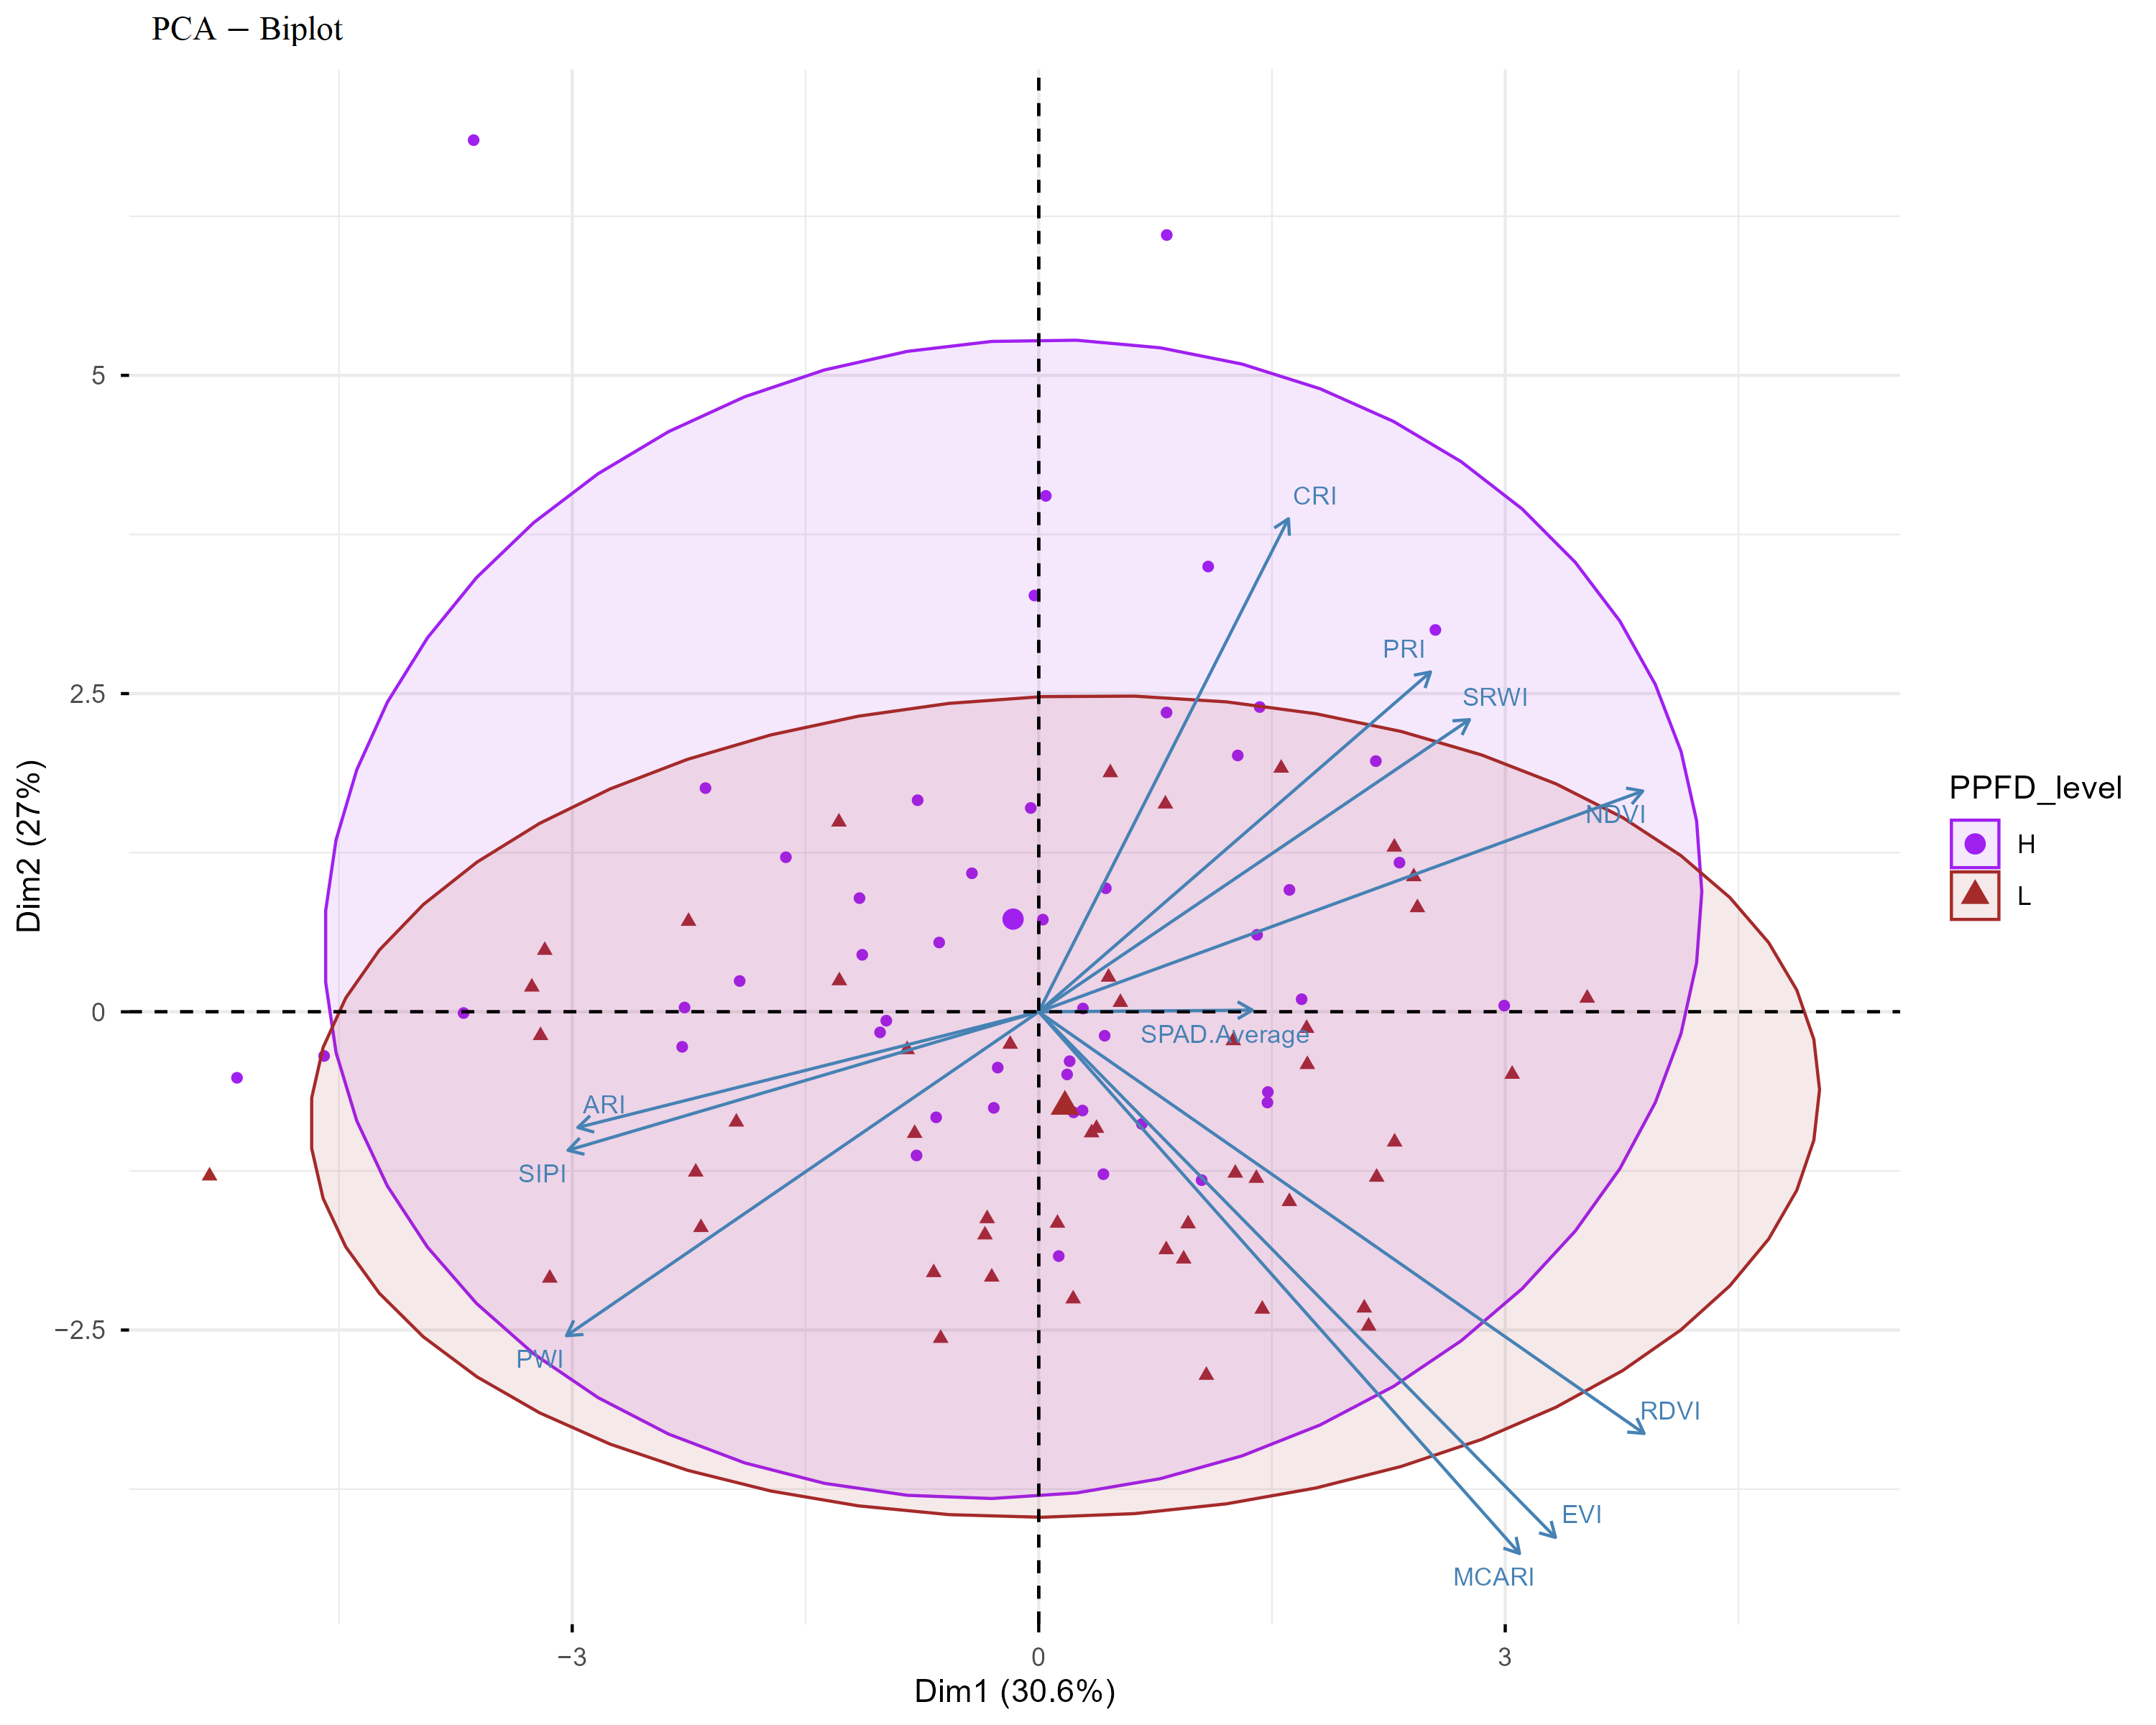
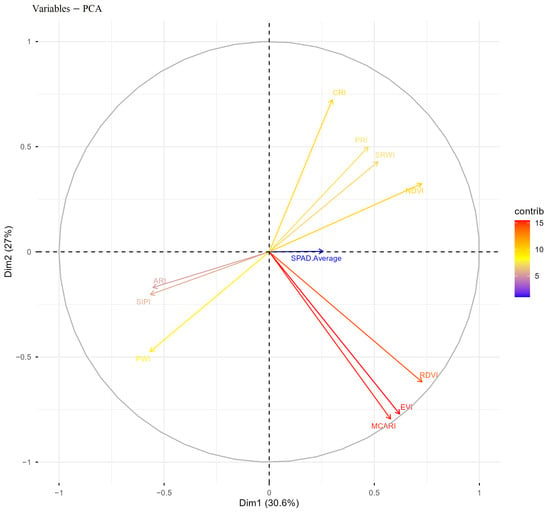
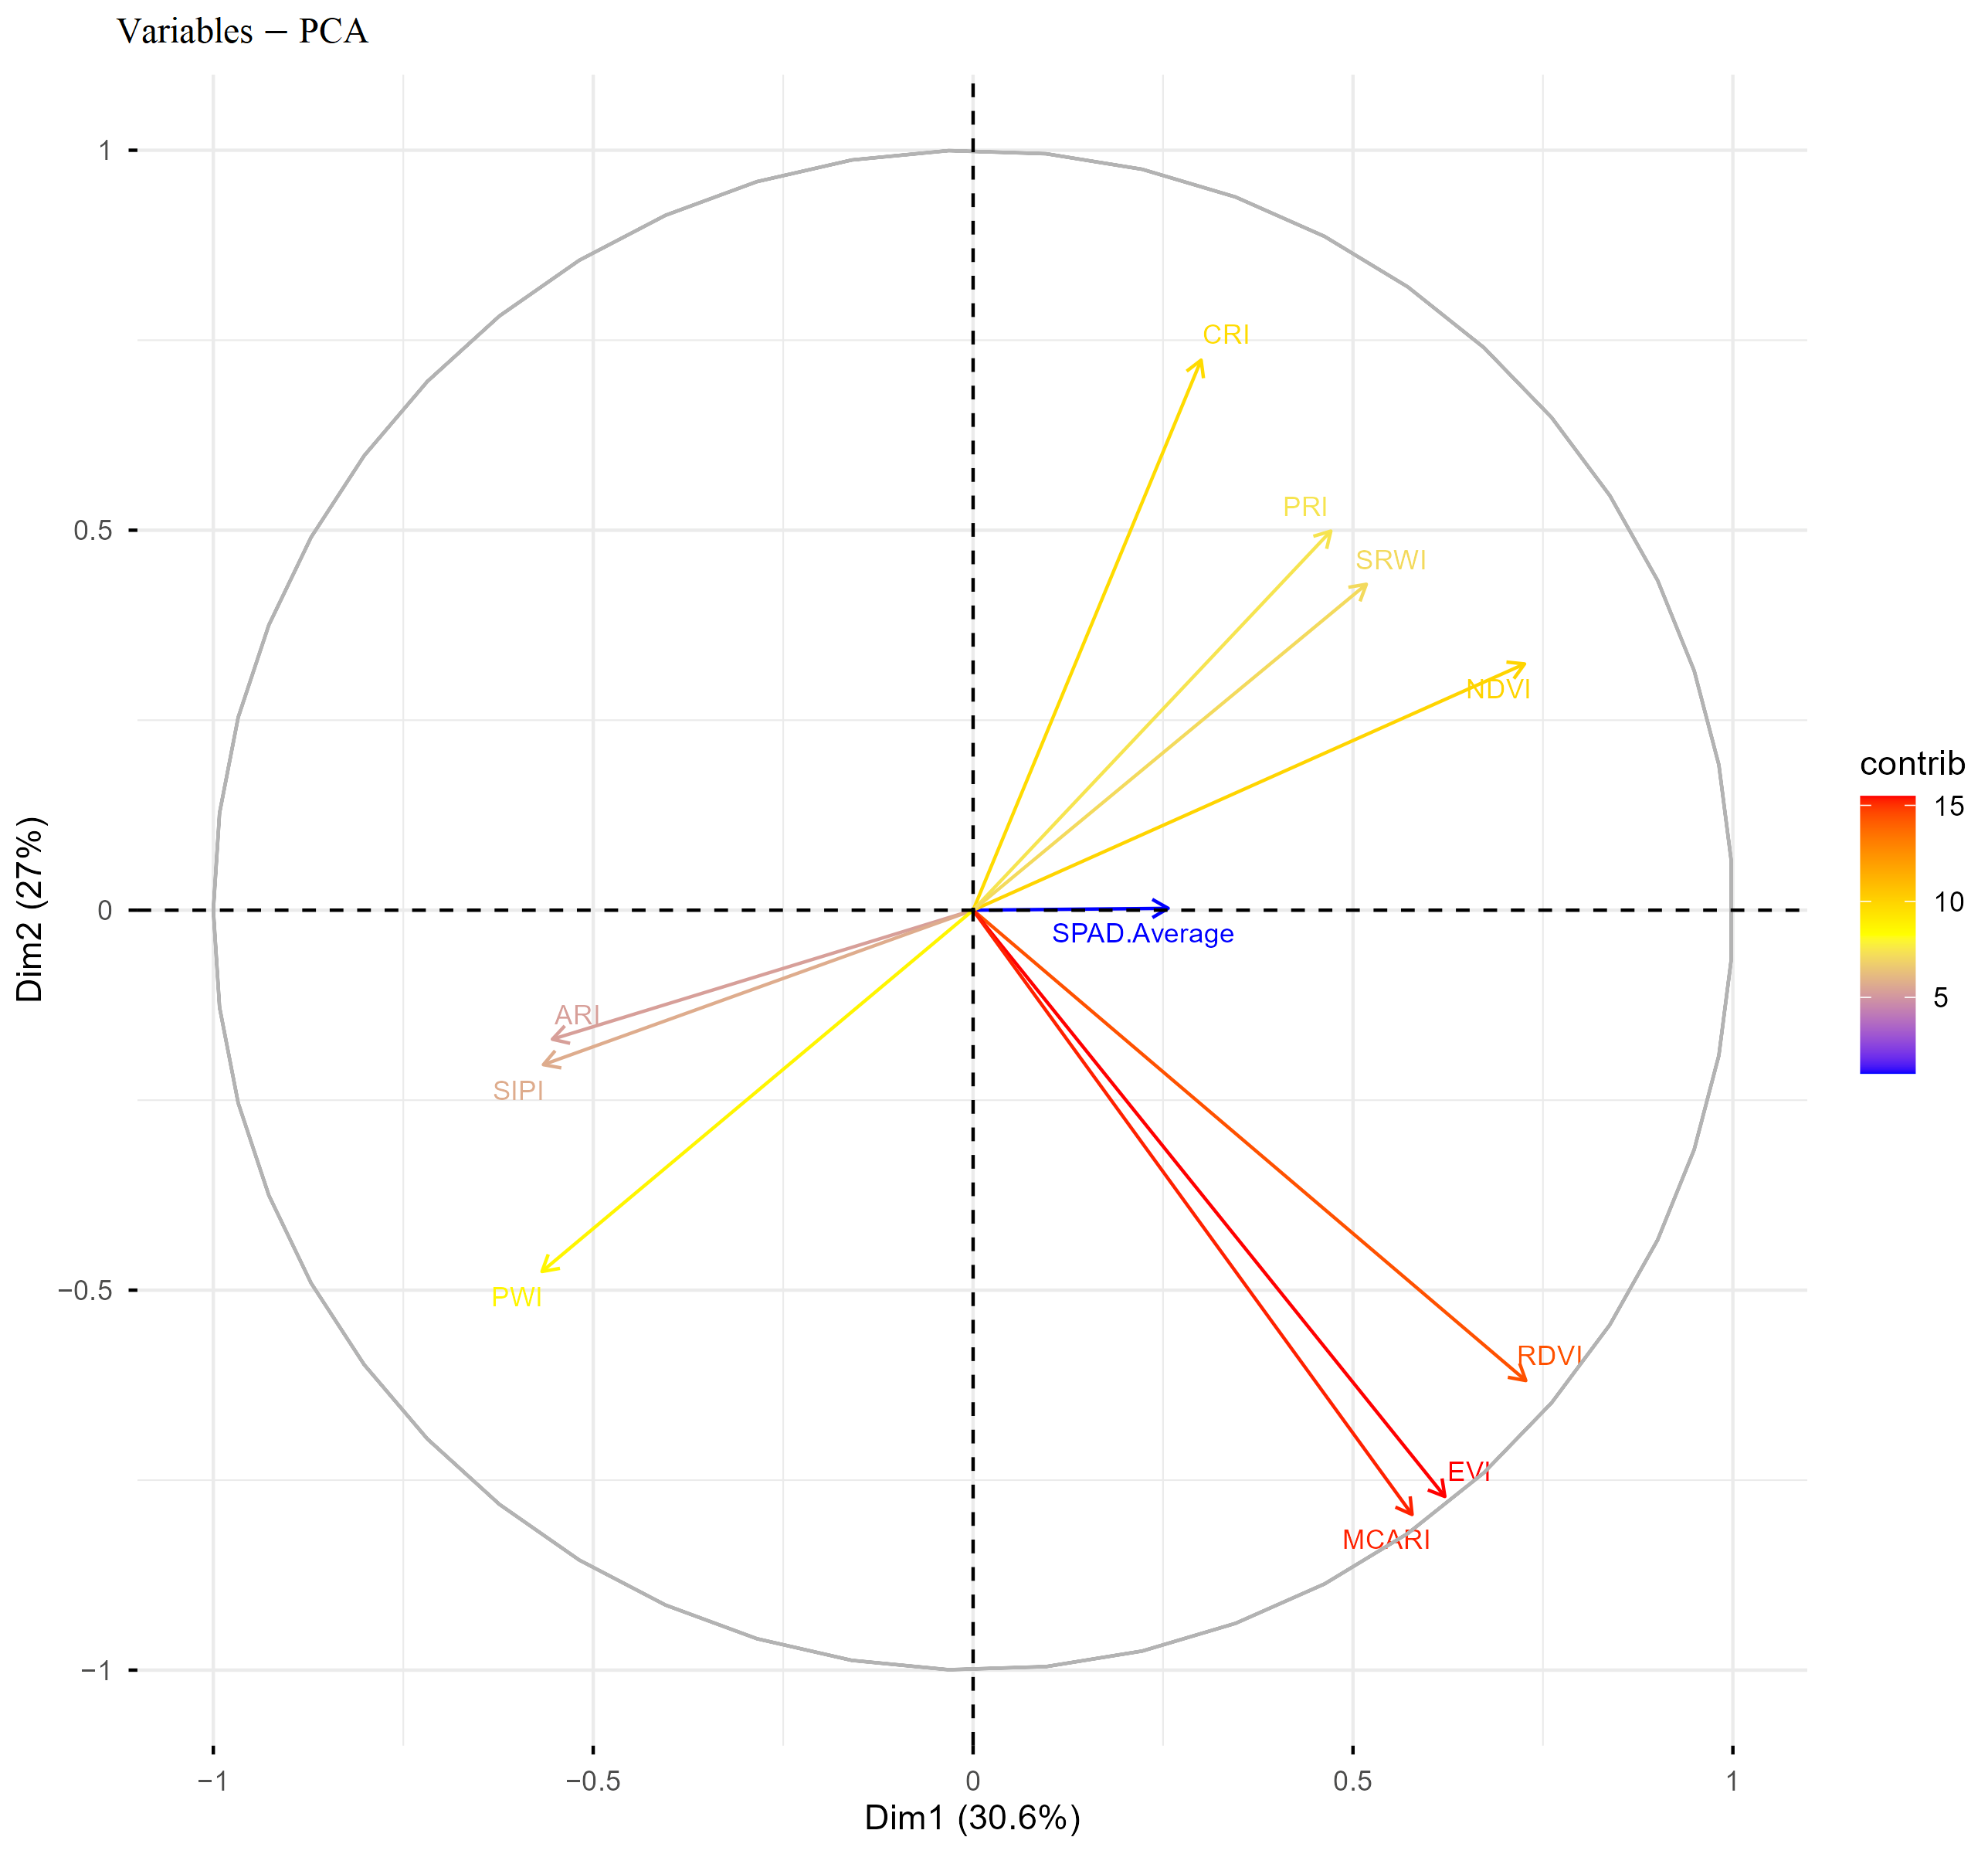
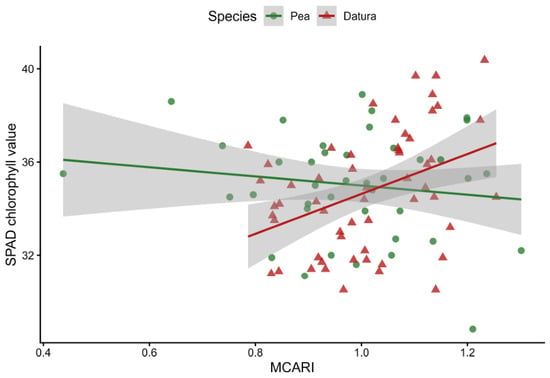
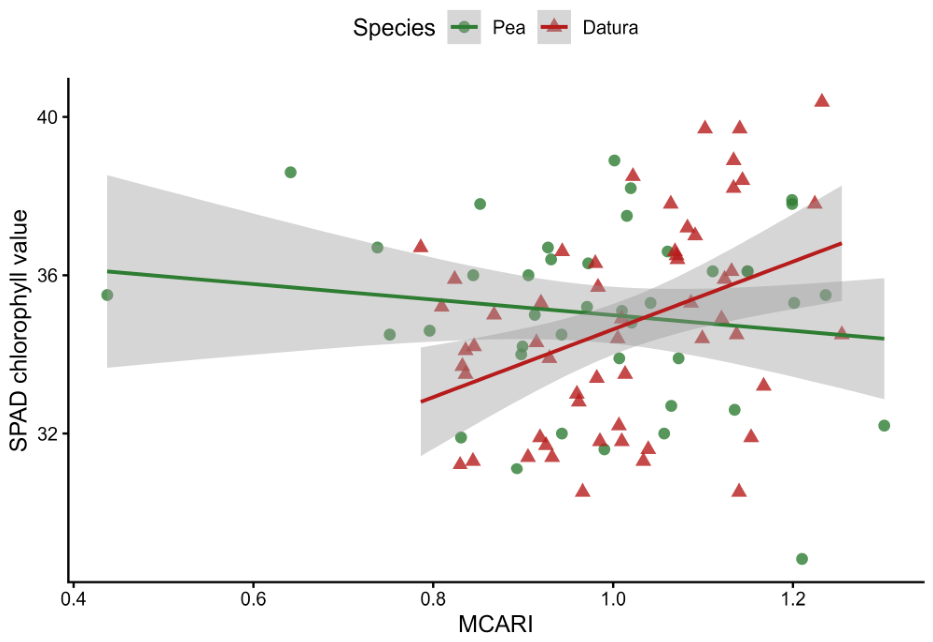
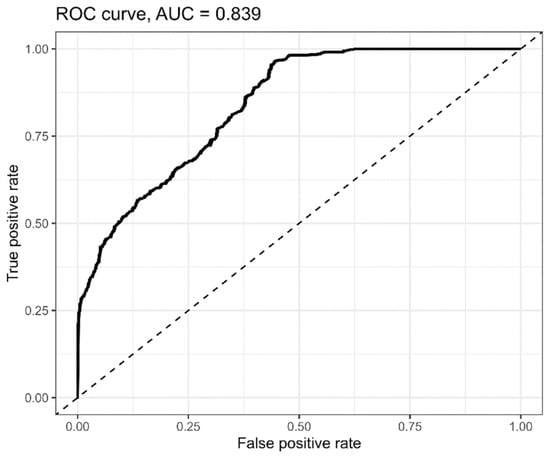
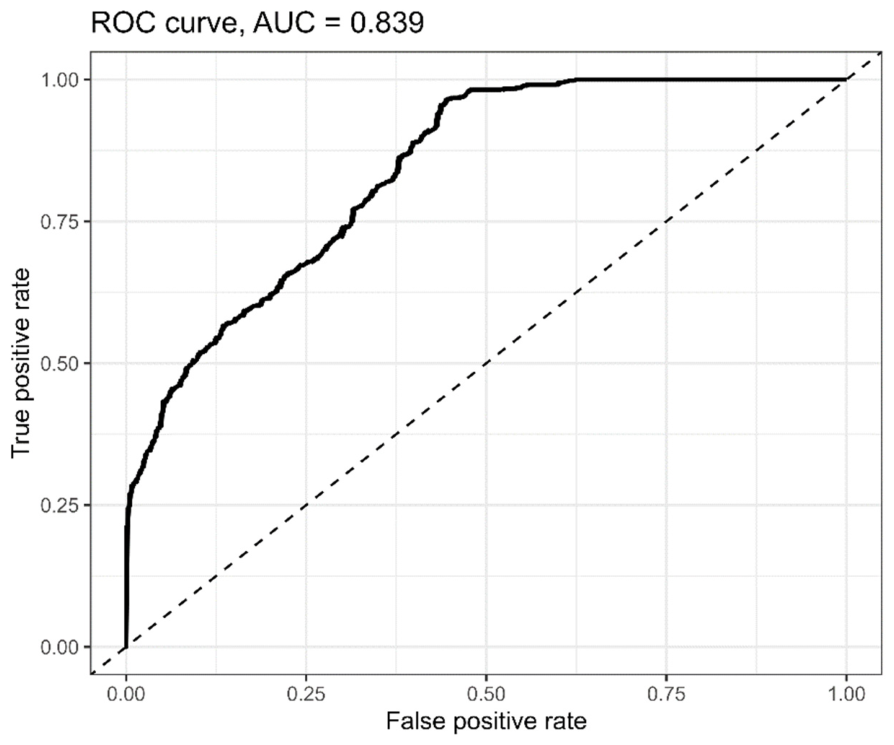
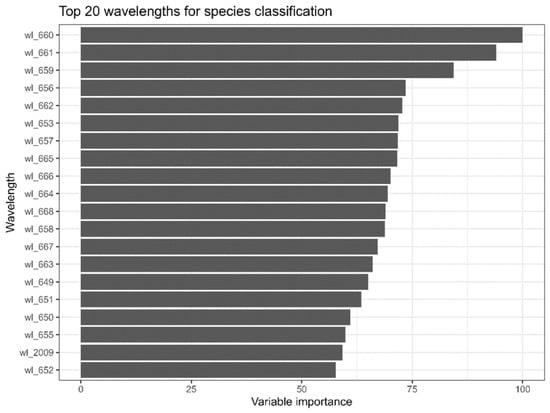
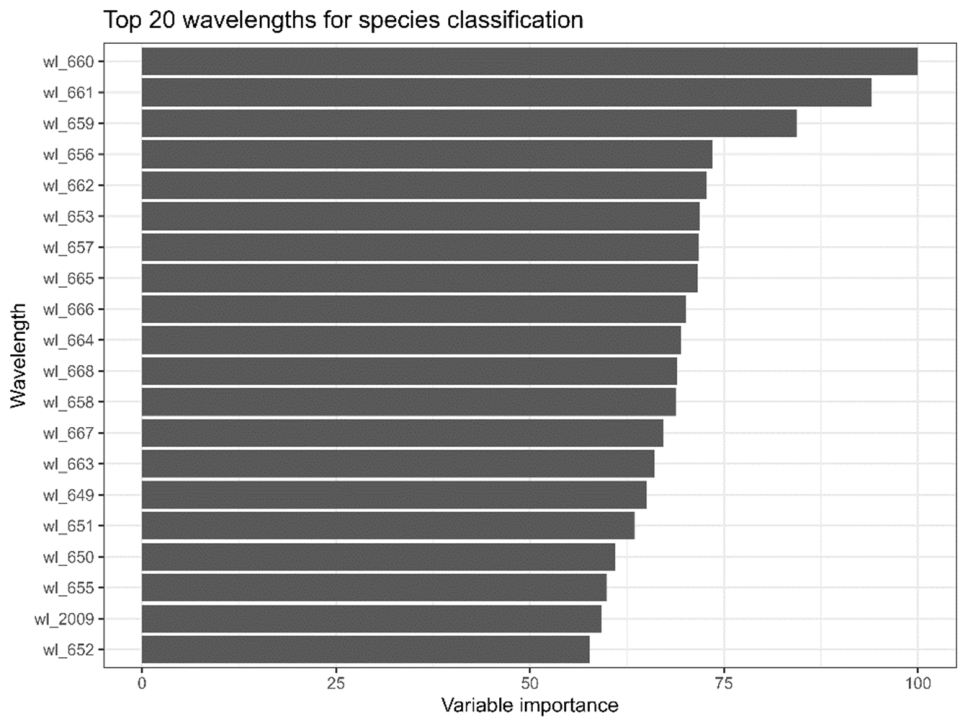
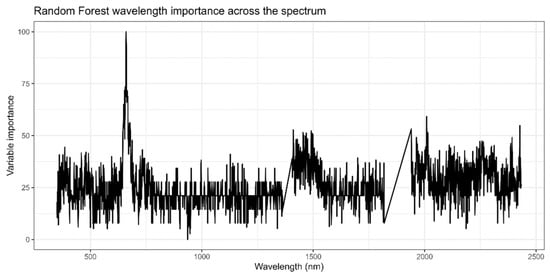
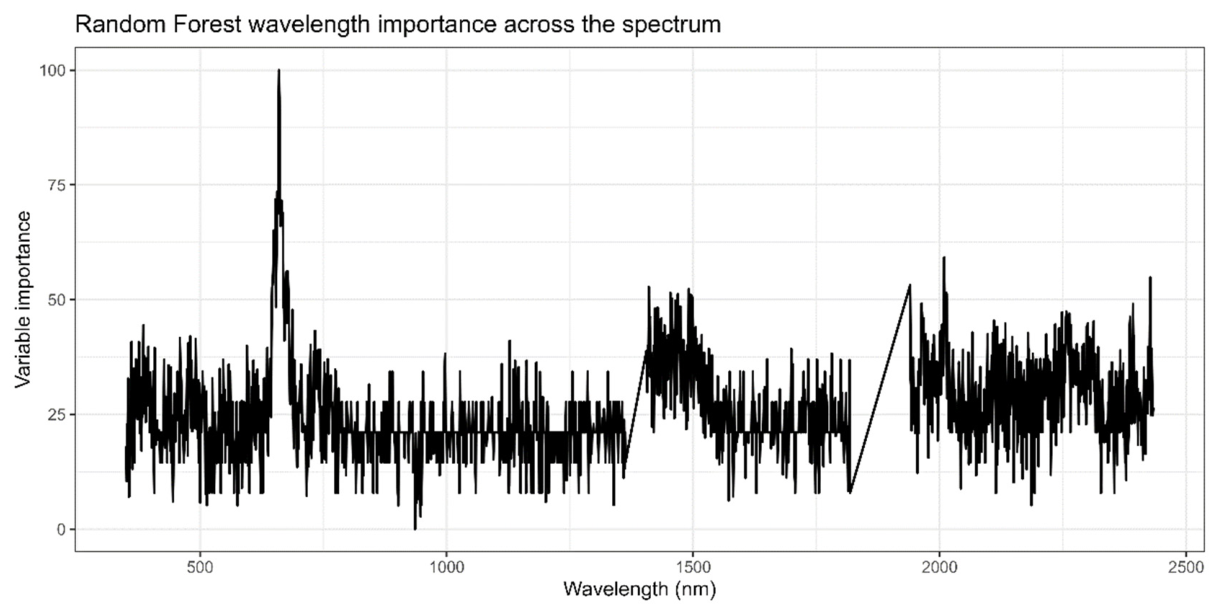

Disclaimer/Publisher’s Note: The statements, opinions and data contained in all publications are solely those of the individual author(s) and contributor(s) and not of MDPI and/or the editor(s). MDPI and/or the editor(s) disclaim responsibility for any injury to people or property resulting from any ideas, methods, instructions or products referred to in the content. |
© 2026 by the authors. Licensee MDPI, Basel, Switzerland. This article is an open access article distributed under the terms and conditions of the Creative Commons Attribution (CC BY) license.