


Abstract
Relative phenotypic positioning among pig populations may differ across production, carcass, and pork-quality domains. We tested whether source-defined Liaodan Black (LDB) pigs occupied a uniformly intermediate position between Liaoning Black (LB) and Duroc (DR) references at a common target body weight. Sixty pigs (20 per source population; 10 barrows and 10 gilts) entered at 70 d and were slaughtered at 106–114 kg. Population effects were evaluated using a Population × Sex model with false-discovery-rate control for individual fatty acids and amino acids. Sensitivity analyses addressed final body weight, slaughter batch, a shared 50–80 kg interval, intramuscular fat (IMF), fatty-acid compositionality, and principal component analysis (PCA) variable selection. Over 50–80 kg, average daily gain increased and feed-to-gain ratio decreased from LB through LDB to DR (both p < 0.001). LDB had the lowest C18:1n-9c and monounsaturated fatty-acid proportion, while its polyunsaturated fatty-acid profile was closer to DR than LB; these lipid differences persisted after IMF adjustment and centered-log-ratio analysis. Exploratory PCA retained the LB–LDB–DR production/carcass ordering under alternative specifications. Thus, production/carcass ordering did not extend uniformly to intramuscular lipid composition within these sampled source populations.
1. Introduction
Growth efficiency, carcass composition, and pork quality are connected across the farm-to-product continuum, but they do not necessarily vary along a single phenotypic axis. Growth rate, feed efficiency, lean yield, and fat deposition characterize production and carcass performance, whereas postmortem pH, color, water-holding capacity, texture, intramuscular fat (IMF), muscle structure, and lipid composition represent distinct dimensions of pork quality. The recent “One Quality” perspective and contemporary carcass-quality frameworks emphasize the need to consider these domains together, rather than treating production value and product quality as interchangeable outcomes [1,2]. This distinction is important, because selection for feed efficiency can increase carcass leanness with limited changes in several meat-quality traits [3], whereas genotype, carcass fatness, and IMF can covary with technological and sensory pork-quality attributes [4,5].
Comparisons among pig populations are sensitive to slaughter body weight, sex, growth stage, and production context. Fixed or target slaughter weight improves comparability of carcass and meat-quality outcomes by providing a common commercial endpoint [6,7], while sex type or castration status can modify carcass composition, IMF, and selected pork-quality traits [4,7,8]. Slaughter timing, season, and batch can also contribute to postmortem variation [9,10]. More broadly, genotype and production context can jointly shape carcass and pork-quality phenotypes [4,5,8]. Accordingly, comparisons made at a common target body weight under standardized feeding, slaughter, and laboratory procedures can provide a production-relevant description of population-associated phenotypes, provided that inference is not extended beyond the populations actually sampled.
Liaoning Black (LB) and Liaodan Black (LDB) are Chinese pig populations, whereas Duroc (DR) provides a contrasting reference for growth, carcass, and meat-quality phenotypes in comparative pig studies [11,12,13,14]. LDB was developed through long-term systematic selection, using Liaoning Black as the maternal foundation and Duroc as the paternal source [11]. That breeding history could lead to an expectation of an intermediate phenotype, but long-term selection does not imply that all trait domains must occupy the same relative position. Previous work has documented broad population or breed variation in meat quality, intramuscular fatty-acid composition, carcass traits, and muscle characteristics [12,13,14,15,16,17,18]. What remains unclear is whether the relative position of LDB is concordant across production, carcass, technological pork-quality, muscle-structural, and intramuscular lipid domains, or whether some domains diverge from a simple LB–LDB–DR continuum.
The present study therefore compared source-defined LB, LDB, and DR populations with a common formal-trial starting age, standardized three-phase feeding, and slaughter within a 106–114 kg target body-weight window. The primary objective was to determine whether the phenotypic position of LDB relative to the LB and DR populations was consistent across growth performance, carcass composition, technological pork quality, muscle morphology, and intramuscular fatty-acid composition. Protein-hydrolysate amino-acid composition was included as a complementary compositional endpoint. We therefore evaluated whether LDB occupied a similar relative position across these phenotype domains, or whether its position differed among domains. Because each named breed was represented by one source population and individual pedigree identifiers were unavailable, all between-group inference was restricted to the sampled source-defined populations, rather than breed-wide genetic effects.
2. Materials and Methods
2.1. Animals, Ethics, and Experimental Design
All animal procedures were approved by the Animal Ethics Committee of Shenyang Agricultural University (approval No. SNLL25051605; approved on 16 May 2025). The study was conducted in accordance with the approved protocol and relevant institutional requirements for animal research, and is reported in accordance with the Animal Research: Reporting of In Vivo Experiments (ARRIVE) guidelines. The feeding trial was conducted from 2 June 2025 to 21 October 2025 at Shenyang Agricultural University, Shenyang, Liaoning, China. Liaoning Black pigs were sourced from the conservation population maintained by the Dandong Livestock and Poultry Genetic Resources Conservation and Utilization Center; Liaodan Black pigs were sourced from the breeding population maintained by the Dandong Agricultural and Rural Development Service Center at the same center (Dandong, Liaoning, China). Duroc pigs were sourced from Liaoning Shuangzeng Swine Breeding Co., Ltd. (Donggang, Liaoning, China), and the sampled population had a French-line Duroc background. Individual sire and dam pedigree identifiers were not archived.
Because each named breed was represented by one source population and individual sire and dam pedigree identifiers were not archived, the inferential grouping factor was the source-defined Population, rather than the breed as a whole. The sampling design was intended to compare eligible animals sampled from the three source populations under standardized experimental conditions, and was not designed to estimate breed-wide genetic effects. Residual genetic relatedness among animals within each source population could therefore not be quantified or modeled.
Sixty pigs were enrolled (20 per source population; 10 barrows and 10 gilts). Barrows were surgically castrated at 7 d of age, as documented in the farm records. Candidate selection was stratified by Population × Sex. Eligible pigs were clinically healthy, had normal appetite and locomotion, showed no evident respiratory, gastrointestinal, congenital, or major traumatic abnormality, and had Day 0 body weight (BW) within ± 1.5 standard deviations (SD) of the corresponding stratum mean. The criterion was applied within Population × Sex strata, and did not equalize Day 0 BW across populations. Pre-screened reserve pigs from the same stratum could replace candidates only before Day 0.
Pigs underwent a 7 d acclimation period at approximately 63–69 d of age in their experimental pens, with ad libitum access to the phase-1 diet and water; acclimation data were excluded from performance calculations. Day 0 was defined at 70 d of age after acclimation. Within each Population × Sex stratum, pigs were ordered by initial body weight, blocked among adjacent weights, and assigned by computer-generated restricted randomization to pre-numbered individual pen positions distributed across the barn. Husbandry personnel could not be blinded to Population because of visible phenotypic differences. Carcass, laboratory, and image-derived measurements used non-informative sample codes, and Population identity was coded as A/B/C during data-quality checks and statistical analysis.
Sample-size sensitivity was characterized using G*Power 3.1.9.7 [19]. Under the fixed-effects one-way ANOVA approximation with n = 60 and α = 0.05, 80% power corresponded to an omnibus Population effect of approximately Cohen’s f = 0.41. A design-specific sensitivity calculation reflecting the balanced 3 × 2 Population × Sex structure (10 pigs per cell; numerator df = 2; error df = 54) likewise indicated that an effect of approximately f = 0.41 would be required for 80% power for either the Population main effect or the Population × Sex interaction. These calculations characterize the magnitude of effects detectable under the design, and do not establish adequate power for every pairwise comparison, secondary outcome, or smaller interaction. Nonsignificant findings were therefore interpreted as absence of statistical support, rather than evidence of equivalence.
2.2. Housing, Diets, and Growth Measurements
Pigs were housed individually in 1.20 × 1.50 m pens (1.80 m2/pig) with approximately equal solid and slatted concrete flooring, an individual feeder, and a nipple drinker. The mechanically ventilated barn was maintained at approximately 18–22 °C and 50–70% relative humidity under a 12 h light:12 h dark cycle. A natural-fiber rope and hardwood chew block were provided for enrichment, and animal health was checked twice daily.
Three phase-specific grower–finisher mash diets were provided ad libitum, with free access to water: phase 1 (P1), 20 to <50 kg body weight; phase 2 (P2), 50 to <80 kg; and phase 3 (P3), ≥80 kg to slaughter. After a pig reached a phase threshold, the subsequent 08:00 feeding used the next diet. Representative samples from each mixing batch were retained and pooled on an equal-mass basis within phase. Each phase composite was analyzed in duplicate at the Analysis and Testing Center, Shenyang Agricultural University, Shenyang, China. Dry matter (DM), crude protein (CP; Kjeldahl N × 6.25), ether extract (EE), ash, calcium, and total phosphorus were analyzed according to GB/T 6435-2014 [20], GB/T 6432-2018 [21], GB/T 6433-2025 [22], GB/T 6438-2007 [23], GB/T 6436-2018 [24], and GB/T 6437-2018 [25], respectively. Digestible energy (DE), metabolizable energy (ME), net energy (NE), and standardized ileal digestible (SID) amino acids were calculated from the diet formulation and ingredient matrix. Standardized total tract digestible phosphorus (STTD p) was derived from base STTD p plus the phytase matrix contribution. Table 1 reports nutrient composition; Supplementary Table S1 reports ingredients and premix nutrient supply.
Table 1.
Phase-specific analyzed and calculated nutrient composition of the experimental diets.
Body weight was recorded individually at Day 0, every 14 d at approximately 08:00, and before slaughter, with confirmation weighing near a phase threshold when needed. Daily feed accounting used 08:00-to-08:00 intervals based on feed offered, refusals, and recorded spillage. Total feed intake was cumulative net intake during the trial. Average daily gain (ADG) was body-weight gain divided by trial days, average daily feed intake (ADFI) was total feed intake divided by trial days, and the feed-to-gain ratio (F/G) was total feed intake divided by body-weight gain. Trial duration was calculated from Day 0 (70 d of age) to slaughter. Final BW was the fasted pre-slaughter live weight recorded approximately 30 min before electrical stunning.
As a sensitivity analysis addressing the different Day 0 body weights, growth efficiency was additionally evaluated over the shared 50–80 kg body-weight interval. For each pig, the trial days corresponding to 50 and 80 kg were estimated by linear interpolation between the nearest bracketing body-weight observations; extrapolation beyond bracketing observations was not permitted. Cumulative feed intake at the two crossing times was obtained by linear interpolation of the daily cumulative feed-accounting record. Days from 50 to 80 kg, ADG, ADFI, and F/G over this interval were then calculated and analyzed with the same Population + Sex + Population × Sex model used for the primary growth outcomes.
2.3. Slaughter Procedure and Carcass Measurements
Pigs were scheduled for the next available slaughter batch after entering the target 106–114 kg live-weight window, and were transported approximately 3.5 h to Dandong Shuangli Meat Processing Co., Ltd. (Dandong, Liaoning, China). Feed withdrawal lasted 12 ± 1 h from withdrawal at the experimental facility to electrical stunning. After unloading, pigs rested for approximately 2 h with water but no feed. Electrical stunning (240 V, 800 Hz, approximately 2 s) was followed by immediate exsanguination. Nine slaughter batches were used (three per population), and the same standardized pre-slaughter, slaughter, chilling, sampling, and instrument procedures were used across batches.
After stunning, exsanguination, and dehairing, the head, fore and hind feet, tail, thoracic and abdominal viscera, and kidneys were removed before carcass weighing; skin and leaf fat were retained. Carcasses were split longitudinally and chilled at 4 ± 1 °C for 24 h. Cold carcass weight was the combined weight of both chilled sides, and dressing percentage was calculated relative to fasted pre-slaughter live weight.
Carcass straight length was measured from the depression at the first cervical vertebra/atlanto-occipital lower anterior edge to the anterior midline of the pubic symphysis, and oblique length from the first-rib–sternum junction to the same pubic reference. Backfat thickness (BFT) was measured without skin at the maximum shoulder point, last rib, and lumbosacral joint, and averaged. Skin thickness was measured at the dorsal cut surface between the sixth and seventh ribs on the left carcass, using a digital vernier caliper (0.01 mm resolution), with the measurement restricted to the skin and excluding subcutaneous fat. Loin muscle area (LMA) was measured on the left carcass at the longissimus cross-section between the third and fourth last ribs by tracing the cross-sectional boundary on transparent paper, scanning the tracing with a scale at 600 dpi, and performing calibrated planimetry in ImageJ 1.53 (National Institutes of Health, Bethesda, MD, USA). After 24 h chilling, carcasses were dissected into bone, skin, separable fat, and lean tissue. Separable fat included subcutaneous, obvious intermuscular, and retained leaf fat; tissue proportions were expressed, relative to cold carcass weight.
2.4. Meat-Quality Measurements
Adjacent regions of the Longissimus thoracis et lumborum (LTL), approximately from the 10th rib to the last-rib region, were allocated to the assays, so that sampling location was standardized across pigs. Muscle pH was measured near the last-rib level at 45 ± 5 min (pH45) and 24 ± 1 h (pH24) postmortem, using an AR25 pH meter (Fisher Scientific, Pittsburgh, PA, USA) calibrated with pH 4.01 and 7.00 buffers.
Objective color was measured after 24 h chilling, using a CR-400 Chroma Meter (Konica Minolta, Osaka, Japan) with D65 illuminant, 2° standard observer, and 8 mm aperture after white-tile calibration. After 20 min blooming, three non-overlapping readings were averaged for L*, a*, and b*.
Drip loss was determined using approximately 50 ± 5 g, 2 cm thick LTL samples trimmed of external fat and fascia. Samples were suspended in individual bags without surface contact, stored at 4 ± 1 °C for 24 h, blotted, and reweighed; loss was expressed relative to initial weight. Cooking loss used approximately 200 ± 20 g samples sealed in heat-resistant bags and cooked in an 80 °C water bath to a 70 °C core temperature, then cooled at approximately 25 °C for 30 min, blotted, and reweighed. Shear force was measured with a QTS25 texture analyzer (Brookfield Engineering Laboratories, Middleboro, MA, USA) and Warner–Bratzler rectangular-hole probe. Three 30 × 10 × 10 mm strips cut parallel to muscle fibers were sheared perpendicular to the fibers at 0.5 mm/s; mean peak force was expressed in N. Cooking and shear-force samples were analyzed fresh after the 24 h postmortem period, without additional aging or freeze–thawing. Separate LTL portions for IMF, fatty-acid, and amino-acid analyses were stored at −80 °C. IMF and fatty-acid samples were thawed in sealed packages at 4 °C for approximately 12 h; amino-acid samples were freeze-dried before hydrolysis. Coded samples from populations and slaughter batches were interspersed across analytical runs, with laboratory quality-control samples included.
2.5. Intramuscular Fat and Muscle Histology
IMF was quantified on a fresh-muscle basis using a Soxtec 2043 system (FOSS, Hillerød, Denmark). Approximately 3.00 g homogenized muscle was pre-dried at 103 ± 2 °C for 2 h and extracted with 40–50 mL petroleum ether (40–60 °C boiling range). The program used an approximately 90 °C instrument temperature, 15 min boiling, 30 min rinsing, and 9–10 min solvent recovery. Extracted lipid was quantified gravimetrically and expressed as percentage of fresh muscle.
For histology, approximately 1 cm3 LTL samples were fixed in 4% paraformaldehyde at 4 °C for 24 h, paraffin embedded, sectioned at 5 μm, and stained with hematoxylin and eosin. Well-oriented transverse sections were selected; fields with tears, folds, large vessels, large connective-tissue regions, or obvious oblique sectioning were excluded. Images were acquired with a Nikon TS100-F microscope (Nikon Corporation, Tokyo, Japan) at 200×. Three random non-overlapping fields were analyzed per pig, using a standardized 0.25 mm2 region of interest. Minimum Feret diameter (MinFeret) was quantified in ImageJ 1.53, and averaged across fields. A total of 63–152 fibers were analyzed per pig, across the three fields. Fiber density was mean field count divided by 0.25 mm2. Fiber types were not determined.
2.6. Intramuscular Fatty-Acid Analysis
Total lipids were extracted from 5.00 g muscle with chloroform:methanol (2:1, v/v), following the Folch principle [26]. Samples were extracted twice with 50 mL solvent, phase-separated with water, and the lower chloroform phase was dried over anhydrous sodium sulfate and concentrated at ≤40 °C. For FAME preparation, approximately 10 mg lipid was mixed with 2 mL n-hexane and 0.20 mL 2 M KOH in methanol, vortexed for 2 min, and the upper phase used for GC.
Fatty-acid methyl esters (FAMEs) were analyzed by gas chromatography–flame ionization detection (GC-FID), using an Agilent 7820A gas chromatograph (Agilent Technologies, Santa Clara, CA, USA) with a J&W DB-23 column (60 m × 250 μm i.d. × 0.25 μm film). Helium linear velocity was 24 cm/s; injection was 1 μL at a 20:1 split. The oven was held at 180 °C for 10 min, increased at 4 °C/min to 200 °C and held for 15 min, then increased at 10 °C/min to 230 °C and held for 6 min. Injector and detector temperatures were 250 °C; FID gases were approximately 30 mL/min hydrogen, 400 mL/min air, and 30 mL/min nitrogen makeup gas. FAMEs were identified against a Supelco 37 Component FAME Mix (CRM47885; Supelco, Bellefonte, PA, USA) and expressed as percentage of total detected fatty acids (FAs). Saturated fatty acids (SFAs), monounsaturated fatty acids (MUFAs), polyunsaturated fatty acids (PUFAs), and other summary measures were calculated from individual fatty acids. Other FA was calculated as 100% minus the summed proportions of the 16 reported fatty acids; individual minor-peak identities were not archived. Fatty-acid nomenclature followed Dugan and Wood [27]. The complete fatty-acid panel is reported in Supplementary Table S3.
2.7. Protein-Hydrolysate Amino-Acid Analysis
Protein-hydrolysate amino acids were quantified, rather than free amino acids. Approximately 50.0 mg freeze-dried homogenate was hydrolyzed in 5.0 mL 6 M HCl under nitrogen at 110 °C, for 24 h. The hydrolysate was diluted to 50 mL; a 10 mL aliquot was evaporated, redissolved in 10 mL 0.02 M HCl, filtered (0.20 μm), and analyzed with an L-8900 amino-acid analyzer (Hitachi High-Tech Corporation, Tokyo, Japan) using post-column ninhydrin detection. Methionine and cysteine were measured in parallel samples after approximately 20 h performic-acid oxidation, quenching with 48% HBr, and 6 M HCl hydrolysis at 110 °C for 18 h; tryptophan was not determined. FUJIFILM Wako Amino Acids Mixture Standard Solution Type H [CRM] (Code 018-27881; FUJIFILM Wako Pure Chemical Corporation, Osaka, Japan) calibrated routine amino acids. Oxidized sulfur amino acids were quantified as cysteic acid and methionine sulfone, using L-Cysteic Acid (Cat. No. 031-05251; FUJIFILM Wako Pure Chemical Corporation, Osaka, Japan) and L-Methionine Sulfone (Cat. No. 352-39841; FUJIFILM Wako Pure Chemical Corporation, Osaka, Japan), respectively. Cysteic acid was converted to cystine/cysteine equivalents on a half-cystine molar basis (120.15 g/mol), and methionine sulfone was converted to methionine equivalents using a molar mass of 149.21 g/mol. Results were expressed as g/100 g protein. Total measured amino acids (TAAs) was calculated as the sum of the 17 measured amino acids; the sum of eight essential amino acids (EAA8) was calculated as His + Ile + Leu + Lys + Met + Phe + Thr + Val.
2.8. Statistical Analysis
Primary statistical analyses used IBM SPSS Statistics 29.0 (IBM Corp., Armonk, NY, USA), with the individual pig as the experimental unit for animal-level outcomes. Additional sensitivity analyses of the shared 50–80 kg interval, IMF-adjusted and CLR fatty-acid outcomes, and PCA specification/stability were implemented in Python 3.13.5 using pandas 2.2.3, NumPy 2.3.5, statsmodels 0.14.6, scikit-learn 1.8.0, and Matplotlib 3.10.8. For Python fixed-effects models, Population and Sex were coded with sum-to-zero contrasts, so that Type III tests matched the SPSS parameterization. The primary analysis model for continuous outcomes used UNIANOVA with type III sums of squares and fixed effects of Population (LB, LDB, DR), Sex (barrow, gilt), and Population × Sex. Because each named breed was represented by one source population, Population was used as the grouping factor. Population estimated marginal means (EMMs) ± standard error (SE) and Tukey-adjusted pairwise comparisons were obtained from the fitted model. Population, Sex, and Population × Sex effects were evaluated; when Population × Sex p < 0.05, interpretation used cell means, rather than marginal Population means alone. For trait positioning, “numerically intermediate” indicated that the LDB EMM lay between the corresponding LB and DR EMMs. A “statistically supported intermediate ordering” additionally required significant LDB–LB and LDB–DR pairwise contrasts in opposite directions; numerical ordering and statistical support were reported separately. Biological or practical relevance was interpreted from effect magnitude and trait context, rather than from statistical significance alone.
The 16 individual fatty acids and 17 protein-hydrolysate amino acids formed separate multiplicity families. Population-effect p values were adjusted within each family using the Benjamini–Hochberg false discovery rate (FDR) procedure [28]. FDR adjustment was applied only to Population effects; Sex and Population × Sex p values were treated as nominal. Fatty-acid class summaries and TAA, EAA8, and EAA8:TAA were analyzed separately, and were not included in the component-variable FDR families. No additional multiplicity adjustment was applied across growth, carcass, technological pork-quality, or muscle-morphology outcomes; for those outcomes, Population pairwise comparisons were Tukey-adjusted within each fitted model. Because fatty acids were reported as relative percentages, a compositional sensitivity analysis was also performed [29]. The 16 identified fatty acids plus Other FA formed a strictly positive 17-part composition, so no zero replacement was required. Centered-log-ratio (CLR) coordinates were calculated for the 17-part composition and analyzed with the same Population × Sex model; Population-effect p values for the 16 identified fatty-acid CLR coordinates were controlled by BH-FDR. At the class level, SFA, MUFA, PUFA, and Other FA were treated as a mutually exclusive four-part composition, and analyzed as CLR coordinates.
Carcass and postmortem outcomes were also evaluated with a MIXED sensitivity model containing SlaughterBatch nested within Population as a random intercept. Because slaughter batches were nested within Population, this sensitivity model assessed stability of numerical ordering, rather than independent batch or calendar effects. Key postmortem outcomes were additionally analyzed from the nine batch means (three per Population) by one-way ANOVA, as a cluster-level sensitivity check. Selected carcass and meat-quality outcomes were reanalyzed with centered Final BW as a covariate; this was retained as a sensitivity analysis, rather than the primary estimand because conditioning on achieved Final BW changes the comparison from observed phenotypes within the target-weight window to conditional contrasts at a common Final BW. Because slaughter-age ranges did not overlap among source populations and slaughter age/calendar were structurally confounded with Population, slaughter age was not entered as a conventional covariate; doing so would require extrapolation beyond common support. Fatty-acid outcomes were additionally reanalyzed after adding centered IMF to the Population + Sex + Population × Sex model. Homogeneity of the IMF association across source populations was assessed by a Population × IMF interaction; when this interaction was supported, common-slope IMF-adjusted means were treated as descriptive, rather than as a uniform Population contrast. Leave-one-out analyses refitted the primary model after omitting each pig for ADG, F/G, lean percentage, BFT, IMF, shear force, MinFeret, and PUFA. Residual plots, studentized residuals, and Cook’s distance were examined for model adequacy and influence.
A standardized individual-level principal component analysis (PCA) provided exploratory integration of 13 traits selected to represent the major phenotype domains while limiting redundancy among closely related measurements: ADG and F/G; lean percentage, average BFT, and LMA; IMF, pH24, drip loss, and shear force; MinFeret and fiber density; and C18:1n-9c and C18:2n-6. Variables were not selected on the basis of PCA loadings. Traits were centered and scaled to unit variance. For the primary PCA, SPSS FACTOR used the correlation matrix, principal-component extraction, no rotation (NOROTATE), and regression score saving (SAVE REG). Individual PC1/PC2 scores were used descriptively, and Population centroids were their within-population means. To assess dependence on trait selection and fatty-acid representation, sensitivity PCAs were run after (i) excluding the two lipid variables and (ii) replacing their raw percentages with the prespecified CLR(C18:1n-9c) and CLR(C18:2n-6) coordinates from the full 17-part composition. A leave-one-trait-out analysis of the CLR-lipid specification omitted each of the 13 variables in turn; PC1 direction was aligned to the full CLR-lipid solution because PCA axis signs are arbitrary. The sensitivity PCAs and sign-aligned leave-one-trait-out calculations used the Python implementation described above. LDB positioning was visualized by dividing primary-model EMM contrasts by the corresponding residual SD, with Tukey-adjusted 95% simultaneous intervals from the same three-Population family. Tests were two-sided with α = 0.05, unless an FDR q-value criterion was specified.
3. Results
3.1. Growth Performance and Time to the Common Target Body Weight
All 60 pigs completed the experiment and were slaughtered within the 106–114 kg target live-weight window. Final BW showed no statistical evidence of a Population effect (p = 0.801), whereas initial BW, trial duration, total feed intake, ADG, and F/G showed Population effects (p < 0.001; Table 2). Trial duration decreased from 135.6 d in LB to 115.3 d in LDB and 100.3 d in DR; corresponding mean slaughter ages were 205.6, 185.3, and 170.3 d, respectively (p < 0.001; Table S2). Population × Sex descriptive values for initial BW, final BW, slaughter age, and trial duration are reported in Table S2, Panel B. ADG increased from 657 to 738 to 813 g/d, whereas F/G decreased from 3.209 to 2.762 to 2.548 kg/kg across LB, LDB, and DR (all Tukey-adjusted p < 0.05). Full-trial ADFI showed no statistical evidence of a Population effect (p = 0.254). In the shared 50–80 kg sensitivity interval, the same ordered pattern was retained: ADG was 704, 801, and 896 g/d and F/G was 2.789, 2.339, and 2.094 kg/kg for LB, LDB, and DR, respectively (both Ppop < 0.001; Table S6). Common-interval ADFI showed an omnibus Population effect (p = 0.032), although no Tukey-adjusted pairwise contrast reached p < 0.05. Sex effects were detected for common-interval ADFI and F/G (both p < 0.001), while there was no statistical evidence of a Population × Sex interaction for any common-interval outcome (all Pint ≥ 0.484). Sex effects also occurred for total feed intake, full-trial ADFI, and full-trial F/G, with no statistical evidence of a Population × Sex interaction for the primary full-trial growth outcomes (Table S2).
Table 2.
Growth performance and time to the target slaughter-weight window.
3.2. Carcass Composition, Technological Pork Quality, and Muscle Morphology
At the common final-BW range, carcass composition differed among populations (Table 3). DR had greater cold carcass weight and dressing percentage than LB and LDB. Lean percentage increased from 50.84% in LB to 59.81% in LDB and 66.99% in DR, whereas fat percentage and average BFT decreased in the same order (all Tukey-adjusted p < 0.05). Loin muscle area also increased from LB to LDB to DR. LDB had the greatest bone proportion, while skin proportion decreased across the three populations. A Sex effect was detected for carcass fat percentage (p = 0.037), with no Population × Sex interaction detected for the principal carcass outcomes in Table 3. Skin thickness showed a Population × Sex interaction (p = 0.003; Table S2).
Table 3.
Carcass traits and tissue proportions of Liaoning Black, Liaodan Black, and Duroc pigs.
Population effects were detected for IMF, pH45, pH24, L*, a*, drip loss, cooking loss, and shear force (p ≤ 0.002; Table 4), whereas b* showed no statistical evidence of a Population effect (p = 0.060). IMF decreased from 4.19% in LB to 3.31% in LDB and 2.58% in DR. LB had higher pH45 than DR, and pH24 was higher in LB than in LDB and DR. Lightness (L*) increased and redness (a*) decreased from LB to LDB to DR. Drip loss was lower in LB and LDB than in DR, cooking loss increased stepwise from LB to LDB to DR, and shear force was lower in LB than in DR; LDB was numerically intermediate for shear force, but neither the LDB–LB nor LDB–DR pairwise contrast was statistically supported. A Sex effect occurred for cooking loss (p = 0.031), with no supported Population × Sex interaction for the outcomes shown in Table 4.
Table 4.
Pork quality, intramuscular fat, and muscle-morphology traits of Liaoning Black, Liaodan Black, and Duroc pigs.
Muscle morphology also differed among populations. MinFeret increased from 52.04 μm in LB to 60.12 μm in LDB and 70.00 μm in DR (p < 0.001), whereas fiber density was greater in LB and LDB than in DR (p < 0.001; Table 4). These structural traits, therefore, showed a largely ordered LB–LDB–DR pattern for fiber size, while fiber density did not distinguish LB from LDB.
3.3. Intramuscular Fatty-Acid and Amino-Acid Profiles
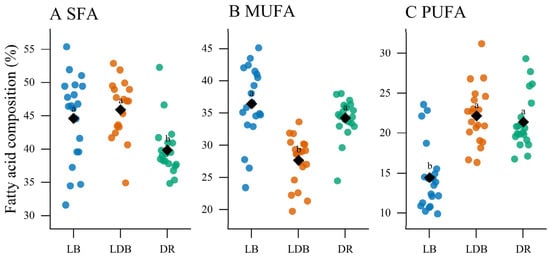
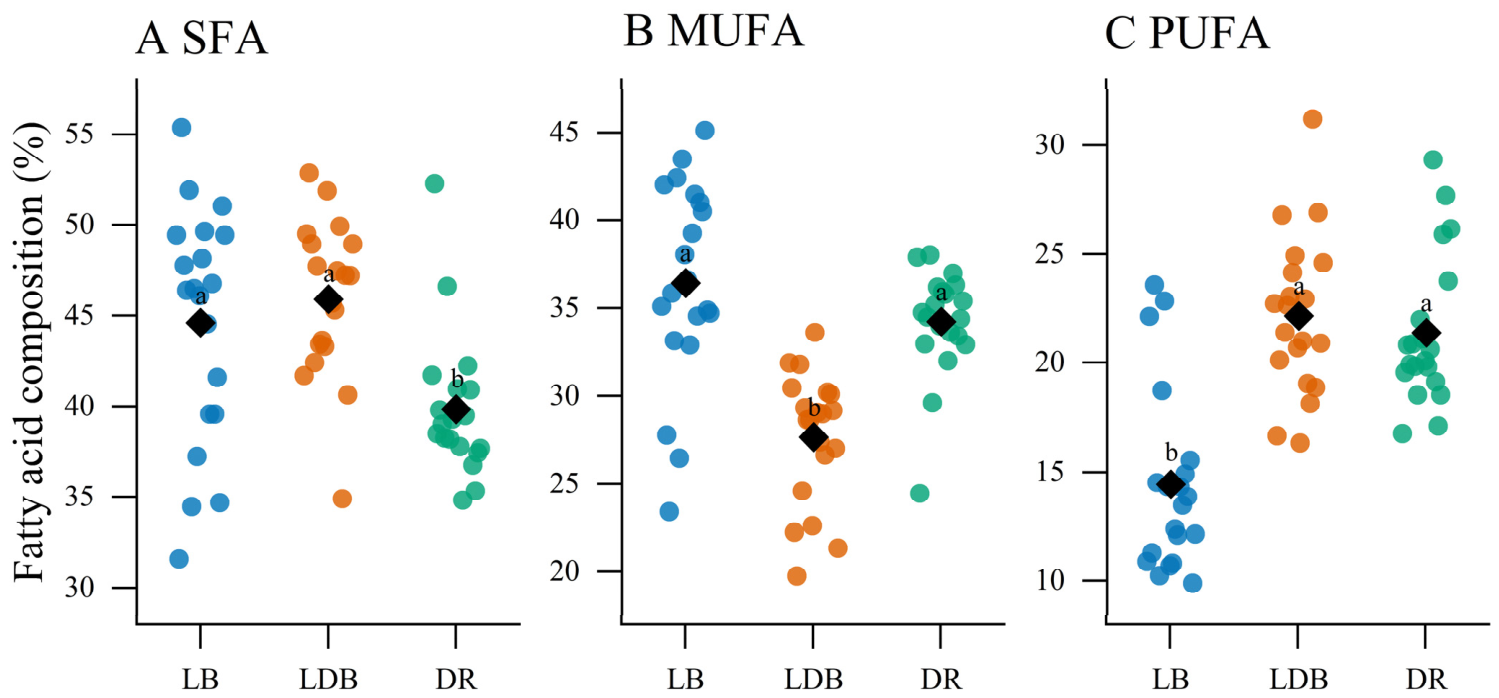
Fatty-acid class composition differed among the sampled populations. SFA was lower in DR than in LB and LDB (p = 0.001), MUFA was lower in LDB than in LB and DR (p < 0.001), and PUFA was lower in LB than in LDB and DR (p < 0.001; Table S3). Unsaturated fatty acids (UFAs) and the UFA:SFA ratio were greatest in DR, while Other FA showed no statistical evidence of a Population effect (p = 0.538).
Across the 16 individual fatty acids (Table 5 and Table S3), FDR-adjusted Population effects were supported for C12:0, C16:0, C16:1, C18:1n-9c, C18:2n-6, C20:0, C18:3n-3, C20:2n-6, C20:4n-6, and docosahexaenoic acid (DHA) (q ≤ 0.019). C12:0 also showed a Population × Sex interaction, and was therefore interpreted at the cell-mean level, rather than from marginal Population means alone (Table S3). Among the fatty acids displayed in Table 5, C18:0 and eicosapentaenoic acid (EPA) did not meet the FDR criterion. C18:1n-9c was lower in LDB than in LB and DR, whereas C18:2n-6 and C20:4n-6 were lower in LB than in LDB and DR. C18:3n-3 was greatest in DR, and DHA was lower in DR than in LDB, with LB intermediate.
Table 5.
Selected intramuscular fatty-acid composition of Liaoning Black, Liaodan Black, and Duroc pigs.
Sensitivity analyses showed that the central lipid-domain pattern was not dependent on a single analytical representation (Table S7). After conditioning on centered IMF, Population effects remained supported for MUFA (p < 0.001), PUFA (p < 0.001), C18:1n-9c (q < 0.001), and C18:2n-6 (q < 0.001), whereas the primary C20:4n-6 difference was attenuated (q = 0.156). Population × IMF interactions were detected for C18:0, C20:4n-6, DHA, and SFA (p = 0.045, 0.014, 0.030, and 0.028, respectively), so common-slope IMF-adjusted means for those outcomes were interpreted descriptively. In the 17-part CLR analysis, LDB retained the lowest relative C18:1n-9c coordinate (q < 0.001), while LB retained the lowest relative C18:2n-6 coordinate (q < 0.001); the four-part class analysis likewise retained lower relative MUFA in LDB and lower relative PUFA in LB (both p < 0.001).
Protein-hydrolysate amino-acid composition showed comparatively limited variation (Table S4). After FDR correction across the 17 measured amino acids, Population effects remained for glycine (q = 0.011), proline (q = 0.002), and alanine (q = 0.040). TAA and EAA8 showed no statistical evidence of Population effects (p = 0.419 and 0.449, respectively), whereas EAA8:TAA differed (p = 0.001), with DR exceeding LB; neither pairwise contrast involving LDB was statistically supported.
3.4. Domain-Dependent Phenotypic Positioning of Liaodan Black
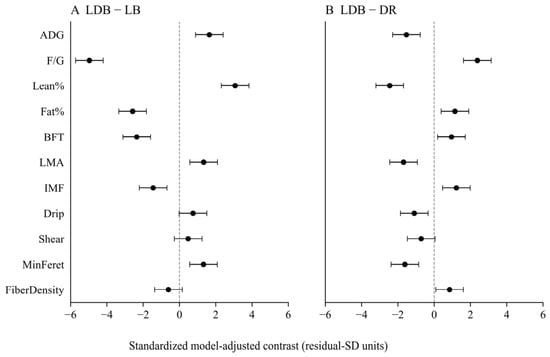
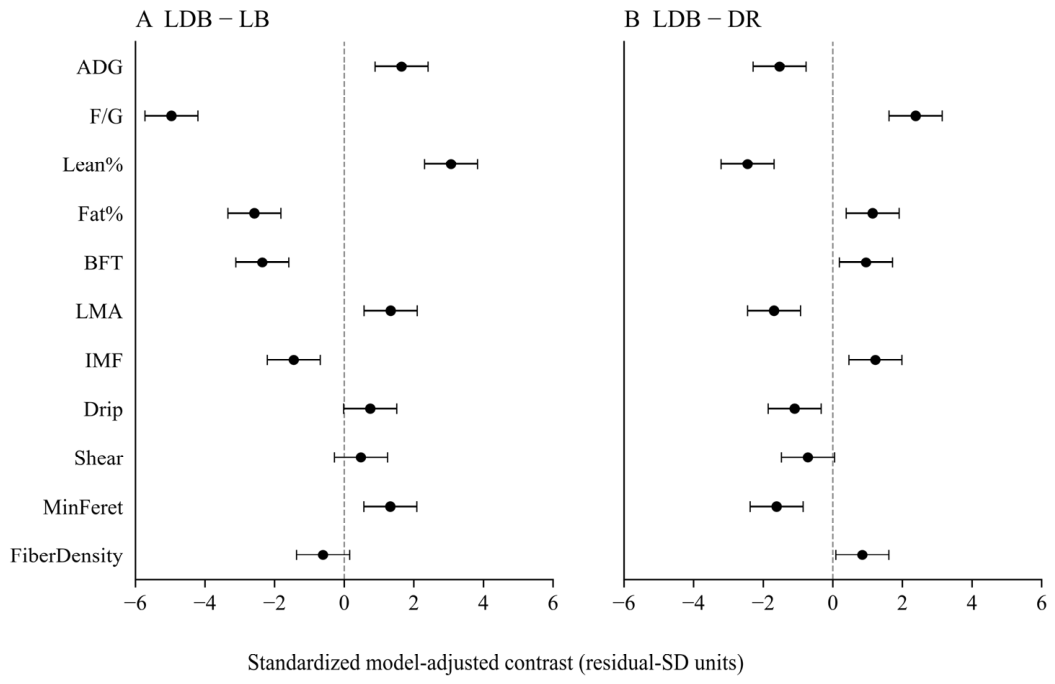
Standardized model-adjusted contrasts positioned LDB numerically between LB and DR for many principal production and carcass traits (Figure 1). Relative to LB, LDB had higher ADG, lean percentage, LMA, and MinFeret, and lower F/G, fat percentage, BFT, and IMF; Tukey-adjusted 95% simultaneous intervals for drip loss, shear force, and fiber density included zero. Relative to DR, LDB had lower ADG, lean percentage, LMA, drip loss, and MinFeret, and higher F/G, fat percentage, BFT, IMF, and fiber density, whereas the adjusted interval for shear force included zero. Thus, several production/carcass traits showed statistically supported intermediate ordering, whereas the pattern was not uniform across meat-quality traits.
Figure 1.
Standardized model-adjusted contrasts positioning Liaodan Black (LDB) relative to Liaoning Black (LB; Panel (A)) and Duroc (DR; Panel (B)). Each contrast from the Population + Sex + Population × Sex model was divided by its residual SD, and is shown with a Tukey-adjusted 95% simultaneous confidence interval. Traits are ADG, F/G, lean percentage, fat percentage, BFT, LMA, IMF, drip loss, shear force, MinFeret, and fiber density. The dashed vertical line denotes zero. Positive values indicate higher LDB values; intervals crossing zero indicate nonsignificant contrasts at α = 0.05. Values are standardized contrasts for cross-trait visualization, and are not Cohen’s d. ADG, average daily gain; F/G, feed-to-gain ratio; BFT, backfat thickness; LMA, loin muscle area; IMF, intramuscular fat; MinFeret, minimum Feret diameter; SD, standard deviation.
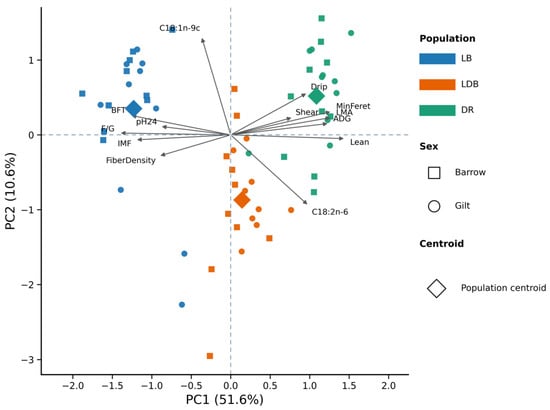
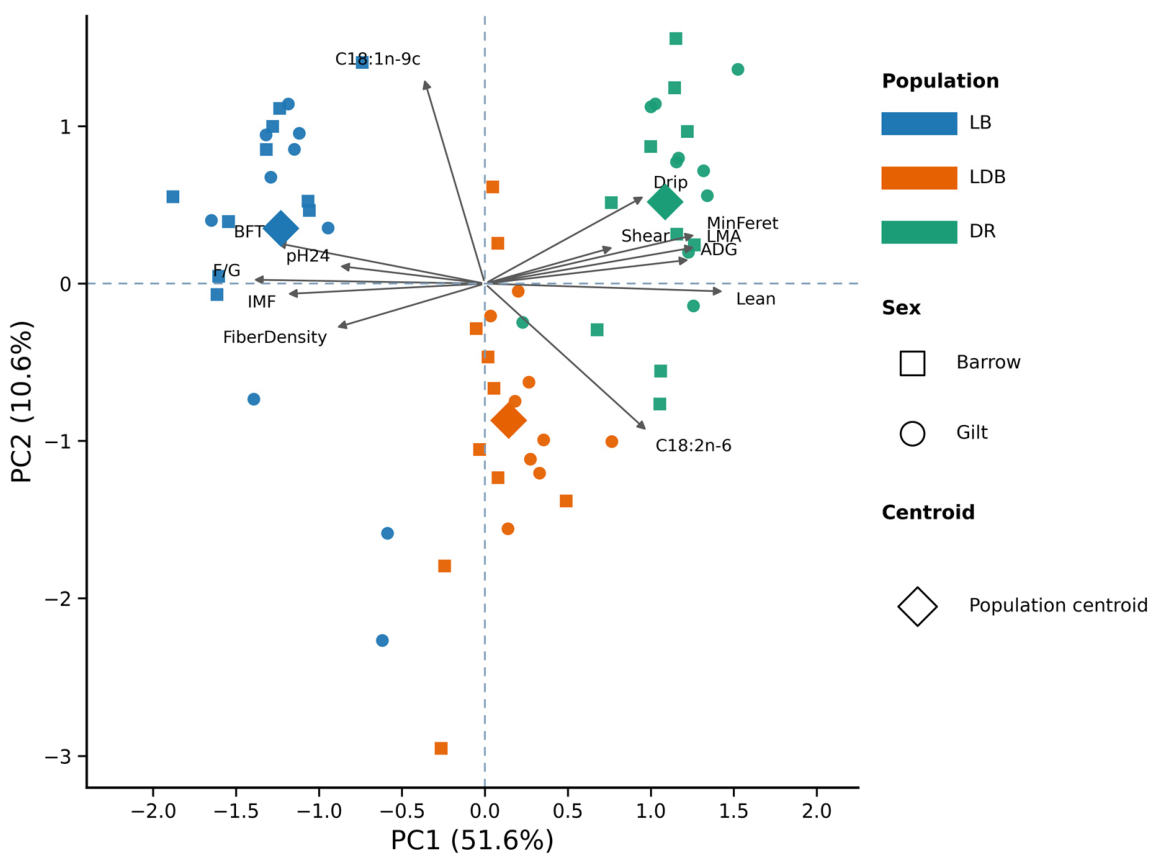
The 13-trait PCA integrated growth performance, carcass composition, technological pork quality, muscle morphology, and representative fatty-acid variables (Figure 2). PC1 and PC2 accounted for 51.6% and 10.6% of total standardized-trait variance, respectively. PC1 was aligned positively with lean percentage, LMA, MinFeret, and ADG, and negatively with F/G, BFT, and IMF. Population score centroids progressed from LB through LDB to DR, along PC1. In contrast, PC2 was dominated by opposing loadings of C18:1n-9c and C18:2n-6, and LDB was displaced from both populations along this lipid-associated axis.
Figure 2.
Primary exploratory principal component analysis of 13 phenotypic traits selected to represent major phenotype domains in Liaoning Black (LB), Liaodan Black (LDB), and Duroc (DR) pigs: average daily gain (ADG), feed-to-gain ratio (F/G), lean percentage, backfat thickness (BFT), loin muscle area (LMA), intramuscular fat (IMF), pH24, drip loss, shear force, minimum Feret diameter (MinFeret), fiber density, C18:1n-9c, and C18:2n-6. Population colors identify LB, LDB, and DR; squares denote barrows and circles denote gilts. Enlarged diamonds show Population centroids, and vectors show trait loadings. PC1 and PC2 explain 51.6% and 10.6% of total variance, respectively. The two fatty-acid variables in this primary visualization are raw percentages; non-lipid, CLR-lipid, and leave-one-trait-out PCA sensitivity analyses are provided in Figure S3. PC1, principal component 1; PC2, principal component 2; CLR, centered log ratio.
The class-level fatty-acid profiles further illustrated this domain divergence (Figure 3): LDB had the lowest MUFA, LB had the lowest PUFA, and DR had the lowest SFA. Alternative PCA specifications were directionally stable (Figure S3). The non-lipid PCA retained LB–LDB–DR centroid ordering on PC1 (57.4% of variance), and the CLR-lipid PCA retained the same PC1 ordering (52.2%) while LDB remained displaced along PC2 (9.8%). After sign alignment to the full CLR-lipid solution, all 13 leave-one-trait-out specifications retained the LB–LDB–DR PC1 centroid ordering. Batch-aware mixed models, final-BW-centered analyses, and leave-one-out refitting retained the principal numerical ordering for most postmortem outcomes (Table S5; Figures S1 and S2). In the nine-batch mean analysis, statistical support was attenuated for cold carcass weight (p = 0.062), dressing percentage (p = 0.097), and b* (p = 0.281), whereas the principal lean–fat, IMF, pH, L*/a*, water-loss, muscle-morphology, and fatty-acid-class patterns remained supported.
Figure 3.
Intramuscular saturated (SFA), monounsaturated (MUFA), and polyunsaturated fatty-acid (PUFA) profiles of Liaoning Black (LB), Liaodan Black (LDB), and Duroc (DR) pigs. Panels (A–C) show SFA, MUFA, and PUFA as percentages of total detected fatty acids. Colored points represent individual pigs. Black diamonds show model-adjusted Population estimated marginal means. Different lowercase letters denote Tukey-adjusted pairwise differences among Population estimated marginal means (p < 0.05).
4. Discussion
The principal finding of this study was that the relative phenotypic position of LDB was domain dependent, rather than uniformly intermediate between the sampled LB and DR source populations. Growth efficiency and major carcass traits largely followed an LB–LDB–DR continuum: ADG and lean percentage increased, while F/G, fat percentage, BFT, and IMF decreased across the three populations. The common 50–80 kg analysis retained the ordered ADG and F/G pattern, indicating that these directions were not solely a consequence of comparing different full-trial weight intervals. In contrast, intramuscular lipid composition did not follow the same continuum. LDB had the lowest MUFA and C18:1n-9c, while its PUFA profile was closer to DR than LB; these principal lipid differences persisted under IMF-adjusted and CLR sensitivity analyses. The exploratory PCA retained the production/carcass PC1 ordering in both non-lipid and CLR-lipid sensitivity specifications, while the CLR-lipid specification also preserved LDB’s distinct displacement along PC2. Thus, the population ordering observed for growth and carcass traits did not extend uniformly to intramuscular lipid composition.
For production and carcass traits, LDB showed numerical or statistically supported intermediate ordering across several economically important outcomes. At a common final-BW range, LDB had ADG, F/G, lean percentage, fat percentage, BFT, and LMA values between those of LB and DR. Similar effects of genotype or sire-line background and sex on carcass composition and related production traits have been reported previously [4,7,8,13,14]. Selection for greater feed efficiency has also been associated with greater carcass leanness and lower trimmed fat [3]. In the present experiment, pigs entered the formal trial at the same age, but differed in initial BW, so full-trial ADG, F/G, and trial duration integrate differences established before Day 0 with subsequent realized growth. The shared 50–80 kg sensitivity analysis retained the LB–LDB–DR ordering for ADG (704, 801, and 896 g/d) and F/G (2.789, 2.339, and 2.094 kg/kg; both p < 0.001). ADFI showed an omnibus Population effect over the common interval (p = 0.032), but no Tukey-adjusted pairwise contrast reached p < 0.05. These results support directional stability of the principal growth-efficiency pattern over a common body-weight interval, but do not convert the comparison into an age-independent genetic estimate. The common target-weight endpoint is therefore most appropriately interpreted as a practical comparison of realized phenotypes, as each sampled source population approached a similar market body weight. Recent syntheses and genetic-line comparisons likewise emphasize that carcass value and fresh-meat quality can respond differently to production and genetic factors [30,31].
Technological pork-quality and muscle-structural traits showed partial, but not complete, concordance with the production/carcass continuum. IMF decreased stepwise from LB to LDB to DR, while cooking loss increased in the opposite direction. LB and LDB had lower drip loss than DR, and LB had lower shear force than DR; LDB was numerically intermediate for shear force, but neither the LDB–LB nor LDB–DR pairwise contrast was statistically supported. Postmortem biochemical events, pH decline, and myofibrillar structural changes are important determinants of water-holding capacity [32,33,34,35]. The higher pH24 and lower water losses in LB are consistent with those mechanisms, but the lack of statistical separation in pH24 between LDB and DR, despite different water losses, indicates that ultimate pH alone does not explain the observed pattern. IMF can contribute to texture and eating quality, but its effects depend on genotype, muscle structure, and other biological factors [5,15,16]. Likewise, MinFeret increased from LB to LDB to DR while fiber density decreased; because both were derived from fixed-area fields, these two measures are structurally related, rather than independent descriptors. Recent work has linked porcine muscle-fiber characteristics with carcass and meat-quality variation [15,17,32,36,37]. Recent reviews further emphasize that skeletal-muscle plasticity, energy metabolism, nutrition, and lipid deposition interact in shaping pork-quality traits, while phenotypic studies of local breeds illustrate that performance, carcass composition, IMF, pH, and age or sex effects need not change in parallel [38,39,40]. The comparatively limited differences in protein-hydrolysate amino-acid composition observed here should also be distinguished from the broader role of dietary amino acids in regulating muscle metabolism, fiber characteristics, and IMF deposition [41].
The most pronounced departure from a simple intermediate pattern occurred in intramuscular fatty-acid composition. LDB had lower C18:1n-9c than both LB and DR, the lowest MUFA class proportion, and PUFA values close to DR, rather than midway between the two references. Fatty-acid percentages can vary with total intramuscular lipid because increased fat deposition changes the relative contributions of neutral lipids and phospholipids [42]. This issue was directly examined in the sensitivity analyses. After conditioning on IMF, the Population effects for MUFA, PUFA, C18:1n-9c, and C18:2n-6 remained supported, whereas C20:4n-6 was attenuated. Population × IMF interactions for C18:0, C20:4n-6, DHA, and SFA further indicate that a single common IMF slope was not appropriate for every lipid outcome. Independently, the 17-part and four-part CLR analyses retained the central pattern of lower relative C18:1n-9c and MUFA in LDB, and lower relative C18:2n-6 and PUFA in LB, showing that the principal lipid-domain divergence was not solely an artifact of the 100% closure constraint. These sensitivity analyses do not establish causal independence from fat deposition; rather, they show which relative-composition differences remained under alternative conditioning and compositional representations. Slaughter age may also contribute: increasing age has been associated with greater IMF and C18:1 and lower C18:2 in growing Duroc pigs [43]. Genetic background, sex, and nutrition can further modify porcine fatty-acid profiles [13,18,44,45,46]. Contemporary reviews of porcine IMF biology and nutrigenetics likewise identify genetics, age, sex, diet, and lipid-metabolic regulation as major determinants of IMF deposition and fatty-acid composition [47,48]. Recent multi-omics comparison of pigs carrying Chinese-indigenous versus conventional commercial genetic backgrounds also reported coordinated differences in IMF, water-holding capacity, meat color, and intramuscular fatty-acid profiles [49]. The present results therefore support domain-specific phenotypic divergence within the sampled populations, but do not identify its causal basis. Because fatty acids were measured as percentages of total detected fatty acids, the findings remain statements about relative composition, rather than absolute fatty-acid quantities.
The trait-domain dependence observed here has a practical implication for evaluating regionally maintained or selected pig populations. Production efficiency and carcass lean yield are important agricultural endpoints, but they should not be used as proxies for all product-quality traits. In the present data, LDB occupied a numerically or statistically supported intermediate position for many growth and major carcass characteristics, yet its intramuscular lipid profile departed from that same ordering. The exploratory PCA was used as an integration tool, rather than as independent inferential evidence. Importantly, the non-lipid PCA and CLR-lipid PCA both retained the LB–LDB–DR PC1 centroid ordering, and all 13 sign-aligned leave-one-trait-out CLR-lipid specifications retained that ordering, indicating descriptive stability regarding the principal variable-selection checks. The PCA results nevertheless remain exploratory, and do not imply additive inheritance or heterosis, because the sampled LB and DR populations were reference groups, rather than the direct parents of the LDB pigs.
Four design features limit the scope of inference. First, each named breed was represented by one source population, and individual sire and dam pedigree identifiers were not archived; within-source genetic relatedness could therefore not be quantified or explicitly modeled. Any such relatedness could introduce within-source correlation and further limit breed-level genetic inference. The results should not be generalized as breed-wide genetic effects or as estimates of population-wide genetic parameters. Second, the modest sample size, particularly 10 pigs per Population × Sex cell, limited precision for smaller differences and interaction effects; nonsignificant results should therefore not be interpreted as equivalence. Third, pigs differed in BW at the common 70 d formal-trial start, and Population could not be fully separated from source-specific developmental history before the 7 d acclimation period. The common 50–80 kg sensitivity analysis reduces the weight-interval discrepancy for growth-efficiency comparisons, but does not remove pre-Day-0 developmental differences. Fourth, the populations reached the target-weight window at different ages and calendar dates, and slaughter batches were nested within Population. The slaughter-age ranges did not overlap, so statistical adjustment for age would require extrapolation beyond common support. Final-BW-centered models, batch-aware mixed models, batch-mean analysis, and leave-one-out refitting retained the principal numerical ordering for most outcomes, but statistical support for cold carcass weight and dressing percentage weakened at the batch level, and none of these sensitivity analyses can independently separate Population from slaughter age or calendar period. The results should therefore be interpreted as population-associated phenotypes expressed when the sampled source populations reached a common target body weight under the standardized production conditions used in this experiment.
5. Conclusions
At a common 106–114 kg target body weight, the relative phenotypic position of Liaodan Black pigs was not uniform across trait domains within the sampled source populations. Growth efficiency and major carcass traits largely followed an LB–LDB–DR continuum, and the shared 50–80 kg analysis retained the ordered ADG and F/G pattern. Intramuscular lipid composition diverged from that continuum, with LDB showing the lowest MUFA and C18:1n-9c, and a PUFA profile closer to DR; the principal lipid differences were retained in IMF-adjusted and CLR sensitivity analyses. These findings indicate that population ordering based on production and carcass phenotypes should not be assumed to extend directly to intramuscular lipid composition. The conclusions are restricted to population-associated phenotypes in the source-defined populations examined under the present target-weight design, and should not be interpreted as age-independent or breed-wide genetic effects.
Supplementary Materials
The following supporting information can be downloaded at: https://www.mdpi.com/article/10.3390/agriculture16212381/s1: Table S1: Ingredient composition and premix nutrient supply of the experimental diets; Table S2: Expanded growth-performance and carcass model output, including Population × Sex descriptive statistics; Table S3: Intramuscular fatty-acid composition, class and derived summaries, and model output; Table S4: Protein-hydrolysate amino-acid composition, summary indices, and model output; Table S5: Sensitivity analyses for key outcomes; Table S6: Common 50–80 kg body-weight interval growth sensitivity analysis; Table S7: IMF-adjusted and compositional fatty-acid sensitivity analyses; Figure S1: Leave-one-out stability of key Population contrasts; Figure S2: Slaughter-batch-level sensitivity of selected postmortem outcomes; Figure S3: PCA sensitivity to lipid representation and trait selection.
Author Contributions
Conceptualization, J.C. and X.L.; methodology, D.Q. and H.S.; investigation, J.C., Y.L., D.Q., L.X. and H.S.; data curation, J.C., Y.L., L.X. and S.W.; formal analysis, J.C. and Y.L.; visualization, Y.L. and S.W.; writing—original draft preparation, J.C. and Y.L.; writing—review and editing, X.L.; supervision, X.L.; resources, X.L.; funding acquisition, X.L. J.C. and Y.L. contributed equally to this work. All authors have read and agreed to the published version of the manuscript.
Funding
This research was funded by the National Key Research and Development Program of China, grant number 2023YFD1300200; the Key Research and Development Project of Liaoning Province, grant number 2024JH2/102400009; and the Shenyang Science and Technology Key Research Project, grant number 24-215-2-20. The funding bodies provided financial support only, and had no role in study design, animal experiments, data collection, data analysis or interpretation, manuscript preparation, or the decision to submit the manuscript for publication.
Institutional Review Board Statement
The animal study protocol was approved by the Animal Ethics Committee of Shenyang Agricultural University (protocol code SNLL25051605; approved 16 May 2025). The study was conducted in accordance with the approved protocol and relevant institutional requirements for animal research, and is reported in accordance with the ARRIVE guidelines.
Informed Consent Statement
Not applicable.
Data Availability Statement
The original data presented in this study are openly available in Zenodo [50] at https://zenodo.org/records/23043225 (accessed on 30 September 2026); DOI: 10.5281/zenodo.23043225. The Python scripts used for sensitivity analyses are available from the corresponding author upon reasonable request.
Acknowledgments
During the preparation of this manuscript, the authors used ChatGPT (OpenAI Version 5.0) to assist with language translation and editing. The AI tool was not involved in study design, data analysis, interpretation of results, or manuscript drafting. All analytical outputs, interpretations, and manuscript content were reviewed and verified by the authors, who take full responsibility for the content of this publication.
Conflicts of Interest
The authors declare no conflicts of interest. The funders had no role in the design of the study; in the collection, analyses, or interpretation of data; in the writing of the manuscript; or in the decision to publish the results.
References
- Čandek-Potokar, M.; Lebret, B.; Gispert, M.; Font-i-Furnols, M. Challenges and future perspectives for the European grading of pig carcasses—A quality view. Meat Sci. 2024, 208, 109390. [Google Scholar] [CrossRef] [Scilit] [PubMed]
- Gagaoua, M.; Gondret, F.; Lebret, B. Towards a ‘One Quality’ approach of pork: A perspective on the challenges and opportunities in the context of the farm-to-fork continuum—Invited review. Meat Sci. 2025, 226, 109834. [Google Scholar] [CrossRef] [Scilit] [PubMed]
- Saikia, A.; Mejicanos, G.; Rothy, J.; Rajendiran, E.; Yang, C.; Nyachoti, M.; Lei, H.; Bergsma, R.; Wu, Y.; Jin, S.; et al. Pork carcass composition, meat and belly qualities as influenced by feed efficiency selection in replacement boars from Large White sire and dam lines. Meat Sci. 2024, 210, 109423. [Google Scholar] [CrossRef] [Scilit] [PubMed]
- Nevrkla, P.; Václavková, E.; Rozkot, M. The Indigenous Prestice Black-Pied Pig Breed Differs from a Commercial Hybrid in Growth Intensity, Carcass Value and Meat Quality. Agriculture 2021, 11, 331. [Google Scholar] [CrossRef] [Scilit]
- Razmaitė, V.; Šveistienė, R.; Šiukščius, A. Effects of Genotype on Pig Carcass, Meat Quality and Consumer Sensory Evaluation of Loins and Bellies. Foods 2024, 13, 798. [Google Scholar] [CrossRef] [Scilit] [PubMed]
- Oh, S.-H.; Lee, C.Y.; Song, D.-H.; Kim, H.-W.; Jin, S.K.; Song, Y.-M. Effects of the slaughter weight of non-lean finishing pigs on their carcass characteristics and meat quality. J. Anim. Sci. Technol. 2022, 64, 353–364. [Google Scholar] [CrossRef] [Scilit] [PubMed]
- Zomeño, C.; Gispert, M.; Čandek-Potokar, M.; Mörlein, D.; Font-i-Furnols, M. A matter of body weight and sex type: Pig carcass chemical composition and pork quality. Meat Sci. 2023, 197, 109077. [Google Scholar] [CrossRef] [Scilit] [PubMed]
- Gomes, J.D.; Silva, B.P.M.; Duarte, S.F.P.; Ferreira, S.V.; Almeida, V.V.; Pian, L.W.; Ciconello, F.N.; Gadbem, C.T.M.; Cesar, A.S.M. Productive performance and carcass quality of pigs from different sire lines under commercial production conditions. Vet. Anim. Sci. 2025, 29, 100491. [Google Scholar] [CrossRef] [Scilit] [PubMed]
- Wang, Y.; Zhang, H.; Yan, E.; He, L.; Guo, J.; Zhang, X.; Yin, J. Carcass and meat quality traits and their relationships in Duroc × Landrace × Yorkshire barrows slaughtered at various seasons. Meat Sci. 2023, 198, 109117. [Google Scholar] [CrossRef] [Scilit] [PubMed]
- Coutant, M.P.; Grønbeck, M.S.; Hviid, M.; Pedersen, L.J.; Larsen, M.L.V. Effects of space allowance, roughage supplement, and enrichment provision on growth, carcass weight and meat quality in conventional indoor pig husbandry. Meat Sci. 2025, 229, 109916. [Google Scholar] [CrossRef] [Scilit] [PubMed]
- Shi, J.; Wang, X.; Liu, X.; Chen, J.; Song, H.; Xu, G.; Zhang, S.; Sun, X.; Li, B.; Zhou, M.; et al. Performance evaluation of Liaodan Black pigs [in Chinese]. Swine Prod. 2024, 5, 13–15. [Google Scholar] [CrossRef]
- Huang, Y.; Zhou, L.; Zhang, J.; Liu, X.; Zhang, Y.; Cai, L.; Zhang, W.; Cui, L.; Yang, J.; Ji, J.; et al. A large-scale comparison of meat quality and intramuscular fatty acid composition among three Chinese indigenous pig breeds. Meat Sci. 2020, 168, 108182. [Google Scholar] [CrossRef] [Scilit] [PubMed]
- dos Santos, J.C.R.; Norenberg, A.; Correia, B.; Irgang, R.; Bianchi, I.; Moreira, F.; Oliveira Júnior, J.M.; Nörnberg, J.L.; Peripolli, V. Evaluation of different percentages of Duroc genes and gender on growth, carcass and meat quality traits for pigs. Meat Sci. 2023, 205, 109314. [Google Scholar] [CrossRef] [Scilit] [PubMed]
- Terada, K.; Ohtani, T.; Ogawa, S.; Hirooka, H. Genetic parameters for carcass and meat quality traits in Jinhua, Duroc, and their crossbred pigs. J. Anim. Breed. Genet. 2024, 141, 33–41. [Google Scholar] [CrossRef] [Scilit] [PubMed]
- Li, X.; Lu, L.; Tong, X.; Li, R.; Jin, E.; Ren, M.; Gao, Y.; Gu, Y.; Li, S. Transcriptomic Profiling of Meat Quality Traits of Skeletal Muscles of the Chinese Indigenous Huai Pig and Duroc Pig. Genes 2023, 14, 1548. [Google Scholar] [CrossRef] [Scilit] [PubMed]
- Mao, X.; Zhu, J.; Li, S.; Diao, X.; Qiu, X.; Hou, Y.; Shan, K.; Li, C. Phenotypic differences between Chinese indigenous pig breeds and Duroc × (Landrace × Yorkshire): A perspective from meat science, biology, and biochemistry. Food Chem. 2025, 495, 146604. [Google Scholar] [CrossRef] [Scilit] [PubMed]
- Yan, M.; Li, L.; Huang, Y.; Tang, X.; Shu, Y.; Cui, D.; Yu, C.; Hu, Y.; Ma, J.; Xiao, S.; et al. Investigation on muscle fiber types and meat quality and estimation of their heritability and correlation coefficients with each other in four pig populations. Anim. Sci. J. 2024, 95, e13915. [Google Scholar] [CrossRef] [Scilit] [PubMed]
- Wen, Y.; Liao, C.; Wang, R.; Wen, B.; Luo, W.; Zhang, W.; Zhu, C.; Sun, H.; Zhang, L.; Liu, X.; et al. Molecular Mechanisms Underlying Divergent Biochemical Compositions in Longissimus Dorsi of Huainan and Yunan Black Pigs: Insights from Fatty Acids, Amino Acids, and Transcriptomic Profiling. Agriculture 2025, 15, 2532. [Google Scholar] [CrossRef] [Scilit]
- Faul, F.; Erdfelder, E.; Buchner, A.; Lang, A.-G. Statistical power analyses using G*Power 3.1: Tests for correlation and regression analyses. Behav. Res. Methods 2009, 41, 1149–1160. [Google Scholar] [CrossRef] [Scilit] [PubMed]
- GB/T 6435-2014; Determination of Moisture in Feedstuffs. Standardization Administration of China: Beijing, China, 2014.
- GB/T 6432-2018; Determination of Crude Protein in Feeds—Kjeldahl Method. Standardization Administration of China: Beijing, China, 2018.
- GB/T 6433-2025; Determination of Crude Fat in Feeds. Standardization Administration of China: Beijing, China, 2025.
- GB/T 6438-2007; Animal Feeding Stuffs—Determination of Crude Ash. Standardization Administration of China: Beijing, China, 2007.
- GB/T 6436-2018; Determination of Calcium in Feeds. Standardization Administration of China: Beijing, China, 2018.
- GB/T 6437-2018; Determination of Phosphorus in Feeds—Spectrophotometry. Standardization Administration of China: Beijing, China, 2018.
- Folch, J.; Lees, M.; Sloane Stanley, G.H. A simple method for the isolation and purification of total lipides from animal tissues. J. Biol. Chem. 1957, 226, 497–509. [Google Scholar] [CrossRef] [Scilit]
- Dugan, M.E.R.; Wood, J.D. Letter to the Editor. Meat fatty acid composition. Meat Sci. 2018, 143, 268. [Google Scholar] [CrossRef] [Scilit] [PubMed]
- Benjamini, Y.; Hochberg, Y. Controlling the false discovery rate: A practical and powerful approach to multiple testing. J. R. Stat. Soc. Ser. B 1995, 57, 289–300. [Google Scholar] [CrossRef] [Scilit]
- Greenacre, M. Compositional Data Analysis. Annu. Rev. Stat. Appl. 2021, 8, 271–299. [Google Scholar] [CrossRef] [Scilit]
- Lebret, B.; Čandek-Potokar, M. Review: Pork quality attributes from farm to fork. Part I. Carcass and fresh meat. Animal 2022, 16, 100402. [Google Scholar] [CrossRef] [Scilit] [PubMed]
- Li, X.; Ha, M.; Warner, R.D.; Hewitt, R.J.E.; D’Souza, D.N.; Dunshea, F.R. Genetic lines influenced the texture, collagen and intramuscular fat of pork longissimus and semimembranosus. Meat Sci. 2024, 207, 109376. [Google Scholar] [CrossRef] [Scilit] [PubMed]
- Matarneh, S.K.; Silva, S.L.; Gerrard, D.E. New Insights in Muscle Biology that Alter Meat Quality. Annu. Rev. Anim. Biosci. 2021, 9, 355–377. [Google Scholar] [CrossRef] [Scilit] [PubMed]
- Huff-Lonergan, E.; Lonergan, S.M. Mechanisms of water-holding capacity of meat: The role of postmortem biochemical and structural changes. Meat Sci. 2005, 71, 194–204. [Google Scholar] [CrossRef] [Scilit] [PubMed]
- Johnson, L.G.; Zhai, C.; Reever, L.M.; Prusa, K.J.; Nair, M.N.; Huff-Lonergan, E.; Lonergan, S.M. Characterizing the sarcoplasmic proteome of aged pork chops classified by purge loss. J. Anim. Sci. 2023, 101, skad046. [Google Scholar] [CrossRef] [Scilit] [PubMed]
- Yin, C.; Wu, S.; Yang, N.; Ai, T.; Wan, J.; Rui, Q.; Liu, H.; Xiong, H.; Liu, J. Number of denatured rigor cross-bridges determines the intracellular volume shrinkage in porcine muscle fibre under PSE-inducing condition. Meat Sci. 2024, 212, 109473. [Google Scholar] [CrossRef] [Scilit] [PubMed]
- Eom, J.-U.; Seo, J.-K.; Jeong, K.-J.; Song, S.; Kim, G.-D.; Yang, H.-S. Comparison of Chemical Composition, Quality, and Muscle Fiber Characteristics between Cull Sows and Commercial Pigs: The Relationship between Pork Quality Based on Muscle Fiber Characteristics. Food Sci. Anim. Resour. 2024, 44, 87–102. [Google Scholar] [CrossRef] [Scilit] [PubMed]
- Cai, L.; Huang, Y.; Zhong, L.; Zou, X.; Ji, J.; Liu, X.; Huang, C.; Zeng, Q.; Yang, B.; Xiao, S.; et al. Using phenotypic and genotypic big data to investigate the effect of muscle fiber characteristics on meat quality and eating quality traits in pigs. Meat Sci. 2023, 198, 109122. [Google Scholar] [CrossRef] [Scilit] [PubMed]
- Sosnicki, A.; Gonzalez, J.; Fields, B.; Knap, P. A review of porcine skeletal muscle plasticity and implications for genetic improvement of carcass and meat quality. Meat Sci. 2025, 219, 109676. [Google Scholar] [CrossRef] [Scilit] [PubMed]
- Yan, E.; Guo, J.; Yin, J. Nutritional regulation of skeletal muscle energy metabolism, lipid accumulation and meat quality in pigs. Anim. Nutr. 2023, 14, 185–192. [Google Scholar] [CrossRef] [Scilit] [PubMed]
- Olschewsky, A.; Krieger, M.; Hoischen-Taubner, S.; Mörlein, D.; Klingel, S.; Thaller, G.; Hinrichs, D. Performance, carcass quality and meat quality of the endangered German Angler Saddleback pig. PLoS ONE 2024, 19, e0300361. [Google Scholar] [CrossRef] [Scilit] [PubMed]
- Liao, J.; Zhang, P.; Yin, J.; Zhang, X. New insights into the effects of dietary amino acid composition on meat quality in pigs: A review. Meat Sci. 2025, 221, 109721. [Google Scholar] [CrossRef] [Scilit] [PubMed]
- Wood, J.D.; Enser, M.; Fisher, A.V.; Nute, G.R.; Sheard, P.R.; Richardson, R.I.; Hughes, S.I.; Whittington, F.M. Fat deposition, fatty acid composition and meat quality: A review. Meat Sci. 2008, 78, 343–358. [Google Scholar] [CrossRef] [Scilit] [PubMed]
- Bosch, L.; Tor, M.; Reixach, J.; Estany, J. Age-related changes in intramuscular and subcutaneous fat content and fatty acid composition in growing pigs using longitudinal data. Meat Sci. 2012, 91, 358–363. [Google Scholar] [CrossRef] [Scilit] [PubMed]
- Sebastià, C.; Gallopin, M.; Ramayo-Caldas, Y.; Estellé, J.; Valdés-Hernández, J.; Castelló, A.; Sánchez, A.; Crespo-Piazuelo, D.; Folch, J.M. Gene co-expression network analysis for porcine intramuscular fatty acid composition. Animal 2024, 18, 101259. [Google Scholar] [CrossRef] [Scilit] [PubMed]
- Atoo, A.F.; Levesque, C.L.; Thaler, R.; Underwood, K.; Beyer, E.; Perez-Palencia, J.Y. Effect of feeding high oleic soybean oil to finishing pigs on growth performance, carcass characteristics, and meat quality. J. Anim. Sci. 2025, 103, skae393. [Google Scholar] [CrossRef] [Scilit] [PubMed]
- Guevara-Freire, D.; Escudero, R.M.; Calvo, L.; Rodriguez, A.I.; Reina, R.; Morales, J.I.; Olivares, Á.; López-Bote, C. Influence of dietary linoleic acid inclusion on fatty acid composition in barrows and gilts and its relationship to fat accumulation. Meat Sci. 2026, 236, 110062. [Google Scholar] [CrossRef] [Scilit] [PubMed]
- Han, Q.; Huang, X.; He, J.; Zeng, Y.; Yin, J.; Yin, Y. Intramuscular fat deposition in pig: A key target for improving pork quality. J. Integr. Agric. 2025, 24, 4461–4483. [Google Scholar] [CrossRef] [Scilit]
- Malgwi, I.H.; Halas, V.; Grünvald, P.; Schiavon, S.; Jócsák, I. Genes Related to Fat Metabolism in Pigs and Intramuscular Fat Content of Pork: A Focus on Nutrigenetics and Nutrigenomics. Animals 2022, 12, 150. [Google Scholar] [CrossRef] [Scilit] [PubMed]
- Long, K.; Zeng, Z.; Long, Y.; Shen, Y.; Meng, C.; Gao, Y.; Tian, T.; Zhou, X.; Gu, Y.; Shang, P.; et al. Multi-omics integration characterizes meat quality differences between Duroc × Wujin × Yorkshire and Duroc × Landrace × Yorkshire pigs. Food Chem. Mol. Sci. 2026, 12, 100372. [Google Scholar] [CrossRef] [Scilit] [PubMed]
- Chen, J.; Li, Y.; Qiao, D.; Xie, L.; Wang, S.; Song, H.; Liu, X. Dataset for Domain-Dependent Phenotypic Positioning of Liaodan Black Pigs Relative to Liaoning Black and Duroc Populations at a Common Target Body Weight. 2026. Available online: https://zenodo.org/records/23043225 (accessed on 30 September 2026).

Disclaimer/Publisher’s Note: The statements, opinions and data contained in all publications are solely those of the individual author(s) and contributor(s) and not of MDPI and/or the editor(s). MDPI and/or the editor(s) disclaim responsibility for any injury to people or property resulting from any ideas, methods, instructions or products referred to in the content. |
© 2026 by the authors. Licensee MDPI, Basel, Switzerland. This article is an open access article distributed under the terms and conditions of the Creative Commons Attribution (CC BY) license.