


Abstract
Rapid urbanization intensifies the overlap between natural hazards and persistent land-use disturbance in coastal agricultural landscapes, yet how these pressures jointly shape ecological risk remains unclear. In the Guangdong–Hong Kong–Macao Greater Bay Area (GBA), we applied a hazard–vulnerability–ecological asset exposure (H–V–E) framework using 2000–2020 data and 5 km gridded assessment units, integrating rainstorm-induced flooding, tropical cyclones, human-induced landscape disturbance, and ecological–environmental and socioeconomic vulnerability. The framework uses ecosystem service value (ESV) as a proxy for ecological assets potentially exposed to loss and identifies eight H–V–E configurations to interpret risk patterns. Rainstorm-induced flooding formed localized hotspots along the central coast and western Pearl River Estuary, whereas tropical cyclone hazard showed a broader southern concentration. Mean landscape ecological risk changed little, but high-risk clusters intensified. ESV declined from CNY 279.12 billion to 262.72 billion over 2000–2020 and remained highest in peripheral forested and agricultural areas. Moderate-to-high integrated ecological risk covered 47.5% of the region. The low H–low V–high E configuration occupied the largest share (30.4%). These findings support differentiated management of cropland and surrounding ecological spaces through hazard mitigation, resilience enhancement, fragmentation control, and ecological asset protection.
1. Introduction
Rapidly urbanizing coastal agglomerations are exposed to both natural hazards and persistent anthropogenic disturbance. In these regions, cropland is embedded in a wider mosaic of forests, water bodies, settlements, and semi-natural habitats whose ecological functions influence water regulation, habitat provision, and landscape stability [1]. Heavy rainfall and flooding may inundate cultivated land [2], while tropical cyclones generate wind and rainfall disturbances across both agricultural and natural systems [3,4]. At the same time, urban expansion converts cropland and other ecological land to built-up uses and alters landscape configuration through fragmentation and spatial reorganization [5,6,7,8]. Regional ecological risk in coastal agglomerations therefore reflects the interaction of episodic hazards with longer-term land-use pressures, rather than either process alone.
Regional ecological risk assessment has consequently developed from single-hazard or single-receptor analyses toward frameworks that integrate multiple pressures, receptor conditions, and potential consequences [9]. Vulnerability in such frameworks is multidimensional, encompassing ecological sensitivity, socioeconomic exposure, and capacities for resistance, response, and recovery [10,11,12]. Ecosystem services and their values have also been introduced to represent ecological functions or assets that may be affected by disturbance [13,14,15]. This use requires a clear distinction: ecosystem service value (ESV) can indicate the relative magnitude of ecological assets potentially exposed to loss, but it is not evidence of realized damage from a particular event. Although integrated indices are useful for locating areas of concern, risk classes alone often reveal little about whether a mapped outcome is driven mainly by hazard, vulnerability, or the value of exposed ecological assets [16]. Examining the configurations of these components can therefore make regional risk patterns more interpretable for land-resource planning.
The Guangdong–Hong Kong–Macao Greater Bay Area (GBA) provides a relevant setting for such analysis. Located on the southern coast of China, the region combines a subtropical monsoon climate with coastal exposure to tropical cyclones, bringing heavy rainfall and strong winds [17,18]. Its low-lying deltaic plains and interconnected river–estuary network create conditions in which heavy rainfall, river discharge, and elevated coastal water levels can jointly contribute to flooding [17,19,20]. Previous assessments have identified marked spatial variation in multi-hazard ecological risk and vulnerability across Guangdong and the Pearl River Delta [21,22,23]. Meanwhile, rapid urbanization and the associated demand for construction land have driven the conversion of cropland and other ecological land to built-up uses, altering landscape configuration and ecosystem services [5,6,24]. These natural and socioeconomic conditions provide the geographical context for the combined pressures examined in this study.
Studies of ecosystem-service supply and demand show a pronounced core–periphery contrast [25,26]: urbanized areas around the Pearl River Estuary commonly have high demand and substantial supply–demand mismatches, whereas peripheral mountainous, forested, and agricultural areas retain more ecological land and provide comparatively greater ecosystem-service supply [27,28,29]. This contrast has informed ecological management zoning in the GBA [30]. Recent work also reports strong spatial variation in cropland-use stability and cultivated-land resilience in Guangdong [31,32].
Existing studies have demonstrated pronounced spatial heterogeneity in natural hazards, urbanization, ecosystem vulnerability, ecosystem services, and cultivated-land conditions across the GBA [21,22,30]. Conservation effectiveness can also vary across taxa, environmental conditions, and biogeographic contexts. For example, Ricci et al. (2024) found that the biodiversity benefits associated with Natura 2000 protected areas differed among taxonomic groups and European biogeographic regions [33]. Such variation further supports the need for spatially differentiated management adapted to local ecological conditions and conservation objectives. However, the hazard, vulnerability, and ecological asset dimensions of regional risk have generally been examined separately. Consequently, it remains unclear why areas with similar hazard levels may exhibit different levels of final ecological risk, or why areas exposed to only moderate hazard may nevertheless become management priorities because of high vulnerability or ecological asset exposure [9,14]. This knowledge gap is relevant to agricultural land management because the condition and protection of cropland are closely related to the configuration and ecological functions of the surrounding landscape [1]. Nevertheless, neither hazard maps nor ESV maps alone can adequately identify differentiated management priorities. A component-based interpretation that distinguishes the respective roles of hazard, vulnerability, and ecological asset exposure is therefore needed to connect regional ecological risk assessment with spatially differentiated agricultural land and ecological-space management [15,16].
This study adopts a hazard–vulnerability–ecological asset exposure (H–V–E) framework in which regional ecological risk is treated as the joint outcome of external pressure, receptor vulnerability, and ecological assets potentially exposed to loss [9,21,23]. Rainstorm-induced flooding, tropical cyclones, and human-induced landscape disturbance represent the principal natural and anthropogenic pressures. Ecological–environmental and socioeconomic indicators characterize vulnerability, while ESV represents relative ecological asset exposure in accordance with approaches that incorporate ecosystem services or their potential loss into regional risk assessment [14,15]. The framework does not introduce a crop-damage model; instead, it disaggregates the final risk surface into interpretable H–V–E configurations.
The analysis addresses three questions: (1) How are rainstorm-induced flooding, tropical cyclone hazard, and landscape ecological risk distributed across the GBA? (2) How do vulnerability and ecological asset exposure modify the spatial translation from hazard to final risk? (3) Which H–V–E configurations underlie the integrated risk pattern, and what broad priorities do they imply for agricultural land and ecological-space management? Building on existing composite-index approaches, this study combines ESV-based ecological asset exposure with a classification of eight H–V–E configurations. These configurations complement integrated risk scores with information on the associated combinations of hazard, vulnerability, and ecological assets. This allows areas within the same broad risk class to be differentiated according to their component profiles, providing a more explicit basis for discussing management priorities.
2. Materials and Methods
2.1. Overview of the Study Area
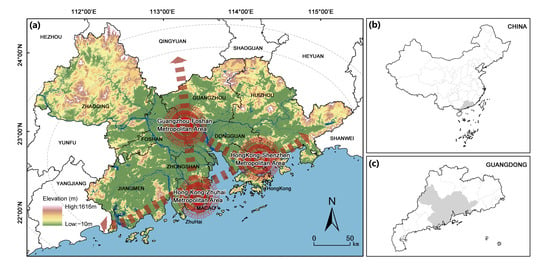
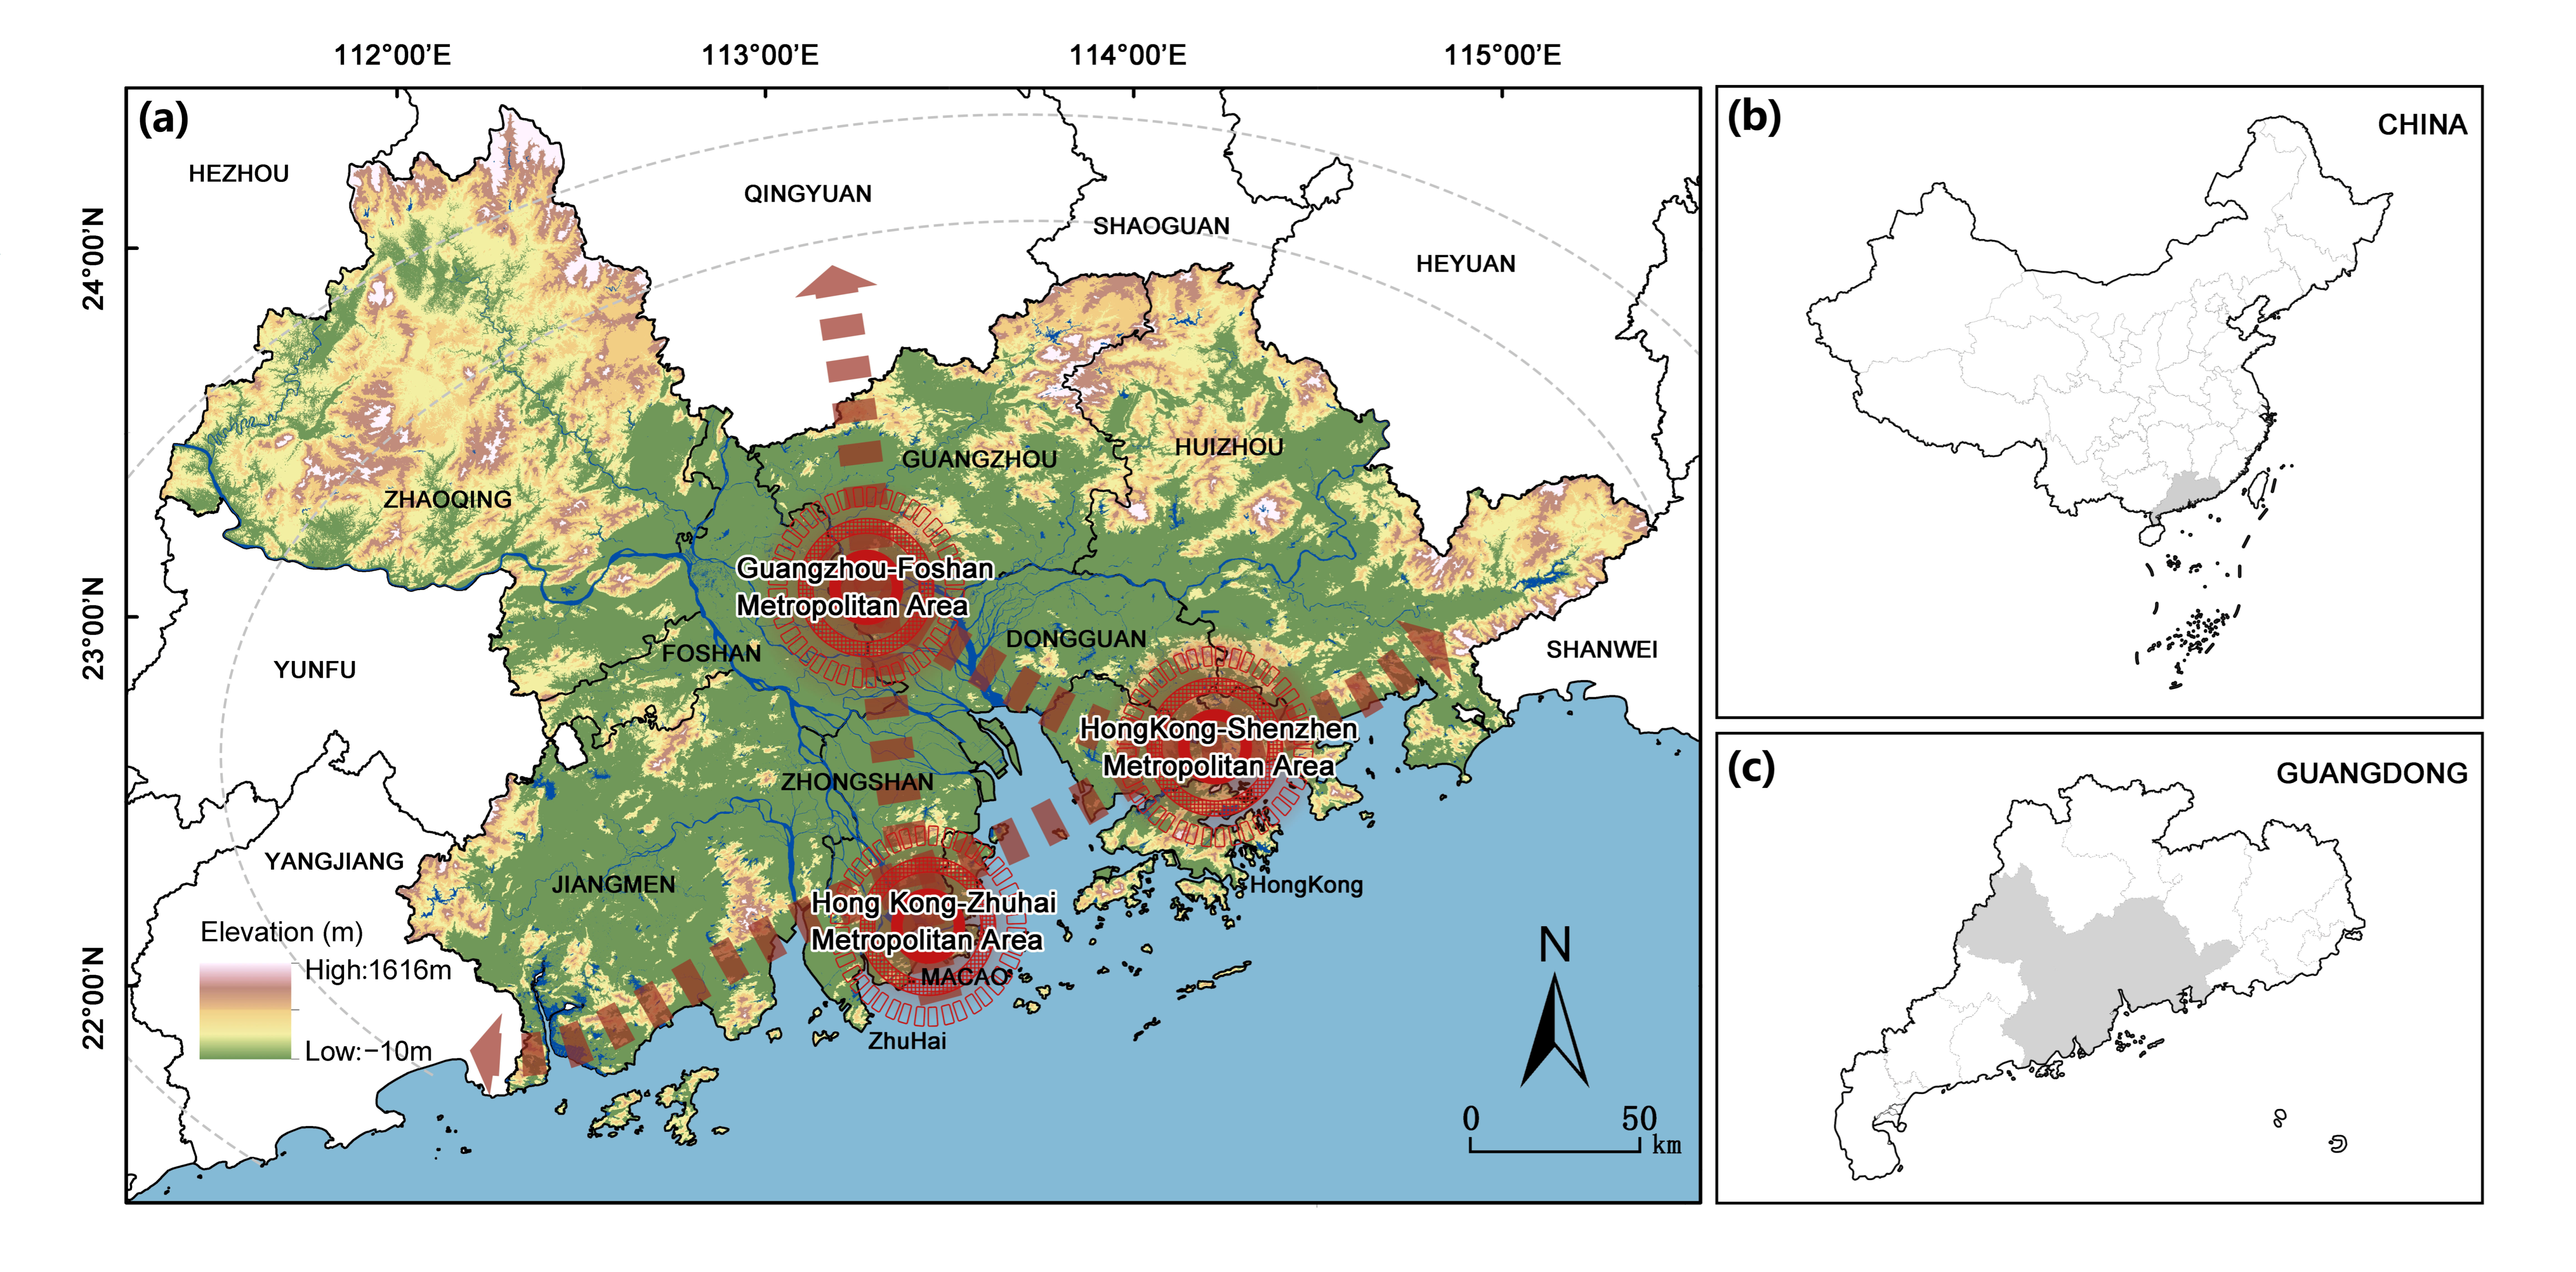
The Guangdong–Hong Kong–Macao Greater Bay Area (GBA) is located in southern China, extending approximately from 21°25′ N to 24°30′ N and from 111°12′ E to 115°35′ E (Figure 1). It comprises the Hong Kong and Macao Special Administrative Regions and nine cities in the Pearl River Delta, namely Guangzhou, Shenzhen, Zhuhai, Foshan, Huizhou, Dongguan, Zhongshan, Jiangmen, and Zhaoqing, covering a total area of approximately 5.6 × 10⁴ km2.
Figure 1.
Location and topography of the Guangdong–Hong Kong–Macao Greater Bay Area (GBA). (a) Topography and major metropolitan areas of the GBA; (b) location of Guangdong Province in China; (c) location of the GBA within Guangdong Province.
The region has a subtropical monsoon climate, with a mean annual temperature of approximately 21–23 °C and mean annual precipitation of about 1808 mm. Elevation ranges from −10 to 1616 m and generally decreases from north to south. Hilly and mountainous terrain dominates the northern, eastern, and western parts of the region, whereas the central and southern areas are characterized by the alluvial plains of the Pearl River Delta, with dense river networks and low-lying coastal terrain. Peripheral areas retain relatively extensive cropland, forests, and mountainous ecosystems, while built-up land is highly concentrated around the Pearl River Estuary, forming a pronounced core–periphery spatial structure [34]. These contrasting geographical, climatic, and land-use conditions provide the regional setting in which agricultural landscapes and their surrounding ecological spaces are simultaneously influenced by hydrometeorological hazards and urban expansion.
2.2. Data Sources and Assessment Units
The datasets used in this study mainly included land use, topography, daily precipitation, tropical cyclone records, and socioeconomic statistics (Table 1). Administrative boundary data and the 30 m digital elevation model (DEM) were obtained from the Resource and Environment Science and Data Center (RESDC). Elevation, slope, and terrain relief were derived from the DEM. Land-use data for 2000, 2010, and 2020 were obtained from the China Multi-Period Land Use Remote Sensing Monitoring Dataset (CNLUCC) at a spatial resolution of 30 m and were reclassified into six categories: cropland, forestland, grassland, water bodies, built-up land, and unused land [35]. The 2000–2020 period was selected based on the availability of comparable land-use data and precipitation and tropical cyclone records covering the same period. It also provides a window for examining landscape and ecological asset changes associated with rapid urbanization, agricultural land-use adjustment, and ecological restoration in the GBA [36]. The three land-use observation years enabled decadal comparisons, while the study period facilitates comparison with previous landscape ecological risk and ecosystem-service assessments covering the same years [29].
Table 1.
Main datasets used in this study and their applications.
Daily precipitation records for the 11 cities in the GBA during 2000–2020 were obtained from the Guangdong Meteorological Bureau and used to assess the frequency, intensity, and hazard of rainstorm-induced flooding. Tropical cyclone records for 2000–2020 were also obtained from the Guangdong Meteorological Bureau. Hourly geographic coordinates of tropical cyclone centers, together with maximum wind-speed information, were used to reconstruct the areas affected by Force 7 and Force 10 wind circles and subsequently to assess tropical cyclone hazard. Socioeconomic and environmental governance data were mainly compiled from the Guangdong Statistical Yearbook, the Guangdong Ecological and Environmental Status Bulletin, statistical yearbooks of the individual cities, the National Bureau of Statistics of China, and other local statistical sources.
All indicators were harmonized to a common 5 km × 5 km grid comprising 2594 assessment units. Rainstorm-induced flooding hazard was interpolated using ordinary kriging, and tropical cyclone hazard was derived from grid exposure to reconstructed wind fields. City-level indicators were assigned by administrative boundaries, with area-weighted values for grids spanning multiple cities. Land-use data for 2000, 2010, and 2020 supported temporal comparisons, while the final assessment combined 2020 landscape disturbance and ESV, vulnerability indicators near the study-period end, and natural-hazard records from 2000 to 2020. The resulting map therefore represents relative ecological risk around 2020, informed by natural-hazard records from 2000 to 2020, rather than annual or period-average risk.
2.3. Integrated Ecological Risk Assessment Framework
2.3.1. Conceptual Framework and Risk Formulation
This study adopted a hazard–vulnerability–ecological asset exposure framework for regional ecological risk assessment, drawing on vulnerability theory and previous ecological risk frameworks that integrate hazard, vulnerability, and exposed ecosystem values [11,21]. Hazard (H), ecosystem vulnerability (V), and ecological assets potentially exposed to loss (E) were considered the three core dimensions of integrated ecological risk (Table 2). These dimensions respectively represent the external pressures acting on the regional system, the sensitivity and response capacity of the receptors, and the ecological assets that may be affected when risk events occur.
Table 2.
Indicator framework for integrated ecological risk assessment.
The integrated ecological risk was calculated as:
where denotes integrated ecological risk; represents the combined pressure generated by natural hazards and human-induced landscape disturbance; characterizes the sensitivity, resistance, and recovery capacity of ecological and socioeconomic systems when subjected to external disturbances; and represents ecological assets potentially exposed to loss, proxied by ecosystem service value (ESV). ESV is therefore used to characterize the relative magnitude of ecological assets that may be affected rather than the actual economic or ecological losses caused by a specific hazard event.
R = H × V × E
Following Liu and Chen [22], we adopted a multiplicative formulation to represent ecological risk as jointly dependent on hazard, vulnerability, and ecological asset exposure. Under this formulation, the contribution of hazard is scaled by receptor vulnerability and exposed asset value, rather than added to them as separate contributions. This reflects the assumption that high hazard alone does not necessarily imply high ecological risk. Conversely, a low value of any component can substantially reduce the integrated score even when the others are high.
Before weighted integration, the three hazard components and two vulnerability components were independently standardized to the 0–1 range using min–max normalization:
where X′ is the original value and Xmin and Xmax are the minimum and maximum values of the corresponding component across the assessment units.
2.3.2. Integrated Hazard and Weighting Scheme
The integrated hazard index consisted of human-induced landscape disturbance, tropical cyclones, and rainstorm-induced flooding. The GBA is characterized by both intensive urbanization and anthropogenic disturbance and substantial exposure to hydrometeorological hazards [6,23]. Anthropogenic disturbance and natural hazards were assigned equal overall weights of 0.5 as a baseline assumption.
Within the natural-hazard component, an approximate 0.6:0.4 allocation between tropical cyclones and rainstorm-induced flooding was adopted with reference to Liu and Chen [22]. The final weights assigned to human-induced landscape disturbance, tropical cyclones, and rainstorm-induced flooding were therefore 0.5, 0.3, and 0.2, respectively. This weighting scheme was intended to reflect the relative importance of the three risk sources in shaping the overall pressure profile of the GBA.
2.3.3. Integrated Vulnerability
Integrated vulnerability was assessed by combining ecological–environmental vulnerability and socioeconomic vulnerability. Ecological–environmental vulnerability describes the sensitivity of ecosystems to external disturbance together with their resistance and recovery capacity, whereas socioeconomic vulnerability reflects population and economic exposure, resource pressure, disaster-prevention capacity, and emergency-response capacity.
Given the high concentration of population and economic activities, rapid urbanization, and strong human disturbance in the GBA, socioeconomic conditions play an important role in determining the consequences of both natural hazards and anthropogenic pressures. Accordingly, while retaining the contribution of ecological–environmental conditions, relatively greater weight was assigned to socioeconomic vulnerability. The ecological–environmental and socioeconomic components were weighted at 0.4 and 0.6, respectively.
To assess sensitivity to the weighting choices for both hazard and vulnerability, we tested seven alternative schemes, including equal weighting and variations around the baseline weights. Sensitivity was evaluated using Spearman’s correlation and risk-class agreement between each alternative scheme and the baseline (Appendix A, Table A1).
2.3.4. Relevance to Agricultural Land and Surrounding Ecological Spaces
The H–V–E framework is applied to the entire regional landscape rather than exclusively to farmland. Its relevance to agricultural land arises because cropland and the ecological spaces that support it are exposed to the same hydrometeorological and land-use pressures represented in the assessment. Hazard describes those external pressures; vulnerability summarizes ecological–environmental and socioeconomic conditions that may influence system sensitivity and response; and ecological asset exposure indicates the relative value of ecosystem services potentially affected.
Accordingly, agricultural interpretation is made at the landscape and land-resource level. Areas with similar hazard may have different final risk because vulnerability and ecological asset exposure differ. The H–V–E configurations are therefore used to distinguish broad priorities—hazard reduction, resilience enhancement, or ecological asset protection—without treating the results as estimates of crop damage, farm income loss, or field-scale production risk.
2.4. Hazard Assessment of Major Risk Sources
2.4.1. Rainstorm-Induced Flooding Hazard
Rainstorm-induced flooding hazard was characterized using the frequency and intensity of heavy-rainfall events during the study period. Based on daily precipitation (), events were classified into three severity levels: light flooding ( mm), moderate flooding ( mm), and severe flooding ( mm). The occurrence frequencies of the three classes were denoted as , , and , respectively. Following Liu and Chen (2019) [22], intensity coefficients () were assigned according to the ratios among the threshold precipitation levels, with values of 1, 2, and 4 for light, moderate, and severe flooding, respectively. The rainstorm-induced flooding disaster index was calculated as:
where is the rainstorm-induced flooding disaster index, is the occurrence frequency of flooding events at severity level , and is the corresponding intensity coefficient. The resulting disaster index was standardized to derive the rainstorm-induced flooding hazard index, which was subsequently classified into hazard levels using the Jenks natural breaks method.
2.4.2. Tropical Cyclone Hazard
Tropical cyclone hazard was assessed using the maximum wind speed and track information of tropical cyclones during the study period. Based on the wind-circle radius model, the spatial extents of Force 7 and Force 10 wind circles were reconstructed, and the frequencies with which each assessment unit was affected by the two wind-circle categories were calculated. The original assessment considered wind-related impacts separately from cyclone-induced rainfall, with the latter incorporated into the rainstorm-induced flooding component.
Because the destructive effect of strong winds is closely related to kinetic energy and therefore to the square of wind speed, the intensity coefficients () for Force 7 and Force 10 wind circles were assigned values of 1 and 3, respectively [22]. The tropical cyclone disaster index was calculated as:
where is the tropical cyclone disaster index, is the frequency with which an assessment unit was affected by wind-circle category , and is the corresponding intensity coefficient. The spatial influence ranges of individual tropical cyclones over the study period were overlaid to derive the spatial pattern of tropical cyclone hazard.
2.4.3. Human-Induced Landscape Ecological Risk
Persistent anthropogenic disturbance was characterized through changes in land-use structure and landscape configuration, thereby representing the long-term pressure of land-use change on cropland and surrounding ecological spaces. Land-use data for 2000, 2010, and 2020 were used to quantify landscape-pattern characteristics. Landscape fragmentation, separation, and dominance indices were calculated using FRAGSTATS 4.2 and integrated into a landscape disturbance index. Based on previous studies and the regional characteristics of the GBA, weights of 0.5, 0.3, and 0.2 were assigned to fragmentation, separation, and dominance, respectively [37].
The disturbance index was subsequently combined with the vulnerability of individual landscape types to derive the landscape loss degree. Landscape ecological risk for each assessment unit was then calculated by weighting the loss degree of each landscape type according to its proportional area within the unit:
where is the landscape ecological risk index of assessment unit , is the area of landscape type within unit , is the total area of unit , and is the landscape loss degree of landscape type . Here, n denotes the number of landscape types. The therefore represents the ecological disturbance risk associated with land-use structure and landscape configuration and was used to examine its spatiotemporal changes from 2000 to 2020.
2.5. Ecosystem Vulnerability Assessment
Ecosystem vulnerability was assessed from ecological–environmental and socioeconomic dimensions, consistent with vulnerability frameworks that consider sensitivity, exposure, and response capacity [11,12,38]. Ecological–environmental vulnerability was evaluated using a pressure–response approach, with pressure representing factors that increase vulnerability and response representing resistance, recovery capacity, and environmental governance. The pressure component was adapted from Yang (2007) [39] by replacing the ecological index with topographic vulnerability and retaining weights of 0.3, 0.3, and 0.4 for ecosystem sensitivity, ecosystem disturbance, and topographic vulnerability, respectively. Topographic vulnerability was derived from elevation, slope, and terrain relief, weighted at 0.3, 0.4, and 0.3 following previous regional ecological risk assessments [40]. The response component included ecosystem resistance, recovery capacity, and environmental governance, with the latter characterized by solid-waste utilization, wastewater treatment, domestic-waste treatment, and environmental-protection investment.
Socioeconomic vulnerability represented potential loss, resource and economic pressure, and disaster-response capacity. The pressure component consisted of loss risk and economic–resource pressure with equal weights of 0.5, while the response component included disaster-prevention and emergency-response capacity. Indicators included population density, economic output, food production, infrastructure investment, public green space, agriculture and water-conservancy investment, health expenditure, physicians per 10,000 people, per capita GDP, and hospital numbers.
Integrated vulnerability was calculated as:
where and denote ecological–environmental and socioeconomic vulnerability, respectively.
2.6. Ecosystem Service Value and Ecological Asset Exposure
Ecosystem service value (ESV) was used to represent ecological assets potentially exposed to loss rather than realized disaster losses. The assessment followed the ecosystem-service valuation framework of Costanza et al. (1997) [41] and the equivalent-factor approach of Xie et al. (2003) [42]. The equivalence factors and built-up-land coefficients were obtained from the sources specified in Appendix A, Table A2. Ecosystem services were grouped into provisioning, regulating, supporting, and cultural services, including nine functions such as food production, climate regulation, hydrological regulation, soil retention, biodiversity maintenance, and aesthetic value.
To improve regional applicability, the national equivalent factors were adjusted using GBA grain yield, planting area, grain price, and forest biomass. Based on the average grain-production value during 2000–2020, one ecosystem-service equivalent was estimated at 2181.58 CNY ha−1. The complete set of adjusted ecosystem-service value coefficients and their sources are provided in Table A2. Total ESV was calculated as:
where is the area of ecosystem type , and is its unit-area ecosystem-service value coefficient; n denotes the number of ecosystem types. The standardized ESV was used as the ecological asset exposure component () in the H–V–E framework.
2.7. Integrated Ecological Risk and Risk-Formation Types
After standardization, integrated hazard (H), ecosystem vulnerability (V), and ecological asset exposure (E) were combined according to Equation (1) to derive integrated ecological risk. The ecological risks associated with rainstorm-induced flooding, tropical cyclones, and human-induced landscape disturbance were also calculated separately by combining each hazard component with vulnerability and ecological asset exposure.
For spatial interpretation, H, V, and E were classified into high and low states, yielding eight possible H–V–E combinations. For each component, Levels 4–5 were classified as high and Levels 1–3 as low. These combinations were defined as risk-formation types to distinguish the configurations underlying the integrated ecological risk surface. They indicate whether high or low hazard, vulnerability, and ecological asset exposure co-occur in each area and provide a basis for discussing differentiated land-management priorities. They do not constitute an additional risk index.
3. Results
3.1. Spatial Patterns of Natural Hazards and Landscape Ecological Risk
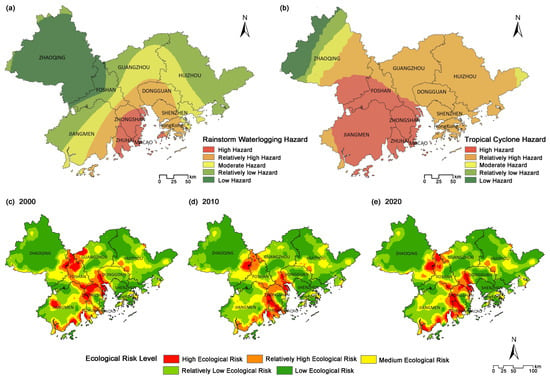
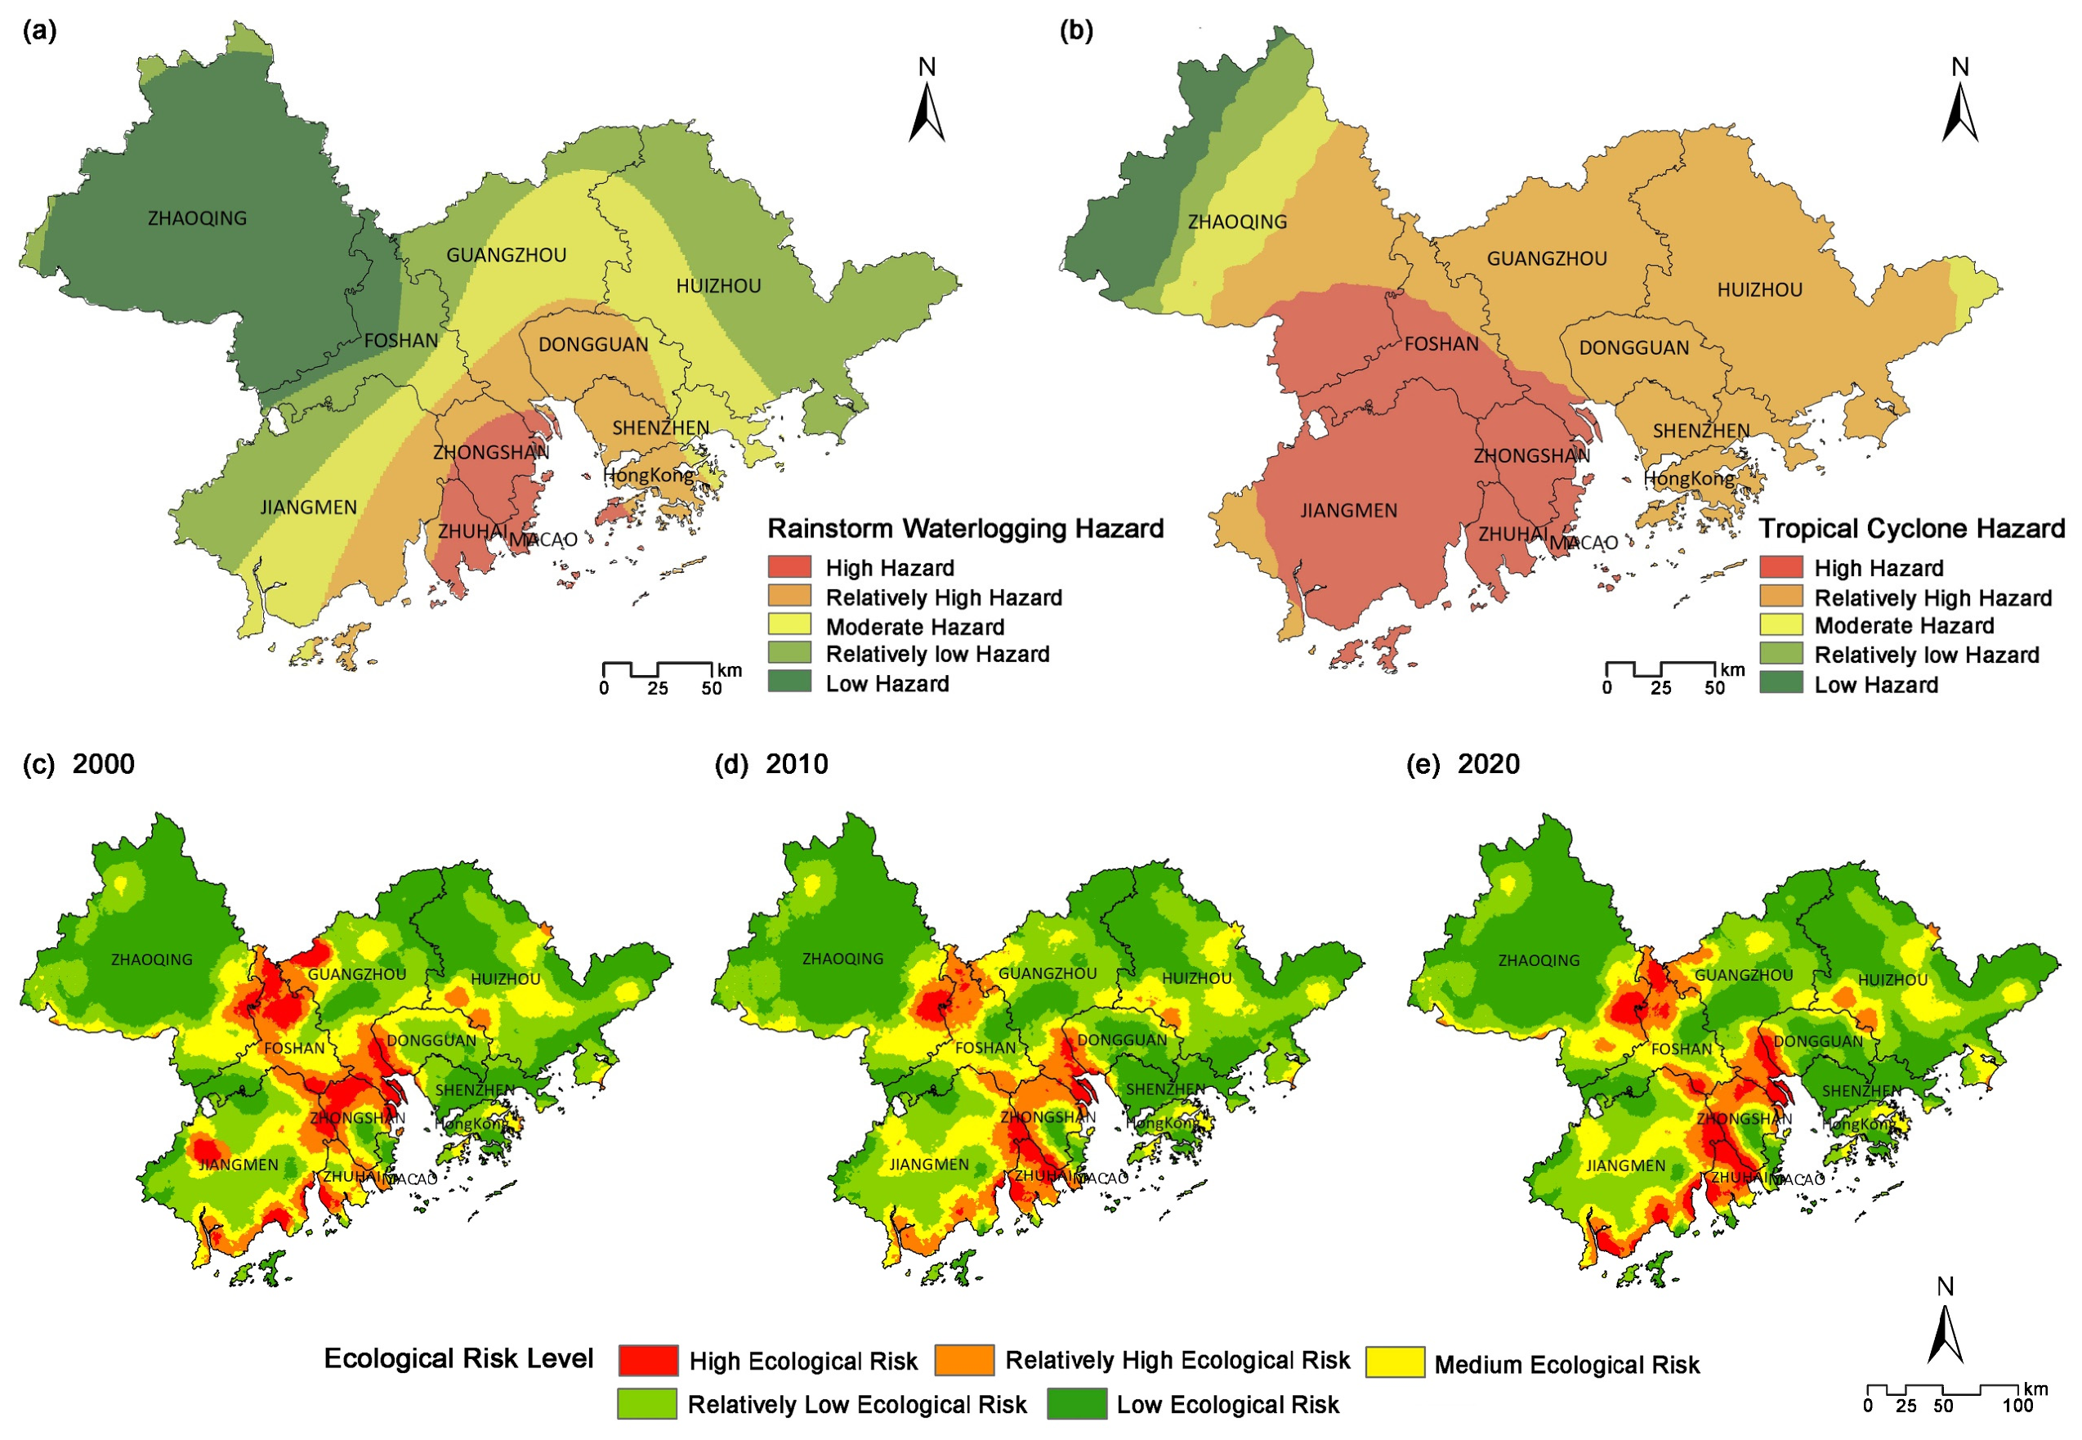
Rainstorm-induced flooding hazard showed a pronounced coastal concentration during 2000–2020. Macao recorded the highest frequency of rainstorm-induced flooding events (165), followed by Zhongshan (133), Zhuhai (125), and Shenzhen (105), whereas Zhaoqing, Foshan, and Huizhou recorded relatively low frequencies of 21, 43, and 60 events, respectively. Most events occurred from June to September. Spatially, hazard levels were generally higher in the central and southern coastal areas and decreased toward the northern and peripheral parts of the GBA, with prominent high-hazard areas concentrated around Macao, Zhuhai, and Zhongshan (Figure 2a).
Figure 2.
Spatial distributions of rainstorm-induced flooding hazard, tropical cyclone hazard, and human-induced landscape ecological risk from 2000 to 2020: (a) rainstorm-induced flooding hazard; (b) tropical cyclone hazard; (c–e) landscape ecological risk in 2000, 2010, and 2020, respectively.
Tropical cyclone hazard exhibited a broader and more continuous spatial distribution. During 2000–2020, an average of approximately 1.2 tropical cyclones per year affected the GBA, with most landfall events occurring from July to September. Hazard levels generally decreased from south to north, with the highest values concentrated along the southwestern coast, particularly in Jiangmen, Zhuhai, Zhongshan, southern Foshan, and southern Zhaoqing. Guangzhou, Shenzhen, Dongguan, Huizhou, and Hong Kong were also affected by relatively high tropical cyclone hazard (Figure 2b).
Human-induced landscape ecological risk showed clearer temporal variation. From 2000 to 2020, built-up land expanded continuously, whereas cropland, forestland, and unused land generally declined; the numbers of cropland and forest patches increased, indicating greater fragmentation. Very-low- and low-risk areas together accounted for more than 70% of the study area throughout the period. The regional mean ERI decreased slightly from 0.0296 in 2000 to 0.0289 in 2020, but local high-risk clusters became more pronounced. High values were concentrated mainly around the Pearl River Estuary and the southwestern coast, with further increases in parts of these areas during 2010–2020 (Figure 2c–e). Thus, rainstorm-induced flooding had relatively localized coastal hotspots, tropical cyclone hazard covered a broader southern zone, and landscape ecological risk varied with the spatial reorganization of land use.
3.2. Spatial Relationships Among Vulnerability, Ecological Asset Exposure, and Risk
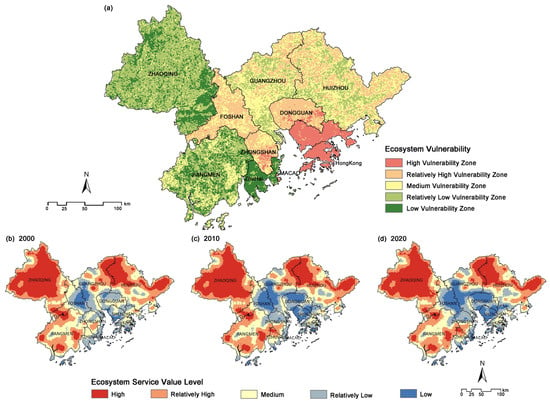
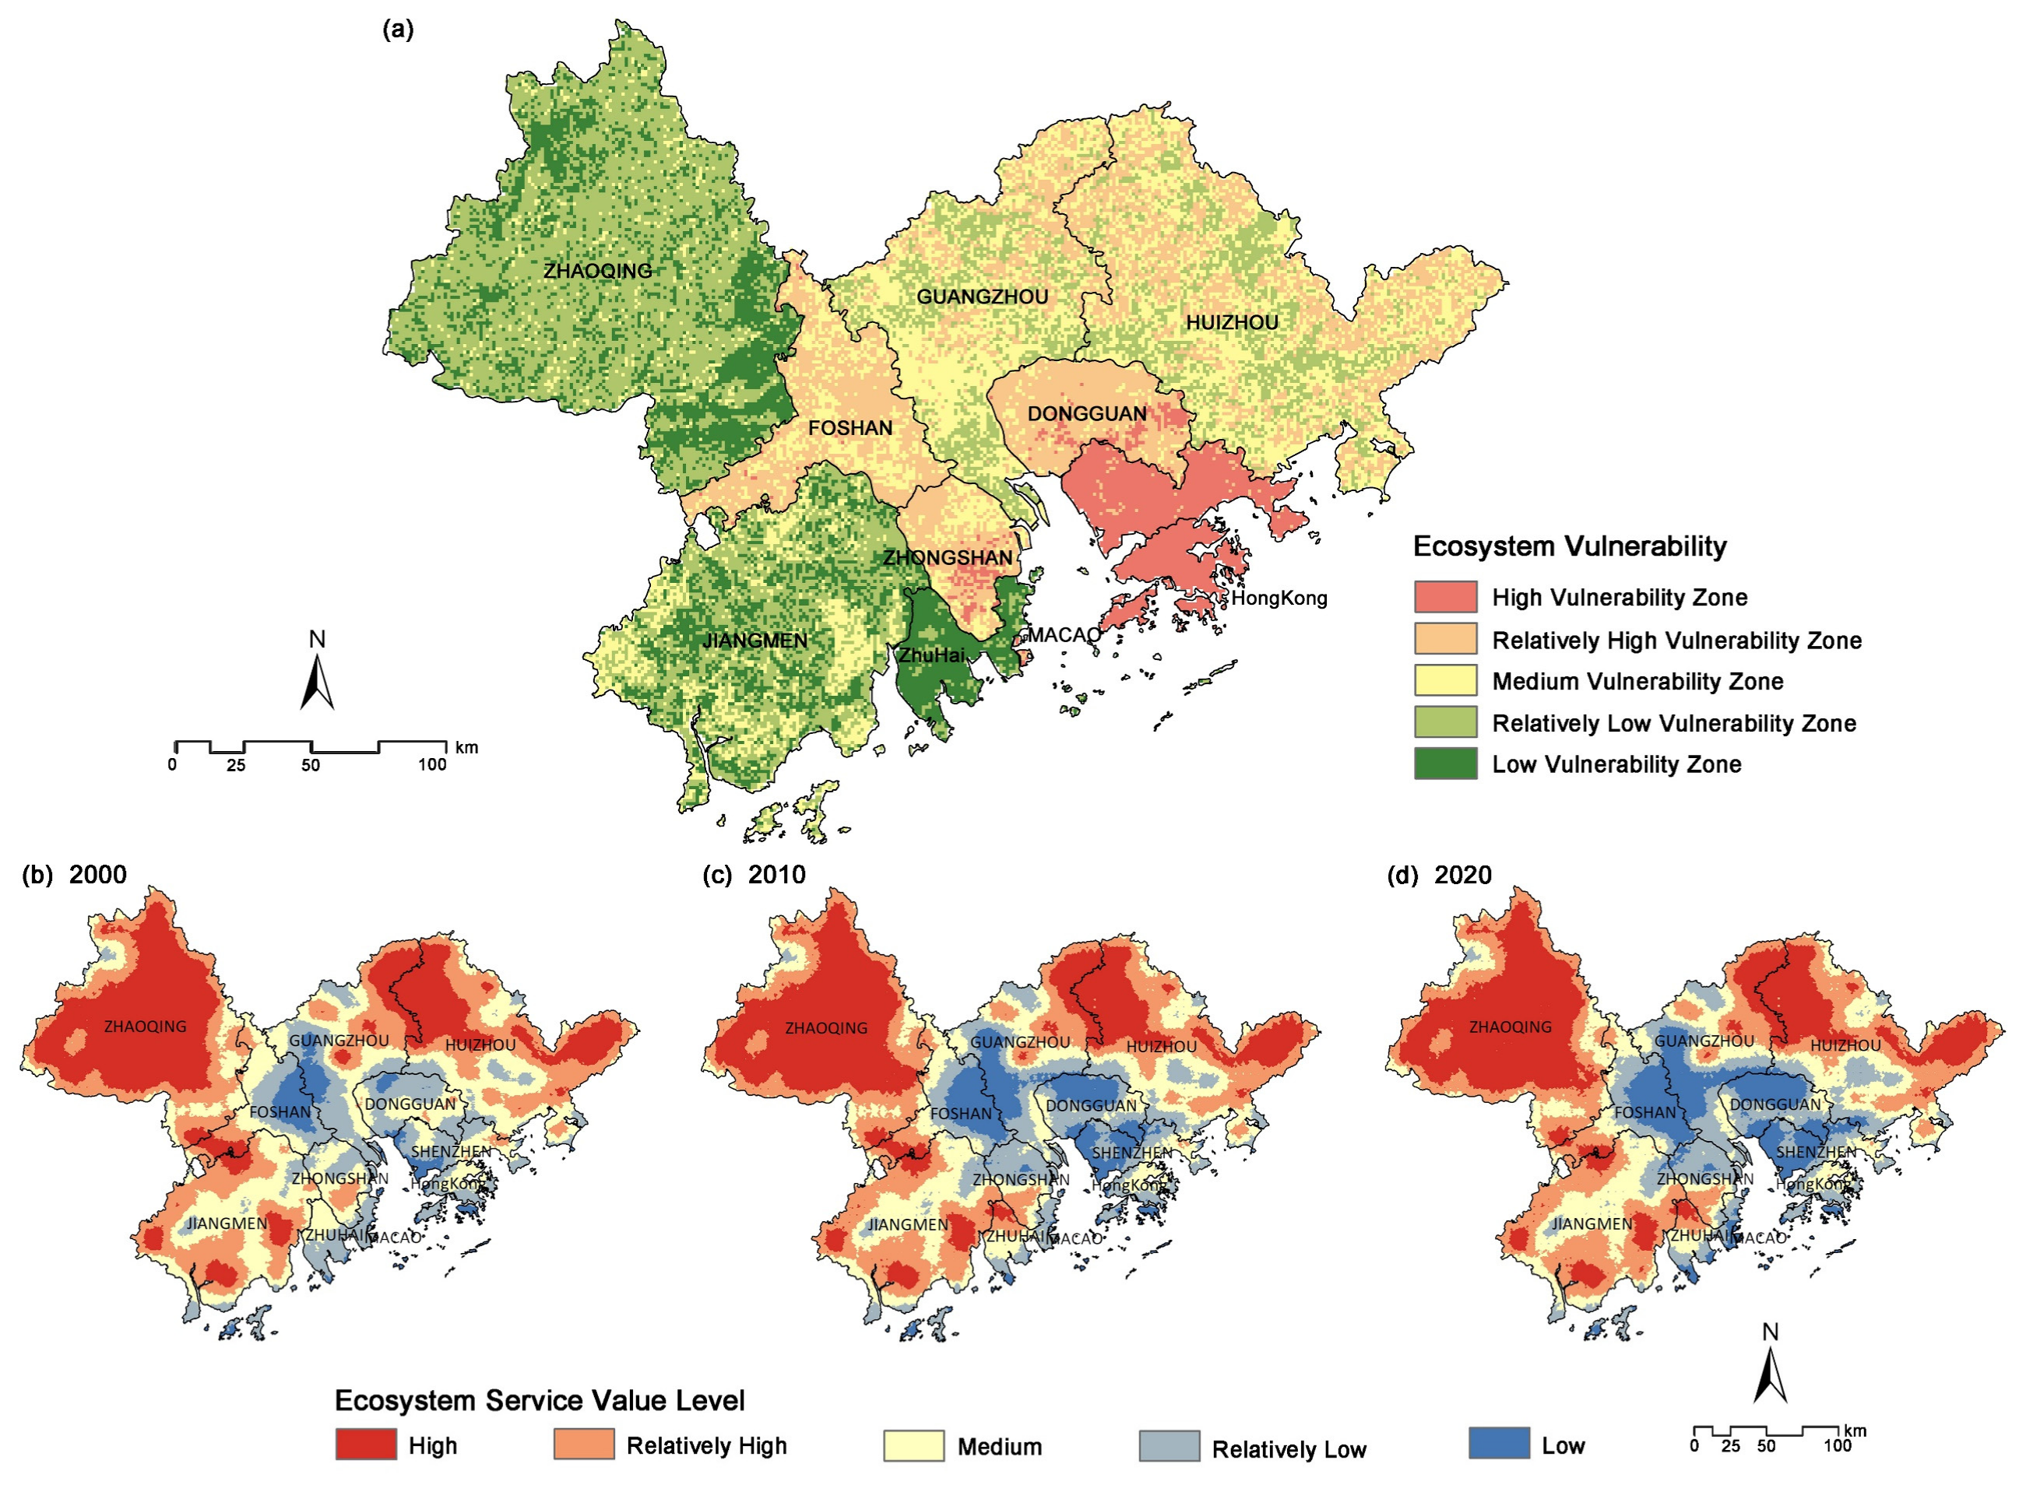
After ecological–environmental and socioeconomic components were integrated, low- and moderate-vulnerability classes dominated the GBA, while high-vulnerability areas occurred mainly in the central coastal and eastern parts of the region (Figure 3a). Total ESV decreased from CNY 279.121 billion in 2000 to CNY 270.367 billion in 2010 and CNY 262.718 billion in 2020, a cumulative decline of CNY 16.403 billion. Forestland consistently contributed more than 82% of total ESV. Regulating services constituted the largest service category and decreased from CNY 147.908 billion to CNY 133.148 billion. Spatially, ESV was higher in much of Zhaoqing, Huizhou, and Jiangmen and lower around the highly urbanized Pearl River Estuary (Figure 3b–d).
Figure 3.
Spatial distributions of integrated ecosystem vulnerability and ecosystem service value: (a) integrated ecosystem vulnerability; (b–d) ecosystem service value in 2000, 2010, and 2020, respectively.
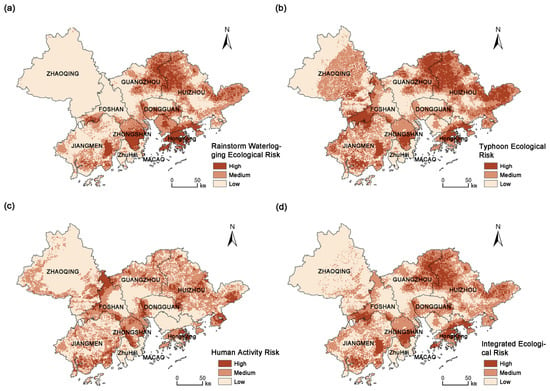
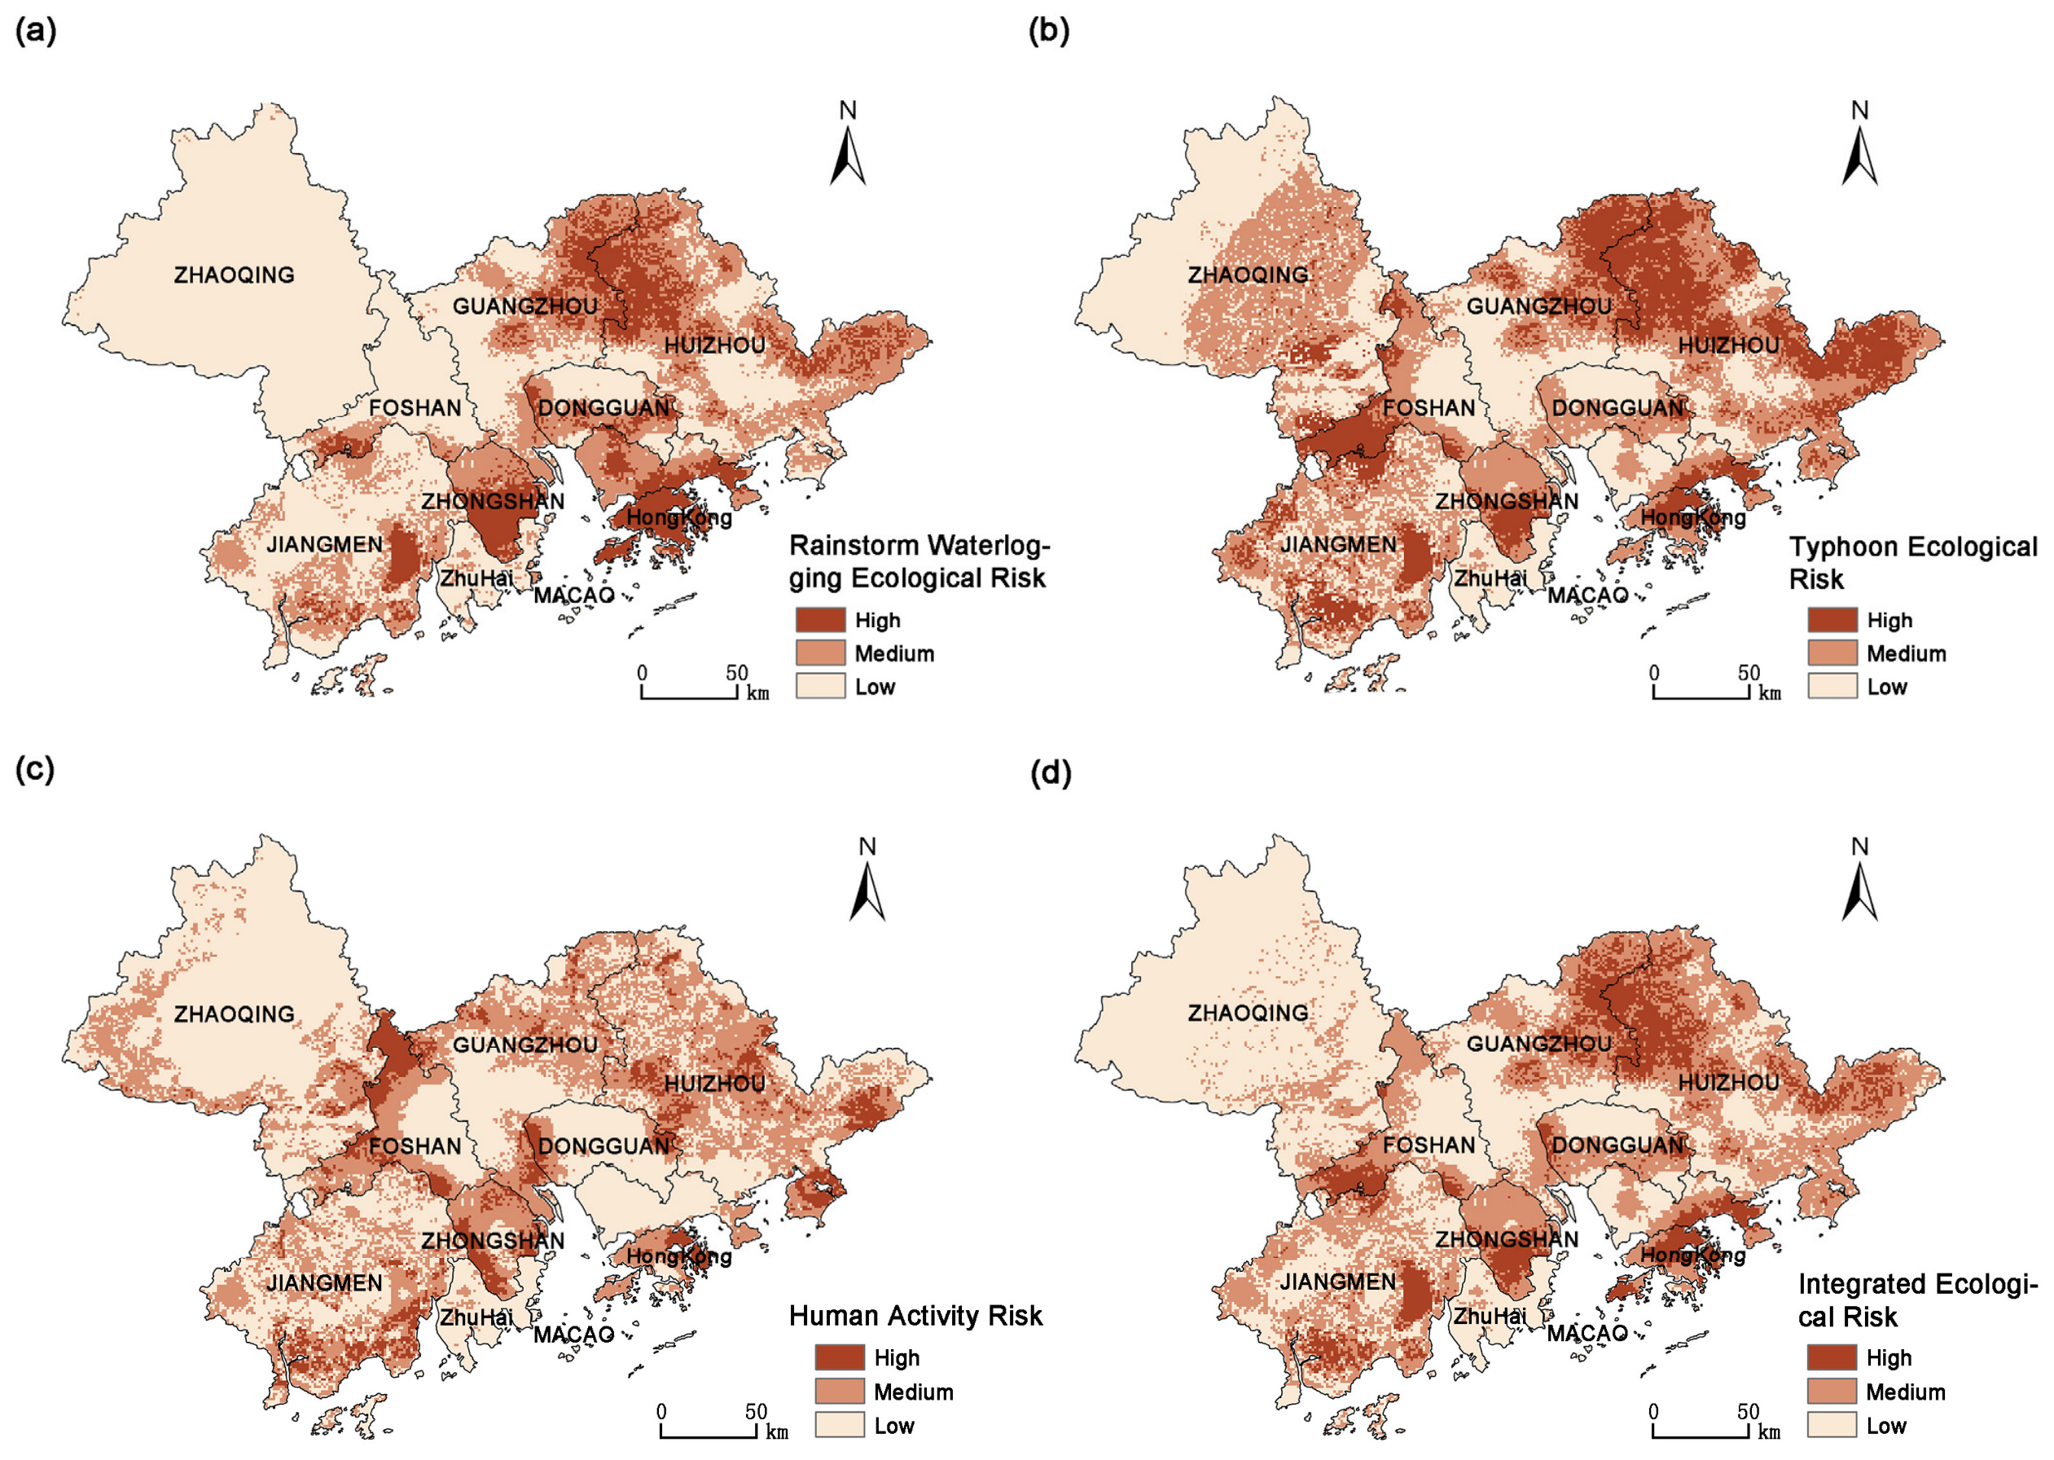
The single-source risk maps were not simple reproductions of their corresponding hazard maps. Rainstorm-induced flooding risk was high in parts of the central coastal zone and also in portions of the northeast where flooding hazard itself was not at its maximum (Figure 4a). Tropical cyclone risk had a broadly similar distribution but formed a more continuous high-risk belt because cyclone hazard extended across a wider area (Figure 4b). These differences reflect the additional contribution of vulnerability and ecological asset exposure to the risk calculation.
Figure 4.
Spatial distributions of rainstorm-induced flooding risk, tropical cyclone risk, human-induced ecological risk, and integrated ecological risk: (a) rainstorm-induced flooding risk; (b) tropical cyclone risk; (c) human-induced ecological risk; and (d) integrated ecological risk.
Human-induced ecological risk displayed another spatial pattern. Several areas around the Pearl River Estuary had strong human-induced disturbance but did not fall within the highest final-risk class, whereas higher risk also occurred in portions of the eastern and western GBA where disturbance was less intense (Figure 4c). Taken together, Figure 4a–c shows that the spatial distributions of vulnerability and ecological asset exposure altered the translation of each hazard component into final ecological risk.
3.3. Integrated Ecological Risk and H–V–E Risk-Formation Types
After the three hazard components were integrated with ecosystem vulnerability and ecological asset exposure, moderate-to-high ecological risk accounted for 47.5% of the study area. Risk was generally higher in the south than in the north and was also elevated in parts of the eastern and western GBA relative to the central region (Figure 4d). High-risk areas in the southern coastal zone coincided mainly with relatively high hazard and vulnerability, whereas some eastern and western areas combined elevated risk with high ecological asset exposure. Much of northwestern Zhaoqing remained in the low-risk class.
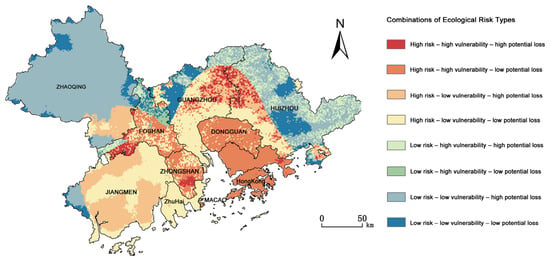
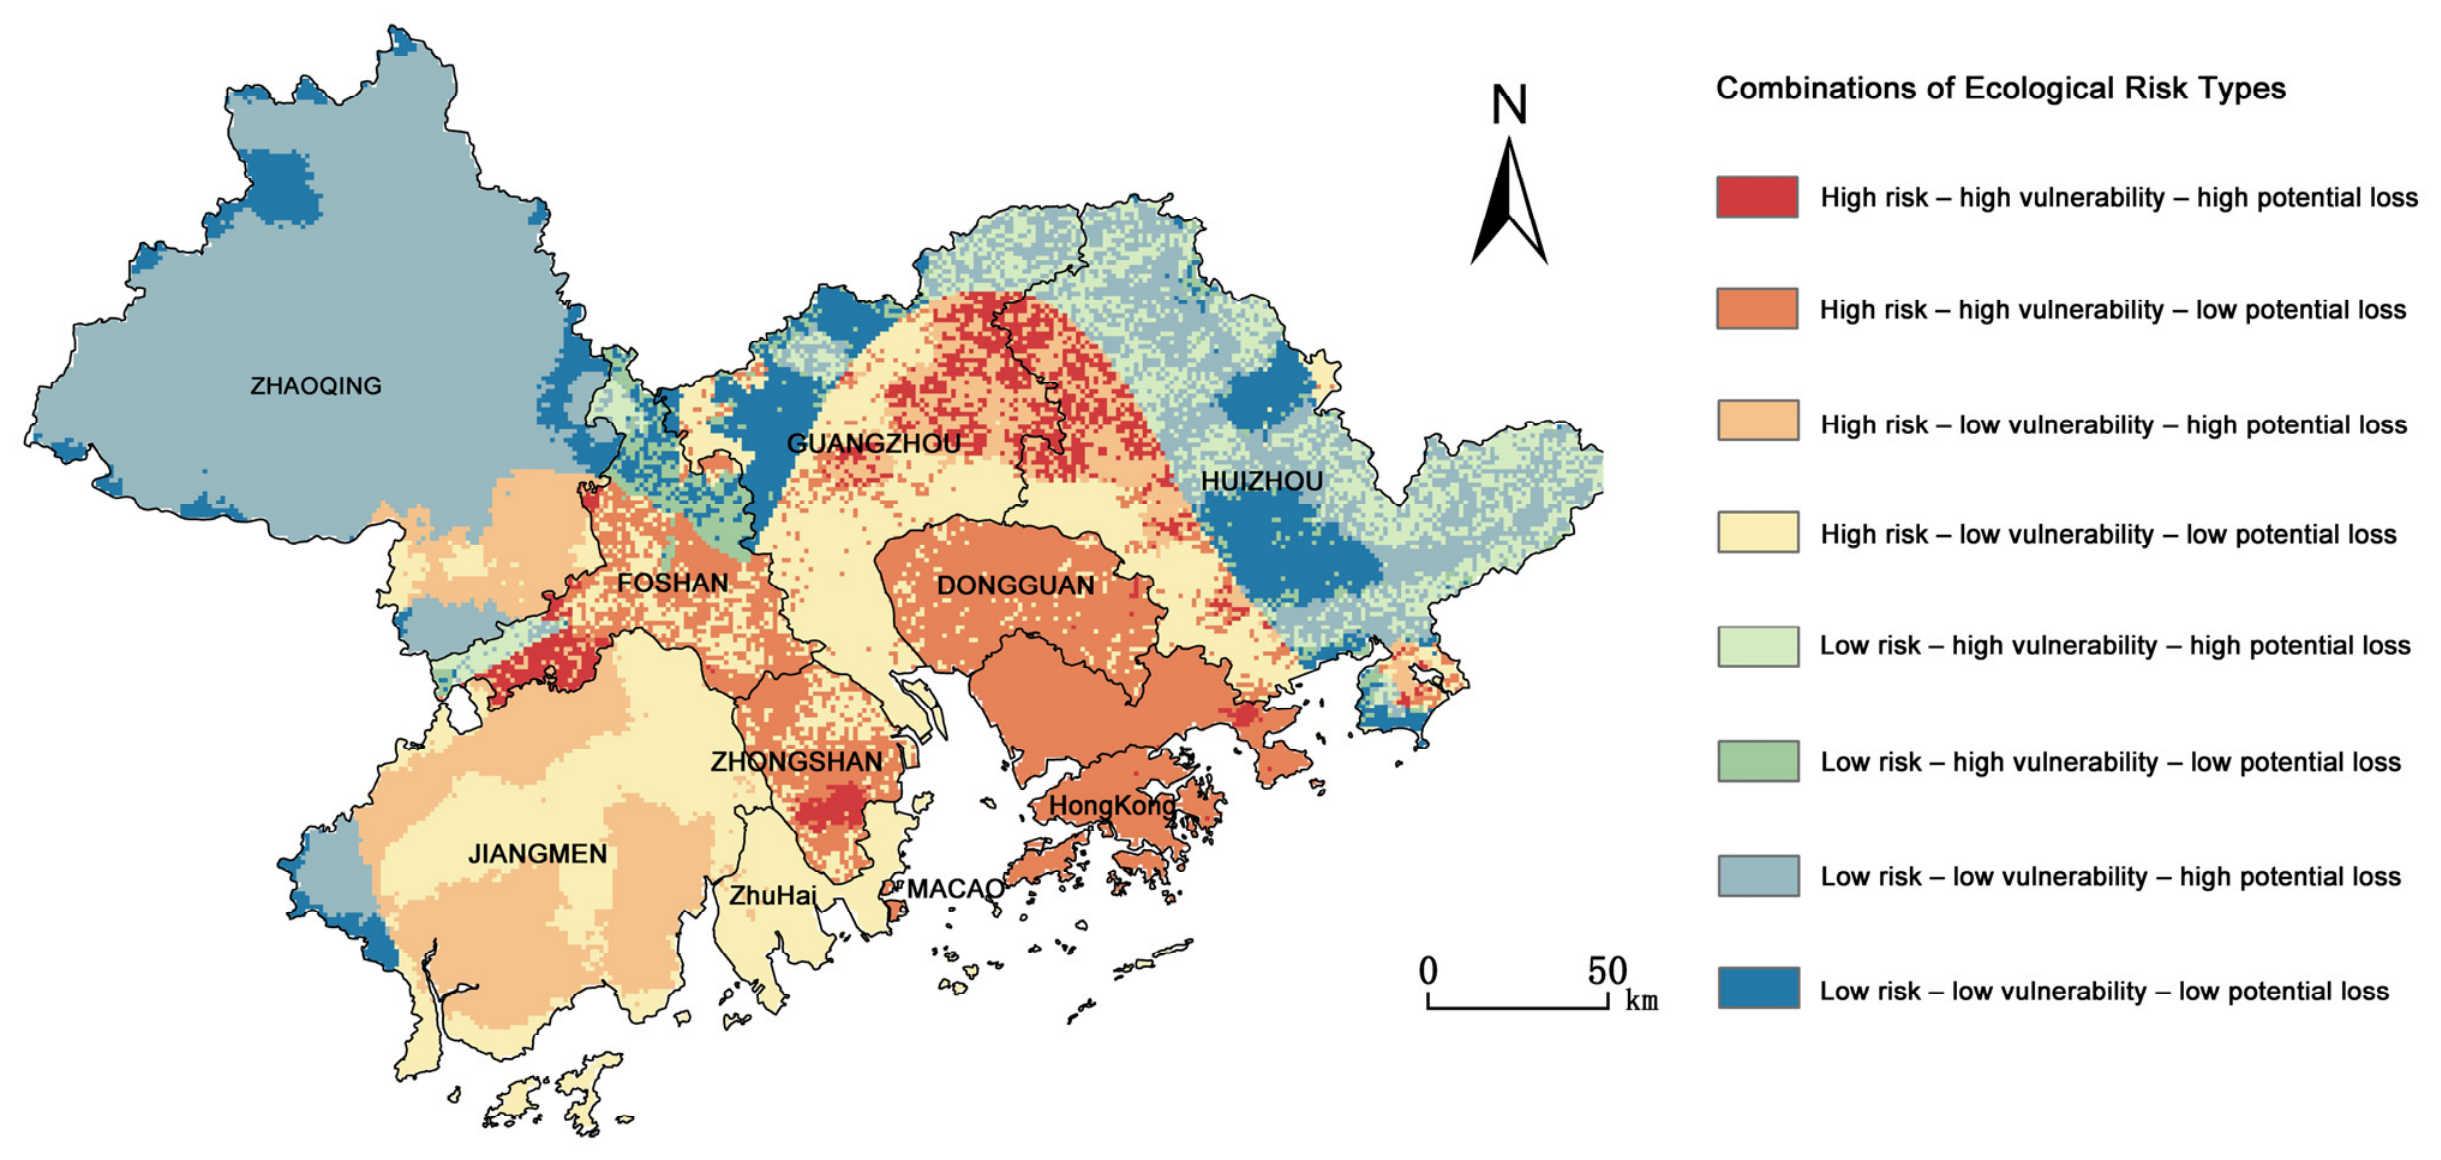
Classification of hazard (H), vulnerability (V), and ecological asset exposure (E) into high and low states produced eight risk-formation types (Figure 5 and Table 3). The low H–low V–high E type occupied the largest area (30.37%) and occurred mainly in Zhaoqing, Huizhou, and northeastern Jiangmen. The high H–high V–low E type was concentrated in Hong Kong, Shenzhen, Dongguan, Zhongshan, and Foshan, while the high H–low V–high E type occurred mainly in Jiangmen and southern Zhaoqing.
Figure 5.
Spatial distribution of hazard–vulnerability–ecological asset exposure (H–V–E) risk-formation types.
Table 3.
H–V–E risk-formation types and their main spatial characteristics.
The high H–high V–high E type occurred mainly in eastern Guangzhou, northwestern Huizhou, and eastern Foshan. The low H–high V–high E type was found mainly in parts of Huizhou and northern Guangzhou. The remaining configurations were more dispersed, as summarized in Table 3. Overall, the eight combinations show that the same broad risk class may be associated with different configurations of hazard, vulnerability, and ecological asset exposure.
4. Discussion
4.1. Contrasting Spatial Patterns and Processes of Natural Hazards and Land-Use Disturbance in Agricultural–Ecological Landscapes
Rainstorm-induced flooding, tropical cyclones, and landscape ecological risk all exhibited some degree of concentration toward the coastal parts of the GBA, but their spatial extents and modes of influence differed substantially. The concentration of population and economic activities in coastal areas creates a strong spatial overlap between hydrometeorological-hazard exposure and intensive urbanization [43]. Meanwhile, urban expansion in the GBA has converted cropland, forestland, and water bodies and reorganized agricultural and ecological landscapes [5,24,36]. Previous studies have similarly identified concentrations of ecological risk associated with tropical cyclones and rainstorm-induced flooding along the coasts of Guangdong and the Pearl River Delta [21,22,23]. The present results are broadly consistent with these regional assessments but reveal an important distinction: the localized rainstorm-induced flooding pattern, the broader tropical cyclone hazard zone, and the changing landscape ecological risk surface represent different forms of pressure and should not be interpreted as equivalent expressions of a single coastal gradient.
These pressures also operate over different temporal and spatial processes. The rainstorm-induced flooding index represents the frequency and intensity of heavy-rainfall events and consequently produces relatively localized hotspots. The tropical cyclone index characterizes repeated exposure to reconstructed wind fields and therefore forms a broader and more spatially continuous hazard pattern [21,22]. Landscape ecological risk, by contrast, reflects the cumulative effects of land-use composition and configuration, including the conversion of cropland and other ecological land, landscape fragmentation, and spatial reorganization [7]. Land conversion and habitat fragmentation can progressively alter ecosystem structure, landscape connectivity, and ecological functions [44,45], while regional studies identify land-use change and human activity as major drivers of the spatiotemporal heterogeneity of landscape ecological risk [37,46]. Retaining both episodic natural hazards and persistent land-use disturbance in the assessment therefore provides complementary information, although their mechanisms and management implications need to be interpreted separately.
The mean ERI decreased slightly from 0.0296 in 2000 to 0.0289 in 2020, but local high-risk clusters and spatial differentiation became more pronounced. The small change in the regional mean should therefore not be interpreted as a spatially uniform reduction in landscape pressure. Similar patterns have been reported where regional averages obscure localized fragmentation or risk concentration arising from heterogeneous land-use transitions [37,47]. Cropland fragmentation in China is also spatially uneven and is closely associated with cropland conversion and impervious-surface expansion [7]. In the GBA, urban growth has occupied cropland and other ecological land, while its effects on ecosystem services vary among locations and stages of urban development [36,48]. Studies of cropland stability and cultivated-land resilience further demonstrate that agricultural land systems respond differently across Guangdong [31,49,50]. For agricultural landscape management, these findings highlight the need to consider both natural-hazard exposure and the localized effects of cropland conversion, fragmentation, and declining landscape connectivity. Their agricultural implications are further examined through the cropland overlay analysis in Section 4.4.
4.2. Vulnerability and Ecological Assets Jointly Shape Risk Translation in Agricultural–Ecological Spaces
The results show that final ecological risk is not a direct spatial reflection of hazard intensity. This distinction is important for agricultural landscapes because similar levels of rainstorm-induced flooding, tropical cyclone hazard, or land-use disturbance may occur under different combinations of terrain, ecological sensitivity, socioeconomic exposure, and response capacity. These conditions influence the stability and management requirements of cropland and its surrounding ecological spaces. Vulnerability theory emphasizes the joint roles of sensitivity, exposure, and response or recovery capacity [11,12], while regional studies have shown that land-use configuration and recovery capacity affect ecosystem responses to disturbance [51,52,53]. In the GBA, relatively high integrated vulnerability was concentrated in the central–southern coastal zone and parts of the east. Because the index combines ecological–environmental and socioeconomic dimensions, this pattern reflects the combined contribution of several conditions relevant to agricultural landscape resilience rather than a single causal factor.
The geographical setting provides further context for interpreting these spatial patterns. The Pearl River Delta is characterized by low-lying terrain and a dense river network, where flooding is influenced by both river inflows and coastal water levels. Modeling studies have shown substantial spatial variation in the individual and combined effects of typhoon intensity, sea level, and upstream discharge on flooding in the delta [19]. Connectivity between the estuary and inland river networks allows coastal hydrodynamic influences to extend beyond the immediate coastline. A study of Typhoon Hato further demonstrated nonlinear interactions among tides, river discharge, and storm surge, with effects varying among river reaches [20]. These findings highlight the need to consider topography, river-network position, and estuarine connectivity when interpreting vulnerability and risk patterns. However, these hydrodynamic processes were not explicitly simulated in this study; they provide geographical context rather than evidence of their specific contributions to the calculated risk scores.
ESV exhibited a different, broadly peripheral-high and core-low pattern. Higher values occurred in much of Zhaoqing, Huizhou, and Jiangmen, where relatively extensive forestland, cropland, and water bodies are retained, whereas the highly urbanized Pearl River Estuary generally had lower values. Food provision, soil retention, hydrological regulation, and habitat maintenance in these peripheral areas form part of the ecological foundation supporting regional agricultural systems. The spatial pattern is consistent with reported mismatches between urban development and ecosystem-service provision in the Pearl River Delta and the wider GBA [28,30,36]. Urban expansion may also occupy land with relatively high ecosystem-service values, although its effects differ among locations and development stages [29,54].
The different spatial distributions of vulnerability and ESV explain why the single-source risk maps depart from their corresponding hazard maps. In the central coastal zone, high rainstorm-induced flooding hazard frequently coincided with high vulnerability, indicating that disaster-prevention and response capacity deserve particular attention where these areas overlap with cultivated land. In parts of the northeastern GBA, ecological risk remained elevated even where hazard was not highest because vulnerability and ecological asset exposure contributed to the final risk score. Conversely, several highly urbanized locations with strong landscape disturbance did not reach the highest final-risk class because ESV was relatively low. Similar interactions among hazard, vulnerability, and ecosystem value have been identified in multi-hazard assessments of Guangdong and the Pearl River Delta [21,23].
For agricultural land-resource management, the results indicate complementary priorities: reducing hazard and vulnerability where they coincide with cultivated land, protecting high-value ecological assets, and limiting cropland conversion and fragmentation. This interpretation is consistent with regional risk approaches based on ecosystem services or potential ecosystem-service losses [14,15,23]. Given the spatial variation in cropland stability and resilience across Guangdong [31,32], these priorities are further examined using the cropland overlay results in Section 4.4.
4.3. Differentiated Risk-Formation Pathways Revealed by H–V–E Configurations
An important issue in regional ecological risk assessment is that similar levels of integrated risk may arise from different combinations of risk-forming conditions. Existing relative risk models and regional ecological risk frameworks emphasize the joint effects of risk sources, receptor vulnerability, and ecological endpoints or exposed assets, rather than attributing final risk to a single pressure [55,56,57]. The H–V–E configurations identified in this study further indicate that relatively high ecological risk in the GBA is associated with at least two typical structures. One occurs mainly in highly urbanized coastal areas, where high hazard coincides with high vulnerability; the other is found in some peripheral agricultural–ecological spaces, where relatively high hazard coincides with high ecological asset exposure.
The low H–low V–high E type occupied the largest proportion of the study area, indicating extensive areas where high ecological asset exposure coincided with relatively low hazard and low vulnerability. However, these areas contain substantial forestland, cropland, and water bodies, and increases in future land-use disturbance, natural-hazard pressure, or system vulnerability could substantially increase risk because of their high ecological asset exposure. The H–V–E classification thus complements integrated risk levels by distinguishing component configurations relevant to management priorities. Recent studies of ecological restoration and ecological networks in the Pearl River Delta and the GBA similarly demonstrate that spatial differences in landscape structure, ecological connectivity, and system resilience can substantially influence ecological risk and ecosystem responses to disturbance [52,53].
4.4. Implications for Agricultural Land and Ecological-Space Management
The H–V–E configurations can support a staged regional screening strategy. In high H–high V areas, especially along the urbanized coast, priorities include drainage improvement, maintenance of flood-control facilities, emergency preparedness, and measures that reduce exposure and improve response capacity. In high H–low V–high E areas, planning should avoid additional conversion and fragmentation of high-value ecological land. Low H–low V–high E areas require preventive land-use control and maintenance of landscape connectivity rather than intensive engineering solely on the basis of their high ESV. High H–high V–high E areas warrant coordinated attention to all three components.
The spatial overlay of 2020 cropland provides quantitative support for these management priorities. Areas with both high H and high V contained 1060 km2 of cropland, accounting for 8.81% of total regional cropland. High integrated ecological risk areas contained 529 km2 of cropland, representing 7.94% of the high-risk area (Appendix A, Table A3). Within the area covered by the integrated risk classification, 63.33% of assessed cropland occurred in low-risk areas, 32.27% in medium-risk areas, and 4.40% in high-risk areas (Appendix A, Table A4). Across the eight H–V–E configurations, the largest share of classified cropland occurred in the low H–high V–low E type (36.20%), followed by the low H–low V–high E type (21.08%) (Appendix A, Table A5). Under the H–V–E classification in Figure 5, 5245 km2, or 17.94% of the high-E area, overlapped with high-H zones (Table A3). These distributions suggest that agricultural-management priorities extend beyond high-risk hotspots to include vulnerability reduction and preventive ecological asset protection.
Municipal comparisons further distinguish the absolute extent of cropland exposure from its relative concentration. Foshan had the largest cropland area within high-H zones (513 km2), whereas Shenzhen had the highest exposure proportion among the nine mainland cities of the GBA (97.9%). Dongguan also showed a high proportion (70.91%), corresponding to 181 km2 (Appendix A, Table A6). These differences highlight the importance of considering both exposed cropland area and its proportion of local cropland when identifying management priorities. Because H includes both natural hazards and human-induced landscape disturbance, these statistics describe spatial exposure to combined pressures rather than observed agricultural losses.
For site-specific agricultural application, the cropland overlay should be supplemented with information on permanent basic farmland, irrigation and drainage networks, and local cropping systems. Management can then be tailored more specifically—for example, drainage and access resilience in flood-prone cultivated areas, control of parcel and habitat fragmentation where landscape disturbance is high, or protection of riparian, forest, and wetland elements that support runoff regulation and landscape connectivity. Natural and semi-natural ecosystems can buffer flooding and coastal hazards and maintain ecological functions relevant to production [53,58,59]. Management should also consider adapting land use to local geographical constraints rather than relying solely on engineering measures to reduce vulnerability. Avoiding additional exposure in hazard-prone areas, retaining flood-storage spaces, and directing suitable new development toward lower-risk locations may complement infrastructure improvements. The choice between engineering protection and land-use adaptation should account for local agricultural needs, ecological impacts, feasibility, and costs; the present assessment does not establish which option is more cost-effective [60]. The effectiveness of any particular intervention was not tested in this study and should be evaluated locally.
This interpretation complements recent moves in the Pearl River Delta and GBA toward ecological-security patterns, ecosystem-service supply–demand analysis, ecological-network resilience, and differentiated zoning [29,30,46]. Compared with zoning based only on integrated risk magnitude, H–V–E configurations indicate whether attention should initially focus on external pressure, vulnerability, ecological asset exposure, or their combination. Transfer to other regions should retain this diagnostic logic but recalibrate indicators, weights, thresholds, and management overlays to local hazard regimes, agricultural land systems, and data availability.
4.5. Limitations and Scope of Agricultural Interpretation
Several uncertainties affect the results. First, the weights assigned to hazard, vulnerability, and their component indicators were specified with reference to previous studies and regional judgment and therefore remain partly subjective. Sensitivity analysis using seven alternative weighting schemes yielded high Spearman’s correlations and risk-class agreement of 90.339–99.997% relative to the baseline (Table A1). These results indicate that the overall integrated risk pattern remained largely stable under the tested schemes, although local high-risk areas showed some changes. The H–V–E configurations were sensitive to the high–low thresholds. When the high state was expanded from Levels 4–5 to Levels 3–5 for all three components, spatial agreement with the baseline decreased to 46.07%. The proportions, spatial distributions, and management implications of these configurations should therefore be interpreted in relation to the adopted classification criteria. Management priorities should consider both integrated risk levels and continuous component values, rather than rely solely on high–low configuration labels.
Second, spatial interpolation, aggregation, and the assignment of city-level indicators to grids may obscure local variation. The differing temporal coverage of historical hazards and study-period-end conditions also introduces uncertainty. The integrated map should therefore be interpreted as a regional risk assessment around 2020, not a time series of risk changes.
Third, the assessment includes three representative risk sources. It does not explicitly simulate compound or cascading interactions among tropical cyclones, extreme rainfall, river flooding, and storm surge. The results describe the joint spatial assessment of multiple sources and persistent landscape disturbance, rather than compound-event probabilities or process-based damage. Future work could incorporate temporal co-occurrence and physical interactions among hazards.
Finally, the regionally adjusted equivalent-factor method provides a consistent measure of relative ESV, but its monetary estimates remain sensitive to parameters, scale, and benefit-transfer assumptions and do not fully represent service supply–demand relationships, non-market values, or ecological processes [15,41,61]. ESV is therefore interpreted only as a proxy for ecological assets potentially exposed to loss. The agricultural implications are correspondingly limited to landscape-scale protection of cultivated land and supporting ecological spaces. Crop-yield loss, farm-level economic damage, food-security effects, and the performance of specific management measures were not assessed. Addressing those questions would require finer temporal data, crop and household observations, infrastructure information, and process-based ecosystem-service or damage models.
5. Conclusions
This study applied a hazard–vulnerability–ecological asset exposure (H–V–E) framework to integrate rainstorm-induced flooding, tropical cyclones, and human-induced landscape disturbance, and to identify integrated ecological risk and risk-formation types across agricultural–ecological spaces in the GBA. Rainstorm-induced flooding formed localized hotspots along the central coast and western Pearl River Estuary, whereas tropical cyclone hazard showed a broader southern concentration. Mean landscape ecological risk changed little, but local high-risk clusters became more pronounced. Vulnerability and ecological asset exposure caused final risk patterns to differ from hazard patterns. ESV declined from CNY 279.121 billion in 2000 to CNY 262.718 billion in 2020, and moderate-to-high integrated ecological risk covered 47.5% of the study area. Elevated risk resulted from high hazard–high vulnerability along the coast and high ecological asset exposure in parts of the eastern and western GBA. Eight H–V–E risk-formation types were identified, with the low H–low V–high E type accounting for the largest share (30.37%). These types support differentiated priorities for disaster preparedness and drainage, fragmentation control, and ecological-asset protection. They provide a regional basis for managing cropland and adjoining ecological spaces. Overall, the H–V–E risk-formation approach improves the interpretability of regional ecological risk assessment for agricultural landscape protection and spatially differentiated land management.
Author Contributions
M.L.: Methodology, Software, Formal Analysis, Writing—Original Draft Preparation; X.H.: Methodology, Data Curation, Formal Analysis, Writing—Review and Editing; T.Y.: Data Curation, Visualization; J.D.: Investigation, Visualization; Y.C.: Investigation, Data Curation; T.L.: Software, Validation; Y.H.: Software, Validation; Y.X.: Data Curation; W.Z.: Conceptualization, Methodology, Resources, Writing—Review and Editing; H.L.: Conceptualization, Writing—Review and Editing, Supervision. All authors have read and agreed to the published version of the manuscript.
Funding
This study is supported by the Guangdong Provincial Funding Program for High-Level Young Talents (2025QN12N156), the Science and Technology Planning Project of Guangdong Province (No. 2025B121207002), the GDAS Project of Science and Technology Development (2024GDASZH-2024010101; 2022GDASZH-2022020402-3), the 2023 Guangzhou Philosophy and Social Science Planning Project (2023GZGJ294), the National Natural Science Foundation of China (52478053), the Guangdong Basic and Applied Basic Research Foundation (2024A1515010783).
Data Availability Statement
The data used in this study were obtained from publicly available datasets and official statistical and meteorological sources, as described in the Section 2.2. Land-use data for 2000, 2010, and 2020 were obtained from the China Multi-Period Land Use Remote Sensing Monitoring Dataset (CNLUCC) [35], and both the land-use and topographic datasets were provided by the Data Center for Resources and Environmental Sciences, Chinese Academy of Sciences (RESDC). Meteorological and tropical cyclone data were provided by the Guangdong Meteorological Bureau, while socioeconomic data were compiled from provincial and municipal statistical yearbooks and other official statistical sources.
Acknowledgments
During the preparation of this manuscript, the authors used ChatGPT (GPT-5.6 Sol, OpenAI)for language editing and improvement of manuscript clarity. The authors reviewed and edited the output and take full responsibility for the content of this publication.
Conflicts of Interest
The authors declare no conflicts of interest.
Abbreviations
The following abbreviations are used in this manuscript:
| GBA | Guangdong–Hong Kong–Macao Greater Bay Area |
| H–V–E | Hazard–Vulnerability–Ecological Asset Exposure |
| ESV | Ecosystem Service Value |
| ERI | Landscape Ecological Risk Index |
| DEM | Digital Elevation Model |
| TC | Tropical Cyclone |
Appendix A
Table A1.
Sensitivity of integrated ecological risk to alternative weighting schemes.
Table A2.
Adjusted ecosystem-service value coefficients for the Guangdong–Hong Kong–Macao Greater Bay Area (CNY ha−1).
Table A3.
Spatial overlap statistics for cropland, ecological assets, and risk zones in 2020.
Table A4.
Cropland distribution across integrated ecological risk classes in 2020.
Table A5.
Cropland distribution across H–V–E configurations in 2020.
Table A6.
Cropland within high-H zones by municipality in 2020.
References
- Alarcon-Segura, V.; Grass, I.; Feuerbacher, A.; Gonzales-Chavez, A.; Mupepele, A.-C. Semi-natural habitats and their contribution to crop productivity through pollination and pest control: A systematic review. Landsc. Ecol. 2025, 40, 137. [Google Scholar] [CrossRef] [Scilit]
- Han, J.; Zhang, Z.; Xu, J.; Chen, Y.; Jägermeyr, J.; Cao, J.; Luo, Y.; Cheng, F.; Zhuang, H.; Wu, H.; et al. Threat of low-frequency high-intensity floods to global cropland and crop yields. Nat. Sustain. 2024, 7, 994–1006. [Google Scholar] [CrossRef] [Scilit]
- Feehan, C.J.; Filbee-Dexter, K.; Thomsen, M.S.; Wernberg, T.; Miles, T. Ecosystem damage by increasing tropical cyclones. Commun. Earth Environ. 2024, 5, 674. [Google Scholar] [CrossRef] [Scilit]
- Bundy, L.R.; Gensini, V.A.; Van Den Broeke, M.S. Tropical cyclone impacts on crop condition ratings and yield in the coastal Southern United States. Agric. For. Meteorol. 2023, 340, 109599. [Google Scholar] [CrossRef] [Scilit]
- Wang, X.; Yan, F.; Su, F. Impacts of urbanization on the ecosystem services in the Guangdong-Hong Kong-Macao Greater Bay Area, China. Remote Sens. 2020, 12, 3269. [Google Scholar] [CrossRef] [Scilit]
- Wang, X.; Yan, F.; Zeng, Y.; Chen, M.; He, B.; Kang, L.; Su, F. Ecosystem services changes on farmland in response to urbanization in the Guangdong–Hong Kong–Macao Greater Bay Area of China. Land 2021, 10, 501. [Google Scholar] [CrossRef] [Scilit]
- Zhao, N.; Chen, K.; Wu, X.; Zhang, L.; Wang, W. Cropland fragmentation change across China over the last two decades. Agric. Syst. 2024, 218, 104010. [Google Scholar] [CrossRef] [Scilit]
- Ye, S.; Ren, S.; Song, C.; Du, Z.; Wang, K.; Du, B.; Cheng, F.; Zhu, D. Spatial pattern of cultivated land fragmentation in mainland China: Characteristics, dominant factors, and countermeasures. Land Use Policy 2024, 139, 107070. [Google Scholar] [CrossRef] [Scilit]
- Peng, Y.; Welden, N.; Renaud, F.G. A framework for integrating ecosystem services indicators into vulnerability and risk assessments of deltaic social-ecological systems. J. Environ. Manag. 2023, 326, 116682. [Google Scholar] [CrossRef] [Scilit]
- Tanim, A.H.; Goharian, E.; Moradkhani, H. Integrated socio-environmental vulnerability assessment of coastal hazards using data-driven and multi-criteria analysis approaches. Sci. Rep. 2022, 12, 11625. [Google Scholar] [CrossRef] [Scilit]
- Turner, B.L., II; Kasperson, R.E.; Matson, P.A.; McCarthy, J.J.; Corell, R.W.; Christensen, L.; Eckley, N.; Kasperson, J.X.; Luers, A.; Martello, M.L.; et al. A framework for vulnerability analysis in sustainability science. Proc. Natl. Acad. Sci. USA 2003, 100, 8074–8079. [Google Scholar] [CrossRef] [Scilit]
- Adger, W.N. Vulnerability. Glob. Environ. Change 2006, 16, 268–281. [Google Scholar] [CrossRef] [Scilit]
- Qian, Y.; Dong, Z.; Yan, Y.; Tang, L. Ecological risk assessment models for simulating impacts of land use and landscape pattern on ecosystem services. Sci. Total Environ. 2022, 833, 155218. [Google Scholar] [CrossRef] [Scilit]
- Gong, J.; Cao, E.; Xie, Y.; Xu, C.; Li, H.; Yan, L. Integrating ecosystem services and landscape ecological risk into adaptive management: Insights from a western mountain-basin area, China. J. Environ. Manag. 2021, 281, 111817. [Google Scholar] [CrossRef] [Scilit]
- Liang, Y.; Song, W. Integrating potential ecosystem services losses into ecological risk assessment of land use changes: A case study on the Qinghai-Tibet Plateau. J. Environ. Manag. 2022, 318, 115607. [Google Scholar] [CrossRef] [Scilit]
- Bian, J.; Chen, W.; Zeng, J. Ecosystem services, landscape pattern, and landscape ecological risk zoning in China. Environ. Sci. Pollut. Res. 2023, 30, 17709–17722. [Google Scholar] [CrossRef] [Scilit]
- Yang, L.; Scheffran, J.; Qin, H.; You, Q. Climate-related flood risks and urban responses in the Pearl River Delta, China. Reg. Environ. Change 2015, 15, 379–391. [Google Scholar] [CrossRef] [Scilit]
- Wang, Y.; Yin, Y.; Song, L. Risk assessment of typhoon disaster chains in the Guangdong–Hong Kong–Macau Greater Bay Area, China. Front. Earth Sci. 2022, 10, 839733. [Google Scholar] [CrossRef] [Scilit]
- Qiu, J.; Liu, B.; Yang, F.; Wang, X.; He, X. Quantitative stress test of compound coastal-fluvial floods in China’s Pearl River Delta. Earth’s Future 2022, 10, e2021EF002638. [Google Scholar] [CrossRef] [Scilit]
- Du, H.; Fei, K.; Gao, L. Nonlinear tide-river-surge interactions and their impacts on compound flooding during Typhoon Hato in the Pearl River Delta. J. Geophys. Res. Ocean. 2024, 129, e2023JC020673. [Google Scholar] [CrossRef] [Scilit]
- Liu, X.; Chen, H. Regional assessment on ecological risk of ecosystems under natural hazards: An application in Guangdong Province (SE China). Nat. Hazards 2020, 100, 205–229. [Google Scholar] [CrossRef] [Scilit]
- Liu, X.; Chen, H. Integrated assessment of ecological risk for multi-hazards in Guangdong Province in southeastern China. Geomat. Nat. Hazards Risk 2019, 10, 2069–2093. [Google Scholar] [CrossRef] [Scilit]
- Peng, Y.; Welden, N.; Renaud, F.G. Incorporating ecosystem services into comparative vulnerability and risk assessments in the Pearl River and Yangtze River Deltas, China. Ocean Coast. Manag. 2024, 249, 106980. [Google Scholar] [CrossRef] [Scilit]
- Liu, W.; Zhan, J.; Zhao, F.; Yan, H.; Zhang, F.; Wei, X. Impacts of urbanization-induced land-use changes on ecosystem services: A case study of the Pearl River Delta Metropolitan Region, China. Ecol. Indic. 2019, 98, 228–238. [Google Scholar] [CrossRef] [Scilit]
- Peng, J.; Wang, X.; Liu, Y.; Zhao, Y.; Xu, Z.; Zhao, M.; Qiu, S.; Wu, J. Urbanization impact on the supply-demand budget of ecosystem services: Decoupling analysis. Ecosyst. Serv. 2020, 44, 101139. [Google Scholar] [CrossRef] [Scilit]
- Wu, J.; Huang, Y.; Jiang, W. Spatial matching and value transfer assessment of ecosystem services supply and demand in urban agglomerations: A case study of the Guangdong-Hong Kong-Macao Greater Bay Area in China. J. Clean. Prod. 2022, 375, 134081. [Google Scholar] [CrossRef] [Scilit]
- Zhao, M.; Peng, J.; Liu, Y.; Li, T.; Wang, Y. Mapping watershed-level ecosystem service bundles in the Pearl River Delta, China. Ecol. Econ. 2018, 152, 106–117. [Google Scholar] [CrossRef] [Scilit]
- Liu, Z.; Wang, S.; Fang, C. Spatiotemporal evolution and influencing mechanism of ecosystem service value in the Guangdong-Hong Kong-Macao Greater Bay Area. J. Geogr. Sci. 2023, 33, 1226–1244. [Google Scholar] [CrossRef] [Scilit]
- Wen, D.; Wang, X.; Liu, J.; Xu, N.; Zhou, W.; Hong, M. Maintaining key ecosystem services under multiple development scenarios: A case study in Guangdong–Hong Kong–Macao Greater Bay Area, China. Ecol. Indic. 2023, 154, 110691. [Google Scholar] [CrossRef] [Scilit]
- Teng, Y.; Chen, G.; Su, M.; Zhang, Y.; Li, S.; Xu, C. Ecological management zoning based on static and dynamic matching characteristics of ecosystem services supply and demand in the Guangdong–Hong Kong–Macao Greater Bay Area. J. Clean. Prod. 2024, 448, 141599. [Google Scholar] [CrossRef] [Scilit]
- Chen, R.; Zhang, L.; Feng, S.; Mao, C.; Lin, S.; Huang, X.; Jiang, S.; Fang, W.; Zhou, C. Spatiotemporal evolution characteristics of cropland use stability in Guangdong Province, China and its implications for cropland management. Agronomy 2026, 16, 1632. [Google Scholar] [CrossRef] [Scilit]
- Qiao, Z.; Zhao, L.; Liu, G.; Wang, H.; Chen, G.; Lan, D. Case study on enhancing cultivated land use resilience through spatial layout optimization in Northern Guangdong, China. Agriculture 2026, 16, 553. [Google Scholar] [CrossRef] [Scilit]
- Ricci, L.; Di Musciano, M.; Sabatini, F.M.; Chiarucci, A.; Zannini, P.; Gatti, R.C.; Beierkuhnlein, C.; Walentowitz, A.; Lawrence, A.; Frattaroli, A.R.; et al. A multitaxonomic assessment of Natura 2000 effectiveness across European biogeographic regions. Conserv. Biol. 2024, 38, e14212. [Google Scholar] [CrossRef] [Scilit]
- Ju, H.; Zhang, S.; Yan, Y. Spatial pattern changes of urban expansion and multi-dimensional analysis of driving forces in the Guangdong-Hong Kong-Macao Greater Bay Area in 1980–2020. Acta Geogr. Sin. 2022, 77, 1086–1101. [Google Scholar] [CrossRef]
- Xu, X.; Liu, J.; Zhang, S.; Li, R.; Yan, C.; Wu, S. China Multi-Period Land Use Remote Sensing Monitoring Dataset (CNLUCC); Resource and Environmental Science Data Registration and Publication System: Beijing, China, 2018. [Google Scholar] [CrossRef]
- Yushanjiang, A.; Zhou, W.; Wang, J.; Wang, J. Impact of urbanization on regional ecosystem services: A case study in Guangdong-Hong Kong-Macao Greater Bay Area. Ecol. Indic. 2024, 159, 111633. [Google Scholar] [CrossRef] [Scilit]
- Ran, P.; Hu, S.; Frazier, A.E.; Qu, S.; Yu, D.; Tong, L. Exploring changes in landscape ecological risk in the Yangtze River Economic Belt from a spatiotemporal perspective. Ecol. Indic. 2022, 137, 108744. [Google Scholar] [CrossRef] [Scilit]
- Cutter, S.L.; Boruff, B.J.; Shirley, W.L. Social vulnerability to environmental hazards. Soc. Sci. Q. 2003, 84, 242–261. [Google Scholar] [CrossRef] [Scilit]
- Yang, J. Theory and Methods of Island Ecological Risk Assessment. Ph.D. Thesis, East China Normal University, Shanghai, China, 2007. [Google Scholar]
- Xu, X.; Yan, L.; Xu, L.; Lu, Y.; Ma, L. Ecological risk assessment of natural disasters in China. Acta Sci. Nat. Univ. Pekin. 2011, 47, 901–908. [Google Scholar]
- Costanza, R.; d’Arge, R.; de Groot, R.; Farber, S.; Grasso, M.; Hannon, B.; Limburg, K.; Naeem, S.; O’Neill, R.V.; Paruelo, J.; et al. The value of the world’s ecosystem services and natural capital. Nature 1997, 387, 253–260. [Google Scholar] [CrossRef] [Scilit]
- Xie, G.; Lu, C.; Leng, Y.; Zheng, D.; Li, S. Ecological assets valuation of the Tibetan Plateau. J. Nat. Resour. 2003, 18, 189–196. [Google Scholar] [CrossRef]
- Jongman, B.; Ward, P.J.; Aerts, J.C.J.H. Global exposure to river and coastal flooding: Long-term trends and changes. Glob. Environ. Change 2012, 22, 823–835. [Google Scholar] [CrossRef] [Scilit]
- Foley, J.A.; DeFries, R.; Asner, G.P.; Barford, C.; Bonan, G.; Carpenter, S.R.; Chapin, F.S.; Coe, M.T.; Daily, G.C.; Gibbs, H.K.; et al. Global consequences of land use. Science 2005, 309, 570–574. [Google Scholar] [CrossRef] [Scilit]
- Haddad, N.M.; Brudvig, L.A.; Clobert, J.; Davies, K.F.; Gonzalez, A.; Holt, R.D.; Lovejoy, T.E.; Sexton, J.O.; Austin, M.P.; Collins, C.D.; et al. Habitat fragmentation and its lasting impact on Earth’s ecosystems. Sci. Adv. 2015, 1, e1500052. [Google Scholar] [CrossRef] [Scilit]
- Li, C.; Niu, W.; Huang, H.; Yao, S.; Gong, Z. Study on spatial and temporal evolution of ecological risk and ecological zoning identification in Guangdong-Hong Kong-Macao Greater Bay Area under the background of urbanization. J. Environ. Eng. Technol. 2024, 14, 562–573. [Google Scholar] [CrossRef]
- Liu, L.; Wei, J.; Luo, P.; Zhang, Y.; Wang, Y.; Elbeltagi, A.; Zainol, M.R.R.M.A. A novel quantity assessment of landscape ecological risk using human-nature driving mechanism for sustainable society. Sci. Total Environ. 2024, 947, 173892. [Google Scholar] [CrossRef] [Scilit]
- Chen, C.; Wen, Z.; Sheng, N.; Song, Q. Uneven agricultural contraction within fast-urbanizing urban agglomeration decreases the nitrogen use efficiency of crop production. Nat. Food 2024, 5, 390–401. [Google Scholar] [CrossRef] [Scilit]
- Xu, W.; Jin, X.; Liu, J.; Li, H.; Zhang, X.; Zhou, Y. Spatiotemporal evolution and the detection of key drivers in the resilience of cultivated land system in major grain-producing regions of China. Land Degrad. Dev. 2023, 34, 4712–4727. [Google Scholar] [CrossRef] [Scilit]
- Yin, X.; Li, Z.; Xu, G.; Wan, C. Integrating resilience theory into a cultivated land system: Empirical insights from China’s key grain-producing regions. Land Degrad. Dev. 2024, 35, 5425–5438. [Google Scholar] [CrossRef] [Scilit]
- Zhang, R.; Chen, S.; Gao, L.; Hu, J. Spatiotemporal evolution and impact mechanism of ecological vulnerability in the Guangdong–Hong Kong–Macao Greater Bay Area. Ecol. Indic. 2023, 157, 111214. [Google Scholar] [CrossRef] [Scilit]
- Liu, Y.; Cao, W.; Wang, F.; Yu, L. Quantifying the contribution of ecological land restoration to landscape ecological risk in the Pearl River Delta Urban Agglomeration: A human-earth areal system perspective. J. Resour. Ecol. 2025, 16, 946–959. [Google Scholar] [CrossRef] [Scilit]
- Sun, X.; Lian, A.; Wang, Z.; Cai, Y.; Dong, R. Structural, functional, and resilience dynamics of ecological networks in the Guangdong-Hong Kong-Macao Greater Bay Area: Impacts of climate and urbanization. J. Environ. Manag. 2025, 393, 126990. [Google Scholar] [CrossRef] [Scilit]
- Wang, X.; Wang, Y.; Song, L.; Dai, S.; Zang, C. Analysis of interrelated characteristics between ecosystem services and ecosystem health in the Guangdong–Hong Kong–Macao Greater Bay Area. Front. Plant Sci. 2025, 16, 1668073. [Google Scholar] [CrossRef] [Scilit]
- Chen, Q.; Liu, J.; Ho, K.C.; Yang, Z. Development of a relative risk model for evaluating ecological risk of water environment in the Haihe River Basin estuary area. Sci. Total Environ. 2012, 420, 79–89. [Google Scholar] [CrossRef] [Scilit]
- Yu, W.; Zhang, L.; Ricci, P.F.; Chen, B.; Huang, H. Coastal ecological risk assessment in regional scale: Application of the relative risk model to Xiamen Bay, China. Ocean Coast. Manag. 2015, 108, 131–139. [Google Scholar] [CrossRef] [Scilit]
- O’Brien, G.C.; Dickens, C.; Hines, E.; Wepener, V.; Stassen, R.; Quayle, L.; Fouchy, K.; MacKenzie, J.; Graham, P.M.; Landis, W.G. A regional-scale ecological risk framework for environmental flow evaluations. Hydrol. Earth Syst. Sci. 2018, 22, 957–975. [Google Scholar] [CrossRef] [Scilit]
- Temmerman, S.; Meire, P.; Bouma, T.J.; Herman, P.M.J.; Ysebaert, T.; De Vriend, H.J. Ecosystem-based coastal defence in the face of global change. Nature 2013, 504, 79–83. [Google Scholar] [CrossRef] [Scilit]
- Arkema, K.K.; Guannel, G.; Verutes, G.; Wood, S.A.; Guerry, A.; Ruckelshaus, M.; Kareiva, P.; Lacayo, M.; Silver, J.M. Coastal habitats shield people and property from sea-level rise and storms. Nat. Clim. Change 2013, 3, 913–918. [Google Scholar] [CrossRef] [Scilit]
- Klijn, F.; Kreibich, H.; de Moel, H.; Penning-Rowsell, E. Adaptive flood risk management planning based on a comprehensive flood risk conceptualisation. Mitig. Adapt. Strateg. Glob. Change 2015, 20, 845–864. [Google Scholar] [CrossRef] [Scilit]
- de Groot, R.; Brander, L.; van der Ploeg, S.; Costanza, R.; Bernard, F.; Braat, L.; Christie, M.; Crossman, N.; Ghermandi, A.; Hein, L.; et al. Global estimates of the value of ecosystems and their services in monetary units. Ecosyst. Serv. 2012, 1, 50–61. [Google Scholar] [CrossRef] [Scilit]
- Xie, G.; Zhen, L.; Lu, C.; Xiao, Y.; Chen, C. Expert knowledge based valuation method of ecosystem services in China. J. Nat. Resour. 2008, 23, 911–919. [Google Scholar] [CrossRef]
- Hasan, S.; Shi, W.; Zhu, X. Impact of land use land cover changes on ecosystem service value—A case study of Guangdong, Hong Kong, and Macao in South China. PLoS ONE 2020, 15, e0231259. [Google Scholar] [CrossRef] [Scilit]

Disclaimer/Publisher’s Note: The statements, opinions and data contained in all publications are solely those of the individual author(s) and contributor(s) and not of MDPI and/or the editor(s). MDPI and/or the editor(s) disclaim responsibility for any injury to people or property resulting from any ideas, methods, instructions or products referred to in the content. |
© 2026 by the authors. Licensee MDPI, Basel, Switzerland. This article is an open access article distributed under the terms and conditions of the Creative Commons Attribution (CC BY) license.