


Abstract
Whether a cooperative management (CM) package can support higher winter wheat productivity and profitability while reducing energy requirements and environmental burdens warrants integrated evaluation. A three-season field comparison (2022–2025) was conducted in the North China Plain to compare CM and smallholder management (SM) packages through an integrated assessment of crop productivity, economic returns, energy performance, carbon footprints and life cycle environmental impacts. Compared with SM, grain yield and aboveground biomass under CM were 2.8–3.7% and 2.5–3.2% higher, respectively. Higher grain revenue and lower production costs were associated with 30.8–38.8% higher net income and a 60.3–72.6% higher net benefit–cost ratio. Total energy input was 14.2–15.6% lower, whereas energy output was 2.5–3.3% higher, with corresponding increases of 4.0–4.9% in net energy and 17.1–18.8% in energy-use efficiency. Fertilizer was the largest contributor to both energy inputs and indirect greenhouse gas emissions. Estimated total and grain yield-scaled carbon footprints were 11.1–13.0% and 13.5–15.6% lower, respectively. Life cycle assessment estimated reductions of 10.1–12.9% across 18 evaluated midpoint impact categories and 11.6% in the total endpoint score, with lower modelled damage scores for human health, ecosystems and resources. These findings indicate more favourable production, economic and modelled environmental performance under the specific CM package and conditions studied. Future studies should validate these findings through long-term, multi-site trials incorporating emission measurements, and soil carbon changes.
1. Introduction
Winter wheat (Triticum aestivum L.) is central to China’s food security, yet its production often relies on intensive resource inputs that impose substantial economic and environmental costs [1]. In the North China Plain (NCP), sustaining wheat production therefore requires management approaches that reconcile high crop output with farm profitability and lower environmental burdens. High inputs of irrigation water, fertilizers, and pesticides have helped sustain high yields, but additional inputs generate diminishing returns when water and nutrient supplies exceed crop demand [2,3]. Research on wheat has shown that coordinated irrigation and nitrogen management can improve yield and resource-use efficiency, highlighting opportunities to improve production through better input allocation rather than higher input use [4,5,6]. The practical question is how to coordinate these improvements within a production system while accounting for their economic, energy and environmental consequences.
Smallholder wheat producers in the NCP can face constraints in accessing technical advice and coordinated machinery services, which may influence irrigation, fertilization and field-operation decisions [7,8,9]. These constraints may contribute to mismatches between input applications and crop requirements, although management practices and input intensity vary among farms. Excessive nitrogen application increases energy requirements associated with fertilizer production and can increase direct and indirect soil N2O emissions, whereas unnecessary irrigation and repeated machinery operations consume electricity and diesel without necessarily increasing yield [3,10]. Beyond GHG emissions, input production and use can contribute to acidification, eutrophication, toxicity and resource depletion throughout the agricultural supply chain [11,12]. Improving input allocation and operational timing thus offers a potential route to maintaining productivity while reducing costs and resource requirements [13]. Cooperative management (CM) can provide a platform for implementing such coordination through standardized protocols, specialized machinery services and technical supervision [14]. Its potential value lies in enabling several management improvements to be implemented together.
Previous research supports this potential but provides an incomplete assessment of its consequences. Field-scale evidence from wheat–rice systems in the Yangtze River Plain showed that improved agronomic practices combined with cooperative production increased productivity and net income while reducing energy inputs and carbon footprints [7]. Our previous 12-year field study also evaluated energy efficiency, carbon footprints and profitability under contrasting winter wheat production types and cultivation patterns in the NCP [9]. Studies of irrigation, fertilization, tillage and straw management likewise demonstrate opportunities to improve cereal productivity and resource efficiency [4,5,15,16]. However, these findings do not establish whether the production, economic and climate benefits associated with a coordinated CM package coincide with lower impacts in other environmental impact categories. Greater machinery use, for example, may reduce labour requirements while increasing dependence on fossil energy. Consequently, lower production costs or carbon footprints alone are insufficient to establish the overall performance of a management package.
Life cycle assessment (LCA) provides a framework for evaluating these potential trade-offs by linking resource consumption and emissions from upstream agricultural input production and field operations to multiple environmental impacts. Midpoint indicators distinguish specific impact categories, whereas endpoint indicators translate these impacts into potential damage to human health, ecosystems and resources [17,18,19]. Their combined interpretation allows category-specific burdens to be considered alongside aggregate potential damage. Although recent wheat studies have applied multi-impact LCA to water and nitrogen management and contrasting cropping systems [11,20], evidence integrating these environmental dimensions with the agronomic, economic and energy outcomes of cooperative-supported management packages remains limited. The remaining question is whether favourable production, economic and energy outcomes under a CM package coincide with lower modelled impacts across multiple environmental categories or involve trade-offs that carbon-footprint accounting alone cannot reveal.
We hypothesized that the CM management package would be associated with maintained or higher grain yield, lower agricultural input requirements, higher net returns and energy-use efficiency, and lower estimated carbon footprints than the SM package. To test this hypothesis, a three-season field experiment was conducted at a site in the NCP to compare winter wheat production under the two management packages. The objectives were to: (1) quantify differences in grain and biomass yields, economic returns, energy performance, and area- and yield-scaled carbon footprints; (2) evaluate modelled environmental impacts associated with upstream input production and field operations using 18 midpoint categories and three endpoint damage categories; and (3) assess whether differences in productivity and profitability coincide with differences in energy requirements and modelled environmental burdens, and identify potential trade-offs among the evaluated outcomes.
2. Materials and Methods
2.1. Experimental Site and Design
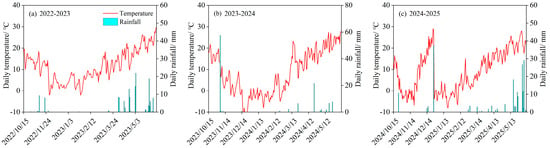
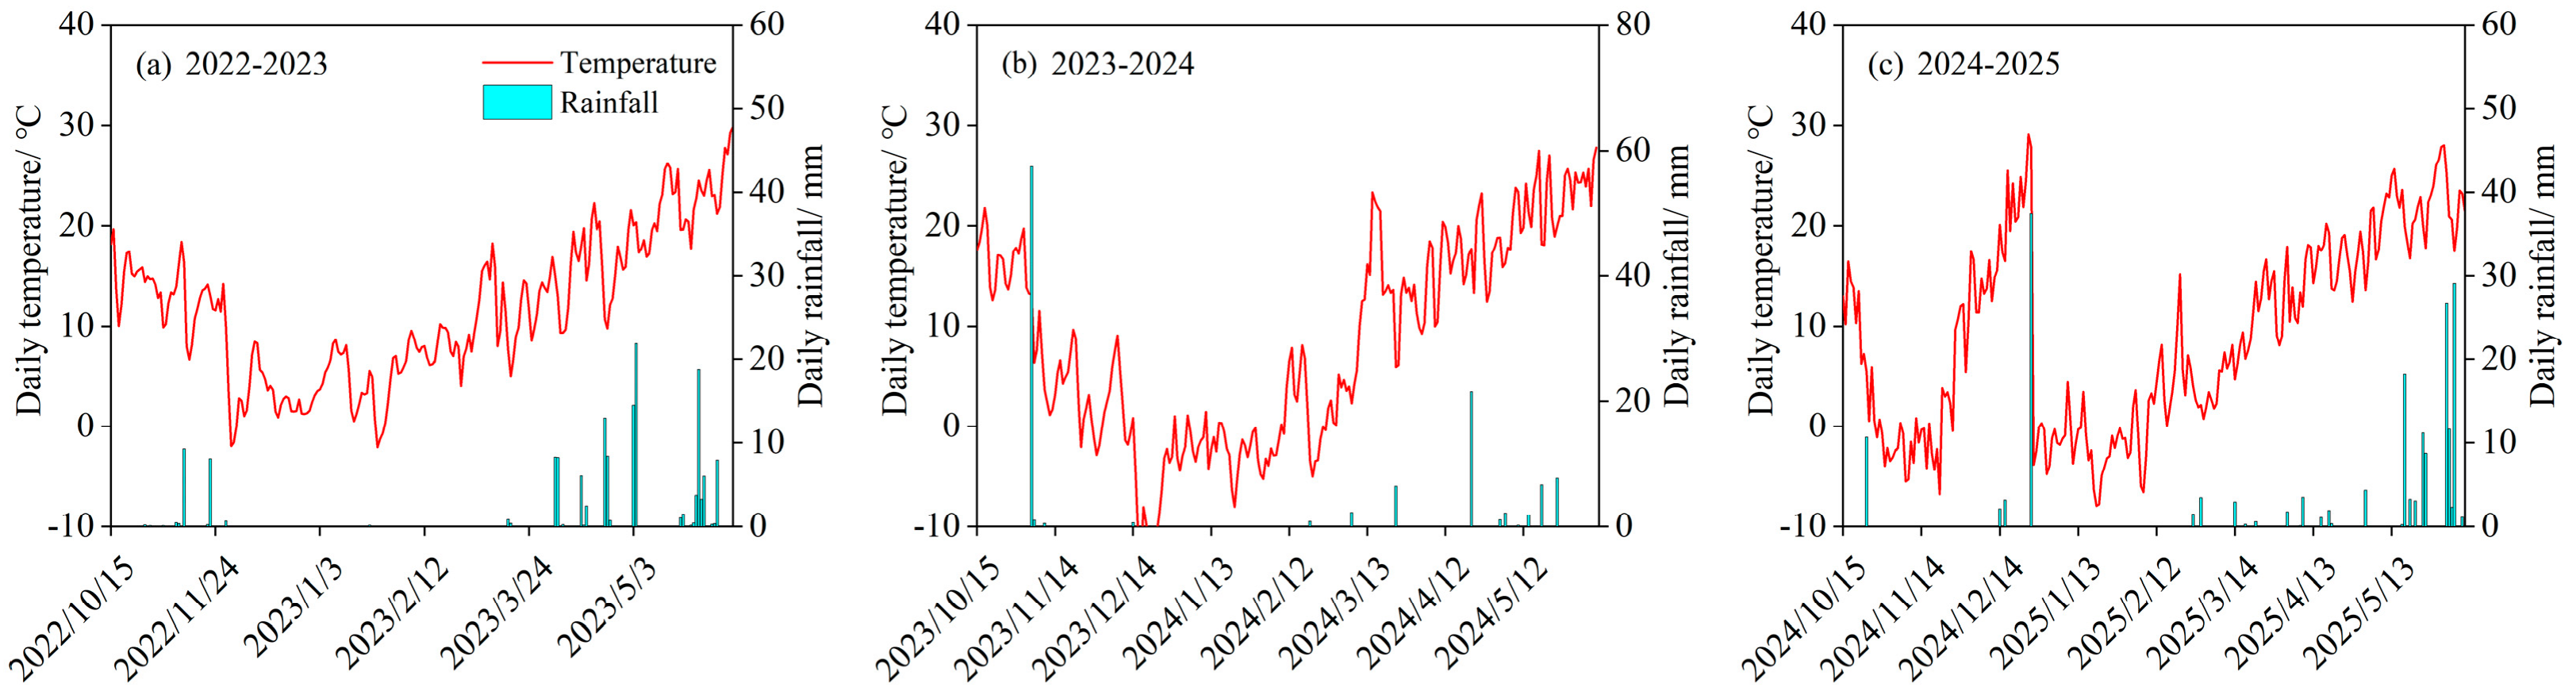
A three-season (2022–2025) field comparison was conducted in Binzhou, Shandong Province, China (37.06° N, 118.29° E). The region has a warm-temperate, semi-humid monsoon climate, with a long-term mean annual air temperature of 12.5 °C and mean annual precipitation of 601 mm. Most precipitation occurs predominantly from July to September. Daily air temperature and precipitation during the three wheat-growing seasons are presented in Figure 1. The soil at the experimental site had a silt loam texture, with a bulk density of 1.50 g cm−3 and a field capacity of 0.33 cm cm−3. In the 0–20 cm soil layer, total nitrogen, available phosphorus, available potassium and soil organic carbon concentrations were 1.03 g kg−1, 13.1 mg kg−1, 98.7 mg kg−1 and 1.5 g kg−1, respectively. The dominant cropping system in the region is a summer maize–winter wheat rotation.
Figure 1.
Daily air temperature and precipitation during 2022–2025 wheat seasons.
Two contrasting production systems were evaluated: a smallholder management system (SM) and a cooperative management system (CM). The CM fields were managed by Boxing Lenong Agricultural Technology Cooperative, whereas the SM fields were managed by an individual farmer. CM and SM were operationally defined as the specific management packages implemented in the participating fields under local production conditions. CM combined standardized agronomic protocols, technical supervision and coordinated machinery services, whereas SM followed the individual farmer’s customary management practices. These designations describe the implemented management packages rather than cooperative membership alone.
Under SM, irrigation, fertilization, seeding rate, pesticide application and machinery operations were determined primarily according to the farmer’s experience and customary local practice. SM provided a local management reference and was not intended to represent all smallholder production systems. Under CM, irrigation, nitrogen application, seeding rate, straw return and machinery operations were jointly planned according to soil fertility, crop demand and local climatic conditions [7]. The cooperative coordinated these operations through a common production protocol and centralized service scheduling. Quantitative differences in agronomic practices between CM and SM are provided in Table S1, and season-specific agricultural input quantities are reported in Table S2.
Each management system was represented by three independent 525 m2 fields (21 m × 25 m), giving six fields in total. Each field constituted an experimental unit, and the same fields were followed across the three growing seasons. Management systems were not randomly assigned. The energy and carbon accounting are summarized in Table 1. At physiological maturity, all aboveground plant material was harvested from a previously undisturbed 7 m2 area (1.4 m × 5.0 m) within each field to determine grain and aboveground biomass yields. Grain was separated from straw, and both fractions were dried at 75 °C to constant mass and weighed separately. Aboveground biomass was calculated as the sum of grain and straw dry masses. Grain, straw and aboveground biomass yields were expressed on a dry-matter basis and converted to kg ha−1 using the actual harvested area.
Table 1.
Energy and carbon-equivalent coefficients.
2.2. Economic Analysis
Production costs included expenditure on seed, fertilizer, irrigation, pesticides, labour, diesel and agricultural machinery. Total input cost (TIC, CNY ha−1) was based on local market prices in each season. Gross return (GR, CNY ha−1) was calculated from measured grain yield and the local wheat purchase price. Net return (NR, CNY ha−1) and net benefit–cost ratio (NBCR) were calculated as follows:
NR = GR − TIC
NBCR = NR/TIC
2.3. Energy Budgeting
Energy budgeting followed the input–output accounting approach described in previous studies [24,26]. Quantities of agricultural input were recorded for each plot during each wheat-growing season. Season-specific energy inputs were calculated using the corresponding season’s activity data; the input quantities presented in Table S2. Total energy input (EI, MJ ha−1), energy output (EO, MJ ha−1), net energy (NE, MJ ha−1), energy-use efficiency (EUE), and energy productivity (EP, kg MJ−1) were calculated as follows [27]:
where EI1, EI2, …, EIn is the energy of different agricultural input (seed, irrigation, fertilizer, etc.); GY is the grain yield (kg ha−1); SY is the straw yield (kg ha−1).
EI = EI1 + EI2 + … + EIn
EO = GY × 14.7 + SY × 12.5
NE = EO − EI
EUE = EO/EI
EP = GY/EI
2.4. Environmental Assessment
Growing-season GHG emissions (kg CO2-eq ha−1) comprised field-derived emissions and indirect emissions embodied in agricultural inputs. The emission factors were obtained from published sources and are summarized in Table 1 [24,26]. The total CF (kg CO2-eq ha−1) was calculated as the sum of direct and indirect GHG emissions. Indirect emissions were estimated by multiplying the amount of each input by its corresponding emission factor and summing the resulting values.
Direct GHG emissions from the wheat fields, including nitrogen applications and plant residue decomposition, were calculated [21,28]:
where CO2eqsnf and CO2eqcrd are the N2O emissions from the chemical nitrogen and crop residue decomposition, respectively; QNsnf is nitrogen rate; QPcrd is the rate of plant residue nitrogen; FRAgasm = 0.1 kg N kg−1 N; EFvd = 0.01 kg N2O-N kg−1 N; EF is the emission factor with a unit of kg N2O-N kg−1 of N; FRAleach is the fraction of fertilizer- and crop residue-N subject to leaching.
Grain yield- CF (kg CO2-eq kg−1 grain) and biomass-scaled CF (kg CO2-eq kg−1 biomass) were calculated by dividing CF by grain yield and aboveground biomass yield, respectively.
2.5. Life Cycle Assessment
LCA was conducted to compare the environmental impacts of CM and SM, following the assessment framework of a previous study [20,29]. The functional unit was 1 ha of wheat production per growing season. The system boundary encompassed upstream agricultural input production and field operations. The inventory comprised recorded agricultural inputs and estimated field emissions [17,18]. Background inventory data were obtained from a Ecoinvent LCA database (v.3).
Environmental impacts were calculated using SimaPro v8.3 with the ReCiPe 2016 method [30]. A 100-year time horizon was used to characterize climate-change impacts [31]. All 18 midpoint categories were evaluated to capture climate-, pollution-, land-use- and resource-related impacts and identify potential trade-offs beyond GHG emissions. The three endpoint categories, namely human health, ecosystems and resources, provided a complementary damage-level assessment. Endpoint results were normalized and weighted based on the previous studies [20,32], and aggregated into a total score expressed in points (Pt). Identical system boundaries and assessment settings were applied to both management systems [20].
2.6. Data Analysis
Statistical analyses were performed using IBM SPSS Statistics 25.0, and figures were generated using Origin 2024. Data are presented as means ± standard deviations of three independent fields per management system. Repeated observations across seasons were analysed using linear mixed-effects models, with management system, season and their interaction as fixed effects and field nested within management system as a random effect. Within-season differences between CM and SM were assessed using Student’s t-tests at p < 0.05.
3. Results
3.1. Grain and Biomass Yield
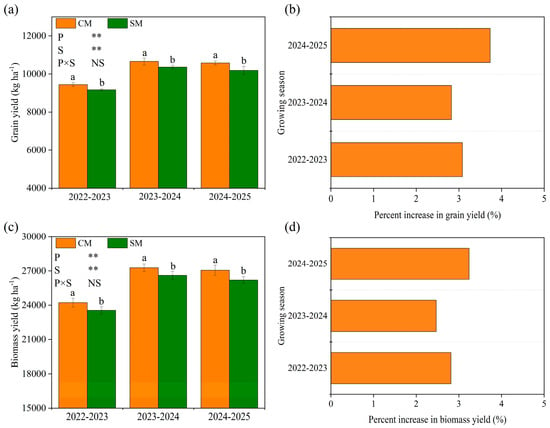
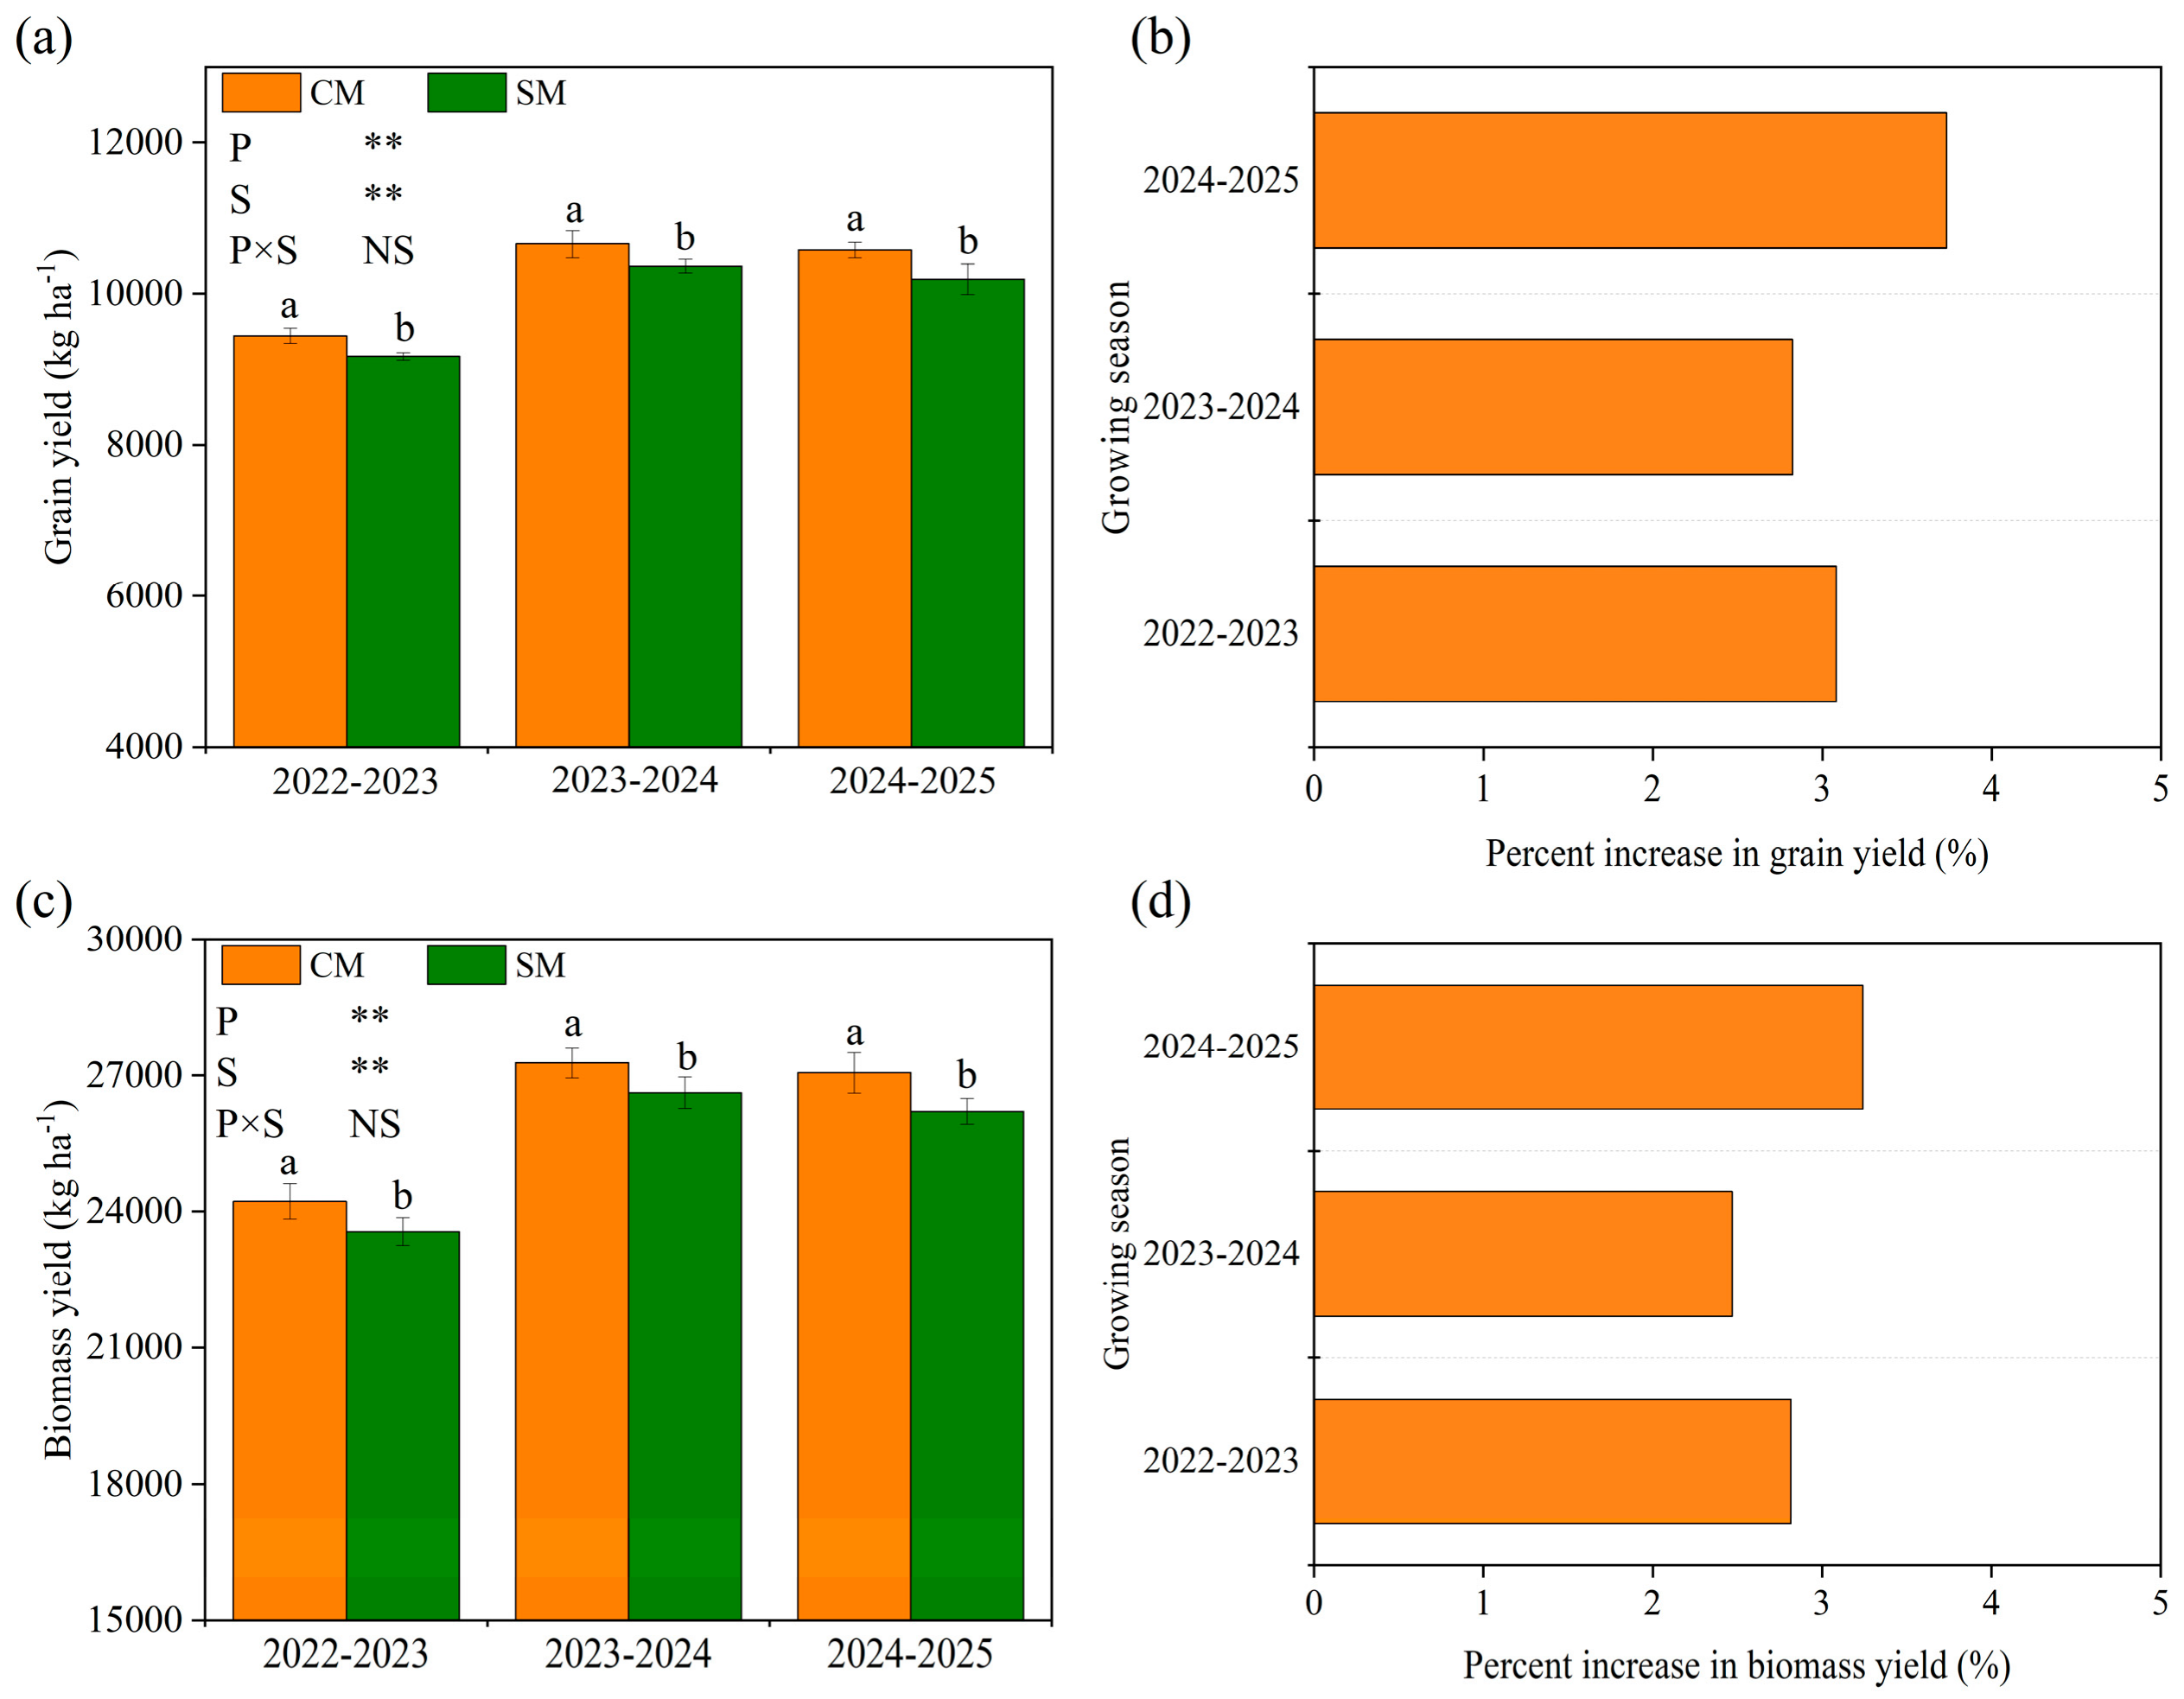
Grain yield varied among growing seasons but was consistently higher under cooperative management (CM) than under smallholder management (SM) (p < 0.05, Figure 2a). Across the three seasons, seasonal mean grain yield ranged from 9447 to 10,657 kg ha−1 under CM and from 9164 to 10,364 kg ha−1 under SM. Grain yield was 2.8–3.7% higher under CM, with the greatest relative difference occurring in 2024–2025 (Figure 2b). Aboveground biomass was also significantly higher under CM in each growing season (p < 0.05, Figure 2c). Seasonal mean aboveground biomass ranged from 24,220 to 27,280 kg ha−1 under CM, compared with 23,558–26,623 kg ha−1 under SM. These differences corresponded to 2.5–3.2% higher aboveground biomass under CM (Figure 2d).
Figure 2.
Grain yield and aboveground biomass yield of wheat under smallholder management (SM) and cooperative management (CM). (a) Grain yield; (b) relative change in grain yield under CM compared with SM; (c) aboveground biomass yield; and (d) relative change in aboveground biomass yield under CM compared with SM. Data are presented as means ± SD (n = 3). Different lowercase letters indicate within-season differences between CM and SM (Student’s t-test, p < 0.05). P, S, and P × S denote the effects of production system, season, and their interaction, respectively. NS indicates a nonsignificant effect; * and ** indicate significance at p < 0.05 and p < 0.01, respectively.
3.2. Production Costs and Economic Returns
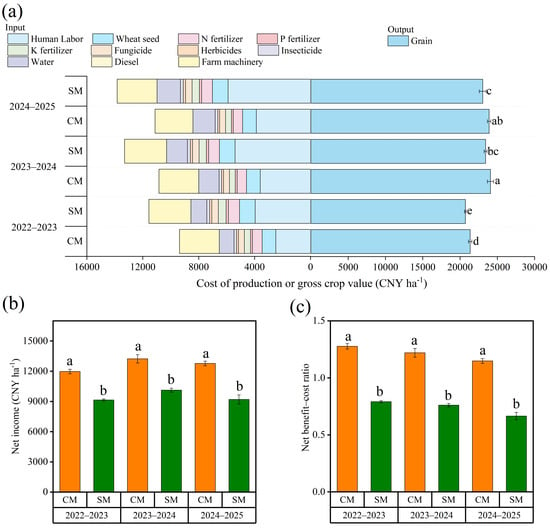
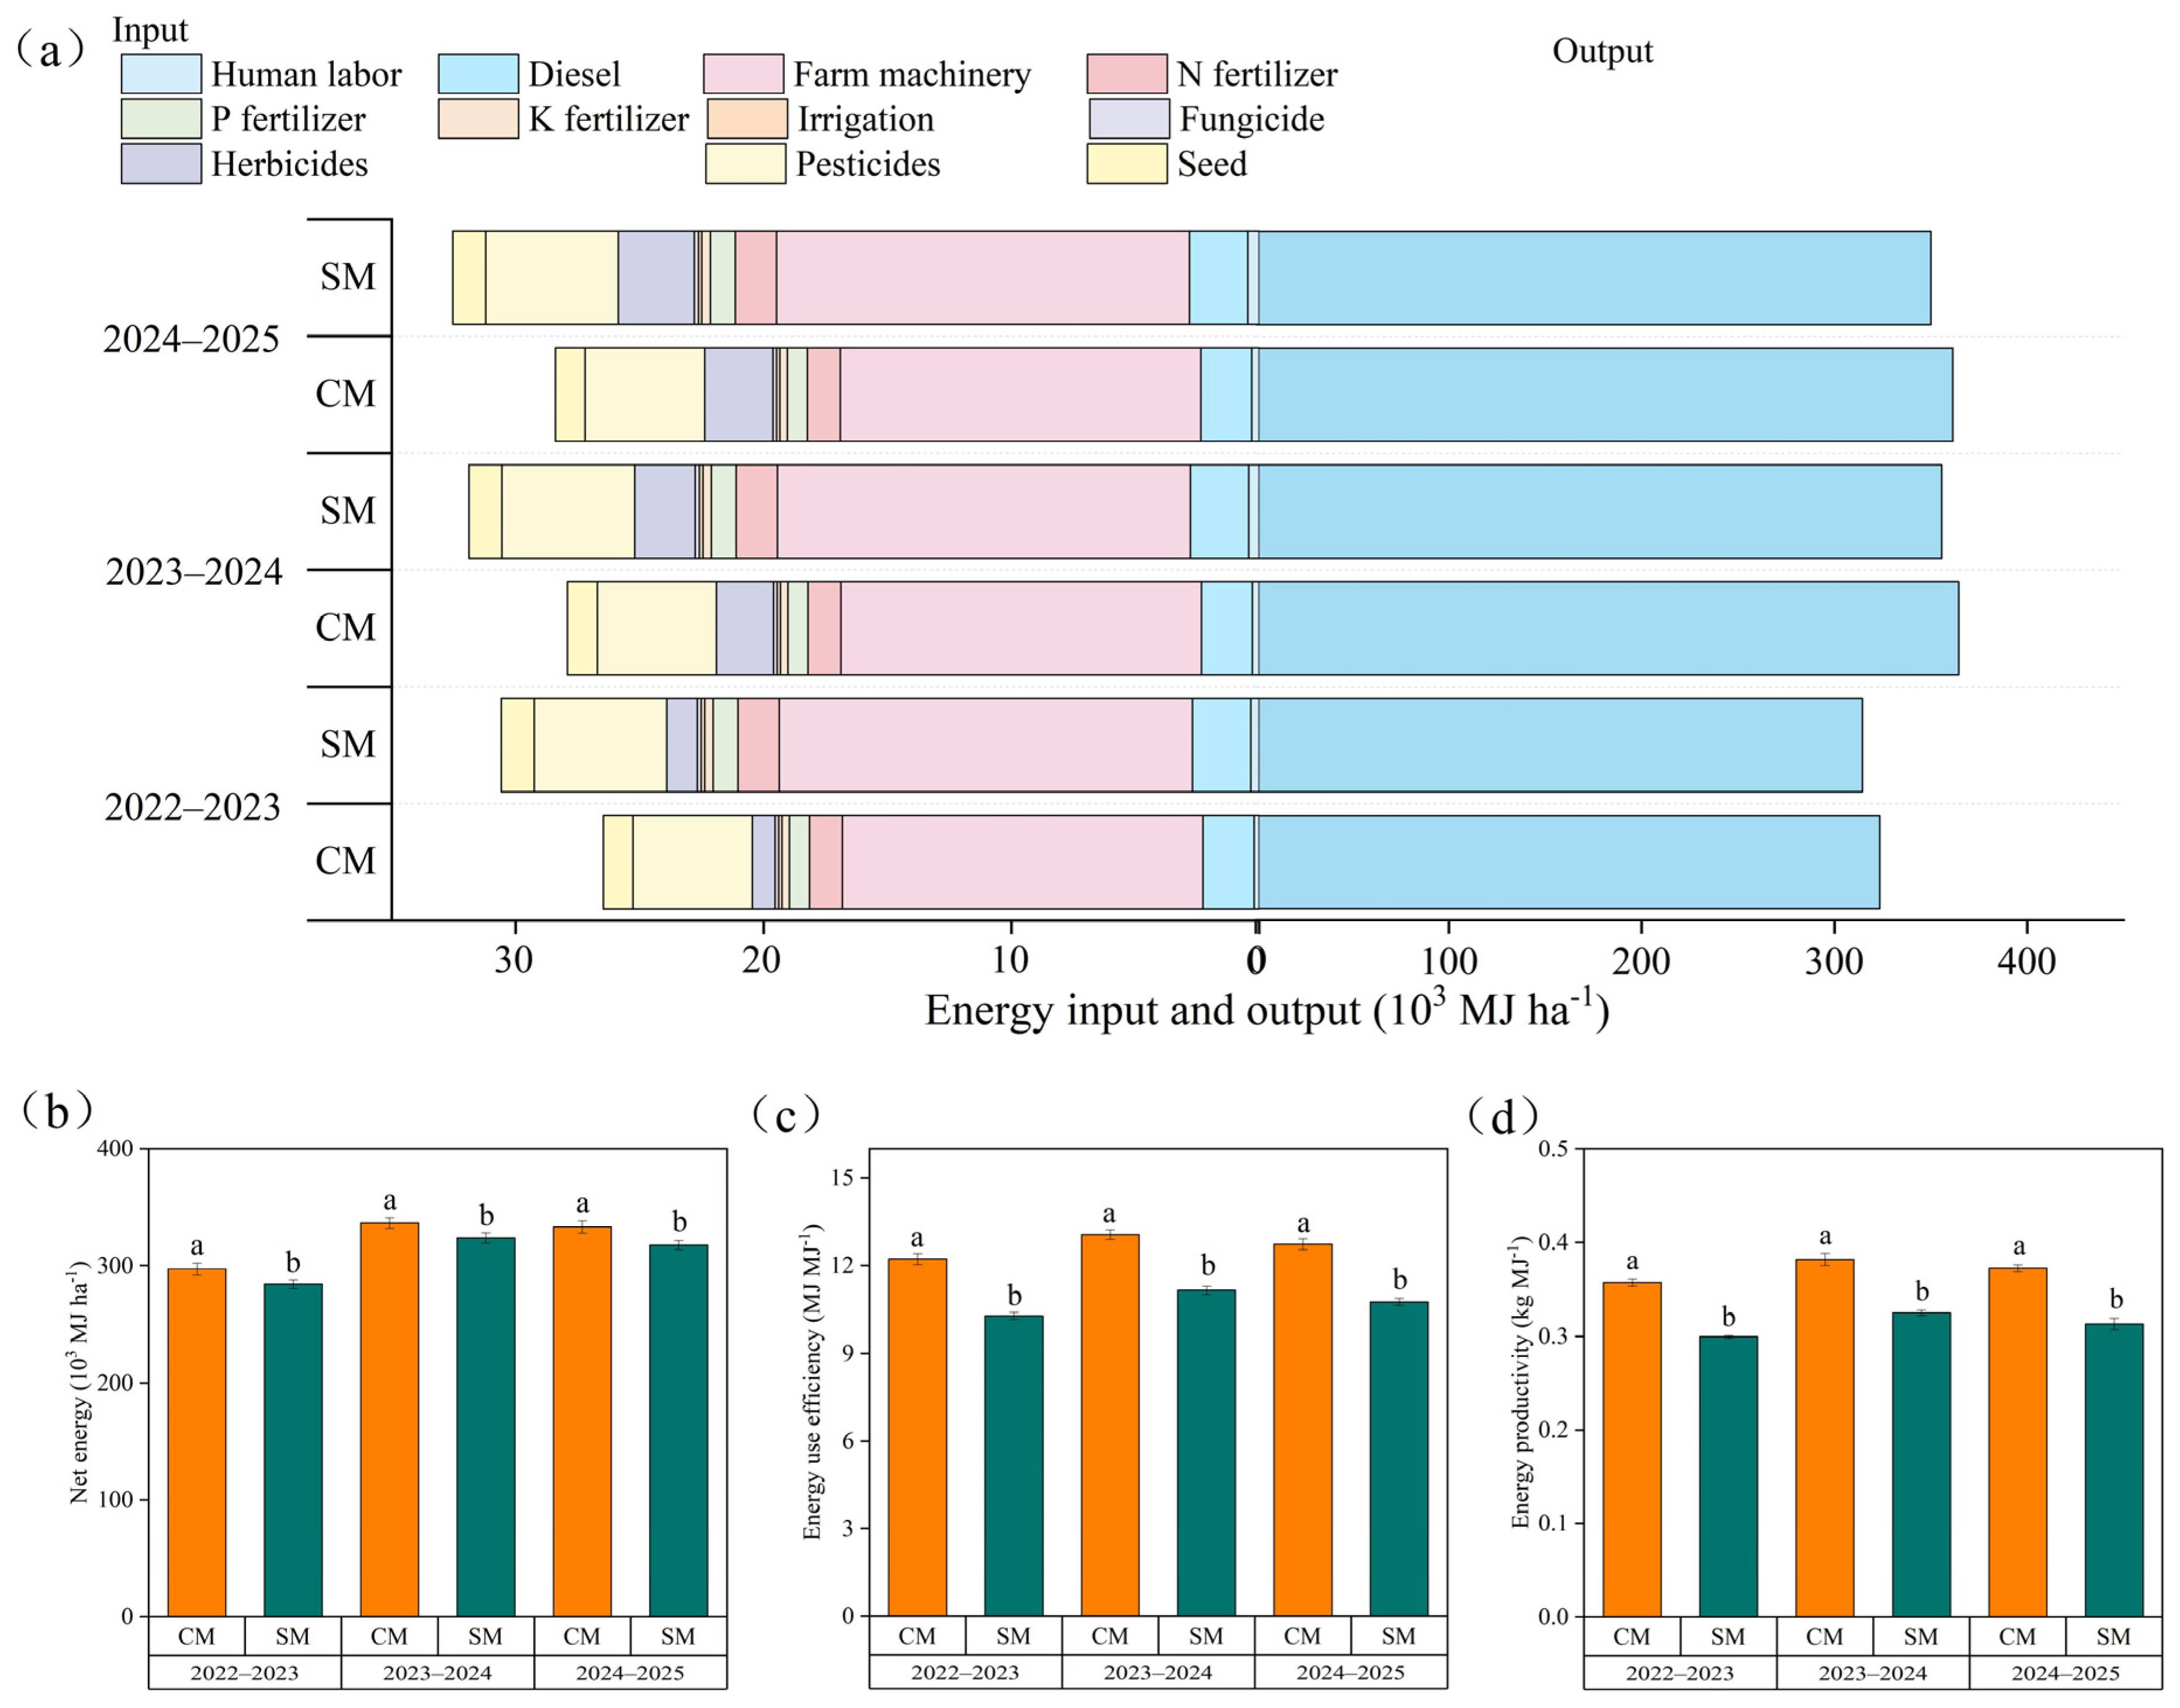
Agricultural machinery, human labour and fertilizer were the principal cost components of winter wheat production, collectively accounting for 70.2% and 74.1% of total production costs under CM and SM, respectively (Figure 3a). CM had lower machinery, labour and pesticide costs, as well as lower total recorded production costs, in all three growing seasons. Seasonal mean gross return was higher under CM, ranging from 21,350.5 to 24,085.1 CNY ha−1 under CM, compared with 20,712.4–23,424.4 CNY ha−1 under SM.
Figure 3.
Production costs and economic returns of winter wheat under smallholder management (SM) and cooperative management (CM). (a) Composition of production costs and gross return; (b) net income; and (c) net benefit–cost ratio.
Net income was significantly higher under CM in every growing season (p < 0.05; Figure 3b). The difference between CM and SM ranged from 2822.5 to 3570.6 CNY ha−1, equivalent to 30.8–38.8% higher net income under CM. The net benefit–cost ratio (NBCR) ranged from 1.15 to 1.28 under CM and from 0.67 to 0.79 under SM (Figure 3c). NBCR was 60.3–72.6% higher under CM, with significant differences between the management systems in each season (p < 0.05).
3.3. Energy Utilization
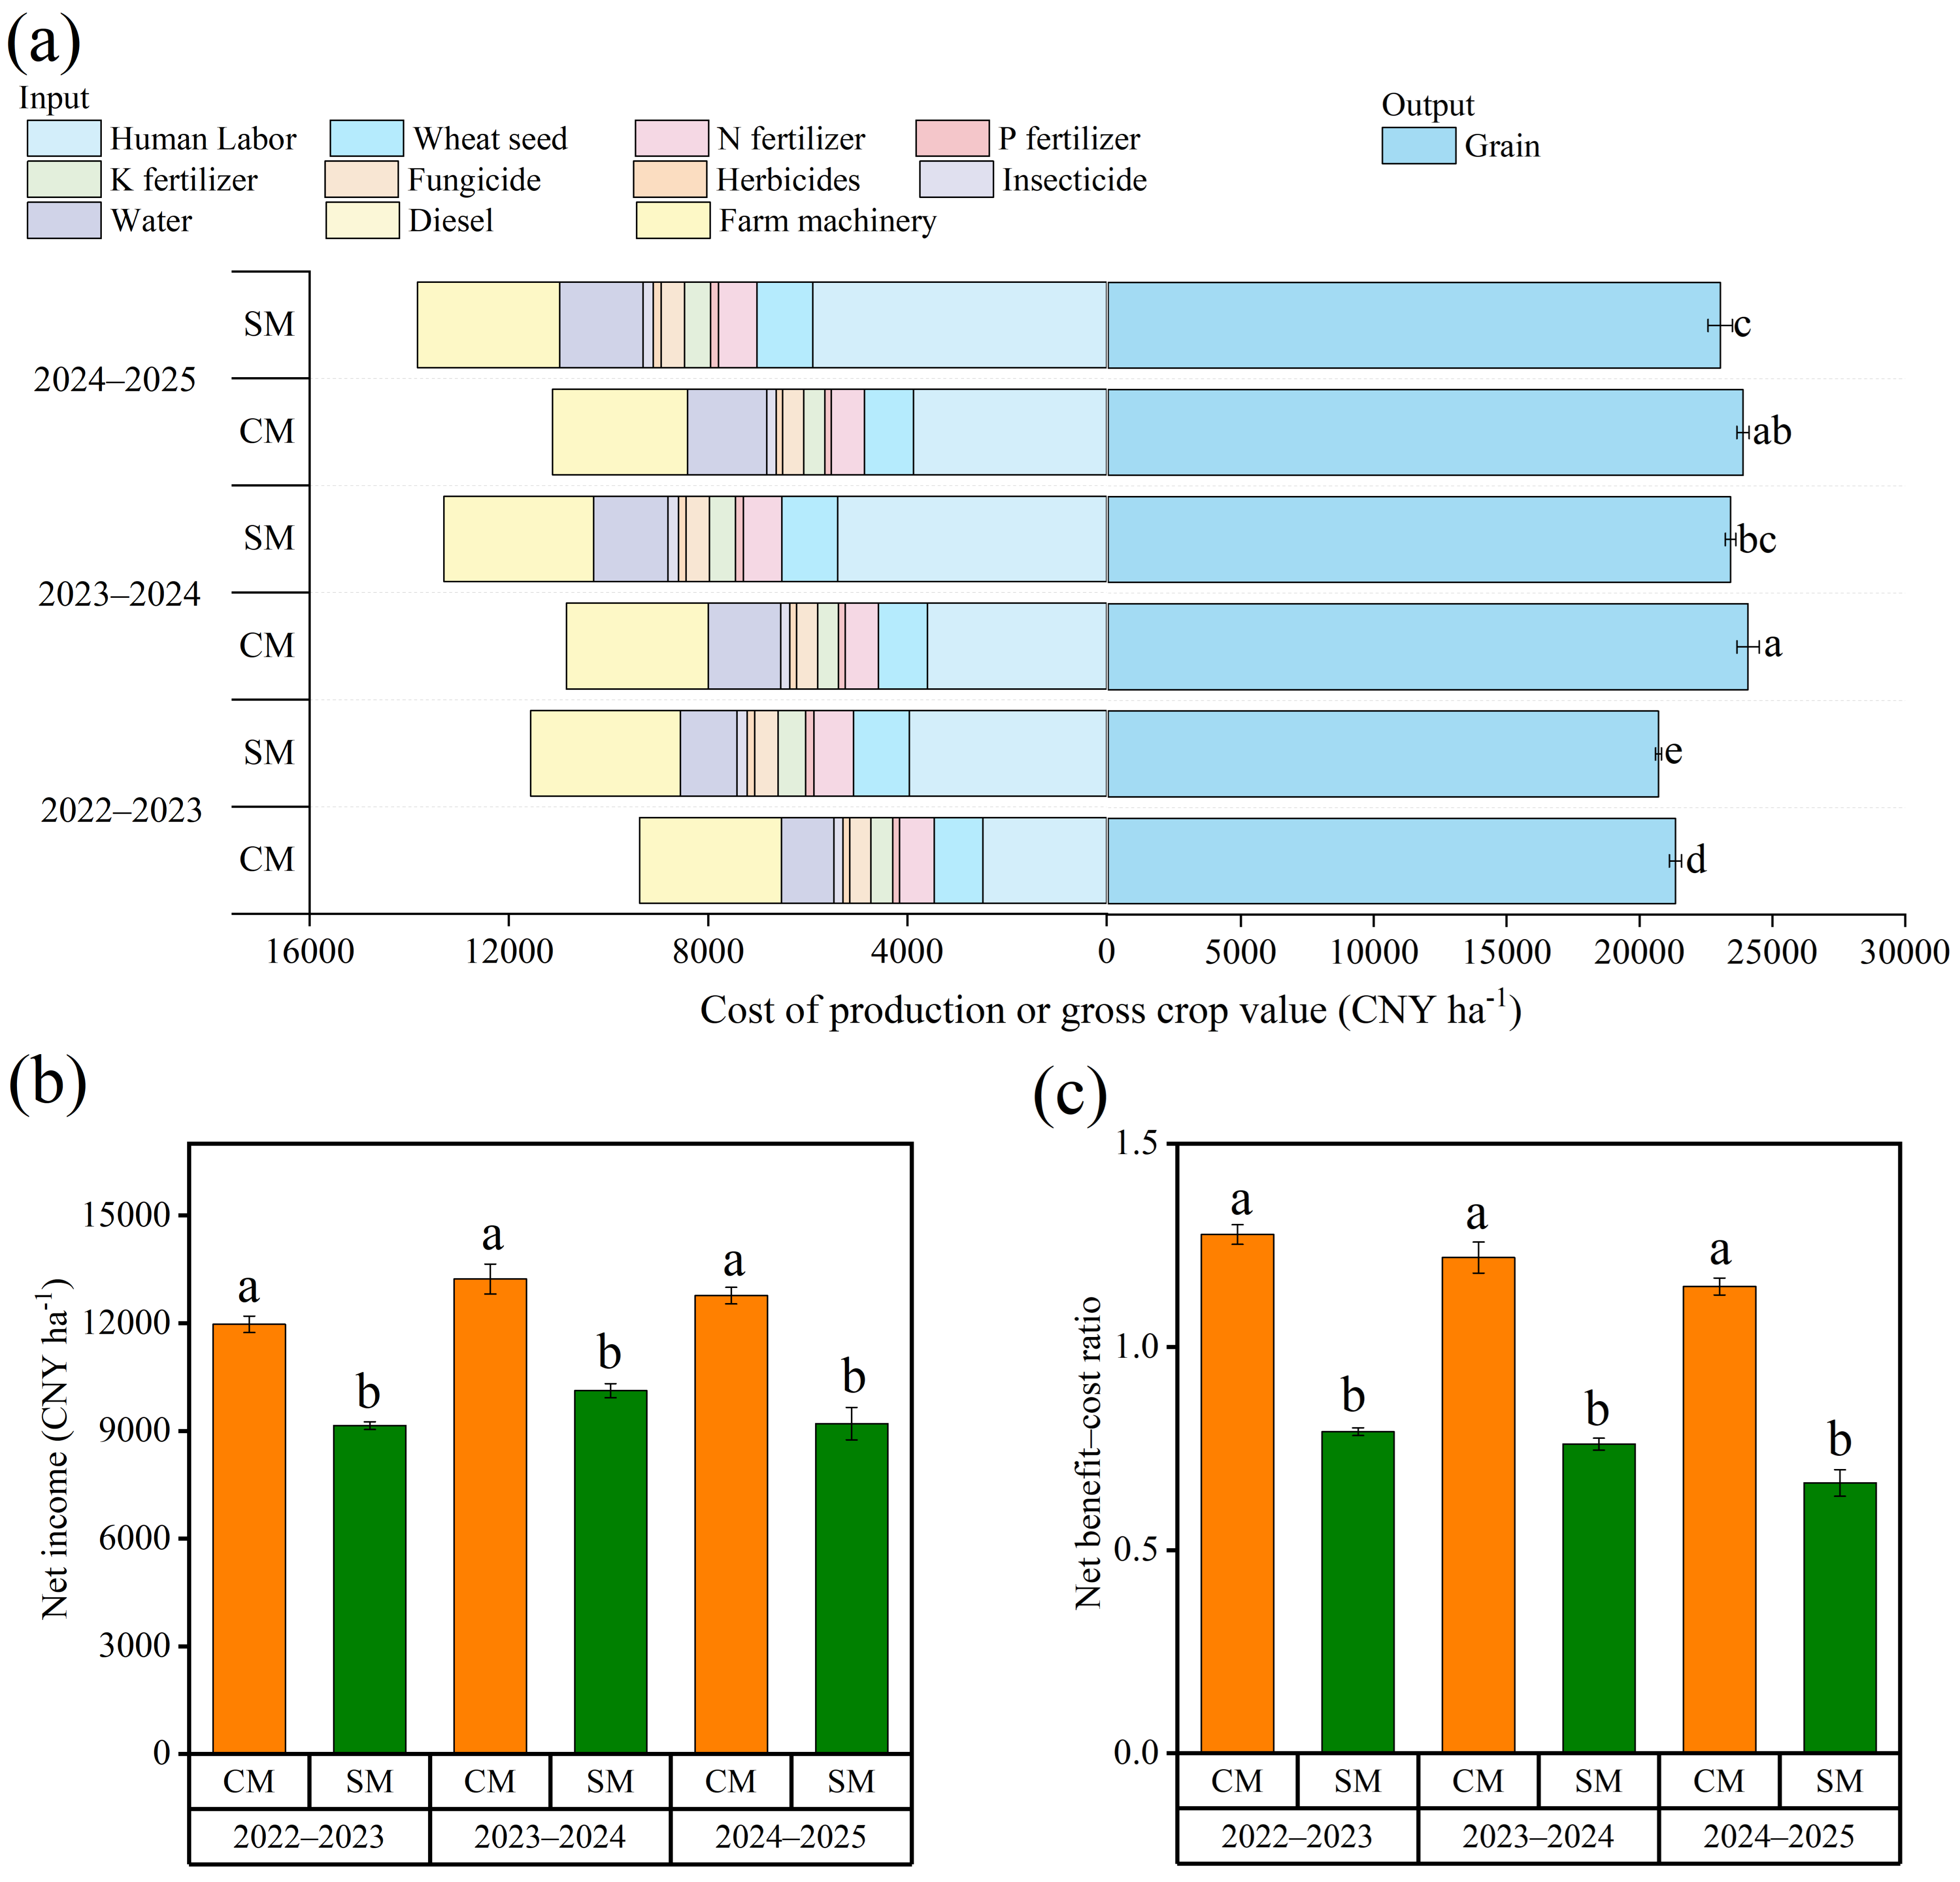
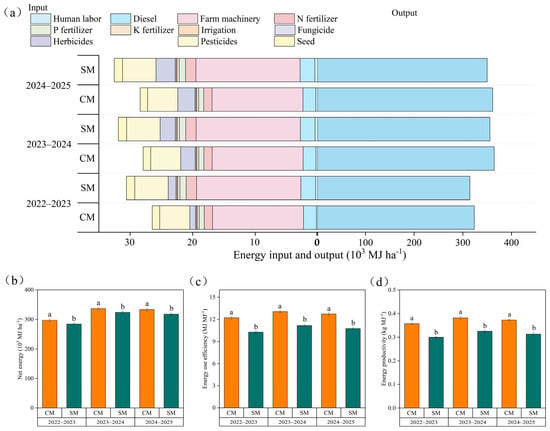
Fertilizers, diesel, seed and agricultural machinery were the main energy inputs, collectively accounting for 89.8% and 89.6% of total energy input under CM and SM, respectively (Figure 4a). Fertilizer was the largest individual contributor, followed by diesel and seed. Across the three growing seasons, total energy input under CM was 14.2–15.6% lower than that under SM, and energy inputs associated with seed, fertilizers, pesticides, labour and machinery operations were also lower.
Figure 4.
Energy inputs, energy outputs and energy-use performance of winter wheat under smallholder management (SM) and cooperative management (CM). (a) Energy input and output; (b) net energy; (c) energy-use efficiency; and (d) energy productivity.
Energy output was 2.5–3.3% higher under CM than under SM (Figure 4a). NE was 4.0–4.9% higher under CM, with significant differences between the management systems in each growing season (p < 0.05; Figure 4b). EUE and EP were also significantly higher under CM in all three seasons (p < 0.05; Figure 4c,d), with respective increases of 17.1–18.8% and 17.5–19.1%.
3.4. Carbon Footprints
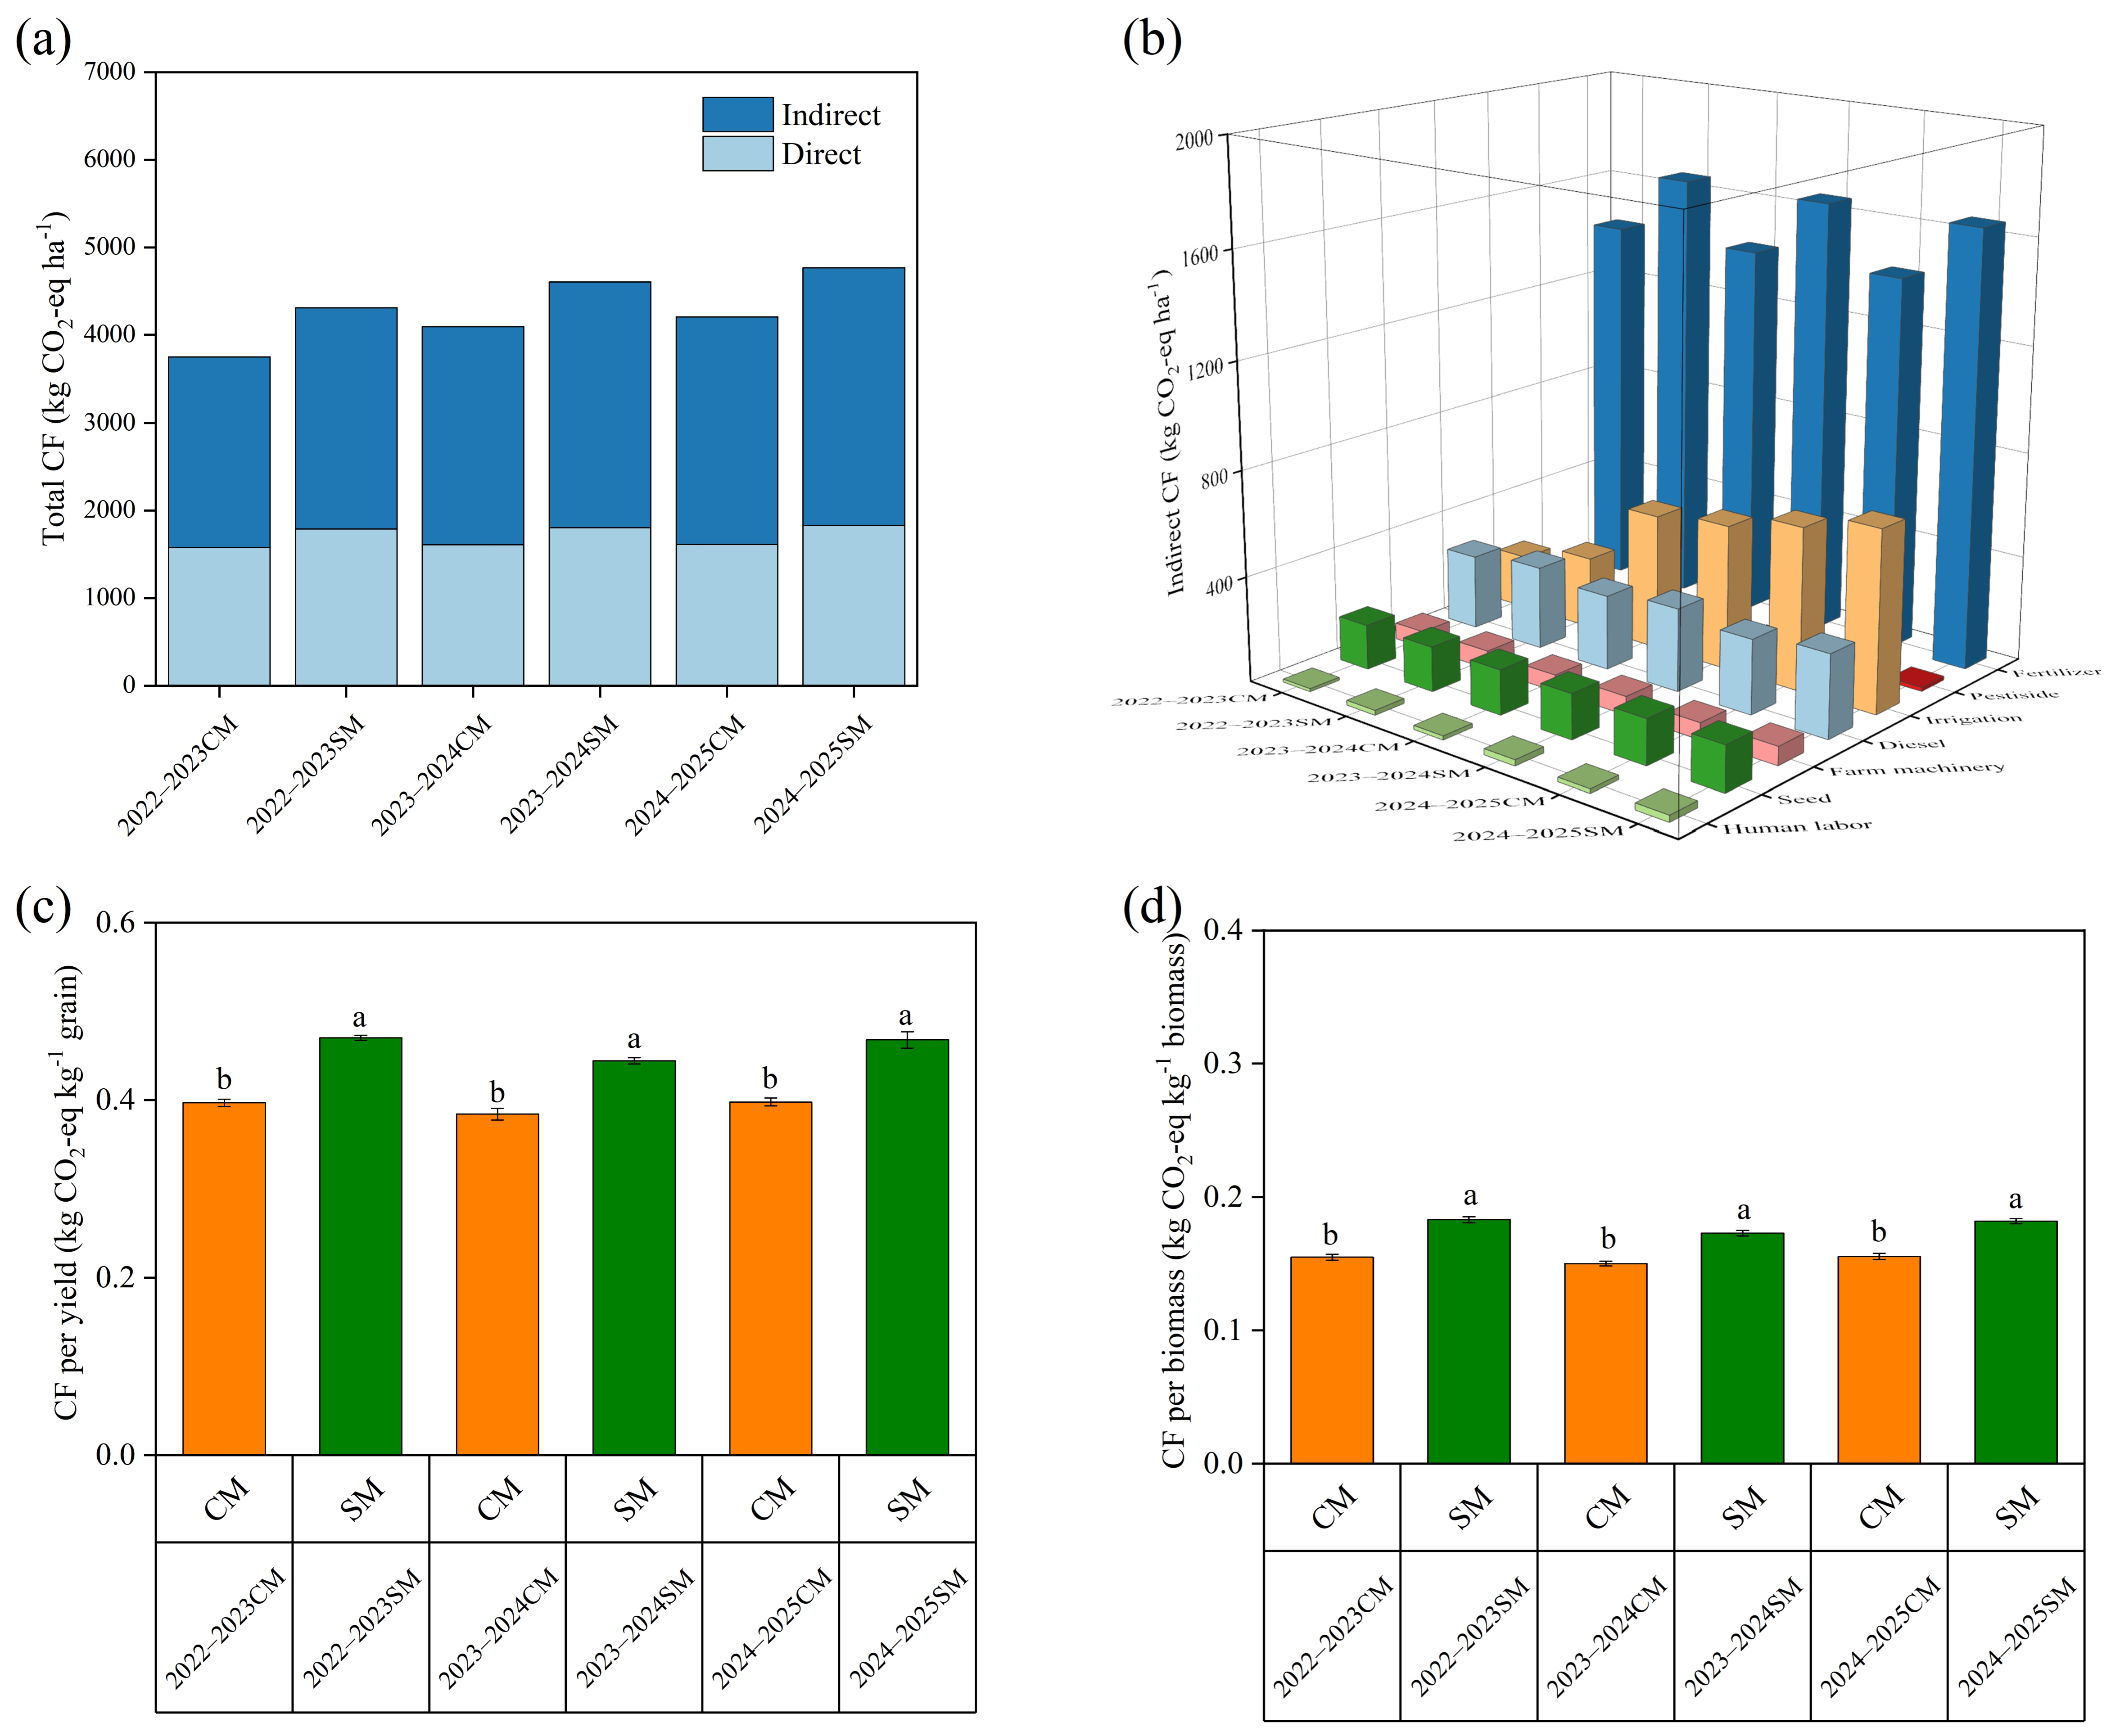
Estimated direct and indirect GHG emissions varied among growing seasons but were consistently lower under CM than under SM (Figure 5). Estimated direct emissions ranged from 1576.6 to 1614.1 kg CO2-eq ha−1 under CM and from 1788.6 to 1826.5 kg CO2-eq ha−1 under SM (Figure 5a). Indirect emissions were also lower under CM, ranging from 2172.9 to 2591.7 kg CO2-eq ha−1, compared with 2520.6–2941.0 kg CO2-eq ha−1 under SM. Fertilizer was the dominant source of indirect emissions, followed by irrigation, diesel, seed and agricultural machinery (Figure 5b).
Figure 5.
Estimated GHG emissions and carbon footprints of winter wheat under smallholder management (SM) and cooperative management (CM). (a) Direct, indirect and total greenhouse gas emissions; (b) contributions of agricultural inputs to indirect emissions; (c) carbon footprint per grain yield; and (d) carbon footprint per biomass yield.
The combined estimates of direct and indirect emissions yielded a lower total carbon footprint (CF) under CM in each season. In 2022–2023, 2023–2024 and 2024–2025, the total CF under CM was 3749.5, 4094.3 and 4205.8 kg CO2-eq ha−1, respectively, compared with 4309.1, 4605.1 and 4767.5 kg CO2-eq ha−1 under SM (Figure 5a). These differences represented reductions of 13.0%, 11.1% and 11.8%, respectively.
The estimated grain yield-scaled carbon footprint ranged from 0.384 to 0.398 kg CO2-eq kg−1 grain under CM and from 0.444 to 0.470 kg CO2-eq kg−1 grain under SM (Figure 5c). Values were 13.5–15.6% lower under CM, with significant differences between the two systems in each growing season (p < 0.05). The biomass-scaled carbon footprint was likewise lower under CM in all three seasons (p < 0.05; Figure 5d). Mean changes in soil organic carbon from 2022 to 2025 were positive under both management systems. The mean increase was numerically greater under CM, but the between-system difference was not statistically significant (p > 0.05; Figure S1).
3.5. Life Cycle Assessment
Estimated midpoint environmental impacts were 10.1–12.9% lower under CM than under SM across the 18 assessed categories (Table 2). Climate change impact decreased from 6400 to 5650 kg CO2-eq, corresponding to an 11.7% reduction. Estimated terrestrial acidification, freshwater eutrophication and marine eutrophication impacts were reduced by 11.9%, 12.3% and 12.0% lower under CM, respectively. Human toxicity and particulate matter formation were 11.9% and 11.5% lower under CM, respectively. The largest relative reduction occurred in marine ecotoxicity (12.9%), followed by terrestrial and freshwater ecotoxicity (both 12.5%), whereas photochemical oxidant formation showed the smallest reduction (10.1%).
Table 2.
Midpoint environmental impacts of wheat production under cooperative management (CM) and smallholder management (SM).
Modelled resource-related impacts were also lower under CM. Water depletion was 3790 m3 ha−1 under CM and 4280 m3 ha−1 under SM, representing an 11.4% reduction. Metal and fossil depletion were reduced by 12.1% and 11.4%, respectively. Agricultural land occupation, urban land occupation and natural land transformation were by 11.7%, 12.4% and 10.8% lower, respectively.
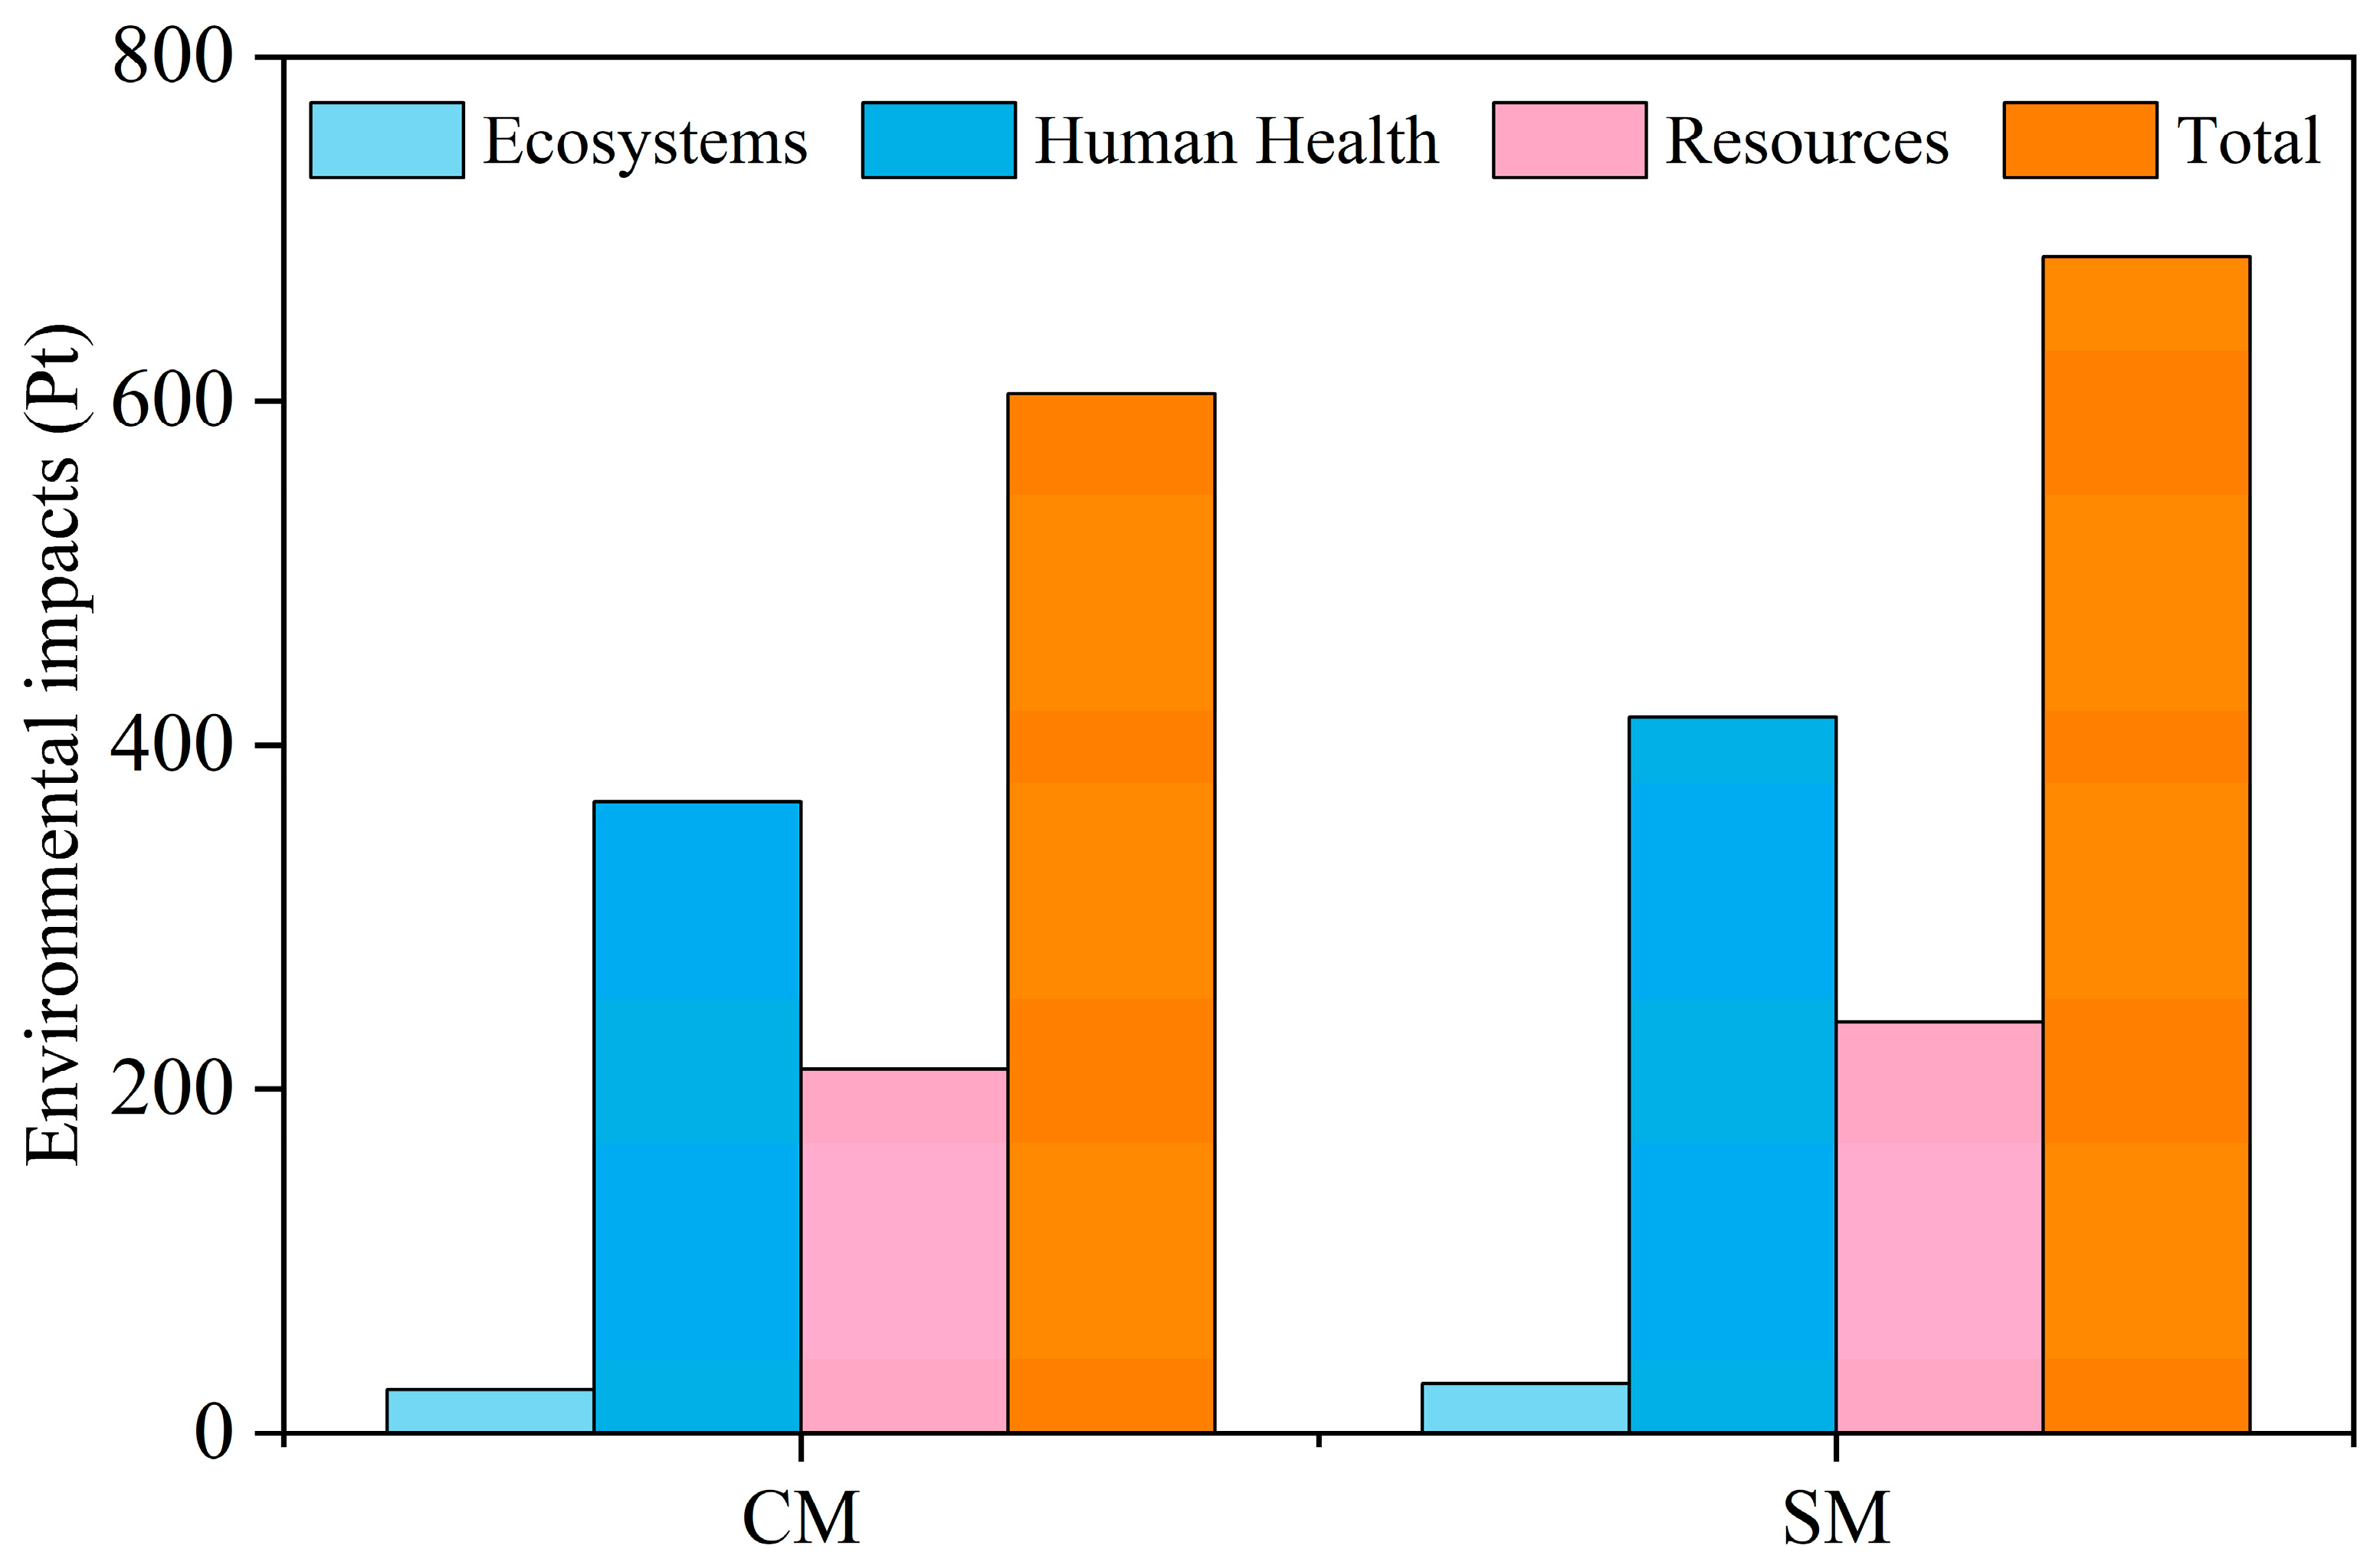
At the endpoint level, CM had lower modelled damage scores for human health, ecosystems and resources (Figure 6). The total normalized and weighted score was approximately 604.4 Pt under CM and 683.8 Pt under SM, representing an 11.6% reduction. Human health and resources contributed approximately 61% and 35% of the total score, respectively, under both systems, with ecosystems accounting for the remaining share.
Figure 6.
Endpoint environmental impacts of wheat production under cooperative management (CM) and smallholder management (SM).
4. Discussion
4.1. Crop Productivity and Economic Performance Under Contrasting Management Packages
The CM package combined higher winter wheat output with lower recorded production costs than the SM package (Figure 2 and Figure 3). The modest yield and biomass differences occurred in all three seasons, suggesting a consistent contrast within the conditions studied rather than demonstrating broader yield stability. Similar improvements have been reported in other agricultural systems, in which cooperative participation and coordinated production services enhanced crop yield or technical efficiency by improving farmers’ access to agricultural information, machinery services and standardized production practices [7,9,33]. Under SM, decisions concerning seeding, fertilization, irrigation, pesticide application and machinery use were based primarily on the farmer’s experience and customary local practices. Limited coordination among operations may contribute to delayed operations, precautionary input use and mismatches between resource supply and crop demand [14,34]. By contrast, CM combined standardized production protocols with technical supervision and coordinated machinery services. These features may have improved the timing of crop establishment and subsequent operations, while coordinated irrigation and fertilization may have better aligned resource supply with crop demand [7,35].
The economic advantage observed under CM was substantially greater than its productivity advantage. Because net income is calculated after deducting input costs, moderate revenue gains combined with cost savings can produce a much larger proportional increase in net income without implying a comparably large biological response. The larger proportional difference in net income reflected the combined effects of higher grain revenue and lower production costs, particularly expenditure on machinery, labour and pesticides. Cooperative-operation labour and technical supervision were included under labour costs, while machinery service charges and ownership or rental expenses were included under machinery costs. Coordinated procurement and field operations offer potential explanations for these cost savings [7,14]. Previous evidence linking cooperatives to lower transaction costs and improved access to machinery services provides context for this interpretation [36,37], but these mechanisms were not quantified independently here. The sensitivity analysis showed that the net-income advantage persisted when aggregate input prices or grain prices were varied separately by ±10% and ±20% (Table 3). The greater sensitivity of net income to grain-price changes indicates that output-market conditions remain important despite lower production costs. This analysis does not establish robustness to separate changes in specific input prices or simultaneous adverse price changes.
Table 3.
Sensitivity of net income to ±10% and ±20% changes in aggregate input prices or grain prices under cooperative management (CM) and smallholder management (SM).
The coexistence of lower input requirements and higher crop output is consistent with the potential to reduce low-return inputs through improved management [9]. However, higher yield under CM does not establish that any individual input was excessive under SM, because changes in input amounts occurred alongside changes in their timing and coordination. The observed contrast therefore describes the comparative performance of the management packages without establishing an independent effect of cooperative organization. For smallholders, a practical route to implementing the package could be to obtain technical guidance and coordinated machinery services through a cooperative or service provider, reducing the need to purchase machinery individually. Its financial feasibility nevertheless depends on service availability, local charges and whether production-cost savings and additional grain revenue exceed implementation costs. Moreover, cooperative-level overheads and establishment costs were not separately allocated beyond expenses already captured in the recorded categories; including additional allocated costs could narrow the estimated economic advantage.
4.2. Energy Performance and Estimated Carbon Footprints Under Contrasting Management Packages
The energy advantage of the CM package reflected lower external energy requirements combined with higher crop output (Figure 4). This distinction matters because reducing energy inputs alone does not establish improved production performance. Previous assessments of cereal production have identified fertilizer, irrigation electricity and diesel as important contributors to energy demand [3,38]. Du et al. (2023) similarly reported lower energy inputs and higher energy-use efficiency when cooperative production was combined with improved agronomic practices in a wheat–rice system [7]. The present comparison is consistent with that finding, providing additional evidence from winter wheat under the conditions studied.
Fertilizer, diesel, seed and agricultural machinery collectively accounted for approximately 90% of total energy input under both management systems. Their similar combined shares suggest that CM had lower total energy demand while retaining the same dominant input categories. In the western Indo-Gangetic Plains of India, for example, irrigation and fertilizer accounted for approximately 41–44% and 32–40% of total energy input, respectively, and management-induced reductions in these components markedly improved system-level energy efficiency [39]. Differences in the relative importance of these inputs reflect variation in irrigation technology, fertilizer application and mechanization, indicating that priorities for energy conservation should be identified within each production system. Fertilizer was the largest energy input in the present study, reinforcing its importance as a target for reducing external energy requirements [3,5,10]. Nevertheless, lower energy inputs under CM were associated with fertilizers, seed, pesticides, labour and field operations rather than a single input category. The implication is that fertilizer management should be considered alongside operational decisions that determine fuel, machinery and other input requirements.
Energy savings are particularly valuable when they are achieved without compromising crop output [9,26]. Some low-input practices have reduced energy consumption and carbon footprints while also decreasing wheat yield [40,41], illustrating why input reduction should be assessed together with productive performance. Net energy measures the absolute energy surplus, whereas energy-use efficiency and energy productivity describe output relative to energy investment. Their concurrent improvement under CM indicates a higher calculated energy surplus per hectare and greater output per unit of external energy input. These indicators describe the performance of the complete package and do not identify which management component produced the improvement.
The lower area- and yield-scaled carbon footprints provide complementary interpretations of the estimated emissions (Figure 5). The area-scaled carbon footprint quantifies GHG emissions per hectare within the specified accounting boundary, whereas a yield-scaled footprint measures the emissions associated with producing a unit of grain [26]. A management system may reduce emissions per hectare but fail to reduce emissions per unit of product if the reduction is accompanied by a yield penalty. Here, lower estimated emissions coincided with higher grain yield, so the footprint advantage persisted on a product basis. This conclusion remains conditional on the emission factors and accounting assumptions used.
The estimated reductions are consistent with previous life-cycle and field-based assessments that identified nitrogen fertilizer, irrigation energy and diesel consumption as major GHG-emission hotspots in cereal production [7,40]. Fertilizer was the dominant source of indirect emissions in the present study and also contributed to estimated direct and indirect N2O emissions following field application. Within the accounting framework, lower fertilizer inputs reduce both upstream manufacturing emissions and estimated field emissions associated with nitrogen application [17,32]. Reduced irrigation and fuel requirements can provide additional savings in electricity-related and fossil-fuel emissions. Because field emissions were calculated rather than measured, these relationships explain the inventory-based estimates rather than demonstrate changes in actual N2O or CO2 fluxes.
4.3. Modelled Life-Cycle Environmental Impacts and Study Limitations
The lower midpoint estimates under CM extended the comparison beyond GHG emissions to pollution- and resource-related impacts (Table 2). None of the 18 assessed categories had a higher point estimate under CM under the selected modelling assumptions. However, this pattern represents a comparison of point estimates, rather than robust evidence that environmental trade-offs are absent. Recent comparisons of wheat production systems similarly demonstrate the importance of evaluating multiple impact categories and production functions, because conclusions based on a single indicator may overlook environmental trade-offs [19,41].
The midpoint pattern is consistent with the combined reductions in fertilizer, irrigation and other agricultural inputs under CM. Lower input requirements can reduce burdens associated with upstream production as well as field operations and emissions [20]. Previous wheat assessments identifying electricity, chemical fertilizers and diesel as environmental hotspots support considering these inputs jointly [11,42]. However, the aggregate results cannot identify the processes responsible for the lower estimates in individual midpoint categories. In particular, the largest relative reduction in marine ecotoxicity does not establish pesticide management as its principal cause. Process-level contribution analysis is needed to distinguish the roles of fertilizer production, irrigation electricity, fuel use and field emissions and identify priorities for further improvement.
The lower endpoint score summarizes the modelled differences at the damage-assessment level (Figure 6). Human health and resources accounted for approximately 61% and 35% of the total score, respectively. Their similar shares under both systems indicate lower overall modelled damage without a substantial difference in its weighted composition. These shares reflect normalized and weighted contributions, rather than observed health outcomes or the intrinsic importance of each damage category. Endpoint scores should therefore be interpreted alongside the midpoint results and with recognition of their dependence on normalization and weighting choices [43]. They provide a complementary summary, rather than independent confirmation of environmental improvement.
The lower modelled environmental burdens occurred alongside higher grain yield and net income. Comparable opportunities to improve environmental performance through input management have been reported for improved fertilization and straw management in smallholder wheat production [44,45]. However, Nadi et al. (2026) identified trade-offs among economic returns, resource use, emissions and nutritional performance in irrigated and rainfed wheat systems [46]. The contribution of the present study is the joint assessment of t production, economic, energy and environmental outcomes within two management packages implemented under actual production conditions. Their favourable association under CM does not establish that equivalent outcomes will occur under other resource constraints, management arrangements or modelling assumptions.
Nevertheless, the benefits observed here reflect the combined effects of the CM management package, and the experimental design does not separate organizational effects from those of individual agronomic practices. The single-site, three-season comparison also limits inference about the persistence and transferability of the observed patterns across soil, climatic and farming conditions. Environmental impacts were estimated using activity data, emission factors and life-cycle modelling, and LCA parameter uncertainty was not quantified. The supplementary soil organic carbon changes do not establish changes in soil carbon stocks or long-term soil fertility. Future studies should combine direct N2O and CO2 monitoring with assessments of soil carbon stocks and nitrogen balances. Validation across multiple independent fields, soil types and climatic conditions, together with evaluation of full implementation costs and farmers’ adoption constraints, is needed before broader management recommendations can be made.
5. Conclusions
A three-season field assessment at a single site in the NCP showed that cooperative management (CM) package was associated with higher winter wheat productivity and profitability, lower energy requirements and lower modelled environmental impacts than the smallholder management (SM) package under the conditions studied. Compared with SM, grain yield and aboveground biomass under CM were 2.8–3.7% and 2.5–3.2% higher, respectively. Higher grain revenue and lower recorded production costs were associated with 30.8–38.8% higher net income and a 60.3–72.6% higher net benefit–cost ratio. Total energy input was 14.2–15.6% lower under CM, whereas energy output was 2.5–3.3% higher. Estimated total and grain yield-scaled carbon footprints were 11.1–13.0% and 13.5–15.6% lower, respectively. Life cycle assessment extended these environmental benefits beyond GHG emissions: CM reduced all 18 midpoint impacts by 10.1–12.9% and the total endpoint score by 11.6%, with lower damage scores for human health, ecosystems and resources. Together, these findings indicate that the CM management package can improve wheat productivity and profitability while reducing energy requirements and life-cycle environmental burdens. Future studies should evaluate the persistence and transferability of these findings through long-term, multi-site comparisons incorporating direct emission measurements, soil carbon dynamics, full cooperative operating costs and farmers’ willingness and capacity to adopt the practices.
Supplementary Materials
The following supporting information can be downloaded at: https://www.mdpi.com/article/10.3390/agriculture16212361/s1, Table S1. Comparison of agronomic practices and machinery inputs for winter wheat under cooperative system (CM) and smallholder system (SM); Table S2. Inputs for winter wheat under cooperative system (CM) and smallholder system (SM); Table S3. Grain yield, biomass yield, total input cost, gross return, net income and net benefit–cost ratio (NBCR) for winter wheat under cooperative system (CM) and smallholder system (SM); Table S4. Endpoint environmental impacts of wheat production under cooperative management (CM) and smallholder management (SM); Figure S1. Variation in soil organic carbon of winter wheat under smallholder management (SM) and cooperative management (CM).
Author Contributions
Conceptualization, J.L., Z.S., X.S., and B.S.; methodology, J.L. and Z.S.; software, Z.W. and J.Z.; formal analysis, Y.H.; investigation, J.L. and Z.S.; writing—original draft preparation, S.L., Z.W., J.Z., J.L., and A.K.M.H.; writing—review and editing, S.L., Z.S., B.S., X.S., and A.K.M.H.; supervision, Z.S., X.S., and B.S., and Y.H.; funding acquisition, S.L., Z.S., and Y.H. All authors have read and agreed to the published version of the manuscript.
Funding
This research was funded by project (ZR2026QC0434) supported by Shandong Provincial Natural Science Foundation, Natural Science Foundation of Henan Province (No. 262300422036), and the Agricultural Science and Technology Innovation Program (ASTIP).
Data Availability Statement
The data presented in this study are available from the corresponding author upon reasonable request. The data are not publicly available due to the fact that they originate from field experiments and form part of a broader research dataset that is still being analysed for further publications.
Acknowledgments
The authors used an AI-assisted tool solely for language editing. No scientific content or interpretation was generated by AI. The authors take full responsibility for the manuscript.
Conflicts of Interest
The authors declare no conflicts of interest.
References
- Liu, X.; Ma, J.; Fan, Z.; Li, Z.; Wang, T.; Sun, M.; Du, R.; Huang, X.; Zhen, W.; Wang, Y. Integrated assessment of productivity, economic and environmental consequences of alternative cropping systems in the North China Plain. Farming Syst. 2026, 4, 100215. [Google Scholar] [CrossRef] [Scilit]
- Ru, C.; Liu, Y.; Wang, W.; Hu, X. Moderate intermittent water deficit enhances dry matter remobilization, nitrogen uptake, and water and nitrogen use efficiency in winter wheat. Agric. Commun. 2025, 3, 100098. [Google Scholar] [CrossRef] [Scilit]
- Rathore, V.S.; Nathawat, N.S.; Shekhawat, R.S.; Yadav, B.M.; Kumar, D.; Kumar, M.; Lal, B.; Gautam, P.; Reager, M.L.; Soni, M.L.; et al. Energy budgeting and environmental impact of Indian mustard production under varying deficit irrigation and nitrogen application rates in north-western India. Energy 2025, 331, 137054. [Google Scholar] [CrossRef] [Scilit]
- Wang, D.; Liu, S.; Guo, M.; Cheng, Y.; Shi, L.; Li, J.; Yu, Y.; Wu, S.; Dong, Q.; Ge, J.; et al. Optimizing Nitrogen Fertilization and Irrigation Practices for Enhanced Winter Wheat Productivity in the North China Plain: A Meta-Analysis. Plants 2025, 14, 1686. [Google Scholar] [CrossRef] [Scilit] [PubMed]
- Liu, J.; Si, Z.; Wu, L.; Fu, Y.; Zhang, Y.; Kpalari, D.F.; Wu, X.; Cao, H.; Gao, Y.; Duan, A. Application of resource-environmental-economic perspective for optimal water and nitrogen rate under high-low seedbed cultivation in winter wheat. Agric. Water Manag. 2024, 298, 108865. [Google Scholar] [CrossRef] [Scilit]
- Wang, Y.; Peng, Y.; Lin, J.; Wang, L.; Jia, Z.; Zhang, R. Optimal nitrogen management to achieve high wheat grain yield, grain protein content, and water productivity: A meta-analysis. Agric. Water Manag. 2023, 290, 108587. [Google Scholar] [CrossRef] [Scilit]
- Du, X.; Xi, M.; Kong, L.; Chen, X.; Zhang, L.; Zhang, H.; Dai, Q.; Wu, W. Energy budgeting and carbon footprint of different wheat–rice cropping systems in China. Sci. Total Environ. 2023, 879, 163102. [Google Scholar] [CrossRef] [Scilit] [PubMed]
- Sun, X.; Ritzema, H.; Huang, X.; Bai, X.; Hellegers, P. Assessment of farmers’ water and fertilizer practices and perceptions in the North China Plain. Irrig. Drain. 2022, 71, 980–996. [Google Scholar] [CrossRef] [Scilit]
- Li, S.; Abubakar, S.A.; Li, H.; Si, Z.; Li, S.; Wang, G.; Zhou, T.; Duan, F.; Ma, Q.; Si, B. Energy efficiency, carbon footprint, and profitability of winter wheat under different production types and cultivation patterns: A 12-year field study. Energy 2026, 353, 141029. [Google Scholar] [CrossRef] [Scilit]
- Jin, Z.; Yue, R.; Ma, Z.; Cheng, S.; Khan, M.N.; Nie, L. Effect of water and nitrogen coupling on energy balance and production efficiency in rice production. Energy 2024, 288, 129739. [Google Scholar] [CrossRef] [Scilit]
- Wang, C.; Fu, Y.; Wang, H.; Ren, Y.; Zhang, Y.; Ma, Y.; Qiao, Y.; Dong, B.; Zhang, Y. Life cycle assessment of environment benefits in wheat production under water-saving and nitrogen-reducing practices in the North China Plain. Agric. Water Manag. 2025, 318, 109697. [Google Scholar] [CrossRef] [Scilit]
- Giongo, V.; Acosta, A.D.S.; Dossa, Á.A.; Santi, A.; Amaral, A.J.D.; Caierão, E.; Denardin, J.E.; Vieira, O.V.; Figueirêdo, M.C.B.D.; Folegatti, M.I.D.S.; et al. How can the environmental impacts of wheat cultivation and wheat flour production be reduced? A life cycle assessment of Brazilian wheat. J. Clean. Prod. 2025, 489, 144650. [Google Scholar] [CrossRef] [Scilit]
- Wang, H.; Ren, H.; Zhang, L.; Zhao, Y.; Liu, Y.; He, Q.; Li, G.; Han, K.; Zhang, J.; Zhao, B.; et al. A sustainable approach to narrowing the summer maize yield gap experienced by smallholders in the North China Plain. Agric. Syst. 2023, 204, 103541. [Google Scholar] [CrossRef] [Scilit]
- Zhang, Q.; Chu, Y.; Xue, Y.; Ying, H.; Chen, X.; Zhao, Y.; Ma, W.; Ma, L.; Zhang, J.; Yin, Y.; et al. Outlook of China’s agriculture transforming from smallholder operation to sustainable production. Glob. Food Secur. 2020, 26, 100444. [Google Scholar] [CrossRef] [Scilit]
- Han, K.; Li, X.; Jia, L.; Yu, D.; Xu, W.; Chen, H.; Song, T.; Liu, P. Optimizing tillage and fertilization practices to improve the carbon footprint and energy efficiency of wheat–maize cropping systems. J. Integr. Agric. 2025, 24, 3789–3802. [Google Scholar] [CrossRef] [Scilit]
- Guo, Z.; Liu, Y.; Meng, X.; Yang, X.; Ma, C.; Chai, H.; Li, H.; Ding, R.; Nazarov, K.; Zhang, X.; et al. The long-term nitrogen fertilizer management strategy based on straw return can improve the productivity of wheat-maize rotation system and reduce carbon emissions by increasing soil carbon and nitrogen sequestration. Field Crops Res. 2024, 317, 109561. [Google Scholar] [CrossRef] [Scilit]
- Wei, T.; Li, X.; Zhang, W.; Liu, L.; Li, S. Sustainable options for improving the economic benefit, energy and ecological efficiency of maize-based forage systems in the North China Plain. Energy 2025, 323, 135907. [Google Scholar] [CrossRef] [Scilit]
- Krzyżaniak, M.; Warmiński, K.; Olba-Zięty, E.; Białoskórski, P.; Stolarski, M.J. Life cycle assessment of camelina and spelt wheat in organic intercropping systems. Ind. Crops Prod. 2025, 231, 121198. [Google Scholar] [CrossRef] [Scilit]
- Zingale, S.; Ingrao, C.; Reguant-Closa, A.; Guarnaccia, P.; Nemecek, T. A multifunctional life cycle assessment of durum wheat cropping systems. Agron. Sustain. Dev. 2024, 44, 45. [Google Scholar] [CrossRef] [Scilit]
- Liu, J.; Duan, F.; Si, Z.; Fu, H.; Li, H.; Sun, X.; Zhou, T.; Li, H.; Abubakar, S.A.; Liu, Z.; et al. Identifying eco-optimal nitrogen and irrigation management for wheat production in the North China Plain. Agric. Water Manag. 2026, 335, 110736. [Google Scholar] [CrossRef] [Scilit]
- Du, X.; He, W.; Gao, S.; Liu, D.; Wu, W.; Tu, D.; Kong, L.; Xi, M. Raised bed planting increases economic efficiency and energy use efficiency while reducing the environmental footprint for wheat after rice production. Energy 2022, 245, 123256. [Google Scholar] [CrossRef] [Scilit]
- Kumar, R.; Mishra, J.S.; Mondal, S.; Meena, R.S.; Sundaram, P.K.; Bhatt, B.P.; Pan, R.S.; Lal, R.; Saurabh, K.; Chandra, N.; et al. Designing an ecofriendly and carbon-cum-energy efficient production system for the diverse agroecosystem of South Asia. Energy 2021, 214, 118860. [Google Scholar] [CrossRef] [Scilit]
- Tuti, M.D.; Prakash, V.; Pandey, B.M.; Bhattacharyya, R.; Mahanta, D.; Bisht, J.K.; Kumar, M.; Mina, B.L.; Kumar, N.; Bhatt, J.C.; et al. Energy budgeting of colocasia-based cropping systems in the Indian sub-Himalayas. Energy 2012, 45, 986–993. [Google Scholar] [CrossRef] [Scilit]
- Lal, R. Carbon emission from farm operations. Environ. Int. 2004, 30, 981–990. [Google Scholar] [CrossRef] [Scilit] [PubMed]
- Yin, W.; Chai, Q.; Fan, Z.; Hu, F.; Fan, H.; Guo, Y.; Zhao, C.; Yu, A. Energy budgeting, carbon budgeting, and carbon footprints of straw and plastic film management for environmentally clean of wheat-maize intercropping system in northwestern China. Sci. Total Environ. 2022, 826, 154220. [Google Scholar] [CrossRef] [Scilit] [PubMed]
- Yang, L.; Jin, W.; Chen, X.; Song, W.; Yang, Y.; Zhou, J.; Kong, L.; Huang, Z.; Liu, R.; Du, X. Effect of soybean inclusion in cropping systems on productivity, profitability, and carbon footprints: A case study from the Huang-Huai-Hai Plain. Energy 2025, 316, 134422. [Google Scholar] [CrossRef] [Scilit]
- Pramanick, B.; Singh, D.; Choudhary, R.; Kumar, P.; Kishor, K.; Nanda, G.; Kumar, M. Synergistic effects of enterprise diversification and organic management on productivity, carbon balance, energy use, and soil health in integrated farming systems. J. Agric. Food Res. 2026, 30, 103217. [Google Scholar] [CrossRef] [Scilit]
- Gan, Y.; Liang, C.; Chai, Q.; Lemke, R.L.; Campbell, C.A.; Zentner, R.P. Improving farming practices reduces the carbon footprint of spring wheat production. Nat. Commun. 2014, 5, 5012. [Google Scholar] [CrossRef] [Scilit] [PubMed]
- Li, S.; Wu, J.; Wang, X.; Ma, L. Economic and environmental sustainability of maize-wheat rotation production when substituting mineral fertilizers with manure in the North China Plain. J. Clean. Prod. 2020, 271, 122683. [Google Scholar] [CrossRef] [Scilit]
- Mankong, P.; Fantke, P.; Ghose, A.; Soheilifard, F.; Oginah, S.A.; Phenrat, T.; Mungkalasiri, J.; Gheewala, S.H.; Prapaspongsa, T. Assessing life cycle impacts from toxic substance emissions in major crop production systems in Thailand. Sustain. Prod. Consum. 2024, 46, 717–732. [Google Scholar] [CrossRef] [Scilit]
- Huijbregts, M.A.J.; Steinmann, Z.J.N.; Elshout, P.M.F.; Stam, G.; Verones, F.; Vieira, M.; Zijp, M.; Hollander, A.; van Zelm, R. ReCiPe2016: A harmonised life cycle impact assessment method at midpoint and endpoint level. Int. J. Life Cycle Assess. 2017, 22, 138–147. [Google Scholar] [CrossRef] [Scilit]
- Li, S.; Wu, J.; Ma, L. Economic, energy and environmental consequences of shifting from maize-wheat to forage rotation in the North China Plain. J. Clean. Prod. 2021, 328, 129670. [Google Scholar] [CrossRef] [Scilit]
- Wanger, T.C.; Raveloaritiana, E.; Zeng, S.; Gao, H.; He, X.; Shao, Y.; Wu, P.; Wyckhuys, K.A.G.; Zhou, W.; Zou, Y.; et al. Co-benefits of agricultural diversification and technology for the environment and food security in China. Nat. Food 2024, 5, 965–968. [Google Scholar] [CrossRef] [Scilit] [PubMed]
- Zhang, W.; Qiao, Y.; Lakshmanan, P.; Yuan, L.; Liu, J.; Zhong, C.; Chen, X. Combing public-private partnership and large-scale farming increased net ecosystem carbon budget and reduced carbon footprint of maize production. Resour. Conserv. Recycl. 2022, 184, 106411. [Google Scholar] [CrossRef] [Scilit]
- Hu, L.-X.; Zhang, X.-H.; Zhou, Y.-H. Farm size and fertilizer sustainable use: An empirical study in Jiangsu, China. J. Integr. Agric. 2019, 18, 2898–2909. [Google Scholar] [CrossRef] [Scilit]
- He, Y.; Chen, Y. The Impact of Agricultural Cooperatives on Farmers’ Agricultural Revenue: Evidence from Rural China. Sustainability 2024, 16, 10979. [Google Scholar] [CrossRef] [Scilit]
- Ma, W.; Li, J.; Nnaji, A.P.; Setsoafia, E.D. The role of agricultural cooperatives in improving mechanization levels: Differences between outsourcing machinery services and household-owned machines. Ann. Public Coop. Econ. 2026, 97, 225–245. [Google Scholar] [CrossRef] [Scilit]
- Tutar, H.; Eren, Ö.; Er, H.; Gonulal, E.; Gokdogan, O. Field-based experimental greenhouse gas emissions and energy use efficiency study of sorghum x sudan grass hybrid growth in a semi-arid region. Energy 2025, 315, 134450. [Google Scholar] [CrossRef] [Scilit]
- Singh, R.; Singh, A.; Sheoran, P.; Fagodiya, R.K.; Rai, A.K.; Chandra, P.; Rani, S.; Yadav, R.K.; Sharma, P.C. Energy efficiency and carbon footprints of rice-wheat system under long-term tillage and residue management practices in western Indo-Gangetic Plains in India. Energy 2022, 244, 122655. [Google Scholar] [CrossRef] [Scilit]
- Xu, Y.; Xu, X.; Li, J.; Guo, X.; Gong, H.; Ouyang, Z.; Zhang, L.; Mathijs, E. Excessive synthetic fertilizers elevate greenhouse gas emissions of smallholder-scale staple grain production in China. J. Clean. Prod. 2023, 430, 139720. [Google Scholar] [CrossRef] [Scilit]
- di Cristofaro, M.; Marino, S.; Lima, G.; Mastronardi, L. Evaluating the impacts of different wheat farming systems through Life Cycle Assessment. J. Clean. Prod. 2024, 436, 140696. [Google Scholar] [CrossRef] [Scilit]
- Xiong, L.; Shah, F.; Zhao, Y.; Li, Z.; Zha, X.; Ye, M.; Wu, W. Sustainability analysis of irrigated and rainfed wheat production systems under varying levels of nitrogen fertilizer through coupling of emergy accounting and life cycle assessment. J. Clean. Prod. 2024, 447, 141423. [Google Scholar] [CrossRef] [Scilit]
- van Zelm, R.; Hennequin, T.; Huijbregts, M.A.J. Performing life cycle impact assessment with the midpoint and endpoint method ReCiPe. Nat. Protoc. 2025, 20, 3400–3411. [Google Scholar] [CrossRef] [Scilit] [PubMed]
- Medel-Jiménez, F.; Krexner, T.; Gronauer, A.; Kral, I. Life cycle assessment of four different precision agriculture technologies and comparison with a conventional scheme. J. Clean. Prod. 2024, 434, 140198. [Google Scholar] [CrossRef] [Scilit]
- Yu, C.; Xu, G.; Cai, M.; Li, Y.; Wang, L.; Zhang, Y.; Lin, H. Predicting environmental impacts of smallholder wheat production by coupling life cycle assessment and machine learning. Sci. Total Environ. 2024, 921, 171097. [Google Scholar] [CrossRef] [Scilit] [PubMed]
- Nadi, F.; Abad-González, J.; Pérez-Neira, D. Linking the energy-emissions-water-food security nexus to the economic return of wheat production in Iran: A nutritional LCA approach. Agric. Water Manag. 2026, 323, 110100. [Google Scholar] [CrossRef] [Scilit]

Disclaimer/Publisher’s Note: The statements, opinions and data contained in all publications are solely those of the individual author(s) and contributor(s) and not of MDPI and/or the editor(s). MDPI and/or the editor(s) disclaim responsibility for any injury to people or property resulting from any ideas, methods, instructions or products referred to in the content. |
© 2026 by the authors. Licensee MDPI, Basel, Switzerland. This article is an open access article distributed under the terms and conditions of the Creative Commons Attribution (CC BY) license.