


Abstract
Insufficient information is available regarding how land management categories influence soil properties in the Hetao Plain (HPYR) and the floodplain of the Yellow River (FPYR), two major agricultural regions of the Yellow River Basin located in arid to semi-arid and warm-temperate monsoon climatic zones, respectively. This study aimed to elucidate the chemical properties of cultivated land soils across the Yellow River agricultural zones. Soil organic matter (SOM), total nitrogen (TN), pH, and selected physical properties were quantified together with their associations with soil type, crop rotation, irrigation, and tillage. Marked differences in chemical properties were observed between the two regions. FPYR soils showed higher SOM and TN levels and lower pH than HPYR soils. The coefficient of variation in SOM was substantially greater in the HPYR than that in the FPYR, indicating stronger heterogeneity in the arid region. Semivariogram analysis revealed that TN exhibited significant positive spatial autocorrelation (Moran’s I = 0.511, p < 0.05) in the HPYR. Thus, soil properties in the Yellow River Basin reflect the combined influence of regional environmental context and local management practices. This observational study may inform region-specific management strategies that can improve soil quality and nutrient balance.
1. Introduction
The Yellow River Basin encompasses 11.93 million ha of arable land and has historically served as a critical grain and energy production base; in 2022, this region contributed 35.3% of the total grain output of China [1]. Intensive irrigation and crop rotation boost productivity but accelerate soil degradation within the Yellow River Basin, and recent studies have documented soil organic matter (SOM) deficiency [2], nitrogen surplus [3], and salinization [4] across the croplands in the basin. According to the 2024 China Statistical Yearbook, a large proportion of the arable land in this region is devoted to cereal crops, exacerbating soil nutrient imbalances. Given the diverse soil issues faced by different sections of the basin, more efficient agricultural management practices are urgently required. Addressing spatially heterogeneous challenges also requires an understanding of how management practices mechanistically regulate SOM, total nitrogen (TN), and pH dynamics, which are prerequisites for designing region-specific sustainable intensification strategies. Soil chemical properties are crucial indicators of soil fertility. For instance, Hammad et al. [5] selected soil pH, TN, available phosphorus, and SOM for soil fertility mapping. Soil chemical properties critically mediate agricultural–environmental interactions. For example, almost 50% of applied nitrogen fertilizers are lost to the environment, thereby accelerating eutrophication and atmospheric changes [6]. Furthermore, approximately 30% of global greenhouse gas emissions originate from the agricultural sector [7]. Thus, enhancing soil carbon sequestration through management practices offers dual mitigation by reducing emissions and stabilizing fragile ecosystems. For instance, intact saline crusts resist wind erosion up to Level 10 (wind speed ranging from 24.5 to 28.4 m/s on the Beaufort wind scale), but their disruption allows dust storms under Level 3 winds (wind speed ranging from 3.4 to 5.4 m/s) in northwest China [8], whereas SOM aggregation with minerals strengthens wind erosion resistance [9]. High-SOM soils form stable aggregates [10], which minimizes nutrient loss during extreme weather conditions. The limited arable land in China precludes large-scale farming, necessitating precise management via soil chemistry regulation. This is challenging given that the chemical properties of soils are influenced by numerous factors. For example, irrigation-driven biomass increases soil organic carbon (SOC) inputs [11], particularly in arid and semiarid regions where irrigation boosts SOC by 12–18% compared to rain-fed systems [12]. In addition, water-saving irrigation further optimizes nitrogen use [13]. Alavaisha et al. [14] found that the impacts of irrigation and fertilization on SOM and TN, as well as their interactions, depended on crop type. Thus, increasing crop diversity can improve soil nutrients and fertility [15], enhancing resilience to climate change [16].
The Hetao Plain (HPYR) and the floodplain of the Yellow River (FPYR), two primary agricultural regions in the middle–lower Yellow River Basin, exemplify contrasting agroecological dynamics shaped by centuries of cultivation [17,18]. The HPYR is located in an arid and semi-arid continental climate zone, experiencing scarce precipitation, intense evaporation, and complex terrain with large undulations [19]; in contrast, the FPYR is situated in a warm–temperate monsoon climate zone, with flat terrain and concurrent rainfall and heat [4]. These climatic, topographic, and hydrological differences drive distinct chemical distribution characteristics and migration patterns between the two regions. In the FPYR, abundant rainfall promotes surface chemical migration through runoff [20], with arable layer replenishment relying on flood sediments and fertilizer inputs. However, flood disturbances increase soil chemical variability, creating heterogeneous spatial patterns [21]. Li et al. [22] analyzed soil chemical properties under different land-use patterns (e.g., forest land, orchards, and irrigated land) in the FPYR and found low baseline SOM content (10–20 g/kg). The nutrient content was higher in lands with greater human input and more advanced management systems. Furthermore, irrigation in the FPYR correlates with greenhouse gas emissions and nutrient depletion [22]. Conversely, the HPYR has insufficient rainfall and high evaporation, and its irrigation-dependent system (primarily via water diversion from the Yellow River) induces vertical salt accumulation [23], with characteristic “surface crusting” under dominant vertical hydrological cycling [24]. Nutrient losses here predominantly stem from wind erosion and topsoil degradation [23]. Salinization in the HPYR shows strong SOC linkages that are addressable through deep tillage [25,26]. Gao et al. [3] also found that increased nitrogen application accelerated nitrogen loss in the Yellow River Basin. Therefore, although floods provide sufficient water for crop growth, these regions are severely affected by rainwater scouring; meanwhile, the HPYR faces the contrasting challenge of salt accumulation under irrigation-dependent agriculture.
While total phosphorus remains unaffected by management practices across soil depths [14], TN is highly sensitive to agricultural interventions [27,28,29]. SOM and TN predominantly respond to land-use patterns and soil pH governs microbial communities and nutrient availability [29], thereby regulating nutrient cycling and plant growth. These three indicators are especially sensitive to changes in management practices, and several previous studies, such as Gao et al. [3] and Yu et al. [30], have focused on them. We thus elected to observe the responses of SOM, TN, and pH to land management practices, and believed that these three indicators can represent the variation in major chemical properties across the main agricultural districts of the Yellow River Basin.
Soil chemical and physical properties are mainly determined by the history of soil formation with respect to natural processes [31], and are also influenced by human activity, particularly in regions with developed agriculture [32,33]. While existing studies on farmland management in the Yellow River Basin are extensive, they predominantly focus on individual river sections and lack systematic cross-regional comparisons. We therefore used systematic cross-regional comparisons to analyze how crop rotation, fertilization, and irrigation practices influence key soil chemical properties (SOM, TN, and pH) in two contrasting agricultural zones, the HPYR and FPYR. Although both regions represent quintessential Yellow River agricultural systems, they exhibit fundamental disparities in terms of climate, topography, soil, and hydrology. The objective of the study was to quantify SOM, soil TN and pH of cultivated land soils and distinguish their differences across the Yellow River agricultural zones. Agricultural management factors, such as crop rotation, irrigation, and tillage, were used to interpret their variations among different regions. Interviews and field studies were used to examine the land-use decisions among farmers and land management practices. We hypothesized the following: (i) soil chemical properties differ significantly between the HPYR and FPYR because of their contrasting environmental conditions; (ii) differences in management strategies, such as crop rotation, irrigation, and tillage, are associated with variations in SOM, TN, and pH; and (iii) soil heterogeneity is greater in the more environmentally constrained HPYR than in the FPYR.
2. Materials and Methods
2.1. Study Area
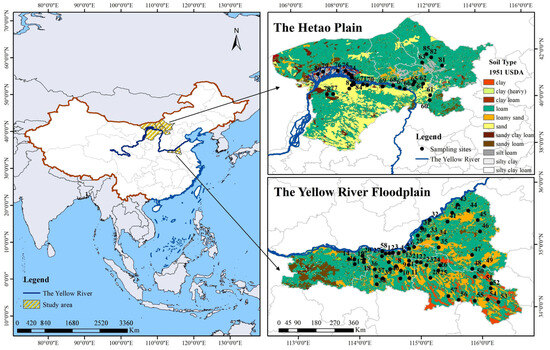
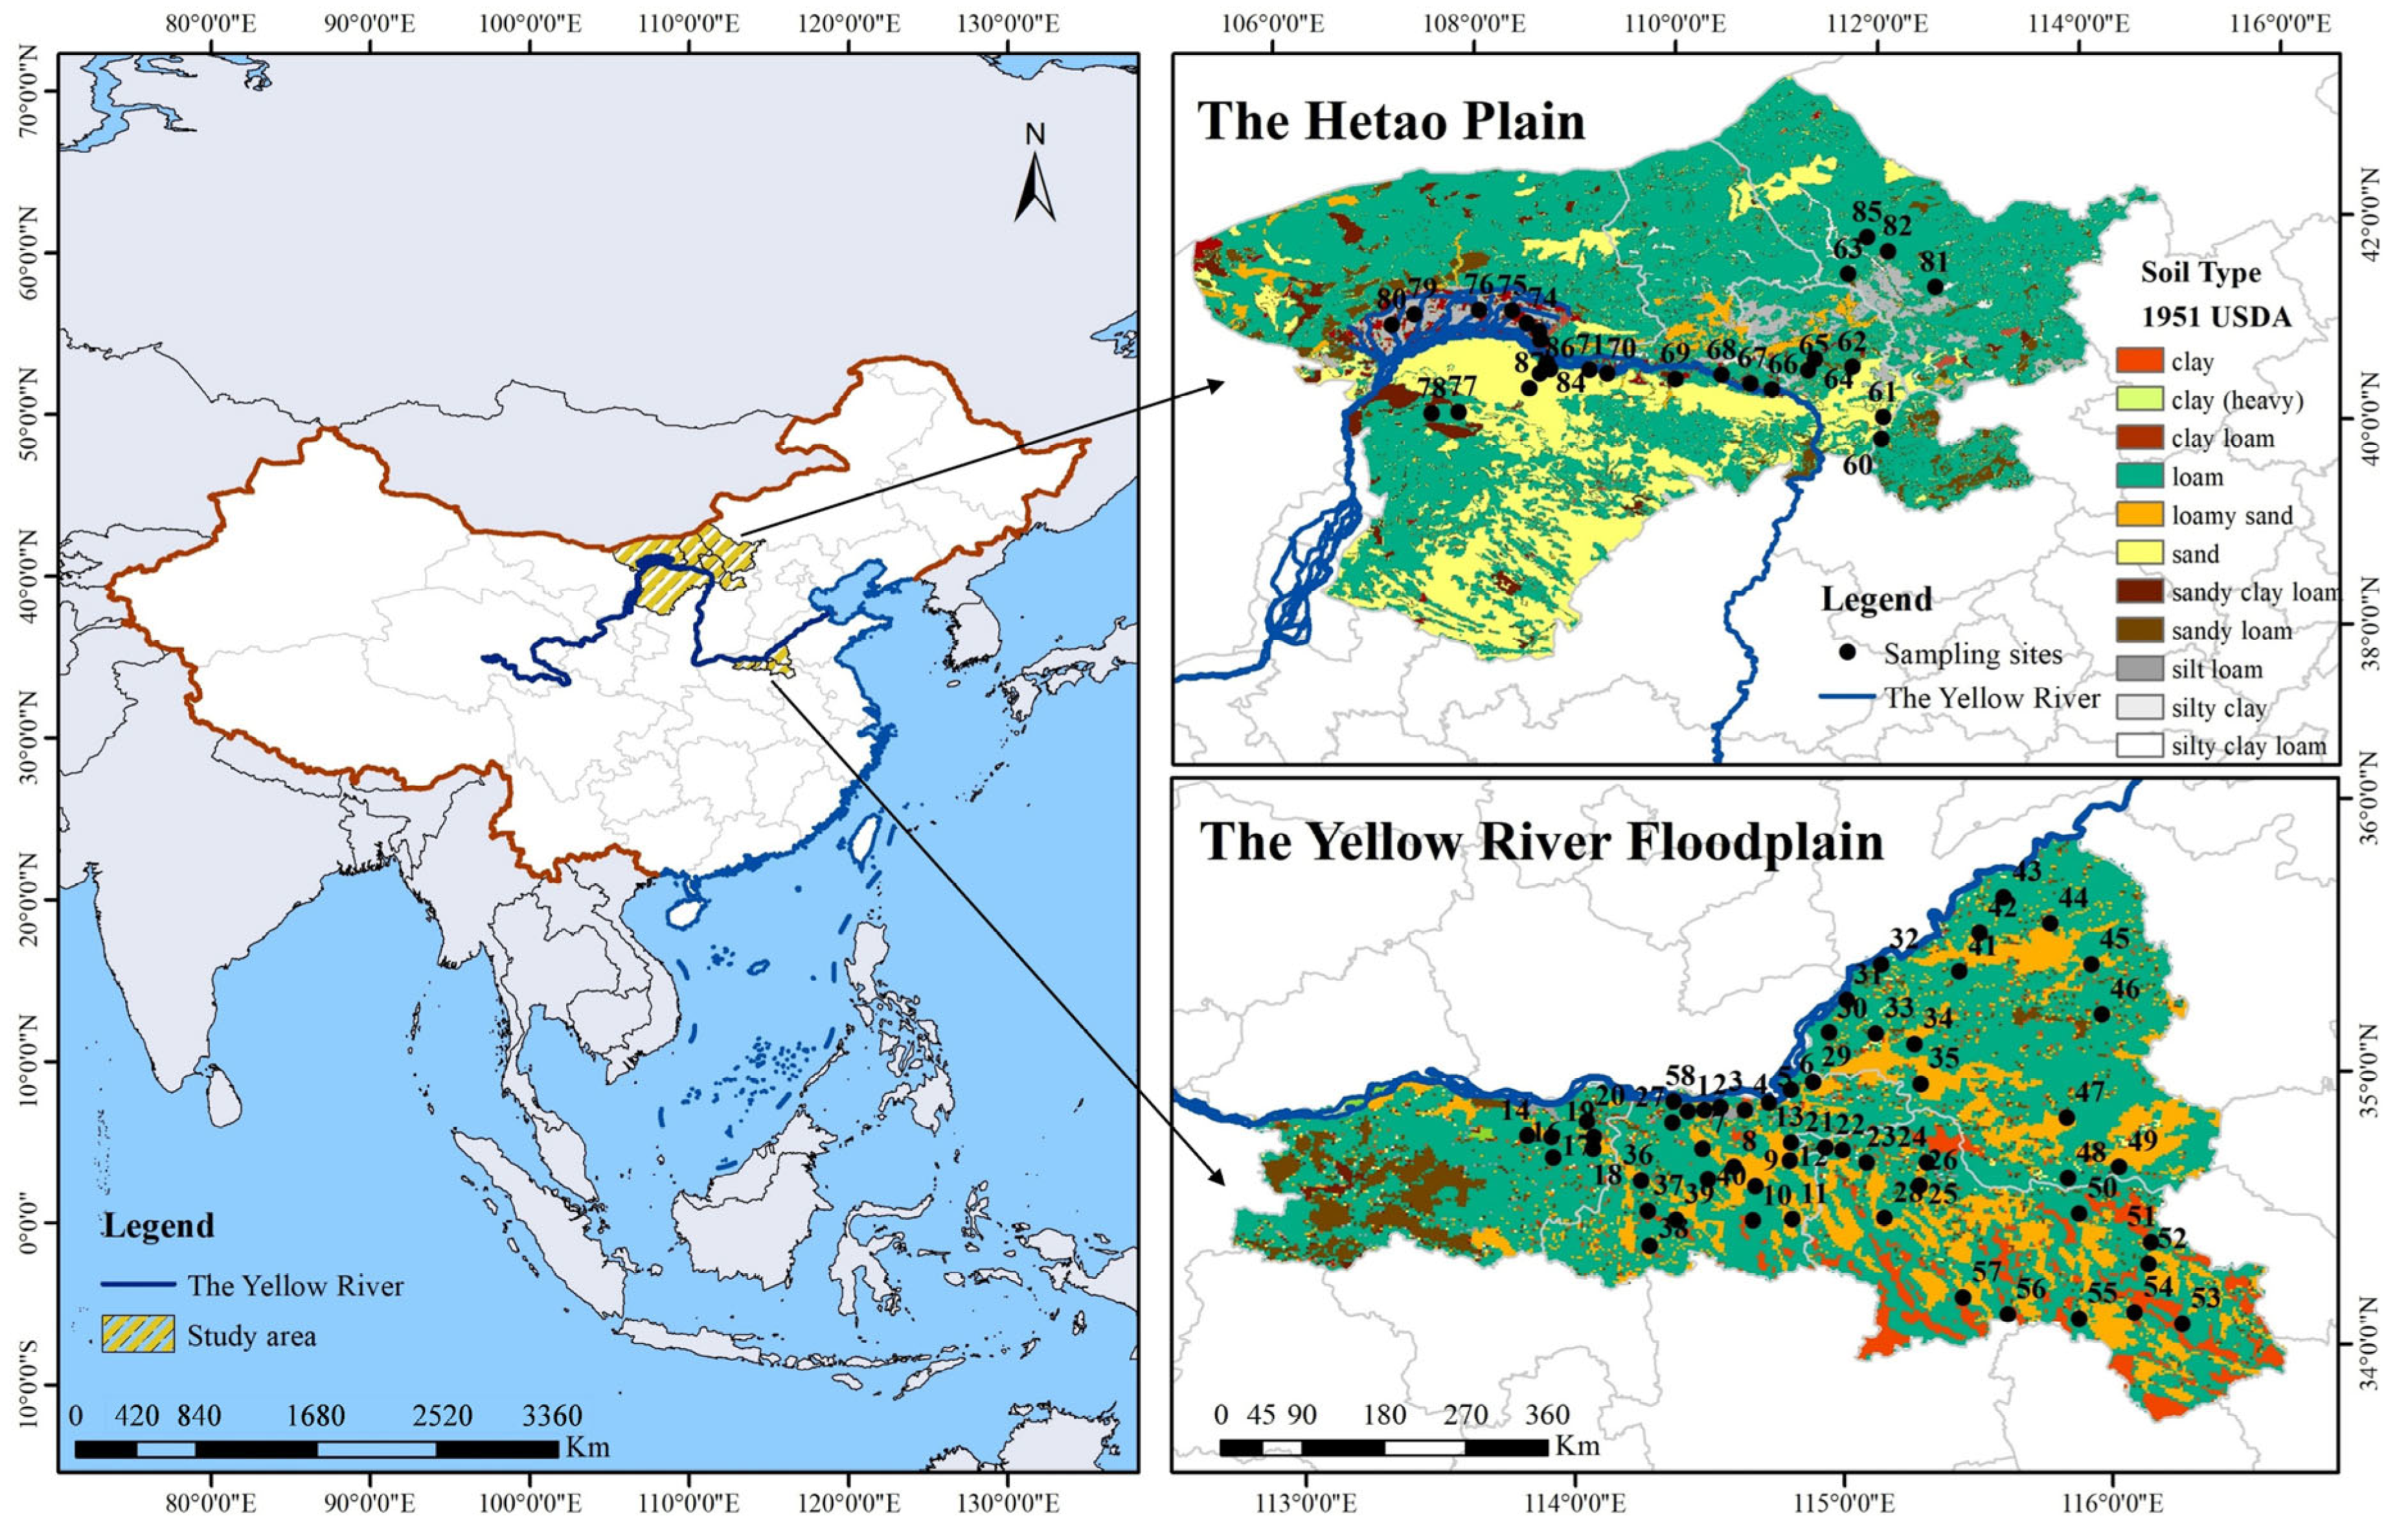
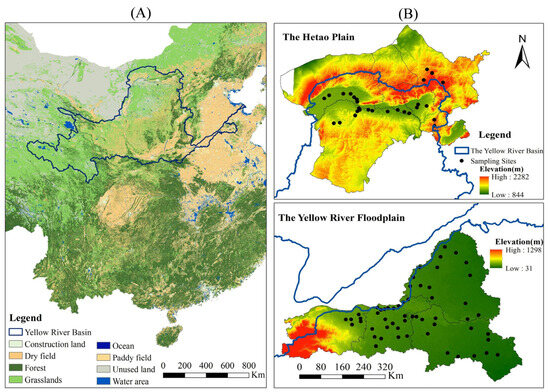
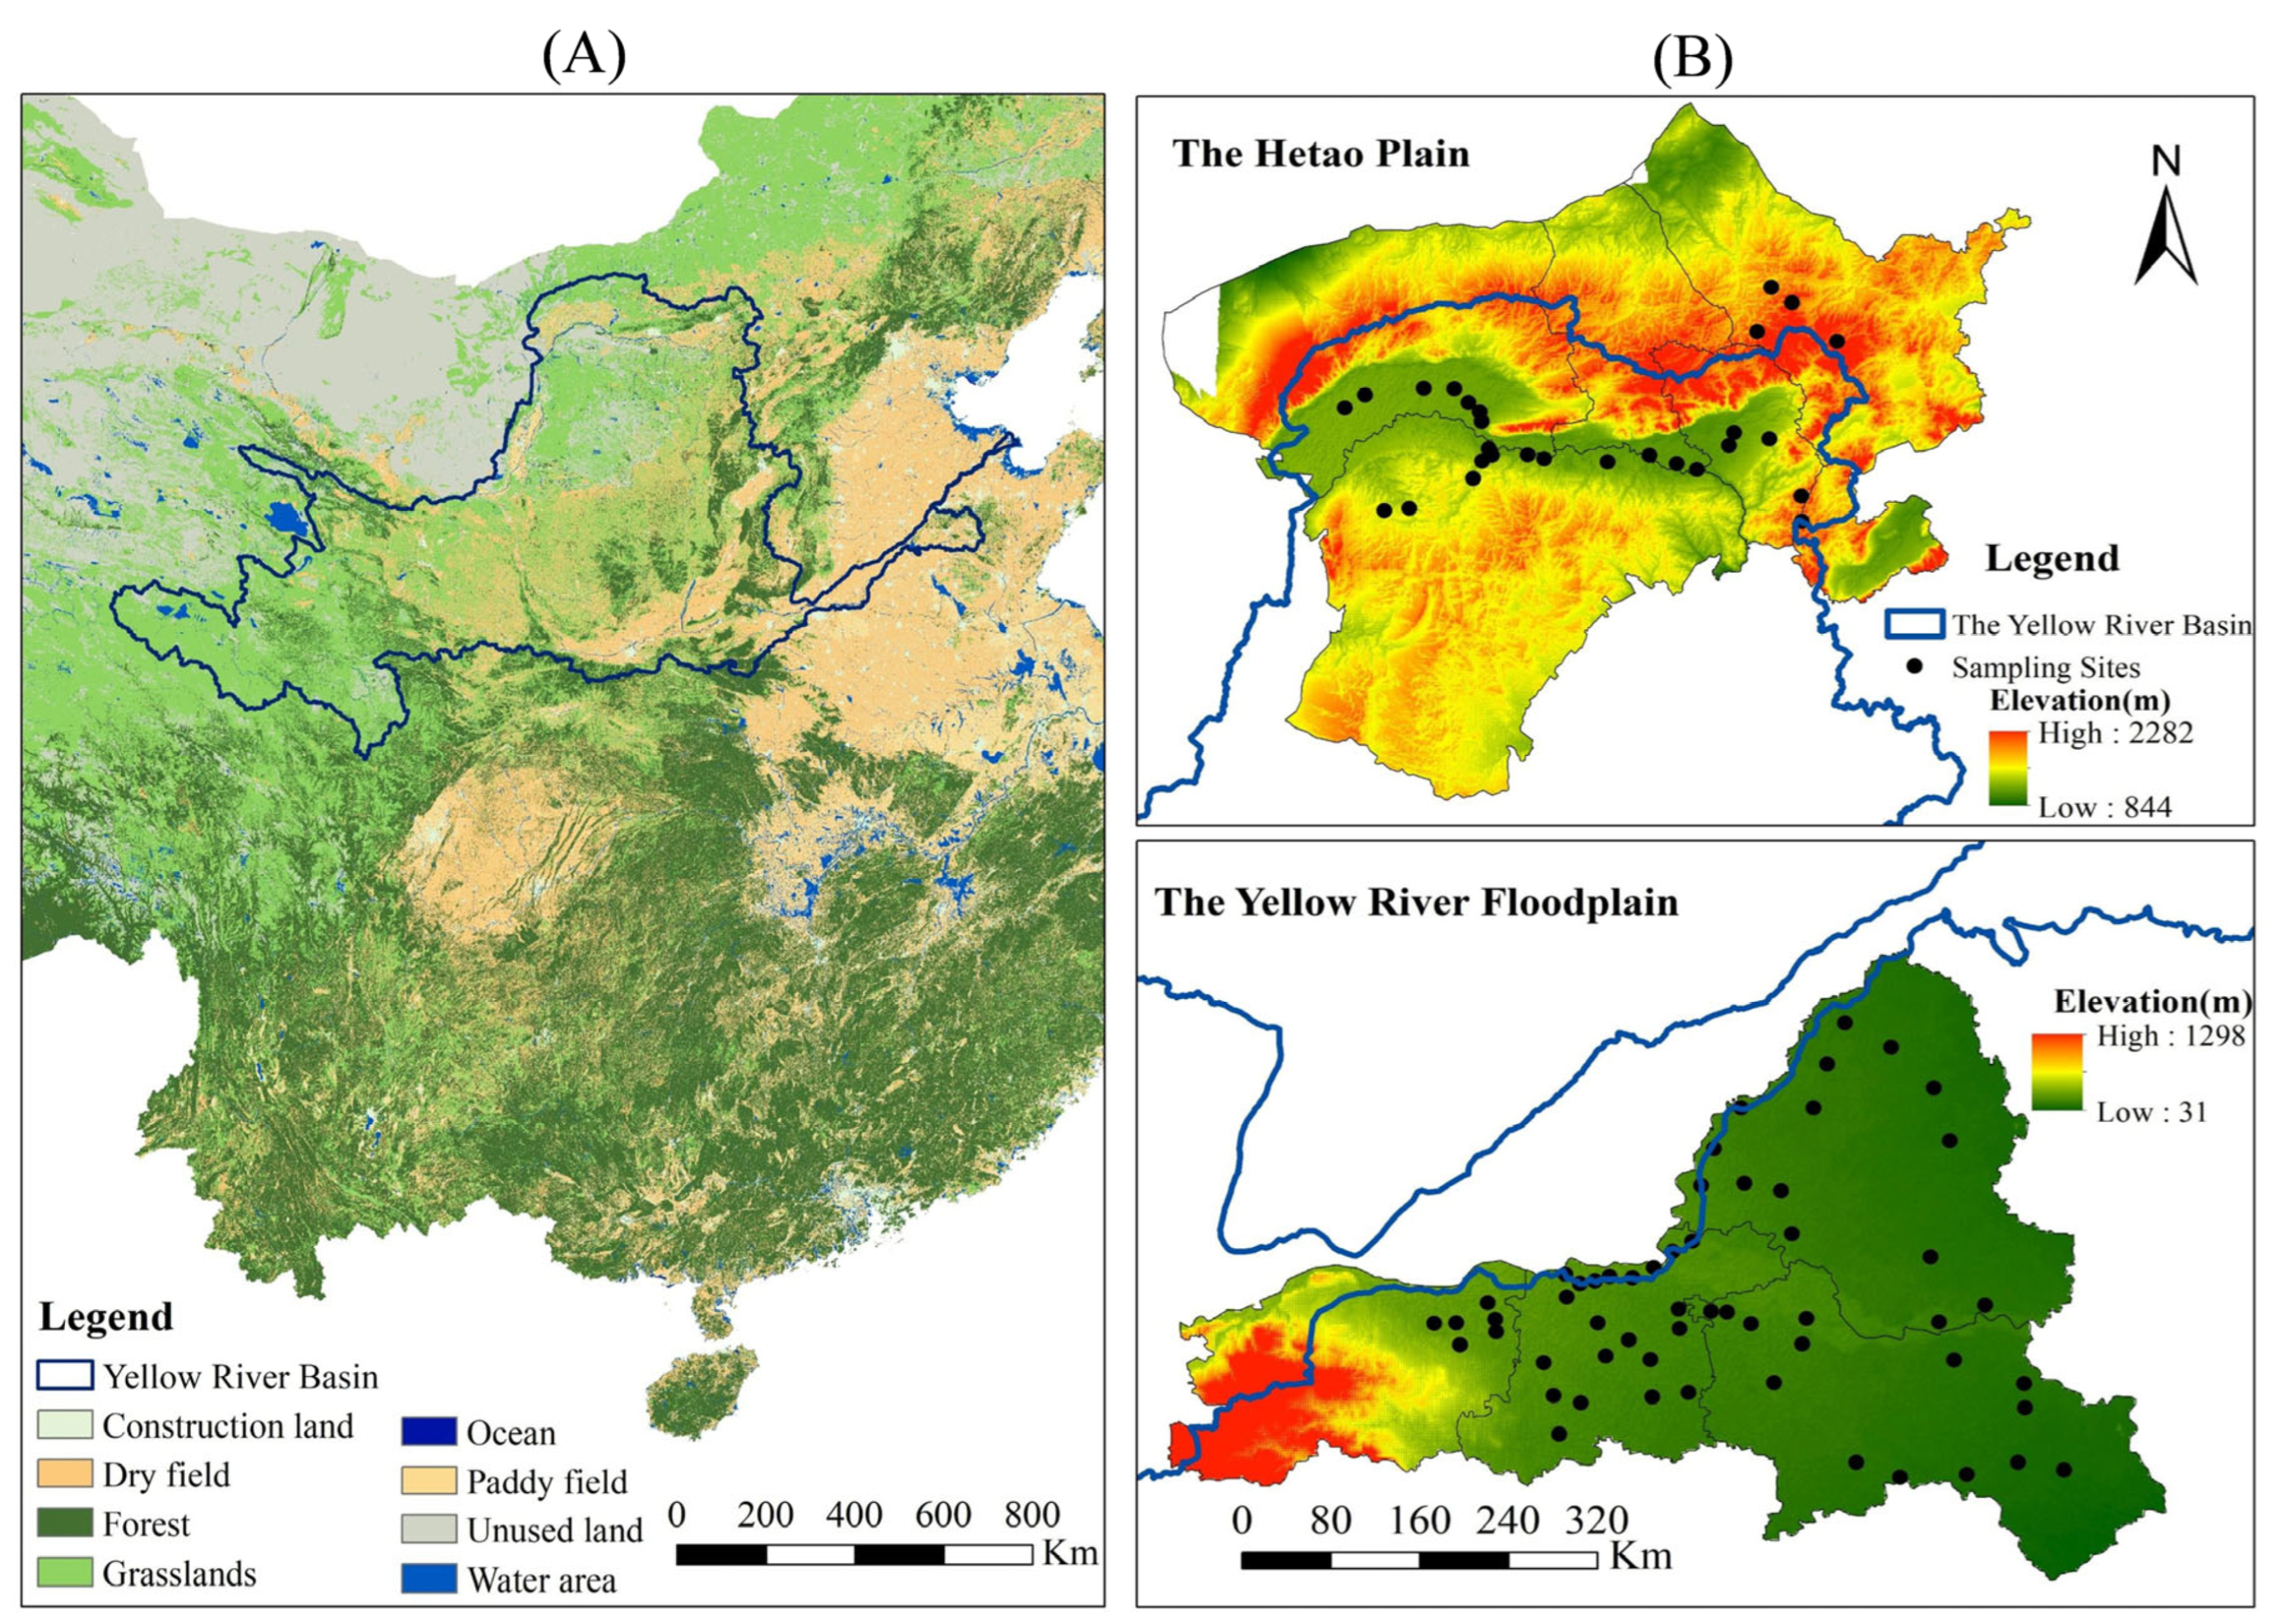
The Yellow River, which is 5464 km long, originates from the Bayan Har Mountains on the Qinghai–Tibet Plateau; spans the eastern, central, and western regions; and serves as an important ecological barrier for China. Figure 1 presents soil categories classified according to the 1951 United States Department of Agriculture soil texture system, with underlying spatial data sourced from the Harmonized World Soil Database (https://www.fao.org/soils-portal; accessed on 16 March 2025) and soil Survey Geographic Data (https://www.ncdc.ac.cn/portal/metadata/1fdf7dc7-7ecb-4e1f-a5df-30f7196756a8; accessed on 16 March 2025). The land-use data presented in Figure 2 was downloaded from GlobalLand30 (https://www.webmap.cn/commres.do?method=globeIndex; accessed on 18 March 2025), with its classification scheme following the GB/T 21010-2017 [34] Chinese national standard for current land-use status mapping. The dataset was stratified into the FPYR (Table S1) and HPYR (Table S2) regions based on the geographic origin and soil type. Two main agricultural areas along the Yellow River, the HPYR in the middle and upper reaches and the FPYR in the lower reaches, were the focus of this study. The HPYR is in an arid and semi-arid climate zone in the northwest inland region (Figure 2), with an average annual temperature of 4.0–7.8 °C. Most areas are west of the 400 mm isohyet, with a dry and rainy climate and an average annual precipitation of 130–215 mm. The annual precipitation is extremely uneven across the year, with 70% concentrated in June–September [35]. The FPYR, characterized by extensive plains (Figure 2), is located in a warm–temperate monsoon climate regime with mean annual precipitation ranging from 580 to 815 mm, of which approximately 58% typically occurs during the summer growing season [10]. The main crops planted in the Yellow River Basin include wheat, corn, rice, soybeans, garlic, and peanuts, with a cropping pattern mainly dominated by winter wheat–summer corn.
Figure 1.
Soil type map and distribution of sampling points in the Hetao Plain (HPYR) and the floodplain of the Yellow River (FPYR).
Figure 2.
Land use (A) and elevation maps (B) of the HPYR and FPYR.
2.2. Interviews to Examine Farmer Crop Choice, Sampling Site Selection, and Soil Collection
Field investigations and questionnaire surveys (Table S3) were conducted to collect data on agricultural management practices at selected sampling sites. The interviewees, natives or residents (>10 years), had implemented land management practices suitable for cultivation, with most of these measures having remained unchanged for five or ten years. Overall, 86 sampling points were identified (HPYR (28) and FPYR (58)). They were primarily characterized by 36 crop rotation systems under disk tillage or no tillage, with two crop water source treatments. Except for several rainfed dryland sites located far from water sources, all plots utilized broad irrigation. Except for a few non-cultivated plots, all agricultural fields received either synthetic fertilizer or a combination of synthetic fertilizer and manure. Fertilizer application was usually similar among surveyed croplands according to the interviews, although exact formulations varied. The dominant regional practice corresponded to approximately 90–140 kg N ha−1, 45–75 kg P2O5 ha−1, and 0–60 kg K2O ha−1 annually.
Despite these inputs, the nutrient use efficiency was considered relatively low. Fertilizer was generally applied to the soil during plowing before autumn sowing, with supplemental fertilization conducted around March. Traditional disk plots were tilled to a depth of 0.10–0.15 m using a disc plow with V-blades to loosen the soil before sowing. The predominant cropping system involved a spring–autumn rotation, featuring winter wheat–corn and winter wheat–peanut cropping patterns.
This study was conducted as a comparative observational field survey across two agricultural regions, the FPYR and HPYR. Soil samples were collected from farmer-managed fields representing naturally occurring soil types and cropping systems. In accordance with the experimental requirements, the selected cropping rotation systems and irrigation methods had remained unchanged for at least 5 years. The bare land was perennially abandoned land. Sampling locations were spatially separated and selected to minimize overlaps in immediate management history and local soil disturbance. Each sampling site represented an independent farmer-managed field or land unit. Additionally, each sampling site was established in a representative agricultural plot with an area of at least 100 × 100 m and a slope of less than 2%. At each site, four subsamples were collected following a W-shaped pattern from the topsoil layer and combined into one composite sample, yielding over 10 kg of surface soil (0–5 cm depth) per plot.
The soil sampling in FPYR was conducted in the winter of 2022 and spring of 2023, while that in HPYR was performed in the winter of 2023 and spring of 2024. The 0–5 cm layer was selected because it represents the soil zone most immediately influenced by land management and environmental disturbance processes, including fertilization, tillage, evaporation-driven salt accumulation, and wind or water erosion [36,37,38]. In both the FPYR and HPYR, these processes are concentrated near the soil surface and can induce relatively rapid changes in SOM, TN, and pH [12,26]. Following soil sample collection, analyses were conducted to determine soil SOM, TN, and pH. Soil types were classified according to the WRB (World Reference Base for Soil Resources) standard.
2.3. Methods for Determining Soil Chemical Properties
2.3.1. SOM
Air-dried soil samples were gently crushed and passed through a 0.149 mm sieve prior to analysis. Soil organic carbon (SOC) was determined using the potassium dichromate oxidation method with external heating, following the procedure of Bao [39] (modified Walkley–Black method). Briefly, 0.10–1.00 g of soil (accurately weighed to 0.0001 g, depending on the expected carbon content) was placed in a hard-glass digestion tube. Then, 5 mL of 0.8000 mol L−1 K2Cr2O7 standard solution and 5 mL concentrated H2SO4 were added, mixed thoroughly, and fitted with a small reflux funnel. The tubes were heated in an oil-bath digestion system at 170–180 °C for 5 min after boiling commenced. After cooling, the digest was quantitatively transferred to a 250 mL conical flask and diluted to approximately 60–70 mL with deionized water. Residual dichromate was titrated with standardized 0.2 mol L−1 FeSO4 solution using a digital burette (Titrette®, BRAND GmbH + Co Kg, Wertheim, Germany). The endpoint was detected using 2-carboxydiphenylamine or ferroin indicator.
Two to three reagent blanks containing SiO2 instead of soil were included in each digestion batch, and the mean blank value was used for calculations. As this method oxidizes approximately 90% of total organic carbon, the measured SOC values were corrected using a factor of 1.1 [39]. Soil organic matter (SOM) was estimated as SOC × 1.724, where 1.724 is the conventional Van Bemmelen conversion factor [40]. All samples were analyzed in duplicate, and analyses were repeated when the relative difference exceeded 5%.
2.3.2. TN
Total nitrogen (TN) was determined using the Kjeldahl digestion-distillation method following Bao [39]. Air-dried soil samples were passed through a 0.25 mm sieve, and approximately 1.000 g soil was weighed into digestion tubes. Samples were moistened with 0.5–1.0 mL deionized water, followed by the addition of 1.85 g catalyst mixture (K2SO4: CuSO4 = 10:1, w/w) and 5 mL concentrated H2SO4. Digestion was performed using a block digestion furnace until the solution became clear green, followed by continued heating for 1 h to ensure complete conversion of organic nitrogen to ammonium. After cooling, the digest was distilled and titrated using a semi-automatic or fully automatic Kjeldahl analyzer (Hanon Instruments Co., Ltd., Jinan, China). Released NH3 was absorbed in boric acid indicator solution and titrated with standardized 0.01 mol L−1 H2SO4 or HCl. The results represent Kjeldahl nitrogen and therefore exclude nitrate-N and nitrite-N. Reagent blanks were included with each batch. Duplicate analyses were conducted for all samples, and repeat measurements were taken when analytical deviation exceeded accepted tolerance limits.
2.3.3. Soil pH
Soil pH was determined in a 1:2.5 soil-to-water suspension (w/v). Ten grams of air-dried soil were mixed with 25 mL deionized water, shaken mechanically for 30 min, equilibrated for 30 min, and measured using a calibrated glass-electrode pH meter (PHS-3C, Shanghai INESA Scientific Instrument Co., Ltd., Shanghai, China). Calibration was performed using standard buffer solutions of pH 4.00, 7.00, and 9.18 before each batch of samples.
2.4. Data Analysis
All data processing and statistical analyses were conducted using Excel 2019, Origin 2021, and SPSS Statistics 26.0 (IBM SPSS Inc., Chicago, IL, USA). As this study was based on field observations rather than controlled experiments, all statistical analyses were intended to compare groups and identify associations, rather than to infer direct causality. Prior to inferential analyses, data distributions were examined using residual diagnostics and normal probability plots, and homogeneity of variances was assessed using Levene’s test. Analysis of variance (ANOVA) was applied to assess differences among groups. To evaluate the effects of environmental and management factors, factorial ANOVA models were constructed with SOM, TN, and pH as response variables and region (FPYR vs. HPYR), irrigation (irrigated vs. rainfed), soil type, and crop rotation as fixed factors. Interaction terms (e.g., region × irrigation) were included to test whether management effects differed between regions. Due to unequal sample sizes among categorical groups, Type II ANOVA was applied when interaction effects were not significant, whereas Type III ANOVA was used in models including interaction terms to obtain adjusted estimates under unbalanced designs. When significant effects were detected (p < 0.05), post hoc comparisons were conducted using Tukey’s honestly significant difference (HSD) test. Pearson and Spearman correlation analyses were both performed to assess relationships between SOM and TN. Pearson correlation was used to evaluate linear relationships, whereas Spearman correlation was used to assess monotonic relationships and reduce sensitivity to non-normality and outliers.
Principal component analysis (PCA) was conducted to explore multivariate patterns among environmental factors, management categories, and soil chemical properties. Prior to PCA, sampling adequacy was evaluated using the Kaiser–Meyer–Olkin (KMO) statistic and Bartlett’s test of sphericity. Categories with very small sample sizes (n < 5) were excluded to reduce instability in multivariate estimation. The PCA results were interpreted as exploratory associations rather than causal mechanisms. The spatial variability of soil chemical properties was visualized in ArcGIS Desktop 10.6.1 (Esri, Redlands, CA, USA) using graduated symbol maps based on sampling point values. The coefficient of variation (CV) was calculated for SOM, TN, and pH within each region to compare the relative heterogeneity among sampling locations. Spatial dependence was further assessed using semivariogram modeling. Global Moran’s I was used to test spatial autocorrelation.
As some sampling sites within the same region may share climatic and geomorphic backgrounds, partial spatial non-independence cannot be fully excluded. Therefore, the statistical inferences should be interpreted cautiously.
3. Results
Over 100 interviews were conducted to examine the land-use decisions of farmers, particularly regarding their choice of cultivation crops. Finally, 86 sites and soil samples characterized by 36 crop rotation systems under standardized management practices (disk tillage and integrated fertilization) were analyzed to identify the effect of crop rotation on soil chemical and physical properties. Industrial crops (e.g., corn and wheat) are mainly grown in the FPYR (Table 1), while rotations of drought-resistant crops (e.g., sunflowers) are mainly practiced in the HPYR (Table 2). The samples included two contrasting crop water source treatments.
Table 1.
SOM, TN, and pH of the six soil types in the FPYR.
Table 2.
SOM, TN, and pH of the six soil types in the HPYR.
3.1. Variation in SOM
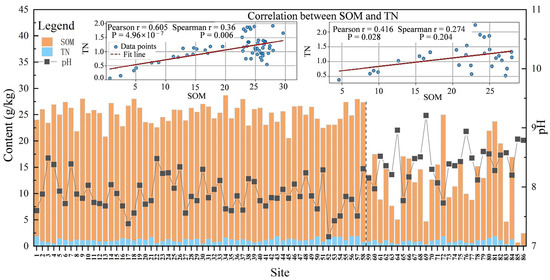
The SOM content across all sampling points ranged from 0.67 to 29.67 g/kg. According to the nutrient grading standards of the second national soil census, 61 sites met Grade III fertility (≥20 g kg−1 SOM), including all 58 FPYR sites (Table 1 and Table 2).
Clear regional differences were observed between the HPYR and FPYR. Mean SOM levels in the FPYR were consistently higher than those in the HPYR. The CV of SOM was 52.23% in the HPYR, compared with only 7.93% in the FPYR. Among management categories, significant differences in SOM were detected among some soil type × cropping-system combinations (p < 0.05). In the loamy sandy soils of the FPYR, the winter wheat–(corn/peanut) alternating rotation had the highest SOM content (28.0 g kg−1), significantly higher than that of the winter wheat–corn–peanut three-crop rotation (26.6 g kg−1; equivalent to 5.1%; p < 0.05). In sandy loam soils, SOM under the winter wheat–corn–peanut system was 3.89 g kg−1 (17%) higher than that under the corn–fallow system. In loam soils, the vegetable–sweet potato system showed the highest SOM among the nine cropping categories, although the differences were not statistically significant. In the HPYR, SOM values varied markedly according to irrigation and cropping system. Irrigated loam soils under potato–winter wheat rotations contained 9.01–10.12 g kg−1 more SOM than adjacent rainfed potato–fallow and potato–oilseed systems. In contrast, in sandy soils, rainfed corn–oilseed fields showed higher SOM than irrigated corn–fallow fields. Regression analysis between clay content and SOM showed a weak relationship (R2 = 0.018), indicating that SOM variation could not be explained by clay content alone [2,11,38].
3.2. Variation in TN
TN concentrations across the sampling sites exhibited substantial variability (0.05–2.24 g/kg), with 53 sites surpassing 1 g/kg and only 15 sites falling below the nitrogen deficiency threshold (<0.75 g/kg) (Table 1 and Table 2). The HPYR exhibited contrasting patterns, with sandy rainfed desert systems showing critically low TN (0.05–0.14 g/kg), while rainfed corn–oilseed fields contained 2.7-times more TN than irrigated corn–fallow fields. No-tillage HPYR loam grasslands retained 1.31 g/kg TN, outperforming disk tillage systems (0.39–1.13 g/kg). A clear regional disparity emerged as the FPYR soils demonstrated systematically higher TN levels than their HPYR counterparts. Under these conditions, large-scale irrigation increases the risk of eutrophication. Crop rotation impacts differed markedly between regions and soil types; winter wheat–corn rotations in FPYR loamy sand achieved peak TN values (1.45 ± 0.39 g/kg, mean ± SD), with maximum concentrations (2.24 g/kg) recorded at Site 52 (Table S1). Similar superiority persisted in FPYR loam soils, where winter wheat–corn systems maintained 1.40 ± 0.31 g/kg TN versus eight competing rotations. A two-factor ANOVA revealed a significant effect of region (p < 0.001) and a significant Region × Irrigation interaction (p = 0.035) on TN, whereas the main effect of Irrigation alone was not significant (p > 0.05). This indicates that irrigation influences TN differently in these two regions.
3.3. Variation in Soil pH
Soil pH ranged predominantly from 7.5 to 8.5, with 84% of all samples (n = 72) classified as weakly alkaline. Strongly alkaline conditions (pH > 8.5) occurred exclusively in the HPYR, accounting for 13% of all sites (n = 11). The mean soil pH in HPYR was 8.37 ± 0.43, which was substantially higher than the mean value of 7.82 ± 0.31 observed in FPYR. The coefficient of variation was moderate, with CV values of 5.14% (HPYR) and 3.96% (FPYR). Within HPYR, the highest pH value (9.21) occurred in sandy soil under corn–fallow conditions. Significant pH differences among management categories were detected in some loam and sandy soils (p < 0.05). FPYR soils showed comparatively lower pH value than that of HPYR. In sandy loam and loam soils, winter wheat–corn–peanut rotations maintained pH values between 7.38 and 7.85, which were lower than those of several alternative cropping systems.
3.4. Relationships Between SOM and TN
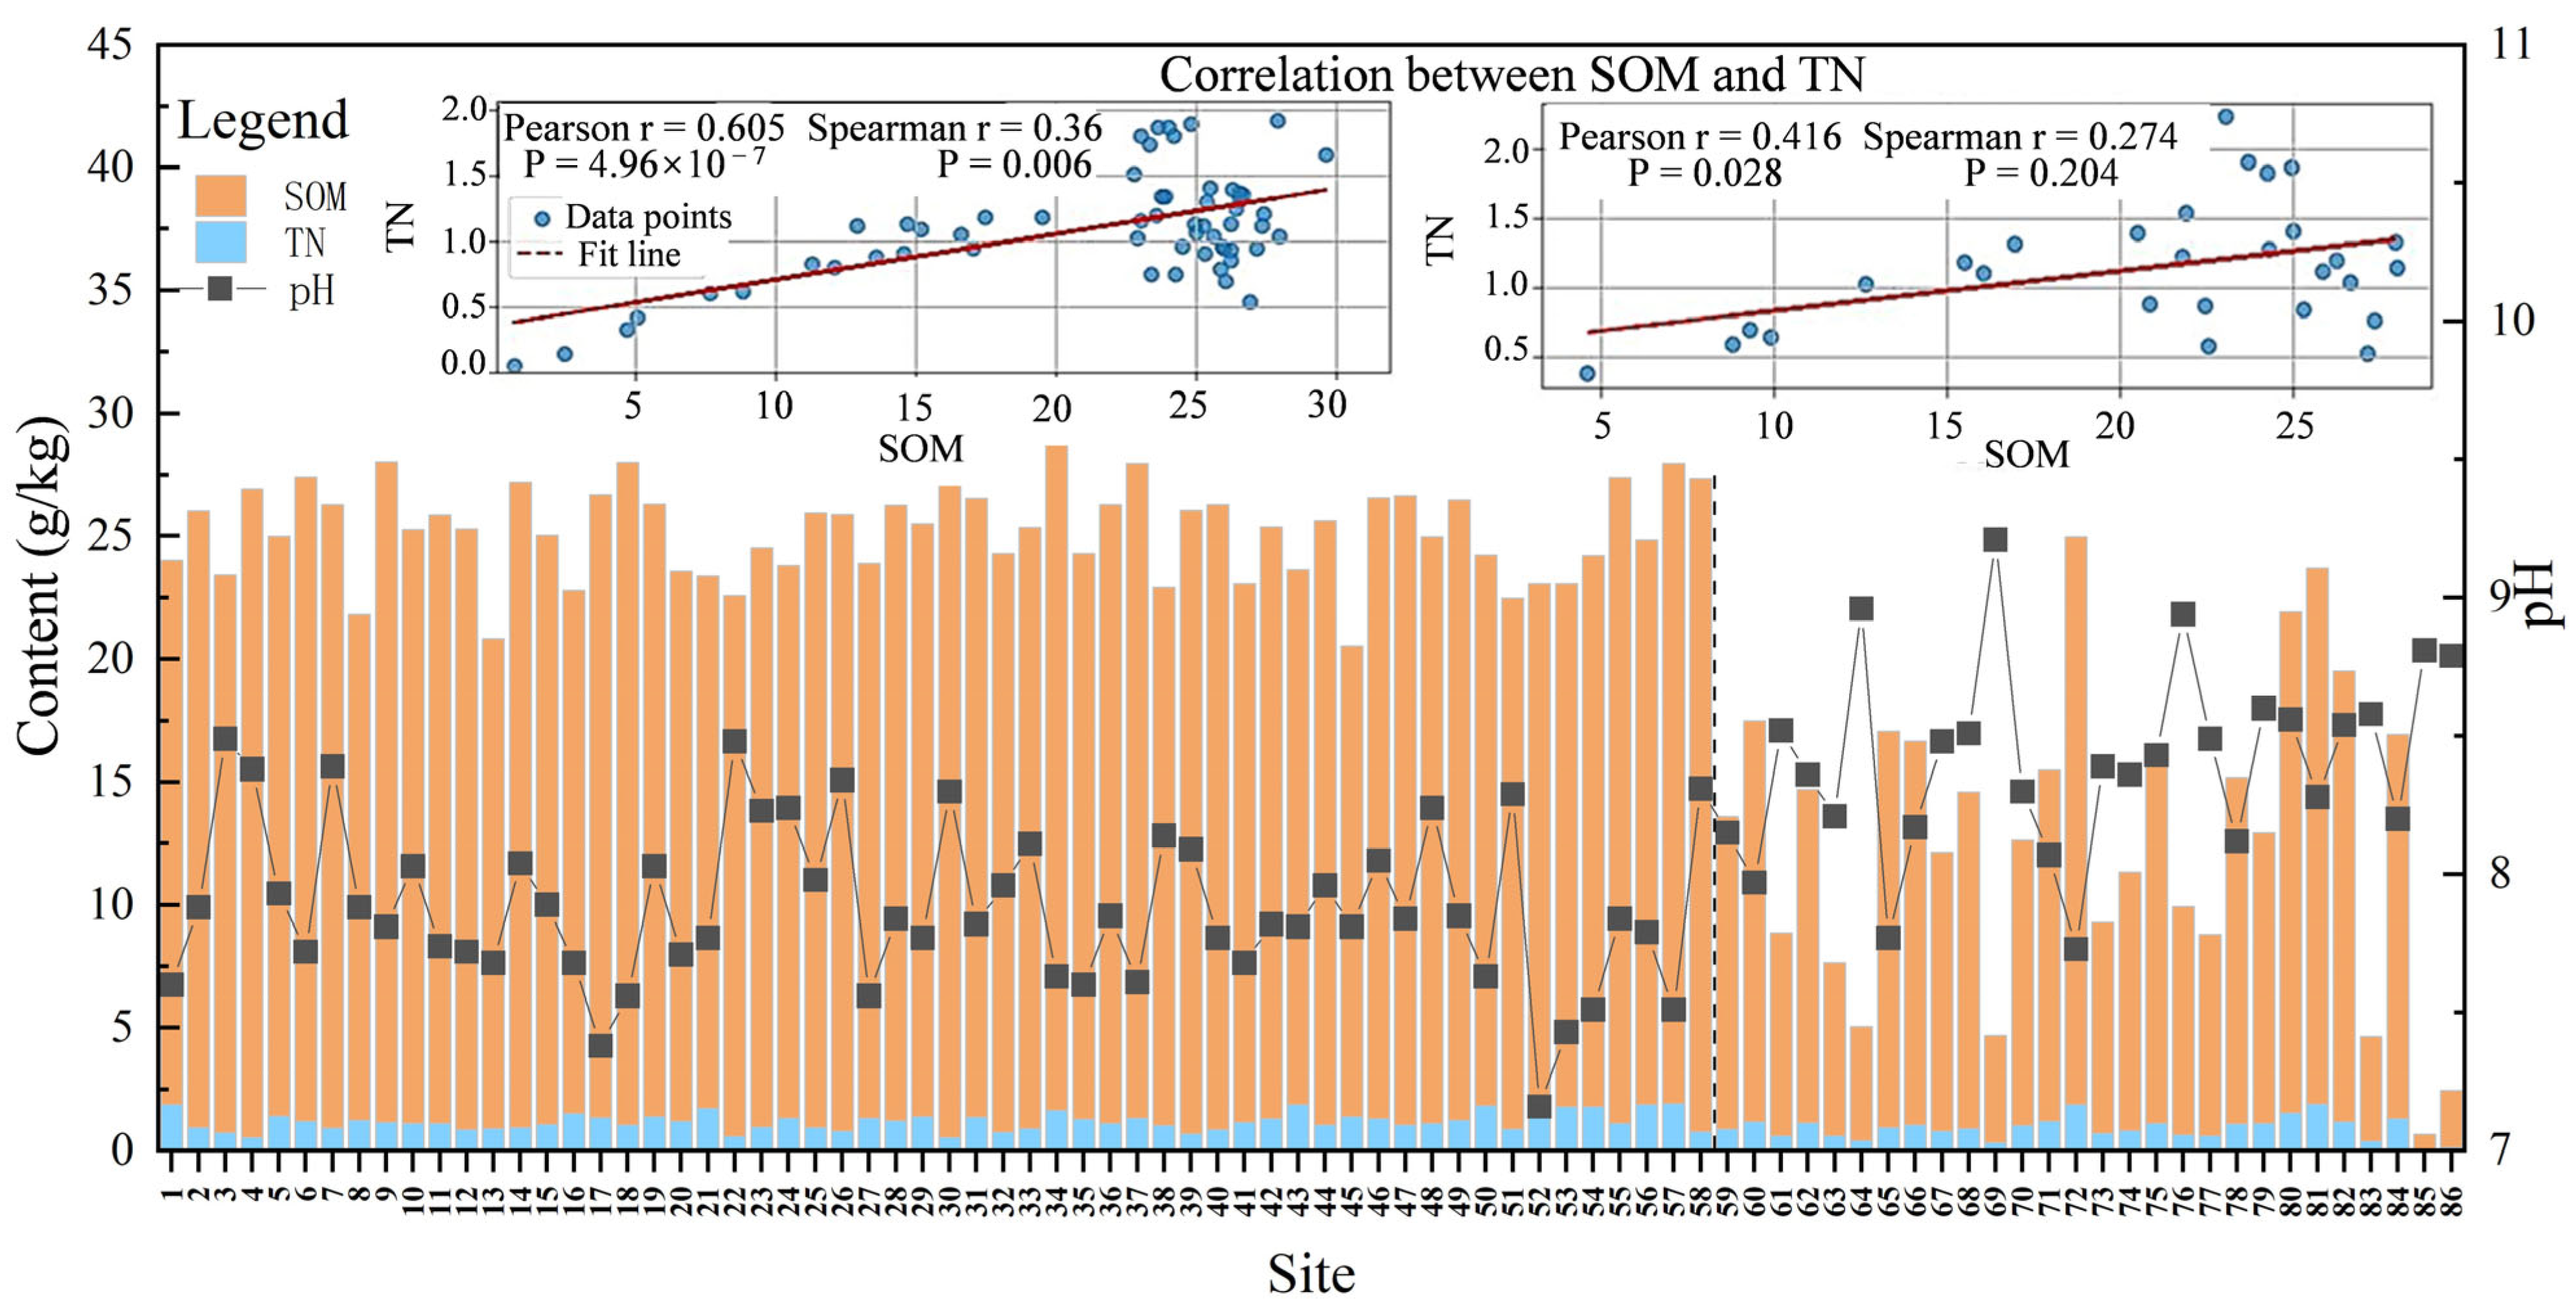
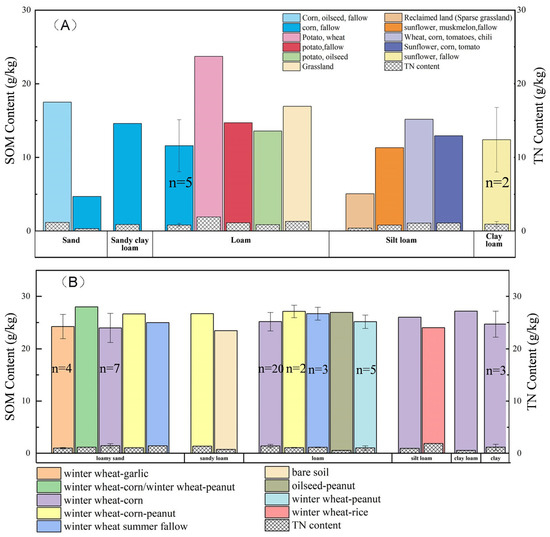
Correlation analyses revealed region-specific relationships between SOM and TN (Figure 3). In FPYR, SOM and TN showed a moderate positive linear relationship (Pearson r = 0.605, p < 0.05). However, the monotonic association was weaker (Spearman r = 0.36, p < 0.05), indicating that the relationship was not strictly rank-consistent across all sites. In contrast, no significant monotonic relationship between SOM and TN was detected in the HPYR (Spearman r = 0.247, p = 0.204). Thus, the SOM–TN proportionality diverged regionally, with a moderate linear correlation observed only in the FPYR. The SOM and TN content under partial crop rotation systems in the HPYR and FPYR were shown in Figure 4A,B.
Figure 3.
SOM, TN, and pH of cropland soils at each sampling point.
Figure 4.
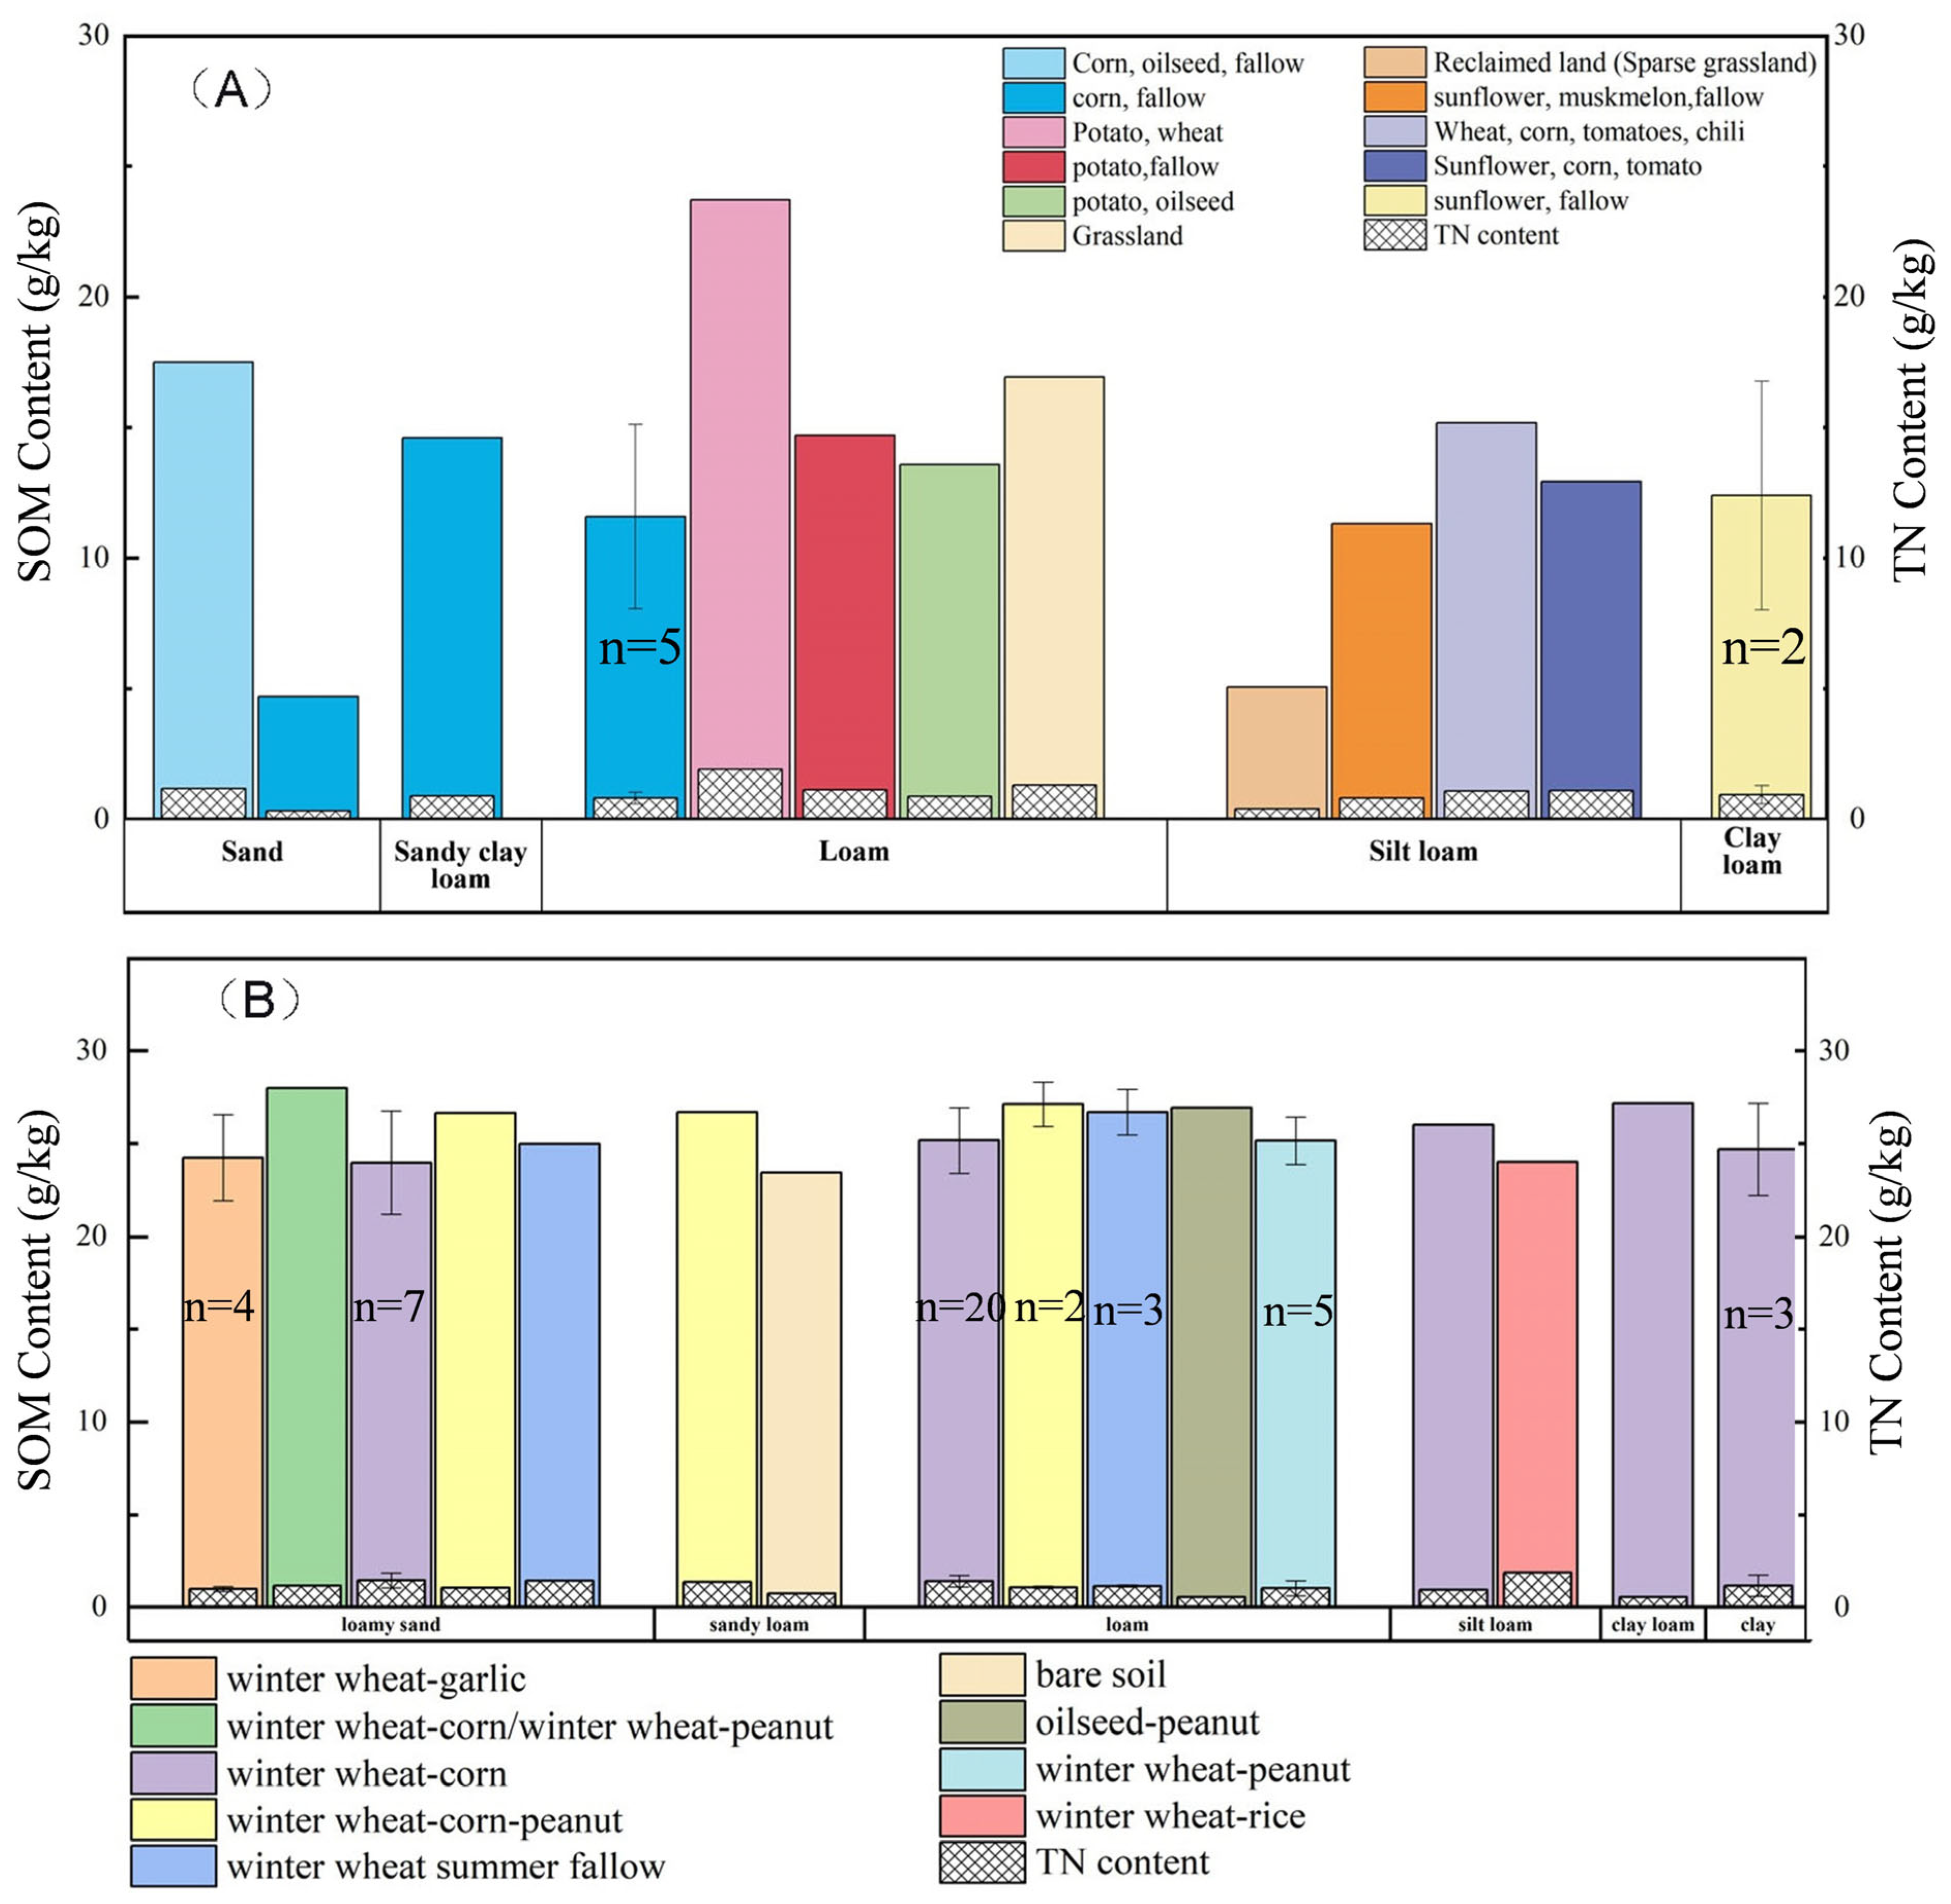
SOM and TN content under partial crop rotation systems in the HPYR (A) and FPYR (B). Note: Error bars indicate the standard deviation of multiple samples.
3.5. Principal Component Analysis
PCA was conducted to explore the key drivers of differences in SOM, TN, and pH (Table 3). Rare parameter categories (n < 5) were excluded to reduce noise interference. Prior to analysis, data suitability was assessed using the Kaiser–Meyer–Olkin (KMO) measure and Bartlett’s test of sphericity. The KMO value was 0.68, indicating mediocre to acceptable sampling adequacy [41], and Bartlett’s test was significant (p < 0.001), confirming that the correlation matrix was appropriate for PCA.
Table 3.
Input variables and loadings of PCA.
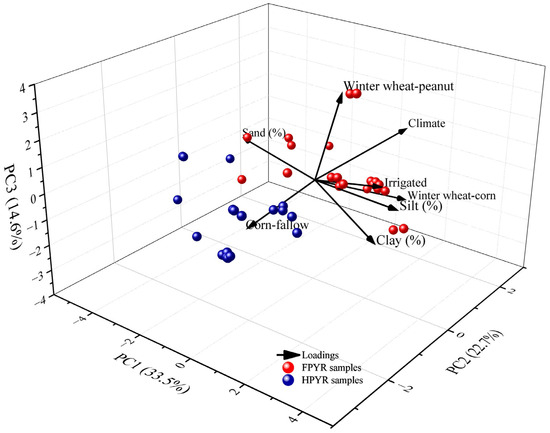
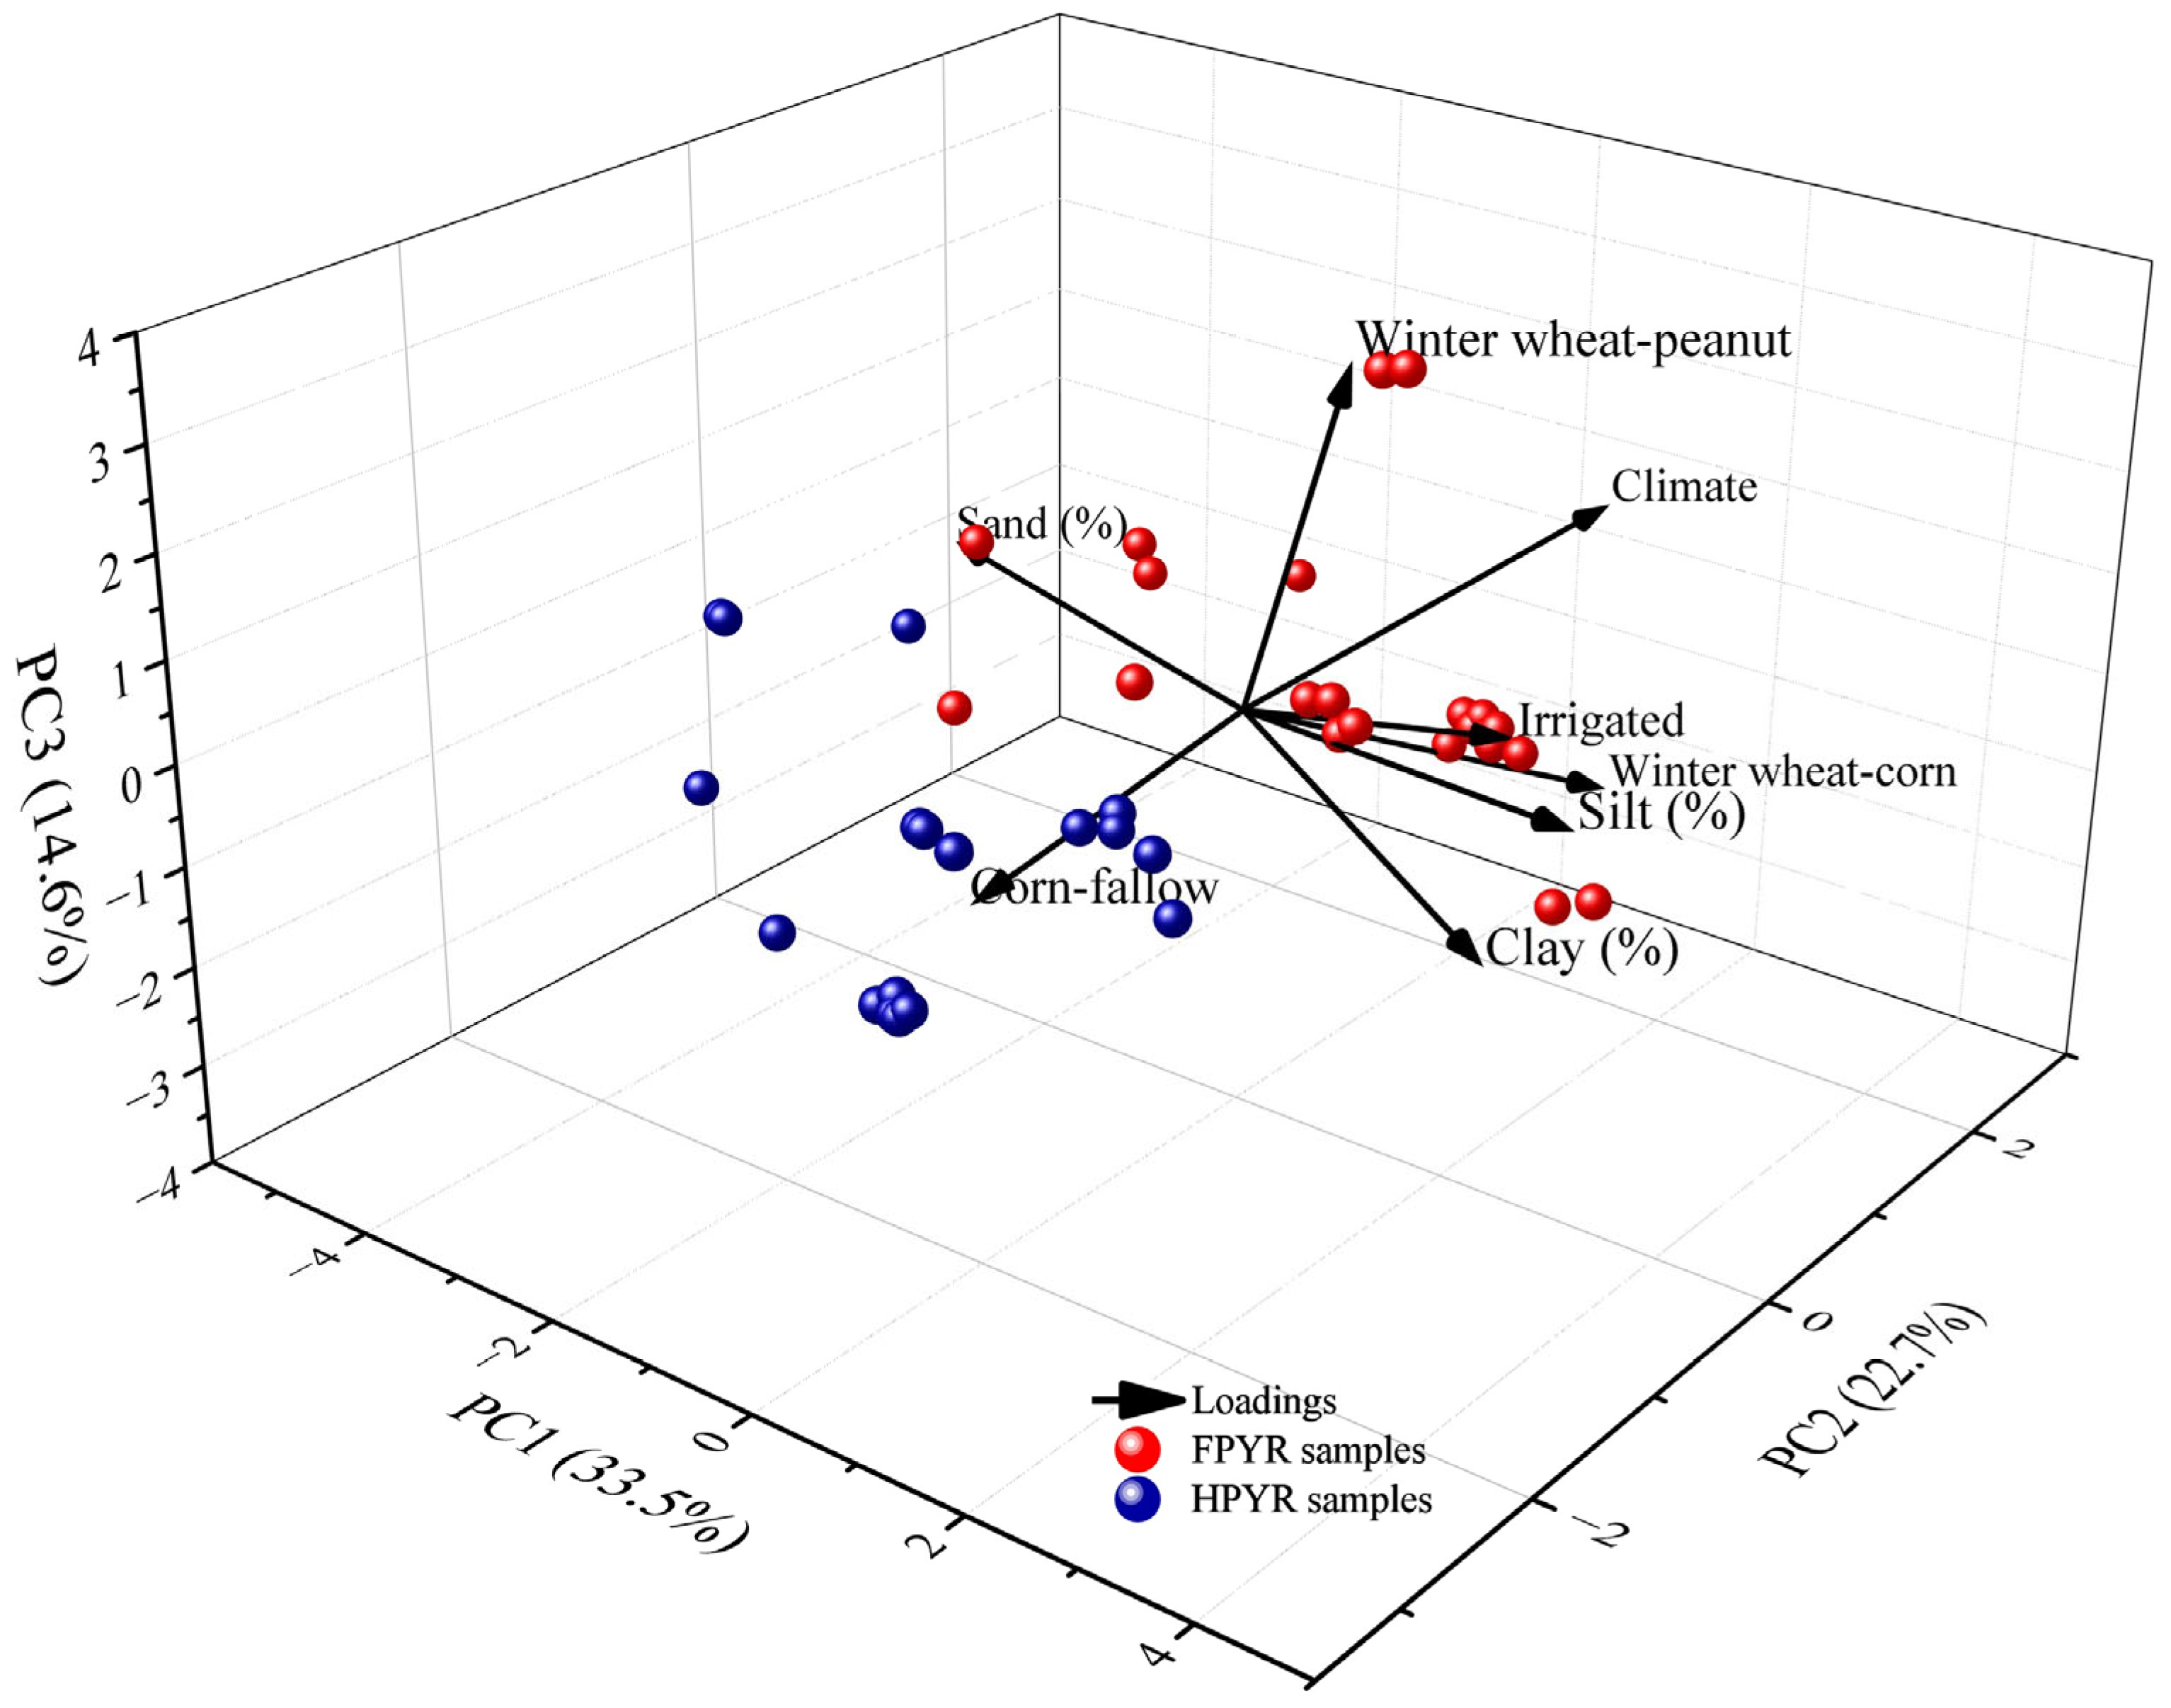
The first three principal components explained 70.8% of the cumulative variance, with PC1 contributing 33.5%, PC2 accounting for 22.7%, and PC3 accounting for 14.6% (Figure 5). The vector length quantifies the contribution of a variable to a principal component, where longer vectors denote a stronger influence. Variables sharing positive correlations cluster proximally in the directional orientation, while angular relationships between vectors encode correlation polarity; acute angles (<90°) indicate positive associations, obtuse angles (>90°) reflect negative correlations, and orthogonal vectors (90°) demonstrate statistical independence.
Figure 5.
Biplot of PC1, PC2, and PC3 for crop rotation system, climate, irrigation, and soil texture.
Multiple linear regression (Table 4) identified PC1 as the primary driver of SOM (R2 = 0.73, p < 0.05), while the significant negative correlation between PC2 and pH (R2 = 0.57, p < 0.05) reflected climatic dominance.
Table 4.
Regression analysis of principal components and SOM, TN, and pH.
3.6. Spatial Structural Variability Analysis Using the Semivariogram
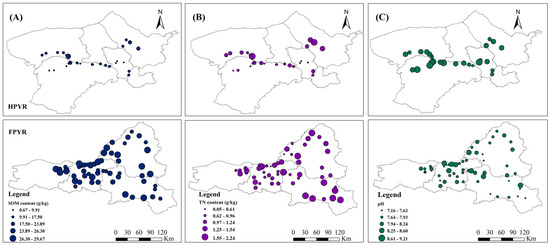
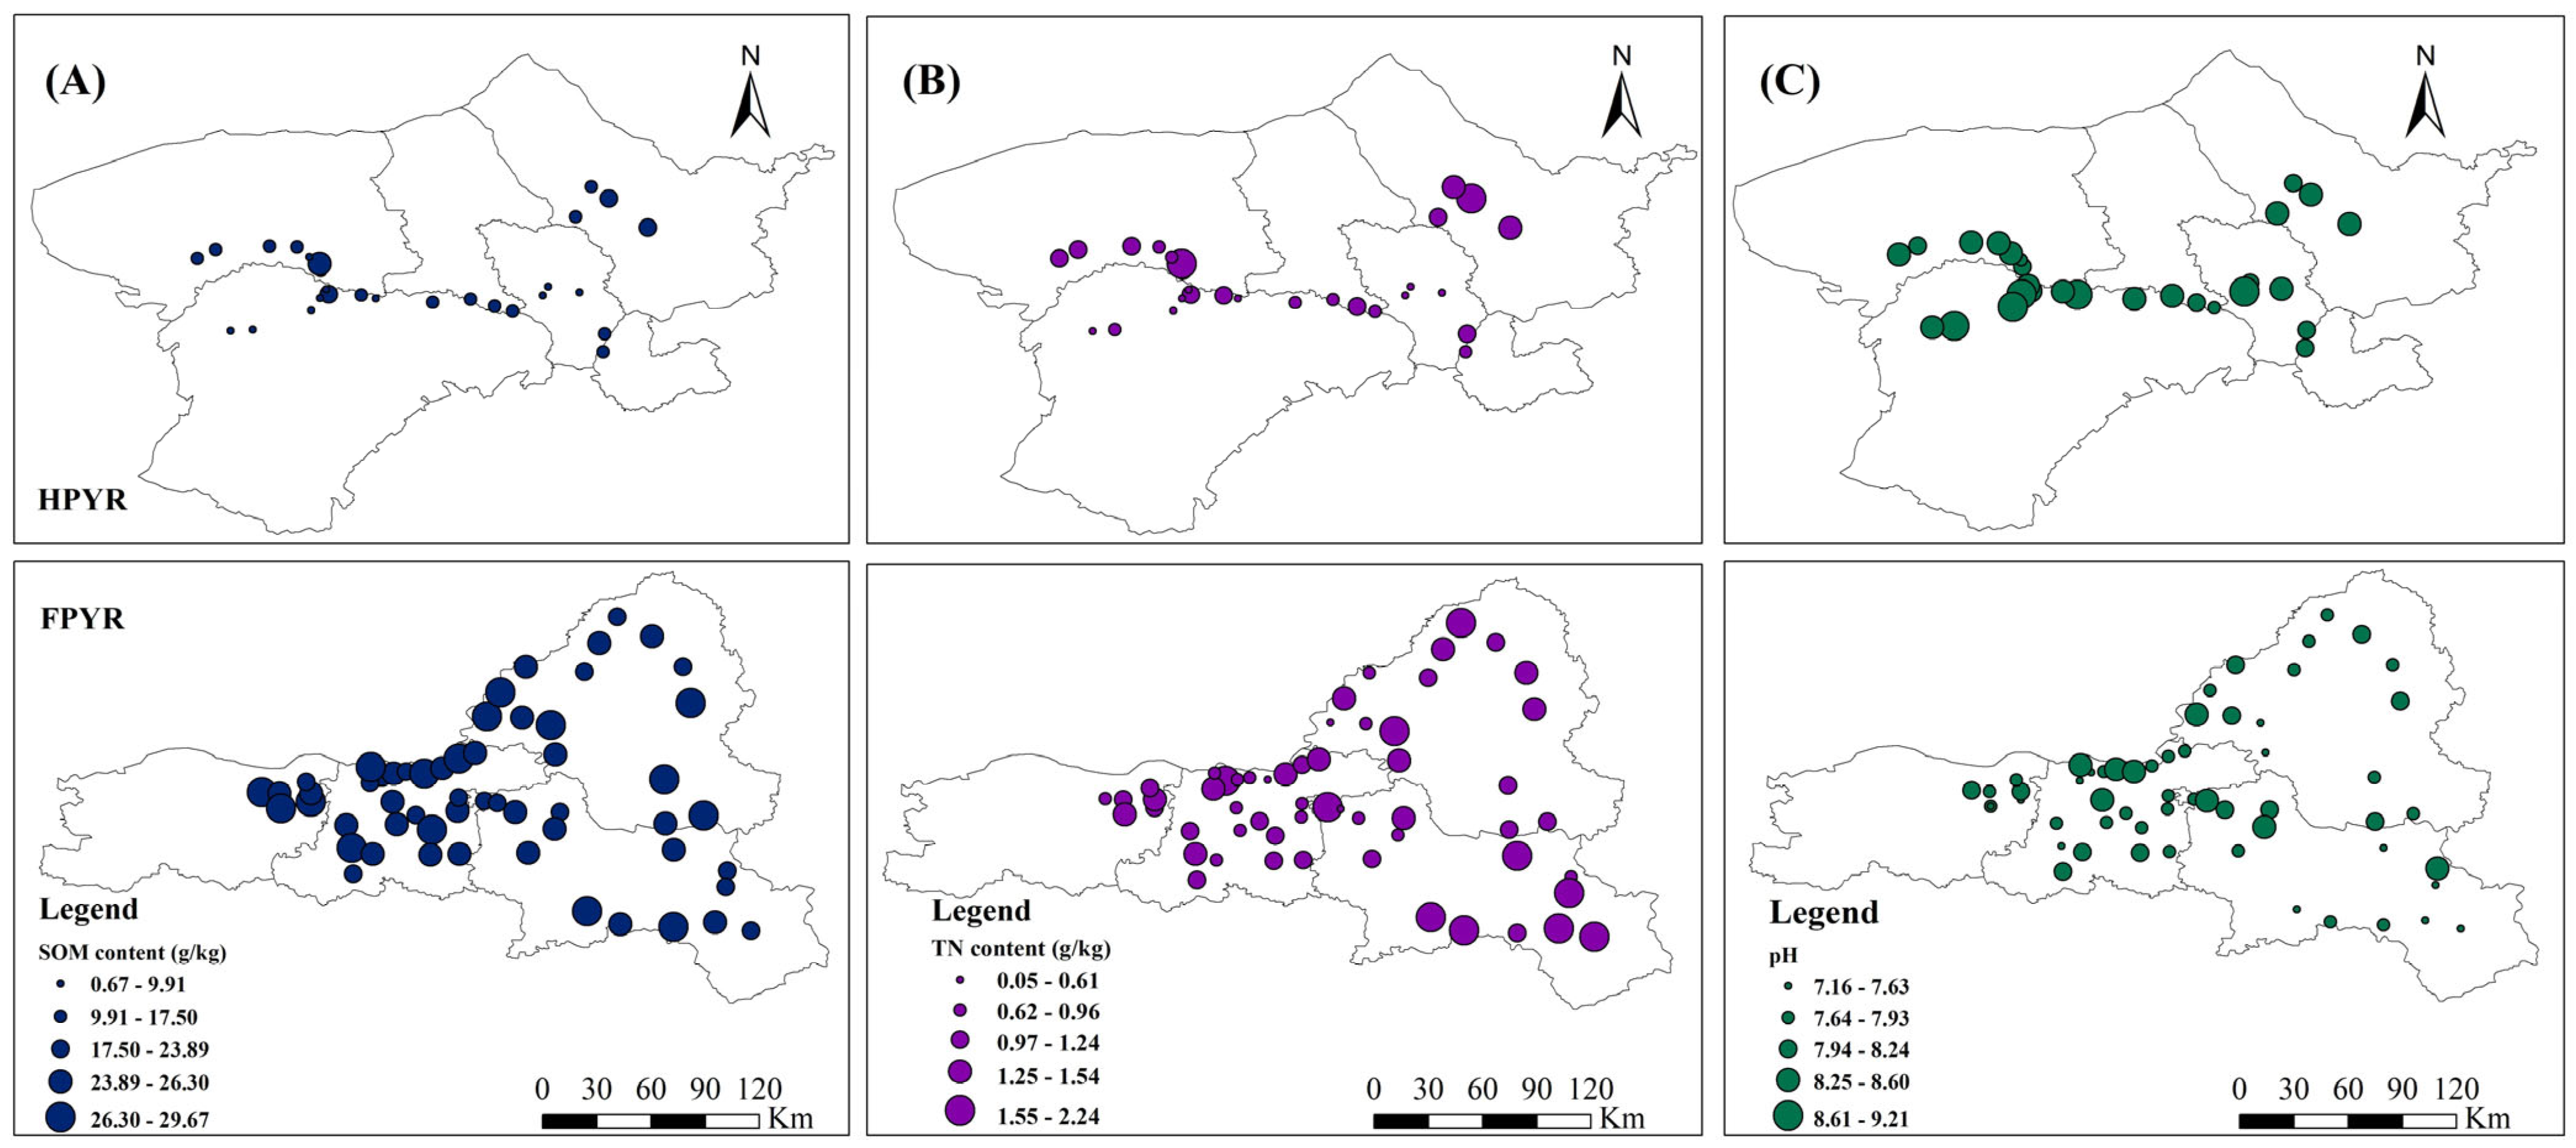
Spatial distribution maps were produced in ArcGIS using graduated symbols based on sampling point values (Figure 6), and the CV values ranged from 4.86% (pH) to 38.14% (TN) across the Yellow River Basin, with 32.72% SOM variability.
Figure 6.
Spatial patterns of SOM (A), TN (B), and pH (C) at the selected sites.
Semivariogram analysis revealed contrasting spatial structures between the FPYR and HPYR (Table 5). In FPYR, SOM exhibited the longest spatial range (78.41 km), suggesting broad-scale continuity likely associated with depositional parent materials and regional land-use history. In contrast, TN and pH had short ranges (3.62–6.11 km), indicating strong local heterogeneity and management-induced variability. In HPYR, SOM, TN, and pH displayed moderate to strong spatial continuity, with ranges of 32.16, 38.91, and 54.57 km, respectively. TN exhibited significant positive spatial autocorrelation (Moran’s I = 0.511, p < 0.05), indicating clustered nitrogen distribution across the plain. SOM also showed moderate spatial aggregation (Moran’s I = 0.454), although the significance was marginal (p = 0.063). Soil pH showed moderate spatial dependence (Nugget/Sill = 38.11%), reflecting regional salinity gradients driven by irrigation processes.
Table 5.
Results of semivariogram analysis.
3.7. Variation in Soil Physical Properties
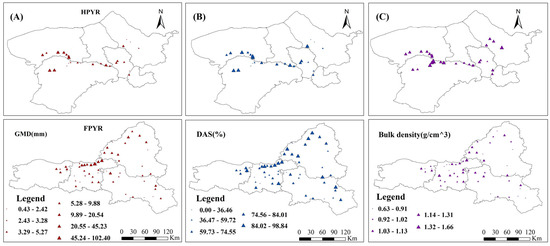
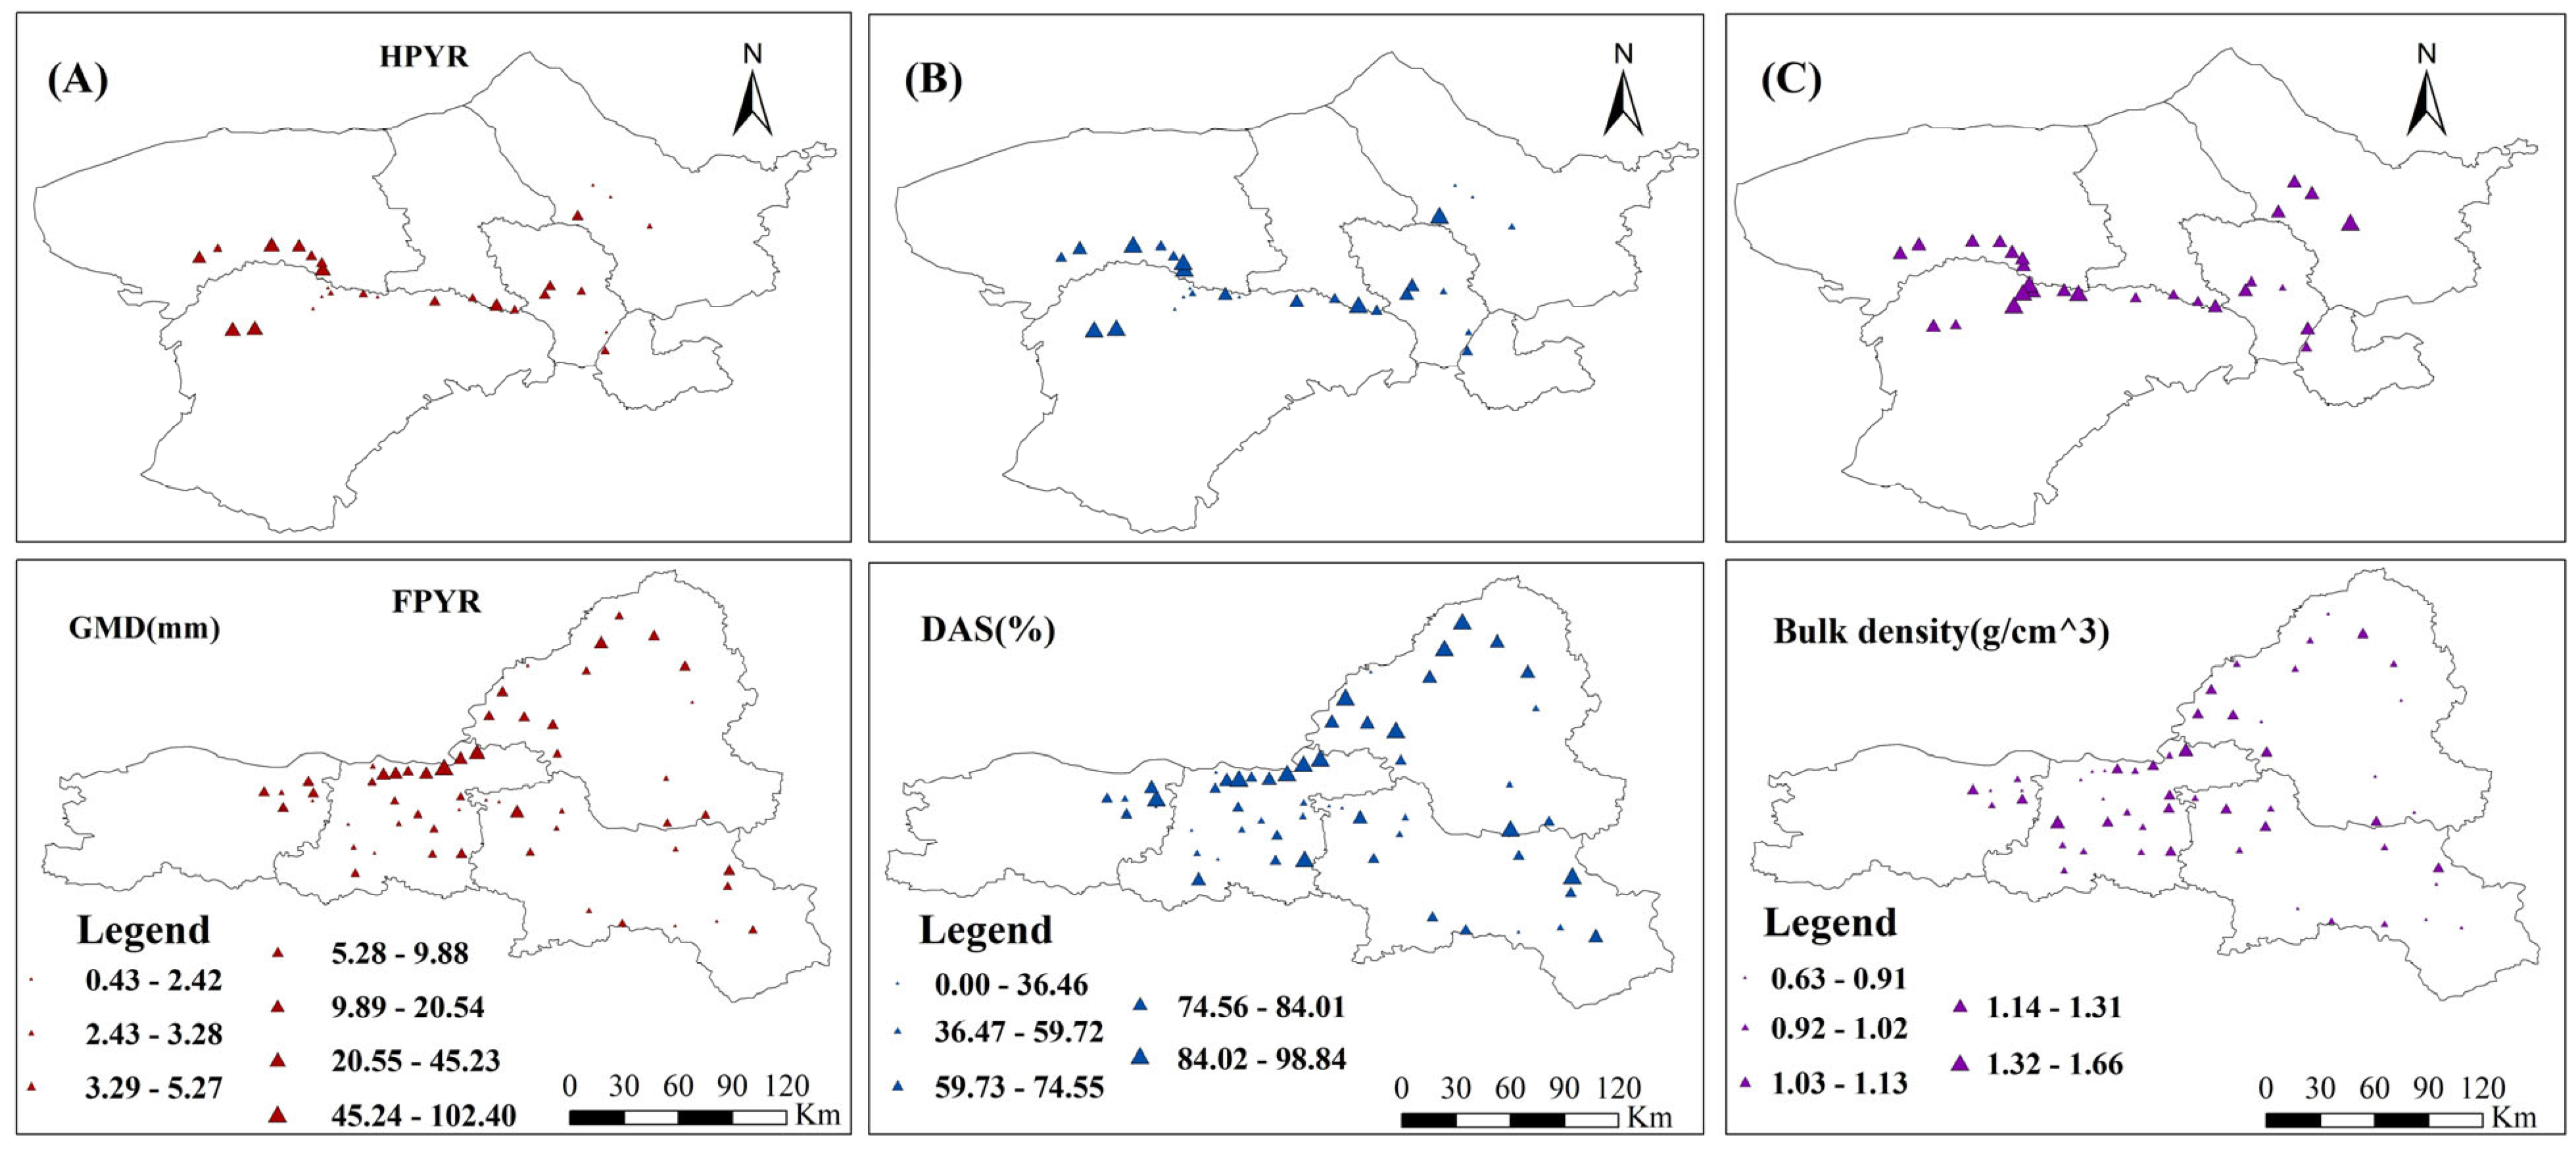
Figure 7 illustrates differences in the spatial distributions of the geometric mean diameter (GMD), dry aggregate stability (DAS%), and bulk density between the HPYR and FPYR sampling sites. Detailed data are shown in Supplementary Table S4. The aggregate GMD across all FPYR sites ranged from 0.456 to 102.40 mm, with the maximum value observed at Site 5, characterized by a winter wheat–summer fallow rotation and loamy sand. The upper sieve size was set at 5 mm. Any aggregates exceeding this threshold were collected and manually measured to obtain their GMD. Analysis of the complete dataset revealed a median value of 3.735 mm, and Site 5 was identified as an outlier. In contrast, the aggregate GMD for all HPYR sites ranged from 0.432 to 30.66 mm. The maximum value in the HPYR, observed at Site 19 which has a loamy texture, was 2.34 times smaller than the maximum GMD in the FPYR, although the aggregate average GMD values of the two regions were similar (6.81 and 7.67 mm in the FPYR and HPYR, respectively). The DAS% ranged from 0% to 98.84% in the FPYR and from 5.31% to 93.7% in the HPYR. Both the average (59.35%) and maximum (93.70%) DAS% values in the HPYR were lower than those in the FPYR (61.72% and 98.84%, respectively). Unlike DAS%, the bulk density in the HPYR was generally higher than that in the FPYR. The average bulk density in the HPYR was 1.23 g cm−3, 25.5% higher than that in the FPYR. The smaller aggregate size and greater DAS% indicate greater wind erosion potential in the HPYR than in the FPYR. For further details regarding the soil physical properties of the HPYR and FPYR, see Pi et al. [10,42].
Figure 7.
Spatial patterns of aggregate GMD (A), DAS% (B), and bulk density (C) in the HPYR and FPYR.
4. Discussion
4.1. Associations Between Soil Types, Management Practices, and SOM
As this was an observational study, soil type was used as a stratification variable rather than an experimentally assigned treatment. Comparisons among management categories were conducted within comparable soil types, where possible. Crop rotations and land management strategies were significantly associated with differences in SOM content. In the loamy sandy soils of the FPYR, the winter wheat–(corn/peanut) alternating rotation had the highest SOM content (28.0 g kg−1), significantly higher than that of the winter wheat–corn–peanut three-crop rotation (26.6 g kg−1; +5.1%, p < 0.05). This may be related to both rotation management (two-crop vs. three-crop system) and the periodic incorporation of peanut residue, which typically decomposes differently from corn residue [43]. However, as residue chemical properties were not measured in this study, the underlying mechanisms remain to be investigated. Conversely, we found that higher soil disturbance in winter wheat–corn–peanut systems was associated with lower SOM levels through accelerated decomposition rates, although both rotations exceeded the monoculture benchmarks. Fields with more diverse crop rotations tended to exhibit higher SOM [44]. Specifically, the SOM of winter wheat–corn–peanut systems in sandy loam surpassed that of corn–fallow systems, although significant differences were not observed. This is attributable to gramineous root biomass contributions [16] and legume residue inputs that elevate stable SOM fractions [45].
Under similar soil texture and tillage conditions, Site 3 (bare soil for at least five years) exhibited 0.64 g kg−1 (2.8%) more SOM than the corn–fallow systems. The lower SOM observed in cultivated corn–fallow systems relative to the bare reference site may reflect reduced SOM accumulation or gradual depletion under prolonged cultivation. This finding aligns with observations by Schnitzer et al. [46] in Canadian farmland, where loam soils under summer fallow exhibited increased SOM retention relative to continuous cropping systems, primarily owing to reduced mineralization of native SOM. Flooding may contribute to periodic nutrient replenishment through sediment deposition. In FPYR, oilseed–peanut fields (which had experienced floods within the previous 5 years) exceeded their 28 irrigated counterparts by 0.35–4.01 g kg−1 (1.3–17.5%, p > 0.05) (Table 1). Similar to our observations, the Nile and Mississippi catchments demonstrated enhanced SOM accumulation through fluvial sediment deposition [47]. SOM content was elevated in the vegetable–sweet potato rotation system compared to the other eight rotation systems in loamy soil. Enhanced SOM accumulation likely results from improved soil aggregate stability, as indicated by greater GMD values [10]. These findings corroborate established relationships between aggregate stability metrics and SOM content, where GMD consistently demonstrates positive correlations with organic matter levels [48].
At the regional scale, SOM levels were generally higher and less variable in the FPYR than in the HPYR. A two-factor ANOVA showed a significant regional effect on SOM (p < 0.001), whereas neither Irrigation nor the Region × Irrigation interaction was statistically significant (p > 0.05). This suggests that differences in SOM were primarily associated with broader regional environmental conditions rather than irrigation status alone. The relatively homogeneous alluvial landscape, finer parent materials, and humid monsoon climate of the FPYR likely favor more stable SOM conditions, whereas the HPYR is characterized by stronger climatic water limitation, heterogeneous terrain, and wind erosion risk [38]. These contrasting environmental settings likely explain the much larger coefficient of variation observed for SOM in the HPYR. Specifically, no comparable positive irrigation effect was observed in FPYR, whereas irrigated soil in HPYR generally exhibited higher SOM than rainfed soils. While irrigation may enhance biomass production and residue return, thereby promoting SOM accumulation [49], the increased soil moisture may also stimulate decomposition. Therefore, the net effect likely depends on soil texture, climate, and management intensity [11,47,49]. Furthermore, limited precipitation fails to maintain soil moisture at field capacity, thereby inhibiting microbial activity and subsequently reducing organic matter turnover [14] and nitrogen mineralization [50], which collectively contribute to enhanced nutrient retention in the soil system. Systems with low disturbance also tended to retain more SOM. Grassland or no-tillage sites in the HPYR commonly showed higher SOM than conventionally tilled potato systems, consistent with previous evidence that lower soil disturbance can reduce aggregate disruption and carbon mineralization [14].
4.2. Associations with TN and Soil pH
TN exhibited strong regional and management-related differences. FPYR soils generally had higher TN than HPYR soils, suggesting a more favorable nitrogen status in the floodplain region. In the FPYR cornfields, nitrogen accumulation was significantly higher than that in fields with other crop types (Table 1). Further studies are needed to determine whether this pattern is related to rhizospheric characteristics of maize, such as root architecture or diazotrophic microbial activity [51,52]. Unexpected flooding, a factor outside the experimental design, can affect the chemical properties of farmland soil, accelerating nitrogen loss. A site-specific pattern potentially related to previous flooding was observed at Site 4, which experienced flooding in 2021. Its soil TN content was the lowest across all cropping systems in loam soil, with significant differences detected between this site and some other sampling sites (Table 1). Previous studies have shown that prolonged anoxia can enhance denitrification [53] and that flood scouring can remove water-soluble nitrogen such as nitrate [54]. However, these processes were not directly measured in the present study, and further research is needed to confirm the mechanisms underlying the observed pattern. Hydrological management may play an important role; paddy–upland rotations in the FPYR silt loam have been associated with lower nitrate leaching through redox cycling [55], with 1.87 g/kg TN observed versus 0.94 g/kg in dry-farming systems. Furthermore, in Plot 3 (the long-term bare-soil plot), the absence of vegetation limited nitrogen uptake and biological fixation, while unimpeded erosion likely contributed to lower TN levels [56].
Alkaline conditions predominated across the study area, with 95.3% of sampling sites showing pH > 7.5. This pattern was especially pronounced in the HPYR, where arid climate conditions (130–215 mm annual rainfall), strong evaporation (>2000 mm yr−1), and shallow groundwater tables (<5 m) favor upward salt transport and surface accumulation [4,38]. Beyond increasing soil pH, salinization can directly constrain soil fertility by reducing nutrient solubility, suppressing microbial biomass and enzyme activity, and weakening plant residue inputs through reduced crop productivity [37]. These processes may partly explain the generally lower SOM and TN values observed in several HPYR sites. Salinity stress can also impair aggregate stability through clay dispersion and reduced biological binding agents, increasing vulnerability to wind erosion [57,58]. Therefore, management strategies for the HPYR should integrate salinity mitigation (e.g., drainage improvement, controlled irrigation, residue retention, and salt-tolerant rotations) with conventional nutrient management. The significant Region × Irrigation interaction for TN suggests that water management effects were context dependent. In the FPYR, irrigated soils generally exhibited higher TN than rainfed soils, a pattern consistent with previous findings that irrigation can enhance crop productivity and nitrogen retention in humid monsoon regions [54,55]. In contrast, the weaker irrigation response in the HPYR may be related to coarse soil texture, salinity, and limited organic inputs, as these factors have been shown to constrain soil nitrogen accumulation in other arid/semi-arid regions [51]. However, the specific mechanisms underlying this pattern in the HPYR were not directly tested in this study.
4.3. Relationships Between SOM and TN
Contrasting results were observed for the TN and SOM contents in the loam and loamy sandy soils in the FPYR (Figure 4B). Specifically, plots with high SOM content exhibited low TN content. This may stem from nitrogen flux dynamics [59]. Soil nitrogen input mainly relied on synthetic fertilizers (June–July applications) and, when followed by heavy rainfall (approximately 70% of the annual rainfall falls in June–September), surface runoff increased sharply. Soil nitrogen was primarily lost through leaching and migration in the form of water-soluble nitrogen (NO3−), which contrasts with the relative stability of SOM through macromolecular association [54]. Although opposite SOM and TN contents were observed in individual soil samples, our Pearson and Spearman correlation analyses (Figure 3) revealed that SOM–TN proportionality diverged regionally, showing a moderate linear correlation (Pearson r = 0.605, p < 0.05) in FPYR; however, the monotonic association of the overall trend was weak. This is inextricably linked to climate. Deng et al. [60] found that under drought conditions, the rates of organic matter decomposition and nitrogen mineralization decrease synchronously. Additionally, the stability of soil C/N ratios in arid regions is significantly higher than that in humid regions. In HPYR, no statistically significant monotonic correlation was observed between SOM and TN, revealing that the overall synergy between carbon and nitrogen cycles in the HPYR was weak. For future regional land management, it will be necessary to gradually enhance the coupling between SOM and TN to improve the stability of soil fertility [61]. The FPYR exhibits distinct soil characteristics compared to surrounding non-floodplain areas due to higher precipitation, stronger leaching effects, and flooding. For instance, while both regions have loamy sandy soils, the non-floodplain areas in Xuzhou, Jiangsu Province, show a significantly coarser texture and higher SOM and TN contents than those of the floodplain soils [62]. This indicates that, while flood sediments can provide nutrients, the intense scouring and soaking caused by flooding can lead to the transportation and redistribution of various soil components. Moreover, prolonged waterlogging creates an anaerobic environment that affects soil pH [20].
4.4. Principal Component Analysis
Figure 5 shows a biplot that portrays the multidimensional PCA variables in a three-dimensional space. The very small angle between the vector arrows for irrigation and winter wheat–corn in Figure 5 indicates an extremely strong positive correlation between this rotation system and irrigation. This correlation suggests an interplay between irrigation regimes and crop rotation systems that is closely linked to soil biogeochemical properties [14]. Specifically, in the sandy soils of the HPYR, rainfed corn–oilseed rotations showed unexpectedly higher SOM (17.5 vs. 4.7 g/kg) and TN (1.18 vs. 0.32 g/kg) compared to irrigated corn–fallow systems. This finding is consistent with the hypothesis that legume-mediated rhizosphere effects may, in some cases, play a more important role than water availability, although direct measurements of rhizosphere processes are needed to confirm this interpretation [12]. Soil texture is the most fundamental factor influencing soil chemical properties, especially during dry summers when SOM mineralization is strongly controlled by soil texture owing to water limitations. Silt and clay particles can delay SOM mineralization by binding to SOM or forming microaggregates and micropores within the soil [63]. Thus, different soil textures vary in their capacity for nutrient retention. For example, Li et al. [64] revealed weak correlations between clay content and nutrient levels in East Flanders, Belgium. In this study, as demonstrated in Figure 5, sand content exerted strong negative loading on PC1 whereas silt and clay exerted positive loadings, thereby capturing textural controls on SOM dynamics.
Multiple linear regression analysis (Table 4) identified PC1 as the primary correlate of SOM (R2 = 0.73, p < 0.05), consistent with the finding that fine-textured soils enhance SOM retention [38]. TN variability across samples predominantly associated with PC2, which is defined by +0.65 loadings of warm–temperate monsoon climate and +0.51 loadings of winter wheat–corn. In fact, the intensive wheat–corn rotations reliant on synthetic fertilization elevated TN to a certain degree [58,59]. Concurrently, synthetic nitrogen inputs reduced soil pH in the FPYR [13]. The significant negative correlation between PC2 and pH (R2 = 0.63, p < 0.05) reflects climatic dominance, with arid–semiarid conditions in the HPYR elevating pH via evaporative salt accumulation, contrasting with the moderate alkalinity in the FPYR soils [19]. Finally, the winter wheat–peanut rotation is placed far from the origin of PC3, indicating the importance of the third PC. Compared to traditional correlation analyses, PCA intuitively shows which variables are related to each other and in which direction. However, these results should be viewed as exploratory because PCA identifies the covariance structure rather than causation, and the categorical management variables were simplified for analysis.
4.5. Soil Chemical Properties Spatial Differentiation
The spatial distribution of soil chemical properties across the Yellow River Basin is shown in Figure 6; clear regional differences were observed. The FPYR generally showed higher SOM and TN values and lower pH values than the HPYR, reflecting contrasting environmental settings between the humid floodplain and the arid irrigated plain. The high precipitation and periodic flooding in the FPYR likely enhance nutrient replenishment, the downward leaching of soluble salts, and favorable organic matter accumulation, whereas the strong evaporation and limited rainfall in the HPYR favor salt accumulation and nutrient constraints. The CV indicated moderate-to-high heterogeneity for SOM (32.72%) and TN (38.14%) across the entire dataset, whereas pH showed comparatively low variability (4.86%). The low CV of pH suggests that alkaline conditions were widespread and relatively consistent throughout both regions, while SOM and TN were more responsive to local differences in soil texture, hydrology, and management history. Similar patterns have been reported in agricultural landscapes where nutrient-related indicators commonly show greater spatial variability than pH [58]. When the two regions were compared separately, SOM variability was substantially greater in the HPYR than in the FPYR. This result is consistent with the more heterogeneous environmental conditions of the HPYR, including variable irrigation access, mixed soil textures, uneven management intensity, and exposure to wind erosion. In contrast, the FPYR is a relatively uniform alluvial plain with finer depositional materials and a flatter topography, conditions that may reduce between-site variability in SOM [62]. In addition, due to the diverse cropping patterns and management practices, such as flood irrigation in the HPYR, the CV of SOM usually exceeded 29% [62].
Semivariogram analysis further clarified these regional contrasts by separating overall variability from spatial structure. In the FPYR, SOM exhibited the longest spatial range (78.41 km), indicating broad-scale spatial continuity. This suggests that SOM patterns in the floodplain are influenced primarily by regional-scale controls such as parent material, depositional history, and long-term land-use patterns rather than by short-distance local effects. In contrast, TN and pH had much shorter ranges (3.62–6.11 km), implying that their spatial variation was dominated by local-scale processes. Such short-distance heterogeneity is consistent with patchy fertilizer application, variable irrigation intensity, localized flooding effects, and field-specific management histories [65].
In the HPYR, all three variables showed moderate-to-large spatial ranges (32.16–54.57 km), suggesting stronger regional continuity than that shown by the FPYR TN and pH. This pattern may reflect broad gradients in irrigation infrastructure, groundwater conditions, salinity processes, and aeolian redistribution across the plain. Soil pH showed moderate spatial dependence (Nugget/Sill = 38.11%), which is consistent with salinity gradients generated by evaporation, capillary rise, and irrigation return flow. These processes often operate over landscape scales rather than within individual fields. Spatial autocorrelation statistics supported the semivariogram results. TN showed significant positive clustering in the HPYR (Moran’s I = 0.511, p < 0.05), indicating that neighboring sites tended to have a similar nitrogen status. This clustering may arise from shared irrigation sources, common fertilization practices, or similar cropping systems within local agricultural zones. SOM also showed moderate positive autocorrelation (Moran’s I = 0.454), although statistical significance was marginal. This suggests the partial spatial organization of SOM, but also substantial unexplained local variability, likely linked to residue management, tillage intensity, and erosion history. Given the moderate sample size (n = 28) in the HPYR, the semivariogram fitting results may have inherent uncertainty, and further validation with larger datasets is warranted.
Several limitations should be acknowledged. The sampling design was observational rather than systematic grid-based monitoring, and some management categories had limited replication. Therefore, the estimated semivariogram parameters describe the spatial structure of the sampled fields rather than the entire region with complete certainty. Nevertheless, the consistent differences between the FPYR and HPYR indicate that spatial statistical approaches provide valuable insight into how environmental background and land management jointly shape soil fertility patterns.
4.6. Land Management Practices for Future Agroecosystems
The two study regions exhibited contrasting soil constraints, indicating that management strategies should be region-specific rather than uniform across the Yellow River Basin. The primary concerns in the HPYR are soil salinity and nutrient deficiencies inherently tied to its arid and semi-arid continental climate. As evidenced by our field data, intense evaporation drives widespread salinization of the soil surface layer. Furthermore, wind erosion, which is prevalent in the HPYR, also impacts soil particles in the 0–5 cm soil layer [10], preferentially removing fine particles and organic matter from exposed surfaces [66]. These regional conditions suggest that soil conservation practices should remain a priority. Within the surveyed fields, cropping systems that included oilseed crops were associated with comparatively higher SOM and TN than some simplified fallow-based systems, particularly in sandy soils. Although these observational data do not demonstrate causation, they suggest that greater crop cover, residue return, and diversified rotations may help maintain soil fertility under water-limited conditions. Accordingly, management strategies such as residue retention, reduced bare fallow periods, shelterbelt protection, and efficient irrigation scheduling may be beneficial for sustaining productivity in the HPYR [12].
In the FPYR, a humid monsoon climate is the main environmental driver that shapes both soil properties and nutrient dynamics (Table 3). The multivariate analyses indicated that TN variability was associated with both regional environmental conditions and cropping categories. Therefore, in the FPYR, management efforts may be more effective if they focus on balanced fertilization, crop rotation planning, and the synchronization of nitrogen inputs with crop demand, rather than increasing irrigation inputs alone. Extreme weather events, such as strong winds and heavy rainfall, have increased in frequency and magnitude. For example, extreme rainfall increased almost seven-fold per decade between 2000 and 2023 [67]. Such climate extremes, when combined with poor land management practices (such as the bare-soil conditions represented by Plot 3), may exacerbate nutrient depletion and reduce agroecosystem resilience to extreme weather events.
Overall, the contrasting patterns between the two regions indicate that land management should be adapted to local environmental constraints. In the HPYR, priorities include salinity mitigation, erosion control, and SOM restoration, whereas in the FPYR, nutrient management and the reduction in potential nitrogen losses may warrant greater emphasis. Because these conclusions are based on field observations rather than controlled experiments, they should be interpreted as practical inferences requiring further validation through long-term experimental studies.
5. Conclusions
Through a systematic comparison of two sections of the Yellow River Basin, we evaluated how soil chemical properties (SOM, TN, and pH) were associated with differences in cropping systems, land management categories, and environmental conditions across two contrasting agricultural regions. Biennial peanut-integrated rotations were associated with relatively high SOM levels and may represent favorable systems for carbon retention because they appear to favor aggregate-associated organic carbon. The overall synergy between the carbon and nitrogen cycles in the HPYR was weak, while SOM–TN relationships showed a moderate linear correlation. Regional differences in irrigation responses indicate that water management exerts stronger control over TN than SOM, emphasizing the need for nutrient-specific management strategies across contrasting Yellow River agroecosystems. In the HPYR, TN exhibited significant positive spatial autocorrelation (Moran’s I = 0.511, p < 0.05), indicating a clustered nitrogen distribution across the plain. SOM also showed moderate spatial aggregation (Moran’s I = 0.454), although its significance was marginal (p = 0.063). Soil pH displayed weaker and non-significant spatial dependence. Semivariogram fitting for the FPYR was unstable, suggesting higher spatial heterogeneity and more complex local variation patterns. As the study was observational, these findings should be interpreted as associations, and future controlled experiments are needed to isolate the independent effects of crop rotation, irrigation, and management history. However, we acknowledge that deeper soil layers may exhibit different nutrient and salinity dynamics; thus, the present study primarily reflects topsoil conditions rather than whole-profile soil fertility status.
Climate, one of the five major soil-forming factors, can indirectly affect soil chemical properties by influencing crops and soil moisture conditions. For example, high precipitation often accelerates the leaching of nutrients from the soil, thereby reducing effective nutrients, whereas high temperatures may increase microbial metabolic activity, promote the decomposition of organic matter, and alter soil pH and other chemical characteristics. Although the impacts of climatic factors were considered when analyzing the effects of agricultural management practices on soil chemical properties, HPYR soils are chronically affected by wind erosion, leading to severe land degradation. Therefore, to gain a deeper understanding of changes in soil chemical properties, future research should systematically analyze differences in meteorological factors such as rainfall, temperature, and wind speed between the HPYR and FPYR. The interannual variations and long-term effects of these meteorological factors on soil chemical properties also need to be considered.
Supplementary Materials
The following supporting information can be downloaded at https://www.mdpi.com/article/10.3390/agriculture16131453/s1, Table S1: Soil information at the FPYR sampling sites; Table S2: Soil information at the HPYR sampling sites; Table S3: Plot survey form; Table S4: GMD, DAS%, and bulk density for 86 sample sites.
Author Contributions
Conceptualization, H.P.; methodology, N.G.; formal analysis, N.G.; investigation, H.P. and S.L.; writing—original draft preparation, N.G.; writing—review and editing, H.P. and S.L.; supervision, H.P. and S.L. All authors have read and agreed to the published version of the manuscript.
Funding
This work was funded by the Institute of River Basin Civilization and Sustainable Development, College of Geography, Henan University (DLXKKY250302), and the National Natural Science Foundation of China (Grant No. 42107367).
Institutional Review Board Statement
Not applicable.
Informed Consent Statement
Not applicable.
Data Availability Statement
The data presented in this study are available on request from the corresponding author due to privacy or ethical restrictions.
Acknowledgments
We are grateful to all personnel for their instrumental assistance in designing the questionnaire and assisting with data collection.
Conflicts of Interest
The authors declare that the research was conducted in the absence of any commercial or financial relationships that could be construed as a potential conflict of interest.
Abbreviations
The following abbreviations are used in this manuscript:
| DAS% | dry aggregate stability |
| GMD | geometric mean diameter |
| HPYR | Hetao Plain of the Yellow River |
| FPYR | floodplain of the Yellow River |
| SOM | soil organic matter |
| TN | total nitrogen |
| USDA | United States Department of Agriculture |
| ANOVA | analysis of variance |
| PCA | principal component analysis |
References
- Cheng, G.; Xi, C.; Li, X.H. Measurement and Spatio-Temporal Evolution of Grain Production Efficiency in the Yellow River Basin. J. Ludong Univ. (Nat. Sci. Ed.) 2024, 40, 218–225. [Google Scholar] [CrossRef]
- Ding, Q.D.; Wang, Y.; Zhang, J.; Chen, R.H.; Jia, K.L.; Li, X.L. Estimation of Soil Water and Organic Matter Content in Medium and Low Yield Fields of Ningxia Yellow River Irrigation Area Based on Hyperspectral Information. J. Appl. Ecol. 2023, 34, 3011–3020. [Google Scholar] [CrossRef] [Scilit] [PubMed]
- Gao, S.; Liu, T.; Wang, S.; Li, Y.; Ding, J.; Liu, Y.; Wang, D.; Li, H. Optimizing Fertilizer Management Practices in Summer Maize Fields in the Yellow River Basin. Agronomy 2023, 13, 2236. [Google Scholar] [CrossRef] [Scilit]
- Cao, J.; Chen, Y.P.; Wu, J.H.; Zhao, M.M. Soil Fertility Evaluation and Improvement Measures in Five Irrigated Areas along the Yellow River Basin. J. Earth Environ. 2020, 11, 204–214. [Google Scholar] [CrossRef]
- Hammad, J.A.; M’nassri, S.; Chaabane, B.; Al-Bayati, A.H.I.; Majdoub, R. Assessing Agricultural Potential of Abandoned Land in the Euphrates Basin: Soil Fertility Modeling and Geostatistical Analysis. Model. Earth Syst. Environ. 2024, 10, 4627–4639. [Google Scholar] [CrossRef] [Scilit]
- Liu, Y.; Stomph, T.; Zhang, F.; Li, C.; Van Der Werf, W. Nitrogen Input Strategies Impact Fertilizer Nitrogen Saving by Intercropping: A Global Meta-Analysis. Field Crops Res. 2024, 318, 109607. [Google Scholar] [CrossRef] [Scilit]
- Smith, K.R.; Jerrett, M.; Anderson, H.R.; Burnett, R.T.; Stone, V.; Derwent, R.; Atkinson, R.W.; Cohen, A.; Shonkoff, S.B.; Krewski, D.; et al. Public Health Benefits of Strategies to Reduce Greenhouse-Gas Emissions: Health Implications of Short-Lived Greenhouse Pollutants. Lancet 2009, 374, 2091–2103. [Google Scholar] [CrossRef] [Scilit] [PubMed]
- Song, Q.; Feng, C.H.; Ma, Z.Q.; Wang, N.; Peng, J. Simulation of Land Use Change in Oasis of Arid Areas Based on Landsat Images from 1990 to 2019. Remote Sens. Nat. Resour. 2022, 34, 198–209. [Google Scholar]
- Wu, T.; Schoenau, J.J.; Li, F.; Qian, P.; Zhang, S.; Malhi, S.S.; Wang, F. Concepts and relative analytical techniques of soil organic matter. Ying Yong Sheng Tai Xue Bao 2004, 15, 717–722. [Google Scholar] [PubMed]
- Pi, H.; Zhang, X.; Li, S.; Webb, N.P. Influence of Crop Rotation, Irrigation, Fertilization, and Tillage on the Aggregate Property and Soil Wind Erosion Potential in the Floodplain of the Yellow River. Aeolian Res. 2024, 67–69, 100925. [Google Scholar] [CrossRef] [Scilit]
- Emde, D.; Hannam, K.D.; Most, I.; Nelson, L.M.; Jones, M.D. Soil Organic Carbon in Irrigated Agricultural Systems: A Meta-analysis. Glob. Change Biol. 2021, 27, 3898–3910. [Google Scholar] [CrossRef] [Scilit] [PubMed]
- Núñez, A.; Schipanski, M. Changes in Soil Organic Matter after Conversion from Irrigated to Dryland Cropping Systems. Agric. Ecosyst. Environ. 2023, 347, 108392. [Google Scholar] [CrossRef] [Scilit]
- Alhaj Hamoud, Y.; Shaghaleh, H.; Guo, X.; Zhang, K. pH-Responsive/Sustained Release Nitrogen Fertilizer Hydrogel Improves Yield, Nitrogen Metabolism, and Nitrogen Use Efficiency of Rice under Alternative Wetting and Moderate Drying Irrigation. Environ. Exp. Bot. 2023, 211, 105376. [Google Scholar] [CrossRef] [Scilit]
- Alavaisha, E.; Manzoni, S.; Lindborg, R. Different Agricultural Practices Affect Soil Carbon, Nitrogen and Phosphorous in Kilombero-Tanzania. J. Environ. Manag. 2019, 234, 159–166. [Google Scholar] [CrossRef] [Scilit] [PubMed]
- Yang, L.; Wang, L.; Chu, J.; Zhao, H.; Zhao, J.; Zang, H.; Yang, Y.; Zeng, Z. Improving Soil Quality and Wheat Yield through Diversified Crop Rotations in the North China Plain. Soil Tillage Res. 2024, 244, 106231. [Google Scholar] [CrossRef] [Scilit]
- Bowles, T.M.; Mooshammer, M.; Socolar, Y.; Calderon, F.; Grandy, A.S. Long-Term Evidence Shows That Crop-Rotation Diversification Increases Agricultural Resilience to Adverse Growing Conditions in North America. One Earth 2020, 2, 284–293. [Google Scholar] [CrossRef] [Scilit]
- Ma, C.; Yang, Q.; Wu, L.X. The Rise of Mongolian Consciousness in the Early Republic of China and the Legislative Countermeasures of Beiyang Government. Qinghai J. Ethnol. 2020, 31, 143–149. [Google Scholar] [CrossRef]
- Wang, F.; Miao, C.; Liu, F.; Chen, X.; Mi, W.; Hai, C.; Duan, D.; Wang, J.; Zhang, Z.; Wang, C. The Locality and Adaptability of Human Settlements in the Yellow River Basin: Challenges and Opportunities. J. Nat. Resour. 2021, 36, 1. [Google Scholar] [CrossRef] [Scilit]
- Chen, M.S.; Wang, L.; Niu, Z.L.; Pan, H.Z.; Wang, R. Characteristics of Soil Salinization in Hetao Irrigation District, Inner Mongolia. J. Agric. Sci. 2024, 45, 40–48. [Google Scholar] [CrossRef]
- Arshad, A.; Jamaludheen, V.; Kunhamu, T.K.; Beena, V.I.; Surendra Gopal, K. Comparison of Soil Chemical Properties in Five Different Land Use Systems after Flooding: A Case Study from South India. Eurasian Soil Sci. 2023, 56, 976–983. [Google Scholar] [CrossRef] [Scilit]
- Sao, S.; Ann, V.; Nishiyama, M.; Praise, S.; Watanabe, T. Tracing the Pathways by Which Flood Duration Impacts Soil Bacteria through Soil Properties and Water-Extractable Dissolved Organic Matter: A Soil Column Experiment. Sci. Total Environ. 2023, 902, 166524. [Google Scholar] [CrossRef] [Scilit] [PubMed]
- Li, H.; Wang, F.; Zhao, G.X.; Fang, Z.; Chang, C.Y.; Wang, Z.R. Analysis of Different Land Use Types on Soil Nutrients in the Yellow River Alluvial Plain Area. J. Soil Water Conserv. 2016, 30, 154–158. [Google Scholar] [CrossRef]
- Ma, X.M.; Li, R.P.; Li, X.L. Combined Effects of Groundwater Depth and Soil Salinization Enhanced Vegetation Index in Hetao Irrigation Area. Agric. Res. Arid Areas 2023, 41, 134–141, 165. [Google Scholar] [CrossRef]
- Wang, Y.; Li, P.; Jiang, D.; Li, B.; Dai, X.; Jiang, Z.; Wang, Y. Vertical Distribution of Bacterial Communities in High Arsenic Sediments of Hetao Plain, Inner Mongolia. Ecotoxicology 2014, 23, 1890–1899. [Google Scholar] [CrossRef] [Scilit] [PubMed]
- Yu, X.F.; Zhao, X.Y.; Hu, S.P.; Gao, J.L.; Cui, T.; Wang, F.G. Tillage method suitable for farmlands with different maize yield levels in Hetao Plain, Inner Mongolia. J. Plant Nutr. Fertil. 2019, 25, 392–401. [Google Scholar] [CrossRef]
- Jing, Y.P.; Gao, R.P.; Chen, Y.H.; Wang, W.N.; Huang, J.; Li, Y.F.; Liu, X.Y.; Zhao, J. Distribution Characteristics of Organic Carbon and Microbial Carbon in Saline-Alkali Soil in the Hetao Plain. Soil Fertil. Sci. China. 2022, 10, 11–19. [Google Scholar]
- Bouray, M.; Moir, J.L.; Condron, L.M.; Lehto, N.J. Lime-Induced pH Elevation Influences Phosphorus Biochemical Processes and Dynamics in the Rhizosphere of Lupinus Polyphyllus and Lupinus Angustifolius. J. Soil Sci. Plant Nutr. 2021, 21, 1978–1992. [Google Scholar] [CrossRef] [Scilit]
- Mondal, S.; Chakraborty, D. Soil Nitrogen Status Can Be Improved through No-Tillage Adoption Particularly in the Surface Soil Layer: A Global Meta-Analysis. J. Clean. Prod. 2022, 366, 132874. [Google Scholar] [CrossRef] [Scilit]
- Xia, Q.; Rufty, T.; Shi, W. Soil Microbial Diversity and Composition: Links to Soil Texture and Associated Properties. Soil Biol. Biochem. 2020, 149, 107953. [Google Scholar] [CrossRef] [Scilit]
- Yu, Y.; Yang, J.; Zeng, S.; Wu, D.; Jacobs, D.F.; Sloan, J.L. Soil pH, Organic Matter, and Nutrient Content Change with the Continuous Cropping of Cunninghamia Lanceolata Plantations in South China. J. Soils Sediments 2017, 17, 2230–2238. [Google Scholar] [CrossRef] [Scilit]
- Delgado, A.; Gómez, J.A. The Soil. Physical, Chemical and Biological Properties. In Principles of Agronomy for Sustainable Agriculture; Villalobos, F.J., Fereres, E., Eds.; Springer International Publishing: Cham, Switzerland, 2016; pp. 15–26. ISBN 978-3-319-46115-1. [Google Scholar]
- Fuentes, M.; Govaerts, B.; De León, F.; Hidalgo, C.; Dendooven, L.; Sayre, K.D.; Etchevers, J. Fourteen Years of Applying Zero and Conventional Tillage, Crop Rotation and Residue Management Systems and Its Effect on Physical and Chemical Soil Quality. Eur. J. Agron. 2009, 30, 228–237. [Google Scholar] [CrossRef] [Scilit]
- Page, K.L.; Dang, Y.P.; Dalal, R.C. The Ability of Conservation Agriculture to Conserve Soil Organic Carbon and the Subsequent Impact on Soil Physical, Chemical, and Biological Properties and Yield. Front. Sustain. Food Syst. 2020, 4, 31. [Google Scholar] [CrossRef] [Scilit]
- GB/T 21010-2017; Current Land Use Classification. Standards Press of China: Beijing, China, 2017.
- Fu, L.Z. Study on the Remote Sensing Monitoring and the Inducing Factors of Soil Salinization in the Houtao Plain. Master’s Thesis, China University of Geosciences, Beijing, China, 2020. [Google Scholar]
- Utomo, M.; Banuwa, I.S.; Buchari, H.; Anggraini, Y. Berthiria Long-Term Tillage and Nitrogen Fertilization Effects on Soil Properties and Crop Yields. J. Trop. Soils 2013, 18, 131–139. [Google Scholar] [CrossRef] [Scilit]
- Li, X.; Guo, M.; Wang, H. Impact of Soil Texture and Salt Type on Salt Precipitation and Evaporation under Different Hydraulic Conditions. Hydrol. Process. 2022, 36, e14763. [Google Scholar] [CrossRef] [Scilit]
- Wu, X.; Wang, S.; Cheng, H.; Yang, Y. Variation of Soil Organic Matter with Particle Size in the Wind Erosion Region of Northern China. Catena 2024, 241, 108025. [Google Scholar] [CrossRef] [Scilit]
- Bao, S.D. Soil Agricultural Chemical Analysis, 3rd ed.; China Agricultural Press: Beijing, China, 2000; pp. 28–34. [Google Scholar]
- Pribyl, D.W. A critical review of the conventional SOC to SOM conversion factor. Geoderma 2010, 156, 75–83. [Google Scholar] [CrossRef] [Scilit]
- Hair, J.F.; Black, W.C.; Babin, B.J.; Anderson, R.E. Multivariate Data Analysis, 7th ed.; Pearson: Upper Saddle River, NJ, USA, 2010. [Google Scholar]
- Pi, H.; Wang, C.; Li, S.; Li, S.; Webb, N.P. Crushing Energy-Based Indicators of Dry Soil Aggregate Stability from Contrastive Land Management Practices in a Semi-Arid Agroecosystem. Ecol. Eng. 2025, 217, 107663. [Google Scholar] [CrossRef] [Scilit]
- Li, Y.; Bai, L.; Wei, S.; Wu, H.; Li, R.; Wang, Y.; Wang, Z. Integrating Heterosis for Root Architecture and Nitrogen Use Efficiency of Maize: A Comparison between Hybrids from Different Decades. Agronomy 2024, 14, 2018. [Google Scholar] [CrossRef] [Scilit]
- Cherubin, M.R.; Canisares, L.P.; Souza, L.N.; Pinheiro Junior, C.R.; de Moraes, M.T.; Bertol, F.; Bortolo, L.; Menillo, R.B.; Cerri, C.E.P. Long-Term Effects of Crop Diversification on Soil Health, Crop Yield and Resilience of Tropical Agroecosystems. J. Environ. Manag. 2025, 392, 126845. [Google Scholar] [CrossRef] [Scilit] [PubMed]
- DuPont, S.T.; Beniston, J.; Glover, J.D.; Hodson, A.; Culman, S.W.; Lal, R.; Ferris, H. Root Traits and Soil Properties in Harvested Perennial Grassland, Annual Wheat, and Never-Tilled Annual Wheat. Plant Soil 2014, 381, 405–420. [Google Scholar] [CrossRef] [Scilit]
- Schnitzer, M.; McArthur, D.F.E.; Schulten, H.-R.; Kozak, L.M.; Huang, P.M. Long-Term Cultivation Effects on the Quantity and Quality of Organic Matter in Selected Canadian Prairie Soils. Geoderma 2006, 130, 141–156. [Google Scholar] [CrossRef] [Scilit]
- Jobbágy, E.G.; Jackson, R.B. Groundwater Use and Salinization with Grassland Afforestation. Glob. Change Biol. 2004, 10, 1299–1312. [Google Scholar] [CrossRef] [Scilit]
- Le Bissonnais, Y. Aggregate Stability and Assessment of Soil Crustability and Erodibility: I. Theory and Methodology. Eur. J. Soil Sci. 2016, 67, 11–21. [Google Scholar] [CrossRef] [Scilit]
- Trost, B.; Prochnow, A.; Drastig, K.; Meyer-Aurich, A.; Ellmer, F.; Baumecker, M. Irrigation, Soil Organic Carbon and N2O Emissions. A Review. Agron. Sustain. Dev. 2013, 33, 733–749. [Google Scholar] [CrossRef] [Scilit]
- Moyano, F.E.; Manzoni, S.; Chenu, C. Responses of Soil Heterotrophic Respiration to Moisture Availability: An Exploration of Processes and Models. Soil Biol. Biochem. 2013, 59, 72–85. [Google Scholar] [CrossRef] [Scilit]
- Kamoni, P.T.; Mburu, M.W.K.; Gachene, C.K.K. Influence of Irrigation and Nitrogen Fertiliser on Maize Growth, Nitrogen Uptake and Yield in a Semiarid Kenyan Environment. East Afr. Agric. For. J. 2003, 69, 99–108. [Google Scholar] [CrossRef] [Scilit]
- Li, Q.; Zhang, G.C.; Yang, L.J.; Liang, Z.J.; Yu, B.; Zhang, T. Effects of Different Peanut Rotations Modes on Carbon Fractions in Soil Aggregates. China. Chin. J. Oil Crop Sci. 2024, 46, 613–624. [Google Scholar]
- Hong, X.; Chen, Z.; Zhao, C.; Yang, S. Nitrogen Transformation under Different Dissolved Oxygen Levels by the Anoxygenic Phototrophic Bacterium Marichromatium Gracile. World J. Microbiol. Biotechnol. 2017, 33, 113. [Google Scholar] [CrossRef] [Scilit] [PubMed]
- Choi, M.; Lee, C.; Kim, L.H.; Choi, S.H.; Bong, Y.S.; Lee, K.S.; Shin, W.J. Assessing Sources of Nutrients in Small Watersheds with Different Land-Use Patterns Using TN, TP, and NO3−-N. J. Hydrol. Reg. Stud. 2024, 55, 101958. [Google Scholar]
- Zhang, N.; Bai, L.; Wei, X.; Li, T.; Tang, Y.; Wen, J.; Peng, Z.; Zhang, Y.; Wang, Y.; Zeng, X.; et al. Effects of Organic Material Addition on Carbon Cycling and Soil Fertility in Paddy Soil. J. Environ. Manag. 2025, 379, 124898. [Google Scholar] [CrossRef] [Scilit] [PubMed]
- Xu, H.; Chen, C.; Chen, W.; Pang, Z.; Zhang, G.; Zhang, W.; Kan, H. Metagenomics Reveals Soil Nitrogen Cycling after Vegetation Restoration: Influence of Different Vegetation Restoration Strategies. Appl. Soil Ecol. 2024, 204, 105695. [Google Scholar] [CrossRef] [Scilit]
- Nachshon, U.; Weisbrod, N.; Katzir, R.; Nasser, A. NaCl Crust Architecture and Its Impact on Evaporation: Three-dimensional Insights. Geophys. Res. Lett. 2018, 45, 6100–6108. [Google Scholar] [CrossRef] [Scilit]
- Han, S.B.; Li, P.C.; Wang, S.; Li, X.H.; Yuan, L.; Liu, J.T.; Shen, H.Y.; Zhang, X.Q.; Li, C.Q.; Wu, X.; et al. Groundwater Resource and Eco-Environmental Problem of the Yellow River Basin. Geol. Rev. China 2021, 48, 1001–1019. [Google Scholar] [CrossRef]
- Ladha, J.K.; Tirol-Padre, A.; Reddy, C.K.; Cassman, K.G.; Verma, S.; Powlson, D.S.; Van Kessel, C.; Richter, D.d.B.; Chakraborty, D.; Pathak, H. Global Nitrogen Budgets in Cereals: A 50-Year Assessment for Maize, Rice and Wheat Production Systems. Sci. Rep. 2016, 6, 19355. [Google Scholar] [CrossRef] [Scilit] [PubMed]
- Deng, L.; Peng, C.; Kim, D.-G.; Li, J.; Liu, Y.; Hai, X.; Liu, Q.; Huang, C.; Shangguan, Z.; Kuzyakov, Y. Drought Effects on Soil Carbon and Nitrogen Dynamics in Global Natural Ecosystems. Earth Sci. Rev. 2021, 214, 103501. [Google Scholar] [CrossRef] [Scilit]
- Holz, M.; Augustin, J. Erosion Effects on Soil Carbon and Nitrogen Dynamics on Cultivated Slopes: A Meta-Analysis. Geoderma 2021, 397, 115045. [Google Scholar] [CrossRef] [Scilit]
- Qian, C.; Han, B.P.; Ge, Z.S.; Li, G.J. Influence of Southern-Rechanneled Yellow River to the Fertility of Xuzhou Arable Farming Land. Yellow River 2011, 33, 75–78. [Google Scholar] [CrossRef]
- Krull, E.S.; Baldock, J.A.; Skjemstad, J.O. Importance of Mechanisms and Processes of the Stabilisation of Soil Organic Matter for Modelling Carbon Turnover. Funct. Plant Biol. 2003, 30, 207. [Google Scholar] [CrossRef] [Scilit] [PubMed]
- Li, H.; Françoys, A.; Wang, X.; Zhang, S.; Mendoza, O.; De Neve, S.; Dewitte, K.; Sleutel, S. Field-Scale Assessment of Direct and Indirect Effects of Soil Texture on Organic Matter Mineralization during a Dry Summer. Sci. Total Environ. 2023, 899, 165749. [Google Scholar] [CrossRef] [Scilit] [PubMed]
- Benincasa, P.; Tosti, G.; Guiducci, M.; Farneselli, M.; Tei, F. Crop Rotation as a System Approach for Soil Fertility Management in Vegetables. In Advances in Research on Fertilization Management of Vegetable Crops; Tei, F., Nicola, S., Benincasa, P., Eds.; Springer International Publishing: Cham, Switzerland, 2017; pp. 115–148. ISBN 978-3-319-53626-2. [Google Scholar]
- Wu, Y.Y.; Wang, Z.T. Risk Assessment of Soil Wind Erosion in Hetao Plain. Arid Land Geogr. 2023, 46, 418–427. [Google Scholar]
- Zou, A.; Yang, Y.; Wang, H.; Wang, P.; Liao, H. Aerosol Decline Accelerates the Increasing Extreme Precipitation in China. Geophys. Res. Lett. 2025, 52, e2024GL113887. [Google Scholar] [CrossRef] [Scilit]

Disclaimer/Publisher’s Note: The statements, opinions and data contained in all publications are solely those of the individual author(s) and contributor(s) and not of MDPI and/or the editor(s). MDPI and/or the editor(s) disclaim responsibility for any injury to people or property resulting from any ideas, methods, instructions or products referred to in the content. |
© 2026 by the authors. Licensee MDPI, Basel, Switzerland. This article is an open access article distributed under the terms and conditions of the Creative Commons Attribution (CC BY) license.